Credit Suisse Financial Services Forum 2018
16
U.S. BANCORP Credit Suisse Financial Services Forum 2018 February 13, 2018 Gunjan Kedia Vice Chairman, Wealth Management & Investment Services Mark Jordahl President, Wealth Management
Transcript of Credit Suisse Financial Services Forum 2018
U.S. BANCORP
Credit SuisseFinancial ServicesForum 2018
February 13, 2018
Gunjan KediaVice Chairman, Wealth Management & Investment Services
Mark JordahlPresident, Wealth Management
2U.S. BANCORP |
Forward-looking Statementsand Additional InformationThe following information appears in accordance with the Private Securities Litigation Reform Act of 1995:
Today’s presentation contains forward-looking statements about U.S. Bancorp. Statements that are not historical or current facts, including statements about beliefs and expectations, are forward-looking statements and are based on the information available to, and assumptions and estimates made by, management as of the date hereof. These forward-looking statements cover, among other things, anticipated future revenue and expenses and the future plans and prospects of U.S. Bancorp. Forward-looking statements involve inherent risks and uncertainties, and important factors could cause actual results to differ materially from those anticipated. A reversal or slowing of the current economic recovery or another severe contraction could adversely affect U.S. Bancorp’s revenues and the values of its assets and liabilities. Global financial markets could experience a recurrence of significant turbulence, which could reduce the availability of funding to certain financial institutions and lead to a tightening of credit, a reduction of business activity, and increased market volatility. Stress in the commercial real estate markets, as well as a downturn in the residential real estate markets could cause credit losses and deterioration in asset values. In addition, changes to statutes, regulations, or regulatory policies or practices could affect U.S. Bancorp in substantial and unpredictable ways. U.S. Bancorp’s results could also be adversely affected by deterioration in general business and economic conditions; changes in interest rates; deterioration in the credit quality of its loan portfolios or in the value of the collateral securing those loans; deterioration in the value of securities held in its investment securities portfolio; legal and regulatory developments; litigation; increased competition from both banks and non-banks; changes in customer behavior and preferences; breaches in data security; effects of mergers and acquisitions and related integration; effects of critical accounting policies and judgments; and management’s ability to effectively manage credit risk, market risk, operational risk, compliance risk, strategic risk, interest rate risk, liquidity risk and reputational risk.
For discussion of these and other risks that may cause actual results to differ from expectations, refer to U.S. Bancorp’s Annual Report on Form 10-K for the year ended December 31, 2016, on file with the Securities and Exchange Commission, including the sections entitled “Risk Factors” and “Corporate Risk Profile” contained in Exhibit 13, and all subsequent filings with the Securities and Exchange Commission under Sections 13(a), 13(c), 14 or 15(d) of the Securities Exchange Act of 1934. However, factors other than these also could adversely affect U.S. Bancorp’s results, and the reader should not consider these factors to be a complete set of all potential risks or uncertainties. Forward-looking statements speak only as of the date hereof, and U.S. Bancorp undertakes no obligation to update them in light of new information or future events.
This presentation includes non-GAAP financial measures to describe U.S. Bancorp’s performance. The calculations of these measures are provided in the Appendix. These disclosures should not be viewed as a substitute for operating results determined in accordance with GAAP, nor are they necessarily comparable to non-GAAP performance measures that may be presented by other companies.
3U.S. BANCORP |
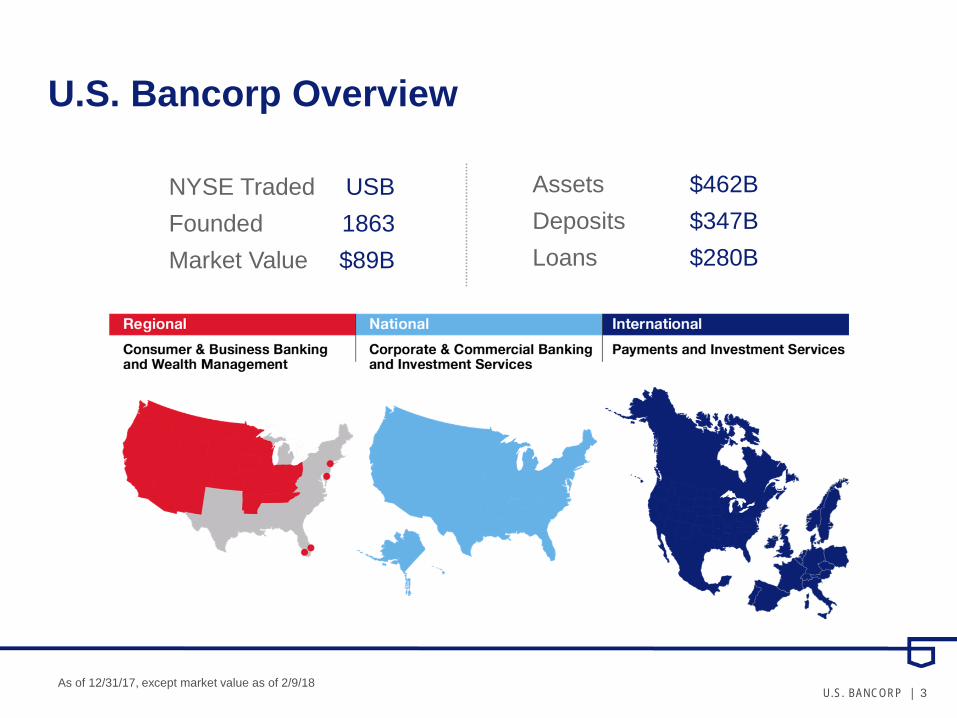
U.S. Bancorp Overview
As of 12/31/17, except market value as of 2/9/18
NYSE Traded USBFounded 1863Market Value $89B
Assets $462BDeposits $347BLoans $280B
4U.S. BANCORP |
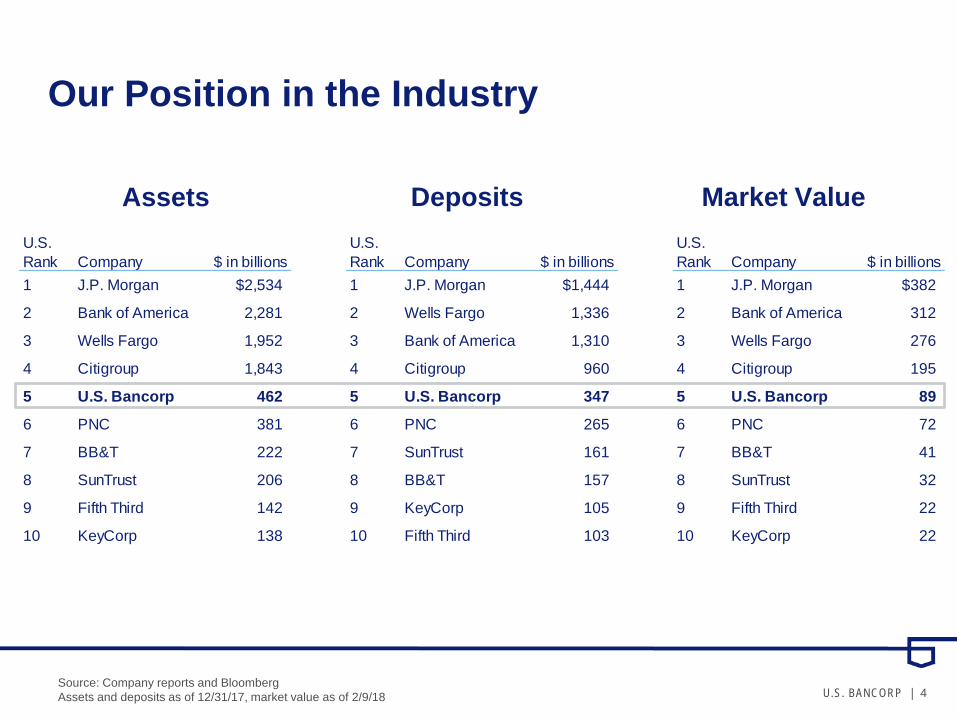
Our Position in the Industry
Source: Company reports and BloombergAssets and deposits as of 12/31/17, market value as of 2/9/18
Assets Market ValueDepositsU.S. U.S. U.S. Rank Company $ in billions Rank Company $ in billions Rank Company $ in billions1 J.P. Morgan $2,534 1 J.P. Morgan $1,444 1 J.P. Morgan $382
2 Bank of America 2,281 2 Wells Fargo 1,336 2 Bank of America 312
3 Wells Fargo 1,952 3 Bank of America 1,310 3 Wells Fargo 276
4 Citigroup 1,843 4 Citigroup 960 4 Citigroup 195
5 U.S. Bancorp 462 5 U.S. Bancorp 347 5 U.S. Bancorp 89
6 PNC 381 6 PNC 265 6 PNC 72
7 BB&T 222 7 SunTrust 161 7 BB&T 41
8 SunTrust 206 8 BB&T 157 8 SunTrust 32
9 Fifth Third 142 9 KeyCorp 105 9 Fifth Third 22
10 KeyCorp 138 10 Fifth Third 103 10 KeyCorp 22
5U.S. BANCORP |
Our Key Priorities
1) One U.S. Bank initiative: putting the customer in the center
2) Leveraging technology and innovation to drive growth and efficiency
3) A relentless focus on optimization
one U.S. Bank
6U.S. BANCORP |
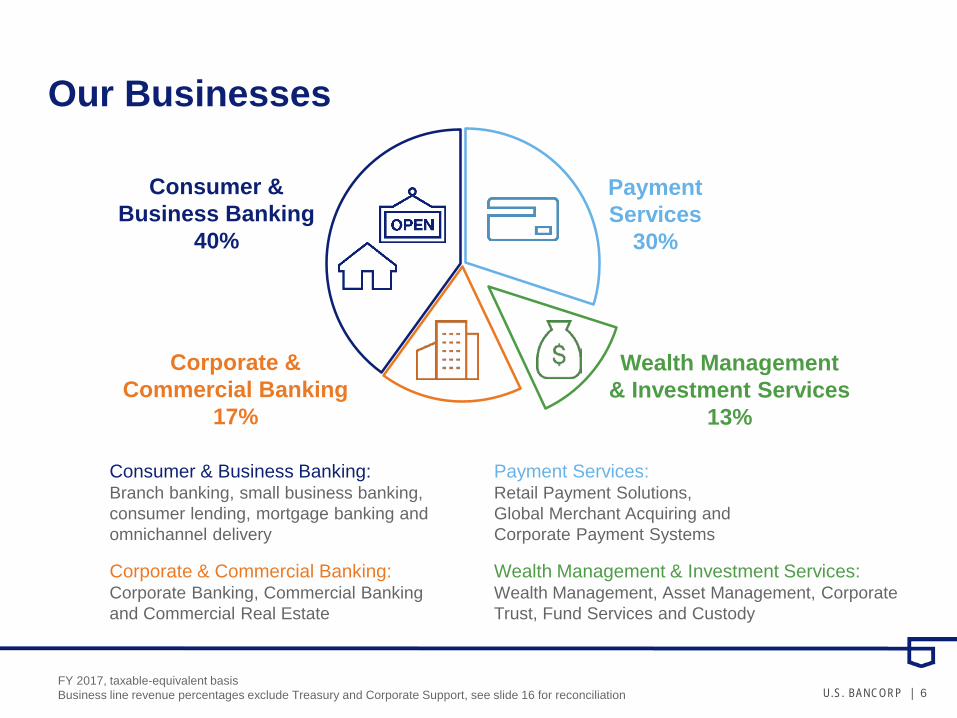
Our Businesses
PaymentServices
30%
Wealth Management& Investment Services
13%
Corporate & Commercial Banking
17%
Consumer &Business Banking
40%
Consumer & Business Banking:Branch banking, small business banking, consumer lending, mortgage banking and omnichannel delivery
Payment Services:Retail Payment Solutions,Global Merchant Acquiring andCorporate Payment Systems
Corporate & Commercial Banking:Corporate Banking, Commercial Banking and Commercial Real Estate
Wealth Management & Investment Services:Wealth Management, Asset Management, Corporate Trust, Fund Services and Custody
FY 2017, taxable-equivalent basisBusiness line revenue percentages exclude Treasury and Corporate Support, see slide 16 for reconciliation
7U.S. BANCORP |
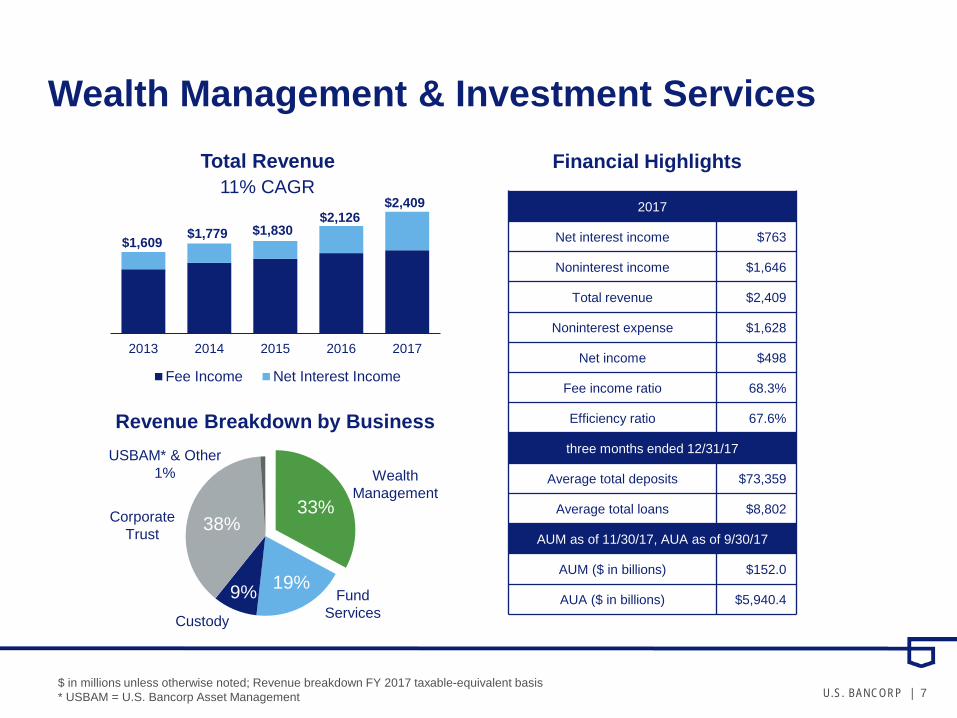
Wealth Management & Investment Services
$ in millions unless otherwise noted; Revenue breakdown FY 2017 taxable-equivalent basis* USBAM = U.S. Bancorp Asset Management
2013 2014 2015 2016 2017
Fee Income Net Interest Income
2017
Net interest income $763
Noninterest income $1,646
Total revenue $2,409
Noninterest expense $1,628
Net income $498
Fee income ratio 68.3%
Efficiency ratio 67.6%
three months ended 12/31/17
Average total deposits $73,359
Average total loans $8,802
AUM as of 11/30/17, AUA as of 9/30/17
AUM ($ in billions) $152.0
AUA ($ in billions) $5,940.4
Financial Highlights
$1,609 $1,779 $1,830$2,126
$2,409
Total Revenue
Revenue Breakdown by Business
33%
19%9%
38%
Wealth Management
Fund Services
Corporate Trust
Custody
USBAM* & Other1%
11% CAGR
8U.S. BANCORP |
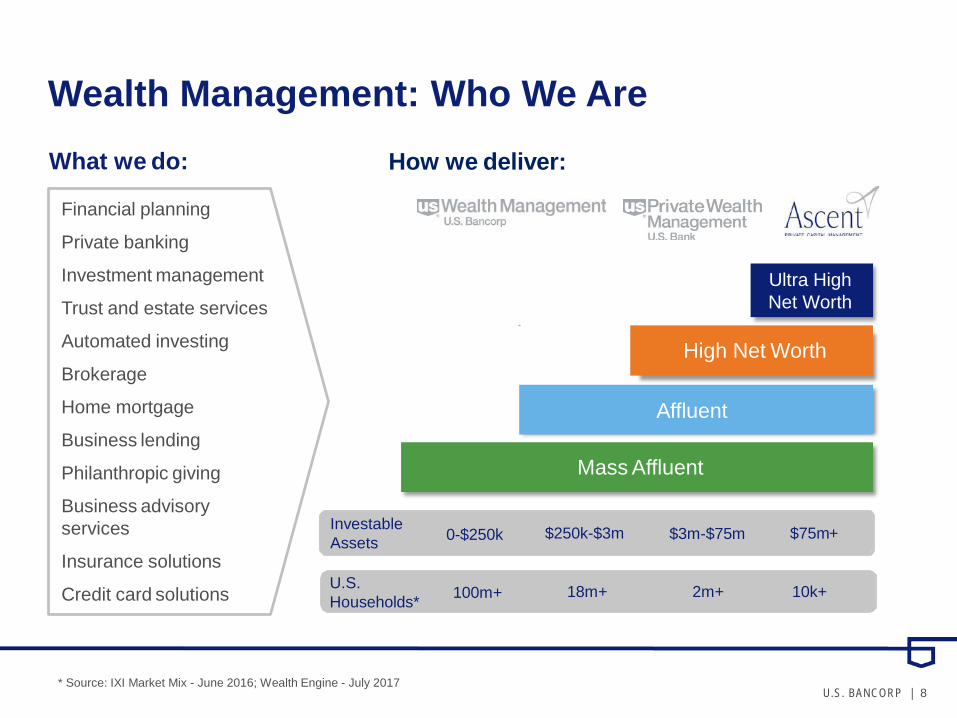
Wealth Management: Who We AreHow we deliver:What we do:
Financial planning
Private banking
Investment management
Trust and estate services
Automated investing
Brokerage
Home mortgage
Business lending
Philanthropic giving
Business advisory services
Insurance solutions
Credit card solutions
Mass Affluent
Affluent
High Net Worth
Investable Assets 0-$250k $250k-$3m $3m-$75m $75m+
U.S.Households* 100m+ 18m+ 2m+ 10k+
Ultra HighNet Worth
* Source: IXI Market Mix - June 2016; Wealth Engine - July 2017
9U.S. BANCORP |
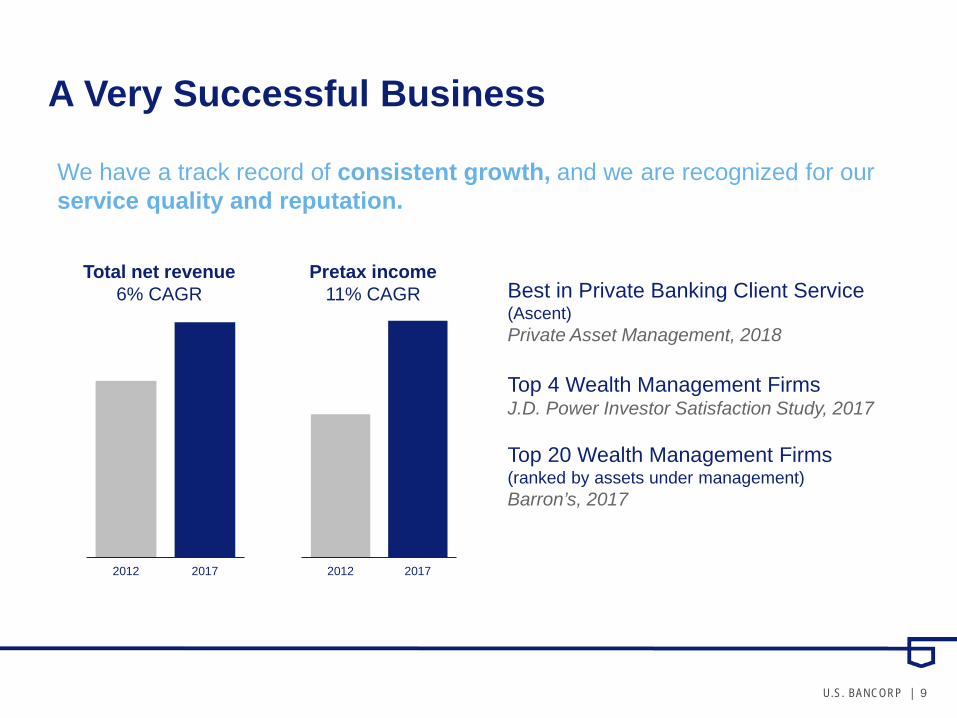
A Very Successful Business
We have a track record of consistent growth, and we are recognized for our service quality and reputation.
2012 2017 2012 2017
Total net revenue6% CAGR
Pretax income11% CAGR Best in Private Banking Client Service
(Ascent)Private Asset Management, 2018
Top 4 Wealth Management FirmsJ.D. Power Investor Satisfaction Study, 2017
Top 20 Wealth Management Firms(ranked by assets under management)Barron’s, 2017
10U.S. BANCORP |
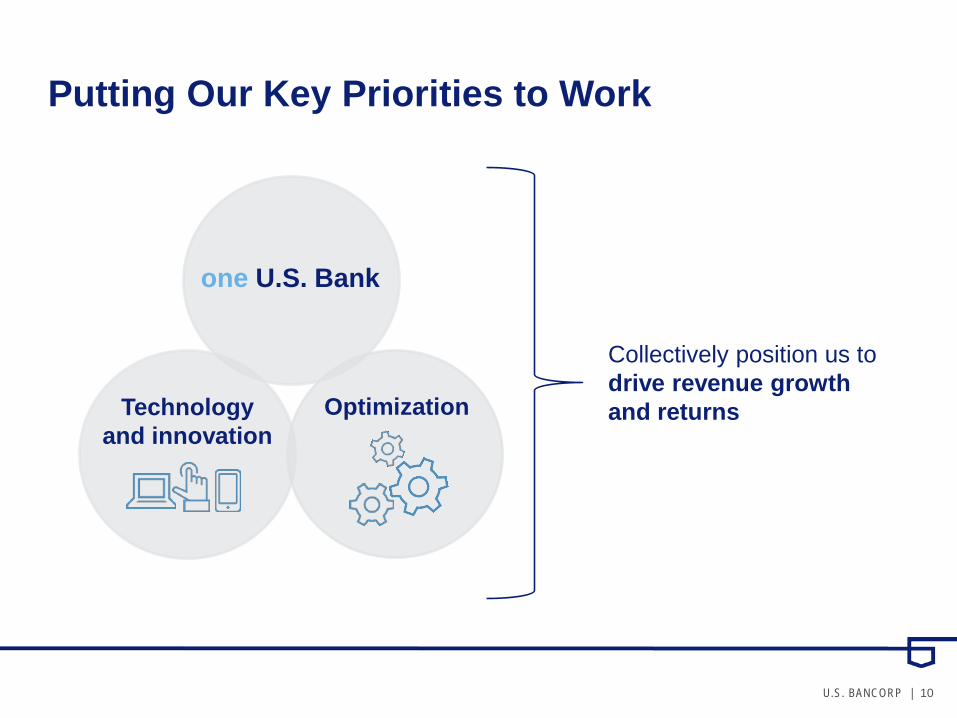
Putting Our Key Priorities to Work
Collectively position us to drive revenue growth and returns
one U.S. Bank
Technology and innovation
Optimization
11U.S. BANCORP |
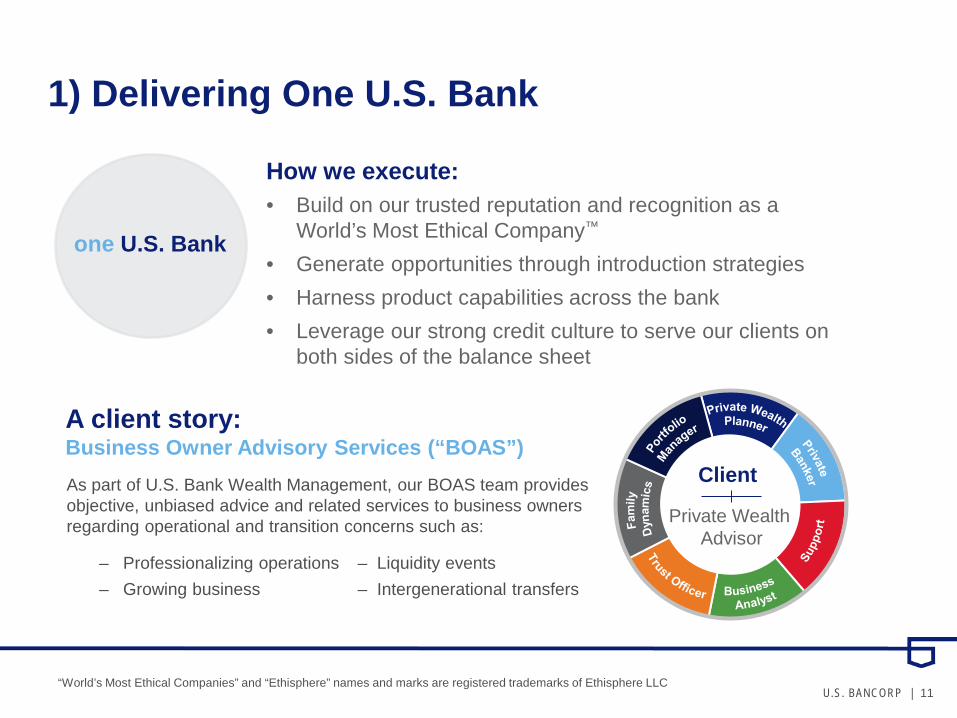
1) Delivering One U.S. Bank
• Build on our trusted reputation and recognition as a World’s Most Ethical Company™
• Generate opportunities through introduction strategies• Harness product capabilities across the bank• Leverage our strong credit culture to serve our clients on
both sides of the balance sheet
How we execute:
A client story: Business Owner Advisory Services (“BOAS”)
one U.S. Bank
Client
Private Wealth Advisor
As part of U.S. Bank Wealth Management, our BOAS team provides objective, unbiased advice and related services to business owners regarding operational and transition concerns such as:
– Professionalizing operations – Liquidity events– Growing business – Intergenerational transfers
“World’s Most Ethical Companies” and “Ethisphere” names and marks are registered trademarks of Ethisphere LLC
12U.S. BANCORP |
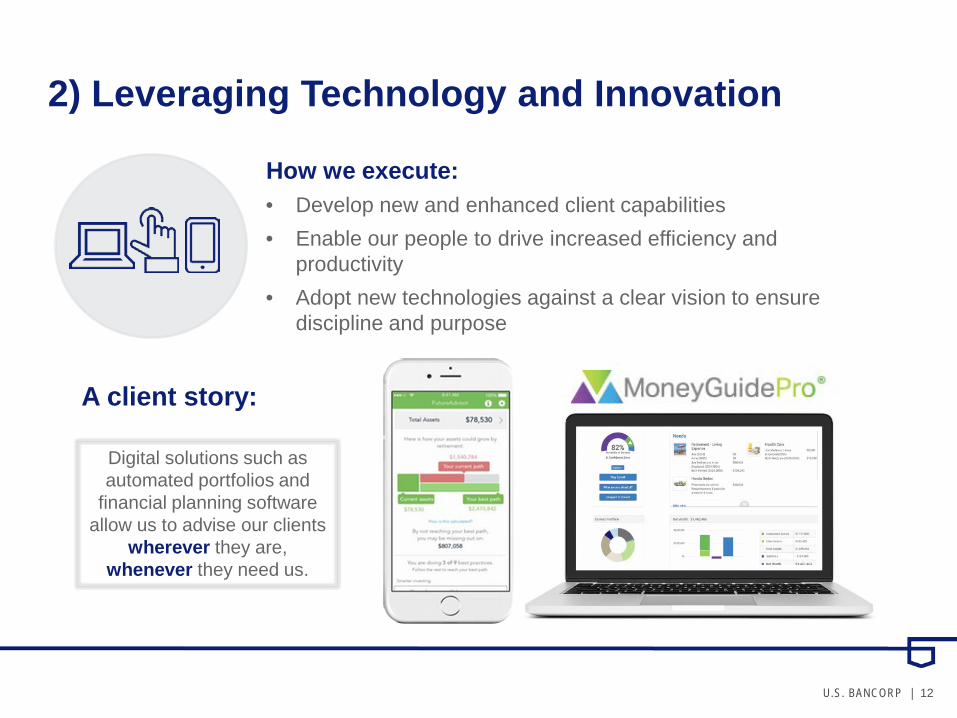
2) Leveraging Technology and Innovation
• Develop new and enhanced client capabilities• Enable our people to drive increased efficiency and
productivity• Adopt new technologies against a clear vision to ensure
discipline and purpose
How we execute:
A client story:
Digital solutions such as automated portfolios and
financial planning software allow us to advise our clients
wherever they are, whenever they need us.
13U.S. BANCORP |
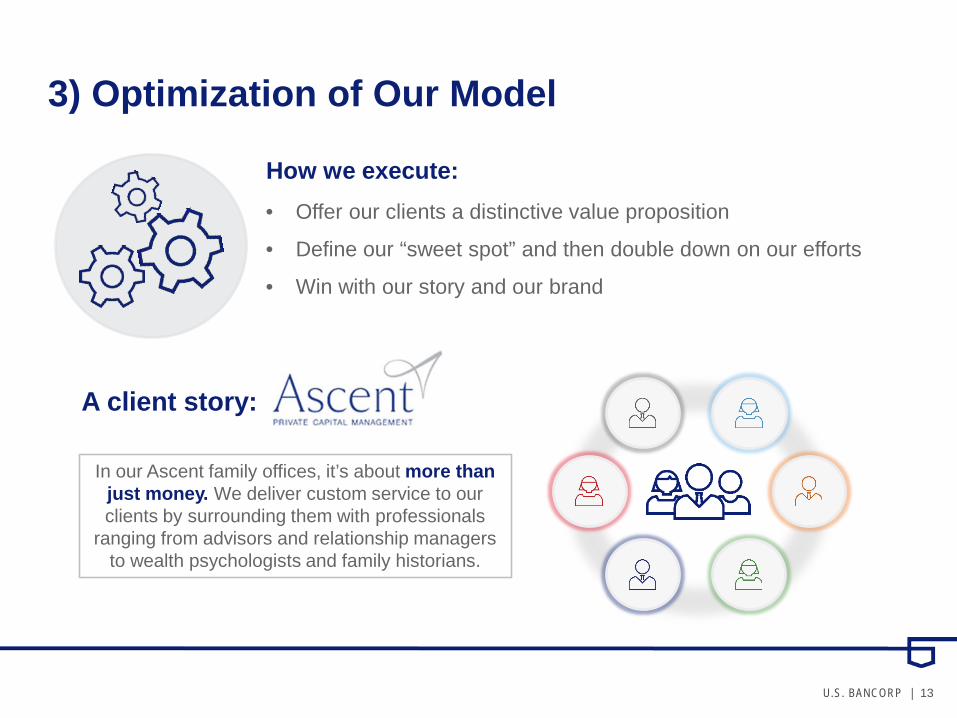
3) Optimization of Our Model
• Offer our clients a distinctive value proposition
• Define our “sweet spot” and then double down on our efforts
• Win with our story and our brand
How we execute:
A client story:
In our Ascent family offices, it’s about more than just money. We deliver custom service to our clients by surrounding them with professionals
ranging from advisors and relationship managers to wealth psychologists and family historians.
14U.S. BANCORP |
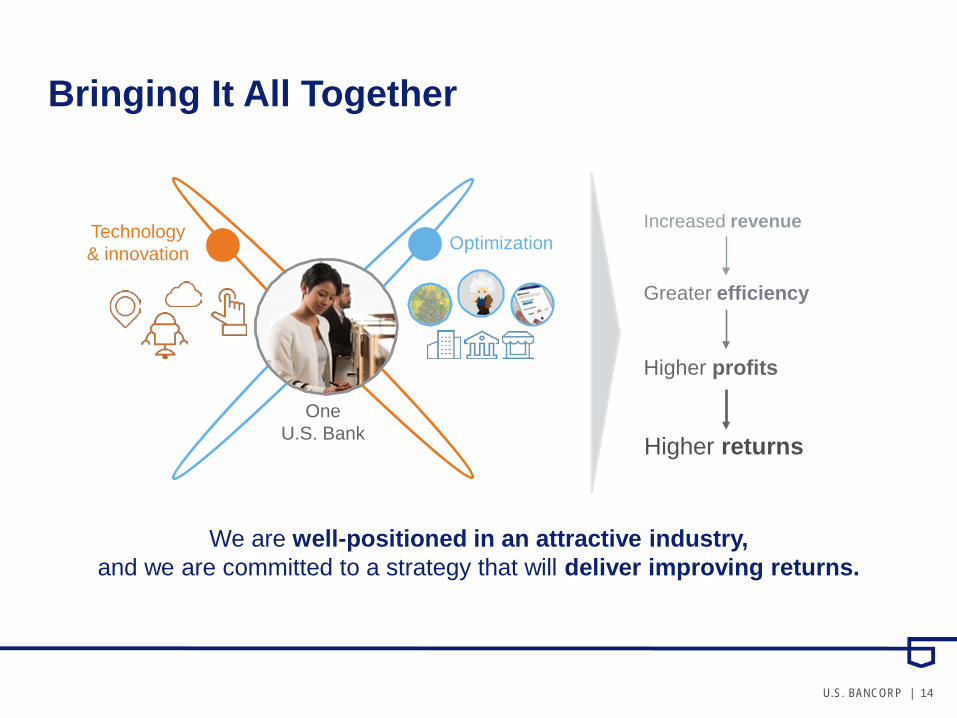
Bringing It All Together
Technology& innovation Optimization
Increased revenue
Greater efficiency
Higher profits
Higher returns
We are well-positioned in an attractive industry,and we are committed to a strategy that will deliver improving returns.
OneU.S. Bank
15U.S. BANCORP |
Appendix
16U.S. BANCORP |
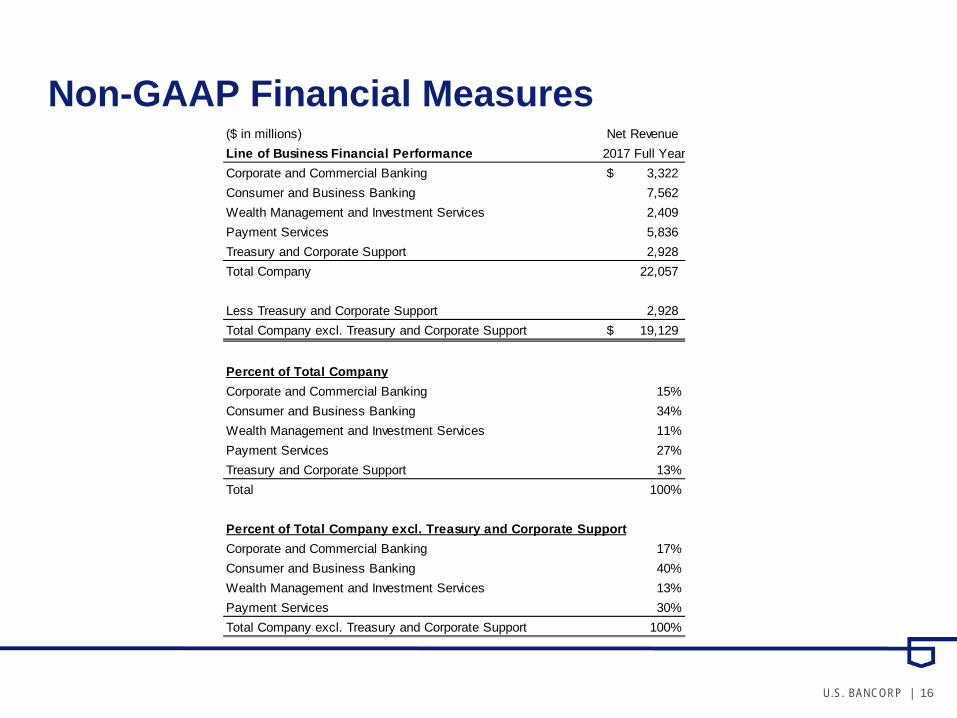
Non-GAAP Financial Measures($ in millions) Net RevenueLine of Business Financial Performance 2017 Full YearCorporate and Commercial Banking 3,322$ Consumer and Business Banking 7,562 Wealth Management and Investment Services 2,409 Payment Services 5,836 Treasury and Corporate Support 2,928 Total Company 22,057
Less Treasury and Corporate Support 2,928 Total Company excl. Treasury and Corporate Support 19,129$
Percent of Total CompanyCorporate and Commercial Banking 15%Consumer and Business Banking 34%Wealth Management and Investment Services 11%Payment Services 27%Treasury and Corporate Support 13%Total 100%
Percent of Total Company excl. Treasury and Corporate SupportCorporate and Commercial Banking 17%Consumer and Business Banking 40%Wealth Management and Investment Services 13%Payment Services 30%Total Company excl. Treasury and Corporate Support 100%