Presentation at Credit Suisse 12 Financial Services … at Credit Suisse 12 th Financial Services...
23
Presentation at Credit Suisse 12 th Financial Services Forum Brady W. Dougan, Chief Executive Officer Credit Suisse Miami, February 11, 2011
Transcript of Presentation at Credit Suisse 12 Financial Services … at Credit Suisse 12 th Financial Services...

Presentation at Credit Suisse 12th
Financial Services
Forum
Brady W. Dougan, Chief Executive Officer Credit Suisse
Miami, February 11, 2011

Slide 1
Cautionary statement
Cautionary statement regarding forward-looking and non-GAAP information
This presentation contains forward-looking statements within the meaning of the Private Securities Litigation Reform Act of 1995. Forward-looking statements involve inherent risks and uncertainties, and we might not be able to achieve the predictions, forecasts, projections and other outcomes we describe or imply in forward-looking statements.
A number of important factors could cause results to differ materially from the plans, objectives, expectations, estimates and intentions we express in
these forward-looking
statements, including those we identify in "Risk Factors" in our
Annual Report on Form 20-F
for the fiscal year ended December 31, 2009 filed with the US Securities and Exchange Commission, and in other public filings and press releases. We do not intend to update these forward-looking statements except as may be required by applicable laws.
This presentation contains non-GAAP financial information. Information needed to reconcile such non-GAAP financial information to the most directly comparable measures under GAAP can be found in Credit Suisse Group's fourth quarter report
2010.

Slide 2
Agenda
Progress in delivering our strategy
while maintaining a disciplined
investment approach
Introduction
Capital update and financial targets
Investment Banking
Private Banking
Asset Management

Slide 3
Introduction
Well positioned for 2011 and beyond
Performance underscores the strength of our business model
Clarity on regulatory framework;
well ahead on implementation
Full-year underlying net income of CHF 5 bn (underlying net income of CHF 1 bn in 4Q10)
Net new assets of CHF 69 bn (CHF 14 bn in 4Q10)
After-tax return on equity of 14% (underlying 12% in 4Q10)
Cash distribution of CHF 1.30 per share, free of Swiss tax
Continued client momentum with industry-leading asset inflows (CHF 200 bn inflows in Private Banking since 2007) will benefit from improving environment
Asset Management successfully refocused to grow diversified fee-based revenues
Market share gains in Investment Banking; an advantage as client activity increases
Maintained strength of high quality balance sheet
Basel 2 tier 1 capital ratio of 17.2%
Repositioned the business over past few years; anticipating changes in the environment
Target annual after-tax return on equity of greater than 15% over the next 3 to 5 years
Strategy to deliver consistent and significant book value per share accretion
Slide 4
Agenda
Progress in delivering our strategy
while maintaining a disciplined
investment approach
Introduction
Capital update and financial targets
Private Banking

Slide 5
Private Banking delivering resilient results, with strong net new assets and superior gross margin trends
All peer comparisons with largest peers where a meaningful comparison is possible
CHF bn
2007
2008
2009
2010
Net revenues
13.5
12.9
11.7
11.6
Operating expenses
8.1
8.9
7.8
8.2
Pre-tax income
5.5
3.8
3.7
3.4
in Wealth ManagementGross margin (bps)
131
131
131
120
Number of RMs
3,860
4,180
4,080
4,200
Net new assets
53
44
35
45
AuM
894
694
803
808
RMs = Relationship managersAuM = Assets under management
Strongest profitability among global wealth management peers at 31 basis points, measured by pre-tax income as a percentage of AuM
Despite recent cyclical reduction, still the highest and most resilient gross margin
Cumulative net new assets of almost CHF 200 bn since 2007
Significant improvement in quality and productivity of relationship managers provide substantial upside potential in future years
Our significantly strengthened competitive position will lead to sustained outperformance when markets normalize

Slide 6
Well prepared for continued evolution of private banking industry
Changes in cross-border regulation and client behavior
Changes in cross-border regulation and client behavior
Suitability of products and
advice
Suitability of products and
advice
Well prepared for regulation focused on suitability and appropriateness of products and advice (e.g. MIFID)
Strong emphasis on expanding our industry-leading advisory model
Relationship manager certification and training
Invested over many years in the successful expansion of our international platforms; leading global footprint with 23 booking centers
Continue to expand on-shore capabilities as client demand shifting from off-shore to multi-shore model with global capabilities
Developed industry leading compliance framework
Expertise and client solutions enables us to thrive in a level playing field with Switzerland as a leading wealth management center
Slide 7
Swiss
booking
center
Global,
(onshore &
offshore)
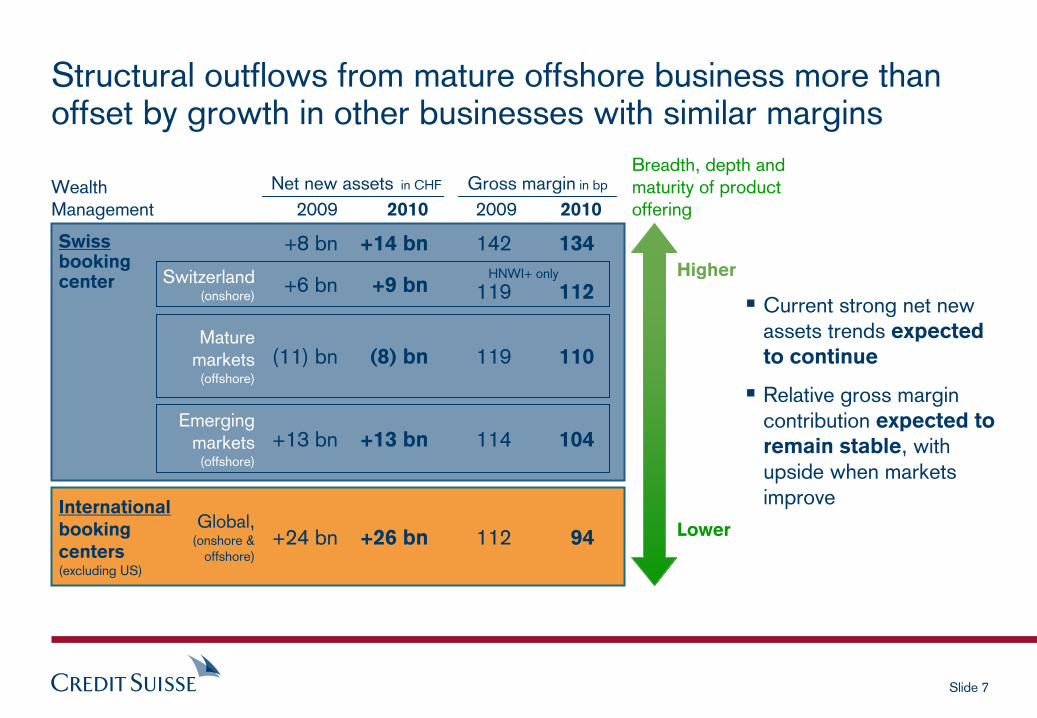
Structural outflows from mature offshore business more than offset by growth in other businesses with similar margins
Wealth Management
Current strong net new assets trends expected
to continue
Relative gross margin contribution expected to
remain stable, with upside when markets improve
Higher
Lower
Breadth, depth and maturity of product offering
Switzerland(onshore)
Mature markets
(offshore)
Emerging markets
(offshore)
International
booking
centers
(excluding US)
(11) bn
+24 bn
+13 bn
+6 bn
(8) bn
+26 bn
+13 bn
+9 bn
2009Net new assets
in CHF
2010
+8 bn +14 bn
94112
2009Gross margin
in bp
2010
104114
110119
112119HNWI+ only
134142

Slide 8
Wealth Management ideally positioned
to benefit when the environment improves
Look
ing
ahea
d
Investor confidence and risk appetite
To normalize with a stabilization of the environment
On/offshore
business mixNot expected to materially impact gross margin
Higher interest rates Will lead to increased revenues
Accelerated growth of UHNWI client segment
Positively impact pre-tax margin over time
Leading compliance framework
Supports mitigation of impact from changes in cross-border banking regulation
UHNWI = Ultra High Net Worth Individuals
Slide 9
Agenda
Progress in delivering our strategy
while maintaining a disciplined
investment approach
Introduction
Capital update and financial targets
Investment Banking

Slide 10
Investment Banking 2010 result impacted by subdued client flows but with continued market share momentum
Strong
underwriting and advisory results
Strong M&A, high yield and IPO underwriting results driven by robust activity levels and improved market shareIncreased market share and maintained #5 global share of wallet rank –
Improved to #3 in global completed M&A (up from #8) and to #3 in
high-yield issuance (up from #4)
Solid results across Cash Equities, Primes Services and Derivatives amid uneven market volumes during 2010Improved market share across key businesses–
Maintained #1 rank in global equity products
–
Maintained #1 rank
in US electronic trading–
Maintained top 3 rank in Prime Services
Solid equity sales and trading results
Resilient results in spite of macroeconomic uncertainties and normal seasonal trends in 2010; Credit and RMBS benefited from investor demand for yieldImproved market share in flow-based businesses–
Globally and across all regions
–
Across products, including global rates and emerging markets
Lower fixed income sales and trading results
Source: see market share slide in the appendix
Slide 11
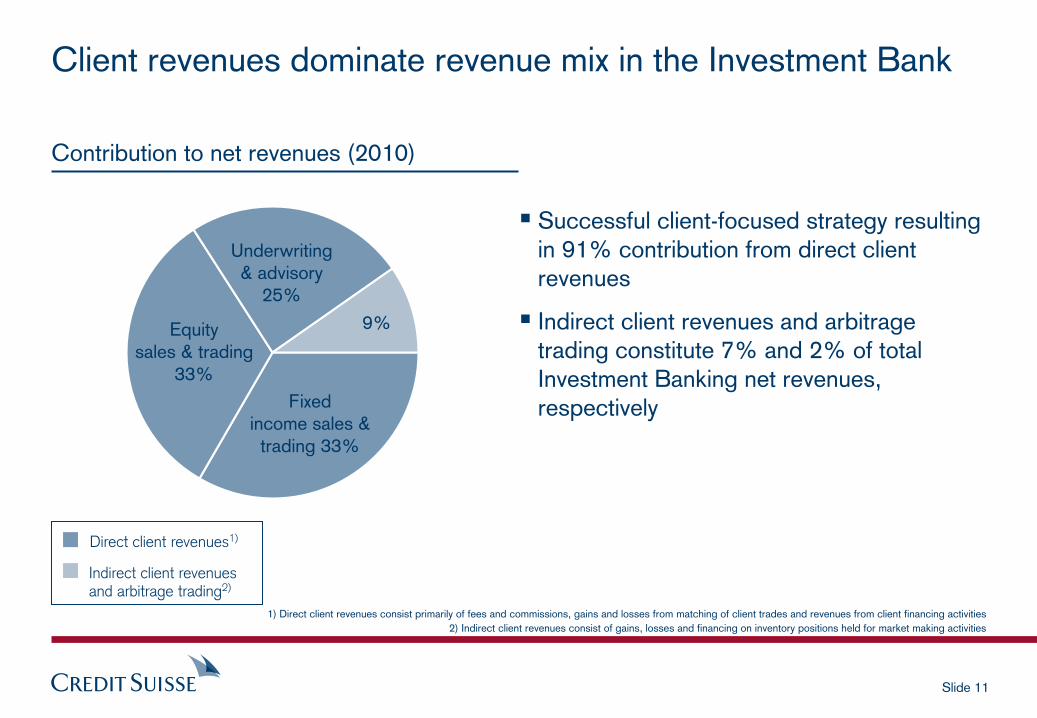
Client revenues dominate revenue mix in the Investment Bank
Successful client-focused strategy resulting in 91% contribution from direct client revenues
Indirect client revenues and arbitrage trading constitute 7% and 2% of total Investment Banking net revenues, respectively
1) Direct client revenues consist primarily of fees and commissions, gains and losses from matching of client trades and revenues from client financing activities2) Indirect client revenues consist of gains, losses and financing on inventory positions held for market making activities
Contribution to net revenues (2010)
Direct client revenues1)
Indirect client revenues and arbitrage trading2)
9%
Fixed
income sales &
trading 33%
Equity
sales & trading
33%
Underwriting & advisory
25%

Slide 12
Rates
Investment grade
Leveraged finance
Emergingmarkets
Equity der.
Prime Services
M&A
Rates
FX
RMBS
Investment grade
Leveraged financeEmerging markets
Cash equities
M&A
Equity capital markets
Commodities
Revenue contribution in FY 2010
Market environment
Cre
dit S
uiss
e m
arke
t sha
reS
tron
g
Worse than historic levels Better than historic levels
Ups
ide
pote
ntia
l
Revenue contribution in FY 2009
Revenue contribution from major business lines
Revenue decline in most businesses driven by challenging environment and client activity levels compared to 2009
Note: Excludes rebound revenues in 1Q09
Slide 13
Continuing to execute on client-focused, capital-efficient strategy
Client revenues dominate revenue mix in the Investment Bank
Focused investments in selected businesses to improve market share positions, broaden the footprint and achieve critical mass
Businesses with a leading market position and high capital turn deliver superior returns on capital
Slide 14
Agenda
Progress in delivering our strategy
while maintaining a disciplined
investment approach
Introduction
Capital update and financial targets
Asset Management
Slide 15
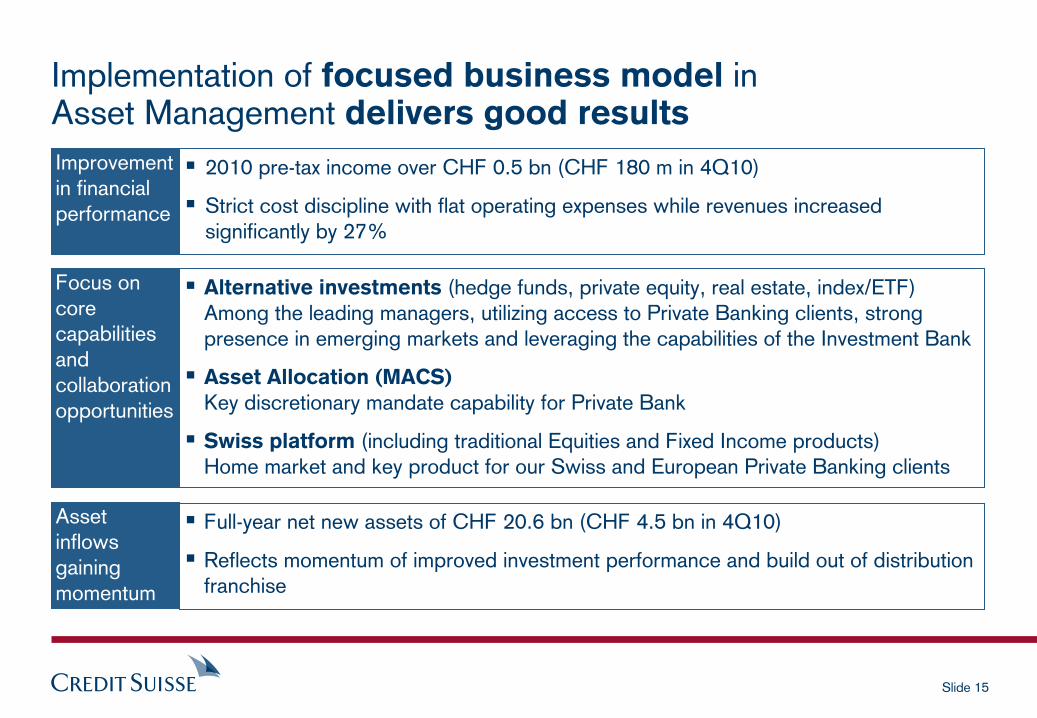
Implementation of focused business model
in Asset Management delivers good results
2010 pre-tax income over CHF 0.5 bn (CHF 180 m in 4Q10)
Strict cost discipline with flat operating expenses while revenues increased significantly by 27%
Focus on core capabilities and collaboration opportunities
Alternative investments (hedge funds, private equity, real estate, index/ETF)Among the leading managers, utilizing access to Private Banking clients, strong presence in emerging markets and leveraging the capabilities of the Investment Bank
Asset Allocation (MACS)
Key discretionary mandate capability for Private Bank
Swiss platform (including traditional Equities and Fixed Income products)Home market and key product for our Swiss and European Private Banking clients
Full-year net new assets of CHF 20.6 bn (CHF 4.5 bn in 4Q10)
Reflects momentum of improved investment performance and build out of distribution franchise
Asset inflows gaining momentum
Improvement in financial performance
Slide 16
Agenda
Progress in delivering our strategy
while maintaining a disciplined
investment approach
Introduction
Capital update and financial targets
Investment Banking
Private Banking
Asset Management

Slide 17
Maintained leading capital position
2008 2009
Basel 2 risk-weighted assets in CHF bn and tier 1 capital ratio in %
2007
10.0
13.3
257324
(32)%
16.3
222
3Q10
16.7
228
1) Excluding hybrid instruments of CHF 11.1 bn and tier 1 capital deductions of CHF 1.1 bn2) Distributions from Swiss GAAP reserves from capital contributions will be free of Swiss withholding tax and not be subject to
income tax for Swiss resident individuals holding the shares as
a private investment
(4)%
219
17.2
2010
Strong capital base
Basel 2 tier 1 ratio of 17.2%
Core tier 1 ratio of 12.7%1)
Pro-forma Basel 2.5 tier 1 ratio of 14.2%
Dividend proposal 2010
Cash distribution of CHF 1.30 per share
Paid free of 35% withholding tax2)
Dividend policy going forward
Gradually grow dividend per share amount over time as we build capital reserves
Slide 18
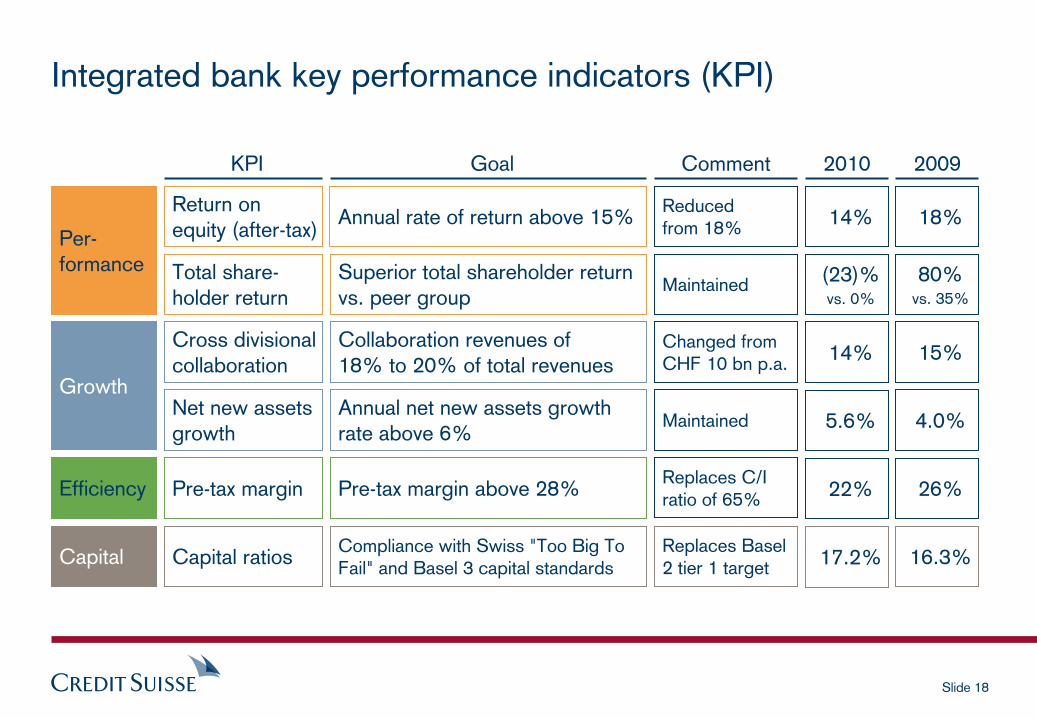
Goal 2010 2009
Integrated bank key performance indicators (KPI)
Growth
Efficiency
Per-
formance
Collaboration revenues of
18% to 20% of total revenues
Annual net new assets growth rate above 6%
Superior total shareholder return vs. peer group
Annual rate of return above 15%
Pre-tax margin above 28%
Cross divisional collaboration
Pre-tax margin
Return on equity (after-tax)
Total share-
holder return
Net new assets growth
15%
4.0%
80%vs. 35%
18%
26%
14%
5.6%
(23)%vs. 0%
14%
22%
Comment
Reduced
from 18%
Maintained
Changed from CHF 10 bn p.a.
Maintained
Replaces C/I ratio of 65%
KPI
Capital Compliance with Swiss "Too Big To Fail" and Basel 3 capital standardsCapital ratios 16.3%17.2%Replaces Basel
2 tier 1 target
Slide 19
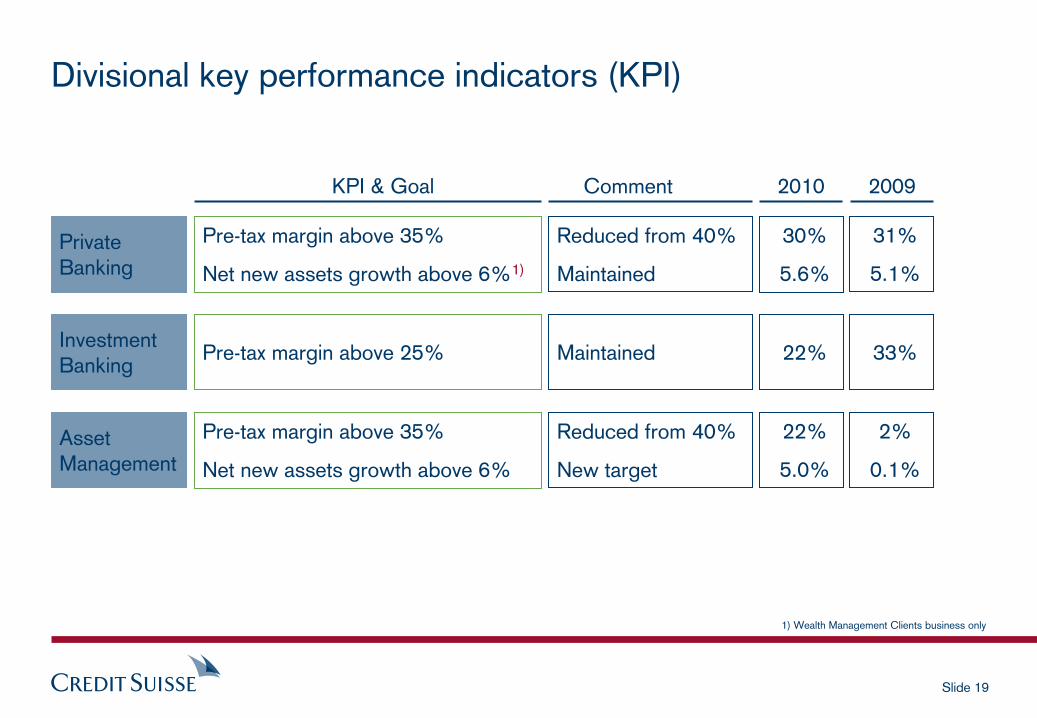
CommentKPI & Goal
Investment Banking
Private Banking
Asset Management
Divisional key performance indicators (KPI)
Pre-tax margin above 35%
Net new assets growth above 6%1)
Pre-tax margin above 35%
Net new assets growth above 6%
Pre-tax margin above 25%
2010 2009
31%
5.1%
30%
5.6%
33%22%
2%
0.1%
22%
5.0%
1) Wealth Management Clients business only
Reduced from 40%
Maintained
Maintained
Reduced from 40%
New target

Slide 20
Key performance indicators: Annual rate of return on equity above 15%
18
14 15
Return on equity (after-tax) in %
2009 2010
Private Banking: significant upside when environment normalizes and from the investment made in our international platforms
Asset Management: continued focus on growingfee-based revenues
Investment Banking: flow-based sales initiatives expansion starting to materialize as we drive our client-focused, capital-efficient strategy
Increased equity base reflecting transition to Basel 3 and Swiss "Too Big To Fail" environment from 2013 onwards
Fundamental trends affecting future returns
Target
Leading to consistent and significant book value accretion
Slide 21
Summary
Well positioned for 2011 and beyond
Performance underscores the strength of our business model
Clarity on regulatory framework; well ahead on implementation

Slide 22