Country Case Study: Brazilcbem.com.br/wp-content/uploads/2011/12/Renewable-Energy-Policy... ·...
30
Osvaldo Soliano Pereira, Ph.D. Centro Brasileiro de Energia e Mudança do Clima - CBEM Washington November 2010 Renewable Energy Policy Workshop Country Case Study: Brazil
-
Upload
trinhkhanh -
Category
Documents
-
view
214 -
download
0
Transcript of Country Case Study: Brazilcbem.com.br/wp-content/uploads/2011/12/Renewable-Energy-Policy... ·...
Osvaldo Soliano Pereira, Ph.D.
Centro Brasileiro de Energia e Mudança do Clima - CBEM
Washington
November 2010
Renewable Energy Policy Workshop
Country Case Study: Brazil
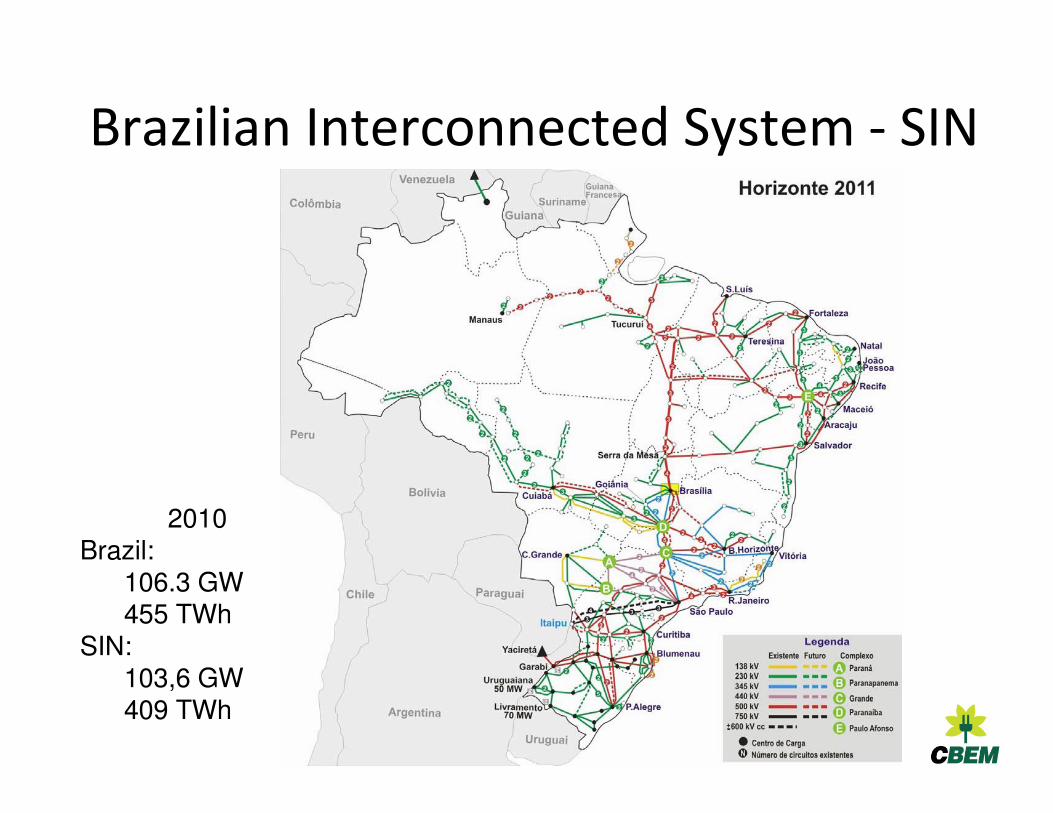
Brazilian Interconnected System - SIN
2010Brazil:
106.3 GW455 TWh
SIN: 103,6 GW409 TWh
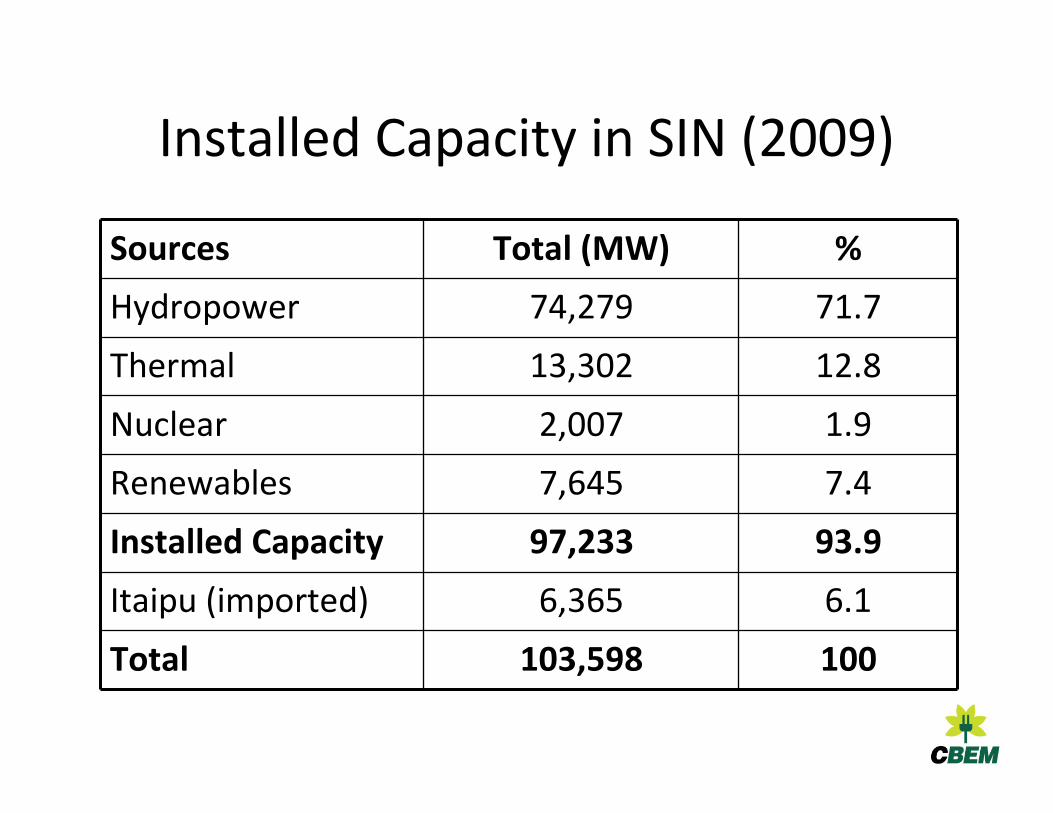
Installed Capacity in SIN (2009)
Sources Total (MW) %
Hydropower 74,279 71.7
Thermal 13,302 12.8
Nuclear 2,007 1.9
Renewables 7,645 7.4
Installed Capacity 97,233 93.9
Itaipu (imported) 6,365 6.1
Total 103,598 100
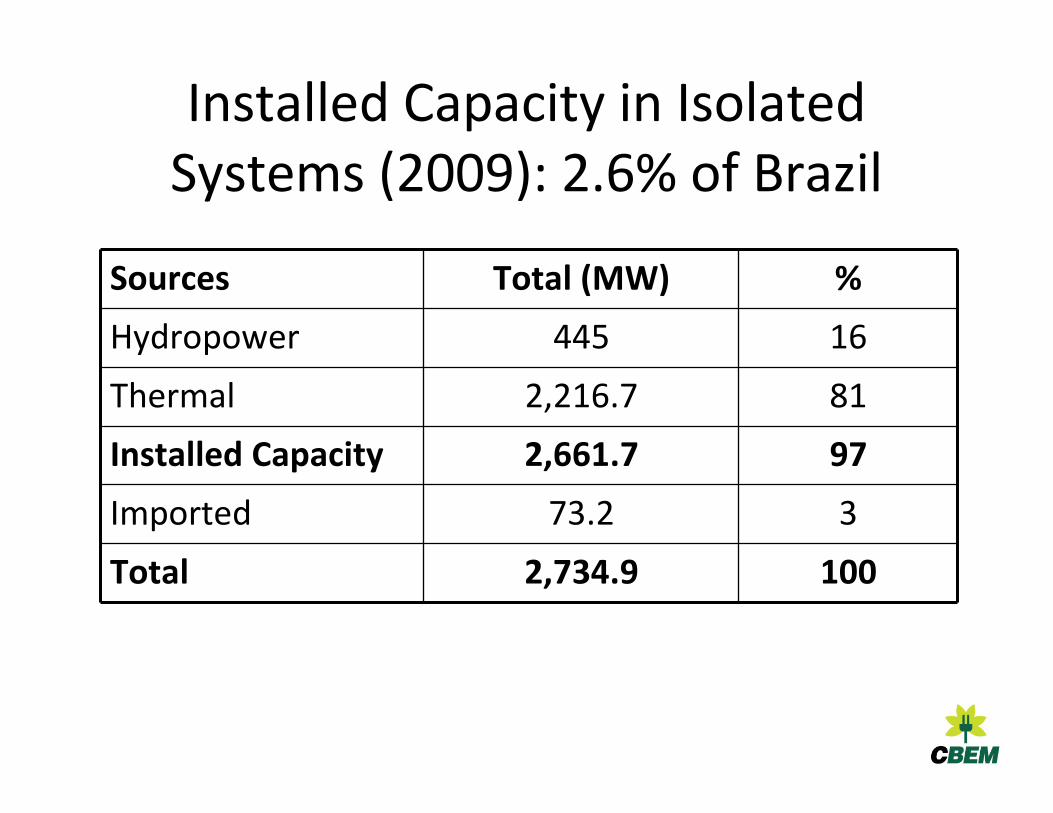
Installed Capacity in Isolated Systems (2009): 2.6% of Brazil
Sources Total (MW) %
Hydropower 445 16
Thermal 2,216.7 81
Installed Capacity 2,661.7 97
Imported 73.2 3
Total 2,734.9 100
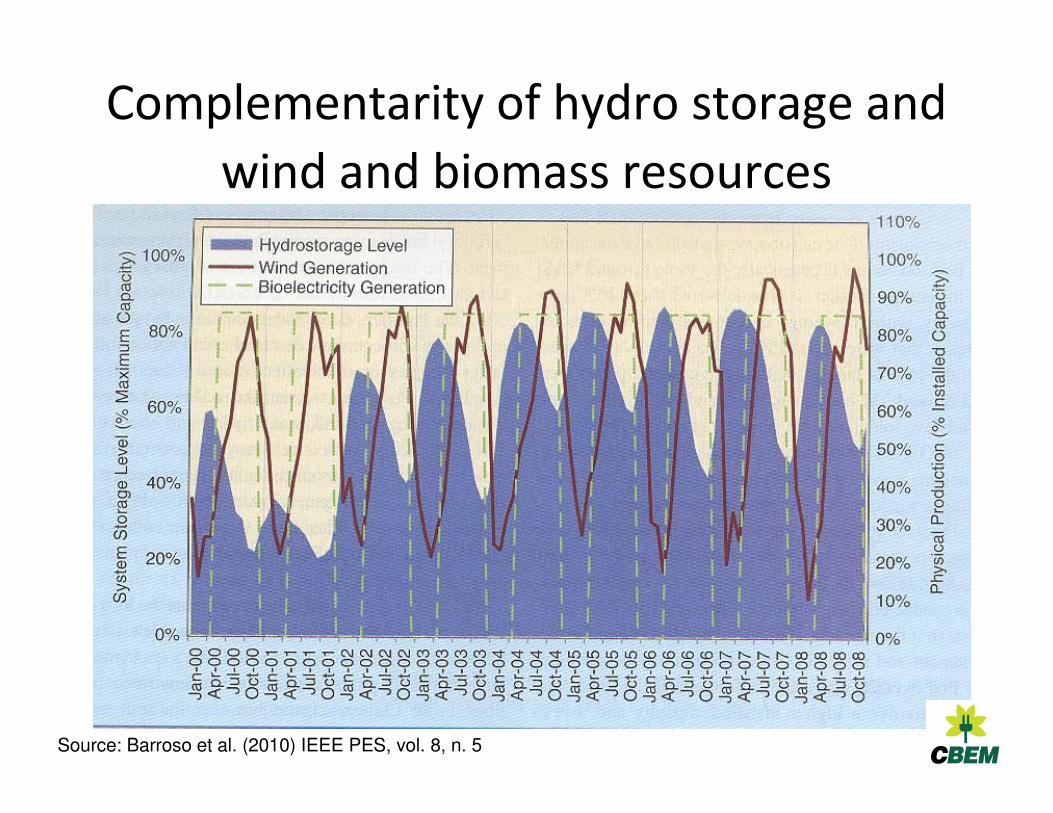
Complementarity of hydro storage and
wind and biomass resources
Source: Barroso et al. (2010) IEEE PES, vol. 8, n. 5
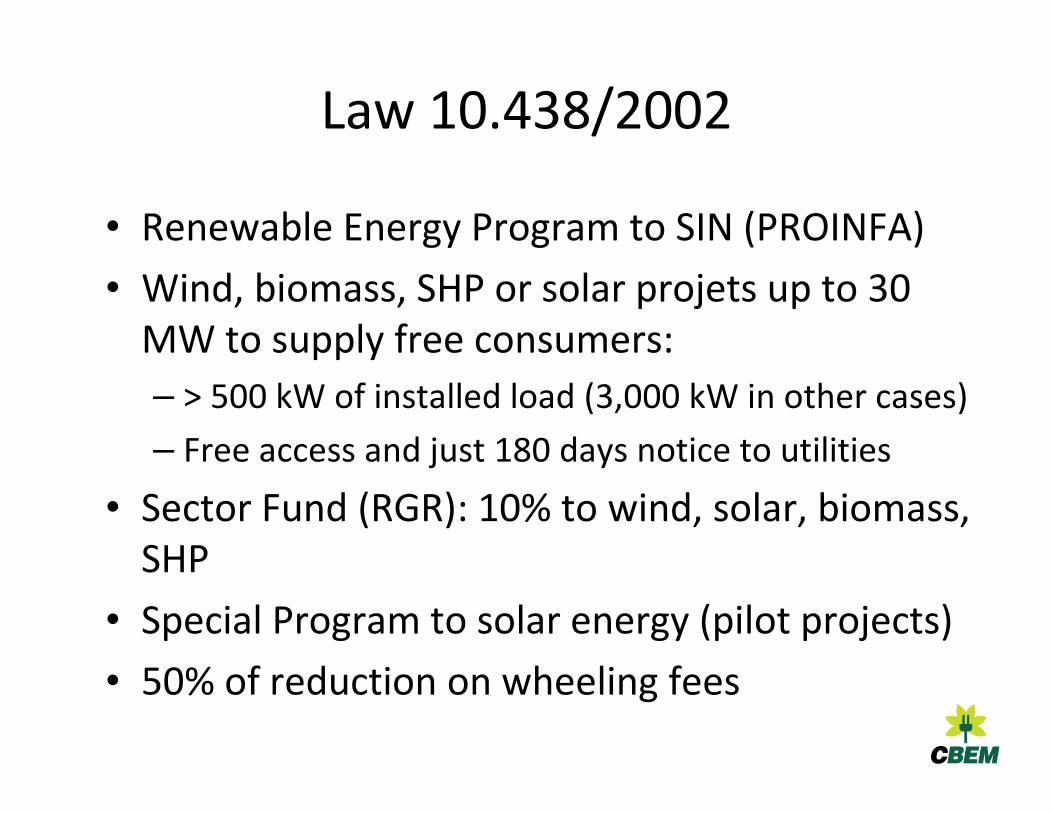
Law 10.438/2002
• Renewable Energy Program to SIN (PROINFA)
• Wind, biomass, SHP or solar projets up to 30 MW to supply free consumers:
– > 500 kW of installed load (3,000 kW in other cases)
– Free access and just 180 days notice to utilities
• Sector Fund (RGR): 10% to wind, solar, biomass, SHP
• Special Program to solar energy (pilot projects)
• 50% of reduction on wheeling fees
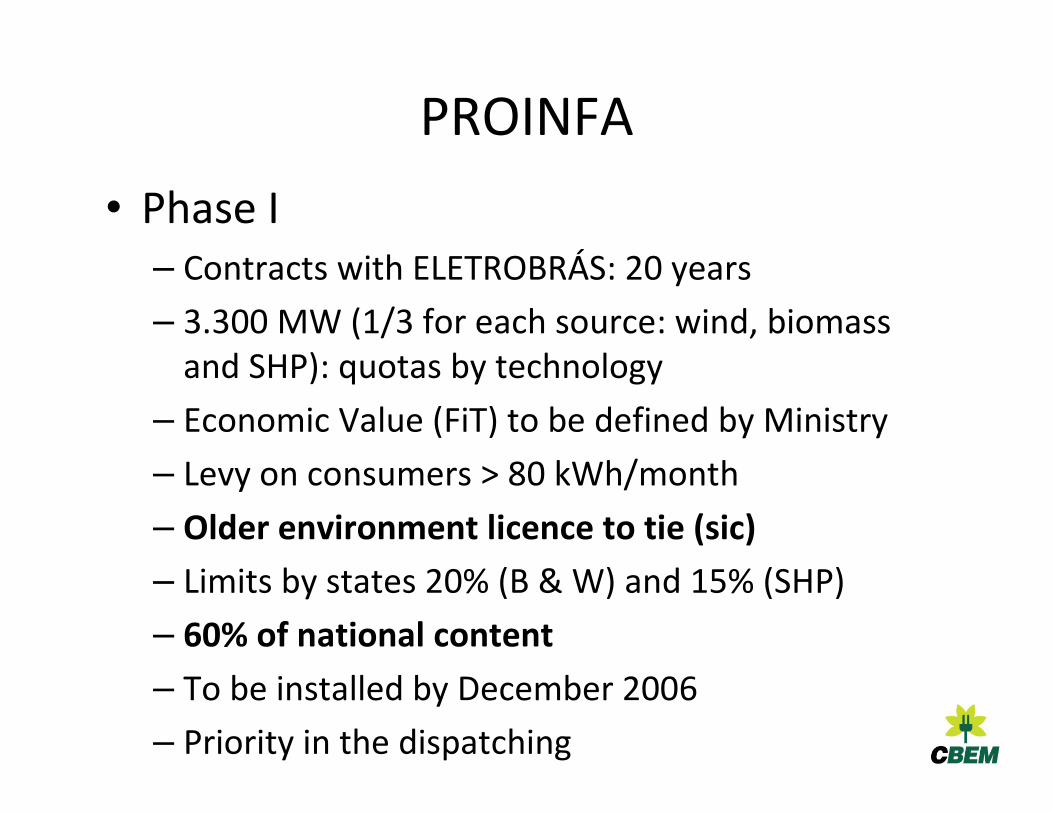
PROINFA
• Phase I– Contracts with ELETROBRÁS: 20 years
– 3.300 MW (1/3 for each source: wind, biomass and SHP): quotas by technology
– Economic Value (FiT) to be defined by Ministry
– Levy on consumers > 80 kWh/month
– Older environment licence to tie (sic)
– Limits by states 20% (B & W) and 15% (SHP)
– 60% of national content
– To be installed by December 2006
– Priority in the dispatching
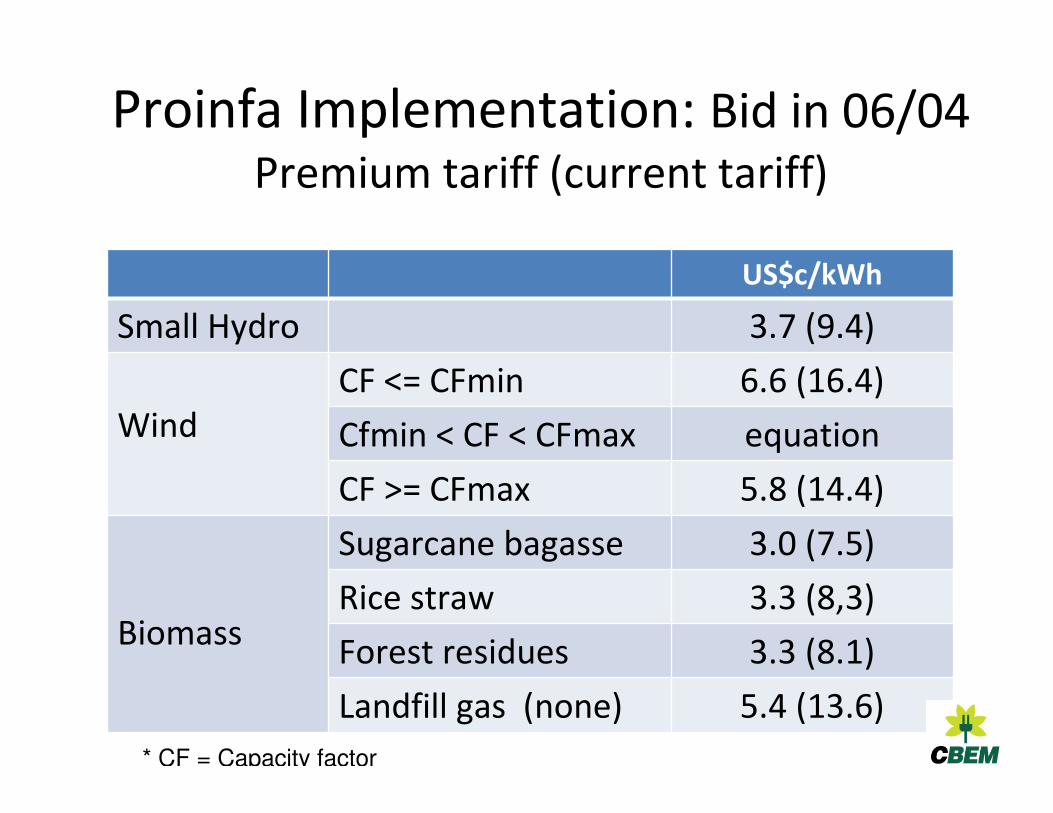
Proinfa Implementation: Bid in 06/04 Premium tariff (current tariff)
US$c/kWh
Small Hydro 3.7 (9.4)
WindCF <= CFmin 6.6 (16.4)
Cfmin < CF < CFmax equation
CF >= CFmax 5.8 (14.4)
Biomass
Sugarcane bagasse 3.0 (7.5)
Rice straw 3.3 (8,3)
Forest residues 3.3 (8.1)
Landfill gas (none) 5.4 (13.6)
* CF = Capacity factor
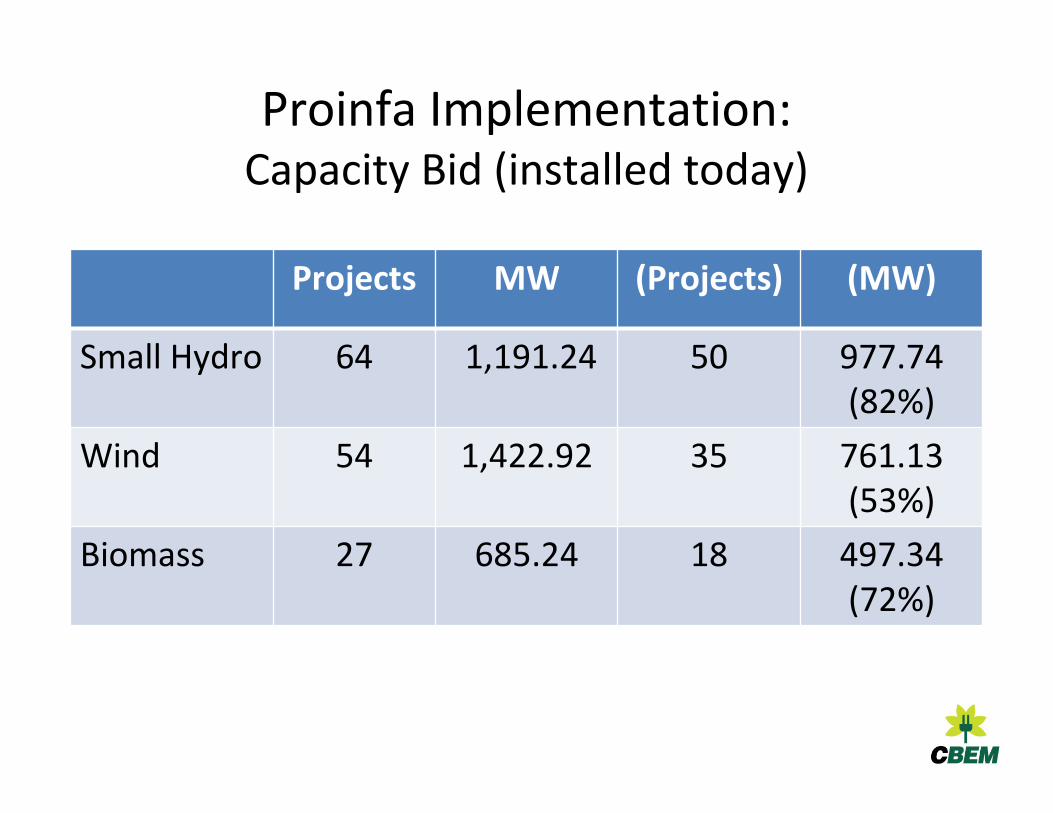
Proinfa Implementation: Capacity Bid (installed today)
Projects MW (Projects) (MW)
Small Hydro 64 1,191.24 50 977.74(82%)
Wind 54 1,422.92 35 761.13(53%)
Biomass 27 685.24 18 497.34(72%)
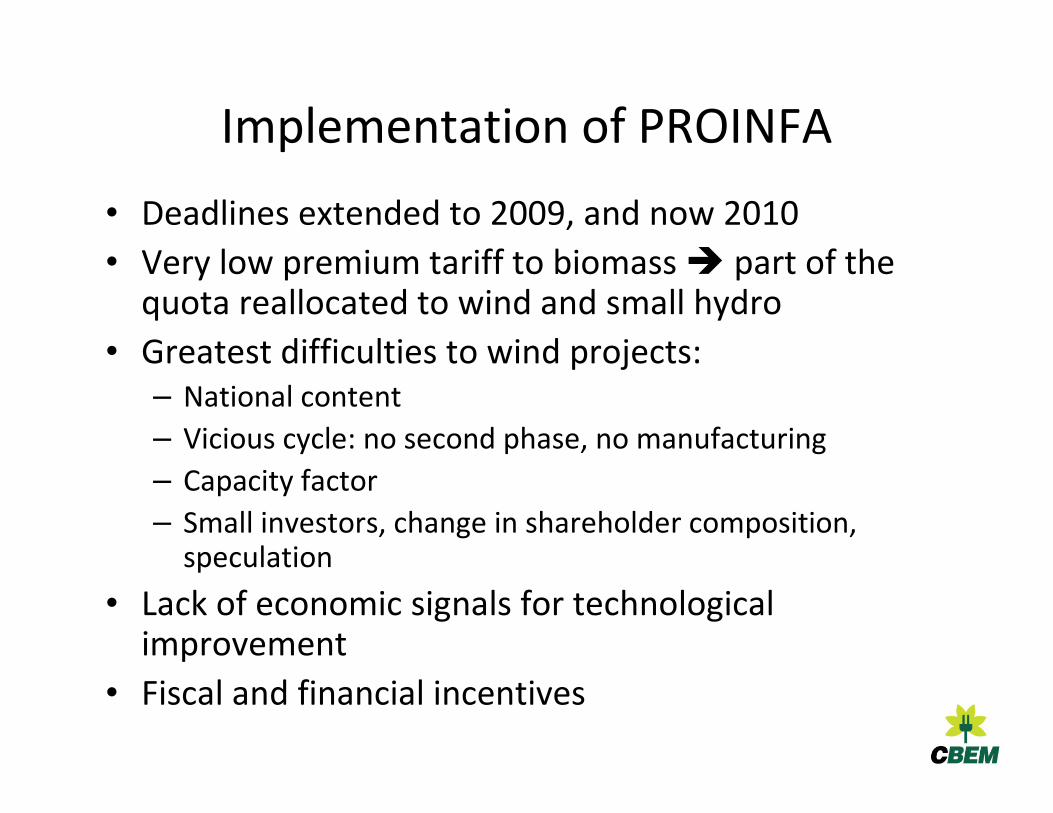
Implementation of PROINFA
• Deadlines extended to 2009, and now 2010
• Very low premium tariff to biomass � part of the quota reallocated to wind and small hydro
• Greatest difficulties to wind projects:– National content
– Vicious cycle: no second phase, no manufacturing
– Capacity factor
– Small investors, change in shareholder composition, speculation
• Lack of economic signals for technological improvement
• Fiscal and financial incentives
PROINFA
• Phase II: Never implemented– Once reached the target of 3.300 MW: 10% of
national consumption would be supplied by wind, biomass and SHP in 20 years
– Annual purchase of 15% of annual increase from these sources
– 20 year contracts by Eletrobras
– Renewable Energy Certificate
• New government came to power – Premium tariff makes pressure on electricity
tariffs penalizing the consumer
Law 10.848/04: New Model to Power Sector:Two Markets
• Regulated Market – ACR: distribution companies– 100% of the energy bought in competitive bids
– Contracts in pool � generators and discos
– Guaranteed revenue for the generators - Bid for lowest price
– Long-term contracts
• Free Market– Contracts freely agreed ==> free consumers, IPPs,
dealers
– Bilateral contracts: short to medium-term
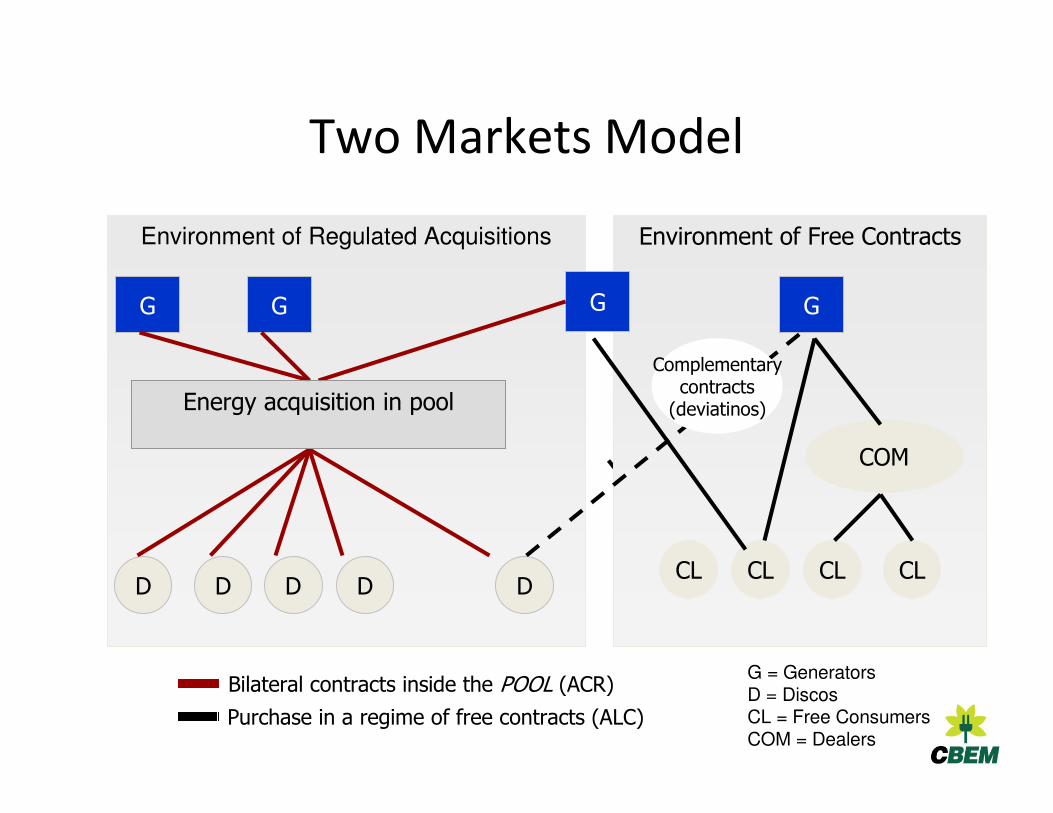
Two Markets Model
Environment of Free ContractsEnvironment of Regulated Acquisitions
COM
D D DD DCLCL CLCL
GG G G
Bilateral contracts inside the POOL (ACR)
Purchase in a regime of free contracts (ALC)
Complementarycontracts
(deviatinos)Energy acquisition in pool
G = GeneratorsD = DiscosCL = Free ConsumersCOM = Dealers
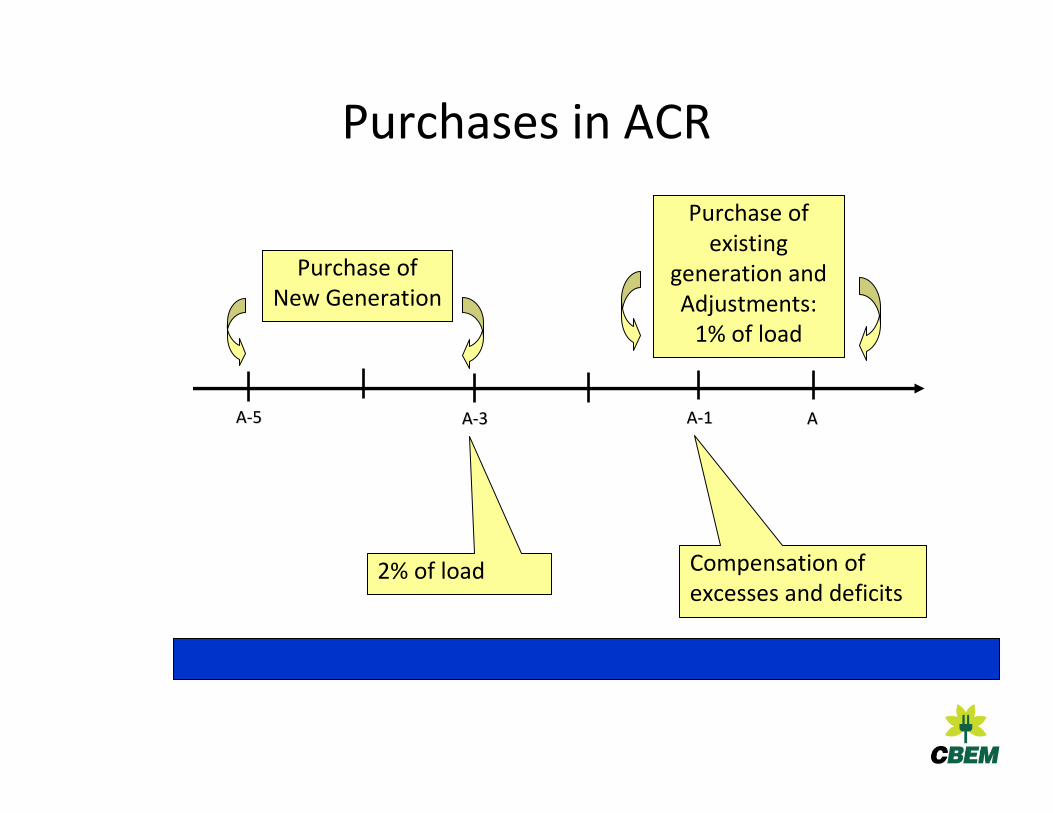
AA--55 AAAA--11AA--33
Purchase of existing
generation and Adjustments:
1% of load
Purchase of New Generation
Purchases in ACR
2% of load Compensation of excesses and deficits
Distributed Generation in New Model
• Sources of energy:
– small hydro (<30 MW), wind
– thermal power with efficiency over 75%, except in case of biomass
• Public bids or self-dealing by discos: up to 10% of load
• No limits to discos with annual sales up to 500 GWh
• Pass through limited to Annual Reference Value
– weighted average of "A-5" and "A-3 auctions, reviewed annually by IPCA
• No concrete results
Decree 6.353/2008: Reserve of Generation Capacity
• Regulation of a physical energy reserve mechanism, conceived to thermal power plants
• Contract auctions to increase of supply in SIN with cap price
• Extended to renewables: wind energy as reserve (sic)
• Auctions organized by Regulatory Agency (ANEEL), under guidelines of the Ministry
• Fixed and variable costs passed through to customers
• It can be technology driven
• Used in 2008 for biomass, 2009 for wind, 2010 for all new renewables, excluding solar
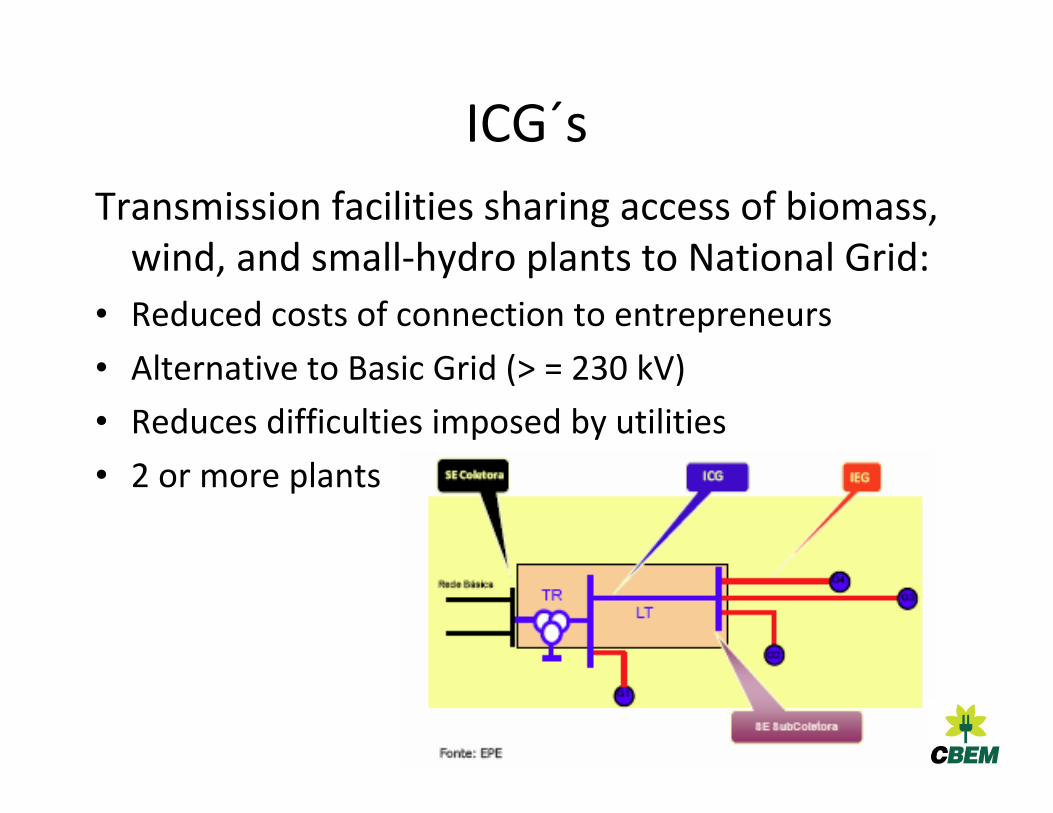
ICG´s
Transmission facilities sharing access of biomass, wind, and small-hydro plants to National Grid:
• Reduced costs of connection to entrepreneurs
• Alternative to Basic Grid (> = 230 kV)
• Reduces difficulties imposed by utilities
• 2 or more plants
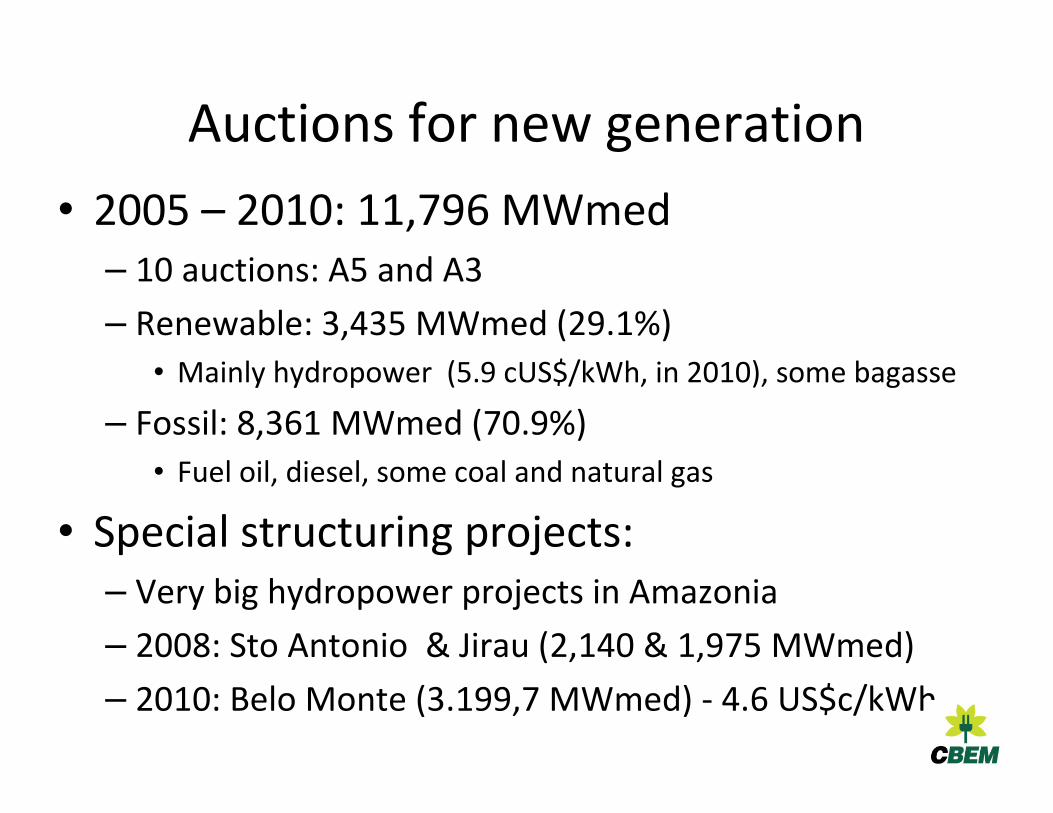
Auctions for new generation
• 2005 – 2010: 11,796 MWmed– 10 auctions: A5 and A3
– Renewable: 3,435 MWmed (29.1%)
• Mainly hydropower (5.9 cUS$/kWh, in 2010), some bagasse
– Fossil: 8,361 MWmed (70.9%)
• Fuel oil, diesel, some coal and natural gas
• Special structuring projects:– Very big hydropower projects in Amazonia
– 2008: Sto Antonio & Jirau (2,140 & 1,975 MWmed)
– 2010: Belo Monte (3.199,7 MWmed) - 4.6 US$c/kWh
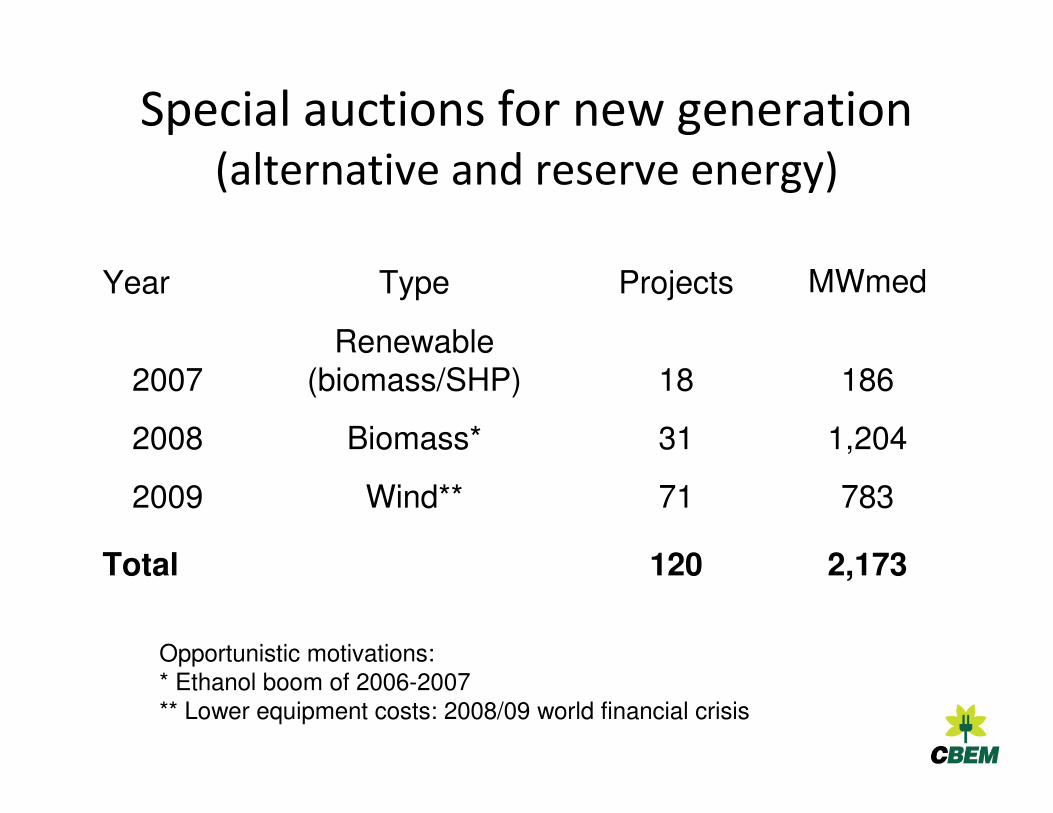
Special auctions for new generation(alternative and reserve energy)
Year Type Projects MWmed
2007Renewable
(biomass/SHP) 18 186
2008 Biomass* 31 1,204
2009 Wind** 71 783
Total 120 2,173
Opportunistic motivations:* Ethanol boom of 2006-2007
** Lower equipment costs: 2008/09 world financial crisis
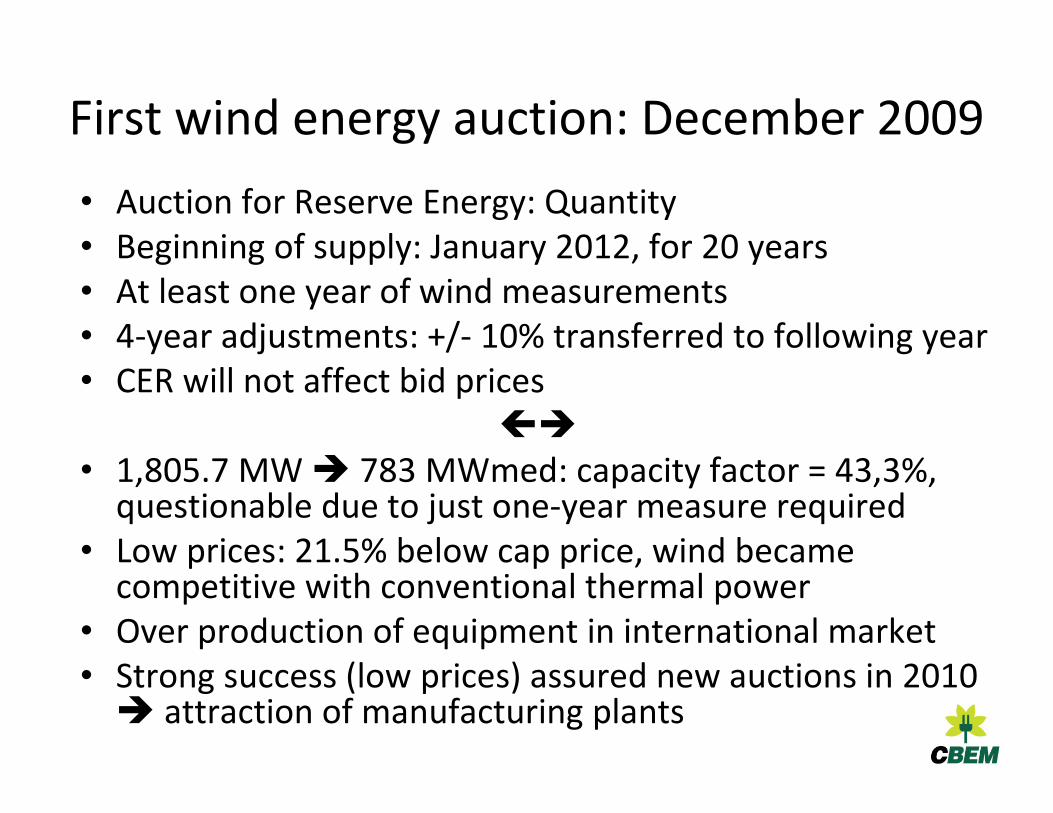
First wind energy auction: December 2009
• Auction for Reserve Energy: Quantity • Beginning of supply: January 2012, for 20 years• At least one year of wind measurements• 4-year adjustments: +/- 10% transferred to following year• CER will not affect bid prices
�
• 1,805.7 MW � 783 MWmed: capacity factor = 43,3%, questionable due to just one-year measure required
• Low prices: 21.5% below cap price, wind became competitive with conventional thermal power
• Over production of equipment in international market • Strong success (low prices) assured new auctions in 2010 � attraction of manufacturing plants
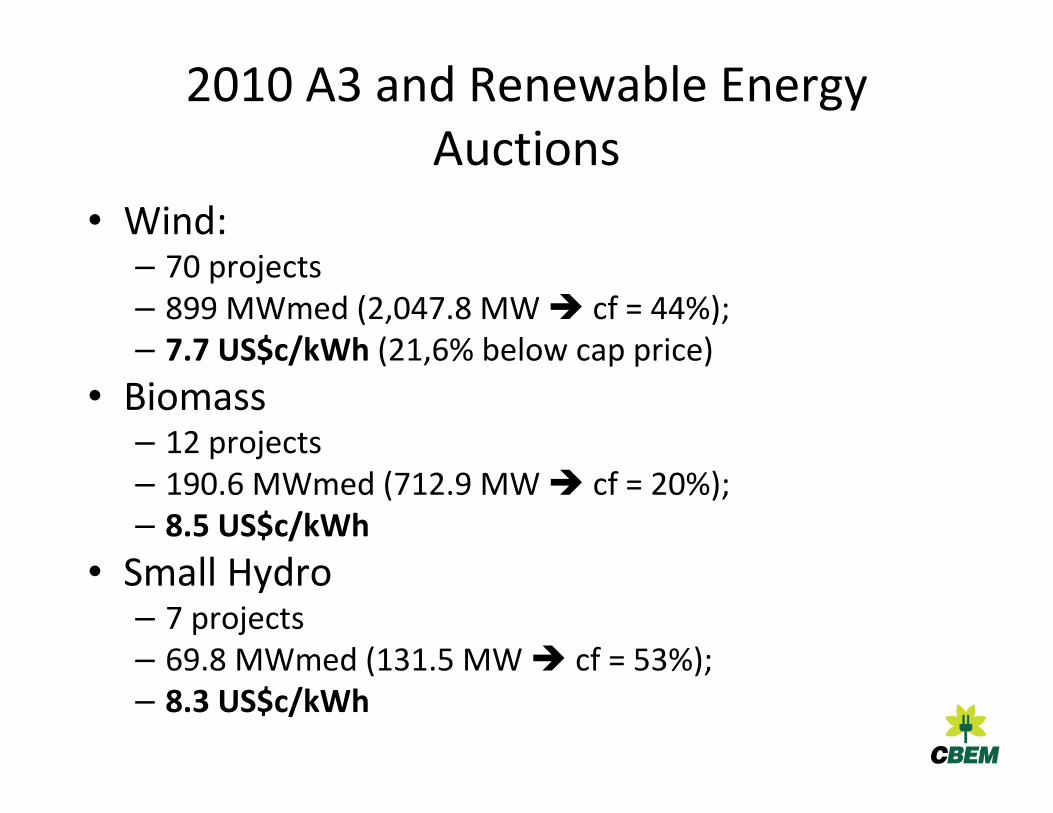
2010 A3 and Renewable EnergyAuctions
• Wind: – 70 projects– 899 MWmed (2,047.8 MW � cf = 44%); – 7.7 US$c/kWh (21,6% below cap price)
• Biomass– 12 projects– 190.6 MWmed (712.9 MW � cf = 20%); – 8.5 US$c/kWh
• Small Hydro– 7 projects– 69.8 MWmed (131.5 MW � cf = 53%); – 8.3 US$c/kWh
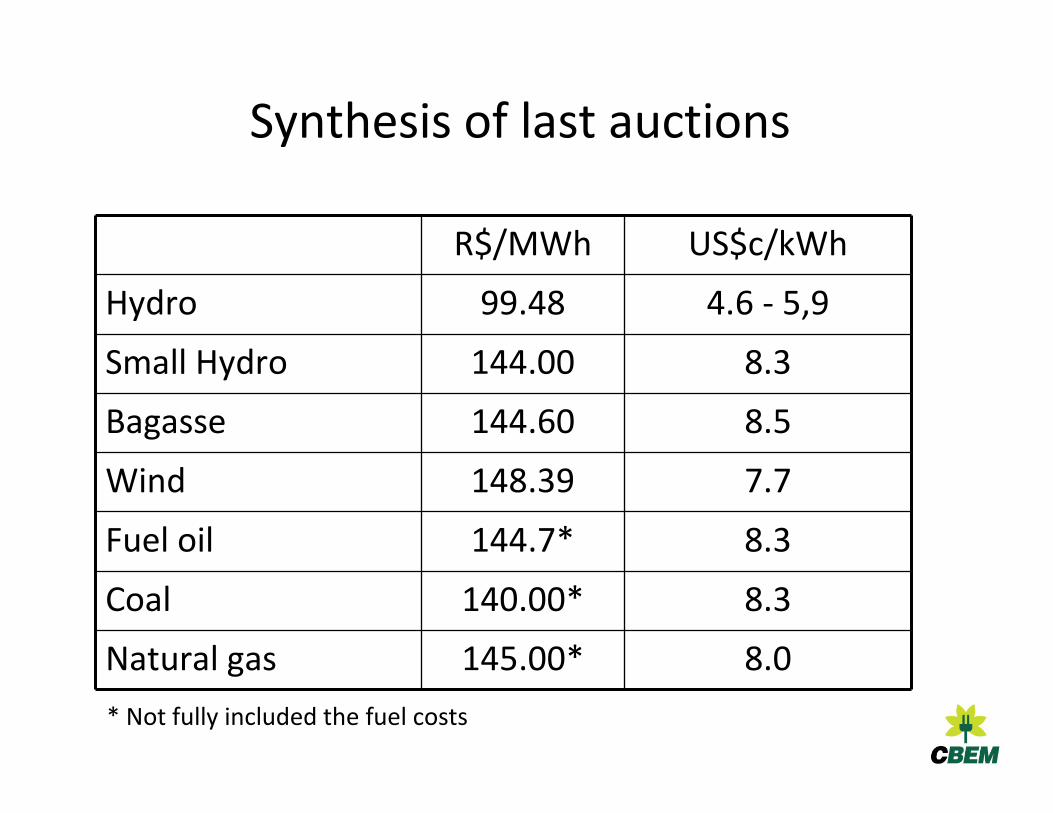
Synthesis of last auctions
R$/MWh US$c/kWh
Hydro 99.48 4.6 - 5,9
Small Hydro 144.00 8.3
Bagasse 144.60 8.5
Wind 148.39 7.7
Fuel oil 144.7* 8.3
Coal 140.00* 8.3
Natural gas 145.00* 8.0
* Not fully included the fuel costs
National Plan on Climate Change
• Power sector emissions reduction will be responsible for less than 1% national reductions (6% of emissions of energy sector)
• Cogeneration (mainly bagasse): 11.4% of supply in 2030
• New 34,46 GW of hydropower
• Reduction of non-technical losses from distribution utilities: 400 GWh
• Support on expansion of use of solar energy
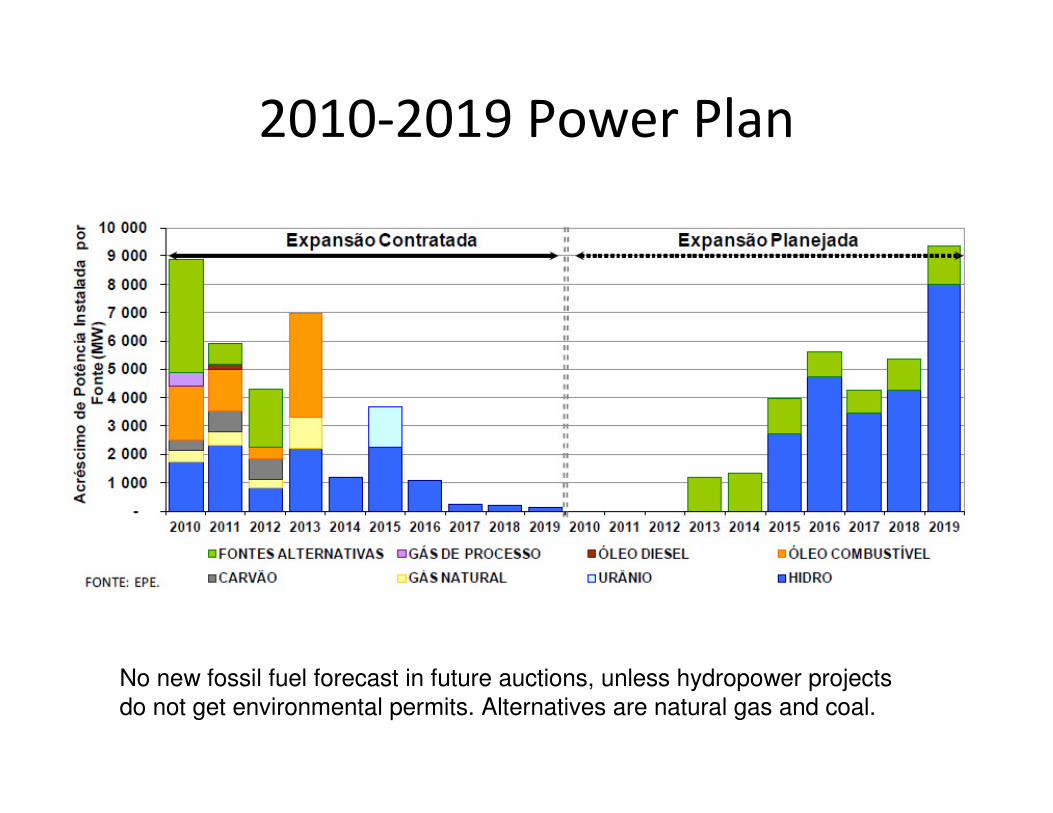
2010-2019 Power Plan
No new fossil fuel forecast in future auctions, unless hydropower projects
do not get environmental permits. Alternatives are natural gas and coal.
Working Group on PV Connected to Grid
• Pilot project by a utility, monitored by ANEEL, using R&D funds
• Impact studies on operation and energy purchase mechanisms
• Assess methodology used to stadiums for World Cup
• Establish a strategy for promoting the national PV industry, focusing on tax exemption, special credits and international partnerships
• Raise the potentials and needs of the domestic industry for production of equipment for PV systems;
• Develop the technology of purification and processing of silicon, taking into account the characteristics of national purity silicon;
• Introduce PV distributed generation in 10 year and long-term energy plans , according to results obtained in earlier phases
Legal Framework for Isolated Systems and Non-supplied areas
• Same subsidies to diesel extended to renewables (2002)
• Compulsory universal access up to 2015 (2002)• Mini-grids or individual solar and wind systems
accepted as an alternative to comply universal access mandate (2004)
• Flexible quality of supply for individual systems regulated by ANEEL (2004): size of systems and duration of outages
• Definition of technical and financial criteria, procedures and priorities to supply isolated communities with mini-grids, preferably making use of renewable energy (2009): pre-paid systems, 85% donnations/soft loans, pilot projects to be replicated
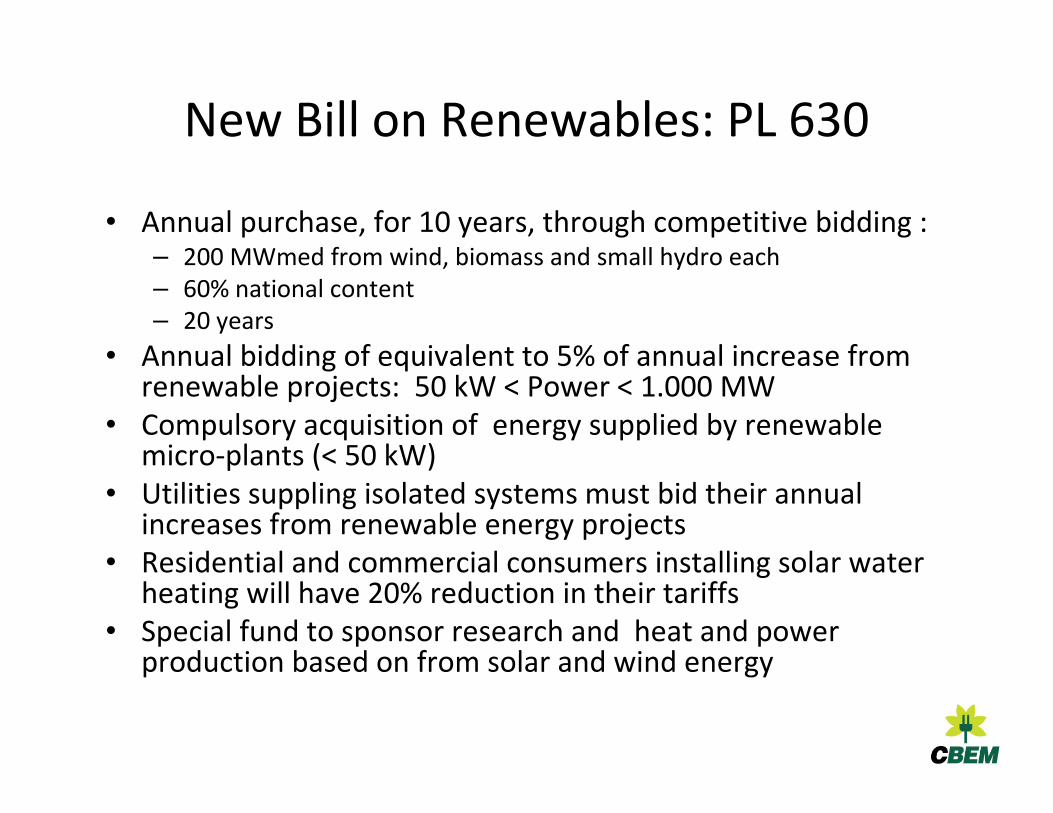
New Bill on Renewables: PL 630
• Annual purchase, for 10 years, through competitive bidding :– 200 MWmed from wind, biomass and small hydro each– 60% national content– 20 years
• Annual bidding of equivalent to 5% of annual increase from renewable projects: 50 kW < Power < 1.000 MW
• Compulsory acquisition of energy supplied by renewable micro-plants (< 50 kW)
• Utilities suppling isolated systems must bid their annual increases from renewable energy projects
• Residential and commercial consumers installing solar water heating will have 20% reduction in their tariffs
• Special fund to sponsor research and heat and power production based on from solar and wind energy
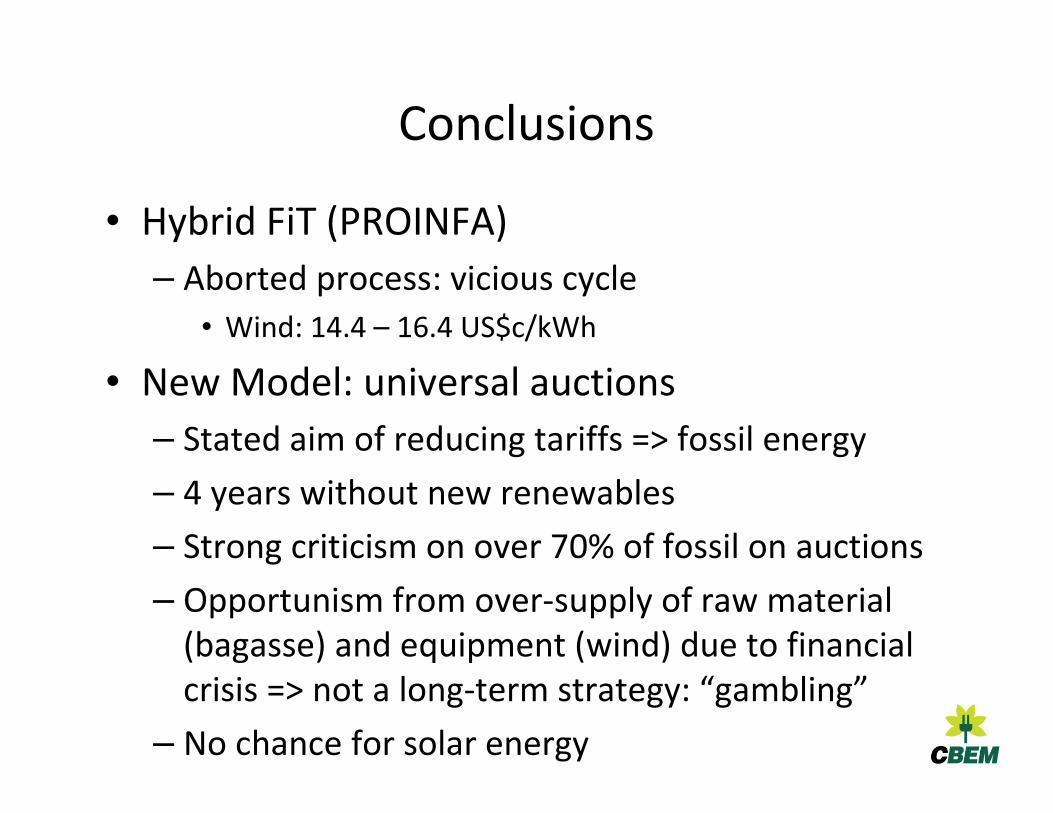
Conclusions
• Hybrid FiT (PROINFA)
– Aborted process: vicious cycle
• Wind: 14.4 – 16.4 US$c/kWh
• New Model: universal auctions
– Stated aim of reducing tariffs => fossil energy
– 4 years without new renewables
– Strong criticism on over 70% of fossil on auctions
– Opportunism from over-supply of raw material (bagasse) and equipment (wind) due to financial crisis => not a long-term strategy: “gambling”
– No chance for solar energy
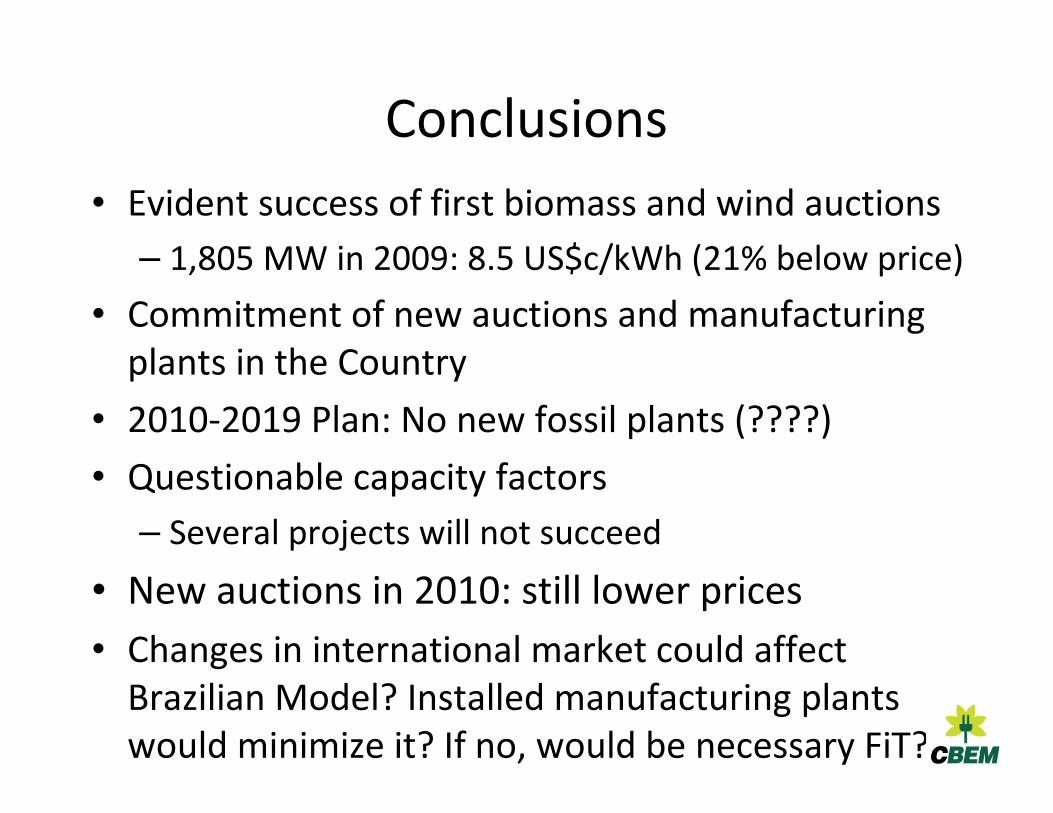
Conclusions
• Evident success of first biomass and wind auctions
– 1,805 MW in 2009: 8.5 US$c/kWh (21% below price)
• Commitment of new auctions and manufacturing plants in the Country
• 2010-2019 Plan: No new fossil plants (????)
• Questionable capacity factors
– Several projects will not succeed
• New auctions in 2010: still lower prices
• Changes in international market could affect Brazilian Model? Installed manufacturing plants would minimize it? If no, would be necessary FiT?
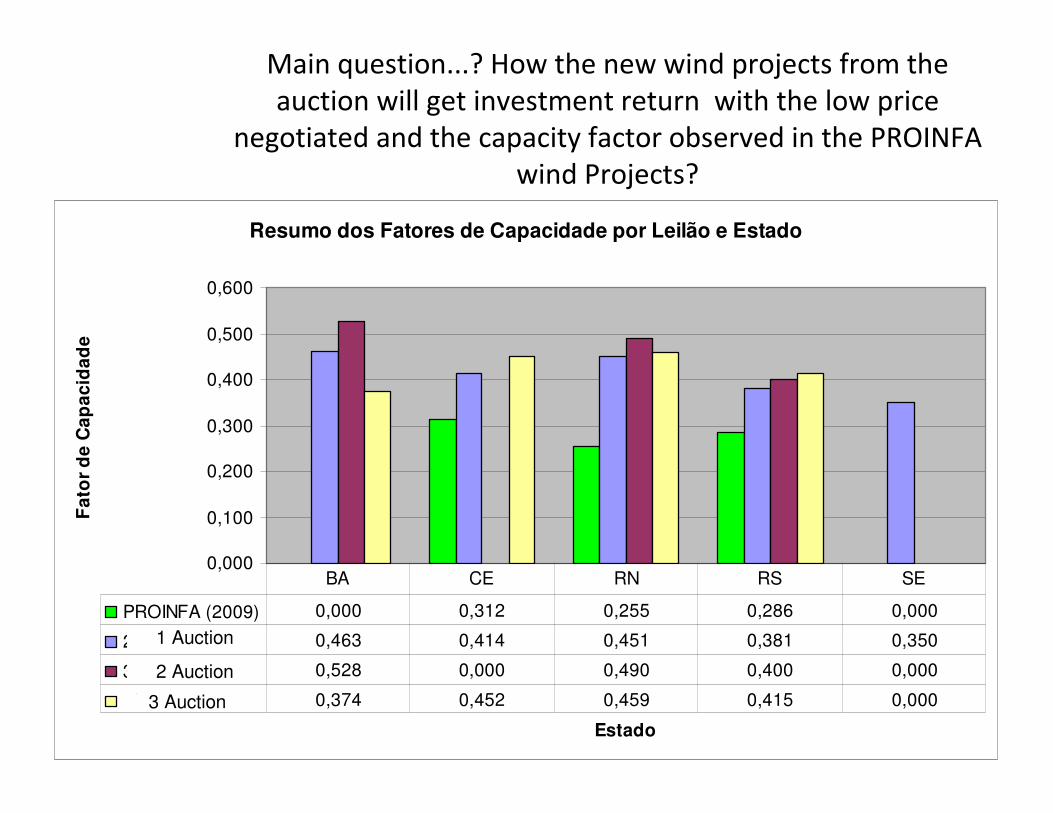
Main question...? How the new wind projects from the auction will get investment return with the low price
negotiated and the capacity factor observed in the PROINFA wind Projects?
Resumo dos Fatores de Capacidade por Leilão e Estado
0,000
0,100
0,200
0,300
0,400
0,500
0,600
Estado
Fa
tor
de
Ca
pa
cid
ad
e
PROINFA (2009) 0,000 0,312 0,255 0,286 0,000
2º LER 0,463 0,414 0,451 0,381 0,350
3º LER 0,528 0,000 0,490 0,400 0,000
2º LFA 0,374 0,452 0,459 0,415 0,000
BA CE RN RS SE
1 Auction
2 Auction
3 Auction