Correlation. Median HHI and Percent of Households Eligible for Food Stamps.
14
Correlation
-
Upload
lester-king -
Category
Documents
-
view
216 -
download
1
Transcript of Correlation. Median HHI and Percent of Households Eligible for Food Stamps.

Correlation

Median HHI and Percent of Households Eligible for Food Stamps

Percent of Households Eligible for Food Stamps and Percent Unemployed

A few words about Scatterplots
• A Scatterplot displays the direction and strength of the association between two sets of quantitative data
• The direction refers to whether there is a positive, negative, or no association between the data
• The association is strong if the dots come close to being in a straight line
• The association is weak if the dots don’t come close to being in a straight line

A number called the correlation measures both the direction and strength of the linear relationship between two related sets of quantitative variables.

Properties of Correlation
• The correlation is written as r
• Correlation requires that both variables be quantitative
• A positive value for r means there is a positive relationship between the variables
• A negative value for r means there is a negative relationship between the variables

• The value of the correlation is always between - 1 and + 1.
• A strong relationship means the correlation is close to either - 1 or + 1
• There can be a strong positive relationship (r is close to 1), or a strong negative relationship (r is close to - 1)
• A weak relationship means the correlation is closer to 0 than to either - 1 or + 1
• The value of r is affected by outliers

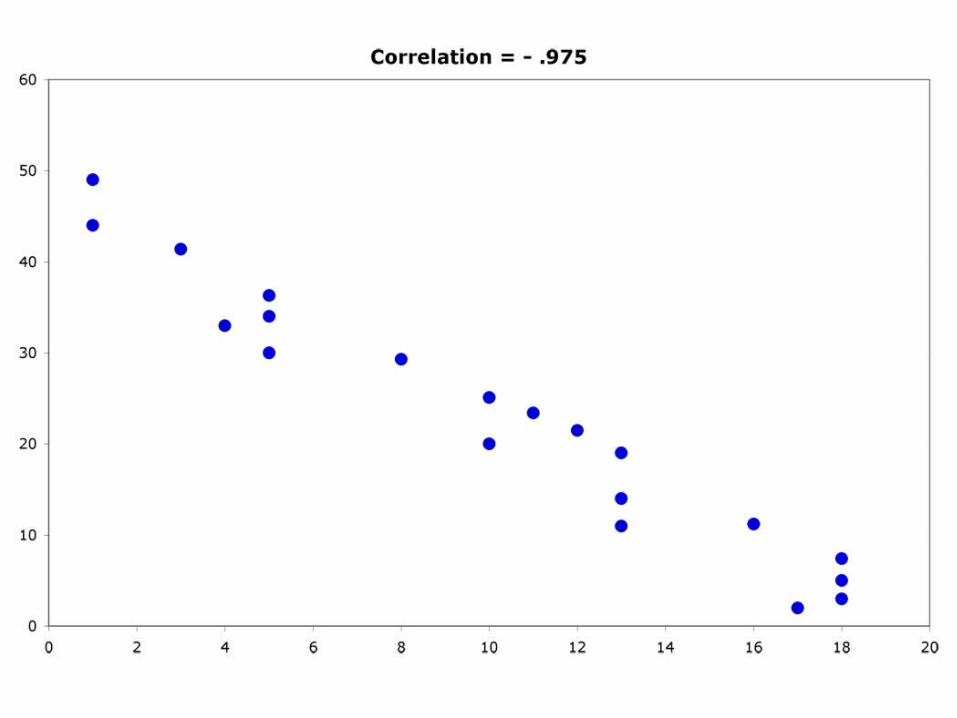
Guess the Correlations:
.67 .993 .003 -.975


Excel Formula for Correlation:
=CORREL(array1,array2)
A B
1 3 2
2 4 8
3 7 11
4 3 4
5 8 2
6 5 7
=CORREL(array1,array2)
=CORREL(a1:a6,array2)
=CORREL(a1:a6,b1:b6)

Percent of HH
Eligible for Food Stamps
New AIDS Cases
per 100,000 (2000)
Percent of 35 – 44 y/o
with Bachelor’s
Degree
Percent Unemployed
Percent Unemployed and Not in
Labor Force
Spending per Student
(Grades 1 – 8)
Median HHI (1999) -0.950 -0.659 0.873 -0.895 -0.687 0.147
Percent of HH Eligible for Food Stamps
0.771 -0.875 0.923 0.675 -0.052
New AIDS Cases per 100,000 (2000)
-0.761 0.585 0.268 0.194
Percent of 35 – 44 y/o with Bachelor’s Degree
-0.735 -0.429 0.043
Percent Unemployed 0.666 -0.070
Spending per Student (Grds 1 – 8)
-0.007