Cool Roofs Report
56
Cool Roofs: City of Melbourne Re searc h Repor t September 2011 The University of Melbourne
Transcript of Cool Roofs Report

7/29/2019 Cool Roofs Report
http://slidepdf.com/reader/full/cool-roofs-report 1/56
Cool Roofs:
City of Melbourne
Research Report
September 2011
The University of Melbourne
7/29/2019 Cool Roofs Report
http://slidepdf.com/reader/full/cool-roofs-report 2/56
Cool Roofs Research
Page | 2
ContentsCool Roofs : ............................................................................................................................................1
Research Results ..................................................................................................................................1
Introduct ion ...........................................................................................................................................4
Background.........................................................................................................................................4
Terminology.........................................................................................................................................4
Understanding the Language of Cool Roof properties .......................................................................5
Solar Reflectance:..............................................................................................................................5
Thermal Emittance:............................................................................................................................5
Solar Reflectance Index:....................................................................................................................5
What are the Benefits of a Cool Roof? ...............................................................................................6
Li terature review ...................................................................................................................................7
Urban Heat Island ...............................................................................................................................7
Local thermal effects – micro heat islands..........................................................................................8
Cool roof studies and measurements .................................................................................................8
Product Description............................................................................................................................10
Thermoshield (from website).............................................................................................................10
SkyCool (from website).....................................................................................................................11
EPA Staycool ....................................................................................................................................12
Dulux Infracool (from website) ..........................................................................................................12
Colorbond CoolMax (from website) ..................................................................................................13
The Issue of R-values.......................................................................................................................13
Methodology ........................................................................................................................................15
Study Limitations...............................................................................................................................15
Methodology – Site Measurements ..................................................................................................16
Field Data Logging...........................................................................................................................17
Methodology – Computer Simulation................................................................................................18

7/29/2019 Cool Roofs Report
http://slidepdf.com/reader/full/cool-roofs-report 3/56
Cool Roofs Research
Page | 3
Field Results ........................................................................................................................................23
Indoor Temperatures.........................................................................................................................23
Roof Surface Temperatures (external) .............................................................................................26
Roof Reflectivity ................................................................................................................................28
Field Results Summary.....................................................................................................................31
Simulation Results ..............................................................................................................................31
Field Test Buildings – modeling for total energy use ........................................................................31
Field Test Buildings – modeling for variation to R-value...................................................................32
Field Test Buildings – modeling for variation to roof pitch ................................................................32
Field Test Buildings – modeling for variation to shading of the roof surface ....................................34
Sample Building Modeling – residential variation of insulation location in roofspace....................... 36
Sample Building Simulation – Commercial and Residential Heating and Cooling Energy...............37
Sample building Simulation – Effect of height of a commercial building ..........................................38
Sample Building Simulation – Industrial internal Temperature profile ..............................................38
Sample Building Simulation – Industrial Energy Use profile.............................................................39
Conclusions.........................................................................................................................................41
References ...........................................................................................................................................42
Appendix A: .........................................................................................................................................44
Appendix B: .........................................................................................................................................45
Appendix E ..........................................................................................................................................48
Appendix F: .........................................................................................................................................54
Appendix G: .........................................................................................................................................55
Current Programs using CRP ...........................................................................................................55
International Programs......................................................................................................................55
Australian requirements for a CRP product ......................................................................................56
7/29/2019 Cool Roofs Report
http://slidepdf.com/reader/full/cool-roofs-report 4/56
Cool Roofs Research
Page | 4
IntroductionThis research and associated fact sheet has been commissioned by the City of Melbourne
to provide direction to consumers about the use of “Cool” or “White” roof paints (hereafter referred toas Cool Roof Paint (CRP), that have a significant higher reflectivity and emissivity when compared
with normal roof materials and coatings.
There is currently available a number of products that can be applied to a variety of new and existing
roof types to reduce primarily heat gain (reflection) through the surface of the roof and also in some
cases to improve heat lost to the atmosphere (emissivity). These products vary widely in their
application approach and performance.
Background
A cool roof is one that reflects the sun’s heat and emits absorbed radiation back into the atmosphere
at a higher rate than standard materials. Cool roof performance may be achieved with additives to thebase material, or by applying a CRP. These types of roofs literally stay cooler,thus reducing the
amount of heat held and transferred to the building below, keeping the building a cooler and more
constant temperature.
A simple analogy is putting your hand on a white piece of metal out in the sun or a black piece of
metal, or feeling warmer in a black jumper compared to a white jumper. And there are times when it is
desirable to absorb more heat, and this will be discussed in relation to building typologies.
It is important to note that with modern technology, CRP’s need not be white. There are many CRP
products which use darker-coloured pigments that have increased reflectivity in the near infrared
(non-visible) portion of the solar spectrum. With these technologies there are roofs that come in a
wide variety of colours and still maintain a high solar reflectance. It is generally accepted however that
a darker roof will never be as reflective as a light coloured roof.
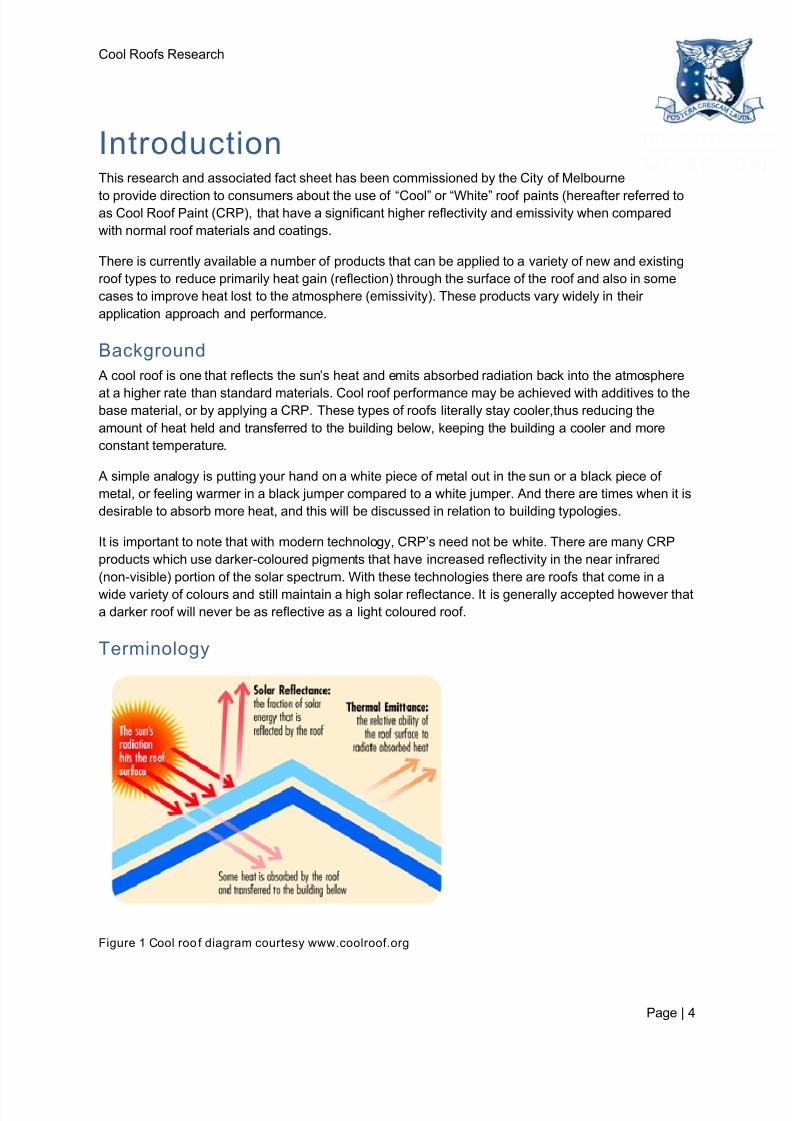
Terminology
Figure 1 Cool roo f diagram courtesy www.coolroof.org

7/29/2019 Cool Roofs Report
http://slidepdf.com/reader/full/cool-roofs-report 5/56
Cool Roofs Research
Page | 5
The two basic characteristics that determine the ‘coolness’ of a roof are solar reflectance
(SR) and thermal emittance (TE). Both properties are rated on a scale from 0 to 1, where
1 is the 100% reflection of solar radiation (most reflective) or 100% emission of heat (most
emissive).
Understanding the language of cool roof properties
Solar Reflectance:
Solar Reflectance is the ability of a material to reflect solar radiation (light, infrared and UV).
Typical Albedo Values: Fresh snow Earth Average Charcoal
0.9 0.3 0.04
Table 1: Understanding solar reflectance values
Thermal Emittance:
Thermal Emmittance is a measure of the ability of the material to both absorb and re-radiate heat into
the atmosphere.
Typical thermal
Emmittance Values:
Metal roof White Roof
0.8 0.21
Table 2: Understanding thermal emittance values
Solar Reflectance Index:
The characteristics of cool roof properties have been combined into one single value known as the
Solar Reflectance Index (SRI). The SRI value combines both the reflectivity value and emittance
value as a measure of a coating’s overall ability to reject solar heat. The calculation has a specific
calculation that must be followed.
It is defined such that a standard black (reflectance 0.05, emittance 0.90) is 0 and a standard white(reflectance 0.80, emittance 0.90) is 100.
The SRI method is not used in this study as it is expensive and more difficult to determine the effect of
the solar reflectance and thermal emittance individually for the products tested

7/29/2019 Cool Roofs Report
http://slidepdf.com/reader/full/cool-roofs-report 6/56
Cool Roofs Research
Page | 6
What are the benefits of a cool roof?
There are numerous benefits in having a cool roof:
Reducing your utility bills associated with air conditioning
Due to lower use lower maintenance requirements for the air conditioning system
Increasing occupant comfort and potential to avoid installing an air conditioner where not
already installed
Decreasing the size and prolonging the life of your air conditioning system
Lowering roof maintenance costs and extending roof life, avoiding reroofing costs and
reducing solid waste
Assist your building in meeting building codes – Section J
Mitigating your community's Urban Heat Island Effect
Maintaining aesthetics with a roof that performs and looks good
Increase ecological sustainability factor, or make your building “greener”
A cool roof can significantly reduce your cooling energy costs and increase your comfort level by
reducing temperature fluctuations inside your home. There are times where a cool roof is undesirable
– such as a domestic dwelling that requires predominately heating. This type of building may have an
increased heating need with the use of a CRP.
Figure 2: Image courtesy www.coolroofcommercial.com
7/29/2019 Cool Roofs Report
http://slidepdf.com/reader/full/cool-roofs-report 7/56
Cool Roofs Research
Page | 7
Literature review As interest in climate change and the urban heat island effect grows, so too does the
interest in the use of both vegetation and “cool” building materials to reduce the impact of both climateissues. As there is extensive research completed on the topics of both Urban Heat Island and Cool
Roof products, this literature review is separated for ease of understanding.
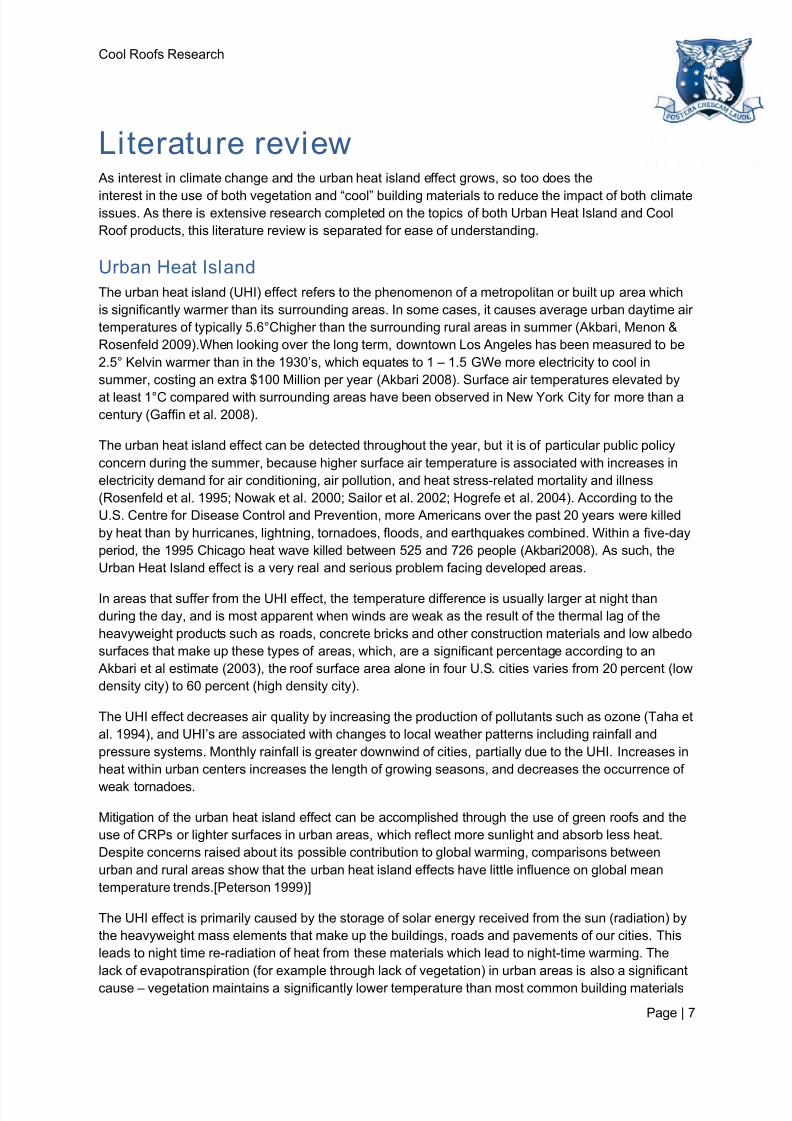
Urban Heat Island
The urban heat island (UHI) effect refers to the phenomenon of a metropolitan or built up area which
is significantly warmer than its surrounding areas. In some cases, it causes average urban daytime air
temperatures of typically 5.6°Chigher than the surrounding rural areas in summer (Akbari, Menon &
Rosenfeld 2009).When looking over the long term, downtown Los Angeles has been measured to be
2.5° Kelvin warmer than in the 1930’s, which equates to 1 – 1.5 GWe more electricity to cool in
summer, costing an extra $100 Million per year (Akbari 2008). Surface air temperatures elevated by
at least 1°C compared with surrounding areas have been observed in New York City for more than acentury (Gaffin et al. 2008).
The urban heat island effect can be detected throughout the year, but it is of particular public policy
concern during the summer, because higher surface air temperature is associated with increases in
electricity demand for air conditioning, air pollution, and heat stress-related mortality and illness
(Rosenfeld et al. 1995; Nowak et al. 2000; Sailor et al. 2002; Hogrefe et al. 2004). According to the
U.S. Centre for Disease Control and Prevention, more Americans over the past 20 years were killed
by heat than by hurricanes, lightning, tornadoes, floods, and earthquakes combined. Within a five-day
period, the 1995 Chicago heat wave killed between 525 and 726 people (Akbari2008). As such, the
Urban Heat Island effect is a very real and serious problem facing developed areas.
In areas that suffer from the UHI effect, the temperature difference is usually larger at night than
during the day, and is most apparent when winds are weak as the result of the thermal lag of the
heavyweight products such as roads, concrete bricks and other construction materials and low albedo
surfaces that make up these types of areas, which, are a significant percentage according to an
Akbari et al estimate (2003), the roof surface area alone in four U.S. cities varies from 20 percent (low
density city) to 60 percent (high density city).
The UHI effect decreases air quality by increasing the production of pollutants such as ozone (Taha et
al. 1994), and UHI’s are associated with changes to local weather patterns including rainfall and
pressure systems. Monthly rainfall is greater downwind of cities, partially due to the UHI. Increases in
heat within urban centers increases the length of growing seasons, and decreases the occurrence of
weak tornadoes.
Mitigation of the urban heat island effect can be accomplished through the use of green roofs and the
use of CRPs or lighter surfaces in urban areas, which reflect more sunlight and absorb less heat.
Despite concerns raised about its possible contribution to global warming, comparisons between
urban and rural areas show that the urban heat island effects have little influence on global mean
temperature trends.[Peterson 1999)]
The UHI effect is primarily caused by the storage of solar energy received from the sun (radiation) by
the heavyweight mass elements that make up the buildings, roads and pavements of our cities. This
leads to night time re-radiation of heat from these materials which lead to night-time warming. The
lack of evapotranspiration (for example through lack of vegetation) in urban areas is also a significant
cause – vegetation maintains a significantly lower temperature than most common building materials
7/29/2019 Cool Roofs Report
http://slidepdf.com/reader/full/cool-roofs-report 8/56
Cool Roofs Research
Page | 8
when exposed to the sunshine. Mitigation of the UHI effect can also be improved by the
use of cool materials that are characterized by high solar reflectance and infrared
emittance values (Synnefa et al 2008).The properties of surface materials commonly used
in urban areas for pavement and roofs, such as concrete and asphalt, have significantly different
thermal properties (including heat capacity and thermal conductivity) and surface radiative properties(albedo and emissivity) than both the cool materials and also the surrounding rural areas. This causes
a change in the energy balance of the urban area, often leading to higher temperatures than
surrounding rural areas.[Oke, 1982]
In terms of a solution, increased vegetation, higher albedo surfaces and higher albedo pavements
are cited as the main opportunities, Rosenzweig et al (2009) found that that the influence of
vegetation on urban climate is more important than the influence of the albedo of built surfaces, and
that although planting street trees citywide has only half the impact of high-albedo surfaces, it involves
planting trees in 7% of the city's area, as compared to raising the albedo of 48% of the city's surfaces.
It must be acknowledged that vegetation cannot be used in every situation and high albedo coatings
will have a significant impact in reducing the UHI effect when used appropriately.
Local thermal effects – micro heat islands
During a typical sunny day, there is approximately 1 kW/m2
of solar radiation on a roofs surface, and
between 20 percent and 95 percent of this radiation is absorbed based on the different roof colours
(Suehrcke, Peterson & Selby 2008). This massive heat load affects the microclimate around a
building or in cities, and is heavily influenced by the incident solar radiation on the building envelope
as well as the level of vegetation in the area. The thermal or long wave radiation reradiated from
building surfaces affects air temperature, relative humidity and wind speed (Prado and Ferraira,
2004).
Cool roof studies and measurementsThere have been several studies using both field measurement and computer simulations that
document the energy savings from increasing the solar reflectance properties of buildings, combined
with an increased thermal emittance. It is now widely accepted that the higher reflectivity a roof colour
is, the lower solar energy is absorbed and the lower surface temperature will be (Kiehl & Trenberth
2010).
Akbari and Konopacki (2005) have calculated the cooling energy savings due to the application of
heat island mitigation strategies (application of cool materials and increase in vegetation cover) for
240 regions in the United States. It was found that for residential buildings the cooling energy savings
vary between 12% and 25%, for office buildings between 5% and 18%, and for commercial (retail
stores) buildings between 7% and 17%.
In a 2001 study by Konopacki and Akbari, the Lawrence Berkeley National Laboratory (LBNL)
measured and calculated the reduction in peak energy demand associated with a cool roof’s surface
reflectivity. They found that, compared to the original black rubber roofing membrane on the Texas
retail building studied, a retrofitted vinyl membrane delivered an average decrease of 24 °C in surface
temperature, an 11 percent decrease in aggregate air conditioning energy consumption, and a
corresponding 14 percent drop in peak hour demand. The average daily summertime temperature of
the black roof surface was 75 °C, but once retrofitted with a white reflective surface, it measured 52
°C. Without considering any tax benefits or other utility charges, annual energy expenditures were
reduced by $7,200 or $0.07/sq. ft.

7/29/2019 Cool Roofs Report
http://slidepdf.com/reader/full/cool-roofs-report 9/56
Cool Roofs Research
Page | 9
Other relevant field studies in California and Florida have demonstrated direct cooling-
energy savings in excess of 20% upon raising the solar reflectance of a roof to 0.6 from a
prior value of 0.1-0.2. Energy savings are particularly pronounced in older houses that
have little or no attic insulation, especially if the attic contains air distribution ducts for ducted heating
and cooling. Akbari et al. observed cooling energy savings of 46% and peak power savings of 20%)achieved by increasing the roof reflectance of two identical portable classrooms in Sacramento,
California. Konopacki et al documented measured energy savings of 12-18% in two commercial
buildings in California. In a large retail store in Austin, Texas, Konopacki and Akbari documented
measured energy savings of 12%. (Akbari 2008)

7/29/2019 Cool Roofs Report
http://slidepdf.com/reader/full/cool-roofs-report 10/56
Cool Roofs Research
Page | 10
Product DescriptionThe products used in the study included:
Thermoshield
SkyCool*
Staycool
Dulux Infracool^.
*Skycool was not used in the computer modeling
^Dulux Infracool was not used in the field tests
Other products not studied included:
Thermilate Colorbond Coolmax
Coolpaints.com.au
Nutech
Solacoat
solar-cool
Heat reflective paint.
The following information is a summary of the information provided by the relevant manufacturer
(website).
Thermoshield (from website) Thermoshield is a NASA-inspired, water-based emulsion of high grade acrylic resins, that contains
millions of hollow ceramic particles. The dead air space provided by these particles creates a high
thermally reflective shield, resulting in up to 75% of incoming heat being reflected directly back,
thereby reducing internal building temperatures by up to 45%. Additionally, Thermoshield has an
ultraviolet resistance of 96%, a solar reflectance of over 80%, and an emissivity of 90%, making it
almost as effective as a mirror.
The application of Thermoshield is very much like that of paint. The surface should be cleaned and
generally prepared, and then two coats of Thermoshield are sprayed on. Once applied the coating
chemically converts any iron oxide (rust) present into iron sulphate, thereby preventing continued
corrosion. It will also seal and waterproof the roof. The heat barrier formed will also eliminate up to80% of destructive thermal shock i.e. the movement of various roofing materials against each other,
which is a major cause of roof degradation and water leakage.
The colours available include all the universal tints, but must be restricted to the first shade of pastel
on any colour chart.

7/29/2019 Cool Roofs Report
http://slidepdf.com/reader/full/cool-roofs-report 11/56
Cool Roofs Research
Page | 11
Figure 3: Thermosheild
Keeping buildings and people comfortable – a typical use of Thermoshield
Figure 4: Thermosheild
And keeping canines comfortable - one of the more unusual uses of Thermoshield
SkyCool (from website)
SkyCool is a specialized thermal coating that is applied to the exterior of metal roofs, which is
designed to combat heat build-up in industrial and commercial buildings. It does this firstly by
preventing excess heat from the sun from entering the building, and secondly, by increasing the
emittance of some of the internal heat. Observations have confirmed constant internal sub-roof
temperature decreases of 20 to 40°C, resulting in work areas being around 14°C below ambient in the
peak of summer, and energy savings averaging around 40-50% for large commercial buildings.
The application of SkyCool will result in a number of important benefits that include:
Large drop in internal temperature, like that experienced by a shopping complex in
Melbourne.
Substantial and very cost-effective reduction in air conditioning power consumption.
Greater efficiency & life from existing air conditioning plant through reduced peak loads.
Significant contribution to the environment through large reductions in greenhouse gas
generation resulting from the power saved.

7/29/2019 Cool Roofs Report
http://slidepdf.com/reader/full/cool-roofs-report 12/56
Cool Roofs Research
Page | 12
A more productive work environment without the expense of air conditioning.
Increased value in the building whether it is conditioned or not.
In turn, the roof is protected from:
thermal shock due to varying sun load
corrosion from atmospheric contaminants
precipitation – as a weather sealant.
The product is environmentally safe and convenient to apply so there is no interruption to business
within the building
SkyCool has so far been used for a wide variety industrial and commercial applications, includingairports, banks, schools, shopping centres, supermarkets and warehouse, to name a few.
Figure 5: Skycool
Application of SkyCool to Melbourne Airport has resulted in energy savings of 30-40%, and an
estimated reduction of 40,000 tonnes of greenhouse gases.
EPA Staycool
EPA Staycool does not have a lot of marketing for this product, as it is an additive in the roof
protective membrane coatings. The performance data that we have been given suggests it is most
similar to other products in the study in terms of outright performance, however it must be noted that
the products are very different and are likely to perform differently as a result.
Dulux Infracool (from website)
The Dulux infracool product differs from the others in two ways: 1) it is partly aimed at the residential
market, and 2) because it is available in a range of colours

7/29/2019 Cool Roofs Report
http://slidepdf.com/reader/full/cool-roofs-report 13/56
Cool Roofs Research
Page | 13
InfraCool Heat Reflective Coatings (from website)
“We are committed to continually improving the environmental footprint and sustainability of
our products. InfraCOOL Technology reflects and emits both the visible or "coloured" light
and invisible Infrared light which accounts for over 50% of the sun's total light energy toprovide a much cooler building surface. A cooler surface means less heat penetration
resulting in cooler accupancy zones which lowers the use of energy- translating in cost
savings and reduced associated greenhouse gas emissions.”
For commercial properties, the product estimates that the surfaces can be 20-40°C cooler translating
into cooler occupancy zones, lowering cooling energy demand and thus delivery cost and energy
emission savings.
For residential properties (from website), “It doesn't have to be WHITE to be COOL - InfraCOOL
Technology maximises reflection of infra-red radiation, so even dark colours can be made cooler.
InfraCOOL Charcoal, for example can be up to 16ºC cooler than conventionally formulated Charcoal
without changing the visual colour.”
Colorbond CoolMax (from website)
The ColorBond product is not in the study but is an interesting product to compare because the cool technology
is applied during production
ColorBond CoolMax is from the Bluescope Steel range which is designed to reduce energy costs by
up to 7.5% compared with the some of the company’s other products. It delivers this performance
through having a comparatively high solar reflectance of 0.77 (a value of 0.0 indicates that a surface
absorbs all solar radiation, and a value of 1.0 represents all is reflected). Additionally, it is able tomaintain this by having an excellent resistance to dirt retention, with studies showing sites that retain
95%of their initial solar reflectance after a decade.
The Issue of R-values
It became apparent that most of the products interpreted the benefit of their products as having and
“equivalent” R-value. Because reflective paint coverings have only a very low “real” R-value benefit to
the properties of the roof on which they are painted (see below), this was identified as potentially
being very confusing to consumers.
CRP’s have a very low direct R-value but the marketing of the products make an “equivalent” r-value
by comparing the temperature reduction of a building that uses CRP to a building that does not useCRP but has an increased R-value.

7/29/2019 Cool Roofs Report
http://slidepdf.com/reader/full/cool-roofs-report 14/56
Cool Roofs Research
Page | 14
Figure 6: Australian Standards for surface coatings
7/29/2019 Cool Roofs Report
http://slidepdf.com/reader/full/cool-roofs-report 15/56
Cool Roofs Research
Page | 15
MethodologyThis study is based on two concurrent testing methodologies. The first is a full-scale
installation of three single room buildings (and one 1/3 scale building) at the University of Melbourne’sBurnley campus in Melbourne, Australia. Two of the full scale buildings and the 1/3 scale building are
painted with proprietary reflective white roof paint (CRP), and the third building is left unpainted as a
control.
The second method is a computer simulation of the physical experiment using the TRNSYS software
package. While these methods are run concurrently, precedents set by Akbrai et al. suggest that
simulated and measured data is not likely to be directly relative but rather implicit of trends and
indications (Akbari 1997).We will aim to compare and integrate the two methodologies in order to
establish an effective predictive model for future scenarios.
The site for this study located in Eastern metropolitan Melbourne with coordinates37°48′ 49″S,
144°57′ 47″E. The moderate oceanic climate results in significant residential heating and coolingloads throughout the year and is an ideal climate for passive design principles. Among the simplest of
these principles is roof surface albedo which has the potential to provide significant reductions in
cooling energy demand and peak loads through cooling months.
The test buildings are of a lightweight construction typical of Australian housing and insulation levels
are indicative of the 1991 minimum building standards (approx R1.0 walls and R0.82 ceilings), which
would have been in place at the time of construction. The un-insulated timber floors and the absence
of weather strips to doors resulted in an assumed infiltration rate of approximately 2air changes per
hour (ACH). The doors and windows were always closed with the exception of those times access
was required for installation and maintenance of equipment. Blinds were installed to North facing
windows in order to mitigate misleading sensor output affected by glare and direct solar gain.
Study limitations
This study is limited in scope as follows:
The study does not accurately cover a complete summer period due to timing of the
monitoring, additionally, the study was conducted in a year that was cooler than average with
less sunshine hours.
The study monitored small buildings – this in some cases limits the ability to upscale the
results due to the differences in roof to wall area ratios.
The study only tests 3 products in the field with one additional product in the computer
modelling. Other products and brands are therefore not accounted for in the results. Computer modelling is inherently limited to specific assumptions about internal gains,
occupancy profiles and other variables that were required to be fixed as static.
The results of this study do not easily translate to likely performance or energy savings for
other, more specialised types of buildings, such as educational, airports, retail etc.

7/29/2019 Cool Roofs Report
http://slidepdf.com/reader/full/cool-roofs-report 16/56
Cool Roofs Research
Page | 16
Methodology – Site Measurements
The field study of the products was conducted at the Melbourne University Burnley
Horticultural campus where 3 “full-size” (10.43m2) sheds, (1 control and 2 white roof sheds
- Staycool and Skycool) were monitored along with a scale model building (approx 1m2
) using theThermoshield product.
Data will be collected at Burnley on three of the paints including, heat transfer into the roof and room,
ambient temperature (dry bulb and wet bulb) thermal comfort – humidity, radiant temperature and air
movement and radiation from the roof – horizontal and vertical.
.

7/29/2019 Cool Roofs Report
http://slidepdf.com/reader/full/cool-roofs-report 17/56
Cool Roofs Research
Page | 17
Figure 7: Building and Site plan for field tests
Field Data Logging
The data collected in this field test is extensive and extends beyond that which is specifically required
to quantify the effects of the CRP’s. It provided a valuable opportunity to collect thorough surfaceproperty and environmental data over an extended period of time from which future research could
draw upon. This additional data was useful in verifying results and identifying anomalies in data or
building performance.
Two means of data collection were used in this field test; a DataTaker DT85 data logger with two
CEM20 expansion modules, and a Hobo weather station. The bulk of the data was recorded using the
DT85 data logger, which was logging continuously at 20-second intervals. The data logger was
located in the control building (building B) for part of the field test but was relocated to a near by
building in order to eliminate the need for regular access to building B which would influence results.
The primary data collection was of the indoor and outdoor temperatures, roof surface temperatures
and reflection both in the horizontal and vertical planes. Additional data was logged including the solar radiation received.
Once the data logging was set in place there were no changes to the test buildings or the logging
equipment for the duration of the study
This data was then used to verify the computer model which was used to extend the results to
commercial and industrial buildings with different heating and cooling requirements. Sensitivity
analysis was done around benefits dependent on roof paint colour, levels of insulation, percentage
shading and pitch, the table below summarises the options.
Option Sensitivity range Factor
Roof paint colour based on available products Total energy use based on
7/29/2019 Cool Roofs Report
http://slidepdf.com/reader/full/cool-roofs-report 18/56
Cool Roofs Research
Page | 18
Roof paint colour based on available products Total energy use based on
properties
Insulation levels R1.5/R2.5/R3.5/R4/R4.5/R5 Heat transfer through the roof
Percentage of shading 0%-20%-50%-70%-100% Percentage shaded
Pitch 5%, 20% Percentage of incident
Table4: Modeling parameters
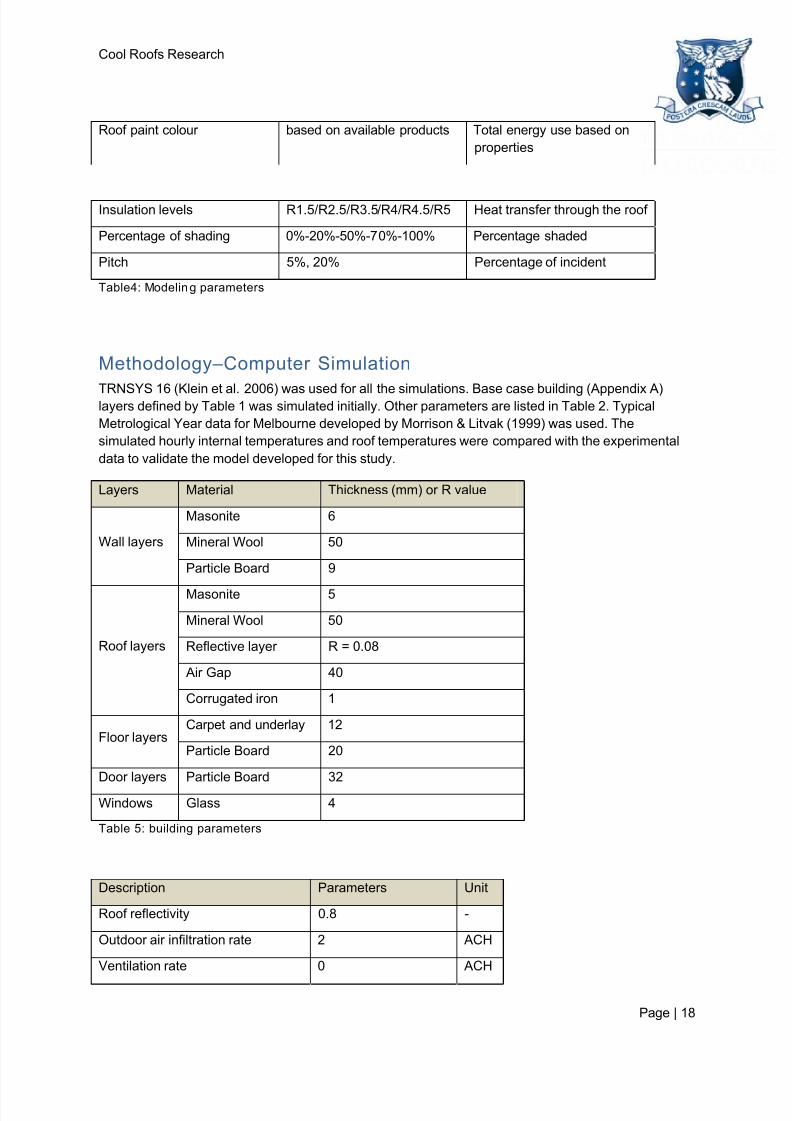
Methodology–Computer Simulation
TRNSYS 16 (Klein et al. 2006) was used for all the simulations. Base case building (Appendix A)layers defined by Table 1 was simulated initially. Other parameters are listed in Table 2. Typical
Metrological Year data for Melbourne developed by Morrison & Litvak (1999) was used. The
simulated hourly internal temperatures and roof temperatures were compared with the experimental
data to validate the model developed for this study.
Layers Material Thickness (mm) or R value
Masonite 6
Mineral Wool 50Wall layers
Particle Board 9
Masonite 5
Mineral Wool 50
Reflective layer R = 0.08
Air Gap 40
Roof layers
Corrugated iron 1
Carpet and underlay 12Floor layers
Particle Board 20
Door layers Particle Board 32
Windows Glass 4
Table 5: building parameters
Description Parameters Unit
Roof reflectivity 0.8 -
Outdoor air infiltration rate 2 ACH
Ventilation rate 0 ACH

7/29/2019 Cool Roofs Report
http://slidepdf.com/reader/full/cool-roofs-report 19/56
Cool Roofs Research
Page | 19
Internal load 0 W
Thermostat setting for cooling 24 C
Thermostat setting for heating 21 C
Night setback for heating 18 (11 pm – 6 am) C
Beginning of heating season 3240 (16 May) hr
End of heating season 6192 (15 September) hr
Beginning of cooling season 8016 (1 December) hr
End of cooling season 1416 (28 February) hr
Table 6: Settings
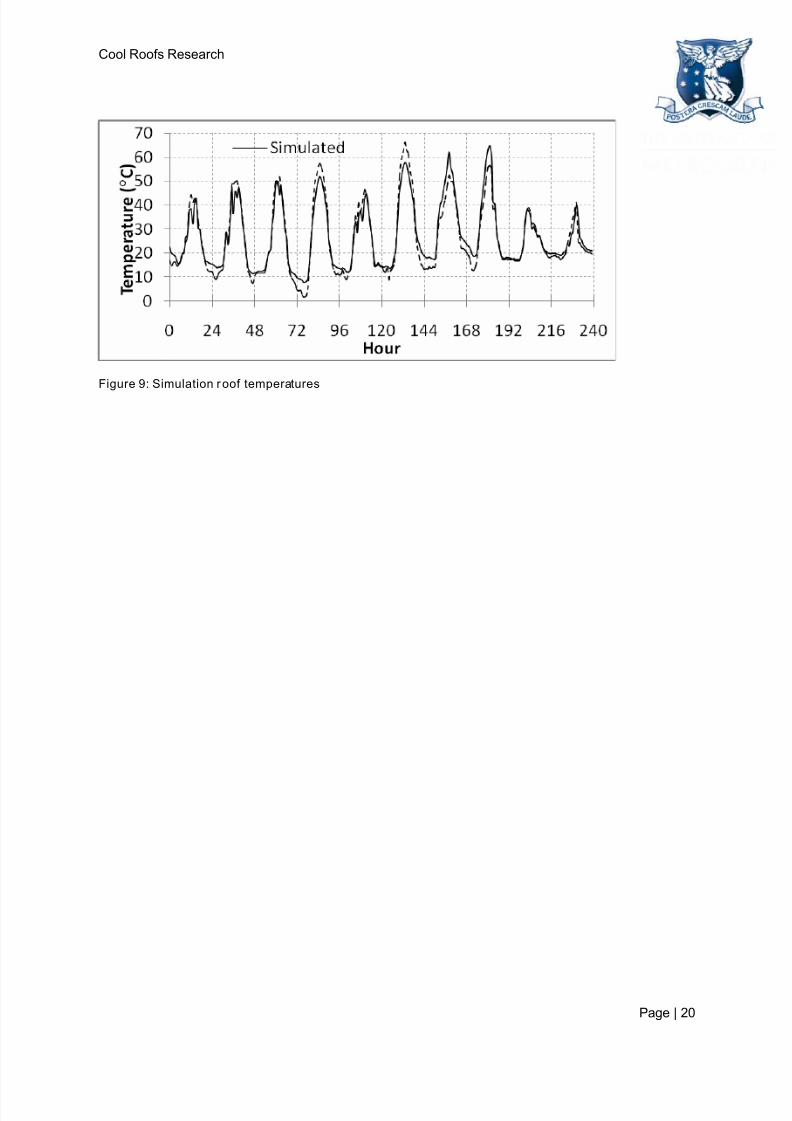
Figures8 and 9 show the graphical caparisons and Figures10 and 11show the correlation for the 1-10
January 2011. The relationship between measured and simulated values was tested by Root MeanSquare Error (RMSE), Mean Bias Error (MBE) and Correlation Coefficient (CC) (see Appendix B).
Table 3 shows the statistical parameters. The correlation coefficients found for internal and roof
temperatures are 0.985 and 0.970. The model developedfor the simulation is found to be acceptable
for the study
Figure 8: simulation internal temperatures
7/29/2019 Cool Roofs Report
http://slidepdf.com/reader/full/cool-roofs-report 20/56
Cool Roofs Research
Page | 20
Figure 9: Simulation roof temperatures

7/29/2019 Cool Roofs Report
http://slidepdf.com/reader/full/cool-roofs-report 21/56
Cool Roofs Research
Page | 21
0
5
10
15
20
25
30
35
40
0 5 10 15 20 25 30 35 40
S i m u l a t e d ( C )
Measured (C)
Figure 10: Measured vs simulated internal temperatures
0
10
20
30
40
50
60
70
0 10 20 30 40 50 60
S i m u l a t e d ( C )
Measured (C)
70
Figure 11: Measured vs simulated roof temperatures

7/29/2019 Cool Roofs Report
http://slidepdf.com/reader/full/cool-roofs-report 22/56
Cool Roofs Research
Page | 22
Internal temperature Roof temperature
Root Mean Square Error (RMSE) 1.082 (C) 3.705 (C)
Mean Bias Error (MBE) – 0.553 (C) 0.755 (C)
Correlation Coefficient (CC) 0.985 0.970
Table 7: Statist ical parameters
By using the validated TRNSYS model the following were investigated:
Effect of roof paint reflectivity on cooling and heating load
Effect of roof paint with highest reflectivity on various insulation levels
Effect of roof paint with highest reflectivity on various shading levels Effect of roof paint with highest reflectivity on various roof pitches

7/29/2019 Cool Roofs Report
http://slidepdf.com/reader/full/cool-roofs-report 23/56
Cool Roofs Research
Page | 23
Field ResultsThe results of the onsite measurements conducted between December 2010 and July
2011 (ongoing) have been separated into a summer (January 1 – 14) and winter (April 23 – 8th
May,2
nd– 16
thJune for Reflection) data sets. These sets are the most suitable for analysis for a number of
reasons (e.g. the control building is air-conditioned making comparisons difficult, sensors being added
or changed during the study) and allow a closer look at the performance of the tested products.
Indoor Temperatures
The summer indoor temperature profiles suggest that the CRP product test buildings maintain a 2 or 3
degree lower internal temperature compared with the control building at the warmest part of the day.
This visible difference is most obvious during the warmest parts of the day, however a similar effect
can be seen overnight also. The main source of difference seen in the indoor temperatures of these
test buildings would be the solar radiation.
Figure 12: Summer Indoor Temperature (11 days)
7/29/2019 Cool Roofs Report
http://slidepdf.com/reader/full/cool-roofs-report 24/56
Cool Roofs Research
Page | 24
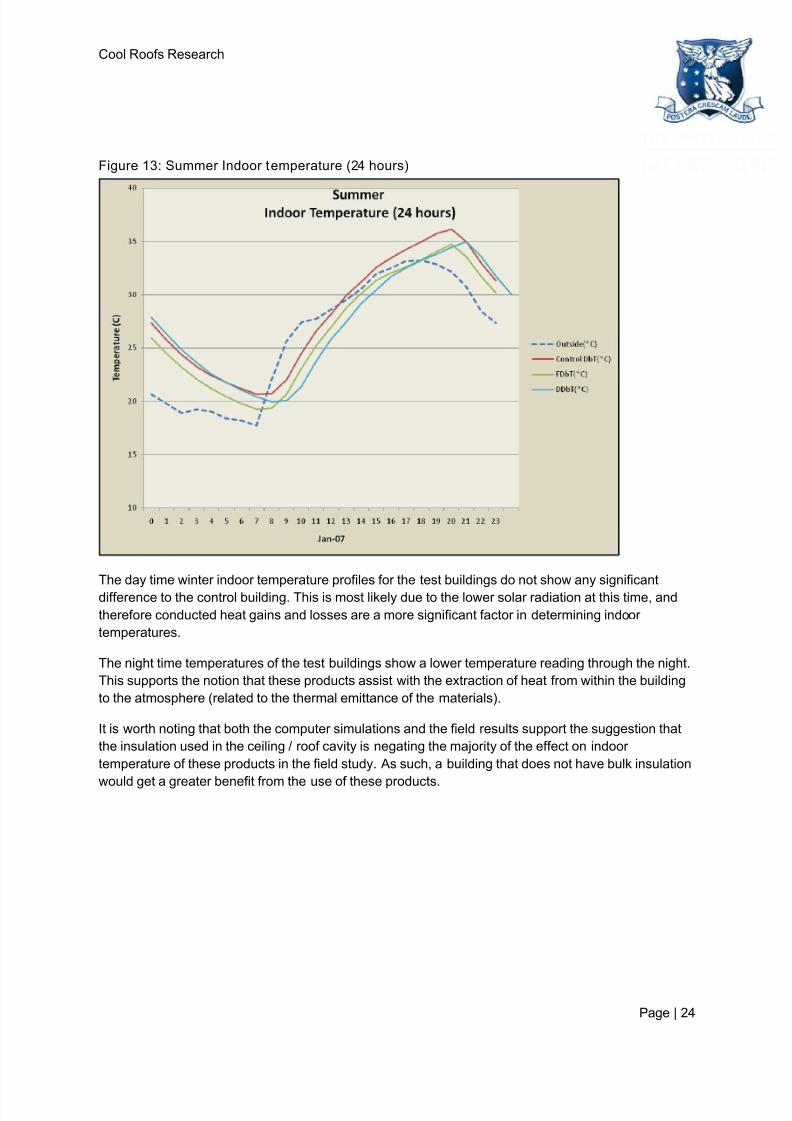
Figure 13: Summer Indoor temperature (24 hours)
The day time winter indoor temperature profiles for the test buildings do not show any significant
difference to the control building. This is most likely due to the lower solar radiation at this time, and
therefore conducted heat gains and losses are a more significant factor in determining indoor
temperatures.
The night time temperatures of the test buildings show a lower temperature reading through the night.
This supports the notion that these products assist with the extraction of heat from within the building
to the atmosphere (related to the thermal emittance of the materials).
It is worth noting that both the computer simulations and the field results support the suggestion that
the insulation used in the ceiling / roof cavity is negating the majority of the effect on indoor
temperature of these products in the field study. As such, a building that does not have bulk insulation
would get a greater benefit from the use of these products.

7/29/2019 Cool Roofs Report
http://slidepdf.com/reader/full/cool-roofs-report 25/56
Cool Roofs Research
Page | 25
Figure 14: Winter indoor Temperature (14 Days)
Figure 15: Winter Indoor Temperatures (24 hours)
It is clear that the products are reducing both daytime (summer) and night-time (winter) temperatures.

7/29/2019 Cool Roofs Report
http://slidepdf.com/reader/full/cool-roofs-report 26/56
Cool Roofs Research
Page | 26
Roof Surface Temperatures (external)
The roof temperatures results refer to the outside temperature of the roof surface. The
results show that CRP’s significantly reduce the surface temperature and make the
difference between being too hot to touch and being warm to touch.
Figure 16: Summer Roof Temperatures (14 days)
Figure 17: Summer Roof Temperature (24 hours )

7/29/2019 Cool Roofs Report
http://slidepdf.com/reader/full/cool-roofs-report 27/56
Cool Roofs Research
Page | 27
The summer roof temperature profile shows a clear difference of up to approximately 30
degrees. As can be seen on the 6th
January the control roof (zincalume) reaches 68 C
whilst the coolest roof is 35 C – this supports the suggestion that a “normal” roof is too
hot to touch whilst the CRP roofs are consistent below 40 C.
Figure 18: Winter Roof Temperature (14 Days)
Figure 19: Winter Roof Temperature (24 Hours)
The winter roof temperature results demonstrate a similar temperature reduction which suggests that
although the roof surface temperatures are lower in general, the CRP roofs still provide a temperature
7/29/2019 Cool Roofs Report
http://slidepdf.com/reader/full/cool-roofs-report 28/56
Cool Roofs Research
Page | 28
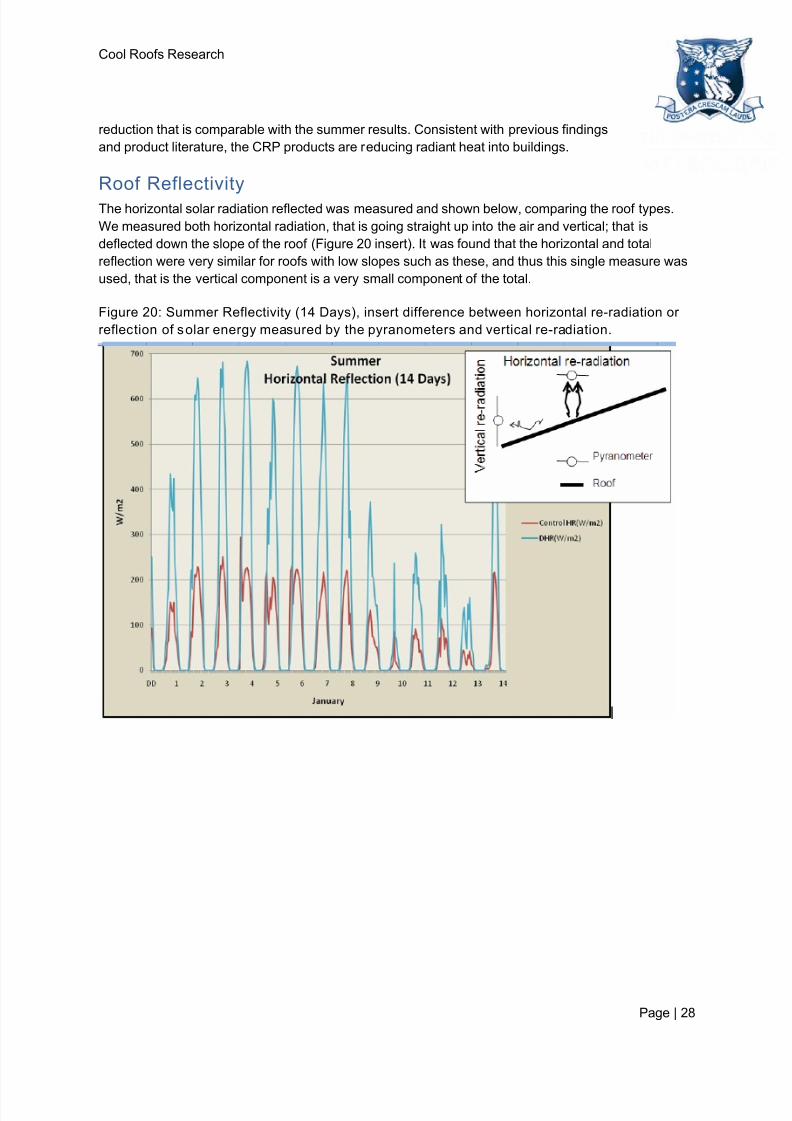
reduction that is comparable with the summer results. Consistent with previous findings
and product literature, the CRP products are reducing radiant heat into buildings.
Roof Reflectivity
The horizontal solar radiation reflected was measured and shown below, comparing the roof types.
We measured both horizontal radiation, that is going straight up into the air and vertical; that is
deflected down the slope of the roof (Figure 20 insert). It was found that the horizontal and total
reflection were very similar for roofs with low slopes such as these, and thus this single measure was
used, that is the vertical component is a very small component of the total.
Figure 20: Summer Reflectivity (14 Days), insert difference between horizontal re-radiation or
reflection of solar energy measured by the pyranometers and vertical re-radiation.
7/29/2019 Cool Roofs Report
http://slidepdf.com/reader/full/cool-roofs-report 29/56
Cool Roofs Research
Page | 29
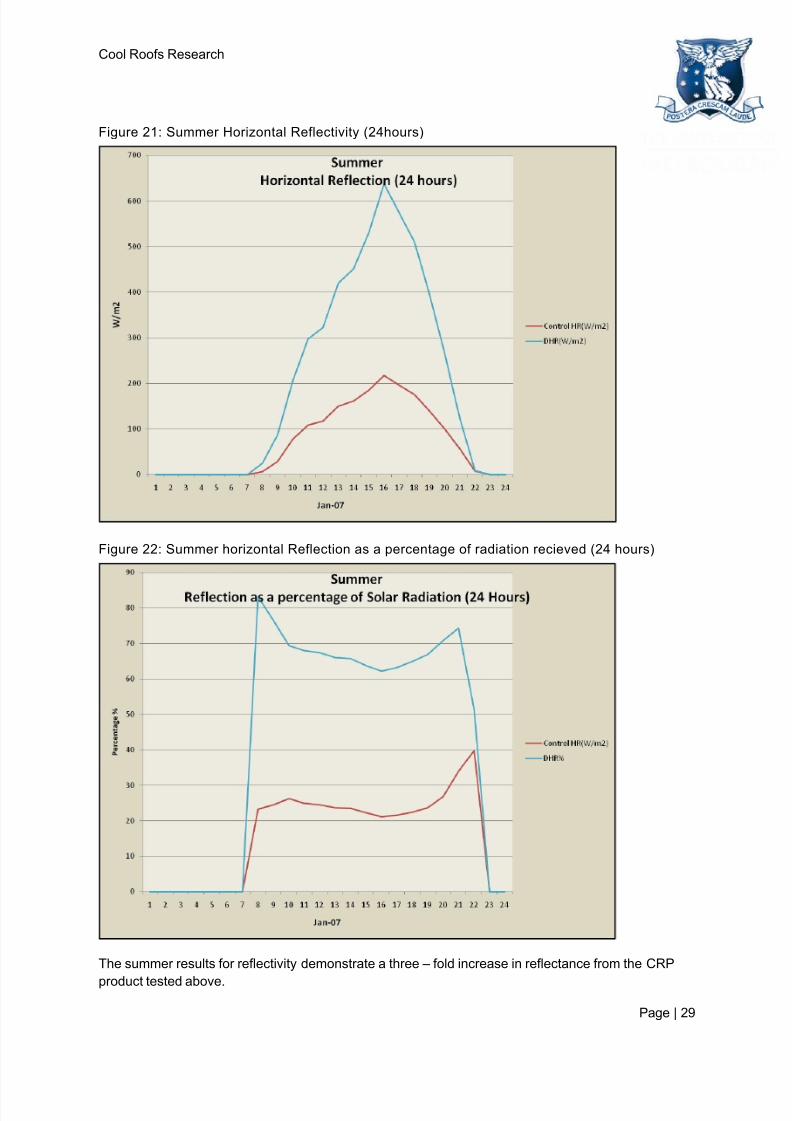
Figure 21: Summer Horizontal Reflectivity (24hours)
Figure 22: Summer horizontal Reflection as a percentage of radiation recieved (24 hours)
The summer results for reflectivity demonstrate a three – fold increase in reflectance from the CRP
product tested above.

7/29/2019 Cool Roofs Report
http://slidepdf.com/reader/full/cool-roofs-report 30/56
Cool Roofs Research
Page | 30
Figure 23: Winter Horizontal Reflecti on (14 Days)
Figure 24: Winter Horizontal Reflection (24 hours)
Figure 25: Winter reflection as a percentage (24 hours)

7/29/2019 Cool Roofs Report
http://slidepdf.com/reader/full/cool-roofs-report 31/56
Cool Roofs Research
Page | 31
The control building is unfortunately absent from the winter results however it is possible to compare
the 3 CRP roofs. This outcome suggests that two products are similar in performance (and with
similar properties and specifications).
Product G, although very high performing, has properties that are designed for insulating andreflective benefits. As such in this study this product is about 10% less effective in reflecting heat than
the products designed purely for reflectance.
Field Results Summary
The field testing demonstrates a clear benefit of the CRP products in reducing indoor temperatures,
reducing roof surface temperatures and increasing the reflection of heat and light. The reduction of
indoor temperatures is heavily influenced by the amount of insulation in the ceiling – this was not
demonstrated however it is consistent with the simulation findings (see below)
Simulation Results
Field Test Buildings – modelling for total energy use
The results of the simulation show that for all white roof paints there is a benefit annually of between
0.88 and 1.53 MJ/m2. So for an average 200m
2home this would be equal to between 176-306 MJ per
year. This represents only a small improvement for this type of building (total energy use in this
example being 7,300MJ, this represents a 4.2% benefit).The predominant reason is the effectiveness
of the insulation, see the sensitivity study carried out below.

7/29/2019 Cool Roofs Report
http://slidepdf.com/reader/full/cool-roofs-report 32/56
Cool Roofs Research
Page | 32
DI-white 0.21 -9.91 11.43 1.52
Product G 0.21 -9.91 11.43 1.52DI-cream 0.34 -8.22 9.05 0.83
Product D 0.4 -7.03 7.91 0.88
DI-Terracotta 0.62 -3.24 3.65 0.41
DI-charcoal 0.76 -0.71 0.84 0.13
Base case 0.8 0.00 0.00 0.00
Product F 0.25 -9.19 10.72 1.53
Total energy (MJ/m2)Type of roof paint Absorptance Heating energy (MJ/m
2) Cooling e ne rgy (M J/m
2)
Savings in energy
Table 8: Energy Savings
Field Test Buildings – modelling for variation to R-value
From the simulation using the field test buildings it shows that an increase in R-values reduces the
benefit of the paint on heating and cooling energy. When there is no insulation, then there is a benefit
in using the CRP’s(for an average 200m2 house this would be 800MJ, but given BCA standard for
insulation added under deemed to satisfy of R2.5, the benefit is 0). This means that from an energy
saving perspective the CRP’s will impact existing housing with lower or zero insulation, but will not
benefit new housing with standard insulation levels. It is worth noting that there will be an impact on
the urban heat island effect due to lower heat build up.
R value Heating Cooling Total
Base case (R=0.82) -9.9 11.4 1.5
0.0 -13.8 18.0 4.2
1.5 -7.7 8.5 0.8
2.5 -6.2 6.1 -0.1
3.5 -4.0 4.7 0.7
5.0 -4.1 3.3 -0.8
Savings in energy MJ/m2)
Table 9: Insulation energy savings
The table above shows that the modelling assumption is based around a Ceiling R-value of R2.5 –
hence the R2.5 saving is zero (0)
Field Test Buildings – modelling for variation to roof pitch
From the simulation using the field test buildings, with an increase in roof pitch with a fixed R-value of
2.5,there is no benefit from the application of CRP on total energy use. This is due to the
effectiveness of the insulation, as discussed above.

7/29/2019 Cool Roofs Report
http://slidepdf.com/reader/full/cool-roofs-report 33/56
Cool Roofs Research
Page | 33
Roof pitch Heating Cooling Total
0.0 -6.2 6.1 -0.1
4.8 -6.2 6.1 -0.1
20.0 -6.5 6.4 -0.1
50.0 -8.7 8.7 0.0
Savings in energy MJ/m2
Table 10: Roof pitch energy savings
Yet when comparing the heating and cooling energy requirements, it is clear that increased roof pitch
leads to a higher heating energy, irrespective of the paint on the roof.
Figure 26: Heating energy wi th roo f pit ch
For cooling energy, the steeper the roof slope the greater the benefit of the CRP. This therefore
concludes from this simulation that it makes sense to paint sloped roofs if artificial cooling is used.

7/29/2019 Cool Roofs Report
http://slidepdf.com/reader/full/cool-roofs-report 34/56
Cool Roofs Research
Page | 34
Figure 27: Cooling energy with roof pitch
However, given the assumptions of the model, and that cooling is such a small percentage (~10%) of
the total energy use for residential projects– roof slope is not a significant factor in deciding to paint an
insulated residential roof with CRP.
Again these results do not discuss the urban heat island effect only the internal temperature factors.
For the urban heat island effect there would be less build up in the city and therefore less cooling
required.
Field Test Bui ldings – modelling for variation to shading of the roof
surface
From the simulation using the field test buildings, it shows that an increase in shading of the roof with
a fixed R-value of 2.5 there is no net benefit from the application of CRP. This isbe because of the
effectiveness of the insulation, the initial sensitivity test for this is shown above.
Shading % Heating Cooling Total
0.0 -6.2 6.1 -0.1
20.0 -4.9 4.8 -0.1
50.0 -3.2 3.0 -0.2
70.0 -2.0 1.8 -0.2
Savings in energy MJ/m2
Table 11: Energy savings with shading
In Winter, more shading requires more heating and this reduces the benefit from the paint.
7/29/2019 Cool Roofs Report
http://slidepdf.com/reader/full/cool-roofs-report 35/56
Cool Roofs Research
Page | 35
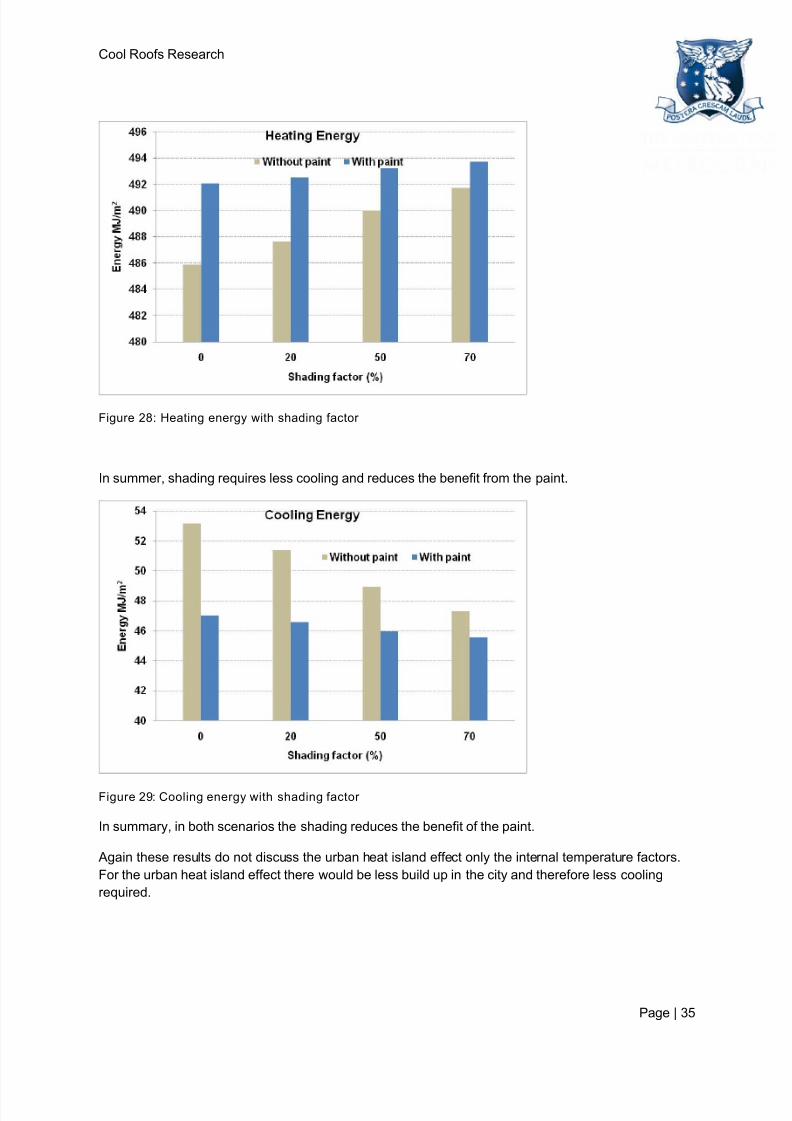
Figure 28: Heating energy with shading factor
In summer, shading requires less cooling and reduces the benefit from the paint.
Figure 29: Cooling energy with shading factor
In summary, in both scenarios the shading reduces the benefit of the paint.
Again these results do not discuss the urban heat island effect only the internal temperature factors.
For the urban heat island effect there would be less build up in the city and therefore less cooling
required.
7/29/2019 Cool Roofs Report
http://slidepdf.com/reader/full/cool-roofs-report 36/56
Cool Roofs Research
Page | 36
Sample Building Modeling – residential variation of
insulation location in roof space
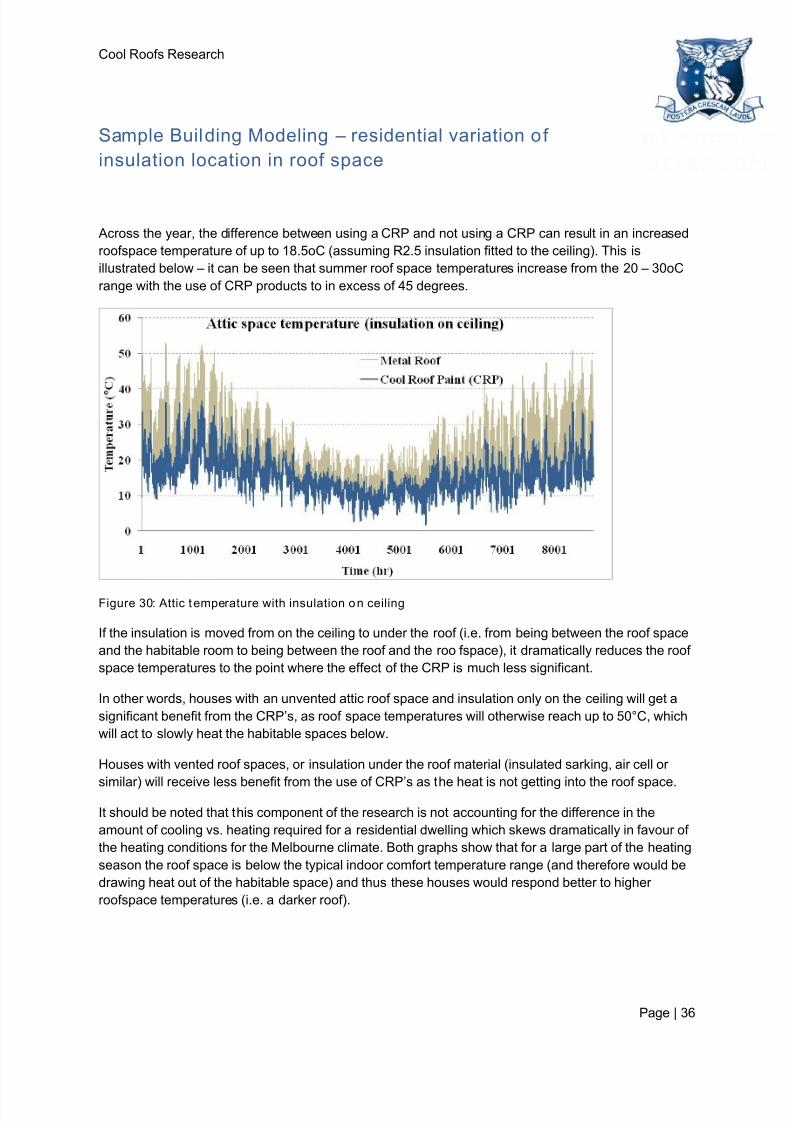
Across the year, the difference between using a CRP and not using a CRP can result in an increased
roofspace temperature of up to 18.5oC (assuming R2.5 insulation fitted to the ceiling). This is
illustrated below – it can be seen that summer roof space temperatures increase from the 20 – 30oC
range with the use of CRP products to in excess of 45 degrees.
Figure 30: Attic temperature with insulation on ceiling
If the insulation is moved from on the ceiling to under the roof (i.e. from being between the roof space
and the habitable room to being between the roof and the roo fspace), it dramatically reduces the roof
space temperatures to the point where the effect of the CRP is much less significant.
In other words, houses with an unvented attic roof space and insulation only on the ceiling will get a
significant benefit from the CRP’s, as roof space temperatures will otherwise reach up to 50°C, which
will act to slowly heat the habitable spaces below.
Houses with vented roof spaces, or insulation under the roof material (insulated sarking, air cell or
similar) will receive less benefit from the use of CRP’s as the heat is not getting into the roof space.
It should be noted that this component of the research is not accounting for the difference in the
amount of cooling vs. heating required for a residential dwelling which skews dramatically in favour of
the heating conditions for the Melbourne climate. Both graphs show that for a large part of the heating
season the roof space is below the typical indoor comfort temperature range (and therefore would be
drawing heat out of the habitable space) and thus these houses would respond better to higher
roofspace temperatures (i.e. a darker roof).

7/29/2019 Cool Roofs Report
http://slidepdf.com/reader/full/cool-roofs-report 37/56
Cool Roofs Research
Page | 37
Figure 31: Attic temperature with insulation under roof
The above results demonstrate that the CRPs are effective in reducing summer heat build up in
buildings with attic roof spaces. This is an excellent outcome for both air-conditioning energy use as
well as a reduced contribution to the Urban Heat Island effect.
Sample Bui lding Simulation – Commercial and Residential Heating
and Cooling Energy
To investigate the impact of the CRP products on different building types, a commercial, residential
and industrial building were modelled. This approach was designed to continue the study beyond thefield test buildings to more “real world” examples (specifications of which can be found in the
appendices).
Why test different building typologies?
Commercial buildings have a day time occupancy profile, a much higher cooling load and unique
building dimensions (often tall with a low roof area). Residential buildings have predominantly night
time occupancy, a higher heating requirement, relatively high levels of insulation, and a total roof to
floor area that is greater than the commercial building. Finally, the industrial buildings tend to have
longer or 24 hour occupancy, are not conditioned, have large roofs compared to total floor area (i.e.
be one story with large footprints).
The residential buildings showed little benefit from the CRP’s, as shown by the simulation and results
of the field test buildings, the typical insulation levels are overpowering the effects of the CRP’s or
other variations. This result is also found with the computer modelling where the energy savings in
both summer and winter show no effect from the use of CRP resulting in a total zero effect. Older un-
insulated buildings receive a positive benefit from the CRP’s
The commercial building showed a small benefit to cooling load (3%) by using the CRP. This of
course is dependent on the proportions of the building, its usage, construction, and other specifics. It
is noted that the literature showed studies that found a benefit of up to 20% of the CRP’s.

7/29/2019 Cool Roofs Report
http://slidepdf.com/reader/full/cool-roofs-report 38/56
Cool Roofs Research
Page | 38
Heating Cooling Heating Cooling
Commercial base case 0.8 155876 308979 50.9 101.0 151.9
Commercial_thermoshield 0.21 159036 299504 52.0 97.9 149.8 2.1
Residential base case 0.8 13102 2280 99.7 17.3 117.1
Residential_thermoshield 0.21 13102 2280 99.7 17.3 117.1 0.0
total MJ
savings per
m2
StructureAnnual (MJ) Average (MJ/m
2)
Absorptancetotal MJ
m2
Table 12: Heating and cooling total energy
Sample building simulation – effect of height of a commercial
building
The above results used a four storey office building. Given many buildings are significantly taller than
this; a simulation was run on different height buildings, all with the same properties.
Heat ing Cooling Heating Cooling Heat ing Cooling Total MJ MJ dif ference MJ per m2
0.8 155876 308979 51 101 464855
0.21 159036 299504 52 98 458540 6315 2.1
0.8 437128 782338 57 102 1219466
0.21 443873 767823 58 100 1211695 7770 1.0
0.8 905881 1571270 59 103 2477150
0.21 918601 1548354 60 101 2466955 10195 0.7
0.8 1374633 2360201 60 103 3734835
0.21 1393329 2328886 61 101 3722215 12620 0.5
-1.54
-1.40
-1.36
Savings (%)
3.07
1.86
1.46
1.33
-2.03
StoreysAnnual (MJ) Average (MJ/m
2)
Absorptance
4
10
20
30
Table 13: Effect of height of building
The above table shows that the lower building (four storeys) receives the greatest benefit from the
CRP, and the tallest building receives the least benefit from the CRP.
Sample Building Simulation – industrial internal temperature profile
Because the industrial building does not use energy for heating or cooling, the analysis was instead
made on internal comfort conditions. Although this approach results in a direct comparison of
performance of with and without CRP, it is more difficult to assign a cost saving to the use of the
products.
The results show that both the CRP and base case roofs result in buildings are uncomfortable at
times, but that the CRP building maintained a significantly lower internal temperature during these
times. To illustrate this, as can be seen from the graph below, on a day when the base case building
internal temperature approach 40 degrees, the CRP building maintained approximately 33 degrees.
This represents a difference of 7 degrees or approximately 17% cooler conditions.

7/29/2019 Cool Roofs Report
http://slidepdf.com/reader/full/cool-roofs-report 39/56
Cool Roofs Research
Page | 39
Figure 32: Industrial internal temperature - summer
In winter neither building is comfortable due to the lack of insulation and gap sealing, nor in this case
the CRP is keeping the indoor temperature down, below comfort temperatures in some conditions.
Figure 33: Industrial internal temperature - winter
Sample Building Simulation – Industrial Energy Use profile
Although the testing on the industrial style building assumes there is no heating and cooling, but
rather an impact on the level of comfort between the CRP and Non-CRP models, it is of interest to
draw comparisons of the energy use if the spaces were heated and cooled to quantify the benefits of
the CRP.

7/29/2019 Cool Roofs Report
http://slidepdf.com/reader/full/cool-roofs-report 40/56
Cool Roofs Research
Page | 40
The modelling for the industrial building was completed using two internal load profiles:
1) A high load profile – 100W/m2
– representing a process style building such as
manufacturing
2) A Low load profile – 10W/m2
– representing a storage style building, such as a warehouse
Average (MJ/m2) Total
Heating Cooling Heating Cooling
High load - Metal 0.80 156989 465382 157 465 622
High load - CRP 0.21 192756 185890 193 186 379
Low load - Metal 0.80 365014 266729 365 267 632
Low Load - CRP 0.21 467956 80260 468 80 548
Type of load AbsorptanceAnnual (MJ)
Table 14: Industrial energy savings
The results show in the above table demonstrate that cooling energy for both scenarios is significantly
reduced (59% reduction high load, 70% low load), but that heating energy is increased (18.6% high
load, 22% Low load).
It is important to remember that these figures are heavily biased by the fact that the industrial building
model assumed zero insulation and very poor thermal performance and as such very high cooling
energy figures are easily influenced by the improvement given by the CRP. As has been
demonstrated previously, if this building were to be heated and cooled in real life it would be requiredto have a minimum of R1.8 wall insulation and R3.2 ceiling insulation, which would significantly
decrease the effect of the CRP seen here. This again supports the idea that CRP products are best
suited to older and/or uninsulated buildings.
The following table represents the number of hours outside the comfort zone, which determines the
number of hours that cooling or heating would be required. This is different to the above results which
show the total demand, this represents the amount of time that external conditioning is required. For
example, day 1 may require 8 hours of cooling with a total demand of 200MJ. Day two may require 10
hours of cooling with only 100MJ.
Type of load Absorptance hrs
High load - Metal 0.8 5136
High load - CRP 0.21 4655
Low load - Metal 0.8 5360
Low Load - CRP 0.21 5361
No of hrs outside comfort zone (<18 and >27)
Table 15: Industrial – hours outside of comfort zone
7/29/2019 Cool Roofs Report
http://slidepdf.com/reader/full/cool-roofs-report 41/56
Cool Roofs Research
Page | 41
It can be seen here that the high load scenario receives a 9% reduction in hours outside
the comfort zone compared with standard roofing products, whilst the low load scenario
receives no benefit. This is due to the fact that uninsulated CRP products reduce the heat
gained from the sun in winter, as well as reducing the heat gain in summer. This has an overall effect
of making summer more tolerable (less hours above comfort) but winter less tolerable (more hoursbelow comfort temps)
This result is consistent with the internal temperature modelling results.
ConclusionsExtensive field testing in conjunction with detailed computer modelling have demonstrated that the
both methodologies are suitable to determine the effectiveness of CRP products on a range of
building typologies. Our computer modelling validation studies have been very accurate in replicating
the effects seen in the field tests.
From this it is concluded that computer simulation is an appropriate methodology to study the effects
and benefits of CRP products on a variety of buildings without the need to replicate it in full scale. This
means that a “calculator” type approach for consumers to consider the benefits of these products
would be effective.
The field tests and computer simulation both have shown that CRP products are highly effective at
reflecting solar radiation and lowering roof surface temperatures, when compared with a standard
metal roof material. Both testing methodologies also have demonstrated that the products reduce
indoor temperatures of the test buildings both during the day and at night-time. This supports the
claims of manufacturers that the products are effective at reflecting radiation AND emitting heat at
night time. Furthermore, these results are fairly consistent between the summer and winter seasons.
The single drawback of these products has been shown to be this heat reduction consistency
between seasons as it is not particularly well suited to the Melbourne heating climate.
The computer simulation results tested the effect of roof pitch, roof shading, roof insulation levels, and
the location of the insulation in the ceiling cavity. It is clear from the results that the level of insulation
specified in the model had a very significant effect on the results, and far outweighed the significance
of all of the other variables. Despite this result, it was clear that the other tested variables do have an
effect on the results as would be expected, and a more significant effect would be seen if the test
building was modelled with no ceiling insulation.
For a typical residential building, the simulation showed that a standard attic space temperature
profile would vary greatly based on the location of the insulation. If the insulation is located on theceiling (below roof space - as is the case with most residential buildings at this time) the attic space
would be up to 18.5 degrees cooler with the use of CRP. If the insulation is located under the roof
(above the roof space) the CRP’s have only a minor impact on the temperature of the roof space.
When extending the computer simulation of the CRP’s to a typical commercial and industrial building,
again the importance of ceiling insulation to the results became apparent. It was demonstrated that a
commercial building in Melbourne could benefit by approximately 3% in terms of cooling energy
reductions – it is expected that much higher savings would be achieved depending on the building
age, construction and location, as found in the literature review. This result suggests that many older
office style buildings would benefit from the use of these products.

7/29/2019 Cool Roofs Report
http://slidepdf.com/reader/full/cool-roofs-report 42/56
Cool Roofs Research
Page | 42
Uninsulated, un-conditioned industrial buildings also can benefit from these products, with
the results showing that depending on the internal temperature load, a significant
reduction in indoor temperature can be achieved. Conversely, in an industrial building that
has a low internal gain profile, such as a warehouse or similar, the products had the effect of
improving the comfort (indoor temperature) in the summer months and reducing the comfort in thewinter months, leading to a net zero benefit.
It is clear from the results of this study that buildings with high cooling loads and minimal insulation
will received significant benefits with the use of CRP’s. Buildings without a significant cooling load,
and with typical insulation levels (e.g. residential buildings) can benefit from these products, but will
be sensitive to roof pitch, shading and of course the level of ceiling insulation.
ReferencesLiterature Review
Akbari, H. (2003). Measured energy savings from the application of reflective roofs in two small
nonresidential buildings. Energy.Vol 28. Issue 9, 953-967.
Akbari H, and Konopacki, S. (2005).Calculating energy saving potentials of heat-island reduction
strategies, Energy Policy vol 33, no 6, pp721 – 756
Akbari (2008) Saving Energy and Improving Energy in Urban Heat Islands. Physics of Sustainability,
Using energy efficiently and producing it renewably.
Akbari, H. Menon & Rosenfeld (2009) Global Cooling: increasing world-wide albedos to offset CO2
Climate Change 94:275 – 286
Gaffin, S., and Coauthors (2008) Variations in New York City's urban heat island strength over time
and space. Theor. Appl. Climatol., 94, 1-11.
Hogrefe C, Lynn B, Civerolo K, Ku JY, Rosenthal J, Rosenzweig C, Goldberg R, Gaffin S, Knowlton
K, Kinney PL (2004a) Simulating changes in regional air pollution over the eastern United States due
to changes in global and regional climate and emissions. J Geophys Res D – Atmospheres 109:1–13
Konopacki, AkbariH., GartlandL., and RainerL., (1998) Demonstration of Energy Savings of Cool
Roofs, Lawrence Berkeley National Laboratory Report LBNL-40673. Berkeley, CA,
Konopacki, S.J., and AkbariH. (2001). Measured Energy Savings and Demand Reduction from a
Reflective Roof Membrane on a Large Retail Store in Austin. Lawrence Berkeley National LaboratoryReport No.LBNL-47149, Berkeley, CA.
Nowak, D. J.,. Civerolo K. L,. Trivikrama Rao, S. Sistla G.,. Luley C. J, and. Crane D. E,(2000): A
modeling study of the impact of urban trees on ozone. Atmos. Environ., 34, 1601-1613.
Oke T. (1982). The energetic basis of the urban heat island. Quarterly Journal of the Royal
Meteorological Society 108: 1–24.
Peterson, T. Gallo, K. Lawrimore,J.; Owen T. Huang, A. McKittrick, D. (1999). Global rural
temperature trends. Geophysical Research Letters 26 (3): 329–332.
7/29/2019 Cool Roofs Report
http://slidepdf.com/reader/full/cool-roofs-report 43/56
Cool Roofs Research
Page | 43
Prado R., Ferreira, F. (2005) Measurement of albedo and analysis of its influence the
surface temperature of building roof materials, Building System Laboratory of Escola
Politécnica at University of São Paulo, São Paulo, Brazil
Rosenfeld, A., AkbariH., BretzS., FishmanB., KurnD., SailorD., and TahaH., (1995): Mitigation of urban heat islands: Material, utility programs, updates. Energy Build., 22, 255– 265.
Rosenzweig, C., Solecki, W.D., Parshall, L., Lynn, B., Cox. J., Goldberg, R. Hodges, S., Gaffin, S.,
Slosberg, R.B., Savio, P., Dunstan, F. and Watson, M. (2009).Mitigating New York City's heat island.
Bulletin of the American Meteorological Society 90: 1297-1312
Sailor, D., KalksteinL. S., and WongE., (2002): Alleviating heat-related mortality through urban heat
island mitigation. Bull. Amer. Meteor. Soc, 83, 663-664.
Suehrcke, H. Peterson E, Selby N (2008) Effect of roof solar reflectance on the building heat gain in a
hot climate, Energy and Buildings 40 2224–223
Synnefa et al (2008) On the use of Cool Materials as a Heat Island Mitigation Strategy. Journal of
Applied Meteorological and Climatology American Meteorological Society.
Taha, H., (1994): Meteorological and photochemical simulations of the South Coast Air Basin.
Analysis of Energy Efficiency of Air Quality in the South Coast Air Basin - Phase II, LBL- 35728, H.
Taha, Ed., Lawrence Berkeley Laboratory, 161– 218.
Simulation Methodology
Klein, SA, Beckman, WA, Mitchell, JW, Duffe, JA, Duffe, NA, Freeman, TL, Mitchell, JC, Braun, JE,
Evans, BL, Kumar, JP, Urban, RE, Fiksel, A, Thornton, JW, Blair, NJ, Williams, PM, Bradley, DE,
McDowell, TP, Kummert, M & Arias, DA 2006, TRNSYS 16: a Transient System Simulation Program,
University of Wisconsin-Madison, WI, USA.
Morrison, GL & Litvak, A, (1999), Condensed Solar Radiation Data Base for Australia, 1/1999, 1999:
Solar Thermal Energy Laboratory, University of New South Wales, Sydney, Australia.
Iqbal, M. (1983). An Introduction to Solar Radiation, Academic Press, Canada.

7/29/2019 Cool Roofs Report
http://slidepdf.com/reader/full/cool-roofs-report 44/56
Cool Roofs Research
Page | 44
Appendix A:Sketch of the base case building

7/29/2019 Cool Roofs Report
http://slidepdf.com/reader/full/cool-roofs-report 45/56
Cool Roofs Research
Page | 45
Appendix B:Drawing files of the typical residential building used in modelling

7/29/2019 Cool Roofs Report
http://slidepdf.com/reader/full/cool-roofs-report 46/56
Cool Roofs Research
Page | 46
Appendix C:
Sketch of the typical commercial building
Building type used for commercial building model

7/29/2019 Cool Roofs Report
http://slidepdf.com/reader/full/cool-roofs-report 47/56
Cool Roofs Research
Page | 47
Appendix D:
Image of the typical industrial building
Building type used for Industrial building model

7/29/2019 Cool Roofs Report
http://slidepdf.com/reader/full/cool-roofs-report 48/56
Cool Roofs Research
Page | 48
Appendix E Assumptions of area for the modelled buildings
Residential building
Zone Wall Dimension Area (m2)
Floor & Ceiling 16.43 x 8.00 131.44
North East wall 16.43 x 2.55 41.90
South East wall 8.50 x 2.55 21.67
South West wall 16.43 x 2.55 41.90
North West wall (adjacent to garage) 8.50 x 2.55 21.67
North East windows 1.2 m height 14.04
South West windows 1.2 m height 9.75
Door on NE wall 1.2 x 2.2 2.64
Door on SW wall 1.2 x 2.2 2.64
Eaves board on NE wall 16.43 x 2.45 40.25
Conditioned space
Eaves board on SW wall 16.43 x 1.85 30.39
Floor & Ceiling 5.00 x 8.00 40.00
North East wall 5.00 x 2.55 3.78
South East wall (adjacent to conditioned
space)
8.50 x 2.55 21.67
South West wall 5.00 x 2.55 10.11
North West wall 8.50 x 2.55 21.67
Door on NE 4.00 x 2.24 8.97
Garage
Door on SW 1.2 x 2.2 2.64
North East roof (22.48) 118.62
South East roof (22.31) 43.03
Attic
South West roof (22.48) 98.22

7/29/2019 Cool Roofs Report
http://slidepdf.com/reader/full/cool-roofs-report 49/56
Cool Roofs Research
Page | 49
North West roof (22.31) 28.06
Residential bui lding materials
Layers Material Thickness (mm)
Carpet 5
Tile 5Room floor
Concrete 100
Garage floor Concrete 100
Plaster board 15Ceiling
Mineral wool 150
Plaster board 15
Mineral wool 150
Air gap 40
Outside wall
Bricks 100
Particle board 15Mineral wool 150
Internal wall
Particle board 15
Masonite 5
Air 40Roof
Corrugated iron 1
Door Particle board 32
Window Glass 5
Other parameters for the residential building
Description Parameters Unit
Outdoor air infiltration rate 0.2 ACH
Ventilation rate 0.2 ACH
Person, seated at rest 5 -
Computer 3 nos x 140 W
Artificial lighting 10 W m-2
7/29/2019 Cool Roofs Report
http://slidepdf.com/reader/full/cool-roofs-report 50/56
Cool Roofs Research
Page | 50
Lighting schedule (ON) 6 – 11 pm -
Thermostat setting for cooling 24 C
Thermostat setting for heating 21 C
Night setback for heating 18 (11 pm – 6 am) C
Beginning of heating season 3240 (16 May) hr
End of heating season 6192 (15 September) hr
Beginning of cooling season 8016 (1 December) hr
End of cooling season 1416 (28 February) hr
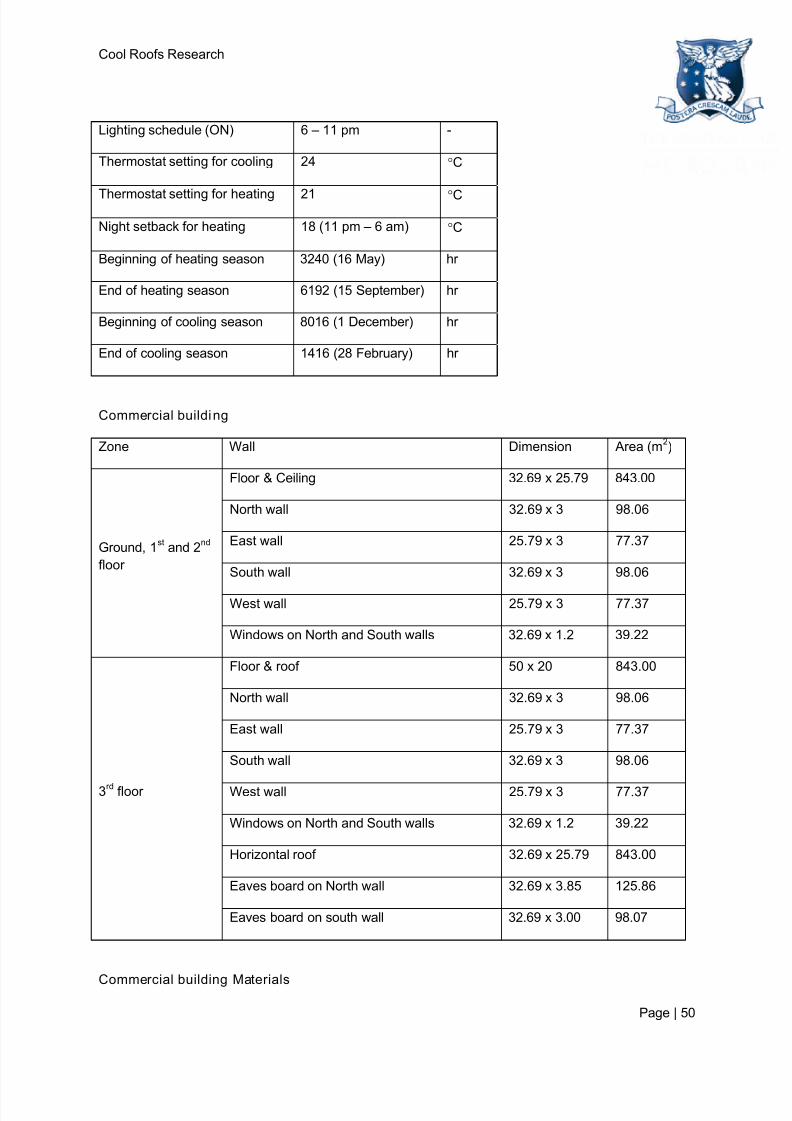
Commercial building
Zone Wall Dimension Area (m2)
Floor & Ceiling 32.69 x 25.79 843.00
North wall 32.69 x 3 98.06
East wall 25.79 x 3 77.37
South wall 32.69 x 3 98.06
West wall 25.79 x 3 77.37
Ground, 1st
and 2nd
floor
Windows on North and South walls 32.69 x 1.2 39.22
Floor & roof 50 x 20 843.00
North wall 32.69 x 3 98.06
East wall 25.79 x 3 77.37
South wall 32.69 x 3 98.06
West wall 25.79 x 3 77.37
Windows on North and South walls 32.69 x 1.2 39.22
Horizontal roof 32.69 x 25.79 843.00
Eaves board on North wall 32.69 x 3.85 125.86
3rd floor
Eaves board on south wall 32.69 x 3.00 98.07
Commercial building Materials

7/29/2019 Cool Roofs Report
http://slidepdf.com/reader/full/cool-roofs-report 51/56
Cool Roofs Research
Page | 51
Layers Material Thickness (mm)
Carpet 5
Tile 5
Ground floor Concrete 100
Plaster board 5
Concrete 100
Tile 5
Ceiling (ground, 1st
and 2nd
floor)
Carpet 5
Plaster board 5
Mineral wool 150Roof
Concrete 100Plaster board 15
Mineral wool 150Outside wall
Concrete 100
Particle board 15
Mineral wool 150Internal wall
Particle board 15
Window Glass 5
Other parameters for the commercial building
Description Parameters Unit
Outdoor air infiltration rate 0.6 ACH
Ventilation rate 1 ACH
Person, seated light work 240 -
Computer 240 nos x 140 W
Artificial lighting 10 W m-2
Lighting schedule (ON) 8 am – 6 pm -
Thermostat setting for cooling 24 C
Thermostat setting for heating 21 C
Heating & cooling (ON only weekdays) 7:30 am – 5:30 pm -
Industrial building

7/29/2019 Cool Roofs Report
http://slidepdf.com/reader/full/cool-roofs-report 52/56
Cool Roofs Research
Page | 52
Zone Wall Dimension Area (m2)
Floor 50 x 20 1000.00
North wall 50 x 4 200.00
East wall 20 x 4 80.00
South wall 50 x 4 200.00
West wall 20 x 4 80.00
North roof (30 slope) 50 x 11.55 577.50
East roof (vertical) 10 x 5.68 56.80
South roof (30 slope) 50 x 11.55 577.50
West roof (vertical) 10 x 5.68 56.80
Internal space
Sky light (on North and South roofs at 30 slope) 0.9 m width 62.37
Industrial building Materials
Layers Material Thickness (mm)
Floor Heavy concrete 100
Masonite 5
Air 40Roof
Corrugated iron 2
Masonite 5
Air 40
Outside wall
Corrugated iron 2
Skylight Polycarbonate (assumed to have similar
transmissivity as plain glass)
2
Other parameters for the industrial building
Description Parameters Unit
Outdoor air infiltration rate 0.6 ACH

7/29/2019 Cool Roofs Report
http://slidepdf.com/reader/full/cool-roofs-report 53/56
Cool Roofs Research
Page | 53
Ventilation rate 0.5 ACH
Person, heavy work 33 -
Artificial lighting 10 W m-2
Lighting schedule (ON) 6 am – 10 pm -
Equipment cooling load 10 & 100 W m-2

7/29/2019 Cool Roofs Report
http://slidepdf.com/reader/full/cool-roofs-report 54/56
Cool Roofs Research
Page | 54
Appendix F:
Method of comparison of simulated and measured results (Iqbal 1983)
Root Mean Square Error (RMSE)
5.02/ n X Y RMSE
ii
Mean Bias Error (MBE)
n X MBE i
/Y i
Correlation Coefficient (CC)
5.022
meanimeani
meanimeani
X X Y Y
X X Y Y CC
Where Xi - ith
measured value
Yi - ith
simulated value
Xmean - measured mean value
Ymean - simulated mean value
n - number of observations

7/29/2019 Cool Roofs Report
http://slidepdf.com/reader/full/cool-roofs-report 55/56
Cool Roofs Research
Page | 55
Appendix G:
Current Programs using CRPIt is interesting to review the current research and requirements for CRP around the world.
International Programs
Across the U.S. Federal Government
The United States Department of Energy has announced a series of initiatives to more broadly
implement cool roof technologies on DOE facilities and buildings across the country. DOE will install a
cool roof, whenever cost effective over the lifetime of the roof, during construction of a new roof or the
replacement of an old one at a DOE facility.
DOE Cool Roof Calculator http://www.ornl.gov/sci/roofs%2Bwalls/facts/CoolCalcEnergy.htm
US Energy Star
A roof product qualifying for the Energy Star label under its Roof Products Program must have an
initial solar reflectivity of at least 0.65, and weathered reflectance of at least 0.50, in accordance with
EPA testing procedures.
EPA Cool Roof Calculator http://www.roofcalc.com
Cool Roof Rating Council
The Cool Roof Rating Council (CRRC) is an independent, non-profit organization that maintains a
third-party rating system for radiative properties of roof surfacing materials.CRRC has created anextensive database and rating system for all types of roofing products. www.coolroof.org
CRRC’s rating program allows manufacturers and sellers to appropriately label their roofing products
according to specific CRRC measured properties. The program does not, however, specify minimum
requirements for solar reflectance or thermal emittance.
Green Globes
To qualify for a Green globe rating category B-2 Ecological impacts, roofing materials must have a
solar reflectance of at least .65 and thermal emittance of at least .90. As many as 10 points may be
awarded for 1-100 percent roof coverage with either vegetation or highly reflective materials or both.
LEED
In the area of roofing, to receive LEED Sustainable Sites Credit 7.2, at least 75% of the surface of a
roof must use materials having a Solar Reflective Index (SRI) of at least 78. This criterion may also be
met by installing a vegetated roof for at least 50% of the roof area, or installing a high albedo and
vegetated roof that, in combination, meets this formula: (Area of SRI Roof/0.75)+(Area of vegetated
roof/0.5) = Total Roof Area.
Cool Roofs Europe
There is a number of Cool roof related organizations in Europe, with Cool Roofs Europe being central
to all of the cool roof activity in the region. This European Union backed organisation aims to create

7/29/2019 Cool Roofs Report
http://slidepdf.com/reader/full/cool-roofs-report 56/56
Cool Roofs Research
and implement an Action Plan for the cool roofs in EU. Although the organization is well
organized and well run, there is a lack of specific rating, design and quality control based
on information from the site. It would appear be more designed to provide information to
consumers should they be interested. http://www.coolroofs-eu.eu/
Australian requirements for a CRP product
In the local scene, the Australian Building Code now has an allowance for a cool roof, which basically
equates to the northern Australian climate having a reduced R-value requirement for the ceiling with
the use of cool roof products. This is an excellent introduction to the market as to the benefit of using
such products and it is likely the BCA will increase its requirements around this type of performance
as the BCA progresses.
Table J1.3a ROOFS AND CEILINGS - MINIMUM TOTAL R-VALUE FOR EACH CLIMATE ZONE
Climate zone 1, 2 and 3
4, 5
and
6
7 8
Direction of heat flow Downwards Upwards
Minimum Total R-Value for a roof or ceiling with a roof
upper surface solar absorptance value of not more than 0.53.2 3.2 3.7 4.8
Minimum Total R-Value for a roof or ceiling with a roof
upper surface solar absorptance value of more than 0.5 butnot more than 0.6
3.7 3.2 3.7 4.8
Minimum Total R-Value for a roof or ceiling with a roof
upper surface solar absorptance value of more than 0.64.2 3.2 3.7 4.8
Table 3 BCA requirements fo r roo f absorptance
*It should be noted that solar absorptance is a measure of the ability of a material or coating to absorb
heat. It is the opposite of the reflectance – although not in a direct mathematical way.