CITY OF PHOENIX COOL URBAN SPACES PROJECT · CITY OF PHOENIX COOL URBAN SPACES PROJECT Urban...
16
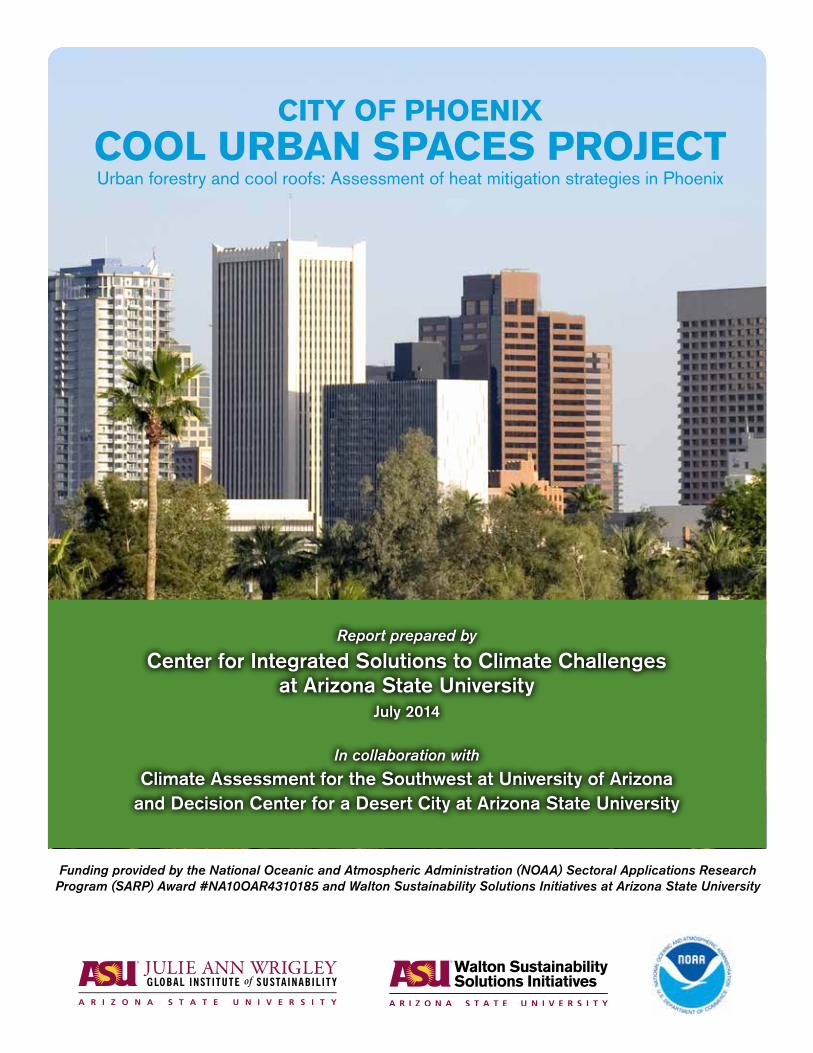
CITY OF PHOENIX COOL URBAN SPACES PROJECT Urban forestry and cool roofs: Assessment of heat mitigation strategies in Phoenix Report prepared by Center for Integrated Solutions to Climate Challenges at Arizona State University July 2014 In collaboration with Climate Assessment for the Southwest at University of Arizona and Decision Center for a Desert City at Arizona State University Funding provided by the National Oceanic and Atmospheric Administration (NOAA) Sectoral Applications Research Program (SARP) Award #NA10OAR4310185 and Walton Sustainability Solutions Initiatives at Arizona State University
Transcript of CITY OF PHOENIX COOL URBAN SPACES PROJECT · CITY OF PHOENIX COOL URBAN SPACES PROJECT Urban...
CITY OF PHOENIX COOL URBAN SPACES PROJECTUrban forestry and cool roofs: Assessment of heat mitigation strategies in Phoenix
Report prepared by Center for Integrated Solutions to Climate Challenges
at Arizona State UniversityJuly 2014
In collaboration with Climate Assessment for the Southwest at University of Arizona
and Decision Center for a Desert City at Arizona State University
Funding provided by the National Oceanic and Atmospheric Administration (NOAA) Sectoral Applications Research Program (SARP) Award #NA10OAR4310185 and Walton Sustainability Solutions Initiatives at Arizona State University

— CITY OF PHOENIX COOL URBAN SPACES PROJECT —
AcknowledgementsThe authors would like to thank Philip McNeely, City of Phoenix Environmental Program Manager; Joe Gibbs, Environmental Quality Specialist; Richard Adkins, Phoenix Parks and Recreation Department Forestry Supervisor; and Darice Ellis, Environmental Quality Specialist, for their assistance with this project. We are grateful to them for taking time out of their busy schedules to accommodate the numerous meetings necessary for gathering the city data.
The authors appreciate the support provided by staff of Decision Theater at Arizona State University (ASU), particularly in the use of their computers for the modeling work this project required.
We would also like to recognize the myriad of ASU researchers and scholars who took part in the Urban Heat Island (UHI) Mini Symposium on October 23, 2013 and whose work informed the outcomes of this project: Anthony Brazel, Harvey Bryan, Mikhail Chester, Michael Dalrymple, Monica Elser, Matei Georgescu, Patricia Gober, Kevin Gurney, Kathrin Häb, Donna Hartz, David Hondula, Jialun Li, Alex Mahalov, Soe Myint, Marcia Nation, Francisco Salamanca, Billie Turner, Ray Quay, Zhihua Wang, Dave White and Sally Wittlinger.
The authors would especially like to thank Michele Roy, who has been an integral part of the team and provided significant professional contributions to the editing of this report, as well as helped to organize the UHI mini symposium.
Finally, the authors would like to thank Walton Sustainability Solutions Initiatives for generously supplying a fast-processing computer, without which this project would have been vastly delayed.
Ariane Middel, Ph.DNalini Chhetri, Ph.D

— CITY OF PHOENIX COOL URBAN SPACES PROJECT —
Contents1. Introduction ..................................................................................................................................................................1
2. Overview of the City of Phoenix UHI mitigation initiatives ................................................................... 11.1 Cool roofs ................................................................................................................................................................ 11.2 Trees and shade ....................................................................................................................................................3
3 Methodology ................................................................................................................................................................33.1 ENVI-met modeling .............................................................................................................................................. 43.2 Thermal comfort modeling ..................................................................................................................................63.3 Synthesis of UHI research at ASU ....................................................................................................................6
4 Results ........................................................................................................................................................................... 74.1 Daytime cooling benefit of trees and cool roofs at the neighborhood scale ......................................... 74.2 Diurnal cooling benefit of trees at the microscale ........................................................................................8
5 Discussion and conclusions ..............................................................................................................................10
References .................................................................................................................................................................... 11
Table of FiguresFigure 1: Aerial view of the City of Phoenix .............................................................................................................. 2Figure 2: Ensemble of scenarios ................................................................................................................................. 4Figure 3: Typical Phoenix residential neighborhood ............................................................................................... 5Figure 4: Tree canopy cover ......................................................................................................................................... 5Figure 5: Thermographic image of an elm tree on grass ....................................................................................... 7Figure 6: ENVI-met simulation outcomes ................................................................................................................. 9Figure 7: Observed non-shaded surface temperatures at the xeric and mesic sites ..................................... 8Figure 8: RayMan model output ................................................................................................................................10
List of TablesTable 1: ENVI-met building and climate parameters ............................................................................................... 6
— CITY OF PHOENIX COOL URBAN SPACES PROJECT —
0. Executive summaryThe City of Phoenix’s Cool Urban Spaces Report (2014) investigated the impact of the Phoenix Cool Roofs and Tree and Shade Master Plan initiatives on the city. The study evaluated how these heat mitigation efforts affect microclimates and human thermal comfort in the Phoenix metropolitan area. These findings are especially relevant as rapid and extensive urbanization has led to an urban heat island (UHI) effect that has increased steadily at approximately 0.9°F per decade.
The city’s questions guiding this research were:
a) What are the cooling benefits achieved by increasing tree canopy from 10% (current) to 25% (2030 goal) and/or implementing cool roofs under existing conditions and projected warming?
b) What is the diurnal thermal benefit of tree canopy shade for a typical heat wave day during pre-monsoon summer?
The impacts of cool roofs and trees on near-ground air temperatures were modeled through 54 scenarios for a typical residential neighborhood in Phoenix. We ran the model for a combination of three tree-planting scenarios (no trees, current canopy cover and 2030 canopy goal) and three landscaping scenarios (mesic, oasis and xeric) with regular roofs and cool roofs under current climate conditions and two climate change projections.
Two significant results of the tree and shade initiative are: 1) increasing tree canopy cover to 25% leads to an additional temperature reduction of 4.3°F, which is a total cooling benefit of 7.9°F as compared to a bare neighborhood, and 2) switching landscaping from xeric to oasis, i.e., adding grass patches to residential backyards, reduces average neighborhood temperatures by 0.4°F to 0.5°F.
The scenario with the lowest air temperatures is the residential neighborhood with mesic landscaping, 25% tree canopy cover and cool roofs under current climate conditions with an average neighborhood temperature of 99.5°F. In contrast, the xeric neighborhood with no tree cover and regular roofs under the high-emissions climate change scenario is the hottest. This indicates that the combination of increased tree canopy cover and cool roofs does lower temperatures as well as reduce the demand for air conditioning, thereby reducing anthropogenic heat. However, trees and cool roofs are only part of the solution and need to be included in a broader, more comprehensive mitigation and adaptation plan.
Across all climate and tree scenarios, the effect of cool roofs alone on local daytime temperatures is relatively low. Air temperature reduction only amounts to 0.5°F in the neighborhood. Regarding the city’s cool roofs initiative, results show little benefit for extending this project to commercial and residential properties based on its cooling impacts alone.
Our research thus far indicates that there is no simple solution to mitigating the UHI, but a complex balance of strategies will be necessary so that efforts to lower the daytime temperatures do not increase nighttime temperatures or shift UHI impacts to more vulnerable populations.
1
— CITY OF PHOENIX COOL URBAN SPACES PROJECT —
1. IntroductionThe Center for Integrated Solutions to Climate Challenges and Decision Center for a Desert City (DCDC) at ASU, along with Climate Assessment for the Southwest (CLIMAS) at the University of Arizona, through a NOAA-funded grant, convened a workshop with urban managers and practitioners in October 2012. One goal of the workshop was to provide useful, state-of-the-art climate knowledge to encourage the use of climate science in long-range decision processes. Another was to provide opportunities for working with urban managers and planners to develop tangible products and/or processes that will enable the incorporation of this information into their unique planning documents and policies. Attendees were asked to develop project proposals for tractable, city-specific adaptation projects on behalf of their municipality. Three proposals were chosen for funding: Tucson, Flagstaff and Phoenix. The City of Phoenix asked for support in assessing the impact of their urban forestry and cool roofs initiatives on projected heat increases and the urban heat island (UHI).
In Phoenix, rapid and extensive urbanization has led to an UHI in the metropolitan area that has increased steadily at approximately 0.9°F (0.5°C) per decade. A time-trend analysis of Phoenix Sky Harbor air temperatures showed nighttime temperature differences between rural and urban areas of up to 11°F (6°C) in the summer (Brazel et al., 2000). Winter mobile transect observations in Phoenix found a UHI intensity of 14°F (8°C) (Sun et al., 2009), and a study in the spring observed an average UHI intensity of 17°F to 23°F (9.4°C to 12.9°C) (Hawkins et al., 2004). Discussions with Philip McNeely, the city’s Environmental Program Manager; Richard Adkins, Phoenix Parks and Recreation Department’s Forestry Supervisor; and a number of ASU researchers provided insight into the current activities being undertaken by the city to mitigate heat. Among these were their green building and urban forestry initiatives.
The stakeholder questions coming from the activities guiding this research were:
a) What are the cooling benefits achieved by increasing tree canopy from 10% (current) to 25% (2030 goal) and/or implementing cool roofs, under existing conditions and projected warming?
b) What is the diurnal thermal benefit of tree canopy shade for a typical heat wave day during pre-monsoon summer?
This study used micro-scale modeling, hourly meteorological observations and a research synthesis workshop with UHI experts from ASU to help inform the City of Phoenix’s green building and urban forestry initiatives. Initial results were presented to the City of Phoenix in late 2013.
2. Overview of the City of Phoenix UHI mitigation initiatives1.1 Cool roofsThe Green Construction Code (City of Phoenix, 2006), adopted by the Phoenix City Council in 2005, was developed as a means of mitigating the UHI. The code includes purchasing guidelines for Energy Star Reflective Roof Certified Products to encourage cool roofs on publicly owned buildings. A mandate for cool roofs on all new city-owned buildings will ensure compliance for all future builds. In October 2012, Mayor Greg Stanton implemented the Phoenix Cool Roofs initiative to coat 70,000 square feet of the city’s existing rooftops with reflective materials (Figure 1c). Approximately 52,000 square feet of public rooftops have been coated with the remainder expected to be completed by the end of 2014. Despite the success of the program for city operations, the private and residential sectors have not been included and have not fully embraced the use of cool roofing materials. Therefore, the city requested assistance in researching the impacts of residential cool roofs on local
— CITY OF PHOENIX COOL URBAN SPACES PROJECT —
2
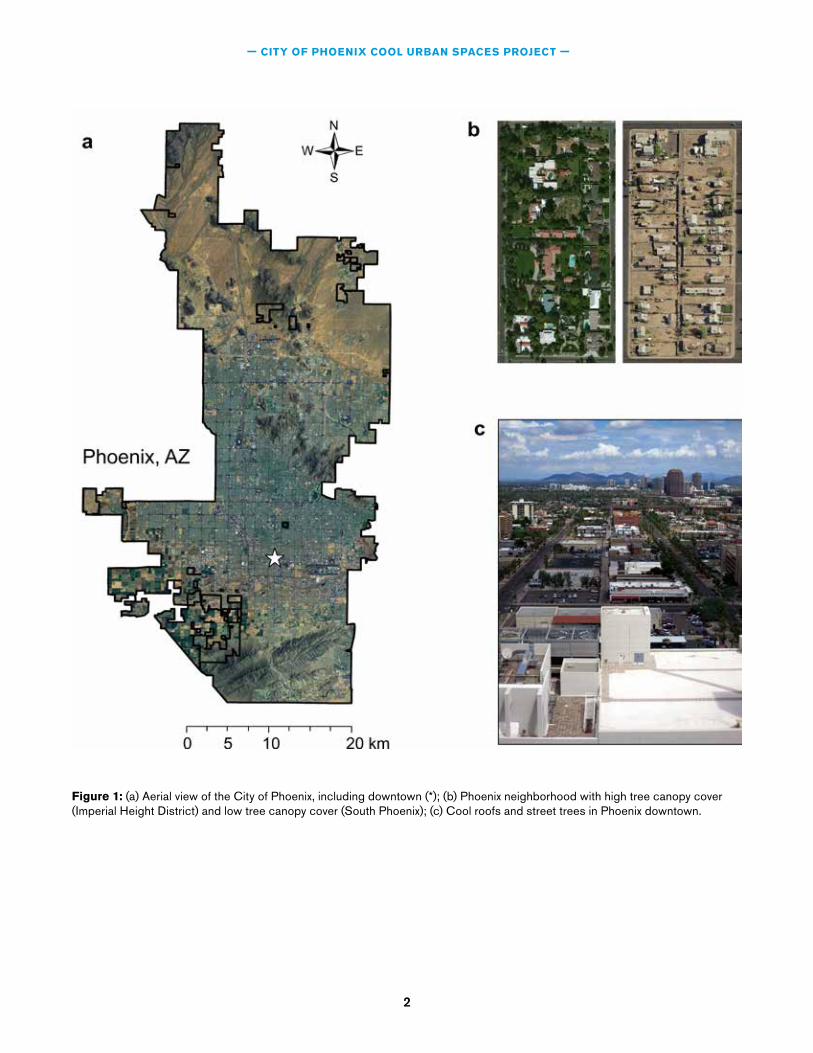
Figure 1: (a) Aerial view of the City of Phoenix, including downtown (*); (b) Phoenix neighborhood with high tree canopy cover (Imperial Height District) and low tree canopy cover (South Phoenix); (c) Cool roofs and street trees in Phoenix downtown.

3
— CITY OF PHOENIX COOL URBAN SPACES PROJECT —
temperatures to understand the consequences of both action and inaction. By translating these findings, best practices that can be marketed to industry and the public can be identified.
1.2 Trees and shadeThe Tree and Shade Management Task Force, a cross-departmental committee led by the City of Phoenix Parks and Recreation Department, developed a master plan that serves as roadmap for the city (City of Phoenix, 2010). The plan outlines three goals: (1) educate the public on the benefits of trees, as there is limited understanding of the importance of the urban forest; (2) incrementally achieve a tree canopy cover of 25% by 2030 and protect existing trees because more are currently being lost than planted; and (3) improve planting, maintenance and irrigation practices, e.g., use drought-resistant, low-water-use trees. Stabler et al. (2005) estimated the Phoenix metropolitan area (PMA) tree cover to be 13%, but Phoenix’s canopy is currently estimated to be only 8-10%. Historic neighborhoods near the urban core have the highest percentage of mature tree canopy (Figure 1b), as lush vegetation was traditionally used here for cooling before air conditioning became widely available (Gober, 2006).
In general, Phoenix has a diverse tree palette ranging from native species, such as palo verde, ironwood and mesquite trees, to non-native species introduced from similar climates: eucalyptus, ash, elm, olive, palm and citrus trees. A recent citywide tree inventory identified 92,845 trees on publicly owned land, i.e., parks, right-of-ways and around municipal buildings (City of Phoenix, 2014). This city-maintained urban forest covers less than 1% of the city’s total land area. Making meeting the 25% canopy goal more difficult, Phoenix Parks and Recreation is only able to maintain the current level of tree canopy and cannot move towards the target percentage due to a
number of constraints, including a lack of data and funds. Due to these constraints and the vast size of the metropolitan area, the city realizes that it must engage the public in order to reach its 2030 goal. Assessing the impact of an increased tree canopy cover on neighborhood climate is the first step towards educating the public on the thermal benefits of trees and creating incentives for the residential sector to engage in the initiative.
3. Methodology A three-step methodology was used to address the research questions for the City of Phoenix. First, we modeled the impact of trees and cool roofs on near-ground air temperatures with the microclimate model ENVI-met (Bruse, 2014) for a typical residential neighborhood in Phoenix. We ran the model for a combination of three tree-planting scenarios (no trees, current canopy cover and 2030 canopy goal) and three landscaping scenarios (mesic, oasis and xeric) with regular roofs and cool roofs under current climate conditions and two climate change projections (Figure 2).
The thermal benefit of each scenario was investigated for mid-afternoon (the warmest temperature period) and at the local and micro scales, at which most UHI mitigation strategies are implemented and the effect is felt most. Second, we used the comfort model “RayMan” to investigate the thermal benefit of tree canopy cover, incorporating hourly microclimate observations, thermographic images of trees and fisheye photography of the canopy. Third, we synthesized existing knowledge on the Phoenix UHI from publications and an expert workshop held at ASU in October 2013 to gain insight into current UHI mitigation solutions and their effectiveness. The following subsections provide more details on the methodology used for each of the three steps.

— CITY OF PHOENIX COOL URBAN SPACES PROJECT —
4
3.1 ENVI-met modelingENVI-met (Bruse, 2014) is a three-dimensional atmospheric model that has been successfully used to simulate microclimate in Phoenix after supplementing the model’s plant database with native species (Chow and Brazel, 2012; Declet-Barreto et al., 2013; Hedquist and Brazel, 2014; Middel et al., 2014a). For the model domain, a Phoenix residential neighborhood scenario representative of a typical single-family home subdivision was chosen. The neighborhood is classified as Open Lowrise Local Climate Zone after Stewart and Oke (2012) and features 28 uniformly arranged detached two-story buildings. By keeping the arrangement of buildings and streets constant, we eliminated the effects of urban form on the simulated microclimate and therefore isolated the impact of trees.
We designed three landscaping scenarios for the neighborhood that reflect the predominant yard styles in Phoenix: mesic (sprinkler-irrigated grass and lush vegetation), xeric (decomposing granite mulch,
Figure 2: Ensemble of scenarios with varying tree cover (0%, 10%, 25%), landscaping (Mesic, Oasis, Xeric), roof type and climate conditions (CCS 1: low- and CCS 2: high-emissions scenarios based on the Assessment of Climate Change in the Southwest United States report [Cayan et al., 2013]).
low-water use vegetation) and oasis (a mix between mesic and xeric) (Figure 3).
Starting with a base of 0% canopy, we added trees to represent 10% canopy cover and 25% canopy cover (Figure 4).
For the simulations, we used model configuration parameters from a recent study on the impact of urban form and landscaping types on the mid-afternoon microclimate in Phoenix (Middel et al., 2014a). The parameters were evaluated for June 23, 2011, a typical summer day, using observed atmospheric conditions from weather stations in the Central Arizona-Phoenix Long-Term Ecological Research (CAP-LTER) North Desert Village (NDV) experiment at the ASU Polytechnic campus (Martin et al., 2007).
To simulate high reflective cool roofs, the roof albedo value in the ENVI-met configuration file was set to 0.88, an Environmental Protection Agency

5
— CITY OF PHOENIX COOL URBAN SPACES PROJECT —
Figure 3: Typical Phoenix residential neighborhood (Middel et al., 2014a).
Figure 4: Tree canopy cover.
(EPA) standard for Energy Star roof coating after a three-year wear and tear period (Georgescu et al., 2013). The future climate scenarios were based on results from the statistically downscaled CMIP3 climate model outputs for the Southwestern U.S., as outlined in the Assessment of Climate Change in the Southwest United States report (Cayan et al., 2013). Minimum and maximum average annual warming projections were 2.0°F (1.1°C) and 6.0°F (3.3°C) for the low (B1) emission scenario (climate change
scenario 1) from 2070-2099 and the high (A2) emission scenario (climate change scenario 2) from 2041-2070, respectively. In total, 54 simulations were run for each of the nine combined tree canopy cover and landscaping scenarios with regular roofs and cool roofs under current conditions and for 2.0°F/6.0°F (1.1°C/3.3°C) warming, using the parameters listed in Table 1.

— CITY OF PHOENIX COOL URBAN SPACES PROJECT —
6
Building Data Regular Roofs Cool Roofs Inside Temperature [°C] 23.00 Heat Transmission Walls [Wm-2 K] 1.60 Heat Transmission Roofs [Wm-2 K] 6.00 Albedo Walls [-] 0.55 Albedo Roofs [-] 0.20 0.88
Meteorological Data Base Case Climate Scenario 1
Climate Scenario 2
Wind Speed, 10 m above Ground [ms-1] 1.50 Wind Direction (0:N, 90:E) [°] 280 Roughness Length at Reference Point [m] 0.01 Initial Temperature Atmosphere [K] 299.00 300.10 302.30 Spec. Humidity in 2500 m [Water/Air] [g kg-1] 2.39 Rel. Humidity in 2m [%] 23.00 Cloud Cover [x/8] 0.00
Table 1: ENVI-met building and climate parameters evaluated for June 23, 2011, for base conditions and roof/climate scenarios.
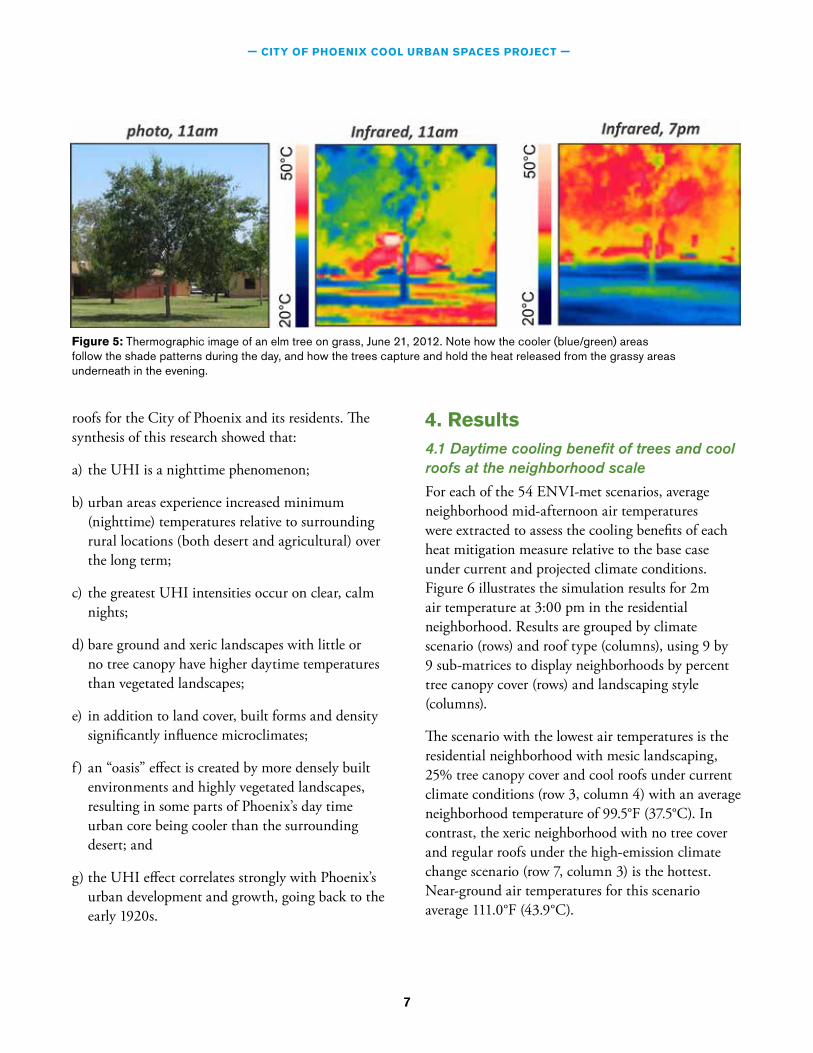
3.2 Thermal comfort modelingAn important benefit consideration for planting trees in arid environments is the daytime thermal comfort provided by a tree during the summer. Therefore, we analyzed microclimate in the shade of trees vs. in the open, using summertime micro-scale observations from the same CAP-LTER NDV experiment used for the modeling simulations (Middel et al., 2014b). We investigated microclimate and thermal comfort differences experienced on two surface types: grass and inorganic mulch (gravel). Measurements were taken on June 21, 2012, representative of a typical hot day during the Phoenix pre-monsoon season with maximum temperature of 107.2°F (41.8°C) and a nighttime low of 79.2°F (26.2°C). We observed hourly surface temperatures from 06:00 am to 10:00 pm under selected trees for each surface type using a handheld FLIR i3 infrared (IR) camera (Figure 5).
Average shaded surface temperatures were extracted from the IR images using a region-growing algorithm. The Sky View Factor (SVF), or the extent
of sky observable under each tree, was determined using fisheye photography. We then used the RayMan model (Matzarakis et al., 2010) to calculate the Physiological Equivalent Temperature (PET). PET, a commonly used thermal comfort index, is defined as air temperature at which, in an indoor setting without wind and solar radiation, the heat budget of the human body is balanced with the same core and skin temperature as under complex outdoor conditions (Höppe, 1999).
3.3 Synthesis of UHI research at ASU Over the past two decades, ASU scholars have conducted extensive research on cool urban spaces, including, but not limited to, the impact of materials, urban form and landscaping on the UHI. The Center for Integrated Solutions to Climate Challenges and DCDC organized a workshop at ASU in October 2013 to bring together experts on urban climate and UHI mitigation strategies to present state-of-the-art findings and discuss the benefits of trees and cool
7
— CITY OF PHOENIX COOL URBAN SPACES PROJECT —
roofs for the City of Phoenix and its residents. The synthesis of this research showed that:
a) the UHI is a nighttime phenomenon;
b) urban areas experience increased minimum (nighttime) temperatures relative to surrounding rural locations (both desert and agricultural) over the long term;
c) the greatest UHI intensities occur on clear, calm nights;
d) bare ground and xeric landscapes with little or no tree canopy have higher daytime temperatures than vegetated landscapes;
e) in addition to land cover, built forms and density significantly influence microclimates;
f) an “oasis” effect is created by more densely built environments and highly vegetated landscapes, resulting in some parts of Phoenix’s day time urban core being cooler than the surrounding desert; and
g) the UHI effect correlates strongly with Phoenix’s urban development and growth, going back to the early 1920s.
Figure 5: Thermographic image of an elm tree on grass, June 21, 2012. Note how the cooler (blue/green) areas follow the shade patterns during the day, and how the trees capture and hold the heat released from the grassy areas underneath in the evening.
4. Results4.1 Daytime cooling benefit of trees and cool roofs at the neighborhood scaleFor each of the 54 ENVI-met scenarios, average neighborhood mid-afternoon air temperatures were extracted to assess the cooling benefits of each heat mitigation measure relative to the base case under current and projected climate conditions. Figure 6 illustrates the simulation results for 2m air temperature at 3:00 pm in the residential neighborhood. Results are grouped by climate scenario (rows) and roof type (columns), using 9 by 9 sub-matrices to display neighborhoods by percent tree canopy cover (rows) and landscaping style (columns).
The scenario with the lowest air temperatures is the residential neighborhood with mesic landscaping, 25% tree canopy cover and cool roofs under current climate conditions (row 3, column 4) with an average neighborhood temperature of 99.5°F (37.5°C). In contrast, the xeric neighborhood with no tree cover and regular roofs under the high-emission climate change scenario (row 7, column 3) is the hottest. Near-ground air temperatures for this scenario average 111.0°F (43.9°C).

— CITY OF PHOENIX COOL URBAN SPACES PROJECT —
8
Across all climate and tree scenarios, the effect of cool roofs on local daytime temperatures is relatively low. Air temperature reduction only amounts to 0.5°F (0.3°C) in the neighborhood. At the regional scale, Georgescu et al. (2012) modeled a cool roof scenario with the Weather Research and Forecasting (WRF) modeling system for the Arizona Sun Corridor and found that high reflective roofs can reduce summer air temperatures up to 2.7°F (1.5°C) in the Phoenix metropolitan area. However, their simulations also suggest that cool roofs change precipitation patterns in the region and lead to a reduction in rainfall of about 4%. Thus, it is important to consider trade-offs when instituting mitigation and adaptation measures.
Significant results for the tree and shade initiative include:
• an increase in tree canopy cover from 0% to 10% decreases average neighborhood temperatures by 3.6°F (2°C);
• increasing tree canopy cover to 25% leads to an additional temperature reduction of 4.3°F (2.4°C) – a total cooling benefit of 7.9°F (4.4°C) as compared to the bare neighborhood;
• switching landscaping from xeric to oasis, i.e. adding grass patches to residential backyards, reduces average neighborhood temperatures by 0.4°F to 0.5°F (0.2°C to 0.3°C); and
• replacing all inorganic mulch with turf has a local cooling effect of 3.0°F to 3.4°F (1.7°C to 1.9°C).
4.2 Diurnal cooling benefit of trees at the microscaleHourly microclimate observations from 6:00 am to 10:00 pm at the NDV study sites on June 21, 2012 revealed that, overall, microclimate in the mesic neighborhood was more comfortable than in the xeric neighborhood, both under tree canopies and in the open. Daytime surface temperatures of inorganic mulch (gravel) at the non-shaded reference point
in the xeric area were higher by at least 9°F (5°C) than temperatures of sun-exposed grass in the mesic neighborhood (Figure 7). In daytime, shaded surface temperatures of grass and gravel under the trees were generally lower, up to 27°F (16°C) at 3:00 pm, compared to the non-shaded reference surfaces.
However, before sunrise and after sunset, surface temperatures were higher under the tree canopy than in the open, indicating that canopies function as a trap for outgoing longwave radiation, retaining heat over both surface types on the order of 1.8 – 3.6°F (1 – 2°C). These findings confirm the results of a previous study by Golden et al. (2007) on the thermal impacts of canopies on pavement surface temperatures in Phoenix.
The thermal comfort differences experienced in the mesic and xeric environments under trees vs. in the open were calculated using the RayMan model (Figure 8), based on the hourly IR camera surface temperature observations, fisheye photos of tree canopies and microclimate measurements at NDV (temperature, relative humidity and wind). In the afternoon, under-canopy PET levels were lower by up to 10.8°F (6.0°C) in the mesic area and up to 7.2°F
Figure 7: Observed non-shaded surface temperatures at the xeric and mesic site (Middel et al., 2014b).

9
— CITY OF PHOENIX COOL URBAN SPACES PROJECT —
Figure 6: ENVI-met simulations for an ensemble of 54 scenarios that combine landscaping styles and heat mitigation strategies for current and projected pre-monsoon summer climate in Phoenix; simulations for June 23, 2011, 3:00 pm.

— CITY OF PHOENIX COOL URBAN SPACES PROJECT —
10
(4.0°C) in the xeric neighborhood compared to non-shaded sites. Over the course of the day, PET values exceeded 105.8°F (41.0°C) for 9 consecutive hours (10:00 am – 06:00 pm) on shaded grass and 11 hours (09:00 am – 07:00 pm) on shaded inorganic mulch. The threshold temperature is 41.0°C PET, above which the thermal perception is categorized as “very hot” and humans experience extreme heat stress.
5. Discussion and conclusionsThis project investigated how heat mitigation efforts affect microclimate and human thermal comfort in the Phoenix metropolitan area. The City of Phoenix’s mitigation efforts include the Phoenix Cool Roofs initiative and Tree and Shade Master Plan. The city’s Parks and Recreation and Environmental Program (EP) managers worked with the research team to determine if the plan’s goal would, in fact, lower temperatures and mitigate UHI impacts.
Modeling results showed that the scenario with the lowest air temperatures (37.5°C/99.5°F) was the
Figure 8: RayMan model output for the observation sites in the mesic and xeric NDV neighborhood at non-shaded reference points and under nine selected trees. Thermal comfort measures MRT and PET for a woman, 65 kg, 1.60 m, 35 years, t-shirt and skirt, standing (Middel et al., 2014b).
neighborhood with a mesic landscaping of grass and other vegetation, 25% tree canopy cover and cool roofs under current climate conditions. In contrast, the xeric neighborhood with no tree cover and regular roofs under the high-emission climate change scenario was the hottest, with near-ground air temperatures for this scenario averaging 111.0°F (43.9°C). This indicates that the combination of increased tree canopy cover and cool roofs does lower temperatures as well as reduce the demand for air conditioning, thereby reducing anthropogenic heat. However, trees and cool roofs are only part of the solution and need to be included in a broader, more comprehensive mitigation and adaptation plan.
Our research thus far indicates that there is no simple solution to mitigating the UHI. A complex balance of strategies will be necessary so that efforts to lower the daytime temperatures do not increase the nighttime temperatures or shift UHI impacts to more vulnerable populations. Some of the considerations when developing a broader plan include:
11
— CITY OF PHOENIX COOL URBAN SPACES PROJECT —
• The arrangement and types of trees is likely to impact their cooling benefit. More research to determine these impacts would be beneficial.
• Trade-offs must be considered, such as increased water needed to maintain the vegetation and higher tree canopy.
• Modifications of land cover alter the heat storage capacity of the urban environment; therefore, heat-storage of materials and the built environment must be taken into consideration.
• The geographic location of trees is important because shading is localized.
• Urban form also affects microclimate by changing wind patterns and shading.
• The socio-economic impacts of UHI mitigation/adaptation efforts also need to be considered, as many vulnerable populations may be adversely affected unless included in the planning process.
• The relationship between canopy cover and cooling in combination with varying neighborhood designs needs further exploration, as grass and other vegetative cover have an impact on air temperature, mainly through evapotranspiration.
• More research on anthropogenic heat impacts on UHI would be beneficial.
Regarding the city’s cool roofs initiative, results show little benefit for extending this project to commercial and residential properties based on its cooling impacts alone. While our research did not have the capacity to model the commercial aspects, we were able to demonstrate that high-albedo roofing had minimal impact on temperatures at the neighborhood level. However, the impact of cool roofs on the use of air conditioning needs further assessment as this may prove to be beneficial to lowering nighttime sources of heat.
ReferencesBrazel, A.J., Selover, N., Vose, R., Heisler, G., 2000.
The tale of two cities: Baltimore and Phoenix urban LTERs. Climate Research 15, 123–135.
Bruse, M., 2014. ENVI-met Version 3.1 BETA V. Available at http://www.envi-met.com/ Accessed February 25, 2014.
Cayan, D., Tyree, M., Kunkel, K.E., Castro, C., Gershunov, A., Barsugli, J., Ray, A.J., Overpeck, J., Anderson, M., Russell, J., Rajagopalan, B., Rangwala, I., Duffy, P., 2013. Future Climate: Projected Average. Assessment of Climate Change in the Southwest United States: A report prepared for the National Climate Assessment, edited by G. Garfin, A. Jardine, R. Merideth, M. Black, and S. LeRoy, 101–125. A report by the Southwest Climate Alliance. Washington, DC: Island Press.
Chow, W.T.L., Brazel, A.J., 2012. Assessing xeriscaping as a sustainable heat island mitigation approach for a desert city. Building and Environment 47, 170–181.
City of Phoenix, 2006. City of Phoenix Planning and Development Department Phoenix Green Construction Code. Available at http://www.ecodes.biz/ecodes_support/Free_Resources/Phoenix2006/Phoenix_Green/PHXGreen_main.html Accessed February 25, 2014.
City of Phoenix, 2010. Tree and Shade Master Plan. Available at http://phoenix.gov/webcms/groups/internet/@inter/@dept/@parks/documents/web_content/071957.pdf Accessed February 25, 2014.
City of Phoenix, 2014. MyTreekeeper Phoenix, Arizona. Available at http://www2.daveytreekeeper.com/ufrm/index.html Accessed February 25, 2014.
Declet-Barreto, J., Brazel, A.J., Martin, C.A., Chow, W.T., Harlan, S.L., 2013. Creating the park cool island in an inner-city neighborhood: Heat mitigation strategy for Phoenix, AZ. Urban Ecosystems 16, 617–635.

— CITY OF PHOENIX COOL URBAN SPACES PROJECT —
12
Georgescu, M., Mahalov, A., Moustaoui, M., 2012. Seasonal hydroclimatic impacts of Sun Corridor expansion. Environmental Research Letters 7, 034026.
Georgescu, M., Moustaoui, M., Mahalov, A., Dudhia, J., 2013. Summer-time climate impacts of projected megapolitan expansion in Arizona. Nature Climate Change 3, 37–41.
Gober, P., 2006. Metropolitan Phoenix: Place making and community building in the desert. University of Pennsylvania Press.
Golden, J.S., Carlson, J., Kaloush, K.E., Phelan, P., 2007. A comparative study of the thermal and radiative impacts of photovoltaic canopies on pavement surface temperatures. Solar Energy 81, 872–883.
Hamada, S., Ohta, T., 2010. Seasonal variations in the cooling effect of urban green areas on surrounding urban areas. Urban Forestry & Urban Greening 9, 15–24.
Hawkins, T.W., Brazel, A.J., Stefanov, W.L., Bigler, W., Saffell, E.M., 2004. The role of rural variability in urban heat island determination for Phoenix, Arizona. Journal of Applied Meteorology 43, 476–486.
Hedquist, B.C., Brazel, A.J., 2014. Seasonal variability of temperatures and outdoor human comfort in Phoenix, Arizona, U.S.A. Building and Environment 72, 377–388.
Höppe, P. 1999. The physiological equivalent temperature - a universal index for the biometeorological assessment of the thermal environment. Int J Biometeorol. 1999 Oct;43(2):71-5.
Martin, C.A., Busse, K., Yabiku, S., 2007. North Desert Village: The effect of landscape manipulation on microclimate and its relation to human landscape preferences. HortScience 42, 853-854.
Matzarakis, A., Rutz, F., Mayer, H., 2010. Modelling radiation fluxes in simple and complex environments: Basics of the RayMan model. International Journal of Biometeorology 54, 131–139.
Middel, A., Häb, K., Brazel, A.J., Martin, C., Guhathakurta, S., 2014. Impact of urban form and design on microclimate in Phoenix, AZ. Landscape and Urban Planning 122, 16–28.
Middel, A., Häb, K., Brazel, A.J., Martin, C., Ruddell, B.L., 2014. Linking shading patterns of trees in Phoenix, AZ, to thermal comfort. Presentation at the 11th Symposium on the Urban Environment, American Meteorological Society 94th Annual Meeting, February 2-6, 2014, Atlanta, GA.
Myint, S.W., Wentz, E.A., Brazel, A.J., Quattrochi, D.A., 2013. The impact of distinct anthropogenic and vegetation features on urban warming. Landscape Ecology 28, 959–978.
Simpson, J.R., 1998. Urban forest impacts on regional cooling and heating energy use: Sacramento County case study. Journal of Arboriculture 24, 201–214.
Stabler, L.B., Martin, C.A., Brazel, A.J., 2005. Microclimates in a desert city were related to land use and vegetation index. Urban Forestry & Urban Greening 3, 137-147.
Stewart, I.D., Oke, T.R., 2012. Local Climate Zones for Urban Temperature Studies. Bulletin of the American Meteorological Society 93, 1879–1900.
Sun, C.-Y., Brazel, A.J., Chow, W.T.L., Hedquist, B.C., Prashad, L., 2009. Desert heat island study in winter by mobile transect and remote sensing techniques. Theoretical and Applied Climatology 98, 323–335.