Cool roofs discussion paper final 61210 -...
23
South Australia’s Cool Roofs Regulation A Discussion Paper Government of South Australia December 2010
Transcript of Cool roofs discussion paper final 61210 -...
South Australia’s Cool Roofs Regulation
A Discussion Paper
Government of South Australia
December 2010

Discussion Paper – South Australia’s Cool Roofs Regulation 2
Invitation to Comment
Comment is sought from industry and the community on the issues and questions set out in this paper as well as issues relating to cool roofs in South Australia generally. It is intended that submissions be made available on our website at www.climatechange.sa.gov.au. Please mark your submission as 'Confidential' if you do not wish your submission to be made public. If you wish certain information not to be disclosed, please indicate what sections of your submission are confidential. These sections will not be published and will be replaced with an appropriate confidentiality statement. All submissions received by Friday 11 February 2011 will be considered. Submissions will be accepted by e‐mail or as written copy. Please e‐mail your submission to [email protected]. Written submissions should be forwarded to: Mr Andrew Klos (Attention Cool Roofs Regulation) Department of the Premier and Cabinet
Post: GPO Box 2343 ADELAIDE SA 5001 By hand: Level 6 Chesser House 91‐97 Grenfell Street ADELAIDE SA 5000
For enquiries phone (08) 8463 7995 or email [email protected]
Disclaimer: This paper is for discussion purposes only and is not a statement of policy from the Government of South Australia. Printed on 100% recycled paper © Government of South Australia December 2010

Discussion Paper – South Australia’s Cool Roofs Regulation 3
Contents
Introduction....................................................................................................................................................... 4
Section A............................................................................................................................................................ 6
A.1 Background and policy context ............................................................................................................... 6
A.1.1 South Australian policy context ....................................................................................................... 6
A.1.2 Rationale for supporting a cool roofs approach .............................................................................. 6
A.1.3 International cool roofs experience................................................................................................. 7
A.2 South Australia’s Building Regulations.................................................................................................... 8
A.2.1 Building Code of Australia ................................................................................................................ 8
A.3 Assessment of Cool Roofs Impacts........................................................................................................ 11
A.3.1 Cooling/heating demand................................................................................................................ 12
A.3.3 Greenhouse emissions ................................................................................................................... 13
A.3.4 Peak energy demand...................................................................................................................... 14
A.3.5 Albedo ............................................................................................................................................ 15
A.3.6 Heat island...................................................................................................................................... 15
Section B.......................................................................................................................................................... 16
B.1 Description of Options........................................................................................................................... 16
B.1.1 No action ........................................................................................................................................ 16
B.1.2 Cool roofs on commercial buildings within BCA ............................................................................ 16
B.2 Financial Considerations........................................................................................................................ 16
B.2.1 Assessment of Costs ....................................................................................................................... 16
B.2.2 Assessment of Benefits .................................................................................................................. 17
B.2.3 Cost Benefit Ratio and NPV Assessment ........................................................................................ 18
Section C .......................................................................................................................................................... 19
C.1 Preferred Option ................................................................................................................................... 19
C.2 Feedback................................................................................................................................................ 19
APPENDIX 1 ‐ Heating and Cooling Demand for Residential Houses .............................................................. 20
APPENDIX 2 ‐ Heating and Cooling Demand for Commercial Buildings .......................................................... 21
APPENDIX 3 – Electricity Cost and Greenhouse Gas Emissions Reductions.................................................... 22
APPENDIX 4 – Net Present Value..................................................................................................................... 23

Discussion Paper – South Australia’s Cool Roofs Regulation 4
Introduction On 31 August 2010, the Premier announced that an evaluation would be undertaken into the benefits of low absorptance1 roofs otherwise known as “cool roofs” for South Australia. Cool roofs or low surface absorptance can be achieved by simply using a lighter paint colour or by using more sophisticated coating systems. Research shows that cool roofs reflect more of the sun’s energy away from the roof structure reducing both the roof’s temperature and the heat transfer into the roof cavity. This results in:
• reductions in the building’s cooling load and the corresponding reduction of cooling demand and energy consumption in summer,
• reduced heating of the surrounding outside air contributing to a reduction in the heat island effect, and
• an increase in the surface albedo2 and a corresponding reduction in the greenhouse effect. However, cool roofs can also result in cooler conditions for a building during winter months and can incur a penalty in terms of increased heating load. This paper discusses the most suitable uses of cool roofs and proposes their use for new or refurbished commercial buildings in the Building Code of Australia (BCA) Class 5 to Class 9 that have flat roofs and air conditioning. These buildings include:
− office buildings used for professional or commercial purposes (Class 5). − shops or other buildings used for the sale of goods by retail or supply of services direct to the public
(Class 6). − buildings which are carparks or used for storage for sale of produce by wholesale (Class 7). − laboratories or buildings in which a handicraft or process for production is carried out (Class 8). − buildings of public nature such as a healthcare building, an assembly building or an aged care
building (Class 9). See the BCA for a complete description of building classes affected by this proposal. Subject to the findings of this review, it is proposed to amend the Development Regulations 2008 pursuant to the Development Act 1993, to mandate the use of cool roofs on new or refurbished commercial buildings. It is intended that this requirement be implemented in the BCA from 2012. This would mean that the new requirement would be that roofs of air‐conditioned commercial buildings that are constructed new or refurbished on the basis of a development approval would have an upper surface solar absorptance value of not more than 0.4. . The purpose of the discussion paper is to seek input on the scope of the initiative. Views are also sought about the estimated costs and benefits of this initiative particularly in relation to the additional cost of supplying specialised coating systems that have low solar absorptance. The aim of this consultation process is to ensure that the scope of this initiative provides the greatest benefit for the community.
1 absorptance, absorption factor n (Physics / General Physics) Physics a measure of the ability of an object to absorb radiation, equal to the ratio of the absorbed radiant flux to the incident flux. Collins English Dictionary – Complete and Unabridged © HarperCollins Publishers 1991, 1994, 1998, 2000, 2003 2 albedo, from Latin meaning “whiteness” defines the ability of an object to reflect light from light sources such as the Sun. Defined as the ratio of total reflected to incident electromagnetic radiation.
Discussion Paper – South Australia’s Cool Roofs Regulation 5
The paper provides an outline of the policy context and the rationale for the cool roofs regulation. The government’s evaluation of cool roof opportunities is provided, including the differential costs and benefits of the following options:
1. no action; 2. mandating a cool roofs requirement for flat roofs of air conditioned commercial buildings of BCA
Class 5 through to 9.
Discussion Paper – South Australia’s Cool Roofs Regulation 6
Section A
A.1 Background and policy context
A.1.1 South Australian policy context
In 2007, the Government of South Australia led the nation by introducing the Climate Change and Greenhouse Emissions Reduction Act 2007, which set targets to cut the State’s greenhouse emissions by 60 per cent of 1990 levels by 2050 and to achieve a 20 per cent of renewable energy by 2014. The latter target is on track to being met and a new target of 33 per cent has been set for 2020.
Government action has also resulted in a large uptake of renewable energy in South Australia including wind power and domestic photovoltaic systems supported by a feed‐in scheme.
South Australia’s Strategic Plan provides the Government’s commitment to improving the energy efficiency of dwellings. As part of this commitment, the Government has introduced stringent Minimum Energy Performance Standards (MEPS) for appliances including air conditioners and increased the requirement for thermal efficiency of new dwellings to 6 stars.
Recent changes to the Building Code of Australia (BCA) also provide improvements in energy efficiency of buildings. In relation to cool roofs, for residential buildings, the BCA provides a level of flexibility in achieving combined thermal performance of roofs and ceilings so that, for example, a roof structure comprising of a light surface colour can incorporate less ceiling insulation in its design and vice versa.
This flexibility in relation to insulation requirements is not provided for commercial buildings and there is therefore no existing incentive to install roofs with a lower upper surface solar absorptance value.
A.1.2 Rationale for supporting a cool roofs approach
The architecture of many ancient civilizations around the world has long recognized the benefits of light‐coloured external surfaces on buildings to improve the internal comfort levels in hot climates. The problem of global warming has renewed interest in products with low solar surface absorptance both in North America and in the European Union. There is a growing understanding in these jurisdictions that these products can provide a number of benefits including a reduction in the cooling demand in summer, increased albedo of urban areas, reduction in the heat island effect and a reduction in greenhouse gas emissions. Cooling and heating demand A roof coated with low solar surface absorptance paint reflects much of the sun’s energy thereby reducing the temperature of the roof’s surface and the amount of heat transfer into the roof cavity and eventually into the building’s living space. This reduces the demand for cooling to maintain appropriate comfort levels resulting in reduced electricity use as well as reductions in greenhouse gas emissions generated by power stations. While there usually is an increase in the demand for heating in winter, for cool roofs introduced in the right locations and the right building types this so called “winter penalty” can be insignificant and is much lower than the reduction in the cooling load.
Cool roofs therefore have the potential to achieve a significant reduction in the annual cooling/heating demand from buildings at a very low cost, especially if light coloured paints are incorporated into the building design from new.
Discussion Paper – South Australia’s Cool Roofs Regulation 7
Reduction in cooling and heating energy The effect of cool roofs on the cooling and heating demand of a building will have a direct impact on the building’s annual energy use. For cool roofs introduced in warmer areas and in flat roofed commercial buildings there is a reduction in the cooling energy requirement and a marginal increase in the heating demand.
The magnitude of this impact on energy use in the building will also depend on the type of appliances used for both heating and cooling and their respective energy efficiency performance. In the correct applications there is a significant net reduction in annual energy use when cool roofs are introduced. Reduction in greenhouse gas emissions The decrease in energy demand associated with appropriate cool roofs use can result in a corresponding reduction in the level of emissions of greenhouse gases and air pollutants. The magnitude of this reduction depends on the greenhouse intensity of the local electricity system. Importantly the seasonal performance of the electricity system needs to be incorporated into the analysis, which recognises the peakiness of electricity demand in places like South Australia. The marginal greenhouse intensity of South Australian electricity generation is higher at times of high demand and this favours the use of cool roofs in the context of reduced demand for cooling. Peak energy demand The reduction in electricity demand at times usually associated with peak demand has the potential to postpone the augmentation of the electricity generation and distribution system. South Australia has a particularly high electricity demand during heat waves and the reduced cooling demand from greater use of cool roofs has the potential to postpone the need for this augmentation. As augmentation costs are ultimately recovered from consumers through electricity tariffs and charges, any delay in augmentation investment contributes to postponing electricity price increases for consumers. Other There are other potential benefits of cool roofs that should be considered in this assessment. Cool roofs can increase albedo or “whiteness” of the urban environment and like the snow and ice covered polar ice caps contribute to reflecting visible light back into space thus reducing the greenhouse effect. Research indicates that reducing the upper surface solar absorptance of 1m2 of a roofs area by 0.25 is equivalent to removing 64 kg of CO2 eq emissions from the atmosphere. However, this is a one off reduction only for the duration of the roofs existence and is not cumulative like actual greenhouse reductions from reduced electricity use. Once the roof is removed or its absorptance increases this benefit is diminished. Cool roofs can also reduce the heating of the local air thereby reducing the heat island effect.
An important benefit of cool roofs is their ability to improve summer comfort levels in buildings that are not air conditioned.
A.1.3 International cool roofs experience
Internationally, the interest in cool roofs has gained prominence as one of the measures that could be relatively easily delivered to address some of the drivers of climate change along with other greenhouse gas emissions mitigation measures.

Discussion Paper – South Australia’s Cool Roofs Regulation 8
In North America cool roofs have been strongly promoted by the White Roofs Alliance3, a non‐for profit organisation developed by a consortium of scientists and environmental leaders. The White Roof Alliance aims to partner with the top 100 largest cities under a “100 Cool Cities” initiative to implement its cool roof program across the world.
New York City has implemented a NYC 0CoolRoofs program with a goal of 1 million square feet of cool roofs applied to existing flat roofs. The program has a strong component of volunteer engagement including NYC Civic Corps and NYC Service.
In July 2010, the U.S. Department of Energy (DOE) announced a series of initiatives to implement cool roofs across the DOE and U.S. Federal Government facilities. As part of this announcement, the Secretary of Energy, Steven Chu, directed that cool roofs be installed whenever cost effective over the lifetime of the roof, when constructing or replacing old roofs. The DOE also provides cool roofs related resources to the public such as on‐line calculators to assess the benefits of cool roofs and guidelines for cool roofs installation.
Cool roofs are also being evaluated in the European Union through a multinational project funded by the European Commission. The project is aimed at the creation of an EU Cool Roofs Council and the development of material supporting and promoting cool roofs. It is expected that the project will be finalised in 2011.
A.2 South Australia’s Building Regulations
A.2.1 Building Code of Australia
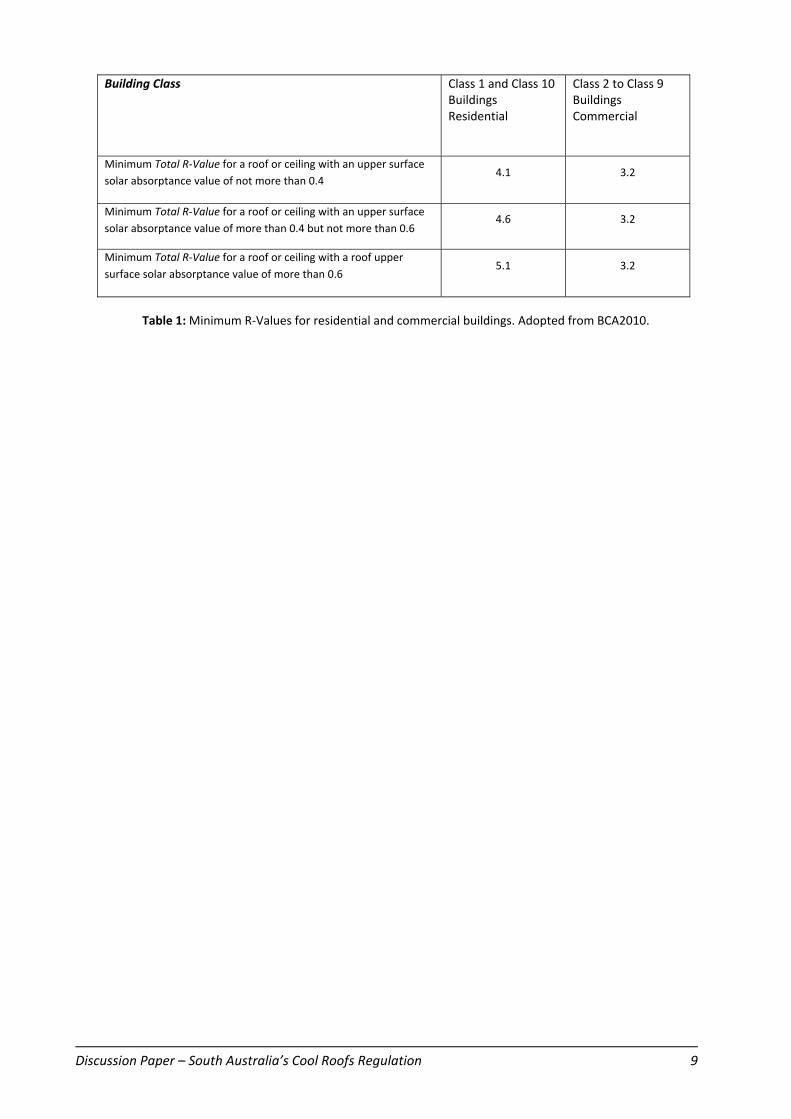
The Deemed‐to‐Satisfy Provisions of the Building Code of Australia (BCA) deal with energy efficiency of roofs and ceilings by establishing minimum total R‐Values, (thermal resistance values) for three ranges of roof upper surface solar absorptance values for each climate zone. Table 1 details the minimum R‐Values for residential and commercial buildings for the South Australian climate zones 4, 5 and 6 for each of the upper surface solar absorptance ranges. Climate zones 4, 5 and 6 are detailed in Figure 1.
For Class 1 and Class 10 buildings, the BCA 2010 sets minimum total R‐Values (or measure of thermal resistance) for combined thermal performance of the ceiling and roof structure at various levels of solar absorptance of the roofs’ upper surface (see Table 1). The installation of cooler roofs can therefore reduce the requirement for insulation (R4.1). This provides a saving4 of about $2.76 per m2 in insulation costs making cool roof installations more desirable. Hot roofs with an upper surface absorptance value of more than 0.6 are required to install more insulation (R5.1).
For buildings in BCA Class 2 to Class 9 the total R‐Value is fixed at R3.2, regardless of roof absorptance. There is no flexibility in relation to the requirement for insulation and this therefore provides no existing incentive for the use of cool roofs.
3 http://www.whiteroofsalliance.org
4 “Indicative Elemental Estimate – Cost Impact of Modification to BCA Energy Efficiency Requirements”, BMT & Associates, September 2009.
Discussion Paper – South Australia’s Cool Roofs Regulation 9
Building Class Class 1 and Class 10 Buildings Residential
Class 2 to Class 9 Buildings Commercial
Minimum Total R‐Value for a roof or ceiling with an upper surface solar absorptance value of not more than 0.4
4.1 3.2
Minimum Total R‐Value for a roof or ceiling with an upper surface solar absorptance value of more than 0.4 but not more than 0.6
4.6 3.2
Minimum Total R‐Value for a roof or ceiling with a roof upper surface solar absorptance value of more than 0.6
5.1 3.2
Table 1: Minimum R‐Values for residential and commercial buildings. Adopted from BCA2010.

Discussion Paper – South Australia’s Cool Roofs Regulation 10
Figure 1: BCA Climate Zones for South Australia. Adopted from BCA.

Discussion Paper – South Australia’s Cool Roofs Regulation 11
A.3 Assessment of Cool Roofs Impacts Thermal simulation modelling of a representative sample of residential houses and commercial buildings has been carried out to assess the impact of cool roofs on cooling and heating demand 5. The simulation included assessment of thermal performance in the different climate zones across South Australia and roof solar absorptance values from 0.3 to 0.9. Residential building assessment The AccuRate simulation software was used to assess four residential buildings including:
• House 1 ‐ Small two story. R3.0 between floors. Living area 193.3 m2
• House 2 ‐ Small single story. Living Area 150 m2
• House 3 ‐ Large two story. Living Area 303 m2
• House 4 ‐ Large single story. Living Area 193.6 m2 The houses were assumed to incorporate the following features and these are typically required to achieve a 6 star energy efficiency rating:
• Metal deck roofs, medium colour, R4.0 or R5.0 bulk ceiling insulation
• Brick veneer walls R2.5 bulk insulation
• Tiles to living area floors, carpet to bedrooms
• Insulation to wall between garage and house R2.5
• Generic standard windows U7.32 SHGC 0.77 The following AccuRate climate zones were simulated for residential buildings:
• Climate 16 equivalent to BCA climate zone 5, eg. Adelaide
• Climate 27 equivalent to BCA climate zone 4, eg. Berri
• Climate 45 equivalent to BCA climate zone 4, eg. Pt Augusta
• Climate 61 equivalent to BCA climate zone 6, eg. Mt Gambier
• Climate 59 equivalent to BCA climate zone 6, eg. Mt Lofty Assessment was carried out to evaluate both flat and pitched roof configurations. Commercial building assessment EnergyPlus building simulation software package was used to assess five common commercial buildings using standard modelling assumptions in accordance with verification method JV3, the alternative solution to Section J of the Building Code of Australia 2010. Section J is the regulatory framework for minimum energy efficiency provisions in commercial buildings and was therefore taken as the benchmark for building energy consumption for new commercial construction. Buildings assessed as part of this analysis included:
• Class 5 (Office): 360 m2, modular construction, steel frame, steel wall cladding and R1.9 wall insulation, suspended timber floor, enclosed sub‐floor, moderate glazed area.
• Class 5 (Office): 582 m2 (ground floor), 728 m2 (first floor), concrete slab, steel wall cladding and insulation to BCA J1.5 (R2.8), moderate glazed area.
• Class 6 (Shop): 453 m2, concrete slab, 150mm tilt‐up concrete structural walls and insulation to BCA J1.5 (R1.4), shopfront glazing to 60% of external facade, shading.
• Class 8 (Workshop): 5220 m2, concrete slab, tilt‐up concrete structural walls and insulation to BCA J1.5 (R1.4), roof height 7.8 m, no glazing.
5 “SA Cool Roofs Project Report”, Sustainability House, October 2010.
Discussion Paper – South Australia’s Cool Roofs Regulation 12
• Class 9b (School): 132 m2, modular construction, steel frame, steel wall cladding and R1.9 wall insulation, suspended timber floor, enclosed sub‐floor, moderate glazed area.
Commercial buildings were simulated for the following climate zones:
• BCA climate zone 4, eg. Woomera
• BCA climate zone 5 eg. Adelaide Airport
• BCA climate zone 6, eg. Mount Gambier The thermal performance of each building type was assessed assuming a roof Total R‐Value for roofs and ceilings of R3.2 and R4.2 for BCA climate zone 4 and 5 and R3.2 for climate zone 6. All roofs were assumed to be flat (0 to 5 degrees pitch) and of insulated sheet construction. Flow‐on impacts In addition, the flow on impacts of cool roofs on electricity consumption, greenhouse gas emissions and peak electricity demand were evaluated6. This included the evaluation of the effect of cool roofs on energy and electrical system augmentation costs in South Australia. Importantly, the evaluation of electricity costs included assessment of the typical air conditioning technologies used in South Australia for heating and cooling as well as the estimation of the local marginal electricity greenhouse intensity in the summer and winter periods.
A.3.1 Cooling/heating demand
Residential buildings
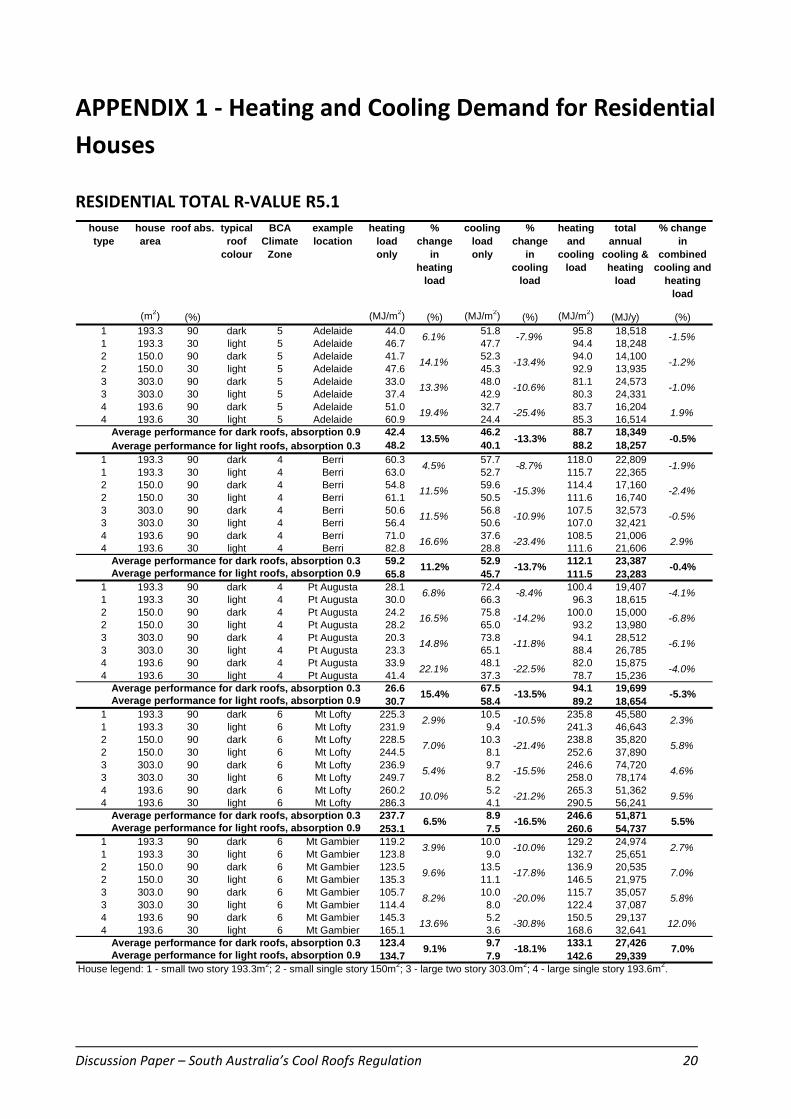
A summary of results for cooling and heating demand for residential buildings (expressed in MJ/m2) is included in Appendix 1. The results indicate that while cool roofs are beneficial in summer by reducing the house cooling demand there is a corresponding reduction in heat transfer into the building in winter. This results in a so called “winter penalty” which is undesirable especially in colder climates and results in an increase in the winter heating demand that can be greater than the reduction in cooling demand in summer. For the Adelaide plains region (BCA Climate Zone 5) the net change in the combined cooling and heating load between a cool roof and a dark roof ranges between ‐ 1.5% and +1.9%. This is despite the fact that the cooling demand is reduced by between 8% and 25% for each building.
Climatic conditions have an important influence on the effectiveness of cool roofs. Cool roofs appear to be more likely to provide an annual benefit in a climate with hot summers and mild winters where winter heating demand is already low. This is evident when comparing northern regions of South Australia with the South East. For the four houses simulated, cool roofs in Pt Augusta reduce cooling/heating demand by between 4% and 7%. In Mt Gambier there is an increase of between 3% and 12% in cooling/heating demand, primarily driven by an increase in heating demand.
While cool roofs deliver reductions in cooling/heating demand in the north of South Australia, in general these are small and on average there is little benefit, if any, from cool roofs in residential properties across the State.
6 “Energy Market Impacts of Cool Roofs”, st.kitts.associates, October 2010.

Discussion Paper – South Australia’s Cool Roofs Regulation 13
Commercial buildings
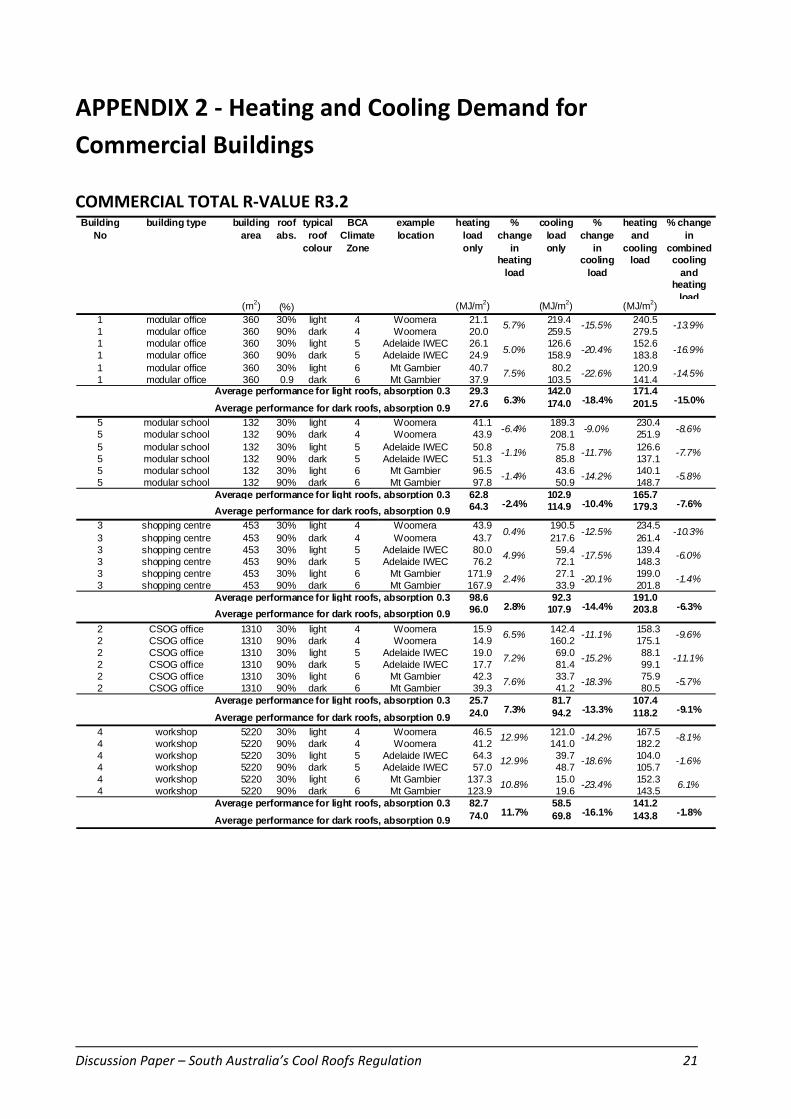
Assessment of cool roofs for commercial buildings included simulation of several commercial buildings representative of the BCA building classes 5, 6, 8 and 9b (see Section A.3 for building description). Flat roofs (between 0o and 5o pitch) were modelled for these buildings.
Analysis indicates that the magnitude of the winter penalty is very dependant on the slope of the roof as well as other energy efficiency measures such as the level of pre‐existing ceiling insulation. In winter, a flatter roof located at higher latitudes results in the sun’s rays’ hitting the roof less directly. This has the effect of reducing the amount of energy captured by the roof regardless of roof colour or surface absorptance. The winter penalty is therefore lower in real terms for flat roofs. The winter penalty is also less of an issue for buildings with an existing internal heating load such as offices and public spaces because those typically have a cooling demand throughout the year, due to heat generated from internal sources such as computers and people. In summer, the cooling benefit of cool roofs is retained because the sun is higher in the sky and its rays hit the roof more directly. For flat roofs in commercial buildings there is therefore a general reduction in the combined annual demand for air conditioning (both heating and cooling). Appendix 2 includes heating and cooling load comparisons for commercial buildings. There is a reduction in cooling load from about 9% to 23% compared to a heating load increase of no more than 11% and typically much lower. On average the combined cooling/heating energy demand is reduced by 10.1% in northern South Australia, by 8.7% around metropolitan Adelaide and by 4.2% in the South‐East.
A.3.3 Greenhouse emissions
Building on the analysis of cooling and heating demand, the evaluation of greenhouse emission impacts involves the estimation of the greenhouse intensities of electricity generation and natural gas use in South Australia as well as an understanding of the mix of appliances used for cooling and heating and their respective energy efficiencies. Residential This study assumes that reverse cycle air conditioners (RCAC) are installed in the majority (80% to 90%) of new residential developments7. Of the remaining 10%‐20%, it is assumed that gas heating is used in winter and evaporative air conditioners used in summer. Table 28 lists the assumptions that have been used for the typical energy efficiencies for these devices (RCAC EER 3.1 & COP3.0; gas 90%; evaporative COP10.0), the marginal intensity of electricity consumed in South Australia, and the greenhouse gas intensities for cooling and heating. Table 2 indicates that, on this basis, the greenhouse intensity of cooling ranges between 66 and 72 kg/GJ and is around 71 kg/GJ for heating. Importantly, the average greenhouse intensities for cooling and heating are coincidently similar because the higher marginal greenhouse intensity of electricity generation in summer is offset by the more energy efficient cooling delivered by evaporative air conditioners in the same season and the relatively high greenhouse intensity of gas heating in winter. The previous section has demonstrated that for residential buildings, cool roofs have only a small impact on the combined demand for cooling and heating. Given that the estimated greenhouse intensity of cooling
7 “Energy Market Impacts of Cool Roofs”, p.3, st.kitts.associates, October 2010.
8 “Energy Market Impacts of Cool Roofs”, p.8, st.kitts.associates, October 2010.

Discussion Paper – South Australia’s Cool Roofs Regulation 14
and heating in South Australia is similar there are therefore no consequential benefits of cool roofs in relation to greenhouse gas emissions reductions in the residential sector. Commercial Due to a wide range of uses, it is difficult to estimate accurately the mix of equipment used for space heating and cooling in the commercial sector. This analysis therefore assumes greenhouse gas intensity of 70 kg/GJ as estimated for the residential sector for both heating and cooling. On this basis, the relative reductions of greenhouse gas emissions arising from the introduction of cool roofs are the same as the reductions in the combined heating/cooling demand of 10.1% in the north, 8.7% in metropolitan Adelaide and 4.2% in the South‐East. This amounts to an annual reduction in greenhouse gas emissions of 1.66kg, 0.89kg and 0.39kg, respectively for every square metre of installed cool roof (see Table 2).
A.3.4 Peak energy demand
The assessment of peak load in the context of cool roofs is important because of the peakiness of electricity demand experienced during summer heat waves in South Australia. The South Australian electricity grid is designed to cope with times of very high demand and this occurs for relatively short periods of time. Similarly, there are many generators in South Australia that lay idle for most of the year only to begin producing electricity at times of high demand. The increasing use of air conditioners only compounds the problem and increases the need for augmentation of the electrical system both for distribution infrastructure and for generation. Cool roofs have the potential to apply a downward pressure on this growth. It is difficult to accurately predict peak load demand from thermal simulation modelling because this process assumes the availability of heating and cooling capacity throughout the day. In reality, occupancy patterns are less regular and often result in air conditioners being activated later in the day and required to run at maximum capacity to achieve a comfortable environment. For dwellings in metropolitan Adelaide (BCA Climate Zone 5), it is estimated that the average peak demand impact of reducing the roof surface absorptance of a typical new residential dwelling from 0.9 to 0.3 to be approximately 0.2kW9. This amounts to an estimated reduction in the cost of electrical system augmentation of around $300 to $600 per cool roof installation or about $1.50 to $3.00 per square metre. This benefit however accrues to the market as a whole and not to the individual homeowner. Under current arrangements the reduction of peak demand therefore provides little incentive for cool roof installation for the homeowner. Assessment of commercial buildings assumes a similar peak demand benefit for Climate Zone 5. The peak benefit for Climate Zones 4 and 6 is assumed as a ratio of actual electricity savings in those Zones when compared to Zone 5.
9 “Energy Market Impacts of Cool Roofs”, p.12, st.kitts.associates, October 2010.
Discussion Paper – South Australia’s Cool Roofs Regulation 15
A.3.5 Albedo
Research10 indicates that increasing the albedo of urban areas has the potential to reduce the greenhouse effect. Akbari et al estimate that on a global basis increasing the net albedo for urban areas by about 0.1 would induce a negative radiative forcing on the earth equivalent to offsetting about 44 Gt of CO2 emissions. Although the impact of albedo on the greenhouse effect is factual, given that roof areas constitute only a small proportion of the urban landscape, the installation of cool roofs will only make a small difference to the earth’s albedo and therefore result in a marginal reduction in albedo affected global warming.
A.3.6 Heat island
Laboratory tests indicate that surfaces coated with low solar absorptance materials or simply lighter colour paints reach temperatures that are significantly lower than surfaces coated with darker paints. Depending on conditions the difference in temperature can be as high as 28oC11 and this contributes directly to a reduction in the heat transferred into the roof cavity when applied to roofs. This higher surface temperature also results in the surrounding external air to be heated and this contributes to the heat island effect experienced in many cities around the world. The heat island effect, where urban areas experience air temperatures several degrees higher than the surrounding countryside, is driven by heat radiated from urban infrastructure, such as footpaths, roads and buildings that absorb the sun’s radiant heat. Given that roofs constitute a relatively small proportion of the urban landscape, their contribution to the heat island effect is expected to be relatively small.
10 “Global cooling: increasing world‐wide urban albedos to offset CO2”. Hashem Akbari et al. Climate Change, 2009.
11 “Guidelines for Selecting Cool Roofs”, U.S. Department of Energy, July 2010.
Discussion Paper – South Australia’s Cool Roofs Regulation 16
Section B
B.1 Description of Options
B.1.1 No action
As stated above, for South Australian conditions, the Building Code of Australia establishes a fixed minimum total R‐Value of R3.2 for commercial buildings irrespective of the roofs upper surface solar absorptance value12. Compared to residential buildings (Class 1 and 10) where cool roofs can be installed with less insulation than hot roofs, there is no incentive to install low absorptance roofs in commercial buildings. Allowing the status quo to continue may result in owners and users of commercial buildings missing out on the opportunity of making savings in cooling costs and reducing their greenhouse gas emissions profile.
B.1.2 Cool roofs on commercial buildings within BCA
The proposed change to the Development Regulations in the first instance and later to the Building Code of Australia through a State variation would apply to new commercial buildings and those commercial buildings that are refurbished under a development approval where the BCA applies. This would apply to buildings that are air conditioned and have flat roofs. The new requirement would mandate the installation of roofs with a roof upper surface solar absorptance value of not more than 0.4.
B.2 Financial Considerations
B.2.1 Assessment of Costs
Cool roofs can be achieved by simply using lighter colour paints or more specialised coating materials. To assess the cost of a requirement for cool roofs it is important to understand the type of materials that are commonly used in commercial applications. There are few, if any, costs when the change is applied from one painted colour to another especially if applied on a flat roof with few amenity issues. However, research indicates that there is a cost premium for painted materials when compared to those that are galvanised or zinc aluminium coated. It is estimated that the difference between proprietary products such as Zincalume and Colorbond is of the order of $3.30 per square metre. It is assumed that the current proportion of Zincalume to Colorbond installations, or similar, is about 50/50 and therefore the marginal cost difference is small, assumed to be on average around $1.65 per square metre across all relevant buildings.
12 Table J1.3a, Roofs and Ceilings – Minimum Total R‐Value For Each Climate Zone, BCA2010. Vol. 1.
Discussion Paper – South Australia’s Cool Roofs Regulation 17
B.2.2 Assessment of Benefits
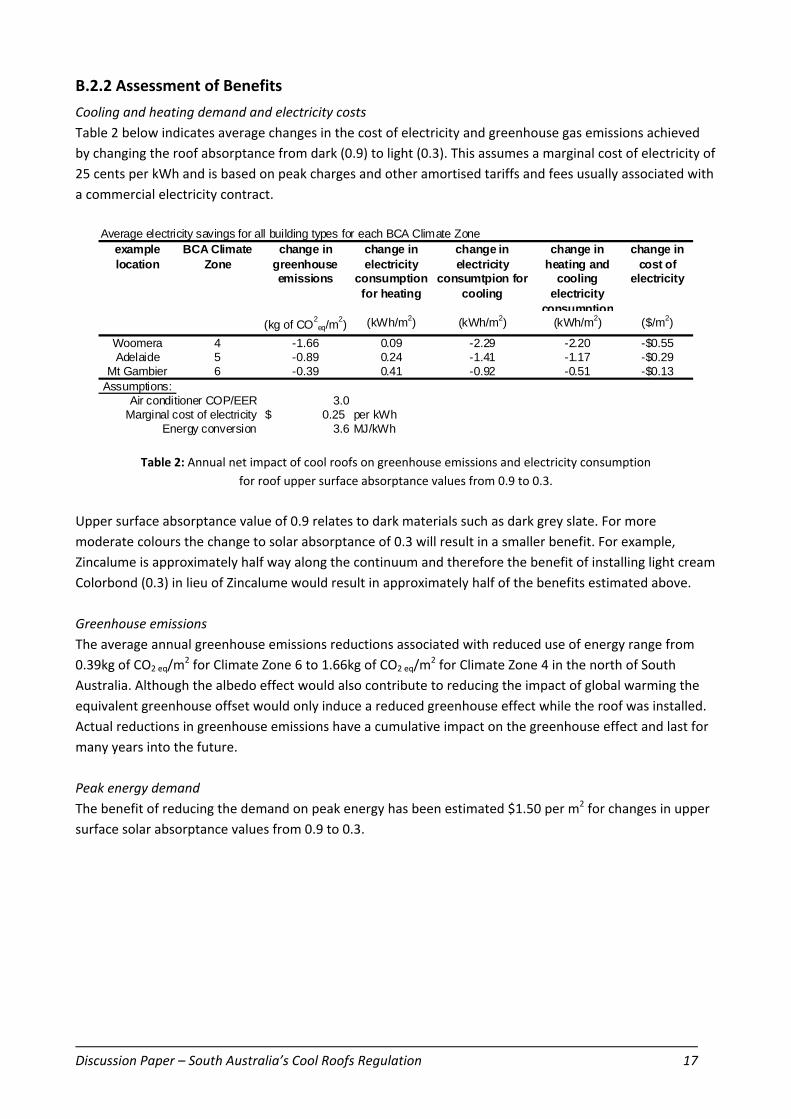
Cooling and heating demand and electricity costs Table 2 below indicates average changes in the cost of electricity and greenhouse gas emissions achieved by changing the roof absorptance from dark (0.9) to light (0.3). This assumes a marginal cost of electricity of 25 cents per kWh and is based on peak charges and other amortised tariffs and fees usually associated with a commercial electricity contract.
Average electricity savings for all building types for each BCA Climate Zoneexample location
BCA Climate Zone
change in greenhouse emissions
change in electricity
consumption for heating
change in electricity
consumtpion for cooling
change in heating and
cooling electricity
consumption
change in cost of
electricity
(kg of CO2eq/m
2) (kWh/m2) (kWh/m2) (kWh/m2) ($/m2)
Woomera 4 -1.66 0.09 -2.29 -2.20 -$0.55Adelaide 5 -0.89 0.24 -1.41 -1.17 -$0.29
Mt Gambier 6 -0.39 0.41 -0.92 -0.51 -$0.13Assumptions:
Air conditioner COP/EER 3.0Marginal cost of electricity 0.25$ per kWh
Energy conversion 3.6 MJ/kWh
Table 2: Annual net impact of cool roofs on greenhouse emissions and electricity consumption for roof upper surface absorptance values from 0.9 to 0.3.
Upper surface absorptance value of 0.9 relates to dark materials such as dark grey slate. For more moderate colours the change to solar absorptance of 0.3 will result in a smaller benefit. For example, Zincalume is approximately half way along the continuum and therefore the benefit of installing light cream Colorbond (0.3) in lieu of Zincalume would result in approximately half of the benefits estimated above. Greenhouse emissions The average annual greenhouse emissions reductions associated with reduced use of energy range from 0.39kg of CO2 eq/m
2 for Climate Zone 6 to 1.66kg of CO2 eq/m2 for Climate Zone 4 in the north of South
Australia. Although the albedo effect would also contribute to reducing the impact of global warming the equivalent greenhouse offset would only induce a reduced greenhouse effect while the roof was installed. Actual reductions in greenhouse emissions have a cumulative impact on the greenhouse effect and last for many years into the future. Peak energy demand The benefit of reducing the demand on peak energy has been estimated $1.50 per m2 for changes in upper surface solar absorptance values from 0.9 to 0.3.
Discussion Paper – South Australia’s Cool Roofs Regulation 18
B.2.3 Cost Benefit Ratio and NPV Assessment
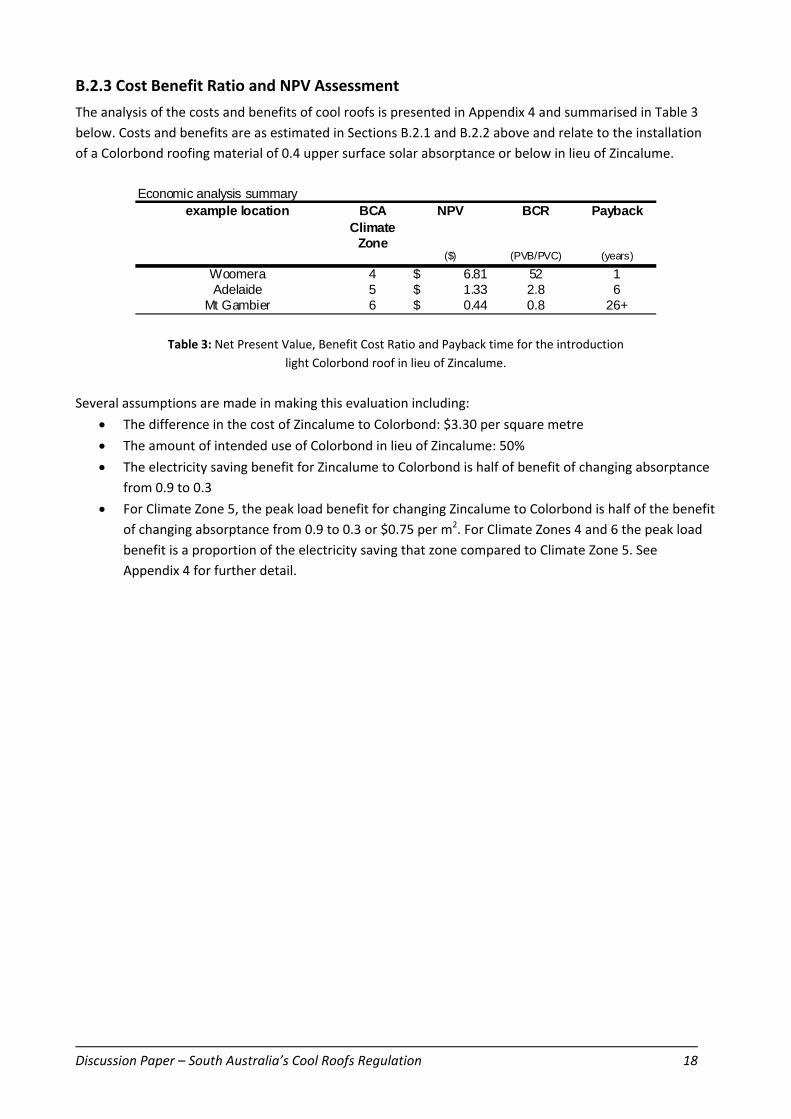
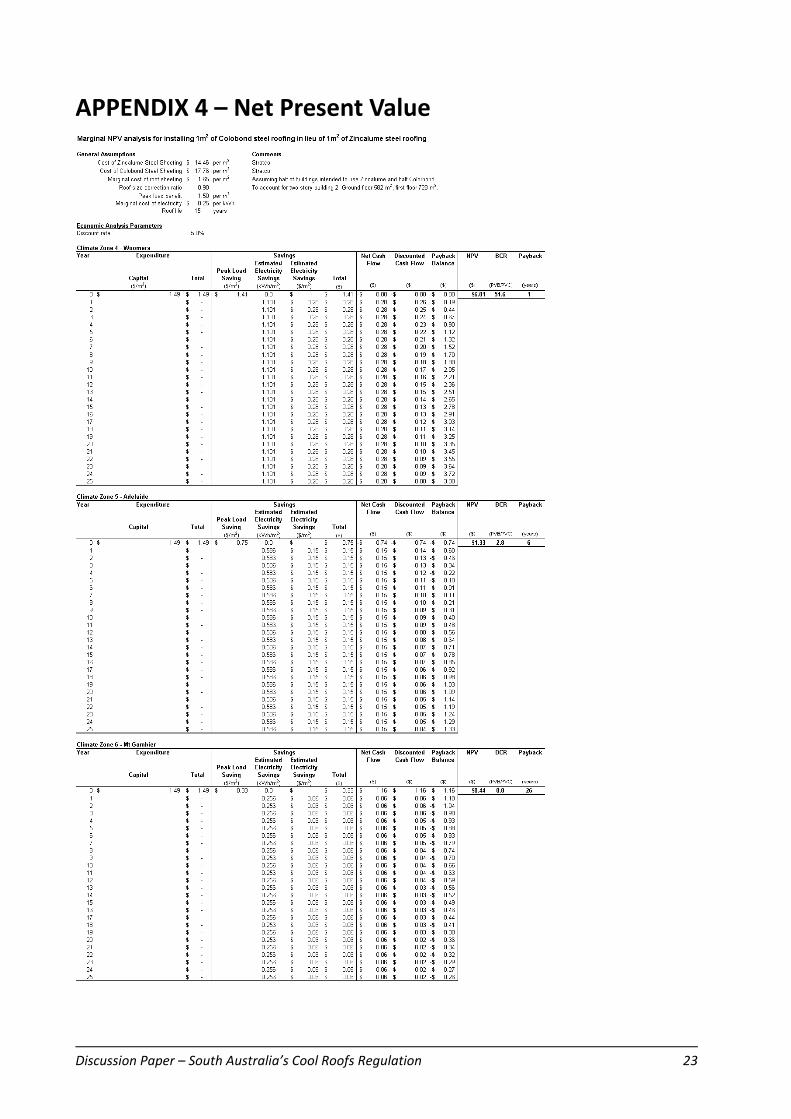
The analysis of the costs and benefits of cool roofs is presented in Appendix 4 and summarised in Table 3 below. Costs and benefits are as estimated in Sections B.2.1 and B.2.2 above and relate to the installation of a Colorbond roofing material of 0.4 upper surface solar absorptance or below in lieu of Zincalume.
Economic analysis summaryexample location BCA
Climate Zone
NPV BCR Payback
($) (PVB/PVC) (years)
Woomera 4 6.81$ 52 1Adelaide 5 1.33$ 2.8 6
Mt Gambier 6 0.44$ 0.8 26+
Table 3: Net Present Value, Benefit Cost Ratio and Payback time for the introduction light Colorbond roof in lieu of Zincalume.
Several assumptions are made in making this evaluation including:
• The difference in the cost of Zincalume to Colorbond: $3.30 per square metre
• The amount of intended use of Colorbond in lieu of Zincalume: 50%
• The electricity saving benefit for Zincalume to Colorbond is half of benefit of changing absorptance from 0.9 to 0.3
• For Climate Zone 5, the peak load benefit for changing Zincalume to Colorbond is half of the benefit of changing absorptance from 0.9 to 0.3 or $0.75 per m2. For Climate Zones 4 and 6 the peak load benefit is a proportion of the electricity saving that zone compared to Climate Zone 5. See Appendix 4 for further detail.

Discussion Paper – South Australia’s Cool Roofs Regulation 19
Section C
C.1 Preferred Option The preferred option is the introduction of a requirement for an upper surface solar absorptance value of not more than 0.4 for all flat roofs on air conditioned commercial buildings (Class 5 through to 9) in BCA Climate Zones 4 and 5. This includes all new roofs and roofs installed under a development approval where compliance with the Building Code of Australia is required. Subject to this consultation process, in the first instance, it is proposed that the new requirement would be introduced into the Development Regulations and later into the Building Code of Australia as a State variation applicable from around BCA2012.
C.2 Feedback The feedback received in response to this discussion paper will be taken into consideration in preparing the Development Regulations. Comments are sought in relation to the following:
• Further information on the estimated costs and benefits of this initiative particularly in relation to the additional cost of supplying lighter colour paints or specialised coating systems that have low solar absorptance as well as type and usage of roofing materials
• Contributions that will add to the assessment of the benefits of this initiative, in particular in relation to the following topics:
- Correlation of modelled results with actual heating and cooling demands - The mix of heating and cooling appliances in new commercial buildings and their relative
energy efficiencies - Peak demand related to cooling load including load control devices - Marginal peak electricity charges including tariffs and fees associated with the supply of
electricity in commercial buildings - Albedo and heat island effects
• Additional performance parameters that should be considered in relation to cool roofs (e.g. thermal emittance)
Discussion Paper – South Australia’s Cool Roofs Regulation 20
APPENDIX 1 ‐ Heating and Cooling Demand for Residential Houses
RESIDENTIAL TOTAL R‐VALUE R5.1 house type
house area
roof abs. typical roof
colour
BCA Climate
Zone
example location
heating load only
% change
in heating
load
cooling load only
% change
in cooling
load
heating and
cooling load
total annual
cooling & heating
load
% change in
combined cooling and
heating load
(m2) (%) (MJ/m2) (%) (MJ/m2) (%) (MJ/m2) (MJ/y) (%)1 193.3 90 dark 5 Adelaide 44.0 51.8 95.8 18,518 1 193.3 30 light 5 Adelaide 46.7 47.7 94.4 18,248 2 150.0 90 dark 5 Adelaide 41.7 52.3 94.0 14,100 2 150.0 30 light 5 Adelaide 47.6 45.3 92.9 13,935 3 303.0 90 dark 5 Adelaide 33.0 48.0 81.1 24,573 3 303.0 30 light 5 Adelaide 37.4 42.9 80.3 24,331 4 193.6 90 dark 5 Adelaide 51.0 32.7 83.7 16,204 4 193.6 30 light 5 Adelaide 60.9 24.4 85.3 16,514
Average performance for dark roofs, absorption 0.9 42.4 46.2 88.7 18,349 Average performance for light roofs, absorption 0.3 48.2 40.1 88.2 18,257
1 193.3 90 dark 4 Berri 60.3 57.7 118.0 22,809 1 193.3 30 light 4 Berri 63.0 52.7 115.7 22,365 2 150.0 90 dark 4 Berri 54.8 59.6 114.4 17,160 2 150.0 30 light 4 Berri 61.1 50.5 111.6 16,740 3 303.0 90 dark 4 Berri 50.6 56.8 107.5 32,573 3 303.0 30 light 4 Berri 56.4 50.6 107.0 32,421 4 193.6 90 dark 4 Berri 71.0 37.6 108.5 21,006 4 193.6 30 light 4 Berri 82.8 28.8 111.6 21,606
Average performance for dark roofs, absorption 0.3 59.2 52.9 112.1 23,387 Average performance for light roofs, absorption 0.9 65.8 45.7 111.5 23,283
1 193.3 90 dark 4 Pt Augusta 28.1 72.4 100.4 19,407 1 193.3 30 light 4 Pt Augusta 30.0 66.3 96.3 18,615 2 150.0 90 dark 4 Pt Augusta 24.2 75.8 100.0 15,000 2 150.0 30 light 4 Pt Augusta 28.2 65.0 93.2 13,980 3 303.0 90 dark 4 Pt Augusta 20.3 73.8 94.1 28,512 3 303.0 30 light 4 Pt Augusta 23.3 65.1 88.4 26,785 4 193.6 90 dark 4 Pt Augusta 33.9 48.1 82.0 15,875 4 193.6 30 light 4 Pt Augusta 41.4 37.3 78.7 15,236
Average performance for dark roofs, absorption 0.3 26.6 67.5 94.1 19,699 Average performance for light roofs, absorption 0.9 30.7 58.4 89.2 18,654
1 193.3 90 dark 6 Mt Lofty 225.3 10.5 235.8 45,580 1 193.3 30 light 6 Mt Lofty 231.9 9.4 241.3 46,643 2 150.0 90 dark 6 Mt Lofty 228.5 10.3 238.8 35,820 2 150.0 30 light 6 Mt Lofty 244.5 8.1 252.6 37,890 3 303.0 90 dark 6 Mt Lofty 236.9 9.7 246.6 74,720 3 303.0 30 light 6 Mt Lofty 249.7 8.2 258.0 78,174 4 193.6 90 dark 6 Mt Lofty 260.2 5.2 265.3 51,362 4 193.6 30 light 6 Mt Lofty 286.3 4.1 290.5 56,241
Average performance for dark roofs, absorption 0.3 237.7 8.9 246.6 51,871 Average performance for light roofs, absorption 0.9 253.1 7.5 260.6 54,737
1 193.3 90 dark 6 Mt Gambier 119.2 10.0 129.2 24,974 1 193.3 30 light 6 Mt Gambier 123.8 9.0 132.7 25,651 2 150.0 90 dark 6 Mt Gambier 123.5 13.5 136.9 20,535 2 150.0 30 light 6 Mt Gambier 135.3 11.1 146.5 21,975 3 303.0 90 dark 6 Mt Gambier 105.7 10.0 115.7 35,057 3 303.0 30 light 6 Mt Gambier 114.4 8.0 122.4 37,087 4 193.6 90 dark 6 Mt Gambier 145.3 5.2 150.5 29,137 4 193.6 30 light 6 Mt Gambier 165.1 3.6 168.6 32,641
Average performance for dark roofs, absorption 0.3 123.4 9.7 133.1 27,426 Average performance for light roofs, absorption 0.9 134.7 7.9 142.6 29,339
19.4%
6.5%
6.1% -7.9%
14.1%
13.3%
4.5%
11.5%
11.5%
16.6%
6.8%
16.5%
14.8%
22.1%
2.9%
7.0%
5.4%
10.0%
3.9%
9.6%
-13.4%
-10.6%
-25.4%
-10.5%
-21.4%
-15.5%
-21.2%
-10.0%
8.2%
13.6%
-8.7%
-15.3%
-10.9%
-23.4%
-8.4%
-14.2%
-11.8%
-22.5%
-20.0%
-30.8%
-1.5%
-1.2%
-1.0%
1.9%
-1.9%
-2.4%
-0.5%
2.9%
-4.1%
-6.8%
-6.1%
-4.0%
2.3%
5.8%
4.6%
-5.3%
House legend: 1 - small two story 193.3m2; 2 - small single story 150m2; 3 - large two story 303.0m2; 4 - large single story 193.6m2.
13.5% -13.3% -0.5%
11.2% -13.7% -0.4%
15.4% -13.5%
9.5%
-16.5% 5.5%
9.1% -18.1% 7.0%
12.0%
2.7%
7.0%
5.8%
-17.8%
Discussion Paper – South Australia’s Cool Roofs Regulation 21
APPENDIX 2 ‐ Heating and Cooling Demand for Commercial Buildings
COMMERCIAL TOTAL R‐VALUE R3.2 Building
Nobuilding type building
arearoof abs.
typical roof
colour
BCA Climate
Zone
example location
heating load only
% change
in heating
load
cooling load only
% change
in cooling
load
heating and
cooling load
% change in
combined cooling
and heating
load(m2) (%) (MJ/m2) (MJ/m2) (MJ/m2)
1 modular office 360 30% light 4 Woomera 21.1 219.4 240.5 1 modular office 360 90% dark 4 Woomera 20.0 259.5 279.5 1 modular office 360 30% light 5 Adelaide IWEC 26.1 126.6 152.6 1 modular office 360 90% dark 5 Adelaide IWEC 24.9 158.9 183.8 1 modular office 360 30% light 6 Mt Gambier 40.7 80.2 120.9 1 modular office 360 0.9 dark 6 Mt Gambier 37.9 103.5 141.4
Average performance for light roofs, absorption 0.3 29.3 142.0 171.4 Average performance for dark roofs, absorption 0.9 27.6 174.0 201.5
5 modular school 132 30% light 4 Woomera 41.1 189.3 230.45 modular school 132 90% dark 4 Woomera 43.9 208.1 251.95 modular school 132 30% light 5 Adelaide IWEC 50.8 75.8 126.65 modular school 132 90% dark 5 Adelaide IWEC 51.3 85.8 137.15 modular school 132 30% light 6 Mt Gambier 96.5 43.6 140.15 modular school 132 90% dark 6 Mt Gambier 97.8 50.9 148.7
Average performance for light roofs, absorption 0.3 62.8 102.9 165.7 Average performance for dark roofs, absorption 0.9 64.3 114.9 179.3
3 shopping centre 453 30% light 4 Woomera 43.9 190.5 234.53 shopping centre 453 90% dark 4 Woomera 43.7 217.6 261.43 shopping centre 453 30% light 5 Adelaide IWEC 80.0 59.4 139.43 shopping centre 453 90% dark 5 Adelaide IWEC 76.2 72.1 148.33 shopping centre 453 30% light 6 Mt Gambier 171.9 27.1 199.03 shopping centre 453 90% dark 6 Mt Gambier 167.9 33.9 201.8
Average performance for light roofs, absorption 0.3 98.6 92.3 191.0 Average performance for dark roofs, absorption 0.9 96.0 107.9 203.8
2 CSOG office 1310 30% light 4 Woomera 15.9 142.4 158.32 CSOG office 1310 90% dark 4 Woomera 14.9 160.2 175.12 CSOG office 1310 30% light 5 Adelaide IWEC 19.0 69.0 88.12 CSOG office 1310 90% dark 5 Adelaide IWEC 17.7 81.4 99.12 CSOG office 1310 30% light 6 Mt Gambier 42.3 33.7 75.92 CSOG office 1310 90% dark 6 Mt Gambier 39.3 41.2 80.5
Average performance for light roofs, absorption 0.3 25.7 81.7 107.4 Average performance for dark roofs, absorption 0.9 24.0 94.2 118.2
4 workshop 5220 30% light 4 Woomera 46.5 121.0 167.54 workshop 5220 90% dark 4 Woomera 41.2 141.0 182.24 workshop 5220 30% light 5 Adelaide IWEC 64.3 39.7 104.04 workshop 5220 90% dark 5 Adelaide IWEC 57.0 48.7 105.74 workshop 5220 30% light 6 Mt Gambier 137.3 15.0 152.34 workshop 5220 90% dark 6 Mt Gambier 123.9 19.6 143.5
Average performance for light roofs, absorption 0.3 82.7 58.5 141.2 Average performance for dark roofs, absorption 0.9 74.0 69.8 143.8
5.7% -15.5% -13.9%
5.0% -20.4% -16.9%
7.5% -22.6% -14.5%
6.3% -18.4% -15.0%
-7.6%
-9.0%
-11.7%
-14.2%
-8.6%
-7.7%
-5.8%
7.3% -13.3% -9.1%
7.2%
7.6%
-15.2%
-18.3%
-6.3%
-6.4%
-1.1%
-1.4%
0.4% -10.3%
-6.0%
-1.4%
-2.4% -10.4%
-11.1%6.5%
-12.5%
-17.5%
-20.1%
4.9%
2.4%
2.8% -14.4%
-9.6%
-11.1%
-5.7%
12.9%
12.9%
10.8%
-8.1%
-1.6%
6.1%
11.7% -16.1%
-14.2%
-18.6%
-23.4%
-1.8%
Discussion Paper – South Australia’s Cool Roofs Regulation 22
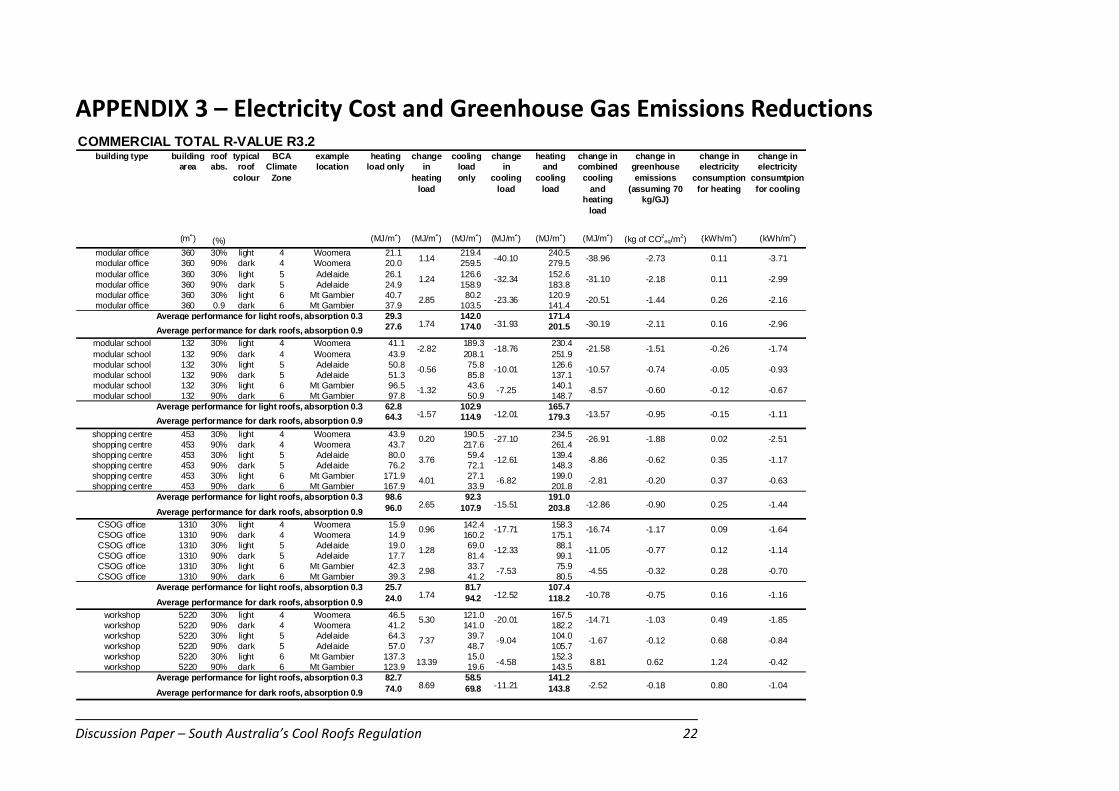
APPENDIX 3 – Electricity Cost and Greenhouse Gas Emissions Reductions COMMERCIAL TOTAL R-VALUE R3.2
building type building area
roof abs.
typical roof
colour
BCA Climate
Zone
example location
heating load only
change in
heating load
cooling load only
change in
cooling load
heating and
cooling load
change in combined cooling
and heating
load
change in greenhouse emissions
(assuming 70 kg/GJ)
change in electricity
consumption for heating
change in electricity
consumtpion for cooling
(m2) (%) (MJ/m2) (MJ/m2) (MJ/m2) (MJ/m2) (MJ/m2) (MJ/m2) (kg of CO2eq/m2) (kWh/m2) (kWh/m2)
modular office 360 30% light 4 Woomera 21.1 219.4 240.5 modular office 360 90% dark 4 Woomera 20.0 259.5 279.5 modular office 360 30% light 5 Adelaide 26.1 126.6 152.6 modular office 360 90% dark 5 Adelaide 24.9 158.9 183.8 modular office 360 30% light 6 Mt Gambier 40.7 80.2 120.9 modular office 360 0.9 dark 6 Mt Gambier 37.9 103.5 141.4
Average performance for light roofs, absorption 0.3 29.3 142.0 171.4 Average performance for dark roofs, absorption 0.9 27.6 174.0 201.5
modular school 132 30% light 4 Woomera 41.1 189.3 230.4modular school 132 90% dark 4 Woomera 43.9 208.1 251.9modular school 132 30% light 5 Adelaide 50.8 75.8 126.6modular school 132 90% dark 5 Adelaide 51.3 85.8 137.1modular school 132 30% light 6 Mt Gambier 96.5 43.6 140.1modular school 132 90% dark 6 Mt Gambier 97.8 50.9 148.7
Average performance for light roofs, absorption 0.3 62.8 102.9 165.7 Average performance for dark roofs, absorption 0.9 64.3 114.9 179.3
shopping centre 453 30% light 4 Woomera 43.9 190.5 234.5shopping centre 453 90% dark 4 Woomera 43.7 217.6 261.4shopping centre 453 30% light 5 Adelaide 80.0 59.4 139.4shopping centre 453 90% dark 5 Adelaide 76.2 72.1 148.3shopping centre 453 30% light 6 Mt Gambier 171.9 27.1 199.0shopping centre 453 90% dark 6 Mt Gambier 167.9 33.9 201.8
Average performance for light roofs, absorption 0.3 98.6 92.3 191.0 Average performance for dark roofs, absorption 0.9 96.0 107.9 203.8
CSOG off ice 1310 30% light 4 Woomera 15.9 142.4 158.3CSOG off ice 1310 90% dark 4 Woomera 14.9 160.2 175.1CSOG off ice 1310 30% light 5 Adelaide 19.0 69.0 88.1CSOG off ice 1310 90% dark 5 Adelaide 17.7 81.4 99.1CSOG off ice 1310 30% light 6 Mt Gambier 42.3 33.7 75.9CSOG off ice 1310 90% dark 6 Mt Gambier 39.3 41.2 80.5
Average performance for light roofs, absorption 0.3 25.7 81.7 107.4 Average performance for dark roofs, absorption 0.9 24.0 94.2 118.2
workshop 5220 30% light 4 Woomera 46.5 121.0 167.5workshop 5220 90% dark 4 Woomera 41.2 141.0 182.2workshop 5220 30% light 5 Adelaide 64.3 39.7 104.0workshop 5220 90% dark 5 Adelaide 57.0 48.7 105.7workshop 5220 30% light 6 Mt Gambier 137.3 15.0 152.3workshop 5220 90% dark 6 Mt Gambier 123.9 19.6 143.5
Average performance for light roofs, absorption 0.3 82.7 58.5 141.2
Average performance for dark roofs, absorption 0.9 74.0 69.8 143.8
-14.71
-1.67
8.81
-20.01
-9.04
-4.58
5.30
7.37
13.39
-7.53
-16.74
-11.05
-4.55
-27.10
-12.61
-6.82
-26.91
-8.86
-2.81
8.69 -11.21 -2.52
-2.82
-0.56
-1.32
0.20
3.76
4.01
0.96
2.65 -15.51 -12.86
1.74 -12.52 -10.78
1.28
2.98
-17.71
-12.33
-1.57 -12.01 -13.57
-18.76
-10.01
-7.25
-21.58
-10.57
-8.57
1.74 -31.93
1.14 -40.10 -38.96
1.24 -32.34 -31.10
-30.19
2.85 -23.36 -20.51 0.26
0.11 -3.71
0.11 -2.99
-2.16
0.16 -2.96
-0.26 -1.74
-0.05 -0.93
-0.12 -0.67
-0.15 -1.11
0.02 -2.51
0.35 -1.17
0.37 -0.63
0.25 -1.44
0.09 -1.64
0.12 -1.14
0.28 -0.70
0.16 -1.16
0.49 -1.85
0.68 -0.84
1.24 -0.42
0.80 -1.04
-0.20
-0.90
-2.73
-2.18
-1.44
-2.11
-1.51
-0.74
-0.60
-0.95
-1.88
-0.62
0.62
-0.18
-1.17
-0.77
-0.32
-0.75
-1.03
-0.12
Discussion Paper – South Australia’s Cool Roofs Regulation 23
APPENDIX 4 – Net Present Value