InTech-Design Considerations for Long Endurance Unmanned Aerial Vehicles
Scholars' Mine Scholars' Mine
Masters Theses Student Theses and Dissertations
Summer 2010
Control and design considerations in electric-drive vehicles Control and design considerations in electric-drive vehicles
Shweta Neglur
Follow this and additional works at: https://scholarsmine.mst.edu/masters_theses
Part of the Electrical and Computer Engineering Commons
Department: Department:
Recommended Citation Recommended Citation Neglur, Shweta, "Control and design considerations in electric-drive vehicles" (2010). Masters Theses. 6858. https://scholarsmine.mst.edu/masters_theses/6858
This thesis is brought to you by Scholars' Mine, a service of the Missouri S&T Library and Learning Resources. This work is protected by U. S. Copyright Law. Unauthorized use including reproduction for redistribution requires the permission of the copyright holder. For more information, please contact [email protected].

i
i
CONTROL AND DESIGN CONSIDERATIONS IN ELECTRIC-DRIVE VEHICLES
by
SHWETA NEGLUR
A THESIS
Presented to the Faculty of the Graduate School of the
MISSOURI UNIVERSITY OF SCIENCE AND TECHNOLOGY
In Partial Fulfillment of the Requirements for the Degree
MASTER OF SCIENCE IN ELECTRICAL ENGINEERING
2010
Approved by
Mehdi Ferdowsi, Advisor Badrul Chowdhury
Jonathan W. Kimball

ii
2010
SHWETA NEGLUR
ALL RIGHTS RESERVED
iii
ABSTRACT
Electric-drive vehicles have been identified as one of the promising technologies
of the future. Electric-drive vehicles including fuel cell, hybrid electric, and plug-in
hybrid electric vehicles have the potential to improve the fuel economy and reduce gas
emissions when compared to conventional vehicles. One of the important challenges in
the advancement of the electric-drive vehicles is to develop a control strategy which
meets the power requirements of the vehicles. The control strategy is an algorithm
designed to command the battery and the internal combustion engine of the vehicle for
specific power demands. In this thesis, load follower and thermostat control algorithms
have been analyzed and compared. A control strategy based on the combined urban and
highway driving cycles has been proposed in order to obtain better fuel economy. In
addition to this, proper choice of the energy storage system with respect to cost and
capacity is another design challenge for electric-drive vehicles. In this thesis, an
investigation has been done to identify the impact of different battery capacities and state
of charge operating windows on the fuel economy of the vehicle. It is proven that the
vehicle fuel economy is highly dependent on the battery state of charge whereas, battery
sizing largely depends on the average daily driving distance and the driving conditions.

iv
ACKNOWLEDGEMENTS
I would like to express my sincere gratitude to my advisor Dr. Mehdi Ferdowsi,
for giving me the opportunity to work and for the continuous support, patience and
motivation throughout my Masters. I would also like to thank Dr. Chowdhury and Dr.
Kimball for being a part of my committee.
I would also like to thank my lab mates Andrew Meintz and Deepak Somayajula
for giving me valuable inputs on the topic. I would also like to thank Mainak Pradhan for
being a constant source of support throughout the Masters program. I’m also grateful to
our Department Secretary, Mrs. Regina Kohout for guiding me through the paperwork
and other departmental procedures.
Lastly, but most importantly, I would like to thank my parents for providing
quality education all my life and motivating me to be successful.
v
TABLE OF CONTENTS
Page
ABSTRACT ...................................................................................................................... iii
ACKNOWLEDGEMENTS .............................................................................................. iv
LIST OF ILLUSTRATIONS ............................................................................................ vii
LIST OF TABLES ............................................................................................................. ix
SECTION
1. INTRODUCTION ...................................................................................................... 1
1.1. PLUG-IN HYBRID ELECTRIC VEHICLE POWERTRAINS ....................... 2
1.1.1. Series PHEVs. .......................................................................................... 2
1.1.2. Parallel PHEVs ........................................................................................ 3
1.1.3. Series-Parallel PHEVs. ............................................................................ 4
1.1.4. Complex PHEVs ...................................................................................... 6
1.2. OPERATING MODES OF PHEVS ................................................................. 6
1.2.1. Charge Depleting Mode (CD) .................................................................. 6
1.2.2. Charge Sustaining Mode (CS) ................................................................. 7
1.3. CHALLENGES IN PHEVS .............................................................................. 8
1.3.1. Design Parameters .................................................................................... 9
1.3.2. Control ................................................................................................... 14
1.3.3. Emissions ............................................................................................... 16
1.3.4. Vehicle to Grid Concept......................................................................... 16
1.3.5. Cost ........................................................................................................ 17
1.4. SIMULATION PACKAGE ............................................................................ 18
1.4.1. Urban Dynamometer Driving Schedule (UDDS) .................................. 19
1.4.2. High Way Fuel Economy Driving Schedule (HWFET) ........................ 20
1.4.3. Combined Driving Schedule (UDDS and HWFET Combination). ....... 20
1.5. THESIS ORGANIZATION ............................................................................ 21
2. CONTROL STRATEGIES FOR ELECTRIC-DRIVE VEHICLES ........................ 23
2.1. SELECTION OF POWERTRAIN .................................................................. 24
2.2. RULE-BASED CONTROL STRATEGIES ................................................... 25
vi
2.2.1. Load Follower Control Strategy ............................................................ 25
2.2.2. Thermostat Control Strategy .................................................................. 31
2.3. CONTROL STRATEGY BASED ON DRIVING CYCLE ........................... 34
2.3.1. Electric Power Only Mode ..................................................................... 37
2.3.2. Engine Power Only Mode ...................................................................... 38
2.3.3. Power-assist Mode ................................................................................. 38
2.4. SIMULATION RESULTS .............................................................................. 39
3. EFFECTS OF BATTERY CAPACITY ON THE PERFORMANCE OF ELECTRIC-DRIVE VEHICLES ............................................................................ 45
3.1. DESIGN PARAMETERS ............................................................................... 46
3.1.1. Powertrain .............................................................................................. 46
3.1.2. Controller Strategy ................................................................................. 46
3.1.3. Energy Storage System .......................................................................... 47
3.2. SIMULATION RESULTS .............................................................................. 48
3.2.1. Effect of SOC Window Width ............................................................... 51
3.2.2. Effect of Window Placement ................................................................. 52
3.2.3. Effect of Initial SOC .............................................................................. 53
3.2.4. Effect of Driving Distance ..................................................................... 54
4. CONCLUSION ........................................................................................................ 57
BIBLIOGRAPHY ........................................................................................................ 59
VITA ............................................................................................................................. 64
vii
LIST OF ILLUSTRATIONS
Page
Figure 1.1. Series PHEV ..................................................................................................... 3
Figure 1.2. Parallel PHEV ................................................................................................... 4
Figure 1.3. Series-parallel PHEV ........................................................................................ 5
Figure 1.4. Complex PHEV ................................................................................................ 5
Figure 1.5. Operating modes of PHEV ............................................................................... 8
Figure 1.6. Cell voltage (V) vs. capacity of different batteries discharged (%) [10] ........ 11
Figure 1.7. Life cycle of different batteries [11] ............................................................... 12
Figure 1.8. Urban driving cycle ........................................................................................ 19
Figure 1.9. Highway driving cycle .................................................................................... 20
Figure 1.10. Combination of urban and highway driving cycle........................................ 21
Figure 2.1. Drive cycle, battery SOC, engine power vs. time (load follower).................. 26
Figure 2.2. Algorithm for load follower control strategy .................................................. 28
Figure 2.3. Scaling factor vs. battery SOC [39] ................................................................ 29
Figure 2.4. Drive cycle, battery SOC, engine power vs. time (thermostat) ...................... 30
Figure 2.5. Algorithm for thermostat control strategy ...................................................... 32
Figure 2.6. Maximum battery power during discharge vs. SOC....................................... 33
Figure 2.7. Internal resistance vs. battery SOC @ 0 deg C ............................................... 35
Figure 2.8. Internal resistance vs. battery SOC @ 25 deg C ............................................. 36
Figure 2.9. Vehicle speed, battery capacity vs. time [41] ................................................. 37
Figure 2.10. Load follower control strategy for combined driving cycle ......................... 40
Figure 2.11. Thermostat control strategy for combined driving cycle .............................. 41
Figure 2.12. Driving cycle based control strategy for combined driving ......................... 42
Figure 3.1. Drive cycle, SOC and engine power output ................................................... 49
Figure 3.2. Zoomed area of the Fig. 3.1 ............................................................................ 50
Figure 3.3. Final SOC vs. battery capacity for different SOC window size ..................... 51
Figure 3.4. Fuel economy vs. battery capacity for different SOC window size ............... 52
Figure 3.5. Fuel economy vs. battery capacity for different SOC window range ............. 53

viii
Figure 3.6. Fuel economy vs. battery capacity for different initial SOC .......................... 54
Figure 3.7. Fuel economy vs. battery capacity for different drive cycles ......................... 55
Figure 3.8. Final SOC vs. battery capacity for different drive cycles ............................... 55
ix
LIST OF TABLES
Page
Table 1.1 Different Battery Chemistries Comparison [9] ................................................. 11
Table 1.2 Specific energy and energy storage requirements by vehicle classes ............... 13
Table 2.1 Ratings of Components in Series Powertrain.................................................... 25
Table 2.2 Load Follower Control Parameters ................................................................... 27
Table 2.3 Thermostat Control Parameters......................................................................... 31
Table 2.4 Fuel economy for combined UDDS and HWFET driving cycle using all three control strategies for different conditions ................................................. 43
Table 3.1 Component Sizing ............................................................................................. 47
Table 3.2 Different Li-ion battery sizes of 6Ah cell capacity, nominal voltage = 3.6V, no. of cells in series = 100 ................................................................................. 48
1
1. INTRODUCTION
Volatile fuel prices and global warming are the main motives to improve the fuel
economy of vehicles. The quest of alternative fuels has been on rise in the recent years.
Many advanced vehicles such as fuel cell vehicles, hybrid electric vehicles, and plug-in
hybrid electric vehicles incorporate energy storage in their powertrain to improve their
efficiency. Fuel cell vehicles (FCVs) use hydrogen as fuel to produce electricity and
ultimately propel the vehicle. Since electricity is generated from a chemical reaction
involving hydrogen, FCVs do not produce any pollutants hence they are considered as
emission free. Even though FCVs have quieter operation and lower green house gas
emissions, they require new infrastructures for the manufacturing and maintenance of the
vehicles and the production and distribution of hydrogen, thus making them costly and
difficult for market penetration [1]. Hybrid electric vehicles (HEVs) are fuel efficient due
to the recovery of the kinetic energy during regenerative braking and also due to presence
of electrical energy source which reduce fuel dependence [2, 3]. HEVs use an internal
combustion engine (ICE) to convert the chemical energy stored in gasoline into
mechanical and finally electrical energy which is used to drive the traction electric motor.
This electric motor optimizes the efficiency of the ICE and also helps in the recovery of
the kinetic energy by regeneration mechanism during braking or cruising. Plug-in hybrid
electric vehicles (PHEV) differ from HEVs with their ability to charge their battery from
a household outlet. PHEVs can be charged from the utility power grid where electricity
can be generated from renewable sources like solar energy, wind energy, or nuclear
energy. Therefore, one of the promising solutions to the current crisis is the mass
production of hybrid and plug-in hybrid electric vehicles [4]. As stated in [5, 6], the
2
advantages of PHEVs include; 1) low operating cost since the cost of electricity per mile
is less when compared to gasoline, 2) tailpipe emissions are reduced due to the fact that
more distance can be covered with the engine being off, 3) energy diversification, since
electricity can be generated from various renewable and non-renewable energy sources,
and 4) reduced petroleum dependence, since vehicles are driven on electric power for
certain miles.
1.1. PLUG-IN HYBRID ELECTRIC VEHICLE POWERTRAINS
A plug-in hybrid electric vehicle’s powertrain consists of electrical components
including electric motors, an energy storage system, and power electronic converters and
also mechanical components like an internal combustion engine (ICE). The ICE provides
the vehicle an extended driving range while the electric motor increases efficiency and
fuel economy by regenerating energy during braking and storing excess energy from the
ICE during coasting. Depending upon the combination of the electrical and mechanical
components, PHEV powertrains can be series, parallel, series/parallel or complex.
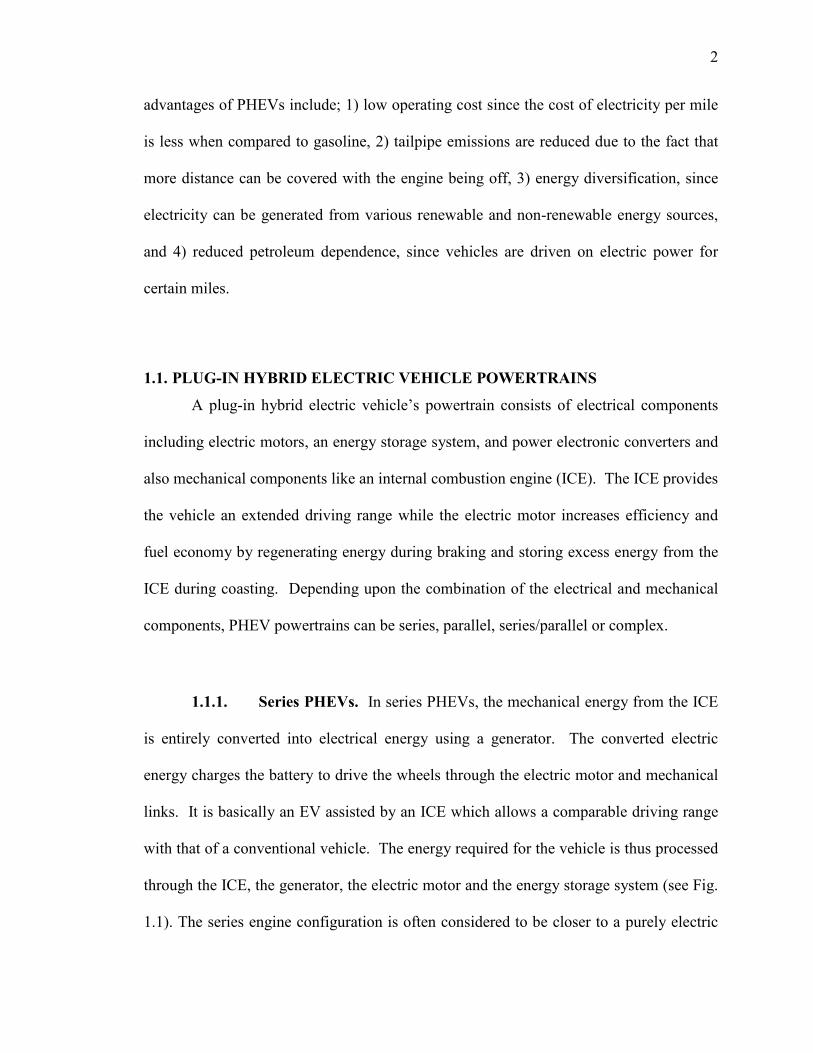
1.1.1. Series PHEVs. In series PHEVs, the mechanical energy from the ICE
is entirely converted into electrical energy using a generator. The converted electric
energy charges the battery to drive the wheels through the electric motor and mechanical
links. It is basically an EV assisted by an ICE which allows a comparable driving range
with that of a conventional vehicle. The energy required for the vehicle is thus processed
through the ICE, the generator, the electric motor and the energy storage system (see Fig.
1.1). The series engine configuration is often considered to be closer to a purely electric
3
vehicle. Engine speed is decoupled from the wheel axles and is completely independent
of the vehicle operating conditions. Hence, engine can be operated in its high efficiency
region.
Figure 1.1. Series PHEV
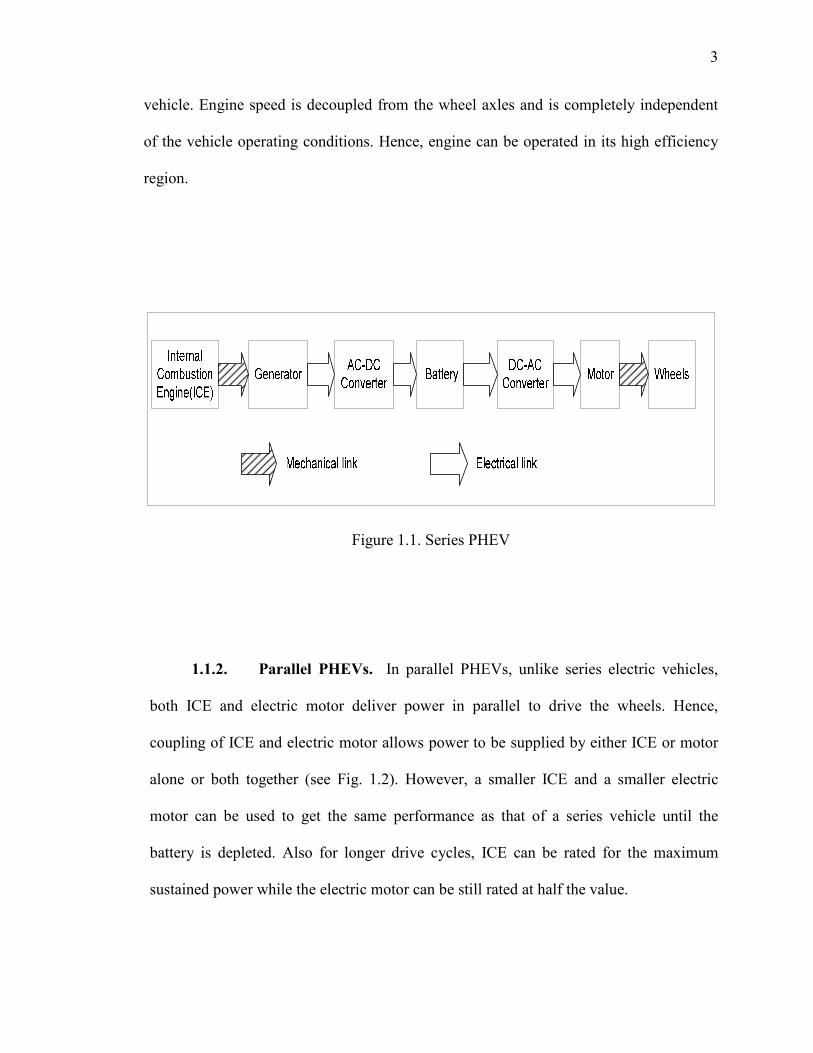
1.1.2. Parallel PHEVs. In parallel PHEVs, unlike series electric vehicles,
both ICE and electric motor deliver power in parallel to drive the wheels. Hence,
coupling of ICE and electric motor allows power to be supplied by either ICE or motor
alone or both together (see Fig. 1.2). However, a smaller ICE and a smaller electric
motor can be used to get the same performance as that of a series vehicle until the
battery is depleted. Also for longer drive cycles, ICE can be rated for the maximum
sustained power while the electric motor can be still rated at half the value.
4
Figure 1.2. Parallel PHEV
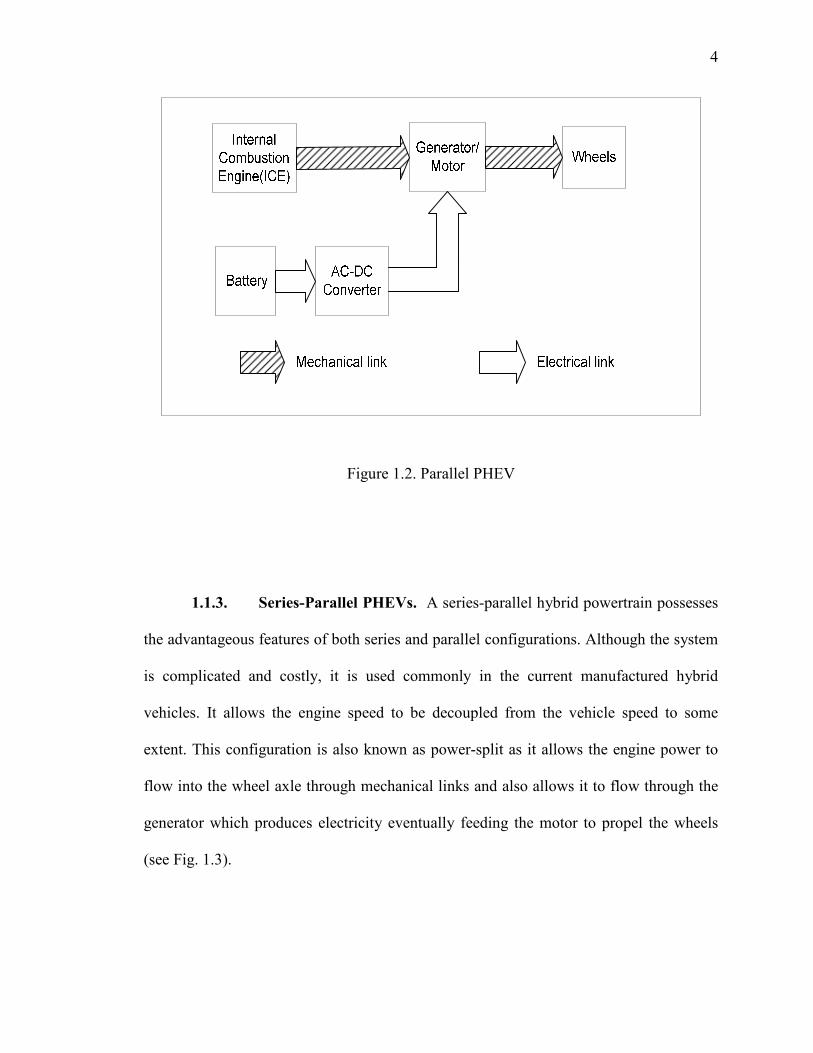
1.1.3. Series-Parallel PHEVs. A series-parallel hybrid powertrain possesses
the advantageous features of both series and parallel configurations. Although the system
is complicated and costly, it is used commonly in the current manufactured hybrid
vehicles. It allows the engine speed to be decoupled from the vehicle speed to some
extent. This configuration is also known as power-split as it allows the engine power to
flow into the wheel axle through mechanical links and also allows it to flow through the
generator which produces electricity eventually feeding the motor to propel the wheels
(see Fig. 1.3).
5
Figure 1.3. Series-parallel PHEV
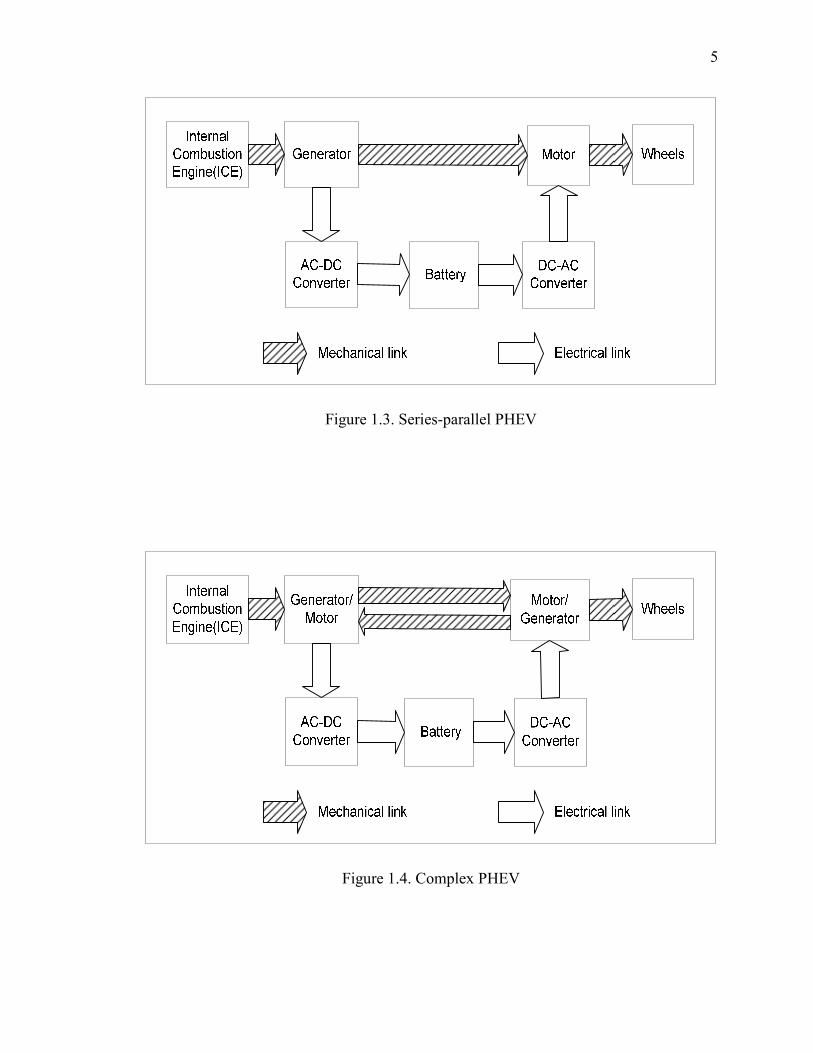
Figure 1.4. Complex PHEV
6
1.1.4. Complex PHEVs. Complex hybrid powertrains are similar to series-
parallel configurations. However, the main difference between them is that complex
hybrid vehicles have bidirectional power flow whereas series-parallel hybrids have
unidirectional power flow (see Fig. 1.4). Thus due to the bidirectional power flow,
various operating modes can be achieved in complex hybrid vehicles. The main
disadvantages of these hybrid vehicles are complicated structure and cost.
1.2. OPERATING MODES OF PHEVS
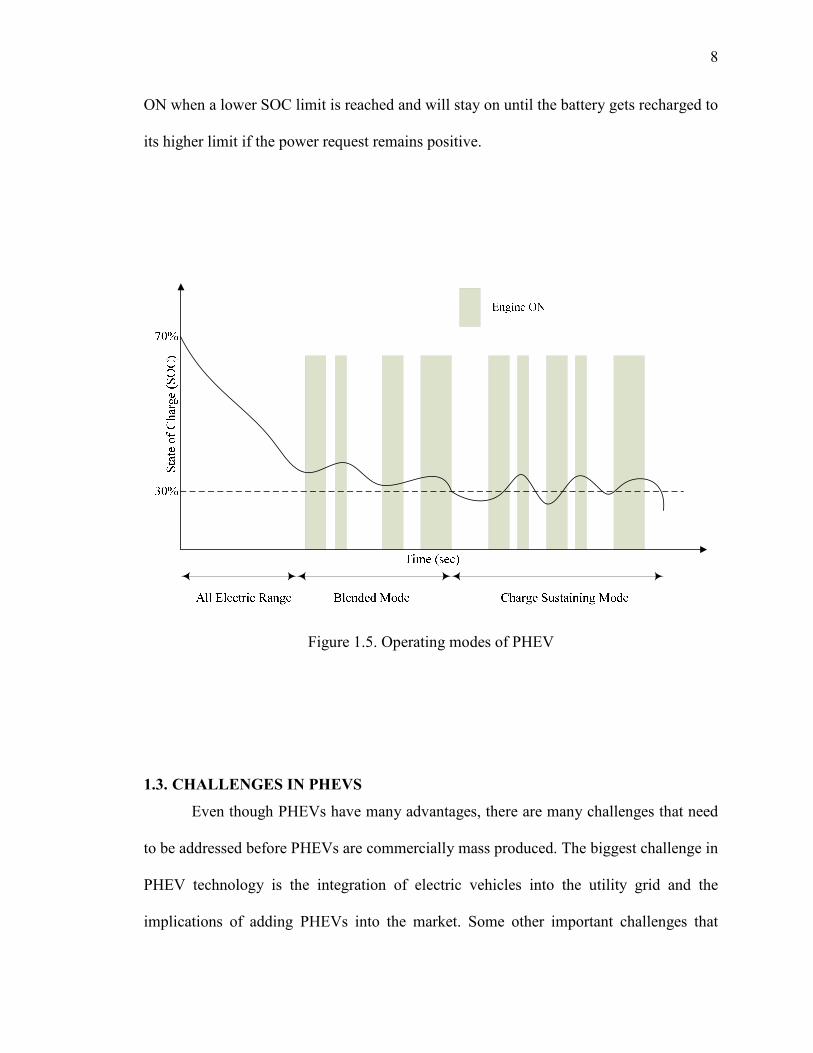
The state of charge (SOC) of a battery is defined as the percentage of the
maximum possible charge that is present inside a rechargeable battery. Depending upon
the SOC of its battery, a PHEV operates in two modes, i.e., charge depleting mode (CD)
and charge sustaining mode (CS). A fully charged PHEV is driven in CD mode and the
vehicle switches to CS mode when the battery SOC is depleted to a minimum level. The
CD mode can be operated in all electric range or in blended mode depending upon the
driver’s power demand and the battery SOC as shown in Fig. 1.5. A typical notation of a
PHEV is PHEV20 which denotes that a hybrid vehicle can be driven in CD mode for 20
miles before switching to CS mode. However, this notation does not specify whether it is
completely driven in all electric range or in blended mode.
1.2.1. Charge Depleting Mode (CD). When the SOC of the battery is high,
the vehicle operates in a charge depleting mode. As the battery drains, the consumption
of power from the engine increases. The CD mode can be said to be operated in all
electric mode when the battery SOC is maximum and also when the battery is able to
7
meet the driver’s power demands. Hence, the engine is off and the vehicle is driven
entirely by the battery power. However, the blended CD mode can be either electric
dominant or engine dominant depending upon the driving conditions and the battery SOC
level. In the blended CD mode, battery can be designed for lower peak power as
compared to the all electric mode as the engine also supplies power to the vehicle. Thus
the battery cost is reduced. The blended mode can be engine dominant or electric
dominant where vehicle operates on both battery and ICE. In the engine dominant mode,
ICE delivers the average power required and the extra demand is supplied by the battery.
Since the primary source of energy is gasoline, the vehicle provides less fuel economy
with more emissions. In the electric dominant blended mode, the battery supplies average
power demand, thus the required battery power is more and hence the vehicle can be
costly. However the choice between these two blended modes should be based on the
driving distance and driving conditions as proposed in [7]. The maximum distance a
vehicle can travel in the CD mode before the CS mode begins is defined as the CD
distance. The electric dominant CD mode is more efficient where the driving distance is
less than the CD distance whereas the engine dominant CD mode is more efficient for
driving distances greater than the CD distance of the vehicle [6].
1.2.2. Charge Sustaining Mode (CS). When the SOC of the battery reaches
to a minimum value; vehicle operates in the CS mode. In the CS mode, the vehicle
operates like a conventional HEV as it uses power from ICE to drive the vehicle. The
choice of the operating mode should be made by the controller in the vehicle. As the
engine is completely decoupled from other mechanical parts, numerous control strategies
can be chosen. The engine is turned ON based on the battery SOC, i.e., the engine turns
8
ON when a lower SOC limit is reached and will stay on until the battery gets recharged to
its higher limit if the power request remains positive.
Figure 1.5. Operating modes of PHEV
1.3. CHALLENGES IN PHEVS
Even though PHEVs have many advantages, there are many challenges that need
to be addressed before PHEVs are commercially mass produced. The biggest challenge in
PHEV technology is the integration of electric vehicles into the utility grid and the
implications of adding PHEVs into the market. Some other important challenges that
9
PHEV technology is facing includes design parameters, emissions, fuel economy, and
cost which are discussed below.
1.3.1. Design Parameters. The energy storage system has to be the most
accommodating component in the design of a PHEV. PHEVs require a smaller battery
capacity as compared to the pure electric vehicles. The energy storage system should be
able to deliver and receive power (propelling and regenerative braking) as per the driving
conditions. The energy storage system needs to be transported and distributed. The
energy density of an energy storage system refers to the amount of energy stored in the
system per unit volume, while specific energy is defined as the amount of energy stored
per unit mass or weight of the system. Hence higher the energy density, more amount of
energy is transported or stored for the same amount of mass. Similarly, power density of
an energy storage system is a measure of the amount of power extracted from the per unit
volume of the energy storage system and specific power is amount of power drawn per
unit mass or weight of the system. Thus, in order to obtain high performance, energy
density and power density of the energy storage system should be high. PHEVs use
various energy storage systems like batteries, ultracapacitors, or a combination of both to
store energy on board.
Over the years there have been significant advancements in the battery
technology. The important battery technologies that have been extensively used in
PHEVs are lead-acid (Pb-Acid), nickel-metal hydride (Ni-MH), and lithium-ion (Li-Ion)
batteries. However not one battery type is able to provide all the power requirements
needed by hybrid electric vehicles. Lead-acid batteries have good power density but they

10
have low specific energy and specific power. Hence it is not recommended for
applications which demand a large amount of power and energy like in power-assist
HEVs. Li-Ion batteries are able to provide small amount of current over a long time but
are not able to provide large amount of power for a short time. Hence Li-ion batteries are
said to have high energy and power density. Li-ion batteries are also sensitive to
overcharge. Ni-MH batteries are capable of delivering short burst of power, but operating
them under high discharging conditions can reduce their lifetime. As a result, many
batteries are connected in parallel to increase current characteristics. This increases the
weight and cost of the vehicle and hence it is not the best solution to the energy storage
problem [8]. In addition, Ni-MH also has a very high self-discharge rate. Cold weather
can also adversely affect the operation of batteries. Generally speaking, batteries are not
considered environment friendly devices since they cannot be easily disposed. Various
other characteristics of battery chemistry such as charge-discharge efficiencies, transient
capabilities, and cycle life should be considered while selecting a battery and its
operation. Table 1.1 compares different battery technologies with respect to their cost,
energy density, and power density.
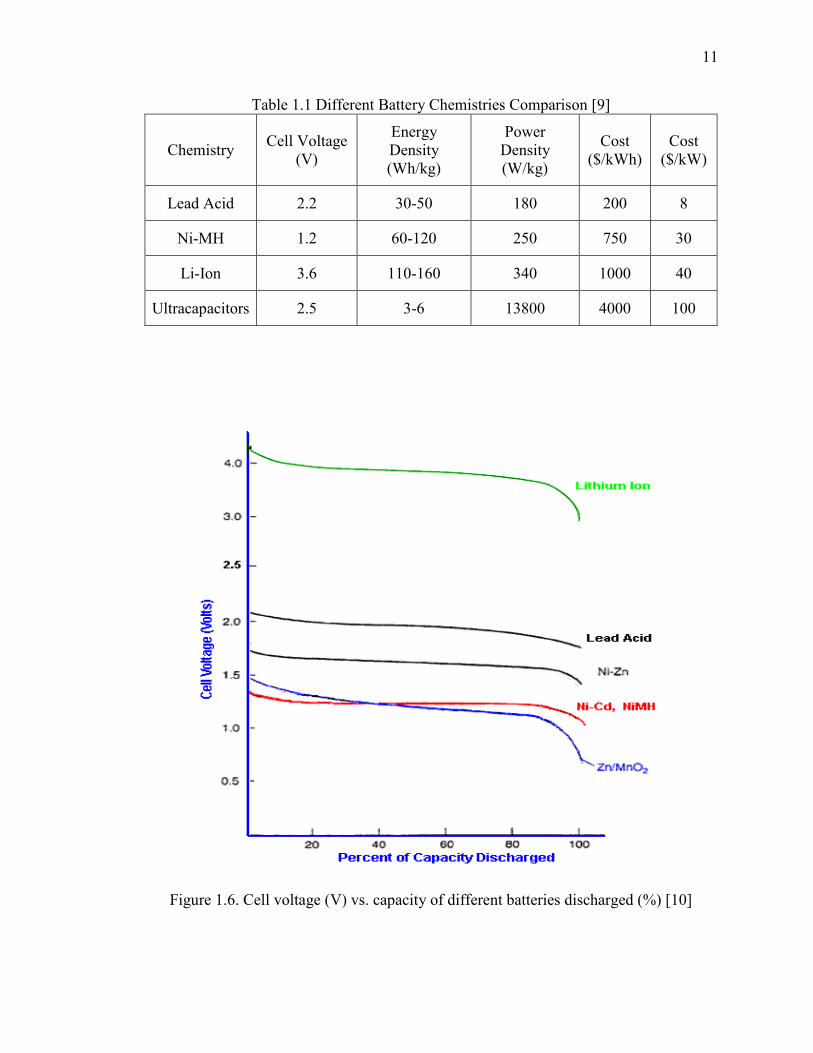
The discharge rate of a battery is defined as the rate depletion of the charge of the
battery per unit time. Figure 1.6 shows the percentage of capacity discharged of different
batteries. The value of discharge capacity on the X-axis is independent of the actual cell
capacity. The cell capacity of the battery is defined as the maximum amount of current a
battery cell can provide continuously and it is measured in Ah.
11
Table 1.1 Different Battery Chemistries Comparison [9]
Chemistry Cell Voltage (V)
Energy Density (Wh/kg)
Power Density (W/kg)
Cost ($/kWh)
Cost ($/kW)
Lead Acid 2.2 30-50 180 200 8
Ni-MH 1.2 60-120 250 750 30
Li-Ion 3.6 110-160 340 1000 40
Ultracapacitors 2.5 3-6 13800 4000 100
Figure 1.6. Cell voltage (V) vs. capacity of different batteries discharged (%) [10]
12
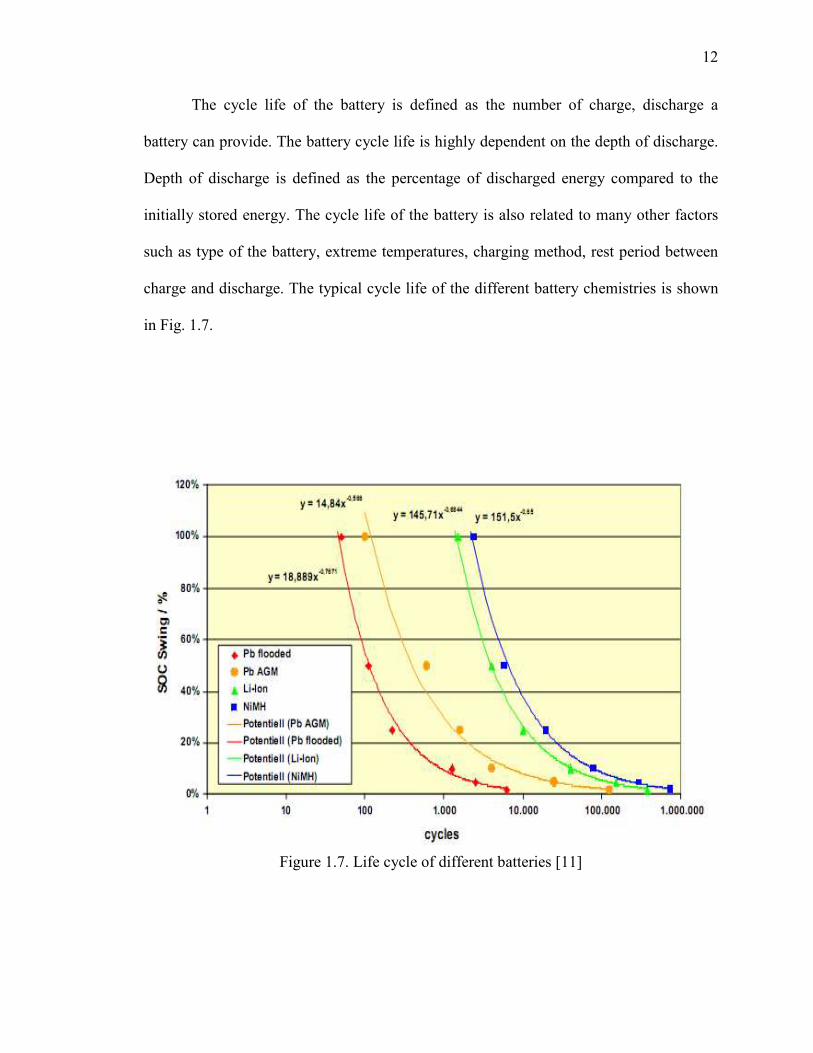
The cycle life of the battery is defined as the number of charge, discharge a
battery can provide. The battery cycle life is highly dependent on the depth of discharge.
Depth of discharge is defined as the percentage of discharged energy compared to the
initially stored energy. The cycle life of the battery is also related to many other factors
such as type of the battery, extreme temperatures, charging method, rest period between
charge and discharge. The typical cycle life of the different battery chemistries is shown
in Fig. 1.7.
Figure 1.7. Life cycle of different batteries [11]

13
The battery energy capacity is sized according to the all electric range required by
the vehicle. An all electric range of a vehicle is the distance travelled by the vehicle
without starting the engine. One of the important parameter in sizing a battery is power-
to-energy value (P/E). The P/E value of the battery is defined as the ratio of battery
power to the battery energy as described by Equation (1). The P/E value of the battery
depends on the type of the vehicle. The PHEVs with all electric range have low P/E value
due to requirement of large energy of a battery pack. However, HEVs with ICE engine
have high P/E value since the battery is designed to handle high instantaneous power.
The energy requirement per mile by certain vehicle classes and the size of battery
necessary to provide the energy is listed in the Table 1.2 below. [12]
==
kgWh
energyspecific
kgW
powerspecific
kWhenergykWpower
hEP
)()(1
(1)
Table 1.2 Specific energy and energy storage requirements by vehicle classes
Vehicle Class Specific Energy Requirements [kWh/mile]
Size of Battery for PHEV33 [kWh]
Compact sedan 0.26 8.6
Mid-size sedan 0.3 9.9
Mid-size SUV 0.38 12.5
Full-size SUV 0.46 15.2
14
Ultracapacitors are energy storage devices where the energy is stored via charge
separation at the electrode and electrolyte interface. Ultracapacitors store energy
electrostatically whereas batteries store energy chemically. Ultracapacitors are capable of
quickly delivering and storing large amount of power required during acceleration or
braking of the vehicle. Unlike batteries, ultracapacitors are not adversely affected during
repetitive charging and discharging, hence avoiding frequent replacements.
Ultracapacitors are not prone to temperature effects and can operate in temperatures as
low as -40°C [8]. Although they can absorb power easily, they cannot retain the charge
for long. This is due to the fact that the energy is stored on the charged particles of the
plates. As a result of this, ultracapacitors are said to have a high self-discharge rate. Thus
in order to eliminate the quest for an ideal energy storage system, research is being
widely done on the hybridization of energy storage systems. This gives rise to the
concept of combining features of electrochemical batteries and ultracapacitors which is
briefly discussed in [13, 14], due to the fact that batteries are energy rich components and
ultracapacitors are power rich [15]. However, the combination of ultracapacitors and
batteries require additional DC/DC converters which increase the cost of the vehicle.
1.3.2. Control. Improvements in fuel economy and emissions of PHEV
strongly depend on the control strategy used while designing a vehicle. The control
strategy is used to determine an appropriate power distribution between the primary
energy storage (internal combustion engine) and the energy storage system so that all the
necessary power requirements are satisfied as well as the fuel consumption and the
harmful emissions are minimized. The input parameters of the control strategy are the
15
measurements of the vehicle speed or acceleration, torque required by the driver, driving
or road condition, traffic information and even the information provided by the Global
Positioning System (GPS). The outputs of the control strategy are decisions to turn ON or
OFF certain components or modify the operating regions to maximize the efficiency of
the component [16]. In HEVs, the battery is charged either from the ICE or during
regenerative braking and battery state of charge is maintained constant throughout the
driving cycle [17]. Therefore, the conventional and hybrid vehicles have a constant fuel
economy at increasing distance over the same driving pattern, however, in PHEVs there
is a decrease in fuel economy at increasing distance [18]. Thus, the main concerns in the
development of a control strategy are firstly, to control the output torque of the traction
motor to meet the required propelling torque. Secondly, to keep the engine operating
points at their highest efficient locus to obtain maximum fuel economy. Thirdly, to
maintain the battery SOC at a reasonable level without overcharging it or discharging it
to a very low value [19]. Hence, obtaining an optimal control strategy of a hybrid electric
vehicle highly depends on various factors like driving conditions, instantaneous state of
charge of the energy storage system, engine capability, and size of the motor. However,
the objectives of a control strategy such as reduction in emission, efficiency optimization,
which are the most contending parameters, it is necessary to obtain a tradeoff between
them. Thus, it can be concluded that there are various ways in which a control strategy
can be defined. The most conventional control strategies are those which alter the input
signals to produce the output signal which results in good reliability. However, the main
disadvantage of having consistency is that it is becomes difficult to adapt to the changes
in the parameters of vehicle’s drivetrain [20]. Hence, the focus is now shifted in
16
developing control strategies that optimizes the performance of the PHEVs. However,
these optimal control strategies are tuned to achieve maximum fuel economy for specific
driving conditions and hence cannot be suitable for real world application. Thus, the real
time controllers need information from GPS in order to obtain a global control strategy.
But, the success of this strategy would depend on the ability to access availability of this
information in real time.
1.3.3. Emissions. PHEVS have the potential to decrease the green house gas
emissions (GHG) in urban areas where it is caused mainly due to vehicle tailpipe
emissions. However, the GHG emissions in the power generation area might increase due
to extra amount of energy generated by coal plants to produce electricity [21]. Hence,
PHEV penetration does not necessarily reduce the GHG emissions, but shifts the energy
dependence from gasoline to electricity and from urban areas to coal plant areas.
Therefore, electricity produced from renewable or clean energy sources to charge the
PHEVs would be considered as an effective solution.
1.3.4. Vehicle to Grid Concept. Utility grids are designed to meet highest
expected demand and this occurs only few hundreds of hours per year. Hence, the grid is
underutilized and could generate and deliver a large amount of energy to charge the
batteries in PHEVs. However, if the electricity is generated from highly polluting sources
then the environmental advantages of PHEV would be limited [22]. Thus, in view of
technical and environmental advantages of PHEVs, they can be designed to provide
back-up power to home through their vehicle-to-grid (V2G) capability. V2G operation

17
allows PHEVs to operate as load, or a standalone energy source during shortage of
power. The energy stored in the battery can be used to serve a small amount of load
demand thus contributing to the peak shaving. The other advantages of peak shaving
include reducing transmission congestion, line losses, and reduce stressed operations on
power systems. PHEVs could be charged in during off peak hours and they could retail
the energy stored back into the grid during the peak hour i.e. when the power demand is
high. Peak shaving applications also reduce the cost of electricity during the peak periods
when they are at the maximum [23]. The unique feature of V2G vehicles is that they are
bi-directional. Hence vehicle is able to take power from the grid during charging and it
delivers power to the grid during discharging [24]. However, care must be taken while
discharging the on-board battery as the depth of discharge has an impact on the life of the
battery. PHEVs could also be used to provide ancillary services to the grid like spinning
reserves and regulation by just plugging into the grid. Hence, they could be able to
overcome short operating reserve capacity and provide voltage regulation in a short time.
The PHEVs are able to provide energy close to the energy demand, and efficiency of the
stored energy in PHEVs batteries is potentially significantly higher than the energy stored
in hydrogen and in FCVs [25]. V2G thus offers to be a promising technology to reduce
the impact on the utilities with the interfacing of PHEVs.
1.3.5. Cost. Electricity prices are a critical factor for the cost-effectiveness of
PHEVs. If a large number of PHEVs plug into the electric grid in the near future, it
would largely increase the amount and pattern of electric load demand. This will affect
the electricity market in a complex way. Also, other important cost-affecting factor in the
18
development of PHEVs is the battery technology. Even though batteries effectively
reduce fuel consumption in PHEVs, they require a high initial cost. If batteries are to be
used largely in the charge depleting region, a large battery pack should be used. This
increases the upfront cost of the battery pack and therefore the cost of the vehicle. Also, if
batteries are frequently charged and discharged, their total cycle life will be reduced and
hence they would require frequent replacement. The cost comparison of different battery
technologies is listed in the Table I in Section 1.3.1.
1.4. SIMULATION PACKAGE
With large number of advanced vehicle powertrains being developed, it is
necessary to have flexible and accurate simulation tool as it is impossible to manually
build and configure each powertrain due to time and cost constraints. Powertrain System
Analysis Toolkit (PSAT), a powerful automotive reusable simulation tool developed by
Argonne National Laboratory (ANL), is hence used to provide accurate vehicle
performance and fuel economy simulations. PSAT allows users to evaluate the vehicle
performance realistically. PSAT is considered as a forward-looking model, due to the fact
that it allows users to model the actual vehicle with real commands [26]. However, in
backward-looking models components cannot be controlled as in reality, thus the
transient effects cannot be considered. Thus, an accurate control application is not
possible in the backward-looking model. PSAT also enables users to perform parametric
studies and compare different component technologies, control strategies and drivetrain
configurations.
19
Using PSAT, we can develop a vehicle model and can modify any parameters according
to the required testing. Also there are various drive cycles defined which can be used so
as to test a vehicle performance depending upon the driving conditions. The most
common driving cycles are the Urban Dynamometer Driving Schedule (UDDS) and the
High Way Fuel Economy Driving Schedule (HWFET).
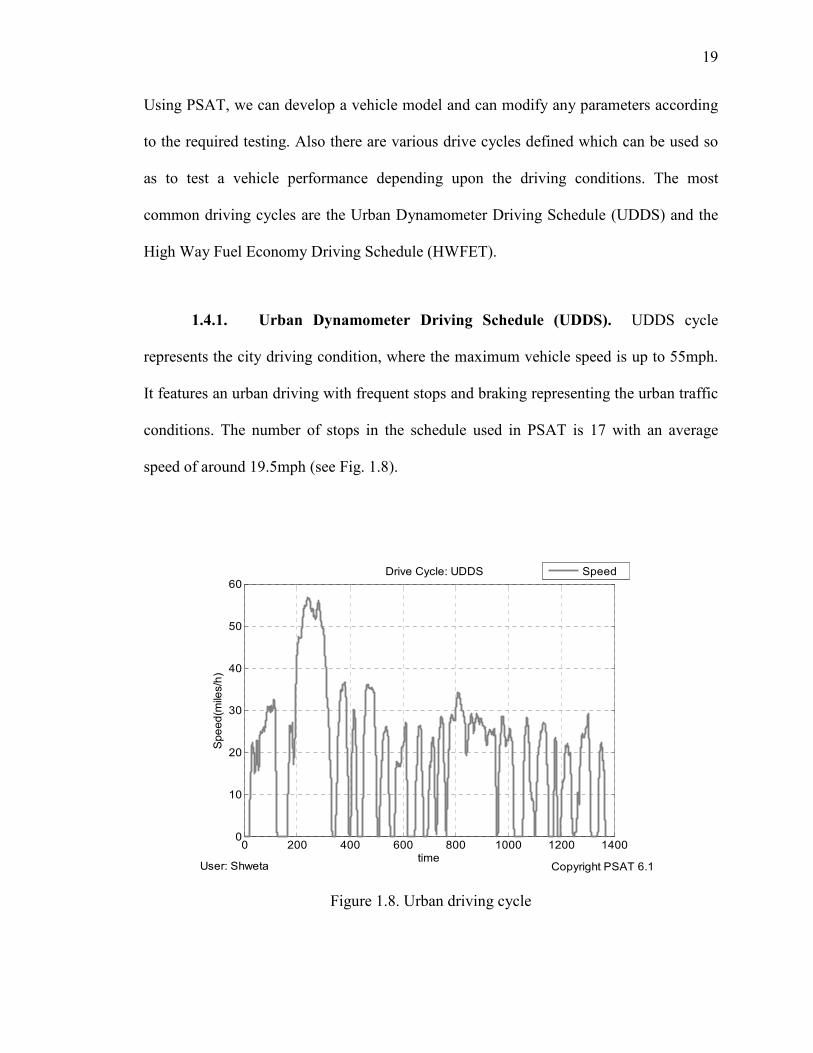
1.4.1. Urban Dynamometer Driving Schedule (UDDS). UDDS cycle
represents the city driving condition, where the maximum vehicle speed is up to 55mph.
It features an urban driving with frequent stops and braking representing the urban traffic
conditions. The number of stops in the schedule used in PSAT is 17 with an average
speed of around 19.5mph (see Fig. 1.8).
Figure 1.8. Urban driving cycle
User: Shweta Copyright PSAT 6.1
Drive Cycle: UDDS
0 200 400 600 800 1000 1200 14000
10
20
30
40
50
60
time
Spe
ed(m
iles/h)
Speed
20
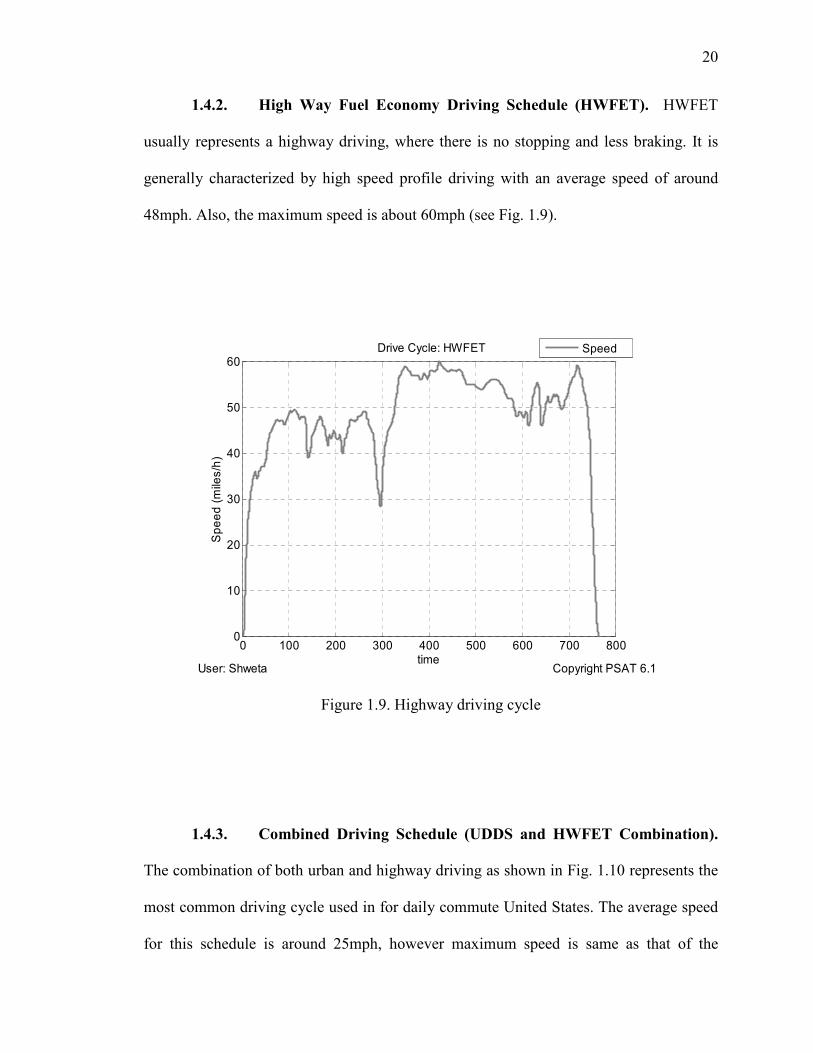
1.4.2. High Way Fuel Economy Driving Schedule (HWFET). HWFET
usually represents a highway driving, where there is no stopping and less braking. It is
generally characterized by high speed profile driving with an average speed of around
48mph. Also, the maximum speed is about 60mph (see Fig. 1.9).
Figure 1.9. Highway driving cycle
1.4.3. Combined Driving Schedule (UDDS and HWFET Combination).
The combination of both urban and highway driving as shown in Fig. 1.10 represents the
most common driving cycle used in for daily commute United States. The average speed
for this schedule is around 25mph, however maximum speed is same as that of the
User: Shweta Copyright PSAT 6.1
Drive Cycle: HWFET
0 100 200 300 400 500 600 700 8000
10
20
30
40
50
60
time
Spe
ed (m
iles/h)
Speed
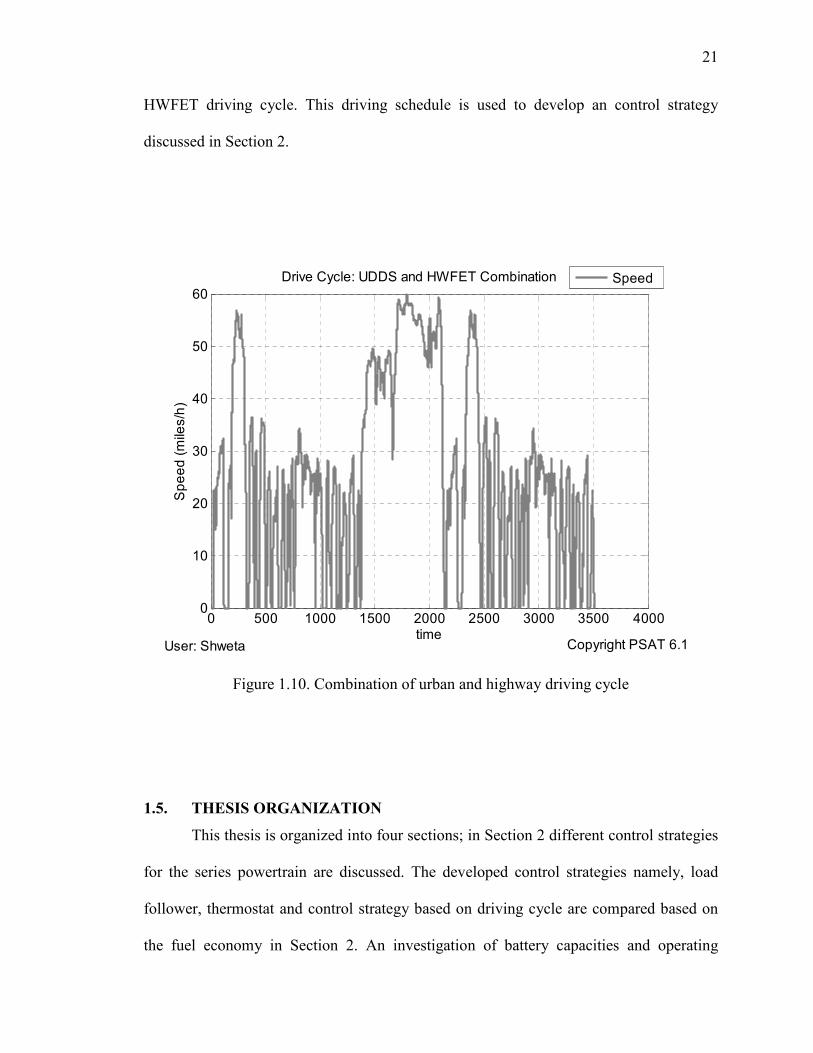
21
HWFET driving cycle. This driving schedule is used to develop an control strategy
discussed in Section 2.
Figure 1.10. Combination of urban and highway driving cycle
1.5. THESIS ORGANIZATION
This thesis is organized into four sections; in Section 2 different control strategies
for the series powertrain are discussed. The developed control strategies namely, load
follower, thermostat and control strategy based on driving cycle are compared based on
the fuel economy in Section 2. An investigation of battery capacities and operating
Copyright PSAT 6.1
Drive Cycle: UDDS and HWFET Combination
0 500 1000 1500 2000 2500 3000 3500 40000
10
20
30
40
50
60
time
Spe
ed (m
iles/h)
Speed
User: Shweta

22
windows of the state of charge on the performance of the vehicle has been carried out in
Section 3. Conclusions and future work are presented in Section 5.
23
2. CONTROL STRATEGIES FOR ELECTRIC-DRIVE VEHICLES
One of the design challenges of the electric-drive vehicles is the development of
an efficient control strategy. The control strategy is an algorithm that determines when
and at what power level to run the vehicle’s internal combustion engine (ICE) as a
function of power demand at the wheels, the state of charge of the battery, and the current
power level of the ICE. There are many control strategies being used for this purpose;
namely, global, dynamic real-time, and static real-time control strategies [27].
Global control strategy is where the entire drive cycle is known. Global
optimization techniques may include fuzzy logic methods [28], or genetic algorithms
[29]. Fuzzy logic methods optimize the entire system efficiency to define the optimal
speed and torque at all given power levels by using the best efficiency curve of the engine
[30]. Genetic algorithms provide efficient and derivative-free approach to solve design
optimization problem. They convert a multi-objective optimization problem into a single
objective problem by evaluating the most important parameter in the design [31].
However these methods are difficult to implement as they require intensive
computational data and future drive cycle information. Also these global optimization
control strategies are specific to a particular vehicle configuration and hence cannot be
easily adapted.
Dynamic real-time control strategies include adaptive fuzzy which minimizes the
fuzzy rules to obtain a desired behavior [32] and adaptive equivalent fuel consumption
minimization strategy (AECMS) which deals with expressing the cost of the electric
motor in terms of the fuel, through the choice of parameters which are critical in
24
achieving best performance [33]. Thus these strategies change the rules based on driving
conditions or other important optimization parameter to obtain an optimal solution.
Static real-time control strategy includes simple rule-based algorithms like load
(or power) follower and thermostat which are discussed in detail in this section [34].
Static real time control methods are implemented based on the predefined rules and
instantaneous data. Rule based control strategy is similar to fuzzy based method.
However, it attempts to optimize the engine efficiency by staying on the efficiency curve,
as opposed to system efficiency in fuzzy logic.
2.1. SELECTION OF POWERTRAIN
A powertrain consists of electrical and mechanical components that generate and
deliver power. In series HEVs, the mechanical energy from the ICE is converted into
electrical energy using a generator as discussed in the previous section. The converted
electrical energy charges the battery to drive the wheels through the electric motor and
mechanical links [35]. Due to decoupling between engine and the wheels there is an
advantage of flexibility in locating the ICE generator set. The series powertrain is best
known for its simple configuration and is most suitable for short trips. However if the
vehicle is to be driven for a longer grade, all the propulsion devices namely, ICE,
generator and motor, should be sized for maximum sustained power making the series
powertrain expensive [3]. But series powertrain configurations also appear to be a best
choice for vehicle designed to provide long all electric range due to their ability to
operate in electric-only mode at high speeds and simplicity in terms of control [36].
25
2.2. RULE-BASED CONTROL STRATEGIES
In this section, the control strategies for a series HEV are discussed using a
predefined Matlab file “gui_series_eng_SUV_explorer_in.m” developed in PSAT. The
ratings of the components used in this predefined series hybrid electric powertrain are
shown in Table 2.1. The series vehicle is a mid-size SUV predefined in PSAT. The
control strategies can be designed depending upon the two operating modes of the
vehicles namely, charge depleting mode (CD) and charge sustaining mode (CS). The
following are the two strategies designed in PSAT depending upon the two operating
modes defined above.
Table 2.1 Ratings of Components in Series Powertrain
Parameter Series Powertrain
ICE peak power (kW) 110
Generator peak power (kW) 110
Electric motor peak power (kW) 170
Battery Capacity (kWh) 1.62
Power Converter Efficiency (%) 95
2.2.1. Load Follower Control Strategy. The load follower control strategy
uses an algorithm where the ICE output power closely follows the wheel power. The ICE
operates over its entire range of power levels and performs fast power transients whereas
the battery state of charge (SOC) remains nearly constant [37] over a given drive cycle
(see Fig. 2.1). Thus the losses associated with charge and discharge of the battery is
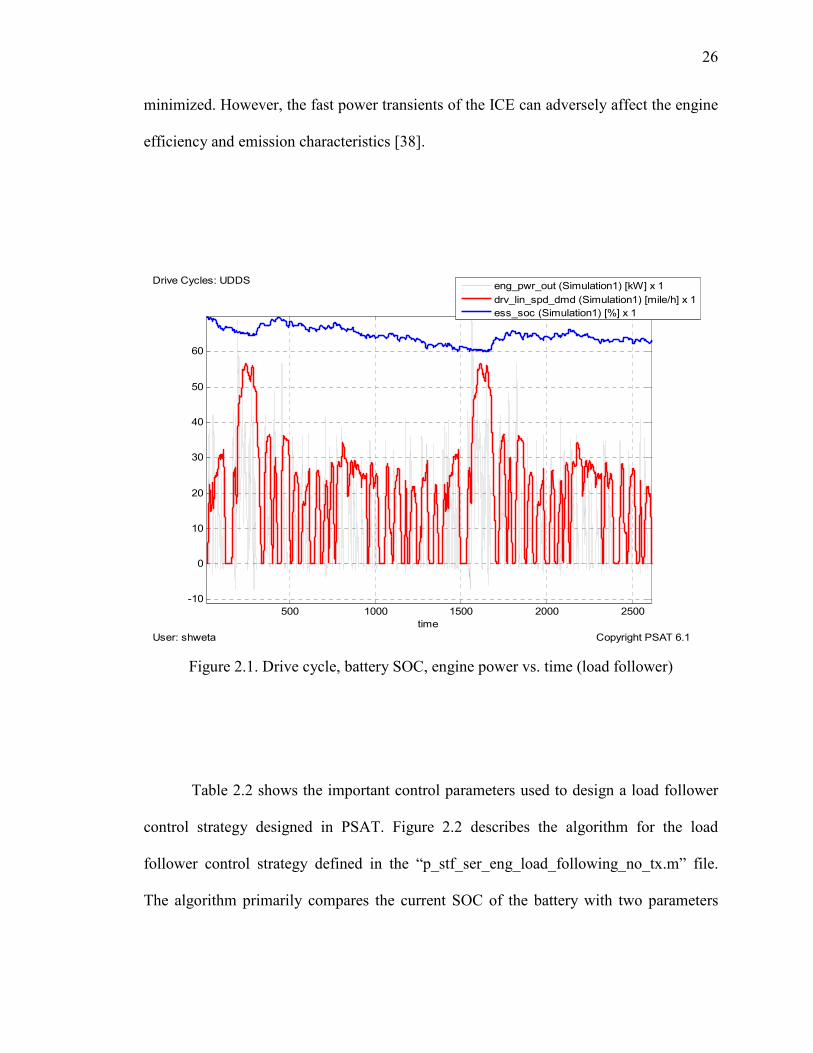
26
minimized. However, the fast power transients of the ICE can adversely affect the engine
efficiency and emission characteristics [38].
Figure 2.1. Drive cycle, battery SOC, engine power vs. time (load follower)
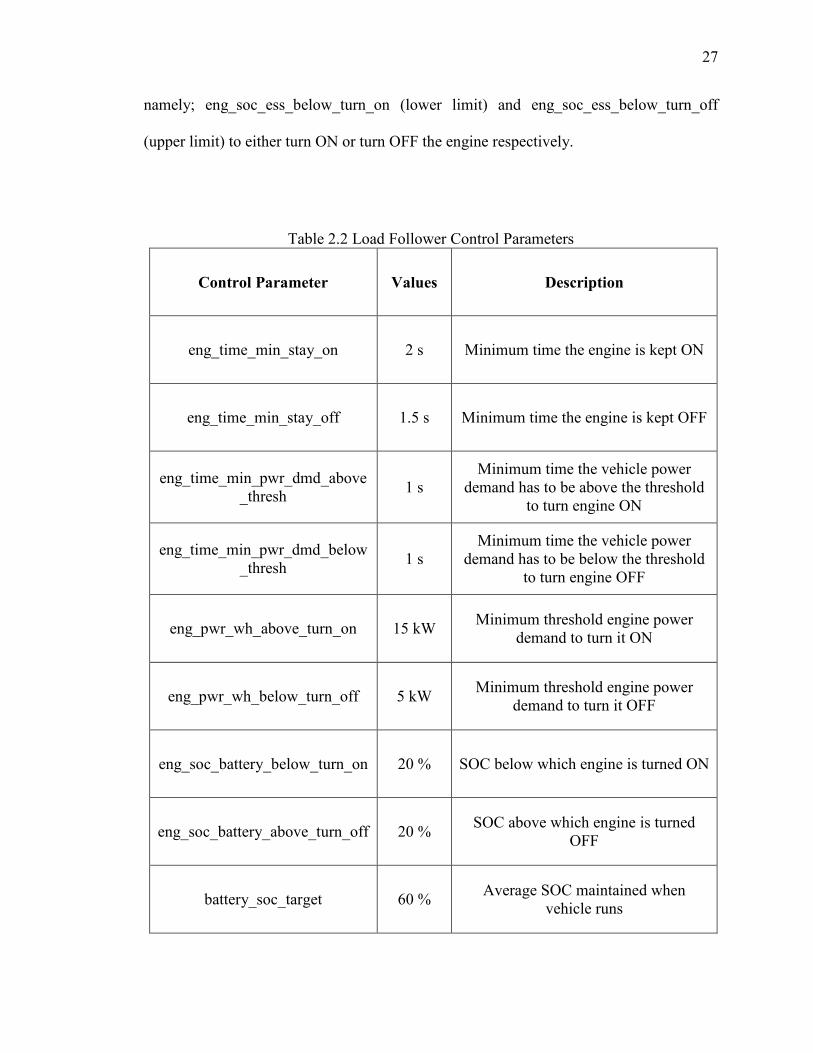
Table 2.2 shows the important control parameters used to design a load follower
control strategy designed in PSAT. Figure 2.2 describes the algorithm for the load
follower control strategy defined in the “p_stf_ser_eng_load_following_no_tx.m” file.
The algorithm primarily compares the current SOC of the battery with two parameters
User: shweta Copyright PSAT 6.1
Drive Cycles: UDDS
500 1000 1500 2000 2500-10
0
10
20
30
40
50
60
time
eng_pwr_out (Simulation1) [kW] x 1drv_lin_spd_dmd (Simulation1) [mile/h] x 1ess_soc (Simulation1) [%] x 1
27
namely; eng_soc_ess_below_turn_on (lower limit) and eng_soc_ess_below_turn_off
(upper limit) to either turn ON or turn OFF the engine respectively.
Table 2.2 Load Follower Control Parameters
Control Parameter Values Description
eng_time_min_stay_on 2 s Minimum time the engine is kept ON
eng_time_min_stay_off 1.5 s Minimum time the engine is kept OFF
eng_time_min_pwr_dmd_above_thresh 1 s
Minimum time the vehicle power demand has to be above the threshold
to turn engine ON
eng_time_min_pwr_dmd_below_thresh 1 s
Minimum time the vehicle power demand has to be below the threshold
to turn engine OFF
eng_pwr_wh_above_turn_on 15 kW Minimum threshold engine power demand to turn it ON
eng_pwr_wh_below_turn_off 5 kW Minimum threshold engine power demand to turn it OFF
eng_soc_battery_below_turn_on 20 % SOC below which engine is turned ON
eng_soc_battery_above_turn_off 20 % SOC above which engine is turned OFF
battery_soc_target 60 % Average SOC maintained when vehicle runs
28
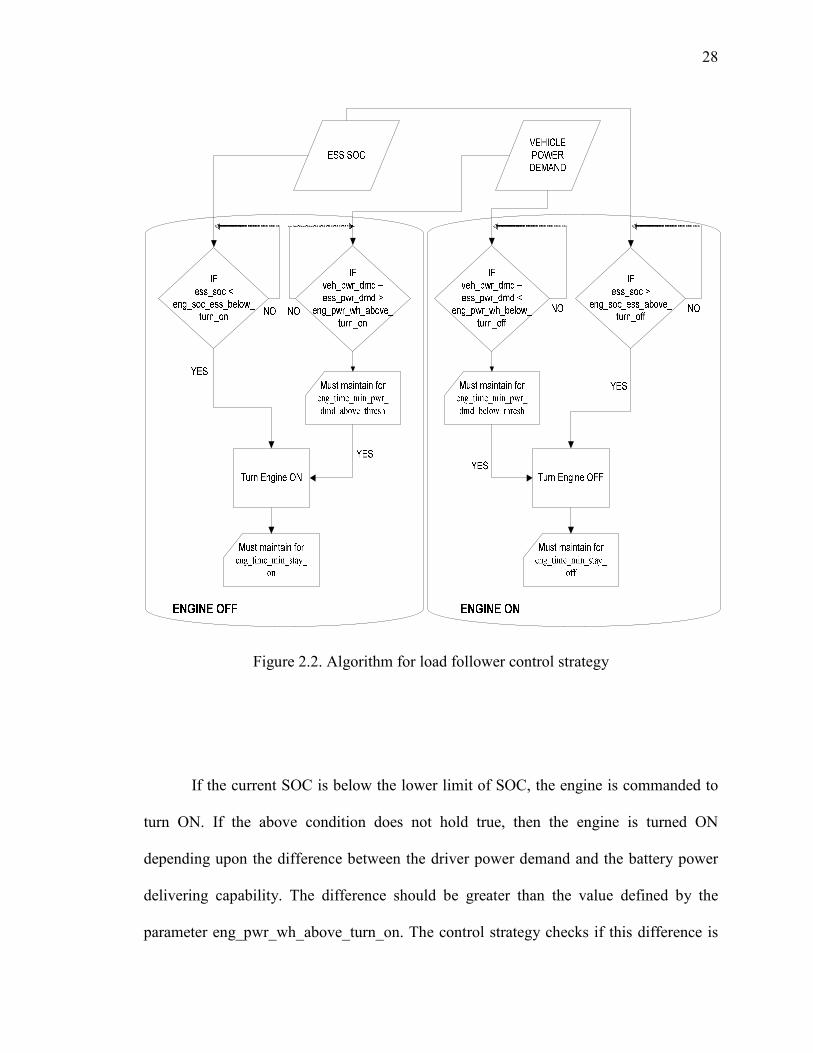
Figure 2.2. Algorithm for load follower control strategy
If the current SOC is below the lower limit of SOC, the engine is commanded to
turn ON. If the above condition does not hold true, then the engine is turned ON
depending upon the difference between the driver power demand and the battery power
delivering capability. The difference should be greater than the value defined by the
parameter eng_pwr_wh_above_turn_on. The control strategy checks if this difference is
29
maintained for the period of time defined by the variable
eng_time_min_pwr_dmd_above_thresh before turning the engine ON. In the load
following strategy, the battery tries to maintain its SOC around a constant value defined
by ess_soc_target, which is maintained at 60% as mentioned in Table 2.2. If the current
SOC value is below 60%, then the engine is turned ON to supply power required for
propelling the vehicle and also to sustain the battery SOC to 60%, i.e. the vehicle
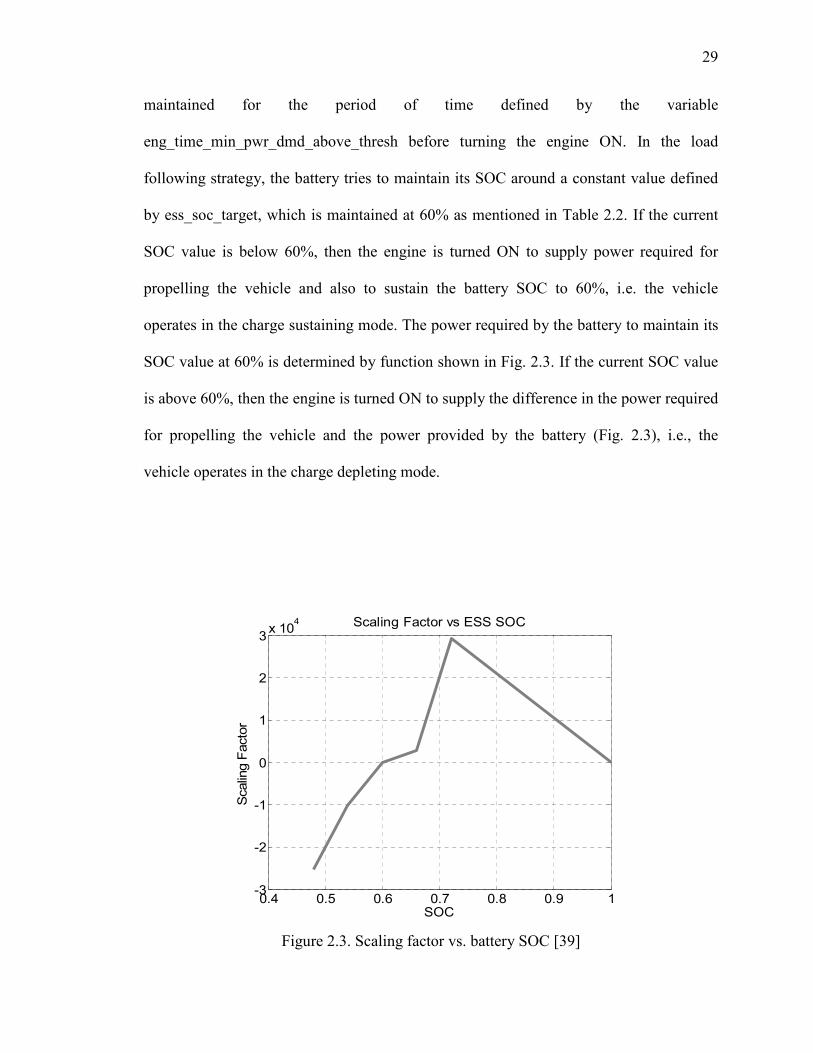
operates in the charge sustaining mode. The power required by the battery to maintain its
SOC value at 60% is determined by function shown in Fig. 2.3. If the current SOC value
is above 60%, then the engine is turned ON to supply the difference in the power required
for propelling the vehicle and the power provided by the battery (Fig. 2.3), i.e., the
vehicle operates in the charge depleting mode.
Figure 2.3. Scaling factor vs. battery SOC [39]
0.4 0.5 0.6 0.7 0.8 0.9 1-3
-2
-1
0
1
2
3x 10⁴
SOC
Scaling Factor
Scaling Factor vs ESS SOC
30
If the current SOC is above the upper limit of SOC, the engine is commanded to
turn OFF. If the above condition does not hold true, then the engine is turned OFF if the
difference between the driver power demand and the battery power delivering capability
is less than the value defined by the parameter eng_pwr_wh_below_turn_off. The control
strategy checks if this difference is maintained for the period of time defined by the
variable eng_time_min_pwr_dmd_below_thresh before turning the engine OFF.
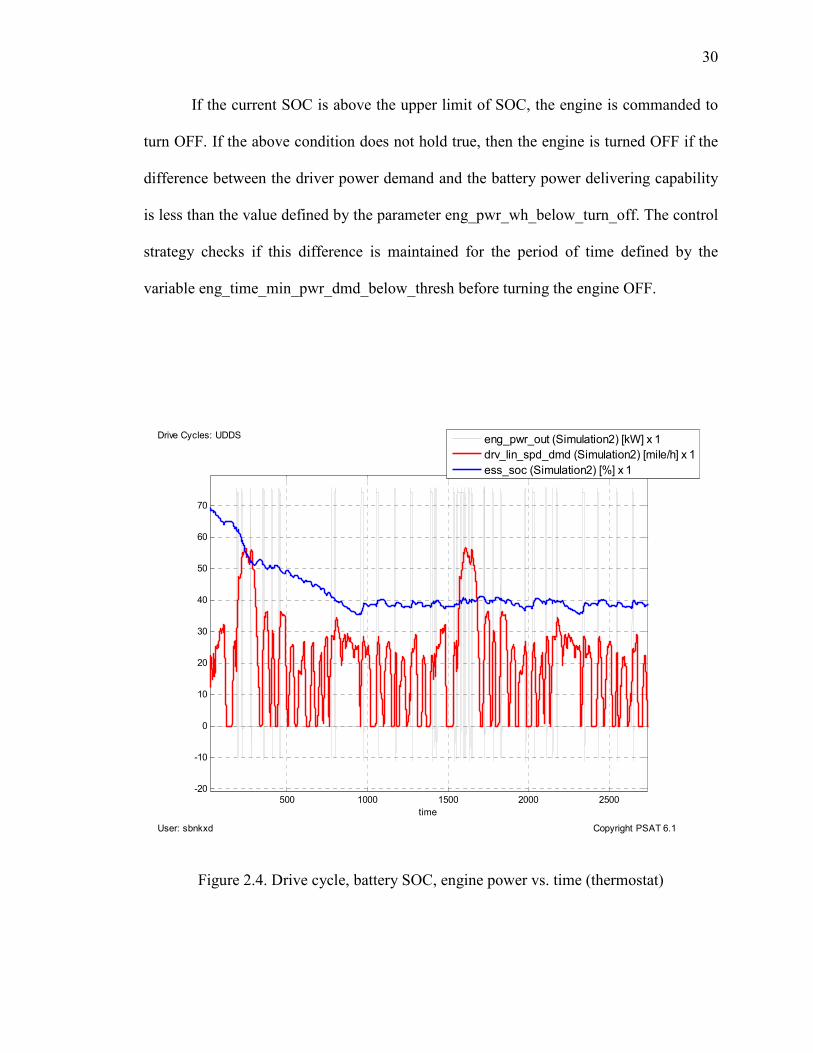
Figure 2.4. Drive cycle, battery SOC, engine power vs. time (thermostat)
User: sbnkxd Copyright PSAT 6.1
Drive Cycles: UDDS
500 1000 1500 2000 2500-20
-10
0
10
20
30
40
50
60
70
time
eng_pwr_out (Simulation2) [kW] x 1drv_lin_spd_dmd (Simulation2) [mile/h] x 1ess_soc (Simulation2) [%] x 1
31
2.2.2. Thermostat Control Strategy. The thermostat control strategy uses
an algorithm to command the ICE. In this strategy, the ICE is turned on when the vehicle
power demand is above a certain level and if the SOC of the battery falls below a certain
lower threshold (vehicle operates in charge sustaining mode). It is turned off when the
SOC exceeds an upper threshold (vehicle operates in charge depleting mode) as shown in
Fig. 2.4.
Table 2.3 Thermostat Control Parameters
Control Parameter Values Description
ess.init.num_cell 75 Initial number of cell connected in series
eng_time_min_stay_on 2 s Minimum time the engine is kept ON
eng_time_min_stay_off 2 s Minimum time the engine is kept OFF
eng_soc_ess_below_turn_on 35 % SOC below which engine is turned ON
eng_soc_ess_above_turn_off 40 % SOC above which engine is turned OFF
ess_pwr_percent_max 90 % Battery percentage of maximum power used in stateflow to decide if battery is
saturated
ess_pwr_percent_max_low 85 % Battery percentage of maximum power used in stateflow to decide if battery is
not saturated
decel_time_min 1 s Minimum time for which wheel torque is < 0 to turn engine OFF
32
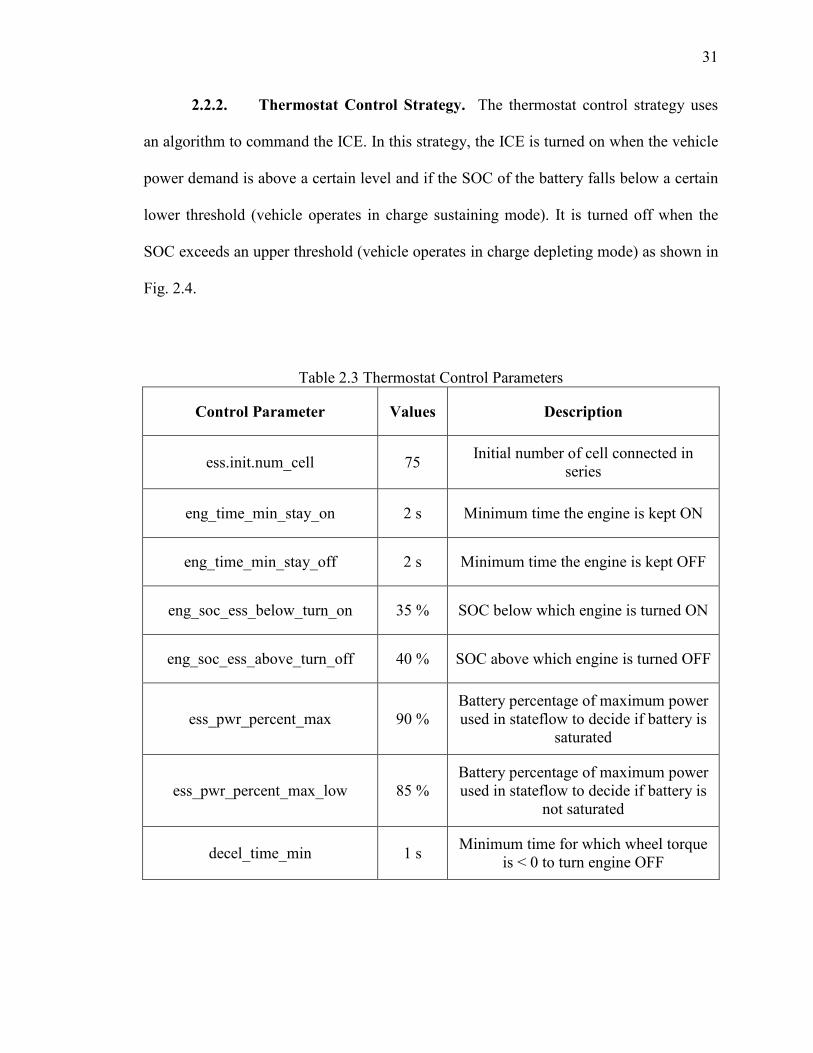
Figure 2.5. Algorithm for thermostat control strategy
Table 2.3 shows the important control parameters used to design a thermostat
control strategy. Figure 2.5 describes the algorithm for the thermostat control strategy
defined in the “p_stf_ser_eng_thermostat_no_tx.m” file. The algorithm primarily
compares the current SOC of the battery with eng_soc_ess_below_turn_on to turn ON
33
the engine. If the current SOC is below this minimum SOC level, the engine is
commanded to turn ON. If the above condition does not hold true, then the engine is
turned ON depending upon the saturation of battery. If the battery is saturated, then the
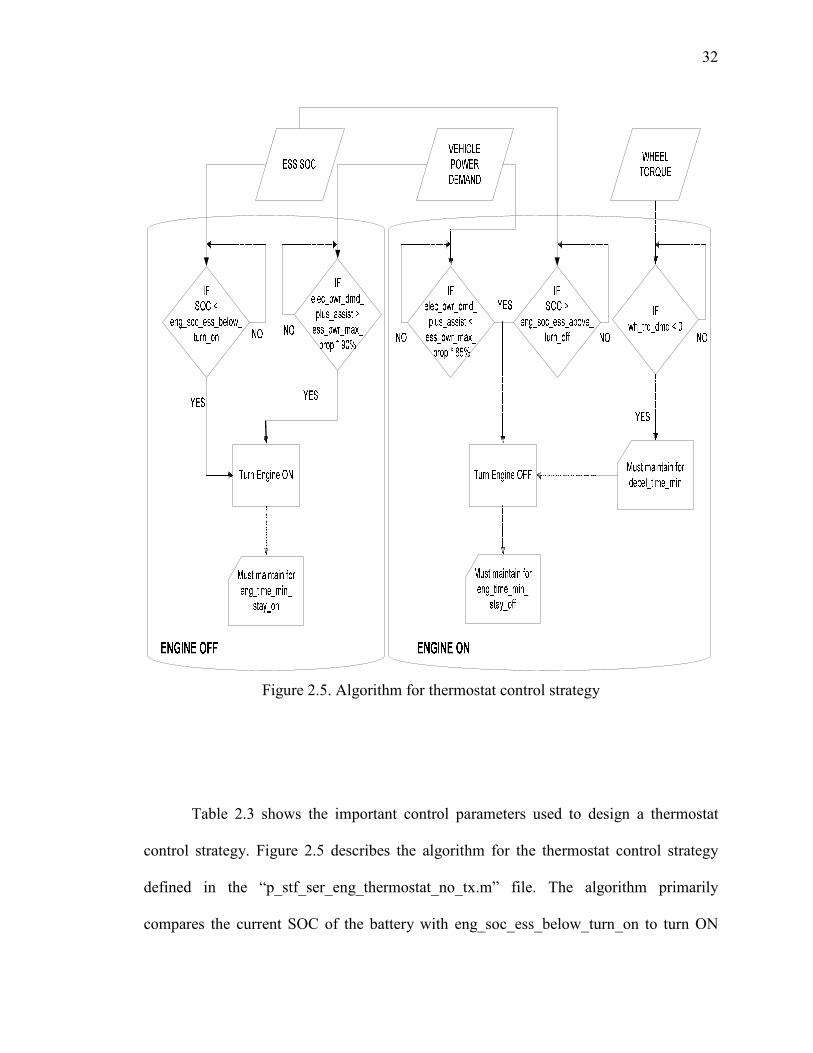
elec_pwr_dmd_plus_assist is greater than the ess_max_pwr_prop times the factor defined
by the variable ess_pwr_percent_max. The variable ess_pwr_max_prop takes the value
from Fig. 2.6 depending upon the current SOC level. Also the value obtained from the
graph is multiplied by the initial number of cells connected in series in the battery. Once
the engine is turned ON it should be ON for at least a few seconds which is defined by
the variable eng_time_min_stay_on.
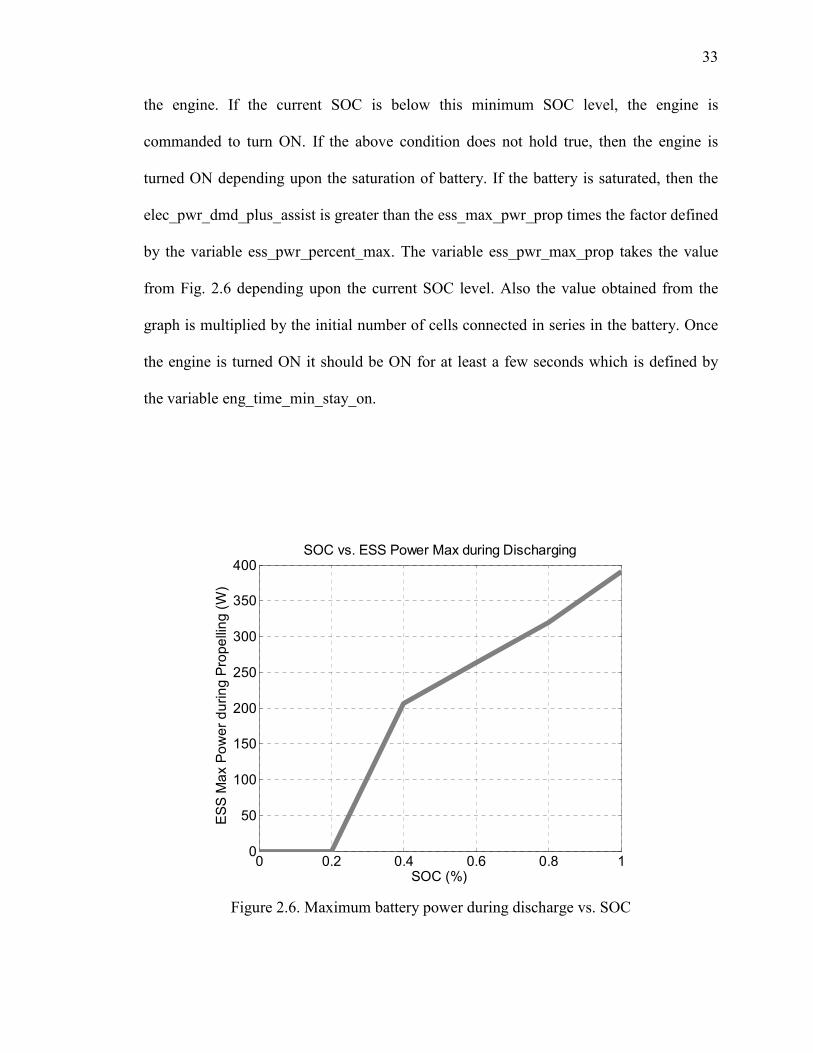
Figure 2.6. Maximum battery power during discharge vs. SOC
0 0.2 0.4 0.6 0.8 10
50
100
150
200
250
300
350
400
SOC (%)
ESS Max Pow
er during Prope
lling
(W)
SOC vs. ESS Power Max during Discharging
34
In order to turn the engine OFF, the algorithm compares the current SOC of the
battery with eng_soc_ess_above_turn_off. If the current SOC is above this upper limit of
the SOC value and if the battery is not saturated, then the engine is commanded to turn
OFF. If the above condition does not hold true, and if the wheel torque demand
(wh_trq_dmd) is negative for a minimum predefined time (decel_time_min), the engine
is still commanded to turn OFF, else it remains ON. Once the engine is turned OFF it
should be OFF for at least a few seconds which is defined by the variable
eng_time_min_stay_off.
2.3. CONTROL STRATEGY BASED ON DRIVING CYCLE
Load follower and thermostat control strategy both have their own advantages and
disadvantages. The main challenges in designing a control strategy is to maintain the
engine operating points on the highest efficient locus to improve the fuel economy and
also keeping the battery SOC level to a reasonable value without overcharging it [19]. In
order to overcome these challenges, the engine should be maintained in its maximum
efficiency region irrespective of the vehicle driving conditions [40]. An optimized control
strategy for the series powertrain can be designed by appropriate selection of the
operating times of the engine and the battery depending upon the drive cycle.
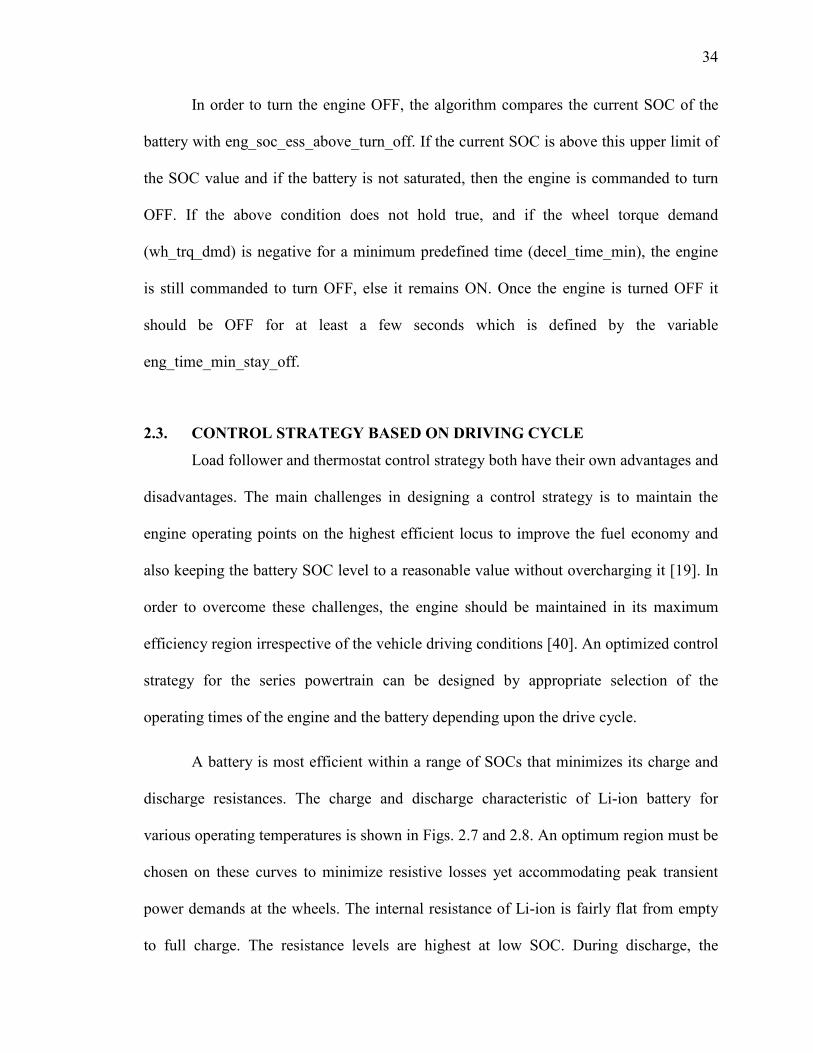
A battery is most efficient within a range of SOCs that minimizes its charge and
discharge resistances. The charge and discharge characteristic of Li-ion battery for
various operating temperatures is shown in Figs. 2.7 and 2.8. An optimum region must be
chosen on these curves to minimize resistive losses yet accommodating peak transient
power demands at the wheels. The internal resistance of Li-ion is fairly flat from empty
to full charge. The resistance levels are highest at low SOC. During discharge, the
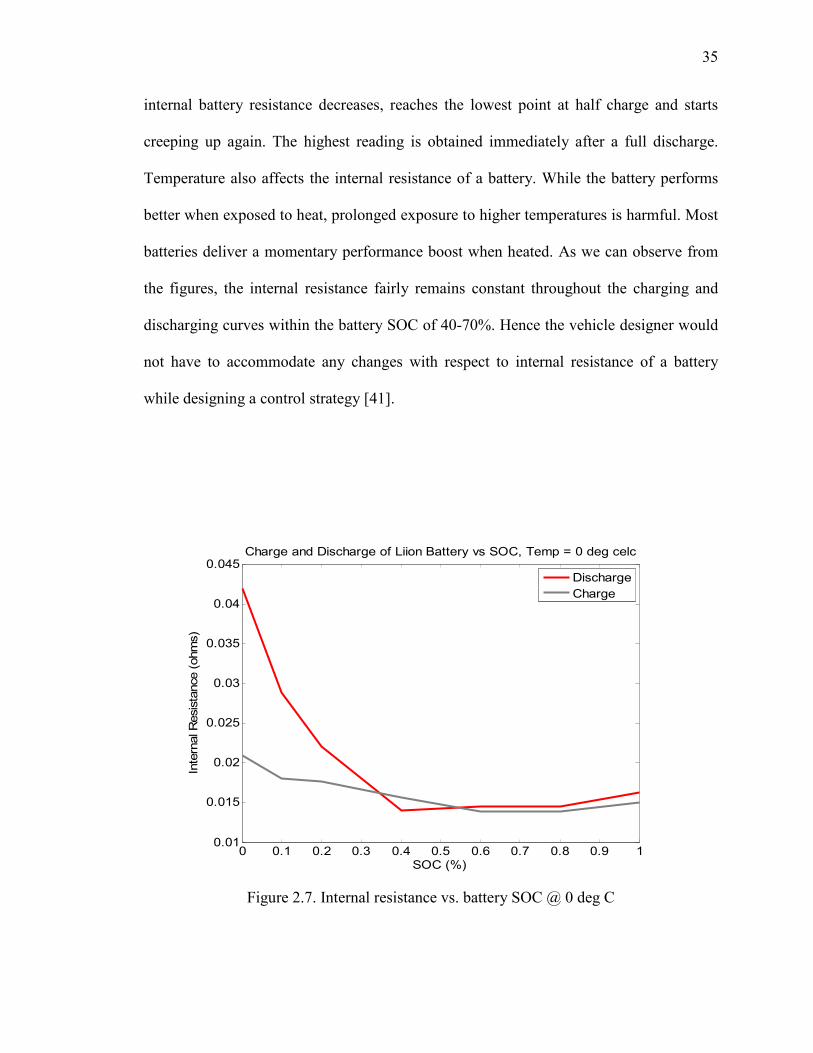
35
internal battery resistance decreases, reaches the lowest point at half charge and starts
creeping up again. The highest reading is obtained immediately after a full discharge.
Temperature also affects the internal resistance of a battery. While the battery performs
better when exposed to heat, prolonged exposure to higher temperatures is harmful. Most
batteries deliver a momentary performance boost when heated. As we can observe from
the figures, the internal resistance fairly remains constant throughout the charging and
discharging curves within the battery SOC of 40-70%. Hence the vehicle designer would
not have to accommodate any changes with respect to internal resistance of a battery
while designing a control strategy [41].
Figure 2.7. Internal resistance vs. battery SOC @ 0 deg C
0 0.1 0.2 0.3 0.4 0.5 0.6 0.7 0.8 0.9 10.01
0.015
0.02
0.025
0.03
0.035
0.04
0.045
SOC (%)
Internal Resistance (ohm
s)
Charge and Discharge of Liion Battery vs SOC, Temp = 0 deg celc
DischargeCharge
36
Figure 2.8. Internal resistance vs. battery SOC @ 25 deg C
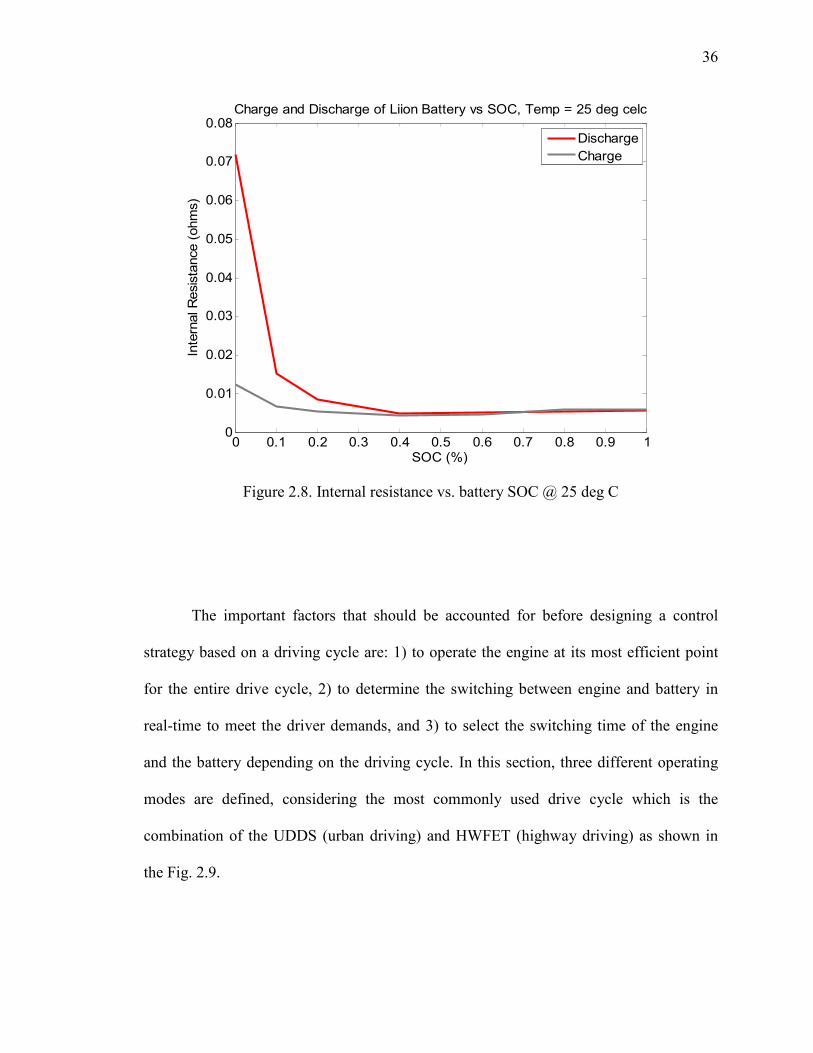
The important factors that should be accounted for before designing a control
strategy based on a driving cycle are: 1) to operate the engine at its most efficient point
for the entire drive cycle, 2) to determine the switching between engine and battery in
real-time to meet the driver demands, and 3) to select the switching time of the engine
and the battery depending on the driving cycle. In this section, three different operating
modes are defined, considering the most commonly used drive cycle which is the
combination of the UDDS (urban driving) and HWFET (highway driving) as shown in
the Fig. 2.9.
0 0.1 0.2 0.3 0.4 0.5 0.6 0.7 0.8 0.9 10
0.01
0.02
0.03
0.04
0.05
0.06
0.07
0.08
SOC (%)
Internal Resistance (ohm
s)
Charge and Discharge of Liion Battery vs SOC, Temp = 25 deg celc
DischargeCharge
37
Figure 2.9. Vehicle speed, battery capacity vs. time [41]
Figure 2.9 shows the vehicle running in UDDS from t = 0s to t = 3000s
approximately. The vehicle then runs in the HWFET from t = 3000s to t = 7500s and
again in the UDDS for the remaining driving cycle. The simulation result indicates that
the SOC of the battery depletes at a higher rate in the HWFET as compared to that in
UDDS if battery alone is used in the HWFET time duration. Hence to ensure the efficient
use of SOC of the battery and to provide high fuel economy three operating modes are
defined as follows [42]:
2.3.1. Electric Power Only Mode. In this mode, the power demand for
propelling the vehicle is only met by the electric power from the battery with the engine
turned off. The engine is turned on to assist the battery only when the driver demand
exceeds the maximum power delivering capability of the battery pack. Electric power
38
only mode is preferred during low speed operation. In the UDDS cycle, the vehicle runs
at lower speeds with frequent braking operation, thus utilizing the maximum benefit of
regenerative braking. The battery gets recharged at each braking operation in the UDDS
cycle thus preventing the battery from depleting to its minimum SOC level.
2.3.2. Engine Power Only Mode. In this mode, only the engine supplies the
driver’s power demand with the battery turned off. The engine is preferably operated at
its most efficient region to improve the fuel economy. The battery is only turned on to
assist the engine when the driver demand exceeds the maximum power delivering
capability of the engine. Engine power only mode is preferred during high speed driving
conditions (HWFET driving cycle). In HWFET, the vehicle runs at approximately
constant high speeds without frequent braking operation. Thus turning on the battery is
not advisable as the battery cannot be recharged to maintain its SOC level above the
minimum level.
2.3.3. Power-assist Mode. Power-assist mode consists of either turning on
the engine during the electric power only mode or turning on the battery during the
engine power only mode. If the engine is turned on during the electric power only mode,
the engine provides the additional power requirement to meet the driver demand, as given
by (1),
39
demand batteryengine demand battery
min min
if P P or,P P P ,
if SOC SOC 10%SOC
>= −
≤ + (1)
If the battery is turned on during the engine power only mode, the engine is made
to operate at its most efficient region and the remaining power demand is supplied by the
battery.
battery demand eng_max_eff demand eng_max_effP P P , if P P= − > (2)
Equation (2) can be implemented only if the SOC of the battery is sufficiently
high and the power demand does not exceed the maximum power delivering capability of
the engine. Equation (3) holds true if the power demand exceeds the maximum power
that the engine can supply.
batte ry d em and eng_m ax dem and eng_m axP P P , if P P= − > (3)
2.4. SIMULATION RESULTS
A combination of driving cycle with urban and highway driving is developed
using PSAT/MATLAB as discussed in Section 1. The combined driving cycle developed
has frequent stops and low speed profile during the first and last part of the driving cycle,
whereas the intermediate part of the driving cycle has less braking and the speed profile
is high. This is the most common driving cycle used. Using the combined driving
condition, simulation is run in PSAT on a series hybrid electric vehicle using all the three
40
control strategies discussed in this section. The initial SOC of the battery is 70% for all
the simulations.
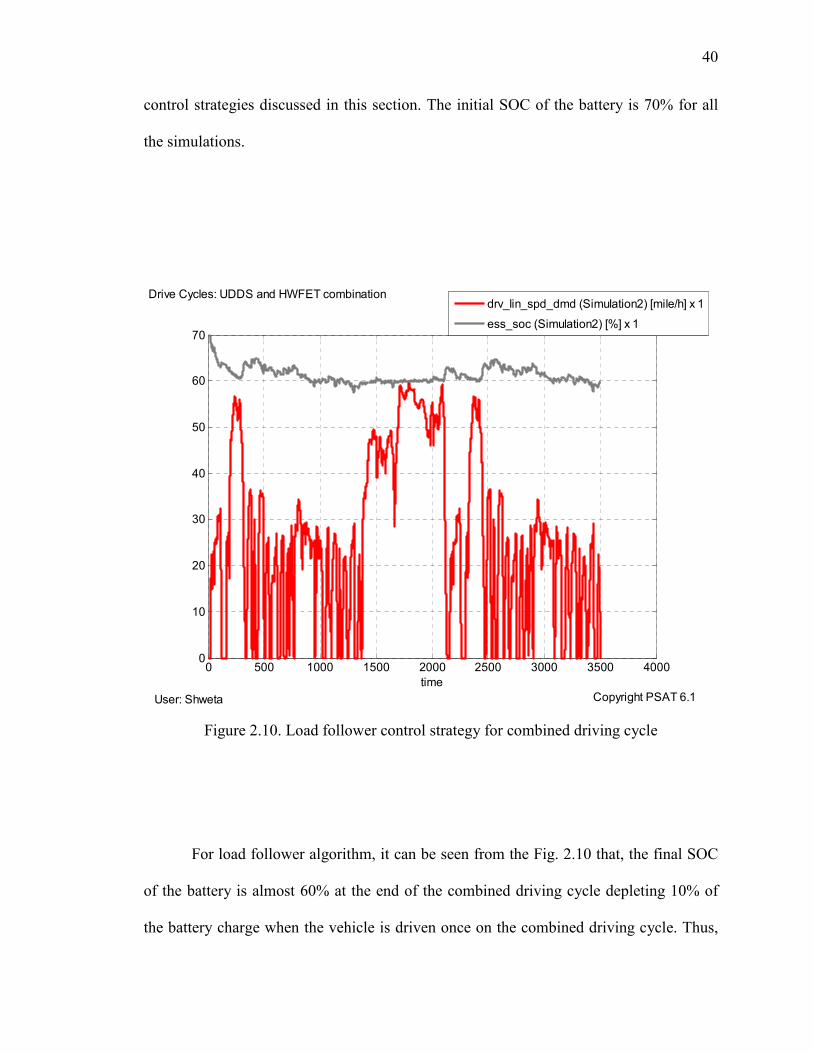
Figure 2.10. Load follower control strategy for combined driving cycle
For load follower algorithm, it can be seen from the Fig. 2.10 that, the final SOC
of the battery is almost 60% at the end of the combined driving cycle depleting 10% of
the battery charge when the vehicle is driven once on the combined driving cycle. Thus,
User: Shweta Copyright PSAT 6.1
Drive Cycles: UDDS and HWFET combination
0 500 1000 1500 2000 2500 3000 3500 40000
10
20
30
40
50
60
70
time
drv_lin_spd_dmd (Simulation2) [mile/h] x 1
ess_soc (Simulation2) [%] x 1
41
the final SOC is less as compared to other two strategies. Also, the fuel economy is not
high as expected if the vehicle is driven on the combined driving condition using load
follower control strategy.
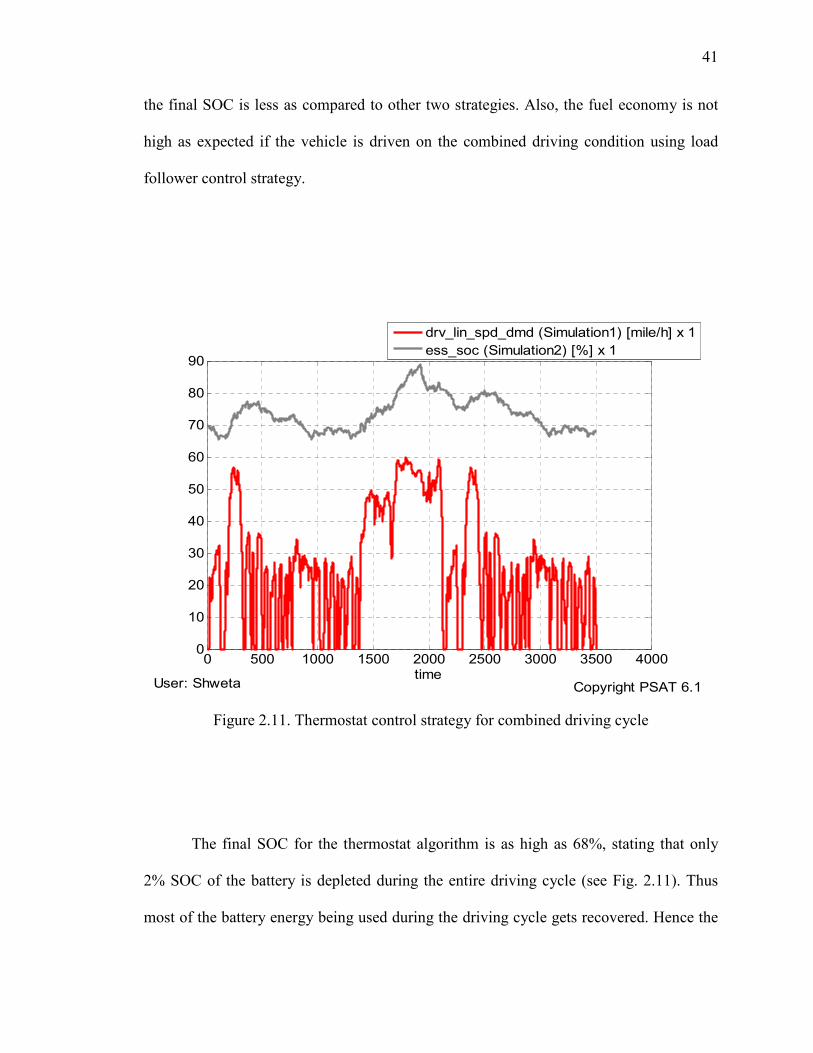
Figure 2.11. Thermostat control strategy for combined driving cycle
The final SOC for the thermostat algorithm is as high as 68%, stating that only
2% SOC of the battery is depleted during the entire driving cycle (see Fig. 2.11). Thus
most of the battery energy being used during the driving cycle gets recovered. Hence the
User: Shweta Copyright PSAT 6.1
0 500 1000 1500 2000 2500 3000 3500 40000
10
20
30
40
50
60
70
80
90
time
drv_lin_spd_dmd (Simulation1) [mile/h] x 1ess_soc (Simulation2) [%] x 1
42
vehicle can be used many times before it actually requires recharging. However, the fuel
economy is less than the load follower strategy.
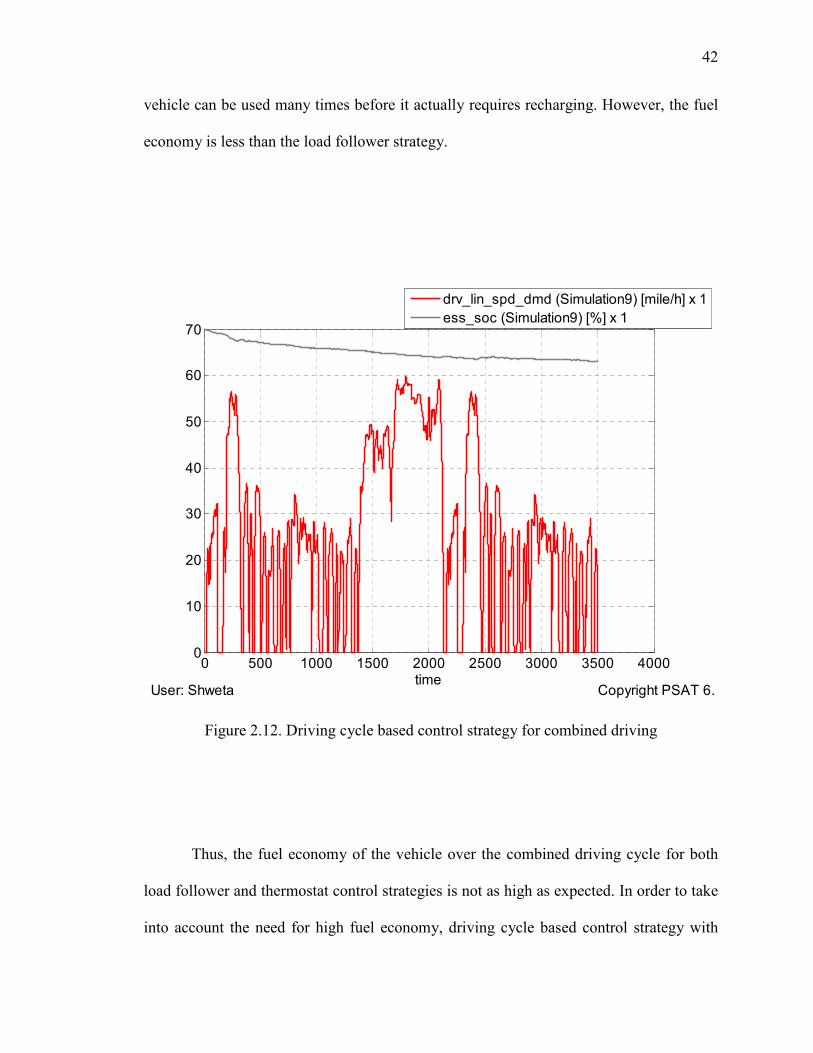
Figure 2.12. Driving cycle based control strategy for combined driving
Thus, the fuel economy of the vehicle over the combined driving cycle for both
load follower and thermostat control strategies is not as high as expected. In order to take
into account the need for high fuel economy, driving cycle based control strategy with
User: Shweta Copyright PSAT 6.1
0 500 1000 1500 2000 2500 3000 3500 40000
10
20
30
40
50
60
70
time
drv_lin_spd_dmd (Simulation9) [mile/h] x 1ess_soc (Simulation9) [%] x 1
43
engine operating in its most efficient region during the highway driving is developed. It
can be seen from the Fig. 2.12 that, the battery SOC is fairly constant at the end of the
combined driving even though a large amount is being depleted during the initial few
seconds due to cold start. Hence, proving that by using engine in its efficient region in the
highway mode and battery in the urban mode a higher fuel economy is obtained
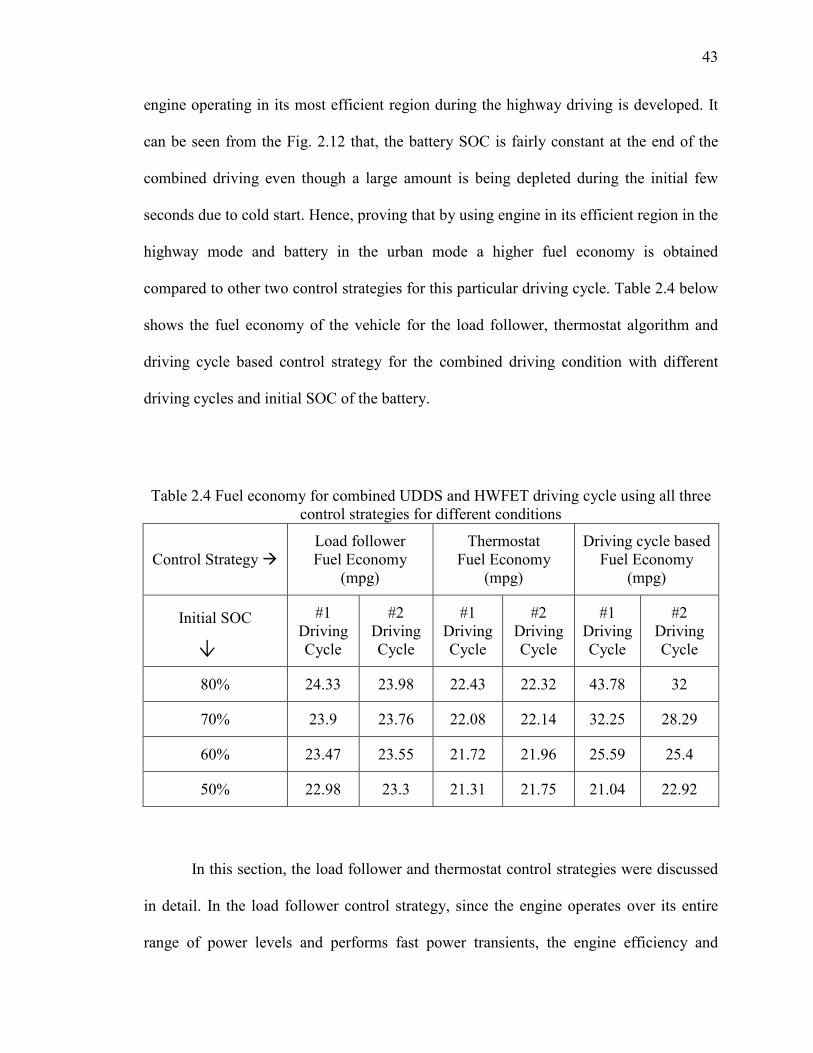
compared to other two control strategies for this particular driving cycle. Table 2.4 below
shows the fuel economy of the vehicle for the load follower, thermostat algorithm and
driving cycle based control strategy for the combined driving condition with different
driving cycles and initial SOC of the battery.
Table 2.4 Fuel economy for combined UDDS and HWFET driving cycle using all three control strategies for different conditions
Control Strategy à Load follower Fuel Economy
(mpg)
Thermostat Fuel Economy
(mpg)
Driving cycle based Fuel Economy
(mpg)
Initial SOC
#1 Driving Cycle
#2 Driving Cycle
#1 Driving Cycle
#2 Driving Cycle
#1 Driving Cycle
#2 Driving Cycle
80% 24.33 23.98 22.43 22.32 43.78 32
70% 23.9 23.76 22.08 22.14 32.25 28.29
60% 23.47 23.55 21.72 21.96 25.59 25.4
50% 22.98 23.3 21.31 21.75 21.04 22.92
In this section, the load follower and thermostat control strategies were discussed
in detail. In the load follower control strategy, since the engine operates over its entire
range of power levels and performs fast power transients, the engine efficiency and
44
emission characteristics are adversely affected. Also, the losses associated with charge
and discharge of the battery are minimized as SOC of the battery remains nearly constant
over a given drive cycle. In the thermostat control strategy, the battery provides most of
the power during the charge depleting mode, thus reducing the SOC to lower levels at the
end of the drive cycle. This in turn increases the frequency of switching of the engine, in
the charge sustaining mode, which increases the gas emissions and is also detrimental to
the engine.
Furthermore, in this section, an attempt has been made to design a control strategy
based on the most common driving cycle for a series hybrid powertrain ensuring the
advantages of both the load follower and thermostat control strategies. Three modes of
operation have been proposed for this control strategy based on the combined urban and
highway driving cycle. However, calculation of the operation times of the engine and
battery in real time is a difficult problem and huge sums of money and time are being
spent to generalize an optimum control strategy over various drive cycles.
45
3. EFFECTS OF BATTERY CAPACITY ON THE PERFORMANCE OF
ELECTRIC-DRIVE VEHICLES
In any PHEV architecture, the energy storage system (ESS) plays an important
role in the powertrain. The electric energy stored in the ESS is obtained either from the
electric grid, the gasoline engine through a generator, or regenerative braking. The
commercial success of PHEVs depends on the development of appropriate battery
technologies. As stated in [43], the challenge is to develop batteries that are able to
perform the requirements imposed by a PHEV system and yet meet market expectations
in terms of cost and cycle life. When a PHEV is completely charged, it relies mostly on
its energy storage system (ESS) for the first few miles of the drive cycle. Afterwards, it
operates like a conventional HEV. The capacity of the ESS of a PHEV is larger than that
of a conventional HEV. In order to improve the overall efficiency of the system, optimal
energy management strategies which determine the power split between the ICE and ESS
need to be employed. Different strategies are described in [7] exploring possible energy
management strategies.
The determination of the design parameters associated with the ESS is a critical
step in the design of PHEVs. In addition, vehicle’s energy management algorithm needs
to have variables like power, energy and the state of charge (SOC) window of the ESS
available. These variables largely affect the cost, mass, volume, fuel economy and cycle
life of the vehicle. The battery constitutes about 25-75% of the vehicle in terms of
volume, cost and weight [44]. The power stored in the energy storage system is a
function of the power demand imposed by the driving cycle [45]. The usable capacity of
the ESS is defined as the electric range capability [46]. The usable SOC window relates
46
the total energy capacity and hence it is necessary to maximize the usable SOC window
for PHEVs. Therefore, it would help in reducing the total energy capacity.
In order to utilize best energy management strategies, in this section, a series of
investigation is done on different battery and power management parameters. The
vehicle model is developed using the Powertrain System Analysis Toolkit (PSAT)
developed by the Argonne National Laboratory [47].
3.1. DESIGN PARAMETERS
3.1.1. Powertrain. A PHEV powertrain differs from conventional HEVs in
terms of its battery module. Series configuration is considered over other vehicle
configurations while converting a hybrid electric vehicle to a plug-in hybrid electric
vehicle due to the fact that electric motor is already rated for the maximum output power
demanded by the driver [48]. Thus series configuration is considered for the simulation
analysis in this section. The architecture of series powertrain is briefly discussed in the
Section 1.
3.1.2. Controller Strategy. The advantages and disadvantages of both load
follower and thermostat control strategy are discussed in the previous section. A
thermostat algorithm is chosen for the performance analysis of the PHEVs, due to the fact
that, energy storage system is primarily used in this algorithm. The engine is only used
when the battery is unable to provide large power demands and during the charge
sustaining mode.
47
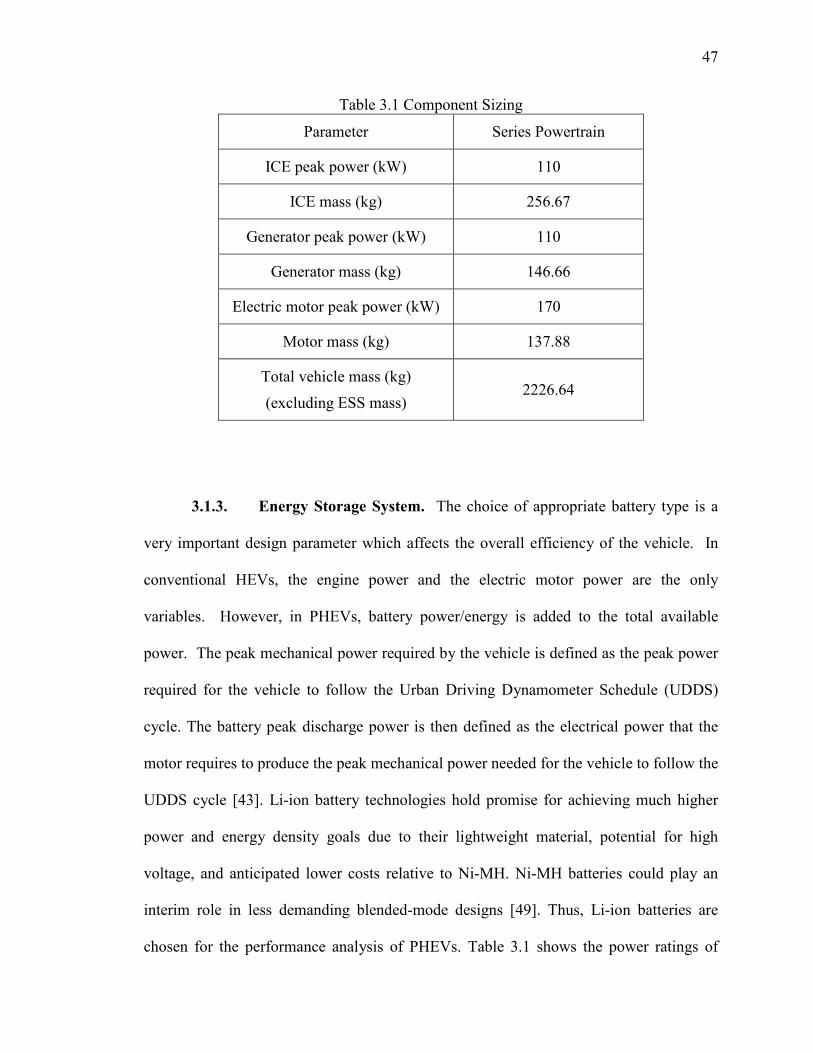
Table 3.1 Component Sizing
Parameter Series Powertrain
ICE peak power (kW) 110
ICE mass (kg) 256.67
Generator peak power (kW) 110
Generator mass (kg) 146.66
Electric motor peak power (kW) 170
Motor mass (kg) 137.88
Total vehicle mass (kg)
(excluding ESS mass) 2226.64
3.1.3. Energy Storage System. The choice of appropriate battery type is a
very important design parameter which affects the overall efficiency of the vehicle. In
conventional HEVs, the engine power and the electric motor power are the only
variables. However, in PHEVs, battery power/energy is added to the total available
power. The peak mechanical power required by the vehicle is defined as the peak power
required for the vehicle to follow the Urban Driving Dynamometer Schedule (UDDS)
cycle. The battery peak discharge power is then defined as the electrical power that the
motor requires to produce the peak mechanical power needed for the vehicle to follow the
UDDS cycle [43]. Li-ion battery technologies hold promise for achieving much higher
power and energy density goals due to their lightweight material, potential for high
voltage, and anticipated lower costs relative to Ni-MH. Ni-MH batteries could play an
interim role in less demanding blended-mode designs [49]. Thus, Li-ion batteries are
chosen for the performance analysis of PHEVs. Table 3.1 shows the power ratings of
48
electrical and mechanical components used in the series powertrain obtained from the
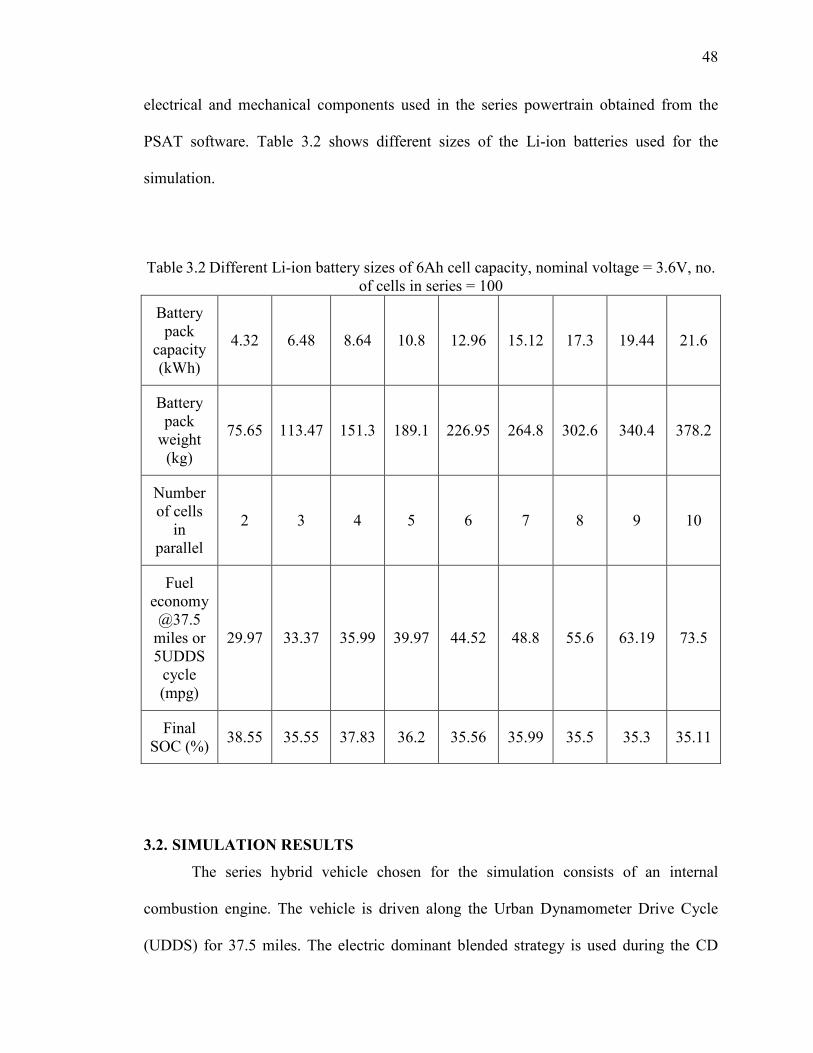
PSAT software. Table 3.2 shows different sizes of the Li-ion batteries used for the
simulation.
Table 3.2 Different Li-ion battery sizes of 6Ah cell capacity, nominal voltage = 3.6V, no. of cells in series = 100
Battery pack
capacity (kWh)
4.32 6.48 8.64 10.8 12.96 15.12 17.3 19.44 21.6
Battery pack weight (kg)
75.65 113.47 151.3 189.1 226.95 264.8 302.6 340.4 378.2
Number of cells
in parallel
2 3 4 5 6 7 8 9 10
Fuel economy @37.5 miles or 5UDDS cycle (mpg)
29.97 33.37 35.99 39.97 44.52 48.8 55.6 63.19 73.5
Final SOC (%) 38.55 35.55 37.83 36.2 35.56 35.99 35.5 35.3 35.11
3.2. SIMULATION RESULTS
The series hybrid vehicle chosen for the simulation consists of an internal
combustion engine. The vehicle is driven along the Urban Dynamometer Drive Cycle
(UDDS) for 37.5 miles. The electric dominant blended strategy is used during the CD
49
mode. The electric dominant blended strategy is the one in which battery is allowed to
deplete to a lower threshold value of state of charge in the CD mode and ICE is used only
to assist the battery during high power demands. Thus, the battery SOC plays an
important role in the simulation as it determines the charging and discharging of the
battery. The simulations were hence carried out by varying the initial SOC and by
varying the SOC window.
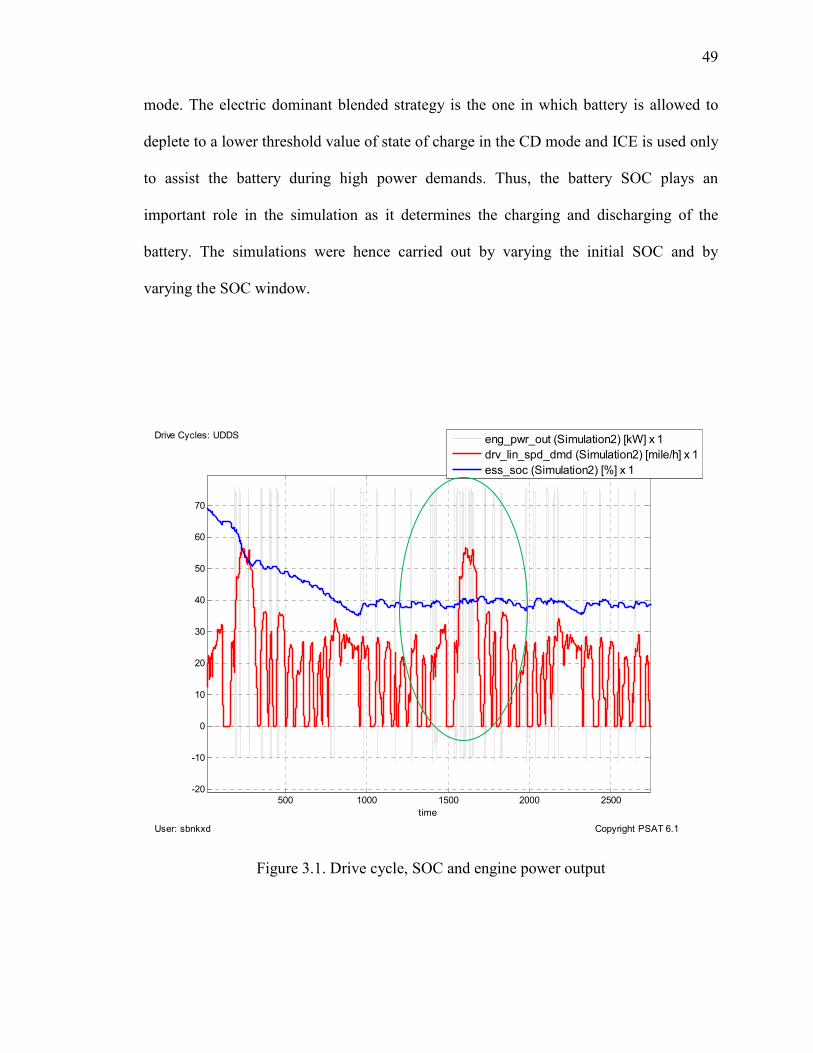
Figure 3.1. Drive cycle, SOC and engine power output
User: sbnkxd Copyright PSAT 6.1
Drive Cycles: UDDS
500 1000 1500 2000 2500-20
-10
0
10
20
30
40
50
60
70
time
eng_pwr_out (Simulation2) [kW] x 1drv_lin_spd_dmd (Simulation2) [mile/h] x 1ess_soc (Simulation2) [%] x 1
50
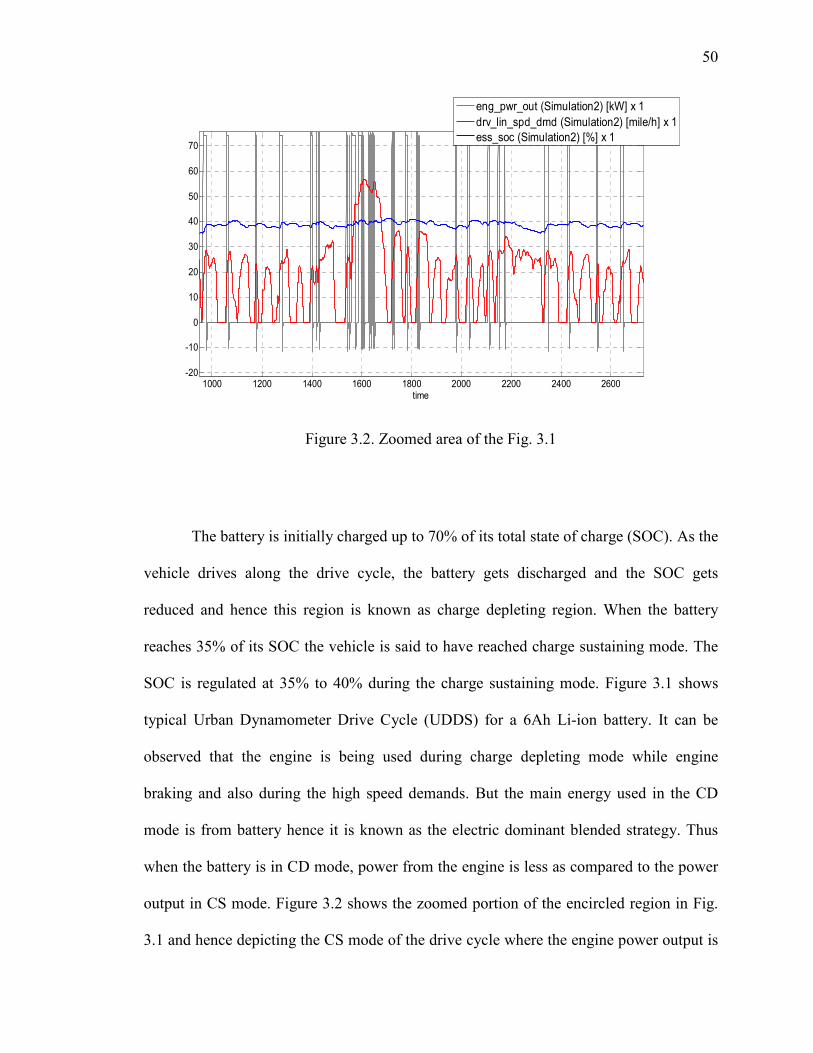
Figure 3.2. Zoomed area of the Fig. 3.1
The battery is initially charged up to 70% of its total state of charge (SOC). As the
vehicle drives along the drive cycle, the battery gets discharged and the SOC gets
reduced and hence this region is known as charge depleting region. When the battery
reaches 35% of its SOC the vehicle is said to have reached charge sustaining mode. The
SOC is regulated at 35% to 40% during the charge sustaining mode. Figure 3.1 shows
typical Urban Dynamometer Drive Cycle (UDDS) for a 6Ah Li-ion battery. It can be
observed that the engine is being used during charge depleting mode while engine
braking and also during the high speed demands. But the main energy used in the CD
mode is from battery hence it is known as the electric dominant blended strategy. Thus
when the battery is in CD mode, power from the engine is less as compared to the power
output in CS mode. Figure 3.2 shows the zoomed portion of the encircled region in Fig.
3.1 and hence depicting the CS mode of the drive cycle where the engine power output is
1000 1200 1400 1600 1800 2000 2200 2400 2600-20
-10
0
10
20
30
40
50
60
70
time
eng_pwr_out (Simulation2) [kW] x 1drv_lin_spd_dmd (Simulation2) [mile/h] x 1ess_soc (Simulation2) [%] x 1
51
more. It can be observed that the SOC in the CS mode is regulated at the specified SOC
range.
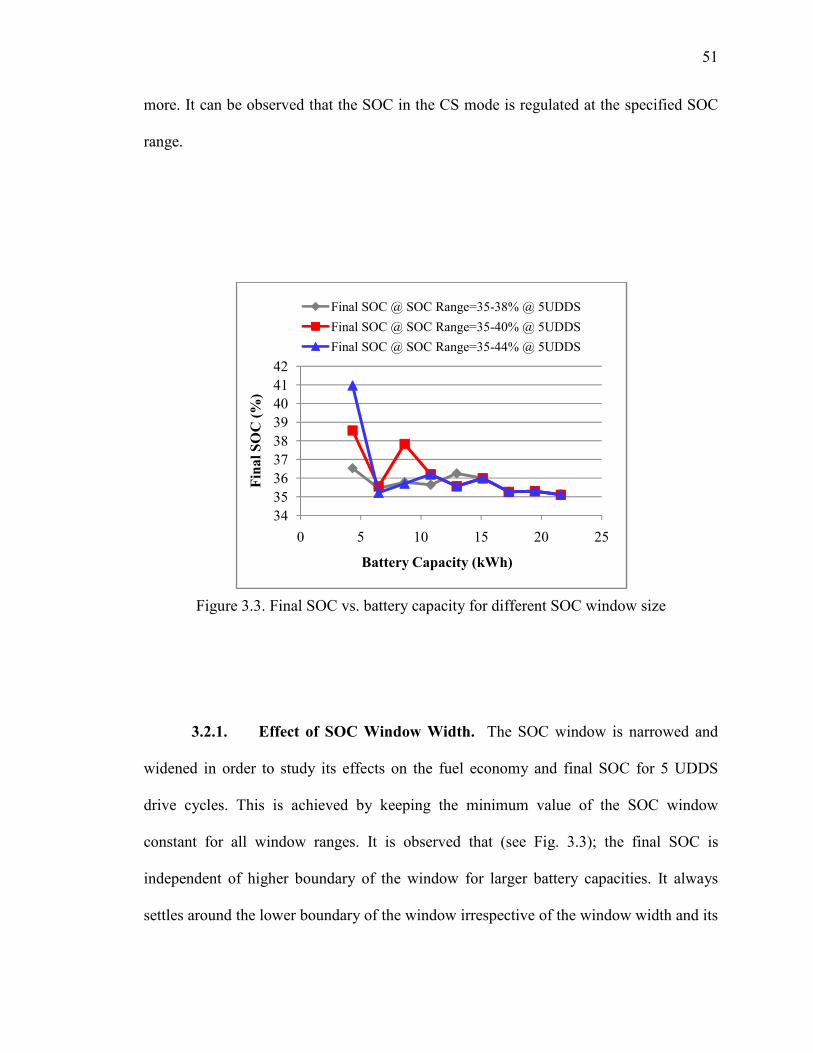
Figure 3.3. Final SOC vs. battery capacity for different SOC window size
3.2.1. Effect of SOC Window Width. The SOC window is narrowed and
widened in order to study its effects on the fuel economy and final SOC for 5 UDDS
drive cycles. This is achieved by keeping the minimum value of the SOC window
constant for all window ranges. It is observed that (see Fig. 3.3); the final SOC is
independent of higher boundary of the window for larger battery capacities. It always
settles around the lower boundary of the window irrespective of the window width and its
343536373839404142
0 5 10 15 20 25
Final SOC (%
)
Battery Capacity (kWh)
Final SOC @ SOC Range=35-38% @ 5UDDS
Final SOC @ SOC Range=35-40% @ 5UDDS
Final SOC @ SOC Range=35-44% @ 5UDDS
52
upper limit. The final SOC for smaller values of battery size is settled around the higher
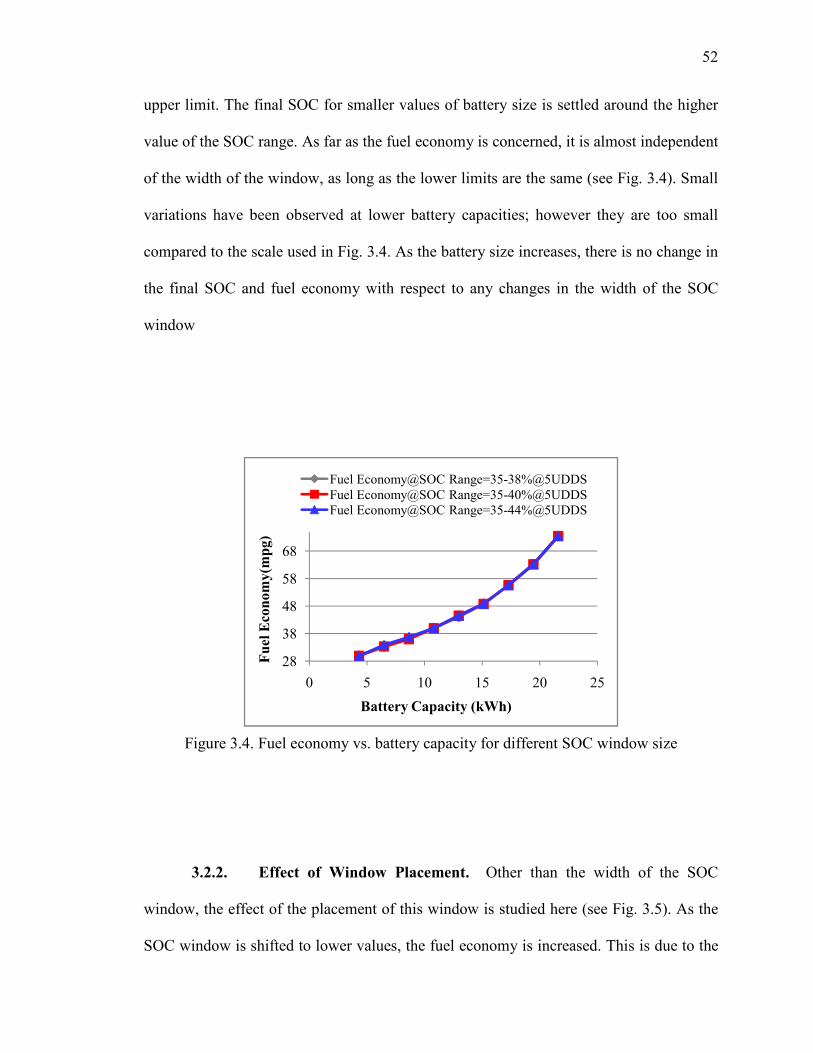
value of the SOC range. As far as the fuel economy is concerned, it is almost independent
of the width of the window, as long as the lower limits are the same (see Fig. 3.4). Small
variations have been observed at lower battery capacities; however they are too small
compared to the scale used in Fig. 3.4. As the battery size increases, there is no change in
the final SOC and fuel economy with respect to any changes in the width of the SOC
window
Figure 3.4. Fuel economy vs. battery capacity for different SOC window size
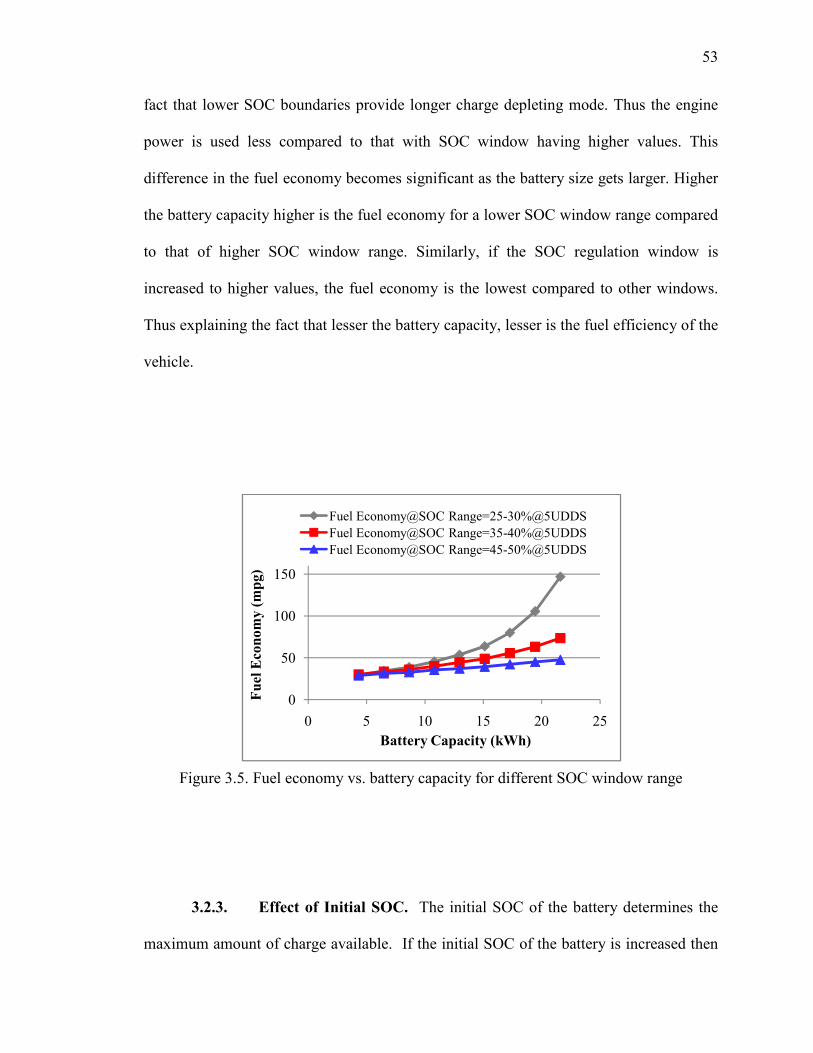
3.2.2. Effect of Window Placement. Other than the width of the SOC
window, the effect of the placement of this window is studied here (see Fig. 3.5). As the
SOC window is shifted to lower values, the fuel economy is increased. This is due to the
28
38
48
58
68
0 5 10 15 20 25
Fue
l Eco
nomy(mpg
)
Battery Capacity (kWh)
Fuel Economy@SOC Range=35-38%@5UDDSFuel Economy@SOC Range=35-40%@5UDDSFuel Economy@SOC Range=35-44%@5UDDS
53
fact that lower SOC boundaries provide longer charge depleting mode. Thus the engine
power is used less compared to that with SOC window having higher values. This
difference in the fuel economy becomes significant as the battery size gets larger. Higher
the battery capacity higher is the fuel economy for a lower SOC window range compared
to that of higher SOC window range. Similarly, if the SOC regulation window is
increased to higher values, the fuel economy is the lowest compared to other windows.
Thus explaining the fact that lesser the battery capacity, lesser is the fuel efficiency of the
vehicle.
Figure 3.5. Fuel economy vs. battery capacity for different SOC window range
3.2.3. Effect of Initial SOC. The initial SOC of the battery determines the
maximum amount of charge available. If the initial SOC of the battery is increased then
0
50
100
150
0 5 10 15 20 25
Fue
l Eco
nomy (m
pg)
Battery Capacity (kWh)
Fuel Economy@SOC Range=25-30%@5UDDSFuel Economy@SOC Range=35-40%@5UDDSFuel Economy@SOC Range=45-50%@5UDDS
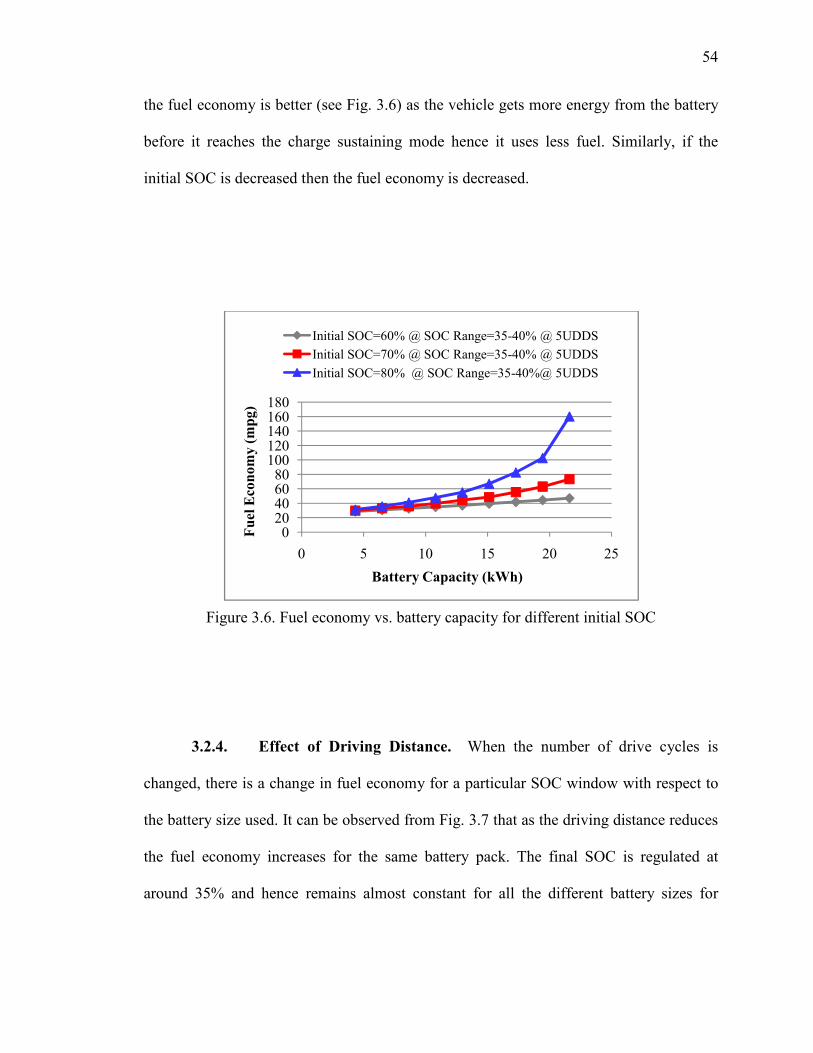
54
the fuel economy is better (see Fig. 3.6) as the vehicle gets more energy from the battery
before it reaches the charge sustaining mode hence it uses less fuel. Similarly, if the
initial SOC is decreased then the fuel economy is decreased.
Figure 3.6. Fuel economy vs. battery capacity for different initial SOC
3.2.4. Effect of Driving Distance. When the number of drive cycles is
changed, there is a change in fuel economy for a particular SOC window with respect to
the battery size used. It can be observed from Fig. 3.7 that as the driving distance reduces
the fuel economy increases for the same battery pack. The final SOC is regulated at
around 35% and hence remains almost constant for all the different battery sizes for
020406080100120140160180
0 5 10 15 20 25
Fue
l Eco
nomy (m
pg)
Battery Capacity (kWh)
Initial SOC=60% @ SOC Range=35-40% @ 5UDDSInitial SOC=70% @ SOC Range=35-40% @ 5UDDSInitial SOC=80% @ SOC Range=35-40%@ 5UDDS
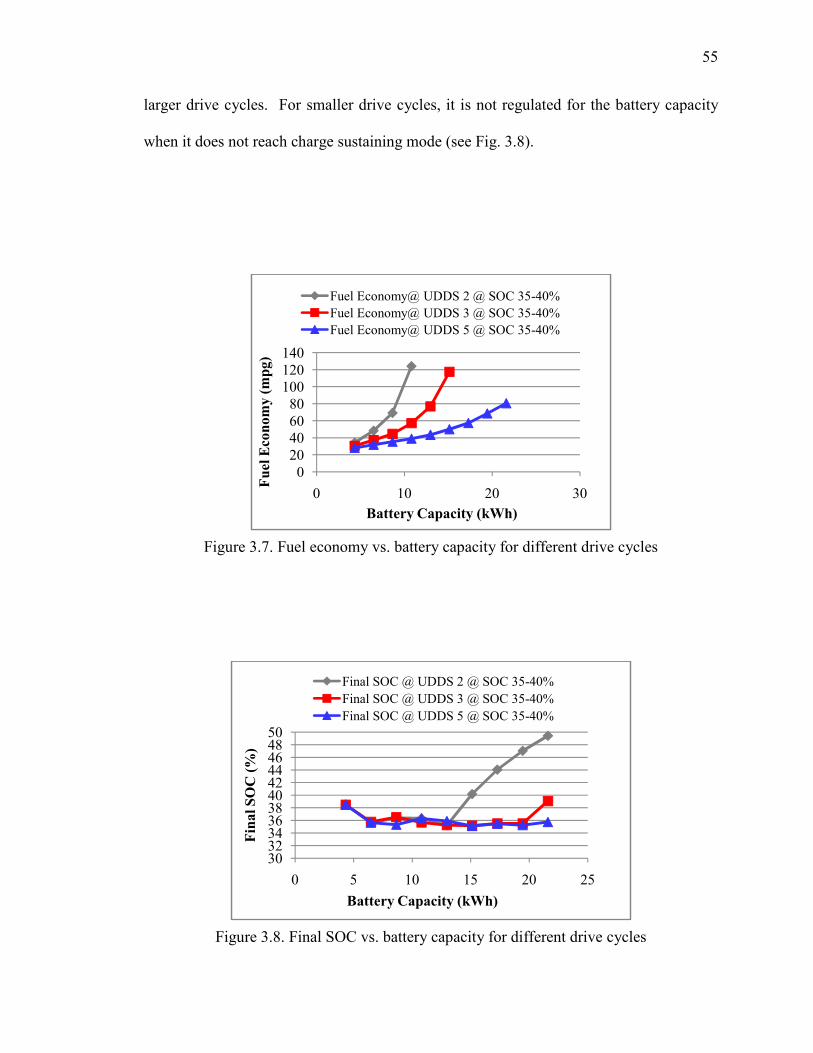
55
larger drive cycles. For smaller drive cycles, it is not regulated for the battery capacity
when it does not reach charge sustaining mode (see Fig. 3.8).
Figure 3.7. Fuel economy vs. battery capacity for different drive cycles
Figure 3.8. Final SOC vs. battery capacity for different drive cycles
020406080100120140
0 10 20 30
Fue
l Eco
nomy (m
pg)
Battery Capacity (kWh)
Fuel Economy@ UDDS 2 @ SOC 35-40%Fuel Economy@ UDDS 3 @ SOC 35-40%Fuel Economy@ UDDS 5 @ SOC 35-40%
3032343638404244464850
0 5 10 15 20 25
Final SOC (%
)
Battery Capacity (kWh)
Final SOC @ UDDS 2 @ SOC 35-40%Final SOC @ UDDS 3 @ SOC 35-40%Final SOC @ UDDS 5 @ SOC 35-40%
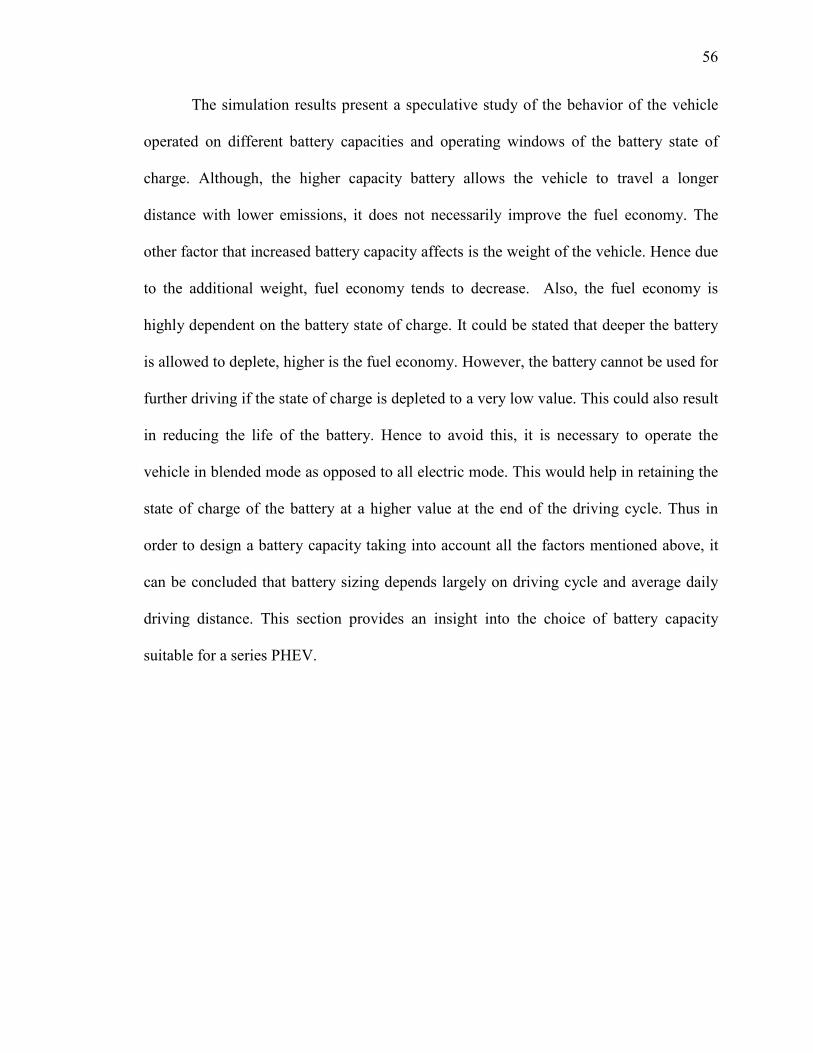
56
The simulation results present a speculative study of the behavior of the vehicle
operated on different battery capacities and operating windows of the battery state of
charge. Although, the higher capacity battery allows the vehicle to travel a longer
distance with lower emissions, it does not necessarily improve the fuel economy. The
other factor that increased battery capacity affects is the weight of the vehicle. Hence due
to the additional weight, fuel economy tends to decrease. Also, the fuel economy is
highly dependent on the battery state of charge. It could be stated that deeper the battery
is allowed to deplete, higher is the fuel economy. However, the battery cannot be used for
further driving if the state of charge is depleted to a very low value. This could also result
in reducing the life of the battery. Hence to avoid this, it is necessary to operate the
vehicle in blended mode as opposed to all electric mode. This would help in retaining the
state of charge of the battery at a higher value at the end of the driving cycle. Thus in
order to design a battery capacity taking into account all the factors mentioned above, it
can be concluded that battery sizing depends largely on driving cycle and average daily
driving distance. This section provides an insight into the choice of battery capacity
suitable for a series PHEV.
57
4. CONCLUSION
Due to increasing fuel prices and green house gas emissions, conventional
vehicles pose a threat to the environment and hence use of hybrid and plug-in hybrid
electric vehicles have gained importance. In order to make these electric drive vehicles
successful, many design challenges need to be addressed. In this thesis, rule-based and
driving cycle based control strategies have been applied to a series hybrid powertrain and
the results are compared. Rule-based control strategies namely, load follower and
thermostat control algorithm, are useful in following the output power required at the
wheels and maintaining the state of charge of the battery in a predetermined range
respectively. However, these control strategies are not efficient for all the driving cycles
and hence a control strategy is proposed for a driving cycle which is being commonly
used combining urban and highway driving conditions. This control strategy gives a
better fuel economy as compared to the load follower and thermostat control strategies
for the combined driving cycle. Hence in order to design a control strategy for a higher
fuel economy, it is necessary that the driving cycle is previously known. The control
strategy also depends on other parameters in the powertrain and hence the algorithm
would vary.
Another important parameter that has been discussed in this thesis is the sizing of
the energy storage system. The energy storage systems must be sized such that a
sufficient amount of energy is stored and also to provide adequate power in order to meet
the acceleration performance and appropriate driving demand. None of the batteries that
are currently available are designed for PHEVs. Thus, a battery that could be used for a
PHEV would have an energy density close to that of an EV battery and power density
58
close to that of an HEV battery. Also the cell capacity of the battery (Ah) for a PHEV
should be less than that of an EV because the energy stored will be less. Battery sizing
also depends on the all electric range of a vehicle. If the vehicle is designed for a large all
electric range, the battery is sized depending on the energy requirements. On the contrary,
if the vehicle is designed for a short all electric range, the battery would be sized
depending on the power requirement. A larger battery size can be used to achieve higher
fuel economy; however, this would depend on the average daily distance and the driving
cycle used.
.
59
BIBLIOGRAPHY
[1] M.A. Weiss, J.B. Heywood, A. Schafer, and V.K. Natarajan, “Comparative assessment of fuel cell cars,” Laboratory for Energy and the Environment, Massachusetts Institute of Technology, Publication no. LFEE 2003-001 RP.
[2] C. C. Chan, “The state of the art of electric and hybrid vehicles,” Proceedings of the IEEE, vol. 90, no. 2, Feb. 2002, pp. 247-275.
[3] C. C. Chan, “The state of the art of electric and hybrid vehicles,” Proceedings of the IEEE, 95, no. 4, Apr. 2007, pp. 704-718.
[4] D. Sandalow, “Ending oil dependence,” The Brookings Institution, January 2007.
[5] T. Markel and A. Simpson, “Energy storage systems considerations for grid-charged hybrid electric vehicles,” in Proc. IEEE Vehicle Power and Propulsion Conference, Sep. 2005, pp. 344-349.
[6] D. Somayajula, A. Meintz, and M. Ferdowsi, “Study on the effects of battery capacity on the performance of hybrid electric vehicles,” IEEE Vehicle Power and Propulsion Conference, Sep. 2008, Harbin, China.
[7] J. Gonder and T. Markel, “Energy management strategies for plug-in hybrid electric vehicles,” SAE World Congress, Detroit, Apr. 2007, SAE paper 2007-01-0290.
[8] H. Douglas and P. Pillay, “Sizing ultracapacitors for hybrid electric vehicles,” Proceedings of IEEE, 2005, 0-7803-9252-3.
[9] R. Spotnitz, “Advanced EV and HEV batteries,” Proceedings of IEEE, 2005, 0-7803-9280-9.
[10] http://www.mpoweruk.com/performance.htm last visited Apr. 21, 2010.
[11] Rosenkranz, C. “Deep cycle batteries for plug-in hybrid application,” presented at EVS-20 Plug-in Hybrid Workshop. Nov. 15, 2003. Monaco.
60
[12] M.K. Meyer, K. Schneider, and R. Pratt, “Impacts of plug-in hybrid vehicles on electric utilities and regional U.S. power grids,” Pacific Northwest National Laboratory.
[13] J. M. Miller, “Energy storage technology markets and application’s: Ultracapacitors in combination with lithium-ion,” International Conference on Power Electronics, Oct. 2007, Korea.
[14] J. M. Miller, “Trends in vehicle energy storage systems: Batteries and ultracapacitors to unite,” IEEE Vehicle Power and Propulsion Conference, Sep. 2008, Harbin, China.
[15] J. Miller, J. Auer, and B. Maher, “Ultracapacitors – The boost for hybrid vehicles,” SAE International, Aug. 2007, SAE paper 2007-01-3468, Hollywood, California, USA.
[16] F. R. Salmasi, “Control strategies of hybrid electric vehicles: Evolution, classification, comparison, and future trends,” IEEE Trans. on Vehicular Technology, vol. 56, no. 5, Sep. 2007, pp. 2393-2404.
[17] V. Marano, P. Tulpule, S. Stockar, S. Onori, and G. Rizzoni, “Comparative study of different control strategies for plug-in hybrid electric vehicles,” SAE International, SAE paper 2009-24-0071.
[18] P. Tulpule, V. Marano, and G. Rizzoni, “Effects of different PHEV control strategies on vehicle performance,” American Control Conference, Jun. 2009, St. Louis, MO, USA, 978-1-4244-4524-0.
[19] L. Chu, Q. Wang, M. Liu, and J. Li, “Development and validation of control algorithm for series power train,” SAE International Congress and Exposition, Pittsburgh, Oct. 2003, 2003-01-3281.
[20] S. Wirasingha and A. Emadi, “Classification and review of control strategies for plug-in hybrid electric vehicles,” Proceedings of IEEE, 2009, 978-1-4244-2601-0.
[21] X. Yu, “Impacts assessment of PHEV charge profiles on generation expansion using national energy modeling system,” Proceedings of IEEE, 2008.
61
[22] A. Hajimiragha, C. Canizares, M. Fowler, and A. Elkamel, “Optimal transition to plug-in hybrid electric vehicles in Ontario, Canada, considering the electricity grid limitations,” IEEE Trans. on Industrial Electronics, vol. 57, no. 2, pp 690-701, Feb. 2010.
[23] M. Chehaly, O. Saadeh, C. Martinez, and G. Joos, “Advantages and applications of vehicle to grid mode of operation in plug-in hybrid electric vehicles,” IEEE Electrical Power and Energy Conference, 2009, 978-1-4244-4509-7.
[24] B. Kramer, S. Chakraborty, and B. Kroposki, “A review of plug-in vehicles and vehicle-to-grid capability,” Proceedings of IEEE, 2008, 978-1-4244-1766-7.
[25] P. Kadurek, C. Ioakimidis, and P. Ferrao, “Electric vehicles and their impact to the electric grid in isolated systems,” Power Engineering, Mar. 2009, Portugal, 978-1-4244-2291-3.
[26] A. Rousseau and M. Pasquier, “Validation of a hybrid modeling software (PSAT) using its extension for prototyping (PSAT-PRO),” Global Powertrain Congress, 2001.
[27] A. Meintz and M. Ferdowsi, “Control strategy optimization for a parallel hybrid electric vehicle,” IEEE Vehicle Power and Propulsion Conference, Harbin, China, Sep. 2008.
[28] J.S. Won and R. Langari, “Intelligent energy management agent for a parallel hybrid vehicle-part II: torque distribution, charge sustenance strategies, and performance results,” IEEE Trans. on Vehicular Technology, vol.54, no.3, pp. 935-953, May 2005
[29] A. Piccolo, L. Ippolito, V. Z. Galdi, and A. Vaccaro, “Optimisation of energy flow management in hybrid electric vehicles via genetic algorithms,” Proc. IEEE/ASME Advanced Intelligent Mechatronic Conf., July 2001, Como, Italy, pp.434-439.
[30] A. Rousseau, S. Saglini, M. Jakov, D. Gray, and K. Hardy, “Trade-offs between fuel economy and NOx emissions using fuzzy logic control with a hybrid CVT configuration,” Argonne National Laboratory.
62
[31] M. Jain, C. Desai, and S. Williamson, “Genetic algorithm based optimal powertrain component sizing and control strategy design for a fuel cell hybrid electric bus,” Proceedings of IEEE, 978-1-4244-2601-0.
[32] F.U. Syed, Y. Hao, Ming Kuang; Okubo, S.; Smith, M., “Rule-based fuzzy gain-scheduling PI controller to improve engine speed and power behavior in a power-split hybrid electric vehicle,” Proc. NAFIPS Fuzzy Information Processing Society, 3-6 June 2006, Montreal, pp.284-289.
[33] P. Pisu and G. Rizzoni, “A comparative study of supervisory control strategies for hybrid electric vehicles,” IEEE Trans. Control Systems Technology, vol.15, no.3, pp.506-518, May 2007.
[34] J. Gao, F. Sun, H. He, G. G. Zhu, and E. G. Strangas, “A comparative study of supervisory control strategy for a series hybrid vehicle,” Proceedings of IEEE, 2009, 978-1-4244-2487-0
[35] S. Neglur and M. Ferdowsi, “Effect of battery capacity on the performance of plug-in hybrid electric vehicles,” IEEE Vehicle Power and Propulsion Conference, Detroit, Sep. 2009.
[36] V. Freyermuth, E. Fallas, and A. Rousseau, “Comparison of powertrain configuration for Plug-in HEV’s from a fuel economy perspective,” SAE World Congress, Detroit, Apr. 2008, SAE paper 2008-01-0461.
[37] M. Cuddy and K. Wipke, “Analysis of the fuel economy benefit of drivetrain Hybridization,” SAE International Congress and Exposition, Detroit, Feb. 1997, 970289.
[38] C. Anderson and E. Pettit, “The effects of APU characteristics on the design of hybrid control strategies for hybrid electric vehicles,” SAE International Congress and Exposition, Detroit, Feb. 1995, 950493.
[39] A. Meintz, M. Ferdowsi and K. Martin, “Supervisory control development of a fuel cell plug-in hybrid electric vehicle,” IEEE Vehicle Power and Propulsion Conference, Detroit, Sep. 2009.
63
[40] A. Konev, L. Lezhnev, and I. Kolmanovsky, “Control strategy optimization for a series hybrid vehicle,” SAE International Congress and Exposition, Detroit, Apr. 2006, 2006-01-0663
[41] M. Duoba and R. Carlson, “Test procedure development for blended type plug-in hybrid vehicles,” SAE International J. Engines, vol. 1, issue 1, Jan. 2008, pp. 360-371, 0457
[42] Z. Wang, W. Li and, Y. Xu, “A novel power control strategy of series hybrid electric vehicle,” IEEE International Conference on Intelligent Robots and Systems, San Diego, CA, Oct. 2007
[43] A. Rousseau, N. Shidore, R. Carlson, and V. Freyermuth, “Research on PHEV battery requirements and evaluation of early prototypes,” Argonne National Laboratory.
[44] J. P. Aditya and M. Ferdowsi, “Comparison of NiMH and Li-ion batteries in automotive applications,” IEEE Vehicular Power and Propulsion Conference, Sep. 2008, Harbin, China.
[45] E. Tara, S. Shahidinejad, and S. Filizadeh, “Battery storage sizing in a retrofitted plug-in hybrid electric vehicle,” IEEE Vehicular Technology Conference, 2009, VT-2009-000943.
[46] T. Markel and A. Simpson, “Plug-in hybrid electric vehicle energy storage system design,” National Renewable Energy Laboratory Conference, May 2006.
[47] A. Rousseau, P. Sharer, and F. Besnier, “Feasibility of reusable vehicle modeling: application to hybrid vehicle,” SAE World Congress, Detroit, Mar. 2004, SAE paper 2004-01-1618.
[48] S. Jenkins and M. Ferdowsi, “HEV to PHEV conversion compatibility,” Proceedings of IEEE.
[49] J. Axsen, A. Burke, and K. Kurani, “Batteries for Plug-in hybrid electric vehicles (PHEVs): goals and the state of technology circa 2008,” Institute of Transportation Studies, UCD-ITS-RR-08-14, May 2008.
64
VITA
Shweta Neglur was born on July 18, 1986. She graduated from University of
Mumbai, India with a BSEE degree in 2007. She had been working as a Programmer
Analyst with Cognizant Technology Solutions, India from 2007 to 2008. She started her
MSEE degree at Missouri University of Science and Technology in August 2008. She
also did her internship with Areva T&D as an Automated Test Intern from May 2009 to
August 2009. Her main research interest is controlling and modeling design aspects of
electric-drive vehicles in order to improve the fuel economy.