Contemporary Liner Shipping Business – A Game Theoretical ...
259
Contemporary Liner Shipping Business – A Game Theoretical Application Kumulative Dissertation Zur Erlangung des akademischen Grades eines Doktors der Wirtschaftwissenschaften der Universität Hamburg (Doctor Rerum Politicarum) Cumulative Dissertation for Doctor Degree Institute of Information Systems Faculty of Economics and Social Science University of Hamburg Xiaoning Shi September 2011 Hamburg, Germany
Transcript of Contemporary Liner Shipping Business – A Game Theoretical ...
Contemporary Liner Shipping Business
– A Game Theoretical Application
Kumulative Dissertation
Zur Erlangung des akademischen Grades
eines Doktors der Wirtschaftwissenschaften der Universität Hamburg
(Doctor Rerum Politicarum)
Cumulative Dissertation for Doctor Degree
Institute of Information Systems Faculty of Economics and Social Science
University of Hamburg
Xiaoning Shi
September 2011 Hamburg, Germany

Annahmevermerk
Tag der Disputation: 13.10.2011
Erstgutachter: Prof. Dr. Stefan Voß
Zweitgutachter: Prof. Dr. Carlos Jahn (TUHH)
Vorsitzender: Prof. Dr. Knut Haase


1
Table of Content
Abstract .................................................................................................................. 2 Chapter 1 Introduction ......................................................................................... 3 1.1 Background ....................................................................................................... 3 1.2 Research Framework ........................................................................................ 4 Chapter 2 Vertical Cooperation in the Liner Business .................................... 10 2.1 Definition ........................................................................................................ 10 2.2 Cooperation with Ports ................................................................................... 13 2.3 Cooperation with Dry Ports ............................................................................ 13 Chapter 3 Horizontal Cooperation in the Liner Business ............................... 15 3.1 Definition ........................................................................................................ 15 3.2 Era of Conferences .......................................................................................... 15 3.3 Era of Strategic Alliances ................................................................................ 16 3.4 Era of Slot Agreements ................................................................................... 17 3.5 Era of Auctions ............................................................................................... 19 Chapter 4 Intra-organizational Development .................................................. 21 4.1 Technology Aspect .......................................................................................... 21 4.2 Ecology Aspect ............................................................................................... 22 4.3 Infrastructure Aspect ....................................................................................... 23 Chapter 5 Conclusions and Future Research ................................................... 25 5.1 Conclusions ..................................................................................................... 25 5.2 Future Research .............................................................................................. 25 Acknowledgement ............................................................................................... 27 References ............................................................................................................ 28 Appendices ........................................................................................................... 32

2
Abstract
The shipping industry is known for providing transportation service at sea in terms of deploying vessels and accessing ports, making the shipping service itself one of the network-based services. From the perspective of traditional as well as neo-economics, the shipping industry is assumed to pursue profit maximization under the constraints of scarce resources, e.g. capital, assets, seafarers, or binding constraints derived from schedules, etc. In addition, in case that we are looking at the liner shipping business from the perspective of games, more and more players are getting involved in the shipping industry and most of them are becoming rational considering interdependencies among them. In other words, players do not only focus on their own businesses. Taking into account their interdependencies and inter-relations, game theory provides a meaningful possibility to model and analyze the behaviors of the involved players in the liner shipping industry. The players in the liner shipping industry could be some or any of the following: linkage operators, e.g. liner shipping carriers, port operators, freight forwarders, customs, hinterland haulage carriers, inland navigation carriers, market regulators, etc. Generally speaking, liner shipping carriers and seaport/dry port operators are main players who operate the links and nodes, respectively. This thesis provides a well-groomed research on the liner shipping business, and some part of the analysis applies game theoretical approaches for vertical and horizontal cooperation among the links and nodes in the liner shipping industry. Keywords: Maritime Shipping, Liner Shipping, Game Theory, Cooperation, Port

3
Chapter 1 Introduction
1.1 Background
The shipping industry provides transportation services among ports by ships at sea, and its service is based mainly on the networks built by shipping carriers. Carriers represent the supply side by providing transportation services while following certain regulations and policies. Shippers represent the demand side by booking transportation services. Besides freight rates, a shipper can decide to accept one of the carriers’ offers taking into account his expectation of other shippers’ decisions to avoid congestion, peak season pricing, risk, etc. Shipping services for the carriage of international trade are traditionally organized, basically on two patterns, i.e., tramp shipping and liner shipping. Tramp ships are usually in search of bulk cargoes. Their movements would be governed by availability of bulk loads from port to port and country to country on a global scale. With the increase in the size of the ships, although the small tramps of the past have not altogether disappeared from the scene, the large bulk carriers and tankers for dry bulk are dominating this niche market. In this thesis, liner shipping business is focused, where services are provided by liner shipping carriers with pre-designed routes and schedules for shippers at a fixed freight rate, following sequences of port-of-calls. The top liner shipping carriers have already established alliances and later on slot-based agreements within the shipping industry and are investigating to set up new business linkages together with customers, suppliers, competitors, consultants, and other companies, too. There are three basic means of obtaining liner fleet capacity, i.e., new building, second-hand purchasing and chartering in vessels. In the first two scenarios, owners are the operators themselves. In the third scenario, the owner is different from the operators. Eventually, the liner carriers, no matter whether they are owners or operators, are attempting to apply most up-to-date business patterns to survive in market dynamics. Based on years of observation in the liner shipping industry, one character of the liner business, among others, is extracted. In brief, the liner carrier often, if not always, cooperates with its competitors. Though it seems extraordinary, such phenomenon can be analyzed from the perspective of cooperative and non-cooperative games. Therefore, in most chapters of this thesis, game theory is applied as a methodology to describe and further analyze collective market equilibrium and individual liner companies’ behaviors. Equilibrium is a game situation where none of the players is able to obtain a better outcome by unilaterally changing her strategy. In other words, assuming that competitors keep their current strategies, a player would not be able to improve her benefit. Hence, under a situation of equilibrium, none of the players has a reason or motivation to change the chosen strategy. This situation characterizes a

4
stable state of the system. On one hand, the purpose of this thesis is to provide overview and analysis on the liner shipping industry followed by discussions on main challenges the industry has faced and is facing based on vertical and horizontal cooperation, respectively. Evidently freight transport, which is directly linked to economic activity and trade facilitation, the cycle of seaborne liner transport then very much relates to the cycle of trade as well as evolving technologies and regulations. Hence, on the other hand, the impact of the technologies on the liner business and the reaction of liner companies under new regulations are also discussed.
1.2 Research Framework
The framework of this cumulative thesis can be structured as Figure 1. The thesis consists of papers covering three main streams of the liner shipping business, i.e., vertical cooperation, horizontal cooperation and intra-organizational development. From the perspective of vertical cooperation, the liner carrier is collaborating with port operators; this holds no matter whether they are sea port operators or dry port operators in related hinterlands. From the perspective of horizontal cooperation, the liner carrier is collaborating with other liners, i.e., they are homogeneous. From the perspective of intra-organizational development, the liner carrier is reacting initiatively under circumstances of changing environmental regulations and technologies. In addition, publications are lined up along different streams with several keywords and abbreviations.
Introduction and Background of Liner Shipping Business
Vertical Cooperation Horizontal Cooperation Intraorganizational Development
Liner
Heterogeneous Homogeneous Technology Ecology
Port Liner RFIDLiner Canal
IFIP 2008
Netnom
ics2010
LNCS 2011a
JOCEC 2011
TRB 2011
Conclusions and Future Research
TRR 2008
IAME 2008
Informa2007
UNCTAD 2009
LNCS 2011b
IAME 2011a
AJSL 2011
LNCS 2011a
RTE 2011
Informa 2007
Infrastructure
CDM
IAME 2011b
Figure 1. Framework of the Thesis

5
Included Publications Below are the publications including refereed chapters in an edited book or proceedings as well as refereed papers in journals, which contribute for cumulating this thesis. Table 1. Included publications and their associated abbreviations1
Abbreviations Publications Informa 2007
Xiaoning Shi and Stefan Voß, Container Terminal Operations under the Influence of Shipping Alliances, in Khalid Bichou, Michael G.H. Bell and Andrew Evans (eds.) Risk Management in Port Operations, Logistics and Supply Chain Security, Informa, London, pp. 135-167, 2007
IFIP 2008
Xiaoning Shi and Stefan Voß, From Transocean Routes to Global Networks: a Framework for Liner Companies to Build Service Networks, in Journal of Telecommunications and Information Technology, 3/2008, pp. 35-43, 2008, ISSN: 1509-4553
IAME 2008
Xiaoning Shi, Hilde Meersman and Stefan Voß, The Win-Win Game in Slot-Chartering Agreement among the liner Competitors and Collaborators, in Conference Proceedings of the Annual Conference of the International Association of Maritime Economists (IAME), Dalian, 2008
TRR 2008
Xiaoning Shi and Stefan Voß, Iterated Cooperation and Possible Deviations among Liner Shipping Carriers Based on Non-cooperative Game Theory, in TRR (Journal of Transportation Research Record), Vol. 2066, pp. 60-70, 2008 , DOI: 10.3141/2066-07
UNCTAD 2009
Honey Tousypanah, Xiaoning Shi and Jan Hoffmann, Liner Shipping Connectivity in 2009, in United Nations Conference on Trade and Development (UNCTAD) Transport Newsletter, Vol. 43, Iss.2, pp. 6-9, 2009
Netnomics 2010
Xiaoning Shi and Thierry Vanelslander, Design and Evaluation of Transportation Networks: Constructing Transportation Networks from Perspectives of Service Integration, Infrastructure Investment and Information System Implementation, Netnomics, Vol. 11, Iss. 1, pp. 1-4, 2010
IAME 2011a
Xiaoning Shi, Yi Zhang and Stefan Voß, Actions Applied by Chinese Shipping Companies under GHG Emissions Trading Scheme, in Conference Proceedings of the Annual Conference of the International Association of Maritime Economists (IAME), Santiago de Chile, 2011
IAME 2011b
Fang Li, Xiaoning Shi and Hao Hu, Location Planning of Dry Port Based on Multinomial Logit, in Conference Proceedings of the Annual Conference of the International Association of Maritime Economists (IAME), Santiago de Chile, 2011
AJSL 2011
Xiaoning Shi and Stefan Voß, General and Modified Slot Chartering Agreements-Performance Comparison Based on Different Mechanisms, in Asia Journal of Shipping and Logistics, Dec 2011, forthcoming
RTE 2011
Dong Yang, Miaojia Liu and Xiaoning Shi, Verifying Liner Shipping Alliance’s Stability by Applying Core Theory, in Research in Transportation Economics, Vol. 32, Iss. 1, pp. 15-24, DOI: 10.1016/j.retrec.2011.06.002
JOCEC 2011
Xiaoning Shi, Dongkai Tao and Stefan Voß, RFID Technology and its Application to Port-Based Container Logistics, in Journal of Organizational Computing and Electronic Commerce, Vol. 21, Iss. 4, pp. 1-16, DOI: 10.1080/10919392.2011.614202. (in print)
LNCS 2011a
Xiaoning Shi and Stefan Voß, Game Theoretical Aspects in Modelling and Analyzing the Shipping Industry, in Lecture Notes in Computer Science, Vol. 6971, pp. 302-320, 2011
1 Abbreviations beyond those in this table can be found in the appendix.

6
LNCS 2011b
Lei Hu, Xiaoning Shi, Stefan Voß and Weigang Zhang, Application of RFID Technology at the Entrance Gate of Container Terminals, in Lecture Notes on Computer Science (LNCS), Vol. 6971, pp. 209-220, 2011
TRB 2011
Xiaoning Shi and Stefan Voß, The Impact of the Panama Canal Expansion on Liner Fleet Deployment and Operation-A New Agenda, submitted for the Annual Conference of the Transportation Research Board (TRB), Washington, Jan 2012, under review
Non-included publications/work There are also some publications that are not included in this thesis, which are listed as follows. Table 2. Non-included publications and their associated abbreviations
Abbreviations Non-included Publications ComLog 2011
Jürgen W. Böse, Hao Hu, Carlos Jahn, Xiaoning Shi, Robert Stahlbock, Stefan Voß (Eds.), Computational Logistics, Lecture Notes in Computer Science (LNCS), Vol. 6971, Springer, 2011, ISBN:978-3-642-24263-2, ISSN:0302-9743, 369 pages
Online 2011
RFID 技术在港口基础设施建设中的应用研究-集装箱码头案例,胡磊、史小宁、周岱、张卫
刚,中国科技论文在线,2011 年 11 月
LISS 2011
Fang Li, Xiaoning Shi and Hao Hu, Location Selection of Dry Port Based on AP-The Case of Southwest China, in Conference Proceedings of International Conference on Logistics Informatics and Service Science (LISS), 2011, ISBN:978-989-8425-66-9
IFSPA 2010
Jiaolong Lai, Xiaoning Shi and Hao Hu, China’s Oil Import Forecast and its Impact on Tanker Fleet Composition, in Conference Proceedings of International Forum on Shipping Port and Airport (IFSPA), 2010
TransEco 2009
Xiaoning Shi, Weihong Hu and Hao Hu, Transport Economics (Chinese Translated Version), ISBN: 978-7-114-08006-7, China Communications Press, Beijing, China, 2009

7
1.3 Research Methodology
Game theory (hereafter GT) is a methodology of decision making involving multiple parties such as persons, companies or agents. For instance, each company must consider what other companies will do. Classical literatures (Nash 1944, Von Neumann and Morgenstern 1944) together with applications of GT in industrial organizations (Gibbons 1992, Phlips 1995, Tirole 1988) usually discuss four classes of games: static as well as dynamic games of complete information and static as well as dynamic games of incomplete information. We assume that readers have a basic knowledge of GT; see, e.g., (Gibbons 1992, Phlips 1995, Tirole 1988). Corresponding to these four classes of games there are four notions of equilibrium in games: Nash equilibrium (NE), subgame-perfect NE, Bayesian NE, and perfect Bayesian equilibrium. The NE is a solution concept of a game, in which each player is assumed to know the strategies to be taken by the others and no player can be better off by changing his or her own strategy unilaterally. A subgame-perfect NE is a refinement of a NE used in dynamic games if it represents a NE of every subgame of the original game. Bayesian NE is a solution concept of Bayesian games where at least one player is unsure of the type (and so the payoff function) of another player, which might result in some implausible equilibria in dynamic games. To refine the equilibria generated by the Bayesian Nash solution concept or subgame perfection, one can apply the perfect Bayesian equilibrium solution concept. The characteristics of each game can thus be summarized in Table 3. Table 3: Brief summary on solution concepts
Solution Concepts Nash equilibrium
Subgame-perfect Nash equilibrium
Bayesian Nash Equilibrium
Perfect Bayesian equilibrium
Proposed by John F. Nash Reinhard Selten John C. Harsanyi N/A
Applications Static games
Pure strategy
Dynamic games
Mixed strategy
Static games Dynamic games
Sequential games
Expressions Normal form
Extensive form
Extensive form Extensive form Extensive form
Approaches Fixed point theorem
Backward induction Bayes’s rule Sequential rationality based on updated beliefs
Information set Complete Complete Incomplete Imperfect
A player in a game is a person or a business community making decisions or choosing a strategy from a set of given options. One player's decision affects that of the others. In a static game, players make decisions simultaneously without knowing information of other's decisions. In a dynamic game, players make decisions at different moments, i.e., a sequential decision making process happens due to the fact that other's decisions have been disclosed. A strategy in a game is one of the options from which a player may select. Such decision making process may be based on historic experience of himself and/or information disclosed by other players. Traditional

8
applications of GT attempt to find equilibria. In an equilibrium each player of the game has adopted a strategy that none of the players involved is likely to deviate from. Traditional applications of game theory attempt to find equilibria. In an equilibrium each player of the game has adopted a strategy that none of the players involved likely tends to deviate. Payoff means what a player gets after choosing a strategy. Pursuit of payoff maximization, usually, is the utmost goal of a player. In this thesis, a player can be, e.g., a liner shipping operator, or a tramp shipping operator, or a community of liners -- an alliance -- behaving as a whole in the market. A set of strategies can include whether to cooperate with other competitors or deviate from the current situation, etc. Payoff of a player is the commercial benefit when a player chooses one of his strategies, e.g., the revenue after choosing to cooperate with his competitor. The shipping industry provides transport services among ports by ships at sea. Its service is based mainly on the networks built by carriers, representing the supply side by providing transport services while following regulations and policies. Shippers represent the demand side by booking transport services. Besides freight rates, a shipper can decide to accept one of the carriers' offers taking into account his expectation of other shippers' decisions to avoid congestion, peak season pricing, risk, etc. Carriers similarly attempt to avoid overcapacity, cut-throat competition, lack of diversification, and other negative factors. Therefore, shippers or carriers can be regarded as players in games as they will not take action without considering what their competitors do. Besides freight rates, a shipper can decide to accept one of the carriers' offers taking into account his expectation of other shippers' decisions to avoid congestion, peak season pricing, risk, etc. Carriers similarly attempt to avoid overcapacity, cut-throat competition, lack of diversification, and other negative factors. Therefore, shippers or carriers can be regarded as players in games as they will not take action without considering what their competitors do. In addition, both shippers and carriers must act subject to regulations and policies in the shipping industry. We must also consider the regulator designing regulations and policies with an eye towards how shippers and carriers will react to them. In this sense, a regulator can also be viewed as player, especially in principal-agent relations. The interactions among players in the shipping industry have a considerable impact on each player's strategy set. The relationship between homogeneous players, e.g. different carriers, is horizontal whereas the relationship between heterogeneous players, e.g. shipper and carrier, is vertical. In addition to the aforementioned players, there is a growing trend for related service providers to integrate. For instance, truck haulage carriers integrate their business with shipping carriers so that door to door service can be achieved. Thus, games such as price auctions and principal-agent incentive games might also need to be

9
considered, and these may be classified as either heterogeneous relations or principal-agent games as mentioned before. Therefore, GT can be a helpful tool in the analysis of the shipping industry given features of the industry that the decisions of multiple players affect each player’s payoff. When observing the literature, it can be seen that many meaningful tools are spread over a variety of papers and books, and not so many well groomed surveys on systematic application of the GT in the shipping industry are available. Hence, the preliminary goal in this chapter is to provide a survey on how the existing literatures deal with operational and strategic behaviors of either homogeneous or heterogeneous players in the shipping industry. In terms of discussing them step by step, i.e., from horizontal relations to vertical relations, this thesis tries to shed lights to kinds of interactions within the players. The related discussion can be very helpful for readers who also intend to analyze game theoretical aspects in the shipping industry. In this chapter, the background of the liner industry and research methodology is introduced together with the research framework of the thesis. In Chapter 2, the vertical cooperation in the liner business is analyzed followed by horizontal cooperation in Chapter 3. Besides, in Chapter 4, technological aspects and ecological aspects are discussed. Finally, conclusions and future research trends are outlined in Chapter 5.

10
Chapter 2 Vertical Cooperation in the Liner Business
2.1 Definition
Basically any player of the shipping industry might play either cooperation games or competition games or both, within the designed mechanism and market circumstances including free market, monopoly, duopoly and even oligopoly. In this chapter, those players who actually provide different services are paid attention; in other words, they are rather suppliers or customers to each other than competitors in a certain niche market. In the transportation industry, there are certainly games to be investigated among vertically related players. The players who share the same value chain sometimes team up with each other so that better integrated service can be provided to the final customer. Once the service provider selection is to be involved, see Figure 2, the vertical relations become apparent. Such vertically related players might be liner carriers and port operators, shippers and freight consolidation/distribution centers as well as hinterland haulage carriers, etc. Leader-follower models can be used to simulate the relationship among players, because some players, who have either more experience or higher negotiation power, distinguish themselves from their peers, become leaders in games. In contrast, those players who have relatively less experience or know-how may become followers in games. From an industrial perspective, a transportation network is a spatial system of nodes and links over which the movement of cargo and passengers occurs (Talley, 2009), so is a shipping network. A node is a center in a transportation network from which cargo and passenger movements emanate. A physical link between two transportation nodes is the transportation way (e.g., waterway, highway, railway, and airway) over some distance between the nodes. From a theoretical perspective (cf. graph theoretical concepts) a network can be represented as a graph, which is a mathematical structure consisting of a number of nodes (vertices) and links (edges). Furthermore, a path is a trail with neither repeated edges nor repeated nodes (Gross and Yellen, 2006). However, in shipping practice service providers may design some certain service route with repeated linkages as well as repeated ports-of-call within one service. In addition, a decision maker representing a link takes into consideration directions and capacities of other links. The same applies to decision makers representing nodes, which inevitably underlies primary principles of game theory. Therefore, instead of just applying the path game, the problems investigated in this research are defined by means of link games and node games within networks. In order to better understand this mature and complex industry, major business issues in the shipping industry are

11
outlined in Figure 2.
The primary shipping industry consists of liner shipping, tramp shipping, the tanker business and the ferry business as shown in Box 1 of Figure 2. Liner shipping is a transportation service following announced and scheduled ports-of-call, regardless of whether it is ocean sea transport or short sea shipping. Tramp shipping is the transportation service that does not rely upon repeatedly scheduled ports of call, but rather on pick-up and delivery of cargos according to demands and either voyage charter or time charter-based contracts. The tanker business shares similar characteristics with tramp shipping, the main difference being that the cargo in this case is either crude oil/oil product or bulk. Finally, the ferry business provides service to passengers, which is beyond the main scope of this thesis taking into account the fact that the behavior of humans is relatively erratic compared to that of cargo. The interested reader could simply replace passengers, to some extent, with cargoes and then apply the same ideas of game theoretical thinking as discussed below. Within the primary shipping industry, the competition and strategic cooperation among the homogeneous carriers arise as horizontal games. Considering the fact that carriers act as links connecting different ports, the carrier related competition and cooperation can be viewed as one of horizontal relations at the macro level. In other words, it belongs to the link game in service networks. Therefore, a link game is dealing with the construction of links and reconstruction of paths by means of either consolidating or deconsolidating linkage supply, so that demand could be better satisfied.
1
Figure 2: Structure of the shipping industry and its associated markets
Liner shipping
Ferry business
Tramp shipping
Tanker business
Associated Resources markets
Container: building, leasing Ship: new-building, chartering, second-hand purchasing Labor: seafarer and back-office employee
Associated Service providers
Port operator Consolidation and distribution center Truck haulage Railway operator
2
6 Regulation and policy
4
5
3

12
In addition, as shown on the left side of Figure 2, the service provider’s component of the shipping service includes port operators, consolidation/distribution centers as well as hinterland service operators such as truck haulage, railway operators and 3rd party logistics providers. The ports and consolidation/distribution centers are nodes which contribute to comprehensive service networks (Talley, 2009). In a figurative sense, a node makes efforts to attract more links by means of amplifying throughput and storage capacity of the node as well as hinterland connections, where this could relate to various aspects including, e.g., available infrastructures to avoid congestion regarding hinterland traffic. Once there are other competitive nodes within the same trading zone or graphical region, the nodes compete with each other in order to sustain as hub. Or the nodes have to cooperate with the existing hub because of their limited capacities. Therefore, the port and consolidation/distribution center related competition and cooperation can also be viewed as a center of horizontal relations among homogeneous players. However, it belongs to the node game. In sum, a node game is aiming to adjust the attractiveness of associated nodes to links in terms of changing the status of the node, so that better accessibility and capacity can be achieved. Furthermore, links and nodes select each other in order to obtain better performance in tandem than it could be achieved in isolation. On one hand, the links select efficient nodes so that the waiting time and total voyage time could be shortened as well as to avoid potential risks. Sometimes, the links observe existing nodes and choose among them, as in the port selection problem of liner carriers (Rimmer, 1998). Sometimes, the links even propose and invest in new nodes when it is worthwhile to do so. On the other hand, nodes select weighted links so that the capacity of the nodes can be better utilized and higher profits can be achieved. In this case vertical relations among heterogeneous players occur (Shi and Voß, 2007). In addition, the accessibility and connections with other service providers are also vital to both the links and nodes from the aspect of strategic sub-network integration at the macro level. Therefore, the problem is presented as a network game. The right hand side of Figure 2 depicts how associated resource markets support the shipping industry. In the case where containers are to be built or leased and workers are to be employed, bargaining and auction games are involved, (links 3 and 5 in Figure 2). In the case where ships are to be deployed, schedule optimization and network games are considered (link 4). Finally, regulations and policies (Box 6) direct and control as appropriately as possible behaviors of the associated players who simultaneously account for interdependencies with others. The remainder of this paper introduces and demonstrates how the players in the shipping industry interact with each other, taking into account both individual and collective rationality, and how market regulators might improve market efficiency by means of game theoretical mechanism design.

13
2.2 Cooperation with Ports
Based on vertical cooperation defined in Section 2.1, investment on networks belongs to strategic behavior of liner carriers. The utmost aim of implementing infrastructure investment, in the hope of at the right moment, is to grasp the market opportunity as well as obtain priority of terminal handling service offered by port operators. Therefore, from the perspective of strategic behavior, such investments should at least consist two folds. Investment on fleet capacity affects fixed costs of a liner shipping company, while investments on port facility affects operational costs (or voyage costs) of a liner shipping service. 1) Investment on Fleet Capacity Investment banks have long time launched an initiative to support ship owners in obtaining credits for supporting bigger fleet. Coming back on track of this initiative especially after the crisis could be envisaged in order to facilitate access to credits for the liner shipping market. Financing is a major concern for usually capital intensive transport operators, i.e., the liner shipping companies in this case. For most parts of the transport industry, vessels, aircraft, rolling stock, buses and trucks represent the most important financial assets and consequently the depreciation accounts for the largest part of the companies’ fixed costs. However, it differs in time spans. The process of projecting, ordering, constructing and operating container ships varies between long distance service and domestic or short sea shipping service and the time span of operating a mega container ship may cover approximately twenty years. 2) Investment on Port Facility Liner shipping companies select terminals to invest in the hope that their ships can have priority when to be handled in the terminals. On one hand, such investment projects are generally assessed by the liner shipping companies in view of increasing complexity of service networks built by them. On the other hand, such investment projects proposed by liner shipping companies help port operators upgrading port facility and terminal infrastructure in order to accommodate high end container ships with higher speeds and bigger capacities. As a result, the competitiveness of service network and corridors get increased. In addition, following this initiative, the port operators get benefits from such cooperation and can respond better to liner shipping companies’ requirements.
2.3 Cooperation with Dry Ports
Sea ports discussed in Section 2.2 are traditional ports-of-call of liner carriers. However, as time goes by, liner carriers would like to expand their business revenue by attracting more customers from the hinterland. Therefore, liner carriers need also to cooperate with and/or to invest in dry ports in the hinterland. With the introduction

14
of the dry port concept, one can also regard dry ports as nodes in the hinterlands (Jaržemskis, 2007). Therefore, liner companies also would like to further attract cargo freight volume which transport through these dry ports to obtain the possibility of increasing their revenues. Such idea is sorted out in this section of the thesis. In other words, not only the sea ports are regarded as nodes within the liner service network, the dry ports are also regarded as non-neglectable nodes because liner carriers want to amplify their business in related hinterlands. Li at al. (2011) discuss cooperation and operational issues of dry ports and carriers.

15
Chapter 3 Horizontal Cooperation in the Liner Business
3.1 Definition
After conferences, the top liner shipping carriers have already established alliances within the shipping industry and are investigating to set up new business linkages together with customers, suppliers, competitors, consultants, and other companies, too. A number of studies have attempted to explain this phenomenon using a variety of conceptual and theoretical frameworks. There are three basic means of obtaining fleet capacity, i.e., new buildings, second-hand purchasing and chartering in vessels. In the first two scenarios, owners are the operators simultaneously. In the third scenario, the owner is different from the operators. It can have significant leeway in adjusting to market demand. If at some point vessels will come out of charter: some might be returned to their owners while others may be replaced or have their contracts renewed at attractive rates. Such kind of cooperation among liner carriers are regarded as horizontal cooperation because these players are homogenous. Not only a liner shipping company can be regarded as a player in a shipping alliance, but also a liner shipping strategic alliance itself can be viewed as a player when it competes with other alliances. In this chapter, it is assumed that those liner companies are unable to make enforceable contracts through outside parties. The aims of publications lined up in this chapter are summarized as follows: 1) Indicate the motivations of short-term cooperation among several liner carriers; 2) Analyze pros and cons of being members in liner shipping strategic alliances; 3) Explain the behavior of deviation or departure of a player when it faces
turbulence and unpredictable shipping circumstances; 4) Advise ways to enhance long-term alliance stability by increasing benefits while
decreasing drawbacks. Among those four main points, the differences between short-term cooperation and long-term alliance are the amounts of sub-games and the potential pay-off in the future. Specific models based on the assumption of non-cooperative behavior are set up and iterated games to give those differences clear explanations. The outcome of this paper will be helpful for the liner shipping carriers attempting to succeed in the shipping industry with greater efficiency, better customer service and lower cost.
3.2 Era of Conferences
The liner carriers need to continuously respond to fluctuations in international trade, phase-out services in sluggish markets and establishing a stronger presence in growth areas. As a consequence, structure reorganization appears. Several major lines/loops have already been reorganized and are receiving larger vessels, improving the productivity. Besides offering a better port coverage, as mentioned in Chapter 2, for

16
shippers, improved regional services need to be launched. In this sense, global liner shipping operators have advantage to achieve a relatively good level of responsiveness. In an attempt to protect carriers in the conferences from the new steam ships serving trades to India and the Far East, the traditional liner shipping companies established cartels in 1875 to control the important trades between these regions. Under the liner conference system, which has long been an established feature of the shipping industry, a group of ship-owners of one or several nationalities serve a group of ports on a given route. Research on the liner conferences and liner shipping strategic alliances has paid great attention for decades either from the perspective of globalization or from the perspective of impact on the port operations and supply chain partners’ cooperation etc. Among liner carriers these ‘top 20’ are of interest in most references and surveys together with their evaluation and the formation of strategic alliances. Before the 1990s, the liner carriers cooperated with others by means of conferences. Since the mid-1990s, the development of the liner shipping industry could be briefly divided into three phases shown in Shi and Voß (2007, 2008). Based on the information shown in these papers, some business issues can be derived from such transformation. It is necessary to highlight the capacity of the supply side. Once overcapacity happens, a liner might need to figure out ways to keep its market share as well as providing consistently high-quality services though she might simultaneously need to decrease size of her fleet.
3.3 Era of Strategic Alliances
This Section focuses on liner shipping strategic alliances and their establishment and transformation within the framework of non-cooperative game theory, which is considered as effective tool to analyze motivations, competitive structures, strategies and potential pay-offs in a number of industries including the turbulent liner shipping industry. An alliance is a close, collaborative relationship between two, or more, firms with the intent of accomplishing mutually compatible goals that would be difficult for each to accomplish alone (Spekman et al., 2000). On one hand, we should note that liner shipping alliances are collaborative relationships among different companies while each member is financially independent. On the other hand, if the expected benefits are not gained, a liner company would no longer choose collaboration as a strategy, which leads to the transformation of alliances. The motivations leading independent liner companies into alliances are sketched as follows:

17
1) Globalization: In the liner shipping industry, globalization of trade markets has been the driving force behind alliance formation. The shippers’ demand for better routing networks (Fagerholt 2004, Gilman 1999 and Lim 1998) and connections (Notteboom 2004 and Haralambides et al. 2000) can be met by means of alliances.
2) Knowledge Transfer: Alliances expand the scope of knowledge and practices available to the partners and ease access to the related knowledge (Mowery et al. 1996).
3) Competition: Cooperation with another liner carrier can extend supply to meet increasing demand without waiting for newly-built mega container ships, which makes liner companies more agile to the increasing market demand raised by shippers (Brooks 1983, Brooks 1993, Brooks et al. 1993, Brooks 2000, Baird and Lindsay 1996) and decrease the development time (Notteboom 2006) accordingly.
4) Development: Given that many mergers and acquisitions fail to achieve their stated objectives, alliances are a less costly alternative to achieve development (Dodgson 1992).
5) Financial Reasons: The liner shipping industry faces high fixed costs mainly due to the construction costs of mega vessels (Cullinane et al. 1999). When firms cooperate intensively in a number of fields, the high fixed costs would decrease dramatically (Song and Panayides 2002) offering better value and better connections with customers at a competitive price (Yoshida et al. 2001).
Motivated by these reasons, alliances go through a series of stages such as strategy formulation, partner selection, negotiation, implementation and evaluation. Each stage is built on a changing alliance landscape as the vision for the alliance becomes a reality and then grows into a mature business (Spekman et al. 2000).
3.4 Era of Slot Agreements
Besides the liner alliances as one of the means to cooperate in the liner industry, vessel-sharing and slot-chartering agreements are also very common among the liner collaborators even if they are competitors at the same time. In this section, slot-based agreements are discussed, including slot exchange and slot chartering. The co-existing competition and collaboration make the negotiation of slot-chartering agreements quite tough. The liner carriers who are involved in the slot-chartering agreements are regarded as the players and the pay-off of the games should be win-win games rather than zero-sum games. Otherwise, such slot-chartering agreements may not be attractive enough to keep their either short-term or long-term cooperation. Thus, the main idea of this section is to explain the negotiation stages as well as to design an efficient mechanism to balance the slot requirements and the equilibrium prices under different circumstances. Furthermore, the negotiation and pricing model is to be applied and demonstrated. The output of this section is of interest to decision makers working in the liner shipping companies as well as in some other business domains.
18
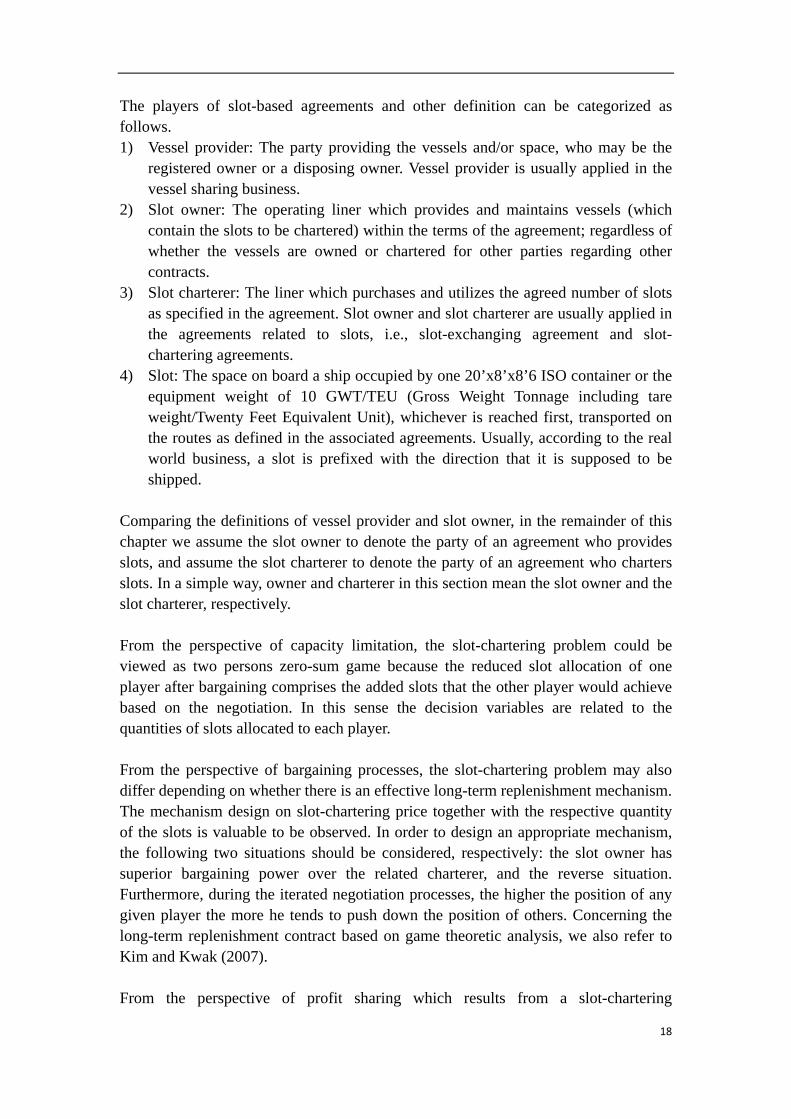
The players of slot-based agreements and other definition can be categorized as follows. 1) Vessel provider: The party providing the vessels and/or space, who may be the
registered owner or a disposing owner. Vessel provider is usually applied in the vessel sharing business.
2) Slot owner: The operating liner which provides and maintains vessels (which contain the slots to be chartered) within the terms of the agreement; regardless of whether the vessels are owned or chartered for other parties regarding other contracts.
3) Slot charterer: The liner which purchases and utilizes the agreed number of slots as specified in the agreement. Slot owner and slot charterer are usually applied in the agreements related to slots, i.e., slot-exchanging agreement and slot-chartering agreements.
4) Slot: The space on board a ship occupied by one 20’x8’x8’6 ISO container or the equipment weight of 10 GWT/TEU (Gross Weight Tonnage including tare weight/Twenty Feet Equivalent Unit), whichever is reached first, transported on the routes as defined in the associated agreements. Usually, according to the real world business, a slot is prefixed with the direction that it is supposed to be shipped.
Comparing the definitions of vessel provider and slot owner, in the remainder of this chapter we assume the slot owner to denote the party of an agreement who provides slots, and assume the slot charterer to denote the party of an agreement who charters slots. In a simple way, owner and charterer in this section mean the slot owner and the slot charterer, respectively. From the perspective of capacity limitation, the slot-chartering problem could be viewed as two persons zero-sum game because the reduced slot allocation of one player after bargaining comprises the added slots that the other player would achieve based on the negotiation. In this sense the decision variables are related to the quantities of slots allocated to each player. From the perspective of bargaining processes, the slot-chartering problem may also differ depending on whether there is an effective long-term replenishment mechanism. The mechanism design on slot-chartering price together with the respective quantity of the slots is valuable to be observed. In order to design an appropriate mechanism, the following two situations should be considered, respectively: the slot owner has superior bargaining power over the related charterer, and the reverse situation. Furthermore, during the iterated negotiation processes, the higher the position of any given player the more he tends to push down the position of others. Concerning the long-term replenishment contract based on game theoretic analysis, we also refer to Kim and Kwak (2007). From the perspective of profit sharing which results from a slot-chartering

19
cooperation, which is one form of link games it could be viewed as non-zero-sum game since additional profits might occur when liners provide more options to shippers. To the best of our knowledge, so far no such research has been done in the ocean sea shipping industry. However, similar research considering the hinterland trucks pick-up and delivery tasks had recently been developed by Krajewska and Kopfer (2006) as well as Krajewska et al. (2008). Briefly speaking, most of the valuable resources of an entity could be regarded as ‘slots.’ Once the resources are not so sufficient to manufacture production or provide services, the entity might, after harsh negotiations, choose to cooperate with its competitors at certain price by sharing certain quantities of resources. Thus, the backward-deduction and price setting mechanism discussed in these papers (Shi and Voß 2011a, b) might be valuable and useful when applied, in an appropriate way, in other business domains.
3.5 Era of Auctions
Due to the crisis since 2008, most liner carriers are still struggling against economical downturn. However, they are getting ready to rebound by means of tending to get ready to rebound as soon as trade begins to accelerate. This phase of liner shipping business performs more like current airline services. Based on above mentioned discussion, pros and cons of liner shipping service can be briefly summarized. As mentioned, the liner shipping business as main segment of international transportation is derived from international trade. Therefore, it suffers major impacts of the recent global crisis. During the crisis, demand for international transportation services is decreasing rapidly and some liner companies are facing economic difficulties and many even nearly bankruptcy. However, the liner shipping business also enjoys the tiny peak curve during recovery from the crisis. Many top liner companies are reported making profit in 2010. It deserves to be noted that the International Monetary Fund (IMF) mentions that after the crisis, there will be a slow increasing rate of the economy. It takes longer time to get recovered. Together with the decline of traditional liner conferences, innovative means of cooperation arise, which can be classified along three levels of cooperation: vessel-sharing, slot-exchanging and slot-chartering. Nowadays, apart from the business patterns mentioned in Sections 3.2, 3.3 and 3.4, auctions on slots becomes an uprising phenomenon, just like what happens in the airline industry. By applying auctions on slots, performances of networks and revenues are expected to be better. One of the performances of liner service network is connectivity. In view of the macro level, performance of networks needs to be evaluated in a manner of connectivity, and most probably evaluated by international organizations. For example, the United Nations of Conference on Trade and Development (UNCTAD) keeps releasing the Liner Shipping Connectivity Index each year.

20
In the era of auctions, service categories and pricing schemes evolve accordingly. Regarding contemporary liner shipping service, the existing pricing scheme can be categorized into three different types, i.e., capacity-based pricing, time-based pricing, and service-based pricing. 1) Capacity-based pricing means the price of using a slot depends on the capacity
constraints given by the liner carriers. An apparent example is the soaring freight rate retained to upcoming peak season, i.e., when supply falls short of demands. Despite the carriers being competitors all the time, they might build up a temporary pricing partnership so that each of these carriers can obtain a freight rate increment simultaneously.
2) Time-based pricing means the price of using a slot depends on the Total Travel Time (TTT) of this specific voyage. When a service ordered by a shipper cannot be performed by one single voyage, one or more transshipments occur. Generally speaking, the more transshipments are involved, the longer TTT can be expected. However, the liner carrier might offer some priority to certain carriages so that even if transshipment is involved, these carriages can still enjoy quite efficient connections, which results in shorter TTT. Obviously, such time-saving service as fast-lane or quick-connection, no matter how to name it, costs more to the shipper.
3) Service-based pricing means the price of using a slot depends on the service quality offered by the carrier. For instance, in case a reefer container is to be carried, the price of providing carriage of such cargo is expected to be relatively high.
Above mentioned pricing scheme is set between the seller of slots and the buyer of the slots. The seller of slots can be owner of a container ship and/or operator of container ships. The buyer of the slots, in most cases, can be a shipper and/or consignee. However, taking into account the cooperation among liners, the buyer of slots can then also be a liner who rents slots, i.e., buys service from her business partner based on designed slot-chartering agreements. As mentioned, in the era of auction, service categories and pricing schemes evolve accordingly. The slot buyers then can auction on the price of slots whenever capacity is constrained or time is limited. Therefore, the output of the service price turns more flexible than that of before.

21
Chapter 4 Intra-organizational Development
4.1 Technology Aspect
Exceptional and outstanding customer relationships will give a liner a big presence. Extremely rigorous standards and processes need to be established for every area of operations, with special attention to service: shipping documents and arrival notices are expected to be highly accurate and detailed; customer service section responds rapidly to the slightest question or request for information; calls are never transferred; all problems are addressed immediately; and managers are available 24 hours a day, seven days a week. A competitive liner who is able to provide tailor-made transport solutions to its shippers will be regarded by them as preferred carriers as a reward. A strategy of strong geographic expansion, innovation and cost leadership enables a liner to grow sustainably. From the technological aspect, applying state-of-the-art information systems is a dream of the liner companies. Some timely action plan can be laid out in terms of joint discussion in the past as well as in terms of applying state-of-the-art decision support systems. Avoid harm trust built between VIP shippers and carriers; it is vital for a successful liner to flawlessly organized shipping. With the gradual promotion of the concept of the Internet of Things (IoT), its related technologies are expected to have impact on the operational processes of any kinds of logistics, and further promote their efficiency and effectiveness. As one of the technologies that enable the implementation of the IoT, Radio Frequency Identification (RFID) is becoming increasingly important and it is used in production, manufacturing as well as supply chain management. Many RFID applications seem to focus on closed-loop scenarios devised to solve particular problems in real business cases where alternative solutions are not feasible (Hu et al. 2011). RFID tools play an important role in supporting assembly lines, medical, logistics, and supply chain management processes. RFID tools can identify, categorize, and manage the flow of goods and information throughout the supply chain. Moreover, RFID brings greater visibility to business processes, e.g., in supermarkets, customs authorities, etc. In an ideal world, it can ensure the necessary data transfer to reach optimal supply chain conditions. Innovation management and process re-engineering of container terminals may refer to the analysis and redesign of workflows of port operations (Voss and Boese, 2000). Related re-engineering can be used in ports to lower costs and increase quality of service. Information technology may be seen as key enabler for a radical change in ports and terminals. To which extent RFID is an enabler for related change still needs to be investigated (Shi et al. 2011). Transportation companies around the world value RFID technology due to its impact on the business value and efficiency. Since RFID

22
technology is mature, we can use this technology in the access control systems of container terminals. In this way, we may decrease the workload in the gate of the container terminal and improve the efficiency in receiving the containers. Regarding yard management, shipping and freight and distribution centers are some areas where RFID tracking technology is used.
4.2 Ecology Aspect
From the ecological aspect, reducing environmental impact and related consumption is one of the most important areas for environmental action. Therefore, innovative eco-friendly technologies are applied or are about to widely applied soon. Many leading liners have been actively committed to reducing the environmental impact of its vessels for years. By updating the fleet, latest eco-friendly technologies can be applied ranging from design of new ships to operations of existing ships. Ways that have been considered or performed by liner companies are summarized as follows (Shi et al. 2011). 1) Modernizing fleets and slow steaming 2) Preserve marine life through rigorous ballast water management and the use of
tin-free antifouling paints 3) Offer eco-friendly shipping solutions, such as eco-containers (with bamboo
flooring, light steel containers) and a wider range of intermodal transport options 4) Develop an environmentally responsible corporate culture 5) Enhance skills of seafarers and accelerate the learning curve for seafarers by
using navigation simulators is regarded as a reasonable training tool Together with the convening of the COP15 United Nations Climate Change Conference Copenhagen 2009, the reduction of Greenhouse Gas (GHG) emissions has once again become a popular topic. All countries present at the meeting have discussed on the standard of emissions, but failed to reach an agreement as one might ever have expected. Although the shipping industry has not been included in the mandatory emission reduction list in the ’Kyoto Protocol,’ as the global climate problem turns to be severe, countries in Annex I in the ’Kyoto Protocol‘ and the EU begin to put pressure on the International Maritime Organization (IMO). As a result, the IMO has put the issue of reducing GHG emissions in the shipping industry on the agenda and committed to introduce a specific standard for emissions reduction by 2011. Moreover, in March 2009, the State Council of the People’s Republic of China has issued a strategic policy on the promotion of transforming Shanghai into an international financial and shipping centre. Under such circumstance, an in-depth study of a carbon emission reduction model is far-reaching not only for the

23
development of the Chinese shipping industry, but also for shipping companies to gain a favorable position in the carbon credits exchange market. In the publication (Shi et al., 2011) lined up in this section, cost-benefit analysis is applied to get a cost-benefit ratio in GHG emissions trading. It is compared with the cost-benefit ratio resulting from GHG emissions reduction through technical methods in the shipping industry, thus showing the feasibility of GHG emissions trading. An in-depth study is carried out, aiming to enhance the professionalism and technical knowledge of the Chinese shipping industry regarding GHG emissions reduction. In addition, proposals for corresponding actions are raised for shipping companies’ reference, so that they will have an advanced position in the GHG emissions exchange market in the near future.
4.3 Infrastructure Aspect
From the network construction aspect, infrastructure as some bottleneck, e.g, the Panama Canal can dramatically affect the liner shipping business. The Panama Canal holds 43% of global shipping traffic. The East/West axis is the busiest, connecting the large industrial zones of Western Europe, North America, and East Asia. Three main routes run along this critical thoroughfare: the Asia/Europe Seaway; the Transatlantic Seaway liking Europe and the United States; and the Transpacific Seaway connecting Asia to the United States. Moreover, traffic within the Americas is concerned. In the past, vessels were forced to make their way around the Cape of Good Hope and the Strait of Magallan or Cape Horn, but construction of the Suez and Panama Canals reduced distances significantly, spurring growth along the East/West axis. Completed in 1869, the 200-km Suez Canal has become the route of choice for vessels transiting between Asia and Europe, with over 20,000 vessels passing through it each year. The Panama Canal, which opened in 1914, now handles annual traffic of more than 13,000 vessels traveling primarily between Asia and the US East Coast and between Europe and South America’s West Coast as well as within the Americas. The additional capacity could benefit a number of seaways. For example, large vessels operating between Asia and the US East Coast currently travel around the tip of South Africa; a widened Panama Canal would give them the option of taking a Transpacific route and then passing through the Canal to the Atlantic. Defined than the East/West and North/South axes, intra-regional seaways form a dense web of connections that account for a full 40% of the world’s shipping trade. Intra-Asian routes are the busiest, accounting for 77% of the world’s intra-regional traffic, as compared with only 14% for intra-European. The reason is simple: Asia is not only the world’s leading exporter, but is also one of its leading import zones, with China leading the way. The publication (Shi and Voß 2011c) lined up in this section discusses impact of the Panama Canal Expansion on the liner shipping business,

24
which might bring a new era of mega-container ships. To summarize content in Chapter 5, the philosophy that liner carriers would like to cope with the slowdown in the world economy, is actually tuning the patterns of their behaviors. The performance of a liner carrier relies on its strengths and competence to survive market dynamics from all aspects of technology, ecology and infrastructure.

25
Chapter 5 Conclusions and Future Research
5.1 Conclusions
In Chapter 1, background of a real world business was briefly overviewed and a framework of the cumulated publications was depicted. In addition, game theory as a methodology was introduced. Cooperation with sea ports and dry ports was analyzed in Chapter 2. Besides, in Chapter 2 and Chapter 3, vertical cooperation and horizontal cooperation in the liner shipping business was defined, respectively. The historical and contemporary service patterns of the liner shipping service are groomed along time periods. Non-cooperative game theory was applied for analyzing individual behavior or liner companies, etc., in Chapter 3. In Chapter 4, as technological aspect, RFID technology application to container terminal operations was sketched and its potential benefit of applying the RFID technology was demonstrated, followed by observations on ecological aspect and infrastructure aspect, too. Sustainability and environmental friendly approaches were also discussed in Chapter 4. In summary, for liner shipping business operators, to survive against market dynamics throughout decades in the past was not an easy task. However, once related business partners are regarded as players of the game, it helps to better understand the contemporary liner shipping business. The liner shipping market keeps showing the players a fantastic dynamics which motivate some newcomers as well as making others evolve.
5.2 Future Research
In the previous chapters, we have addressed issues including service categories, network construction, connectivity, pricing schemes and strategic investment. There are further research areas in this field deserving dedicated observation, e.g., online auctions as further service provided to Shippers. Such initiative of online auction on the service per slot would in particular facilitate liner companies to interact timely with their customers. Reliability is also one of performance indices of liner shipping service network, which has not been discussed in this thesis. It is generally accepted that time reliability can have significant influence on route choice behavior. Therefore, from a micro level perspective, further research on performance of networks needs to be evaluated in a manner of reliability, but most probably evaluated by carriers and shippers. However, in viewpoints of the author, accessibility of shipping line networks relies more on port operation and handling systems of the port-of-calls. Furthermore, there are some other

26
indices to evaluate networks as well, e.g., accessibility and stability. Stability of shipping line service relies more on behaviors of alliances’ members. In this thesis, we did not cover these two indices, though important, in details. Domestic services, e.g., inland navigation might also be an interesting further research. In reality, those ships deployed for domestic services and inland waterway service are often those smaller ones or aged ones phased out from international service. Further efforts can be paid to accelerate and implement above outlined ideas, including liner shipping networks reconstruction taking into considerations the dynamic routing derived from online auctions as well as services derived from domestic markets.

27
Acknowledgement
This Phd thesis is finished under sufficient support from Prof. Dr. Stefan Voß at the University of Hamburg and Prof. Dr. Hilde Meersman at the University of Antwerp. Besides transferring knowledge to me, both of them are extremely strict and serious with respect to academic work, which provides me good role models that I always want to be for my research career. With financial supports from the DAAD (Deutscher Akademischer Austauschdienst) of Germany and from the TransportNET program under the 6th Framework of the European Union, I, as a DAAD fellow and later a Marie Curie fellow, was able to enjoy my research in Europe. I also benefited from working and discussing with Prof. Eddy Van de Voorde and Dr. Thierry Vanelslander, who are members of TransportNET. All these professors together designed a dedicated training program which enabled me to touch wide ranges of cutting-edge research in transportation. I would also like to thank Prof. Dr Xinlian Xie, Prof. Dr. Xianzhong Meng. They accepted me as a master student and later a Phd candidate, respectively, which provided me chances of being further trained and being motivated. I am also grateful for having worked with Dr. Dong-Wook Song, who was the first supervisor of mine encouraging me to be an international researcher with open mind. Were it not because of his idea, I would not have chosen game theory as methodology and studied long time in Europe. When I was lost in the sea of mathematics as well as the application of Latex, Dr. Silvia Schwarze, Dr. Robert Stahlbock and Dr. Torsten Reiners helped me out with their outstanding knowledge. My colleagues in IWI (Institute of Information Systems) at the University of Hamburg, in TPR (Department of Transport and Regional Economics) at the University of Antwerp and other 16 Marie Curie fellows—they are too many to be listed here—are so friendly, so energetic and so humorous that I always think that I am extremely lucky to be with them. My close friends-Hanghang Gao, Hsin-Yi Huang, Xinyan Li, Zhenzhu Yue, especially Chih-Yun Yang whom I met in the first day that I came to Europe, always support me when I need them. We conquer difficulties together, such as homesick, and had lots of fun together. Most of them had already obtained and are going to have Phd degrees continuously in different majors including oceanic science, educational methodology, philosophy and atomic physics. Being a friend of them is a great thing! Last but not least, I am very happy to give this thesis to my parents as a gift, which they might have thought of since I was born though without telling me. They gave birth to me, educated and trained me, as well as keep putting more value into me by means of motivating me always in an appropriate way. Whenever I need supervision given by elder and experienced ‘supervisor’, I know they are always there.

28
References
Baird A.J. and Lindsay A.J. (1996), Strategic Choice in the Global Container Shipping Industry: A Resource-Based Approach, Proceedings of International Association of Maritime Economists Annual Conference, Vancouver. Brooks M.R. (1983), Determinants of Shipper’s Choice of Container Carriers: A Study of Eastern Canadian Exporters, PhD Dissertation, Department of Maritime Studies and International Transport, University of Wales College of Cardiff. Brooks M.R. (1993), International Competitiveness-Assessing and Exploring Competitive Advantage by Ocean Container Carriers, Logistics and Transportation Review, Vol. 29, No. 3, pp. 275-293. Brooks M.R., Blundel R.G. and Bidgood C.I. (1993), Strategic Alliances in the Global Container Transport Industry, Multinational Strategic Alliances, in Refick R. (ed), International Business Press, London. Brooks M.R. (2000), Sea Changes in Liner Shipping, Elsevier Science, Oxford. Fagerholt K. (2004), Designing Optimal Routes in a Liner Shipping Problem, Maritime Policy and Management, Vol. 31, pp. 259-268. Cullinane K.P.B., Khanna M. and Song D-W. (1999), How Big is Beautiful: Economies of Scale and the Optimal Size of Containership, Proceedings of International Association of Maritime Economists Annual Conference, Halifax, pp. 108-140. Dodgson M. (1992), The Strategic Management of R&D Collaboration, Technology Analysis and Strategic Management, Vol. 4, No. 3, pp. 227-244. Gibbons R. (1992), A Primer in Game Theory. Harvester Wheatsheaf, Hertfordshire Gilman S. (1999), The Size Economies and Network Efficiency of Large Containerships, International Journal of Maritime Economics, Vol. 1, pp. 5-18. Gross J. and Yellen, J. (2006), Graph Theory and its Applications, 2nd edn. Taylor & Francis,

29
Abington Haralambides H.E., Cheung C. and Tsolakis S. (2000), The Future of the Hub and Spokes System in Liner Shipping, World Conference on Transport Research, Pre-WCTR Workshop, Genoa. Hu L., Shi X., Voß S. and Zhang W. (2011), Application of RFID Technology at the Entrance Gate of Container Terminals, Lecture Notes on Computer Science (LNCS), Vol. 6971, pp. 209-220. Jaržemskis A., and Vasiliauskas A. V. (2007), Research on Dry Port Concept as Intermodal Node, Transport, Vol XXII, No 3, pp. 207-213. Kim J.S. and Kwak T.C. (2007), Game Theoretic Analysis of the Bargaining Process over a Long-Term Replenishment Contract, Journal of the Operational Research Society, Vol 58, pp. 769-778. Krajewska M.A. and Kopfer H. (2006), Collaborating Freight Forwarding Enterprises: Request Allocation and Profit Sharing, OR Spectrum, Vol. 28, pp. 301-317. Krajewska M.A., Kopfer H., Laporte G., Ropke S. and Zaccour G. (2008), Horizontal Cooperation among Freight Carriers: Request Allocation and Profit Sharing, Journal of the Operational Research Society, Vol. 59, Iss. 11, pp. 1483-1491. Li F., Shi X. and Hu H. (2011), Location Planning of Dry Port Based on Multinomial Logit, in Conference Proceedings of Annual Conference of the International Association of Maritime Economists (IAME), Chile Lim S-M. (1998), Economies of Scale in Container Shipping, Maritime Policy and Management, Vol. 25, pp. 361-373. Mowery D.C., Oxley J.E. and Silverman B.S. (1996), Strategic Alliances and Interfirm Knowledge Transfer, Strategic Management Journal, Vol. 17, Special Issue: Knowledge and the Firm, pp. 77-91. Nash J. (1944), Equilibrium Points in n-Person Games. Princeton University Press, Princeton Notteboom T. (2004), A Carrier’s Perspective on Container Network Configuration at

30
Sea and on Land, Journal of International Logistics and Trade, Vol. 1, pp. 65-87. Notteboom T. (2006), The Time Factor in Liner Shipping Services, Maritime Economics and Logistics, Vol. 8, pp. 19-39. Phlips L. (1995), Competition Policy: A Game Theoretic Perspective. Cambridge University Press, Cambridge Rimmer P.J. (1998), Impact of Global Strategic Alliances on Pacific Rim Seaports, Maritime Studies, Vol. 98, pp. 1-29. Shi X. and Voß S. (2007), Container Terminal Operations under the Influence of Shipping Alliances, in Khalid Bichou, Michael G.H. Bell and Andrew Evans (eds.) Risk Management in Port Operations, Logistics and Supply Chain Security, London, pp. 135-167. Shi X. and Voß S. (2008), Iterated Cooperation and Possible Deviations among Liner Shipping Carriers Based on Non-cooperative Game Theory, Journal of Transportation Research Record, Vol. 2066, pp. 60-70. Shi X. and Voß S. (2011a), Game Theoretical Aspects in Modelling and Analyzing the Shipping Industry, i Lecture Notes in Computer Science, Vol. 6971, pp. 302-320. Shi X. and Voß S. (2011b), General and Modified Slot Chartering Agreements-Performance Comparison Based on Different Mechanisms, Asia Journal of Shipping and Logistics, forthcoming Shi X. Tao D. and Voß S. (2011), RFID Technology and its Application to Port-Based Container Logistics, Journal of Organizational Computing and Electronic Commerce, Vol. 21, Iss. 4, pp. 1-16. Shi X. Zhang Y. and Voß S. (2011), Actions Applied by Chinese Shipping Companies under GHG Emissions Trading Scheme, Proceedings of Annual Conference of the International Association of Maritime Economists (IAME), Chile Shi X. and Voß S. (2011c), The Impact of the Panama Canal Expansion on Liner Fleet Deployment and Operation-A New Agenda, submitted for Annual Conference of Transportation Research Board (TRB), Washington, under review Song D. W. and Panayides M. (2002), A Conceptual Application of Cooperative Game

31
Theory to Liner Shipping Strategic Alliances, Maritime Policy and Management, Vol. 29, No.3, pp. 285-301. Spekman E., Isabella L. A. and MacAvoy T. C. (2000), Alliance Competence: Maximizing the Value of Your Partnerships, New York: John Wiley & Sons, Inc. Talley W. (2009), Port Economics. Routledge, New York Tirole J. (1988), The Theory of Industrial Organization. MIT Press, Cambridge Von Neumann J. and Morgenstern O. (1944), Theory of Games and Economic Behavior. Princeton University Press, Princeton Voß S. and Böse J. (2000), Innovationsentscheidungen bei logistischen Dienstleistern - Praktische Erfahrungen in der Seeverkehrswirtschaft. In: Dangelmaier W. and Felser W. (eds.) Das reagible Unternehmen, HNI, Paderborn, 253 - 282. Yoshida S., Yang J. H. and Kim K. H. (2001), The Network Economy of the Alliance in the Liner Shipping, Proceeding of Annual Conference of the International Associate of Maritime Economists (IAME), pp. 333-343.
32
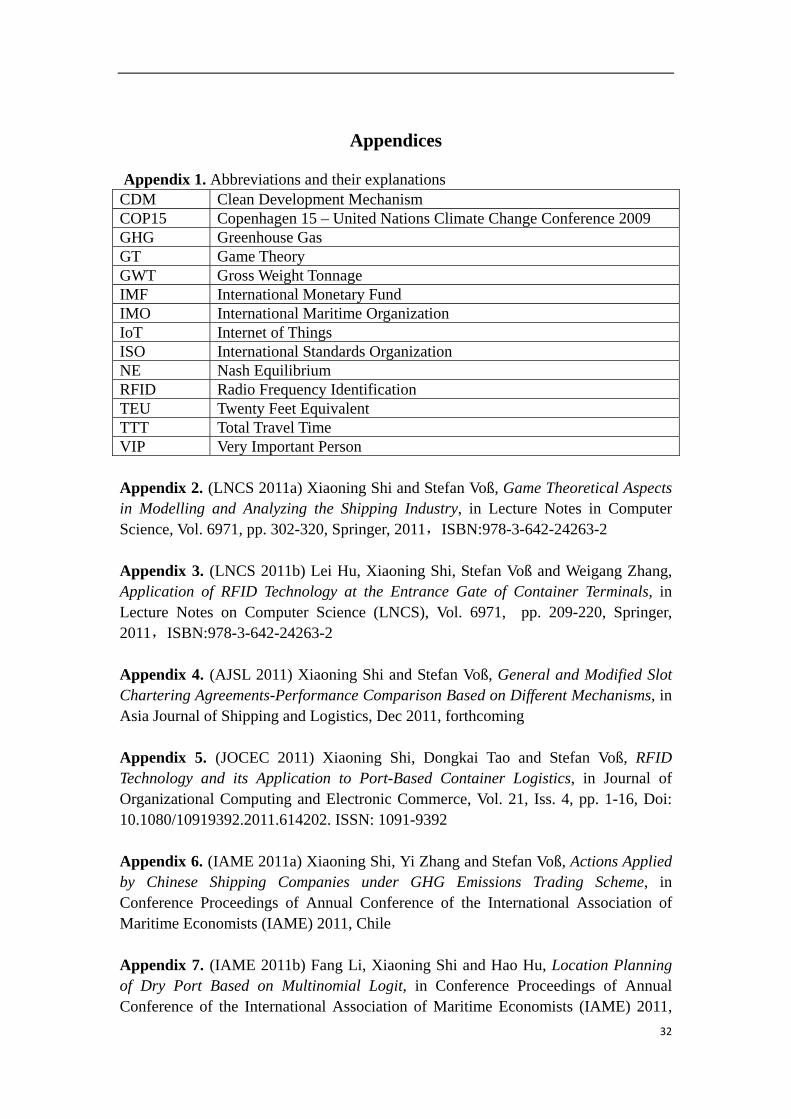
Appendices
Appendix 1. Abbreviations and their explanations CDM Clean Development Mechanism COP15 Copenhagen 15 – United Nations Climate Change Conference 2009 GHG Greenhouse Gas GT Game Theory GWT Gross Weight Tonnage IMF International Monetary Fund IMO International Maritime Organization IoT Internet of Things ISO International Standards Organization NE Nash Equilibrium RFID Radio Frequency Identification TEU Twenty Feet Equivalent TTT Total Travel Time VIP Very Important Person Appendix 2. (LNCS 2011a) Xiaoning Shi and Stefan Voß, Game Theoretical Aspects in Modelling and Analyzing the Shipping Industry, in Lecture Notes in Computer Science, Vol. 6971, pp. 302-320, Springer, 2011,ISBN:978-3-642-24263-2 Appendix 3. (LNCS 2011b) Lei Hu, Xiaoning Shi, Stefan Voß and Weigang Zhang, Application of RFID Technology at the Entrance Gate of Container Terminals, in Lecture Notes on Computer Science (LNCS), Vol. 6971, pp. 209-220, Springer, 2011,ISBN:978-3-642-24263-2 Appendix 4. (AJSL 2011) Xiaoning Shi and Stefan Voß, General and Modified Slot Chartering Agreements-Performance Comparison Based on Different Mechanisms, in Asia Journal of Shipping and Logistics, Dec 2011, forthcoming Appendix 5. (JOCEC 2011) Xiaoning Shi, Dongkai Tao and Stefan Voß, RFID Technology and its Application to Port-Based Container Logistics, in Journal of Organizational Computing and Electronic Commerce, Vol. 21, Iss. 4, pp. 1-16, Doi: 10.1080/10919392.2011.614202. ISSN: 1091-9392 Appendix 6. (IAME 2011a) Xiaoning Shi, Yi Zhang and Stefan Voß, Actions Applied by Chinese Shipping Companies under GHG Emissions Trading Scheme, in Conference Proceedings of Annual Conference of the International Association of Maritime Economists (IAME) 2011, Chile Appendix 7. (IAME 2011b) Fang Li, Xiaoning Shi and Hao Hu, Location Planning of Dry Port Based on Multinomial Logit, in Conference Proceedings of Annual Conference of the International Association of Maritime Economists (IAME) 2011,

33
Chile Appendix 8. (RTE 2011) Dong Yang, Miaojia Liu and Xiaoning Shi, Verifying Liner Shipping Alliance’s Stability by Applying Core Theory, Research in Transportation Economics, accepted in July 2011, Doi No.: 10.1016/j.retrec.2011.06.002 Appendix 9. (Netnomics 2010) Xiaoning Shi and Thierry Vanelslander, Design and Evaluation of Transportation Networks: Constructing Transportation Networks from Perspectives of Service Integration, Infrastructure Investment and Information System Implementation, Netnomics, Vol. 11, Iss. 1, pp. 1-4, 2010 Appendix 10. (UNCTAD 2009) Honey Tousypanah, Xiaoning Shi and Jan Hoffmann, Liner Shipping Connectivity in 2009, in United Nations Conference on Trade and Development (UNCTAD) Transport Newsletter, Vol. 43, Iss.2, pp. 6-9, 2009 Appendix 11. (IFIP 2008) Xiaoning Shi and Stefan Voß, From Transocean Routes to Global Networks: a Framework for Liner Companies to Build Service Networks, in Journal of Telecommunications and Information Technology, 3/2008, pp. 35-43, 2008, ISSN: 1509-4553 Appendix 12. (TRR 2008) Xiaoning Shi and Stefan Voß, Iterated Cooperation and Possible Deviations among Liner Shipping Carriers Based on Non-cooperative Game Theory, in TRR (Journal of Transportation Research Record), Vol. 2066, pp. 60-70, 2008 , Doi No.: 10.3141/2066-07 Appendix 13. (IAME 2008) Xiaoning Shi, Hilde Meersman and Stefan Voß, The Win-Win Game in Slot-Chartering Agreement among the liner Competitors and Collaborators, in Conference Proceedings of Annual Conference of IAME (International Association of Maritime Economist), 2008, China Appendix 14. (Informa 2007) Xiaoning Shi, and Stefan Voß, Container Terminal Operations under the Influence of Shipping Alliances, in Khalid Bichou, Michael G.H. Bell and Andrew Evans (eds.) Risk Management in Port Operations, Logistics and Supply Chain Security, London, pp. 135-167, 2007 Appendix 15. (TRB 2011) Xiaoning Shi and Stefan Voß, The Impact of the Panama Canal Expansion on Liner Fleet Deployment and Operation-A New Agenda, submitted for the Annual Conference of the Transportation Research Board (TRB), Washington, Jan 2012, working paper under review
Eidesstattliche Versicherung:
Hiermit erkläre ich, Xiaoning Shi, an Eides statt, dass ich die Dissertation mit dem Titel:
“Contemporary Liner Shipping Business – A Game Theoretical Application”
selbständig und ohne fremde Hilfe verfasst habe.
Andere als die von mir angegebenen Quellen und Hilfsmittel habe ich nicht benutzt. Die den herangezogenen Werken wörtlich oder sinngemäß entnommenen Stellen sind als solche gekennzeichnet.
Hamburg, 22 Sep, 2011 Xiaoning Shi
Ort/Datum Unterschrift

Game Theoretical Aspects in Modeling
and Analyzing the Shipping Industry
Xiaoning Shi1,2 and Stefan Voß1
1 University of Hamburg, Institute of Information Systems,Von-Melle-Park 5, 20146 Hamburg, Germany
[email protected], [email protected] Shanghai Jiao Tong University, Shanghai 200240, P.R. China
Abstract. The shipping industry is known for providing transport ser-vice in terms of deploying vessels and accessing ports, making shippingone of the network-based services. From the perspective of traditional aswell as neo-economics, shipping is assumed to pursue profit maximizationsubject to scarce resources, e.g. capital, assets, seafarers, or binding con-straints derived from schedules, etc. Players could be any of the following:linkage operators, e.g. liner shipping carriers, port operators, freight for-warders, customs, hinterland haulage carriers, inland navigation carriers,market regulators, etc. Taking into account interdependencies and inter-relations, game theory provides a meaningful way to model and analyzebehaviors of the involved players. In this paper we provide a survey ongame theoretical approaches within the shipping industry.
1 Introduction
Game theory (hereafter GT) is a methodology of decision making involving mul-tiple parties such as persons, companies or agents. For instance, each companymust consider what other companies will do. Classical literatures [48,73] togetherwith applications of GT in industrial organizations [21,50,70] usually discuss fourclasses of games: static as well as dynamic games of complete information andstatic as well as dynamic games of incomplete information. Corresponding tothese four classes of games there are four notions of equilibrium in games: Nashequilibrium (NE), subgame-perfect NE, Bayesian NE, and perfect Bayesian equi-librium. The NE is a solution concept of a game, in which each player is assumedto know the strategies to be taken by the others and no player can be betteroff by changing his or her own strategy unilaterally. A subgame-perfect NE is arefinement of a NE used in dynamic games if it represents a NE of every sub-game of the original game. Bayesian NE is a solution concept of Bayesian gameswhere at least one player is unsure of the type (and so the payoff function) ofanother player, which might result in some implausible equilibria in dynamicgames. To refine the equilibria generated by the Bayesian Nash solution conceptor subgame perfection, one can apply the perfect Bayesian equilibrium solutionconcept. The characteristics of each game can thus be summarized in Table 1.
J.W. Bose et al. (Eds.): ICCL 2011, LNCS 6971, pp. 302–320, 2011.c© Springer-Verlag Berlin Heidelberg 2011

Game Theoretical Aspects in Modeling and Analyzing the Shipping Industry 303
Table 1. Brief summary on solution concepts
Solution Nash equilibrium Bayesian Nash Subgame-perfect Perfect BayesianConcepts Equilibrium Nash equilibrium equilibrium
Proposed by John F. Nash Reinhard Selten John C. Harsanyi N/A (see, e.g. [39])Applications Static games Dynamic games Static games Dynamic games
Pure strategy Mixed strategy Sequential gamesExpressions Normal form Extensive form Extensive form Extensive form
Extensive formApproaches Fixed point Backward induction Bayes’s rule Sequential rationality
theorem based on updated beliefsInformation set Complete Complete Incomplete Imperfect
We start with a game in normal form which is a possible way of describing agame. Unlike extensive form, normal-form representations are not demonstratinga game by a graph or tree, but rather represent the game by way of a matrix orformulations. A game in this form consists of (1) players denoted by i = 1, 2, ..., n,(2) strategies or, more generally, a set of strategies indexed by xi available toplayer i and (3) payoffs πi(x1, x2, ..., xn) achieved by each player.
A player in a game is a person or a business community making decisions orchoosing a strategy from a set of given options. One player’s decision affects thatof the others. In a static game, players make decisions simultaneously withoutknowing information of other’s decision. In a dynamic game, players make de-cisions at different moments, i.e., a sequential decision making process happensdue to the fact that other’s decisions have been disclosed. A strategy in a game isone of the options from which a player may select. Such decision making processmay be based on historic experience of himself and/or information disclosed byother players. Traditional applications of GT attempt to find equilibria. In anequilibrium, each player of the game has adopted a strategy that none of theplayers involved is likely to deviate from.
Payoff means what a player gets after choosing a strategy. Pursuit of payoffmaximization, usually, is the utmost goal of a player. In this paper, we emphasizeways of thinking when decision makers face the shipping business. Therefore, thecategory of games and their applications are from an industrial viewpoint takinginto account that shipping is a network based service. Within this framework, aplayer can be, e.g., a liner shipping operator, or a tramp shipping operator, ora community of liners – an alliance – behaving as a whole in the market. A setof strategies can include whether to cooperate with other competitors or devi-ate from the current situation, etc. Payoff of a player is the commercial benefitwhen a player chooses one of his strategies, e.g., the revenue after choosing tocooperate with his competitor. The shipping industry provides transport ser-vices among ports by ships at sea. Its service is based mainly on the networksbuilt by carriers, representing the supply side by providing transport serviceswhile following regulations and policies. Shippers represent the demand side bybooking transport services. Besides freight rates, a shipper can decide to acceptone of the carriers’ offers taking into account his expectation of other shippers’

304 X. Shi and S. Voß
decisions to avoid congestion, peak season pricing, risk, etc. Carriers similarlyattempt to avoid overcapacity, cut-throat competition, lack of diversification,and other negative factors. Therefore, shippers or carriers can be regarded asplayers in games as they will not take action without considering what theircompetitors do. In addition, both shippers and carriers must act subject toregulations and policies in the shipping industry. We must also consider theregulator designing regulations and policies with an eye towards how shippersand carriers will react to them. In this sense, a regulator can also be viewed asplayer, especially in principal-agent relations. The interactions among playersin the shipping industry have a considerable impact on each player’s strategyset. The relationship between homogeneous players, e.g. different carriers, ishorizontal whereas the relationship between heterogeneous players, e.g. shipperand carrier, is vertical.
Mechanism design is one of the branches of GT where protocols are designedfor players by regulators. Sometimes also called reverse GT, it studies solutionconcepts for a class of private information games. More specifically, it is a caseof vertical games; we may also categorize it as principal-agent. In addition tothe aforementioned players, there is a growing trend for related service providersto integrate. For instance, truck haulage carriers integrate their business withshipping carriers so that door to door service can be achieved. Thus, games suchas price auctions and principal-agent incentive games also need to be considered,and these may be classified as either heterogeneous relations or principal-agentgames as mentioned before. Therefore, GT can be a helpful tool in the anal-ysis of the shipping industry given features of the industry that the decisionsof multiple players affect each players payoff. When observing the literature,the authors find that many meaningful tools are spread over a variety of pa-pers and books, and not so many well groomed surveys exist on systematicapplication of GT in the shipping industry. Our goal is to provide a survey onhow the existing literatures deal with behaviors of either homogeneous or het-erogeneous players in the shipping industry. In terms of discussing them stepby step, i.e., from horizontal relations to vertical relations, we shed lights tokinds of interactions among the players. The related discussion can be helpfulfor readers who intend to analyze GT aspects in the shipping industry. Dueto the need for short explanations, we focus only on the intuition behind thebusiness patterns discussed in this paper. Our second goal is to provide amplebut by no means exhaustive references on specific applications of various GTtechniques.
The remainder of this paper is organized as follows. In Section 2, operationalbusiness and strategic behaviors are categorized. In Section 3 and Section 4, weintroduce and demonstrate in various dimensions how players in the shippingindustry interact with each other taking into account both individual and col-lective rationality. Moreover, in Section 5 we show how market regulators mightimprove market efficiency by means of game theoretical mechanism design.

Game Theoretical Aspects in Modeling and Analyzing the Shipping Industry 305
Fig. 1. Structure of the shipping industry and its associated markets
2 Games in Shipping Networks
From an industrial perspective, a transport network is a spatial system of nodesand links over which the movement of cargo and passengers occurs [68], so is ashipping network. A node is a center in a transport network from which cargo andpassenger movements emanate. A physical link between two nodes is the trans-portation way (e.g., waterway, highway, railway, and airway) over some distancebetween the nodes. From a theoretical perspective (cf. graph theoretical con-cepts) a network can be represented as a graph, consisting of a number of nodes(vertices) and links (edges). Furthermore, a path is a trail with neither repeatededges nor repeated nodes [23]. However, in shipping practice service providersmay also design service routes with repeated linkages as well as repeated ports-of-call within one service. In addition, a decision maker representing a link alsoconsiders directions and capacities of other links. The same applies to decisionmakers representing nodes, which inevitably underlies primary principles of GT.Therefore, instead of just applying the path game, the problems investigated inthis research are defined by means of link games and node games within networks(Section 3). In order to better understand this mature and complex industry, wefirst outline major business issues. Then the informal business description istranslated into formal game theoretical problems. Figure 1 shows the varietiesof business relations comprising the shipping industry.
The primary shipping industry consists of liner shipping, tramp shipping, thetanker business and the ferry business (Box 1 of Figure 1). Liner shipping is aservice following announced and scheduled ports-of-call, regardless of whetherit is ocean sea transport or short sea shipping. Tramp shipping is a transport

306 X. Shi and S. Voß
service that does not rely upon repeatedly scheduled ports of call, but rather onpick-up and delivery of cargos according to demands and either voyage charter ortime charter-based contracts. The tanker business shares similar characteristicswith tramp shipping, the main difference being that the cargo in this case iseither crude oil/oil product or bulk. Finally, the ferry business provides serviceto passengers, which is beyond the scope of this paper taking into account thefact that the behavior of humans is relatively erratic compared to that of cargo.The interested reader could simply replace passengers, to some extent, withcargos and then apply the same GT thinking as discussed below. Within theprimary shipping industry, the competition and strategic cooperation amongthe homogeneous carriers arise as horizontal games. Considering the fact thatcarriers act as links connecting different ports, the carrier related competitionand cooperation can be viewed as one of horizontal relations at the macro level(i.e., a link game in service networks). Therefore, a link game is dealing with theconstruction of links and reconstruction of paths by means of either consolidatingor deconsolidating linkage supply, so that demand could be better satisfied.
As shown on the left side of Figure 1, the service providers component of theshipping service includes port operators, consolidation/distribution centers aswell as hinterland service operators such as truck haulage, railway operators and3rd party logistics providers. The ports and consolidation/distribution centersare nodes contributing to comprehensive service networks [68]. In a figurativesense, a node makes efforts to attract more links by means of amplifying through-put and storage capacity of the node as well as hinterland connections, wherethis could relate to various aspects including, e.g., available infrastructures toavoid congestion regarding hinterland traffic. Once there are other competitivenodes within the same trading zone or graphical region, the nodes compete witheach other in order to sustain as hub [47]. Or the nodes have to cooperate withthe existing hub because of their limited capacities [42]. Therefore, the port andconsolidation/distribution center related competition and cooperation can alsobe viewed as a center of horizontal relations among homogeneous players. How-ever, it belongs to the node game. In sum, a node game is aiming to adjust theattractiveness of associated nodes to links in terms of changing the status of thenode, so that better accessibility and capacity can be achieved.
Furthermore, links and nodes select each other in order to obtain better per-formance in tandem than in isolation. On one hand, the links select efficientnodes so that the waiting time and total voyage time could be shortened aswell as to avoid potential risks. Sometimes, the links observe existing nodes andchoose among them, as in the port selection problem of liner carriers [54]. Some-times, the links even propose and invest in new nodes when it is worthwhileto do so. On the other hand, nodes select weighted links so that the capacityof the nodes can be better utilized and higher profits can be achieved. In thiscase vertical relations among heterogeneous players occur [60]. In addition, theaccessibility and connections with other service providers are also vital to boththe links and nodes from the aspect of strategic sub-network integration at themacro level. Therefore, the problem is presented as a network game.
Game Theoretical Aspects in Modeling and Analyzing the Shipping Industry 307
The right hand side of Figure 1 depicts how associated resource markets sup-port the shipping industry. If containers are built or leased and workers areemployed, bargaining and auction games arise, (links 3 and 5 in Figure 1). Ifships are to be deployed, schedule optimization and network games are consid-ered (link 4). Finally, regulations and policies (Box 6) direct and control as faras possible behaviors of the associated players who simultaneously account forinterdependencies with others (related to mechanism design; see Section 5).
Besides demonstrating how players in shipping interact with each other wealso mention how market regulators might improve market efficiency by means ofgame theoretical mechanism design. Assume there is a shipping carrier (maybea tramp shipping carrier operating bulk in the past), who attempts to diversifyits business in terms of entering the liner shipping market. First, it might facea market entry barrier game when starting the liner business (Section 3.1). Thestrategy set consists of two options, i.e., to enter or not. The strategy set of exist-ing liners would include two actions: to defend (and if so to which extent) againstthe new entrant or not. The pay-offs for both the new liner and the existing lin-ers would be reflected in their utility matrices. In case the new liner succeeds inthe first game, this new liner might further consider being a member of existingliner strategic alliances. Then it faces the problem of fair allocation of profits(Section 3.2). If it does not have enough capital and fleets to cooperate fully withother liners, it might consider cooperation in terms of slot-chartering which canbe modeled as a kind of auction game (Section 3.3). However, as the shippingindustry keeps changing continually, the liner adjusts its competitive strategyas well as its long-term cooperation partners by means of learning (Section 4.3)undiscovered information (Section 3.5) in iterated and evolutionary sub-games(Section 3.4). If this liner eventually performs well enough, it might invest in re-lated industries, such as container building and leasing business (Section 3.6) aswell as the port operation business (Section 4). In addition, it needs to widen itsthinking based on the idea of customer relationship management: How would itscustomer (shipper) behave given various alternative liner carriers in the shippingnetwork (Section 4.1)? The shipper might maximize its own utility by avoidingcongestion on sea routes (Section 4.2). Similarly, the liner itself may achieve costsavings by avoiding congestion at ports (Section 4.2), too. Therefore, it couldbe better for this liner to investigate the whole shipping network by taking intoaccount network games (Section 4.4). In addition, it needs to follow the relevantregulations and policies as well as motivate its freight forwarders to grasp themarket share as much as possible (Section 5). Furthermore, even if it becomesmore sophisticated compared to when it first started the business, it might alsoobtain fast responses on how other players act by building an algorithmic system(Section 6), which can approach an equilibrium, in case of any.
3 Horizontal Relations among Homogeneous Players
We start with an example as a motivation to depict a simple game in a service-based network. Assume, some liner companies are providing nearly identical

308 X. Shi and S. Voß
service to the market, i.e., these services are pre-arranged as well as announcedwith fixed vessels, fixed schedule, fixed freight rate, fixed sequence of port-of-calls. Each service and port-of-calls are eventually constructing a network, whileservice routes can be regarded as sets of edges and port-of-calls as nodes. Then,we consider a directed network G = (V, E) with finite sets of nodes v ∈ V andedges e ∈ E. In this case, the liner carriers are the network owners because theshipping service network is built by them, i.e., l1, l2, ..., ln. A liner is denoted as li.Then, the entire capacity of a certain edge is Q =
∑ni=1 qi where qi denotes the
capacity of liner li along that edge. Given capacity provided by all liner carriers,the price of the shipping service of that edge is p = p(Q) = a − b
∑ni=1 qi. In
this expression, a and b are positive parameters to be defined in price-supplyrelation. Furthermore, once a liner carrier is regarded as a player, its strategyset consists of different options of providing certain amounts of capacities. Thebigger the supply (Q) the lower is the market price (p), and vice versa. So, aand b can be estimated by a series of values Q and p in different scenarios. Thecapacity is denoted as qi. The payoff of this player is ui = qip(Q) − ciqi fori = 1, 2, ..., n(i �= j), where ci denotes its cost function. From the perspective ofthis liner carrier, which is assumed to be selfish, the aim of successfully playingthe game is to maximize the output based on above mentioned payoff function.
It should be noted that link games together with node games could by nomeans be separated no matter what niche market of the shipping industry isto be observed. In this section, horizontal competition and cooperation amonghomogeneous players is considered. We start with the market entry game beforedeepening the business issues into more sophisticated games.
3.1 Market Entry Barriers Game
Once a liner attempts to enter a certain route, it becomes a competitor of theexisting liners operating this route. Therefore, the market entry barriers gamemay apply. Such games happened when liner shipping conferences functionedbefore the mid 1980s. Then, the conference deployed a “battle ship,” operatingon the same route, following the same schedule as the newly entered liner, butat a much lower price. The aim of such a deployment was to build up entrydeterrence [19] and prevent new entries by means of grasping shippers providinglower prices. Losses from these lower prices would be commonly allocated amongcartel members of the fighting conference. It is doubtful whether the new entrycould survive under a situation of low competitive price. However, the protectingcompany has to predict the rival’s cost function compared to its own in order toset up entry barriers as well as to better prepare for the competition [43].
3.2 Fairness and Power Indices
It should be noted that fair cost allocation can be applied to the liner con-ferences. Fairness does not automatically mean the allocation of costs or profitson an average base. In most cases, there exist leading players and follower players

Game Theoretical Aspects in Modeling and Analyzing the Shipping Industry 309
based on their performance powers. In other words, there exist partner asymme-tries in the strategic alliances [24]. When all the involved players accept a costallocation method taking into account power differentiations, it can be viewedas fairness, too. As for the power differentiation among the players we refer toat least five indices [1]: the Shapley-Shubik index [58], the Banzhaf index [3], theJohnston index [30], the Deegan-Packel index [10], and the Public Good index[29]. Furthermore, players within alliances or collusion might consider stabilityof the organization not only since the formation of the organization but alsoalong the iterated procedure in terms of designing an effective mechanism. Forinstance, instability of shipping cartels is a standard feature of elementary eco-nomic theory [62,63,64]. Generally speaking, the empty core can be applied toexplain why previous shipping conferences and current alliances exist, so it worksfor any industrial cartels alike [78]. In addition, the fairness among the partnersneeds to be considered as one of the main factors of associated mechanism design.
3.3 Auction Game
Together with the decline of traditional liner conferences, innovative means ofcooperation arise, which can be classified along three levels of cooperation: vessel-sharing, slot-exchanging and slot-chartering. These various forms of cooperationare of importance for the liner carriers as well as of interest for researchers.The main difference between vessel-sharing, slot-exchanging and slot-charteringis that vessel-sharing focuses more on network integration [14] and fleet deploy-ment [69], whereas slot-exchanging focuses more on route implementation, andslot-chartering more on price-and-quantity decisions [59]. Concerning the compe-tition and cooperation among the liner carriers, i.e. the link game, much researchhas been done based on a variety of observations including shippers choice [6],oligopoly market status, overcapacity issues [19] and additional profit allocationapproaches as well as fairness based on the Shapley value [56,57] derived from co-operative GT [74,66,41]. For the analysis of liner strategic alliances we also referto [65,61]. When relations among homogeneous liner carriers are to be discussedin terms of non-cooperative games, there are different perspectives which mightlead to various models. From the perspective of capacity limitation, the slot-chartering problem could be viewed as two persons zero-sum game because thereduced slot allocation of one player after bargaining comprises the added slotsthat the other player would achieve based on the negotiation. In this sense thedecision variables are related to the quantities of slots allocated to each player.From the perspective of bargaining processes, the slot-chartering problem mayalso differ depending on whether there is an effective long-term replenishmentmechanism. The mechanism design on slot-chartering price together with therespective quantity of the slots is valuable to be observed. Regarding the replen-ishment existing in other areas, e.g. in military management, see [40]. In order todesign an appropriate mechanism, the following two situations should be consid-ered, respectively: the slot owner has superior bargaining power over the relatedcharterer, and the reverse situation. Furthermore, during the iterated negotia-tion processes, the higher the position of any given player the more he tends to
310 X. Shi and S. Voß
push down the position of others. For long-term replenishment contracts basedon GT analysis see, e.g., [34]. From the perspective of profit sharing resultingfrom a slot-chartering cooperation, which is one form of link games, it could beviewed as non-zero-sum game since additional profits might occur when linersprovide more options to shippers. To the best of our knowledge, so far no suchresearch has been done in the ocean sea shipping industry. For similar researchconsidering the hinterland trucks picking-up and delivery tasks see [37,38].
3.4 Iterated and Evolutionary Games
From the perspective of negotiation processes, iterated sub-games affect the re-peated assignment of either capacities or extra profits [61]. One output of iteratedgames is to emphasize the evolution of ongoing processes. Players either turn outto be more rational, or capture more information and knowledge on the games.In addition, the mechanism of sub-games might turn out to be more truthful, orjust the other way around. Those possibilities could be realized only based oniterations of the game. Fundamental knowledge of evolutionary GT can be foundin [76]. Whether the iteration is converging is of great importance to all playersinvolved. The iteration during the negotiation process can be interpreted as a se-quence of best responses provided by all players. Therefore, contraction mappingmaybe applicable to find a solution to the fixed point equation x = f(x), x ∈ R1
[7]. One can think of a contraction mapping in terms of iterative play: player 1selects some strategy, based on this player 2 selects a strategy, etc. If the bestresponse mapping is a contraction, the NE obtained as a result of such itera-tive play is stable but the opposite is not necessarily true, i.e., no matter wherethe game starts, the final outcome is the same. See [49] for an extensive treat-ment of stable equilibria. The feature of contraction iteration of a game can bewell applied as an explanation on formation of slot-sharing agreements amongliner carriers. However, market circumstances are vital for the stability of theagreements. Once the market changes, e.g. freight rates increase sharply, theprevious stable equilibria set by a certain agreement turns to be unstable, or thecontraction process deviates from its way.
3.5 Asymmetric Information
From the perspective of incomplete and imperfect information among the in-volved players of shipping agreements, the true cost and individual prediction onthe market share are, to great extent, the business confidentialities of each player.Thus the involved players do not have full information about quantity optionsand consequently each possible quantity of capacity depends on the probabili-ties that other players perform different actions/behaviors. The unequal statusof information derives from the fact that some shipping related companies maypose superior information regarding their own costs and operating procedures.In addition, a shipping related company may know that another company mayhave better information, and therefore, choose actions that acknowledge thisinformation shortcoming [7]. In some cases, the players simultaneously choose

Game Theoretical Aspects in Modeling and Analyzing the Shipping Industry 311
actions or one of the players chooses an action without knowing actions of theother players. Then the game could be viewed as static. If one liner alreadyknows actions of the others before making a decision, the game could be viewedas dynamic. Furthermore, a player would use a mixed strategy when he is indif-ferent between several pure strategies. When the mixed strategy is mentioned,it means that one player is uncertain about what another player will do. So hegives each action of his strategy a probability to better respond to other players’actions. Related research in supply chain management, however, shows that un-der certain acceptability assumptions, asymmetric information need not implydecisions which are too far from optimal; see, e.g., [16]. This is valid for the casewhere asymmetric information and opportunistic behavior is taken into accounttogether with a mediator who supports the negotiation process. This mediatorrepeatedly generates new candidate contracts, which need to be accepted or re-jected by the agents according to particular strategies. Some research based on aGT framework suggests that learning processes might imply a contingence of theequilibrium [51]. Thus, iterated negotiations on price and quantity of the slot-chartering agreements deserve further research. Actually because of asymmetricinformation, the players are not exact homogeneous anymore. Those players canthen be categorized into either leader or follower of a game. After player 1 ob-serves the information on another player and/or his decision, the game turns tobe a Stackelberg game. In a Stackelberg duopoly model, player 1, the Stackel-berg leader, chooses a strategy first and then player 2, the Stackelberg follower,observes this decision and makes his own strategic choice. Since in many scenar-ios the ship operator as an upstream firm, e.g. the wholesaler, possesses certainpower over the typically freight forwarder as a smaller downstream firm, e.g. theretailer, the Stackelberg equilibrium concept can be applicable in many shippingrelated business. Besides dynamic games and leader-follower games, asymmetricinformation may also result in signaling games and Bayesian Games.
3.6 Asset Flows
The assets available for providing transport services, exist in the whole network,but not all of the assets are utilized. In this section, the utilized asset flows arediscussed, while the unused ones are discussed in the next paragraph. In somerecent research, e.g., [52] assigned involved players right to choose flow rate,energy amount, or bandwidth to reach equilibrium subject to the maximumflow, amounts or width, respectively.
Taking into account the characteristics of the special products related to trans-port capacity, one might realize that the transport capacity does not always equalthe customers’ requirements in terms of quantities. Therefore, either overcapac-ity or lack of service might occur. In both situations, imbalance between thetransport capacity and customers’ requirements would result in extra ‘costs.’ Incase of overcapacity, the wasted capacity can be interpreted in terms of the well-known newsboy problem, which belongs to classical Operations Research [33].Transport capacity not occupied when the ship (or truck) starts its trip, i.e., theempty part of the capacity is just like yesterday’s newspaper – it usually exists

312 X. Shi and S. Voß
without being of any value any more. This asks for efficient revenue managementtools as they are available in the airline industry; see, e.g., [25]. In case of lackof service, the extra costs can be interpreted as opportunity costs. The carriermight regret as it might be more profitable to prepare more capacity to graspthe market share instead of accounting for lost sales because he does not havethe capability to fulfill the requirements. Furthermore, the imbalance of tradeflows results in an empty container inbound dilemma: empty containers have tobe shipped back to export origins so that they can be used for further shipments.Thus, when setting parameters of the network games, empty containers shouldbe labeled as certain load but without profits or even with negative profits, sothat more realistic models could be derived.
4 Vertical Relations among Heterogeneous Players
Basically any player of the shipping industry might play either cooperationgames or competition games or both, within the designed mechanism and mar-ket circumstances including free market, monopoly, duopoly and even oligopoly.In this section, we pay attention to those actors who actually provide differentservices; i.e., they are rather suppliers or customers to each other than competi-tors in a certain niche market. In the transportation industry, there are gamesto be investigated among vertically related players. The players who share thesame value chain sometimes team up with each other so that better integratedservice can be provided to the final customer. Once the service provider selectionis to be involved, see Figure 1, the vertical relations become apparent. Such ver-tically related players might be liner carriers and port operators, shippers andfreight consolidation/distribution centers as well as hinterland haulage carriers,etc. Leader-follower models can be used to simulate the relationship among play-ers, because some players who have either more experience or higher negotiationpower distinguish themselves from their peers becoming leaders in games. Incontrast, those players who have relatively less experience or know-how may be-come followers in games. In case of inter-company management, human resourcesarrangement and the salary bargaining problem [13] can be interpreted as theprocess of learning labors’ potentials, hence a principal-agent model might beof use to motivate the labors in terms of design bonus and penalty mechanism.The ships owned by a carrier, without intracompany cooperation, could also beviewed as inter resources, and apply a principal-agent model, too.
4.1 Route Choice Game
The transportation industry is part of the service industry, i.e., the actual rev-enue must come from the first order customers who have the requirements tomove cargoes or passengers themselves from origins to destinations taking intoaccount the resource constraints together with customer preferences. The effortsof vertically related games, horizontally related games and network games are tosmooth the resource constraints and to fulfill customer preferences. In that sense,

Game Theoretical Aspects in Modeling and Analyzing the Shipping Industry 313
the customers themselves need to “play the game.” They use their common senseon the current service network, collect up-to-date information, and learn how tooptimize the utilities in terms of route choice and modal choice, as traditionaldiscrete choice models show [31]. For the freight transport sector, the shippermight choose air transportation as the preferred mode if he needs a faster linkto avoid any delay caused by shipping; however, he might also keep in mind theshipping line as an alternative for network reliability reasons. Recently, there hasbeen research considering network users as non-cooperative selfish players whoseek to optimize their experienced network latency [28,17].
4.2 Congestion Game
For the competition among regional ports, zoning techniques can be used tosupplement non-cooperative games. The congestion game and the Price of An-archy are also suitable ways to build pricing policies of associated ports withinzones. The congestion game is a game where a player’s payoff only depends onits strategy as well as the number of other players choosing the same strategy[46]. On the other hand, shippers are typically viewed as players in a congestiongame, and they are assumed to be non-cooperative and to choose routes self-ishly. Shippers of a certain zone first choose origins and destinations for theirshipments, and then select several carriers as options for fulfilling the shippersrequirement. Considering the number of shippers, this game could be regarded asan atomic game with a large number of players. Shippers may have the intentionto avoid overloaded links, while carriers have the intention to avoid congestednodes. Shippers might consider the reliability and stability of networks by hav-ing more links as options in case that overpayment occurs. So far there is nodetailed research on this in the shipping industry. However, similar ideas havebeen observed in telecommunications including wireless networks (see, e.g., [12]).
Considering appropriate customer relationship management, as network pro-viders, certain carriers give different weights especially to very important ship-pers so that they have priority to access the required links. This could also bereflected in the graph of the shipping networks.
4.3 Learning Processes
We do not claim that there is no learning process in horizontal relations andprincipal-agent relations; see [9] on how partners in alliances turn to trust eachother and/or control the cooperation based on expectations. Rather we includethe learning process here mainly because vertical relations are based on hetero-geneous players, and it might be harder to learn and control the expected coop-eration among heterogeneous players. For instance, service providers forecast thecustomers’ requirements and never know exactly what customers choose. There-fore, the learning mechanism involved due to business experience, informationsharing and exchanging could not reach pure transparency in shipping businessreality. Obviously, a liner may learn the performance of a port operator so thathe can choose whether to visit. Concerning information sharing among players

314 X. Shi and S. Voß
Fig. 2. Two layers of the shipping service network
in shipping, it is not surprising that information is asymmetric. For instance, theowner of the slots gets better access to the information of the costs of slots whilethe charterer gets less relevant information. The effective transparency of theinformation sharing among owners and charterers might improve the efficiencyof the whole agreements. However, with regard to the published vessel-sharing,slot-exchanging and slot-chartering agreements (see, e.g., [15]), the amount andprice of the slots are by no means transparent since they are regarded and pro-tected as business confidentiality. Generally speaking, the liner shipping servicecooperation among heterogeneous players can be regarded as stochastic resourceallocation problems, usually characterized by “curses of dimensionality.”
4.4 Network Dynamics
The node transit capacity and the link weight could change over time, resultingin network dynamics. Shippers own links in a network and sell transport service;at the same time shippers aim to minimize the prices they pay with respect tolinkages between origins and destinations taking into account network dynamics.Once the capacity is interpreted as bandwidth of edges, some research done inthe telecommunications industry [8] can also be applied to the shipping industry.
The shipping service network is quite dynamic. From the shippers’ standpoint,they are atomic, selfish, and non-cooperative, though sometimes shipment con-solidations occur. From the standpoint of carriers, they are monopolistic, almostrational, attempt to have more coalitions, which recently resulted in liner ship-ping strategic alliances and continuously change the capacities of different links.From the standpoint of port operators, they are aggressive, struggling for leader-ship within nearby zones, which push them towards increasing handling speedsand attract more links to connect them. Furthermore, in case hinterland distri-bution is included, the schedules of either carriers or shippers turn out to bemore or less unreliable [72]. All the above mentioned intentions cause dynamicsin the shipping network. The shipping network distinguishes two main layers:the links layer and the nodes layer, as shown in Figure 2. Competition and co-operation games among the liners can be described in the links layer as inputand a collection of liners’ actions are represented as port-of-call and shipment

Game Theoretical Aspects in Modeling and Analyzing the Shipping Industry 315
load of each link. This collection of liners’ actions is actually the input of thenodes layer. In addition, given extra investments and encouraging policies, someports may have extension opportunities. Then, in the base layer of Figure 2,the leader-follower situation of the zones in which promising ports are located,might change. There is valuable research from the perspective of network users.[4] studies reliability of a transport network by constructing a non-cooperativegame with two players including a network user and a network provider. Theauthor not only considers link failure of a network, but also the scenario that aconnected network fails to provide an adequate level of service. The latter aspectis often faced by ocean sea network service providers, especially when the marketis booming and there is not enough capacity available immediately. [5] study theroute-choice behavior performed by risk-averse network users by formulating anon-cooperative game. These network users can be transformed to shippers asthey can be regarded as ocean sea network users. Such kind of risk-averse userstend to take into account the route costs and their consequent uncertainty onthe cost when making decisions on route choice.
5 Mechanism Design
In this section, we start to observe what an industry regulator should do tobe better off compared to anarchy. Mechanism design is one of the branches ofGT, where protocols are designed for players by regulators. Generally speaking,mechanism design can be viewed as the ‘inverse problem’ of games, where theinput is a game’s outcome and the output is a designed game guaranteeing thedesired outcome [44]. Regulators in the shipping industry observe the marketturbulence and involved players’ behaviors from a GT perspective, and laterfigure out better mechanisms to regulate and motivate shippers, carriers, portoperators, etc. Similar ideas have recently been implemented as road pricingpolicies from the viewpoint of a regulator; see, e.g., [75,77,71].
Ships in our settings usually cause emissions. In this respect a market regula-tor, e.g. the transport commission of the European Union, regulates the memberstates in terms of emission quota allocation [20,22]. Once we realize values ofcost, profit, emission, slot, and the load share of networks of the same nature,the emission quota allocation problem is actually similar to the cost sharingproblem. Regarding profits and the resources sharing problem we refer to [53],where a similar idea could be applied in emission quota allocation, too.
The vital problem of a Principal-Agent incentive game is how the principalcould motivate agents to perform as effectively as possible [2] by taking advan-tage of more information about the agents actual efficiencies. In the shippingindustry, a shipping carrier as principal has more information about its owntotal costs to control the marketing but less information on how effective itsrelated forwarder agents could be. The carrier authorizes forwarder agents tograsp freights on behalf of the principal. As a dominant principal, the carriercan design mechanisms in such manners, e.g., setting bonus of good performancein monetary terms, setting penalty of laziness or ineffectiveness to either moti-vate or control its agents. Thus, the key points are price setting, contract design

316 X. Shi and S. Voß
based on interdependent players, etc., where the Stackelberg model [55] and aworst-case NE together with the Price of Optimum [32] are vital.
Another application of mechanism design is to harmonize partnerships be-tween public and private sectors of transport projects. One may refer to [45].
6 Algorithmic Game
Algorithmic GT is a promising subfield and experimental method to figure out orsimulate the players’ behaviors, and later the optimized collective outcome. A NEcan be interpreted as the best response of each player so that no other improve-ment can be better off. While attractive, numerous criticisms of the NE exist.Two particularly vexing problems are the non-existence of an equilibrium andthe multiplicity of equilibria. Therefore, what is the complexity for computingand searching the NE? This is a relatively new subfield which captured researchinterest over the last couple of years. For the computation of network complexity,we refer to [44] as well as, e.g., contributions in [36]. Multi-agent based simulationfor the evaluation of container terminal management operations is considered instudies summarized in [27]. The approach aims at planning and coordinating theprocesses within the terminal by mapping the terminal’s objects and resources.The agents strive to complete their specified goal by searching, coordinating,communicating, and negotiating with other agents by means of a market basedmechanism such as a series of auctions; see also [67]. In [26], experiments ap-plying multi-agent systems for investigating the impact of different policies forsequencing, berthing, and stacking on the performance of container terminals areproposed. Numerical experiments based upon real data are conducted to evaluateeight transshipment policies. Shorter vessel turnaround times can be achievedwith good decisions on yard stacking (e.g., using the stacking-by-destination pol-icy) and berth allocation. [18] propose an integrative cost estimation concept anda multi-agent system approach for managing container terminals. The holisticobjective is the minimization of the average terminal-effected costs of containerhandling. The paper presents different market mechanisms for resource alloca-tion by coordinating the market with bilateral polypolies. Techniques proposedfor the container barge handling in the port of Rotterdam by [35,11] may beseen in the spirit of GT approaches, too.
7 Summary and Conclusion
In this paper, we discussed from various perspectives how to observe the shippingindustry by means of game theoretical applications. We categorized the link game,the node game and the network game. In addition, we integrated shipping carri-ers, port as well as consolidation/distribution operators in terms of interdepen-dent network games. Concerning the nature of the shipping industry, horizontalrelations among homogeneous players and vertical relations among heterogeneousplayers were discussed, too. From the supply perspective, once existing carriersmake decisions based on cooperative games, overcapacity would not happen so
Game Theoretical Aspects in Modeling and Analyzing the Shipping Industry 317
often or severe. In that respect, ideas discussed in this paper propose food forthought for developing liner shipping service in a sustainable manner.
We may further observe transport carriers of other modes than shipping, to-gether with more consolidation/distribution options within associated hinterlandinstead of only ports at sea. The discussion of this paper can be extended to othermeans of transport as long as they share the same natures of networks. To con-clude, game theoretical concepts can help better understand the liner shippingindustry and equally support them in decision making.
References
1. Alonso-Meijide, J., Casas-Mendez, B., Holler, M., Lorenzo-Freire, S.: Computingpower indices: Multilinear extensions and new characterizations. European Journalof Operational Research 188, 540–554 (2008)
2. Arrow, K.: The economics of agency. In: Pratt, J., Zeckhauser, R. (eds.)Principals and Agents: The Structure of Business, pp. 37–51. Harvard UniversityPress, Cambridge (1985)
3. Banzhaf, J.: Weighted voting doesn’t work: A mathematical analysis. Rutgers LawReview 19, 317–343 (1965)
4. Bell, M.: A game theory approach to measuring the performance reliability oftransport networks. Transportation Research B 34, 533–545 (2000)
5. Bell, M., Cassir, C.: Risk-averse user equilibrium traffic assignment – An applica-tion of game theory. Transportation Research B 36, 671–681 (2001)
6. Brooks, M.: Determinants of Shippers Choice of Container Carriers: A Study ofEastern Canadian Exporters. Ph.D thesis, Department of Maritime Studies andInternational Transport, University of Wales, College of Cardiff (1983)
7. Cachon, G., Netessine, S.: The economics of agency. In: Simchi-Levi, D., Wu,D., Shen, Z. (eds.) Handbook of Quantitative Supply Chain Analysis: Modelingin the eBusiness Era, pp. 37–51. Kluwer, Boston (2004)
8. Chawla, S., Roughgarden, T.: Bertrand competition in networks. In: Monien,B., Schroeder, U.-P. (eds.) SAGT 2008. LNCS, vol. 4997, pp. 70–82. Springer,Heidelberg (2008)
9. Das, T., Teng, B.: Between trust and control: Developing confidence in partnercooperation in alliances. Academy of Management Review 23, 491–512 (1998)
10. Deegan, J., Packel, E.: A new index of power for simple n-person games. Interna-tional Journal of Game Theory 7, 113–123 (1979)
11. Douma, A., Schuur, P., Jagerman, R.: Degree of cooperativeness of terminals andthe effect on the barge handling process. Tech. rep, University of Twente, Depart-ment of Operational Methods for Production and Logistics (2008)
12. Ercal, G., Izhak-Ratzin, R., Majumdar, R., Meyerson, A.: Frugal routing on wire-less ad-hoc networks. In: Monien, B., Schroeder, U.-P. (eds.) SAGT 2008. LNCS,vol. 4997, pp. 133–144. Springer, Heidelberg (2008)
13. Espinosa, M., Rhee, C.: Efficient wage bargaining as a repeated game. QuarterlyJournal of Economics 104, 565–588 (1989)
14. Evangelista, P., Morvillo, A.: Logistical integration and co-operative strategies inliner shipping: Some empirical evidence. International Journal of Maritime Eco-nomics 2(1), 1–16 (2000)
15. Federal Maritime Commission (FMC), http://www.fmc.gov/ (last call June 30,2011)

318 X. Shi and S. Voß
16. Fink, A.: Supply chain coordination by means of automated negotiations. In:Sprague, R. (ed.) Proceedings of the 37th Hawaii International Conference on Sys-tem Sciences, pp. 234–248. IEEE, Piscataway (2004)
17. Fotakis, D.: Congestion games with linearly independent paths: Convergence timeand price of anarchy. In: Monien, B., Schroeder, U.-P. (eds.) SAGT 2008. LNCS,vol. 4997, pp. 33–45. Springer, Heidelberg (2008)
18. Franz, T., Voß, S., Rolke, H.: Market-mechanisms for integrated container terminalmanagement. In: Bertram, V. (ed.) Proc. of the 6th Inter. Conf. on Computerand IT Applications in the Maritime Industries, COMPIT 2007, Cortona, Italy,pp. 234–248, INSEAN (2007)
19. Fusillo, M.: Excess capacity and entry deterrence: The case of ocean liner shippingmarkets. Maritime Economics and Logistics 5, 100–115 (2003)
20. Gardner, B., Marlow, P., Nair, R.: The economic regulation of liner shipping: Theimpact of US and EU regulation in US trades. In: Grammenos, C. (ed.) The Hand-book of Maritime Economics and Business, pp. 327–345. Informa, London (2002)
21. Gibbons, R.: A Primer in Game Theory. Harvester Wheatsheaf, Hertfordshire(1992)
22. Gomes, E., Lins, M.: Modelling undesirable outputs with zero sum gains dataenvelopment analysis models. Journal of the Operational Research Society 59,616–623 (2003)
23. Gross, J., Yellen, J.: Graph Theory and its Applications, 2nd edn. Taylor & Francis,Abington (2006)
24. Harrigan, K.: Strategic alliances and partner asymmetries. In: Contractor,F.,Lorange, P. (eds.) Cooperative Strategies in International Business-Joint Ven-ture and Technology Partnerships Between Firms, pp. 205–226. Lexington Books,Lexington (2006)
25. Hellermann, R.: Capacity Options for Revenue Management. Springer, Berlin(2006)
26. Henesey, L., Davidsson, P., Persson, J.: Agent based simulation architecture forevaluating operational policies in transshipping containers. In: Fischer, K., Timm,I.J., Andre, E., Zhong, N. (eds.) MATES 2006. LNCS (LNAI), vol. 4196, pp. 73–85.Springer, Heidelberg (2006)
27. Henesey, L.: Multi-agent Systems for Container Terminal Management. Ph.D. the-sis, Blekinge Institute of Technology, Karlshamn (2006)
28. Hoefer, M., Souza, A.: The influence of link restrictions on (random) selfish routing.In: Monien, B., Schroeder, U.-P. (eds.) SAGT 2008. LNCS, vol. 4997, pp. 22–32.Springer, Heidelberg (2008)
29. Holler, M.: Forming coalitions and measuring voting power. Political Studies 30,262–271 (1982)
30. Johnston, R.: On the measurement of power: Some reactions to laver. Environmentand Planning A 10, 907–914 (1978)
31. de Jong, G., Ben-Akiva, M.: A micro-simulation model of shipment size and trans-port chain choice. Transportation Research B 41, 950–965 (2007)
32. Kaporis, A., Spirakis, P.: The price of optimum in Stackelberg games. In: Bichou,K., Bell, M., Evans, A. (eds.) Proceedings of the 18th Annual ACM Symposiumon Parallelism in Algorithms and Architectures, pp. 19–28 (2006)
33. Khouja, M.: The single-period (news-vendor) problem: Literature review and sug-gestions for future research. Omega 27, 537–553 (1999)
34. Kim, J., Kwak, T.: Game theoretic analysis of the bargaining process over along-term replenishment contract. Journal of the Operational Research Society 58,769–778 (2007)

Game Theoretical Aspects in Modeling and Analyzing the Shipping Industry 319
35. Konings, R.: Opportunities to improve container barge handling in the port of Rot-terdam from a transport network perspective. Journal of Transport Geography 15,443–454 (2007)
36. Kontogiannis, S., Koutsoupias, E., Spirakis, P.G. (eds.): Algorithmic Game Theory.LNCS, vol. 6386. Springer, Heidelberg (2010)
37. Krajewska, M., Kopfer, H.: Collaborating freight forwarding enterprises: Requestallocation and profit sharing. OR Spectrum 28, 301–317 (2006)
38. Krajewska, M., Kopfer, H., Laporte, G., Ropke, S., Zaccour, G.: Horizontal coop-eration among freight carriers: Request allocation and profit sharing. Journal ofthe Operational Research Society 59, 1483–1491 (2007)
39. Kreps, D.M., Wilson, R.: Sequential equilibria. Econometrica 50, 863–894 (1982)40. Lennon, C., Connel, J.M., Liang, K.Y.: A game-theoretic model for repeated as-
signment problem between two selfish agents. Journal of the Operational ResearchSociety 59, 1652–1658 (2007)
41. Liu, M., Akio, I.: An application of modified Shapley value to ocean shippingstrategic alliances. Journal of Japan Institute of Navigation 113, 281–286 (2005)
42. Matsumura, T., Shimizu, D.: Cournot and Bertrand in shipping models with cir-cular markets. Regional Science 85, 585–598 (2006)
43. Mavronicolas, M., Papadopoulou, V.G., Philippou, A., Spirakis, P.G.: Networkgame with attacker and protector entities. In: Deng, X., Du, D.-Z. (eds.) ISAAC2005. LNCS, vol. 3827, pp. 288–297. Springer, Heidelberg (2005)
44. Mavronicolas, M., Papadoupoulou, V., Spirakis, P.: Algorithmic Game Theory andApplications. Wiley, New York (2006)
45. Medda, F.: A game theory approach for the allocation of risks in transportpublic private partnerships. International Journal of Project Management 25,213–218 (2004)
46. Milchtaich, I.: Congestion games with player-specific payoff functions. Games andEconomic Behavior 13, 111–124 (1996)
47. Min, H., Guo, Z.: The location of hub-seaports in the global supply chain net-work using a cooperative competition strategy. International Journal of IntegratedSupply Management 1(1), 51–63 (2004)
48. Nash, J.: Equilibrium Points in n-Person Games. Princeton University Press,Princeton (1944)
49. Moulin, H.: Game Theory for the Social Science. New York University Press (1944)50. Phlips, L.: Competition Policy: A Game-Theoretic Perspective. Cambridge Uni-
versity Press, Cambridge (1944)51. Powell, J., Swart, J.: Scaling knowledge: How does knowledge accrue in systems?
Journal of the Operational Research Society 59, 1633–1643 (2007)52. Puerto, J., Schobel, A., Schwarze, S.: The path player game – A network game from
the point of view of the network providers. Mathematical Methods and OperationsResearch 68, 1–20 (2008)
53. Reinhardt, G., Dada, M.: Allocating the gains from resource pooling with theshapley value. Journal of the Operational Research Society 56, 997–1000 (2005)
54. Rimmer, P.: Ocean liner shipping services: Corporate restructuring and port selec-tion/competition. Asia Pacific Viewpoint 39(2), 193–208 (1998)
55. Roughgarden, T.: Stackelberg scheduling strategies. SIAM Journal on Comput-ing 33, 332–350 (2003)
56. Shapley, L.: A value of n-person games. Annals of Mathematics Studies 28,307–317 (1953)
57. Shapley, L.: Cores of convex games. International Journal of Game Theory 1,11–26 (1971)

320 X. Shi and S. Voß
58. Shapley, L., Shubik, M.: A method for evaluating the distribution of power in acommittee system. American Political Science Review 48, 787–792 (1954)
59. Shi, X., Meersman, H., Voß, S.: The win-win game in slot-chartering agree-ment among the liner competitors and collaborators. In: Bichou, K., Bell, M.,Evans, A. (eds.) Proceedings of the IAME 2008 Conference Sustainability in In-ternational Shipping, Port and Logistics Industries and the China Factor, vol. 3,pp. D2/T2/S2–3, 1–26. IAME, Dalian (2008)
60. Shi, X., Voß, S.: Container terminal operations under the influence of shippingalliances. In: Bichou, K., Bell, M., Evans, A. (eds.) Risk Management in PortOperations, Logistics and Supply Chain Security, pp. 135–163. Informa, London(2007)
61. Shi, X., Voß, S.: Iterated cooperations and possible deviations among the linershipping carriers based on non-cooperative game theory. Transportation ResearchRecord 2066, 60–70 (2008)
62. Sjostrom, W.: Collusion in ocean shipping: A test of monopoly and empty coremodels. The Journal of Political Economy 97(5), 1160–1179 (1989)
63. Sjostrom, W.: Liner shipping: Modelling competition and collusion. In: Gram-menos, C. (ed.) The Handbook of Maritime Economics and Business, pp. 307–326.Informa, London (2002)
64. Sjostrom, W.: Ocean shipping cartels: A survey. Review of Network Eco-nomics 3(2), 107–134 (2004)
65. Slack, B., Comtois, C., McCalla, R.: Strategic alliances in the container shippingindustry: A global perspective. Maritime Policy and Management 29, 65–75 (2002)
66. Song, D., Panayides, P.: A conceptual application of cooperative game the-ory to liner shipping strategic alliances. Maritime Policy and Management 29,285–301 (2002)
67. Stahlbock, R., Voß, S.: Operations research at container terminals: a literatureupdate. OR Spectrum 30, 1–52 (2008)
68. Talley, W.: Port Economics. Routledge, New York (2009)69. Ting, S., Tzeng, G.: Ship scheduling and cost analysis for route planning in liner
shipping. Maritime Economics & Logistics 5, 378–392 (2003)70. Tirole, J.: The Theory of Industrial Organization. MIT Press, Cambridge (1988)71. Tsekeris, T., Voß, S.: Design and evaluation of road pricing: State-of-the-art and
methodological advances. Netnomics 10, 5–52 (2009)72. Vernimmen, B., Dullaert, W., Engelen, S.: Schedule unreliability in liner shipping:
Origins and consequences for the hinterland supply chain. Maritime Economics &Logistics 9, 193–213 (2007)
73. von Neumann, J., Morgenstern, O.: Theory of Games and Economic Behavior.Princeton University Press, Princeton (1944)
74. Wang, T., Panayides, P., Song, D.: Inter-organisational relations in liner shippingalliances as a co-operative game. Journal of the Eastern Asia Society for Trans-portation Studies 3(1), 247–262 (2001)
75. Wang, Y.: Strategic Gaming Analysis of Competitive Transportation Services.Ph.D thesis, Hong Kong University of Science and Technology (2004)
76. Weibull, J.: Evolutionary Game Theory. MIT Press, Cambridge (1995)77. Xiao, F.: Game-Theoretic Models for Competitive Pricing and Network Design
Problems. Ph.D thesis, Hong Kong University of Science and Technology (2007)78. Zhao, J.: Estimating merging costs by merger preconditions. Theory and Deci-
sion 66, 373–399 (2009)
Application of RFID Technology at the Entrance
Gate of Container Terminals
Lei Hu1, Xiaoning Shi1,2, Stefan Voß2, and Weigang Zhang1
1 Department of International Shipping and Logistics, School of Naval Architecture,Ocean and Civil Engineering, Shanghai Jiao Tong University, 800 Dongchuan Road,
Shanghai, 200240, [email protected], [email protected], [email protected]
2 University of Hamburg, Institute of Information Systems,Von-Melle-Park 5, 20146 Hamburg, Germany
[email protected], [email protected]
Abstract. Radio Frequency Identification refers to using transpondersor tags affiliated with an object for the purpose of identification andtracking by means of radio waves. This paper focuses on container portoperations, emphasizing on the current status of these operations andits business bottlenecks. Based on that, we discuss related solutions forimproving efficiency from the perspective of orderly balance and seam-less connection in different operational processes at the entrance gate ofcontainer terminals.
1 Introduction
With the gradual promotion of the concept of the Internet of Things (IoT), itsrelated technologies are expected to have impact on the operational processesof any kinds of logistics, and further promote their efficiency and effectiveness.As one of the technologies that enable the implementation of the IoT, RadioFrequency Identification (RFID) is becoming increasingly important and it isused in production, manufacturing as well as supply chain management.
Many RFID applications seem to focus on closed-loop scenarios devised tosolve particular problems in real business cases where alternative solutions arenot feasible [10]. RFID tools play an important role in supporting assemblylines, medical, logistics, and supply chain management processes. RFID tools canidentify, categorize, and manage the flow of goods and information throughoutthe supply chain. Moreover, RFID brings greater visibility to business processes,e.g., in supermarkets, customs authorities, etc. In an ideal world, it can ensurethe necessary data transfer to reach optimal supply chain conditions.
Innovation management and process re-engineering of container terminals mayrefer to the analysis and redesign of workflows of port operations [18]. Relatedre-engineering can be used in ports to lower costs and increase quality of ser-vice. Information technology may be seen as key enabler for a radical changein ports and terminals. To which extent RFID is an enabler for related changestill needs to be investigated. Transportation companies around the world value
J.W. Bose et al. (Eds.): ICCL 2011, LNCS 6971, pp. 209–220, 2011.c© Springer-Verlag Berlin Heidelberg 2011

210 L. Hu et al.
RFID technology due to its impact on the business value and efficiency. SinceRFID technology is mature, we can use this technology in the access controlsystems of container terminals. In this way, we may decrease the workload inthe gate of the container terminal and improve the efficiency in receiving thecontainers. Regarding yard management, shipping and freight and distributioncenters are some areas where RFID tracking technology is used.
We first sketch the functioning of container terminal operations in Section2. In Section 3, the working principles of RFID are introduced. In Section 4 wediscuss options to re-engineer selected port operations, together with a discussionon the application of RFID in the container entrance gate for road trucks. Thelatter section is moderately interleaved with a related literature review. Based ona small case, in Section 5, we reach conclusions on potential benefit of applyingthe RFID technology as well as summarize some relevant further research topics.
2 Container Terminal Operations
Operation processes at a container terminal can be divided into import andexport operation processes. In this paper we focus on the export processes andbusiness bottlenecks. Seaport container terminals may be seen as open systemsof material flow with a large variation in size, function, and layout. Basically,they are very similar in structure and related same sub-systems (see Figure 1).The waterside (ship operation or berthing area) is equipped with quay cranesfor loading and unloading of vessels. Import and export containers are stockedin a yard which usually is divided into a number of blocks. Special stackingareas may be reserved, e.g., for reefer containers, which need electrical supplyfor cooling, or for storing hazardous goods. Separate areas may also be usedfor empty containers. Some terminals employ sheds for stuffing and strippingcontainers or for additional logistics services. The truck and train operationarea links the terminal to the hinterland and outside transportation systems.
The chain of operations for export containers can be described as follows (seeFigure 2 and [15]). After arrival at the terminal by truck or train, the containeris identified and registered with its major data (e.g., content, destination, out-bound vessel, shipping line), picked up by internal transportation equipment,and distributed to one of the storage blocks in the yard. The respective storagelocation is given by row, bay, and tier within the block and is assigned in realtime upon arrival of the container at the terminal. To store a container at theyard block, specific cranes or lifting vehicles are used (e.g., rail mounted gantrycranes RMG). Finally, after the arrival of the designated vessel, the containeris transported from the yard block to the berth where quay cranes load thecontainers onto the vessel at a pre-defined stacking positions. The operations tohandle an import container are performed in the reverse order. Scheduling thehuge number of concurrent operations with all the different types of transporta-tion and handling equipment involves extremely complex planning problems.Following the discussion in the extensive surveys of [16,14], in view of the ever-changing terminal conditions and the limited predictability of future events andtheir timing, they often must be solved in an online fashion or even in real time.

Application of RFID Technology at the Entrance Gate 211
Truck and Train Operation Area
Yard Moves
Ship Operation Area
YardImport/Export Stock
Empty Stock
Sheds
Quayside Operation
Hinterland Operation
Fig. 1. Operation areas of a seaport container terminal and flow of transports [16, p. 6]
Stackwith RMG
Quay CraneTrucks, Train
Vessel
Vehicles
Quayside Landside
Vehicles
Fig. 2. Transporting and handling procedures of a container [16, p. 13]
Consider a specific example of the container transport chain. When it comesto exporting of containers, the operation processes are as follows.
1. The shipper first consolidates his cargoes in containers.2. After the commission of the shipper or its freight forwarder, the trucking
firm will transport the containers to the yard of the container terminal.3. Before going into the container yard, the truck has to first check-in at the
container entrance gate. During this process, the gate house workers willcheck the EIR (Equipment Interchange Receipt) and related information ofthis container, such as the container size, its reference number, etc.
4. After the container has been checked, it will be unloaded, e.g., with a gantrycrane, and placed on the yard.
5. When a vessel comes, the port uses related equipment to discharge and loadthe containers to the vessel.

212 L. Hu et al.
The procedure of importing the containers is similar to that of exporting con-tainers. When it comes to the transshipment of the containers, the operationprocesses are shown as follows (including domestic as well as international trans-shipment containers). When the terminal unloads the transshipment containers,it needs the manifest of the transshipment container or the related EDI infor-mation, and the transshipment containers should be transported to a specifiedtransshipment zone. Exporting transshipment containers need the notice certi-fied by the customer. Then the terminal can load the transshipment containers.
Export containers are usually delivered to the ports two or three days beforethe arrival of related vessels. But at that time the export manifests collected bythe shipping agency need not be complete. Still at many ports worldwide onlyby manually completing data can the terminal collect the containers as thereare incomplete (or non-correct) export lists. As there is only one piece of exportmanifest for one vessel, the terminal gates might even record the information ofthe containers manually only by referring to the documents, i.e., EIR and pack-ing lists, and after this the containers can pass the entrance gates. It is obviousthat this kind of process not only wastes time, but also increases the possibilityof including errors [19]. Suppose we record the data completely when containerspass the gates, this will be at the expense of at least 30 to 60 extra seconds. Ifa vessel carries 2000 containers on average, then this procedure might take 10to 20 hours to complete the process of moving the containers to the yards orcontainer freight stations, possibly leading to a lower access rate of the gates inthe terminal. To improve the recognition accuracy, a container number recogni-tion system needs to identify the reference number at least twice. Finally, theresults are based on the integrated complementary information of the containersurfaces. Since containers are transferred around the world, the identificationnumber of the containers might be damaged or even disappear. This issue alsolimits the development of efficient operations of the container terminal.
3 Technical Aspects of RFID Systems
RFID belongs to Automatic Identification (Auto-ID) technologies. This familyof technologies includes the famous bar code system, optical character readersand some biometric technologies (like retinal scans). Auto-ID technologies haveproved to reduce time and working resources needed and to increase data accu-racy. Despite their practical value, the fact that a person is needed to manuallyscan items is itself a constraint. It is exactly this part where RFID revolutionizesAuto-ID technologies as mentioned in [17]. An RFID system consists of threeparts: a scanning antenna, a transceiver with a decoder to interpret the data,and a transponder, the RFID tag, which has been programmed with informa-tion. A typical RFID tag consists of a microchip attached to a radio antennamounted on a substrate. The chip can store as much as 2 kilobytes of data[17] and beyond. For example, information about a product or shipment-date ofmanufacture, destination and sell-by data can be stored in a tag. Tags can bepassive, active or semi-active. An active tag contains some types of power source

Application of RFID Technology at the Entrance Gate 213
Tag/TransponderComputer
Reader/Antenna
Fig. 3. Working principles of RFID
on the tag, whereas the passive tags rely on the radio signal sent by the readerfor power. Semi-active tags use a battery to run the microchip’s circuitry but notto communicate with the reader. The reader emits radio waves in ranges of any-where from one inch to 100 feet or more, depending upon its power output andradio frequency used. The data is interchanged with the monitoring computerfor processing after the reader decodes the data encoded in the tag’s integratedprocessing. The working process is shown in Figure 3.
Regarding fundamentals and applications of RFID, Finkenzeller [3] is of valueas an introductory reference. Next we review RFID literature with a specific focuson container terminals and logistics and provide a specific application scenario.
4 Application of RFID to Improve the ContainerTerminal Operation
The intelligent management of container terminals mainly consists of the passiveRFID tag with an UHF band between 860-960MHZ, an RFID reader, the com-munication system, a common data management system and the car software(onboard unit). The passive RFID tag can contain the container information, thecargo information and the information of the logistic chain. The passive RFIDtags are attached to the lintel of the container. The container gate house orentrance gate as well as all handling equipment components (e.g., reach stacker,straddle carrier, quay cranes, RMG) are all attached with RFID readers [24].When a container which is fixed with the passive RFID tags passes any han-dling or yard equipment, all the information of the container may be checked bythe RFID readers in this equipment. The information can be used in the modernmanagement of the container terminal.
There are quite a few more or less conceptual papers on the analysis of RFIDtechnology implementation in container terminals; see, e.g., [1,2,9,13,21,26]. Har-der and Voß [6] provide basis and applicable understanding of cost-benefit anal-ysis on RFID application to the shipping industry. RFID usage may envisageseveral benefits including better “information visibility” allowing for improvedtracking and tracing options etc. Another example is better container port se-curity. If sensors are installed inside containers to monitor changes in light, hu-midity or pressure, indication could be given that someone had interfered withit. A successful test on this issue for Yantian International Container Terminalsis mentioned in [22].
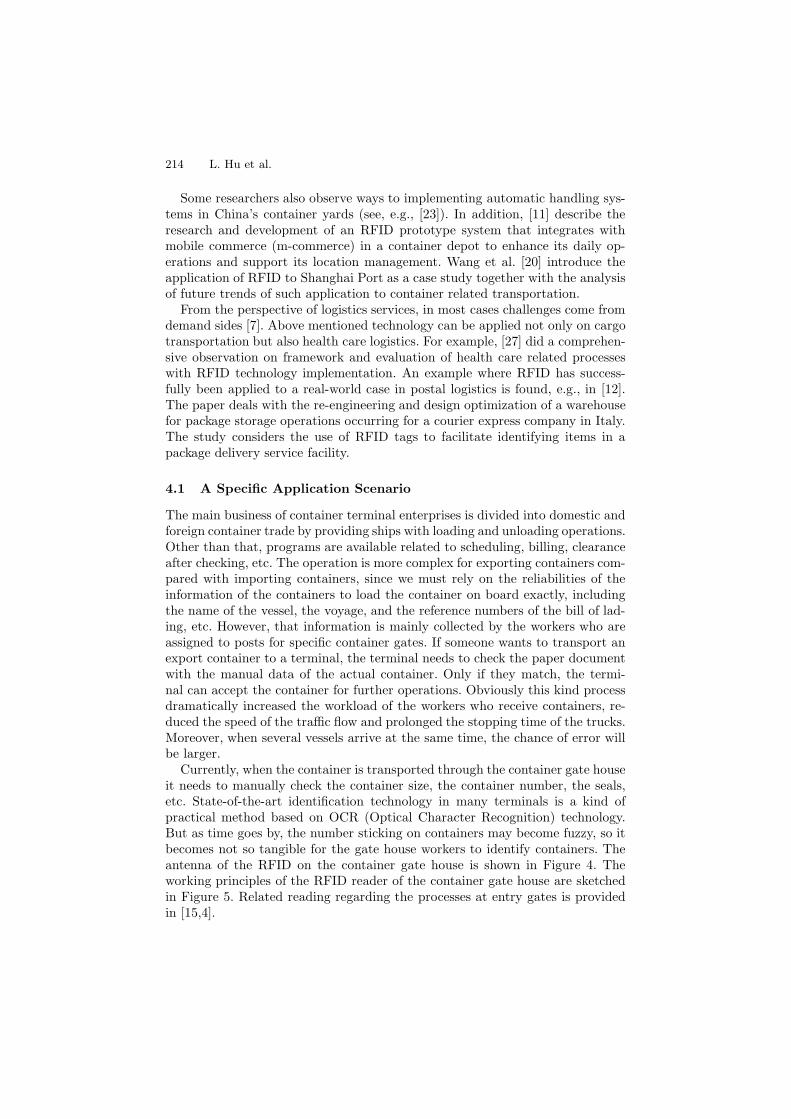
214 L. Hu et al.
Some researchers also observe ways to implementing automatic handling sys-tems in China’s container yards (see, e.g., [23]). In addition, [11] describe theresearch and development of an RFID prototype system that integrates withmobile commerce (m-commerce) in a container depot to enhance its daily op-erations and support its location management. Wang et al. [20] introduce theapplication of RFID to Shanghai Port as a case study together with the analysisof future trends of such application to container related transportation.
From the perspective of logistics services, in most cases challenges come fromdemand sides [7]. Above mentioned technology can be applied not only on cargotransportation but also health care logistics. For example, [27] did a comprehen-sive observation on framework and evaluation of health care related processeswith RFID technology implementation. An example where RFID has success-fully been applied to a real-world case in postal logistics is found, e.g., in [12].The paper deals with the re-engineering and design optimization of a warehousefor package storage operations occurring for a courier express company in Italy.The study considers the use of RFID tags to facilitate identifying items in apackage delivery service facility.
4.1 A Specific Application Scenario
The main business of container terminal enterprises is divided into domestic andforeign container trade by providing ships with loading and unloading operations.Other than that, programs are available related to scheduling, billing, clearanceafter checking, etc. The operation is more complex for exporting containers com-pared with importing containers, since we must rely on the reliabilities of theinformation of the containers to load the container on board exactly, includingthe name of the vessel, the voyage, and the reference numbers of the bill of lad-ing, etc. However, that information is mainly collected by the workers who areassigned to posts for specific container gates. If someone wants to transport anexport container to a terminal, the terminal needs to check the paper documentwith the manual data of the actual container. Only if they match, the termi-nal can accept the container for further operations. Obviously this kind processdramatically increased the workload of the workers who receive containers, re-duced the speed of the traffic flow and prolonged the stopping time of the trucks.Moreover, when several vessels arrive at the same time, the chance of error willbe larger.
Currently, when the container is transported through the container gate houseit needs to manually check the container size, the container number, the seals,etc. State-of-the-art identification technology in many terminals is a kind ofpractical method based on OCR (Optical Character Recognition) technology.But as time goes by, the number sticking on containers may become fuzzy, so itbecomes not so tangible for the gate house workers to identify containers. Theantenna of the RFID on the container gate house is shown in Figure 4. Theworking principles of the RFID reader of the container gate house are sketchedin Figure 5. Related reading regarding the processes at entry gates is providedin [15,4].

Application of RFID Technology at the Entrance Gate 215
Antenna
Fig. 4. Antenna located at the gate of a container terminal
RFID Tag
RFID Antenna
RFID Reader
Computer
Fig. 5. Working principles of RFID readers
When the container fixed with passive RFID tags goes through the entrancegate, the loadmeter senses there are containers passing. At the same time theloadmeter sends signals to the RFID reader, after that the RFID reader beginsto work. It reads the related information of the container recording by the pas-sive RFID tags through locating the RFID tags on the container, thus it canautomatically identify the container number. The Container Terminal Manage-ment System records the information automatically by the RFID reader. Afterthe information is checked by the information center of the container terminal,the container is allowed to leave the port, at the same time the informationcenter sends the time that the container took in the entrance gate and relatedinformation to the Common Data Management Platform. This process needsno human intervention. To compare the efficiency of the entrance gate before

216 L. Hu et al.
Table 1. Average time (in seconds) taken at the entrance gate
Type Brake Check Start Total
Without the use of RFID 4 60 6 70With the use of RFID 4 12 6 22
using the RFID system with the one after using the RFID system, we take theentrance gate of the Shanghai Waigaoqiao Terminal as example with the time asthe main index to determine whether the RFID system is efficient. Preliminaryinvestigation of the related gates shows the data provided in Table 1.
4.2 Truck Handling at the Terminal Entrance – Conceptual Aspects
New technology is creating opportunities for an entirely new wave of re-enginee-ring efforts. In [5], re-engineering as a role model was implemented in the backoffice, the factory, and the warehouse. Later on, it has been applied to the frontoffice and the revenue-producing side of the business: product development, sales,and marketing. In case a port operator is regarded as an enterprise and the portoperation process is viewed as workflow within enterprises, re-engineering wouldmost probably have to occur as long as either new demand is increasing or newinformation technology is about to be applied. From its inception, re-engineeringhas been a close partner of information technology. Technology enables the pro-cesses that are the essence of re-engineering to be redesigned.
The container gate house service system is a typical queuing system, the majorprocesses are trucks passing through the gate. The object in this system is acontainer truck; According to a large number of internal and external statisticaldata, most of the container gate house service processes can be considered as aM/Ek/S model [25]. The arrival process of trucks follows a Poisson distribution
Pn = P (n) =λn
n!e−λ , n = 1, 2, 3, ... (1)
with n being the number of daily arriving trucks, λ the daily average number ofarriving trucks, and P (n) denoting the probability of n trucks arriving in a day.After arrival, the passing time of the trucks follows a k-Erlang distribution
fk(t) =μk(μkt)k−1
(k − 1)!e−μkt , t > 0 (2)
with μ being the number of trucks served in a single gate every day.In the container gate house service system, service station number is the
number of gates owned by the port, we designate it by S. Set the strength factorof system loading according to the M/Ek/S queuing model:
P0 =
{s−1∑
n=0
1n!
(λ
μ)n +
1S!
11 − ρ
(λ
μ)S
}−1
(3)

Application of RFID Technology at the Entrance Gate 217
Pn = P (n) =
{1n! (
λμ)nP0, (n < S)
1S!Sn−s (λ
μ)nP0 (n ≥ S)(4)
where P0 is the probability of no trucks arriving in a day, namely the probabilitythat every gate of the port is idle.
The main performance indicators in a port services system include:
1. The average number of trucks waiting in the container gate house:
Lq =∞∑
n=S+1
(n − S)Pn =(S × ρ)S × ρ
S!(1 − ρ)2P0 (5)
2. The average number of arriving container trucks:
LS =∞∑
n=0
nPn = Lq + S × ρ (6)
3. The average residence time of trucks: WS = LS/λ
4. The average waiting time of the trucks: Wq = Lq/λ
In the following we consider Daxie Terminal, Ningbo (China), as an example.Table 2 provides details on a sample of 20 trucks between 2:30 and 3:30 PM, May11th 2011 to calculate related performance indicators. Each truck is transportingone container passing through the gate without RFID technology. Moreover, onMay 11th the total number of container trucks entering the port was 1904 TEU.Daxie in Ningbo has eight gates in total, among which five are entrance gatesand three are for exits, i.e., S = 5. We may denote by tw the waiting time foreach truck when it tends to enter into the terminal. tp is the processing time formanually processing the EIR documents as there is no RFID. ts = tw + tp.
Based on these numbers we may perform the following calculations. Basedon 1904 TEU we have λ = 79.33/h, ρ = 0.2314, P0 = 0.17. Moreover, Lq =0.0002, LS = 1.157, WS = 226.83s, and Wq = 0.04s.
From these calculations, we can see that the average waiting time Wq is nearly0, reflecting that the container gates are enough for the Daxie container ports.WS = 226.83s indicates that the average service time of one truck is less than fourminutes. On one hand, if we use RFID technology in the container gates, thenthe passing time tp will be decreased, thus the average waiting time can decrease.On the other hand, if the time of the trucks passing through the container gatehouse decreased, then the container terminal can decrease the number of thegates. For the present data we may conclude the phenomenon of queueing is notfrequent. But when building a new container terminal, if the port authoritiesconsider using RFID technology to design the container gate house, one mightbuild a smaller number of gates.

218 L. Hu et al.
Table 2. Time of container trucks passing through the gate
Container No. tw/second tp/second ts/second
YMLU4956169 90 40 130INKU6102043 89 152 241SPNU2879389 78 72 150YMLU5035019 124 46 170DFSH6277779 144 57 201CCLU9233314 87 67 154YMLU8171209 123 69 192HJCU4140364 131 71 202GLDU7464425 56 68 124CBHU8312882 88 63 151GCSU6008340 87 49 136BMOU4783317 75 110 185GLDU0879225 54 56 110KMTU7326329 94 68 162UACU3371086 102 258 360OOLU8858380 121 75 196TGHU9799940 197 87 284GLDU7213760 262 79 341HUCU1072820 184 92 276HJCU3205776 88 68 156
average passing time E(t) 113.7 82.35 196.05Variance D(t) 2602.43 2308.13 4955.84
5 Conclusions and Further Research
In this paper, we discussed the current status of container port operations aswell as the application of RFID in the container gate house and the containeryard. For the discussion of the application of RFID in the entrance gate, we canconclude that by using an RFID system we can decrease the passing time ofthe container trucks. More specifically, from the discussion of Section 4, we canconclude that if we use the RFID technology in the container gate house, then wecan improve the efficiency of the turnover of the container trucks, thus decreasethe waiting of the trucks and also decrease the parking area of the containertrucks. In this sense, we can expand the area of the storage yard.
Due to the limited real world data that has been obtained, the potentialre-engineering within the container yard has not been discussed in this paper.However, that would be one of research topics of our interest in the near future.Besides, in the application of RFID in the container yard we have not consideredother conveyance when transporting containers from the yard to the terminalapron. This could be another topic for further research. As real business caseson RFID in the shipping industry are still quite rare, related field studies wouldbe of great benefit. This might help to close the credibility gap regarding RFIDmentioned in [8].
Application of RFID Technology at the Entrance Gate 219
References
1. Chang, P.: Analysis of RFID technology implementation in container terminal. In:Proceedings of the 2008 International Conference on Business and Information,BAI 2008 (2008)
2. Choi, H.R., Park, N.K., Park, B.J., Yoo, D.H., Kwon, H.K., Shin, J.J.: An auto-mated gate system based on RFID technology. In: Proceedings of the 10th WSEASInternational Conference on Systems, ICS 2006, pp. 243–249. World Scientific andEngineering Academy and Society (WSEAS), USA (2006)
3. Finkenzeller, K.: RFID Handbook: Fundamentals and Applications in Contact-less Smart Cards, Radio Frequency Identification and Near-field Communication,3rd edn. Wiley, Munich (2010)
4. Geweke, S., Busse, F.: Opportunities to exploit capacity reserves of the hinterlandconnection to road transport. In: Bose, J.W. (ed.) Handbook of Terminal Planning,Berlin, pp. 305–322. Springer, Heidelberg (2011)
5. Hammer, M., Champy, J.A.: Reengineering the Corporation: A Manifesto for Busi-ness Revolution. Harper, New York (1993)
6. Harder, F.-C., Voß, S.: A simple RFID cost model for the container shipping indus-try. International Journal of Shipping and Transport Logistics (To appear 2011)
7. Kapoor, G., Zhou, W., Piramuthu, S.: Challenges associated with RFID tag imple-mentations in supply chains. European Journal of Information Systems 18, 526–533(2009)
8. Lee, H., Ozer, U.: Unlocking the value of RFID. Production and Operations Man-agement 16(1), 40–64 (2009)
9. Miragliotta, A., Perego, A., Tumino, A.: RFID technology in a container port: Anactivity-based model to assess costs and benefits. In: Proceedings of the LogisticsResearch Network (LRN) Annual Conference, Hull, UK, pp. 101–106 (2007)
10. Ngai, E.W.T.: RFID technology and applications in production and supply chainmanagement. International Journal of Production Research 48, 2481–2483 (2010)
11. Ngai, E.W.T., Cheng, T.C.E., Au, S., Lai, K.-H.: Mobile commerce integrated withRFID technology in a container depot. Decision Support Systems 43, 62–76 (2007)
12. Pacciarelli, D., D’Ariano, A., Scotto, M.: Applying RFID in warehouse opera-tions of an Italian courier express company. Netnomics 12 (2011); doi: 10.1007/s11066-011-9059-4
13. Park, D.-J., Choi, Y.-B., Nam, K.-C.: RFID-based RTLS for improvement of opera-tion system in container terminals. In: Asia-Pacific Conference on Communications,APCC 2006, pp. 1–5. IEEE, Los Alamitos (2006)
14. Stahlbock, R., Voß, S.: Operations research at container terminals: a literatureupdate. OR Spectrum 30, 1–52 (2008)
15. Steenken, D.: Fahrwegoptimierung am Containerterminal unter Echtzeitbedingun-gen. OR Spektrum 14, 161–168 (1992)
16. Steenken, D., Voß, S., Stahlbock, R.: Container terminal operations and operationsresearch – a classification and literature review. OR Spectrum 26, 3–49 (2004)
17. Tsilingiris, P.S., Psaraftis, H.N., Lyridis, D.V.: Radio frequency identification(RFID) technology in ocean container transport. In: Proceedings of the IAMEConference, Athens (2007)
18. Voss, S., Bose, J.: Innovationsentscheidungen bei logistischen Dienstleistern –Praktische Erfahrungen in der Seeverkehrswirtschaft. In: Dangelmaier, W., Felser,W. (eds.) Das reagible Unternehmen. HNI, Paderborn,, pp. 253–282 (2000)

220 L. Hu et al.
19. Wang, T.: Application of EDI and RFID technology to optimize the new containerexport process. Containerization, 7–8 (2008)
20. Wang, W.J., Yuan, Y., Wang, X., Archer, N.: RFID implementation issues inChina: Shanghai port case study. Journal of Internet Commerce 5(4), 89–103 (2006)
21. Will, T.: RFID in Maritime Container Logistics - A Delphi Study on ParticipantSpecific Benefits. tredition, Hamburg (2010)
22. Wong, C.W.Y., Lai, K.-H., Teo, T.S.H.: Institutional pressures and mindful ITmanagement: The case of a container terminal in China. Information & Manage-ment 16(46), 434–441 (2009)
23. Xie, Y., Bao, Q., Yao, Z., Ge, Z.: Research on the automatic handling system inWaigaoqiao automatic container yards. Machine Design and Research 23, 106–108(2007)
24. Xu, S., Deng, Y., Cao, W.: RFID technology in the container terminal demonstra-tion. Research on Waterborne Transportation, 10–12 (2009)
25. Zhang, M., Ji, S., Zhou, K.: Modelling and application on the extension scale ofport based on queuing theory. In: Ninth International Symposium on DistributedComputing and Applications to Business, Engineering and Science, pp. 663–666.IEEE, Los Alamitos (2010)
26. Zhang, Z.: The application of the radio frequency identification technology in thecontainer terminal. Science & Technology of Ports, 28–30 (September 2007)
27. Zhou, W., Piramuthu, S.: Framework, strategy and evaluation of health care pro-cesses with RFID. Decision Support Systems 50(1), 222–233 (2010)
1
General and Modified Slot Chartering Agreements—Performance
Comparison Based on Different Mechanisms
Xiaoning Shi
Institute of Information Systems
University of Hamburg
Von-Melle-Park 5, Hamburg, Germany
Department of International Shipping and Logistics
Shanghai Jiao Tong University
Mulan Building, NAOCE, Dongchuan Road 800, Shanghai, China
Stefan Voss
Institute of Information Systems
University of Hamburg
Von-Melle-Park 5, Hamburg, Germany
Abstract:
Consignment is a form of business arrangement where a supplier retains ownership of the
goods stocked and pays a retailer based on the actual amount that the retailer sells. Similar
ideas can be applied to the liner shipping business. A slot-chartering agreement can be
designed in such a way that the slot-owner retains ownership of the used slot stocked and
collects payment from the slot-charterer based on the actual units sold. The consignment
concerns questions on how decision making regarding the inventory stocking level (i.e., who
book idle slots) is performed and who is going to take those decisions. Such form of
agreement has become popular in the liner shipping business, especially during the Post-Crisis
Era, when it became apparent that nobody can forecast market dynamics exactly. With
consignment, how or who to make decisions on the selling price of the used slot as well as the
payment transfer between the slot-charterer and the slot-owner can have significant impact on

2
the overall performance as well as individual liner carrier’s commercial performance. In this
paper, we study a specific consignment arrangement, called slot-chartering agreement, based
on what the leading slot-owner has recently launched for managing its business relationship
with many of its slot- charterers. Under the slot-chartering agreement, a slot-owner charges a
slot-charterer a pre-specified percentage of the ‘list price’ of loaded slots sold to the market by
the slot-charterer, where the slot-owner is allowed to choose the list price for its loaded slot
while the slot-charterer in return decides the final retail/selling price and order quantity for the
used slot.
According to the slot-chartering agreement, there are two kinds of contracts to be analyzed in
this paper, namely, a general slot-chartering contract and a modified slot-chartering contract.
We build a game-theoretic model to demonstrate that managed under such a general slot-
chartering contract, the overall performance incurs a minimum loss in efficiency or
profitability, compared with a centralized overall, and depending on cost parameters and the
nature of demand uncertainty, the actual loss can be significantly higher than the minimum
value. Second, we show that the slot-chartering agreement leads to a 50-50 split of the
realized overall profit between the slot-charterer and the slot-owner, and in equilibrium the
combined choice of the percentage charged by the slot-charterer and the list price itself by the
slot-owner is largely a non-influential factor both to the overall performance and to individual
firm’s performance, i.e., the 50-50 split of overall profit. We then propose a simple
modification to the above mentioned general slot-chartering agreement, where the only
change is for the slot-charterer to delegate the decision on stocking quantity to the slot-owner.
We show that such a modified slot-chartering agreement guarantees a loss in efficiency of just
or no more that a minimum value for the overall, while keeping the 50-50 split of overall
profit unchanged. As a consequence, the modification program on the slot-chartering business,
if implemented, has the potential to create a guaranteed win-win environment for the slot-
charterer and its slot-owners in the liner shipping industry.
Keywords: Slot, Slot agreement, Liner Shipping, Mechanism Design
Section 1 Introduction
Service retailing in liner shipping business has created an unprecedented market place for the
slot-owner (supplier of slots) and slot-charterer (buyer of slots and competitor of the slot-
owner simultaneously) to cooperate on distributing as well as offering their slots as service to
final consumers, i.e., shippers in the liner shipping market. These business structures have
3
entailed the continued creation of innovative forms of contracting arrangement between liner
shipping business partners, i.e., slot-owners and slot-charterers, for managing their
commercial relationship. Understanding the effectiveness or efficiency of these contracting
arrangements has in turn become a major interest of practitioners as well as academic
researchers.
Regarding contemporary liner shipping service, the existing pricing scheme can be
categorized into three different types, i.e., capacity-based pricing, time-based pricing, and
service-based pricing.
1) Capacity-based pricing means the price of using a slot depends on the capacity
constraints given by the liner carriers. An apparent example is the soaring freight rate
retained to upcoming peak season, i.e., when supply falls short of demands. Despite the
carriers being competitors all the time, they might build up a temporary pricing
partnership so that each of these carriers can obtain a freight rate increment
simultaneously.
2) Time-based pricing means the price of using a slot depends on the Total Travel Time
(TTT) of this specific voyage. When a service ordered by a shipper cannot be performed
by one single voyage, one or more transshipments occur. Generally speaking, the more
transshipments are involved, the longer TTT can be expected. However, the liner carrier
might offer some priority to certain carriages so that even if transshipment is involved,
these carriages can still enjoy quite efficient connections, which results in shorter TTT.
Obviously, such time-saving service as fast-lane or quick-connection, no matter how to
name it, costs more to the shipper.
3) Service-based pricing means the price of using a slot depends on the service quality
offered by the carrier. For instance, in case a reefer container is to be carried, the price
of providing carriage of such cargo is expected to be relatively high.
Above mentioned pricing scheme is set between the seller of slots and the buyer of the slots.
The seller of slots can be owner of a container ship and/or operator of container ships. The
buyer of the slots, in most cases, can be a shipper and/or consignee. However, taking into
account the cooperation among liners, the buyer of slots can then also be a liner who rents
slots, i.e., buys service from her business partner based on designed slot-chartering
agreements.
Among these three pricing schemes, the capacity- based pricing more likely happens during
highly congested season or geographical regions. One of the objectives of adopting slot
agreement is to have a best possible interplay between covering much of a service network as

4
possible and deploying the smallest capacity (or handling volume) as possible, and obtain
maximal expected profits. Therefore, the pricing scheme also plays a vital role as one aspect
of general principles of slot agreements, which build up the main research scope of this paper.
For years the slot-charterer has been using a simple consignment contract with revenue
sharing to manage its relationship with its numerous slot-owners for selling slots at the
marketplace and nowadays even by means of online auctions through the internet. Such
online auction as a newly designed business can be seen, e.g., through Maersk Lines’
webpage (www.maerskline.com) since the beginning of 2009. Ignoring many of the details of
minor importance, the contract can be described as follows: A seller of slots can choose the
retail price and listing quantity for selling his loaded slot at the slot-charterer online
marketplace, and the slot-owner collects a fee from the slot-charterer based on the slot-
chartering agreement only when a slot related service is sold. The slot-owner calculates the
fee to charge based on a predetermined percentage of the list price of a loaded slot.
Very recently, however, the slot-charterer started to offer a different contract, called the
modified slot-chartering agreement, the essential part of which states as follows: There is an
annual fee for being a member of a slot-chartering agreement. The fee includes unlimited title
enrollment, access to the slot-owner services association, and access to the slot-owner
protocol to manage the account. The standard term of slot-chartering agreement slot-owners is
55% and the slot-charterer keeps 45% of the list price. That means that slot-charterer is
entitled to 55% of the list price for each slot that sells to shippers- final customers in the liner
shipping service market.
The slot-owner, receives 55% of the list price. The slot-owner sets the list price, also known
as Suggested Retail Price of the liner service, of loaded slots, and all payments made to slot-
owners are calculated based on the list price. If the slot-charterer decides to further reduce the
retail price to the final customer at a lower price than the list price, the shipper’s discount is
derived from the slot-charterer’s percentage.
Furthermore, under the modified slot-chartering program, it is the slot-charterer who makes
the decision about the amount of slots that are to be chartered. The slot-charterer continuously
adjusts the amount of slots he orders from slot-owners based on the recent sales performance
of slot-charterer’s business, with the goal of keeping a few weeks of estimated demand in
stock by holding even some spare slots. Provided as one of functions of the managerial
information system of the slot-charterer, he himself will be notified on how many chartered
slots were actually sold to his final customer, i.e., making revenue.
The purpose of this research is to study the decisions and performance of slot related business

5
under the above mentioned slot-chartering agreements.
1) How do the slot-charterer and the slot-owner each make their respective decisions in
equilibrium under such contracts?
2) How does the non-cooperative behavior perform, compared with a cooperative behavior?
How does each individual liner company perform?
3) Can we propose alternative contracts to improve the collective benefit as well as
individual benefit?
4) Who, including slot-charterer and slot-owner will or will not benefit when switching
from its previous revenue-sharing contract to a newly designed slot-chartering
agreement?
Towards gaining managerial insights on these issues, we consider building a slot related
business consisting of one slot-owner and one slot-charterer. The slot-owner incurs a constant
unit cost to offer a slot with unlimited shipping capacity, and the slot-charterer incurs a
constant unit cost for chartering and later selling the slot to the liner shipping market. Market
demand for the liner shipping service during a selling season is uncertain and depends on the
freight rate offered.
Prior to the selling season, the slot-owner announces a revenue share, as the percentage of the
list price for the slot (e.g., 55% in slot-owner’s), that he wants to charge the slot-charterer for
each slot sold. In response to this revenue share, the slot-owner chooses the list price for
chartering out a slot. Based on this list price and the predetermined revenue share, the slot-
charterer then decides the final freight rate for selling the slot to the market and a
corresponding slot-chartering order quantity. This final freight rate chosen by the slot-
charterer is the actual price that the shipper will pay for using the slots, and it does not have to
be equal to the list price set up by the slot-owner. The calculation of the slot-charterer’s fee
payable to the slot-owner on each unit sold, however, is always based on the list price.
We assume that demand information, about the service price-sensitivity and its nature of
uncertainty, is common knowledge to both parties. All decisions, i.e., the revenue share, the
list price, the final freight rate and the slot order quantity, have to be made before the start of
each selling season (i.e., every year or every half year). In addition, for simplicity, we assume
that there is no salvage value or disposal cost for any unsold slot at the end of voyages, and
there is no shortage penalty beyond the loss of profit margin for any unmet demand.
We model the above decision-making procedures as a 3-stage Stackelberg (leader-follower)
game. At the first stage, the slot-charterer, acting as the Stackelberg-leader, offers the Slot-
owner a take-it-or-leave-it contract, specifying the percentage allocation of the revenue
6
between these two parties. At the second stage, the slot-owner, acting as the follower, chooses
the list price, which is actually the unit cost of this specific slot-charterer of using the slot. At
the third stage, the slot-charterer determines the freight rate per unit as well as the slot-
chartering order quantity.
With some weak conditions on probability distribution of the demand function, this game has
a unique Nash equilibrium and the following sections characterize explicitly its equilibrium
solution. Equilibrium decisions determine performance of agreement as well as individual
liner company’s performance as represented by the split of the collective profit between the
slot-charterer and the slot-owner.
Second, the research shows that the collective profit is always evenly (50-50%) shared
between the slot-charterer and the slot-owner. The model analyses and reveals that in
equilibrium the combined choice of the percentage charged by the slot-charterer and the list
price chosen by the slot-owner is largely a non-influential factor both to the performance of
collective profit and that of an individual liner company. That is, the slot-charterer will simply
compute his list price in such a way that his unit net revenue on each sold slot stays as a
constant.
We then propose a simple modification to the slot-chartering agreement, where the only
change is for the slot-charterer to relinquish his decision on stocking quantity to the slot-
owner. That is, at the second stage of the game, the slot-owner now decides the list price
together with a quantity of idle slots, i.e., based on the stocking factor, while at the third stage,
the slot-charterer now chooses only the final freight rate per unit. We derive the Nash
equilibrium for this model and prove its uniqueness. We show that such a modified agreement
guarantees a net improvement over the previous agreement, leading to a loss in collective
revenue. The share of collective revenue between the slot-charterer and the slot-owner,
however, stays unchanged. As a consequence, the modified agreement creates a guaranteed
win-win environment for both parties.
The subsequent parts of this paper are divided as follows. Section 2 provides a brief review of
related literature. Section 3 details the model assumptions and derives decisions based on
cooperative behavior. Section 4 provides the analysis for the non-cooperative behavior under
two different kinds of mechanisms regarding slot-chartering agreements, respectively. Section
5 concludes the research and discusses future research directions.
Section 2 Literature Review
This research contributes to the broad literature on joint production-pricing or service-pricing
7
decision problems under market uncertainty. In the classic newsvendor setting of pricing
scheme for centralized decision-making, Whitin (1955), Mills (1959, 1962) and Karlin and
Carr (1962) are the earliest researchers who formulate and solve such problems. Petruzzi and
Dada (1999) provide a review and extensions to problems under the single-period newsvendor
setting, while Federgruen and Heching (1999) and Chen and Simchi-Levi (2004 a,b) study
production-pricing problems under multi-period settings. Yano and Gilbert (2002) provide a
comprehensive review that covers a much broader range of production-pricing decision
problems.
Extending the newsvendor framework to decentralized supply chains, Emmons and Gilber
(1998), Granot and Yin (2005), and Song et al. (2006) consider a setting where a slot-owner
wholesales a product to a slot-charterer who makes pricing-procurement decisions. These
papers explore how the slot-owner of a product or service can improve the overall
performance by using an inventory-return policy for items overstocked by the assembler.
Cachon and Lariviere (2005) explore how a slot-owner can use a combination of wholesale-
price and revenue-sharing contracts to achieve cooperative behaviors of involved parties.
Granot and Yin (2007a,b) study the effect of postponement of determining retail prices or
order quantity decisions on overall performance. Other papers dealing with joint production-
pricing decisions of decentralized supply chains include Federgruen and Heching (1999), and
Ray et al. (2004), etc. The papers that are most relevant to our research here are by Wang et al.
(2004) as well as Ru and Wang (2010), who analyze the consignment contract with revenue
sharing methods.
With respect to the broad literature on contract design, this research seeks to characterize the
equilibrium, and to measure the performance of the slot-chartering agreement when operating
under a given set of designed contracts. This is in contrast to many other literatures whose
goal is to design a contract form of achieving cooperative behaviors from all involved parties,
in the sense that when the cooperative behavior is performed under such a slot-chartering
agreement, it achieves the first-best agreement performance. For readers interested in papers
with such a focus, Cachon (2003) provides a most comprehensive review with extensions.
Section 3 Decision Making Procedures and Performance under the General Slots-
Chartering Agreement
In this section the equilibrium decisions are analyzed in subsections, respectively. Later on,
the comparison between the performances of a decentralized decision making procedure with
that of the centralized decision making procedure is demonstrated.

8
We will characterize the solutions of non-cooperative behaviors under the two kinds of
agreements in Sections 3 and 4, respectively. In order to provide a brief framework on these
two kinds of agreements, i.e., the General Slot-Chartering Agreement and the Modified Slot-
Chartering Agreement, players and their decisions are listed in Table 1.
Table 1 General and Modified Slot-Chartering Agreements
Player General Slot-Chartering Agreement Modified Slot-Chartering Agreement
Slot-owner • provide list price • provide list price
• quantity of slots to sell to the slot-charterer
Slot-charterer • quantity of slots to buy
• selling price of the slots to market
• stocking factor
• selling price of the slots to the market
Section 3.1 Model Assumption based on Collective Decision
Consider a liner shipping service where a slot-owner provides slots and sells slots through a
slot-charterer to the market. The slot-owner, i.e., the carrier, produces the service at a constant
unit cost of ��, and the slot-charterer incurs a unit cost of �� for handling and selling the
service to the market.
Define � ≡ �� + �� as the total unit cost, and � ≡ �� �⁄ as the share of the collective cost
that is incurred by the Slot-charterer (or by the slot-agreement based business).
Market demand for the service, denoted by �, is price-dependent as well as uncertain. We use
the following multiplicative function form to model demand:
�() = () ∙ � (1)
is the freight rate offered to the final customer, i.e., shipper, () is a deterministic and
decreasing function of , and � is a scaling factor, representing the randomness of demand.
Let � ∈ ��, �� Assume () takes the following form: () = ����� with �, � > 0 (2)
Before the implementation of the slot-chartering agreement, the slot-owner provides � units
of slots and delivers them to the slot-charterer who consequently tries to sell them to the liner
shipping market at selling price (i.e., a freight rate) . The Slot-charterer and the slot-owner
operate according to a slot-chartering agreement that specifies who makes which decisions
and how payments are transferred between the parties. We will consider and compare two
different contractual arrangements, to be labeled as the General Slot-Chartering Agreement
and the Modified Slot-Chartering Agreement, respectively.
When operating the slot-chartering business under the General Slot-Chartering Agreement,
the slot-charterer and the slot-owner negotiate sequentially in three stages, which can be

9
shown as follows.
Negotiation Stage 1: the slot-charterer sets up a payment schedule which states that for each
unit of the product he sells to the market, he pays (1 − !) percent of a list price " to the slot-
owner.
Negotiation Stage 2: the slot-owner chooses the list price " to determine the final payment
he will get back from the slot-charterer for each slot sold.
Negotiation Stage 3: the slot-charterer decides the quantity � for the Slot-owner to deliver
and the final freight rate of selling the slot to the liner shipping market.
Then, in order to derive solution to such agreement, a backward-induction procedure is
applied for analyzing these stages.
For the rest of this section we derive the optimal solution for a cooperative behavior, which
will serve as a benchmark for comparing the performance of the Slot-Chartering Agreements.
In the case of a slot-chartering business based on cooperative behaviors from both parties, the
slot-chartering agreement between the slot-seller (i.e., slot-owner) and the slot-buyer (i.e.,
slot-charterer), the decision is to simultaneously choose the selling price and the quantity �
with the objective to maximize the expected collective revenue which can be written as:
∏ (, �)$ = %&'() (�, �)+ − ,� = %&'() ( ()�, �)+ − ,� (3)
Following Petruzzi and Dada (1999), we define - ≡ � ()⁄ and name it the ‘stocking factor’
of unused idle slots, which to some extent reflect service level of the slot-owner. Then, due to
the one-to-one correspondence between (, -) and (, �), for maximizing ∏ (, �)$ , choosing
(, �) is equivalent to choosing (, -). Furthermore, based on the demand function form (1)
that for given (, �), the stocking factor is computed as:
.�&�() ≤ �+ = .�&� ≤ � () = -⁄ + (4)
For given distribution of �, each - value corresponds to a unique stocking factor, and thus
choosing a value for - is equivalent to setting up a service level for the slot-owner.
Substituting � = ()- into the formula, the objective function can be rephrased as:
∏ (, -)$ = ()&%�'()(�, -)� − ,-+ = () 0 1- − 2 (- − 3)4(3)56 738 − ,-9 , (5)
where ⋀ - ≡ 2 (- − 3)4(3)56 73. (6)
To find the optimal solution, denoted as ($∗, -$∗), which maximizes <$(, -), we first find the
optimal price $∗(-) for any given -, and then maximize <$($∗(-) , -) with respect to - to find
the optimal -$∗.
Theorem 1: For any given - ∈ ��, ��, the unique optimal freight rate $∗(-) is given by

10
$∗(-) = $==�2 (=�>)?(>)@
A B> + C� (7)
And, if the probability distribution function 4(∙) satisfies the property of increasing failure
rate (IFR), the optimal -$∗ that maximizes <$($∗(-) , -) is uniquely determined by
$==�2 (=�>)?(>)@
A B> + C� = $
C�D(=E∗) (8)
Then, ∏∗$ = ����& EFE∗FE∗G2 (FGH)I(H)@
A JHKL
M+ =E∗�2 (=�>)?(>)@A B>
� = ����& EFE∗FE∗G⋀(FE∗)KL
M+ =E∗�⋀(=E∗)� (9)
Section 3.2 Equilibrium Decisions
At Stage 3 of the decision procedure, for a given revenue share !, allocated by the slot-
charterer at the Stage 1, and a given list price ", chosen by the slot-owner at Stage 2, the slot-
charterer’s problem is to simultaneously choose the selling price and the order quantity � to
maximize her own expected profit which can be calculated as
∏ (, �|!O, ")B,� = � − (1 − !)"�%&min (�, �)+ − ,��. (10)
As before, stocking factor - ≡ ST(�). Then, for the slot-charterer, choosing (, �) is equivalent
to choosing (, -). Hence, the above profit function can be rewritten as
∏ (, -|!O, ")B,� = ()&� − (1 − !)"��- − ⋀(-)� − ,�-+, (11)
Where () and - are defined as given in Table 2, respectively. Other Notations are also
summarized in Table 2.
Table 2 Notations
Expression Meaning Memo
� Slot-charterer’s share of the collective cost � ≡ ,�,
�
- Stocking factor of idle slot as inventory - ≡ U ()
Selling price of slot to market
() a deterministic and decreasing function of () = �����, with �, � > 0
" list price that slot-owner provides
� a scaling factor � ∈ ��, �� ! Revenue share
V Profit function
WXY Increasing failure rate
�� a constant unit cost
� Market demand for the service
� quantity of slots that the slot-owner provides
Although selling price to market is decided by the slot-charterer, it should be close to or

11
almost the same as the slot-owner’s offer to the same market in case the slot-owner would like
to sell directly these slots to the market (shippers) by him. It should be noted that in the liner
shipping market, a slot-owner and a slot-charterer can be liner shipping carriers at the same
time, which means that generally speaking, they simultaneously are competitors besides the
fact that slots are chartered from one player to the other on some specific voyage.
Section 3.2 Decision Making Procedures under General Slot-Chartering Agreement
Backward-induction is applied in this section so that stages of decision making procedures are
analyzed. The decision making procedure 1 is applied during Stage 3. In other words, the
decision making procedures follow reversed sequence of the negotiation stages.
Decision making procedures are listed as follows:
Decision making procedure 1: Slot-charterer decides the selling price
Decision making procedure 2: Slot-owner decides list price
Decision making procedure 3: Slot-charterer Decides Revenue Share
3.2.1 Slot-charterer decides the selling price
In order to find the optimal solution, denoted by (B∗ , -B∗ ), for maximizing the output of the
profit function ∏ (, -|!O, ")B,� , the optimal selling price B∗ (-)for any given - needs to be
derived. And then figure out the optimal -B∗ that maximizes ∏ (, -|!O, ")B,� with respect to -.
The results are summarized as follows:
Theorem 2: For any given - ∈ ��, ��, list price " > 0, and revenue share ! ∈ (0,1), the
unique optimal selling price B∗ (-) is given by
B∗ (-) = (1 − !)" + $Z==�⋀(=) + C
� (12)
And, if the demand distribution satisfies the property of IFR, the optimal -B∗ that maximizes
∏ (B∗ (-), -|!O, ")B,� is uniquely determined by
$Z=J∗=J∗ �⋀[=J∗ \ + C
� = $ZC�D]=J∗ ^ (13)
The WXY, i.e., h(3) ≡ ?(>)C�D(>) being increasing in 3 , as required by Theorom 1, is a relatively
weak condition satisfied by most commonly applied probability distributions like Normal,
Uniform, and Exponential distribution, etc. Equation (13) implies that under this condition
about the demand distribution, the optimal stocking factor -B∗ is in fact independent of the list
price " and revenue share !; rather it is uniquely determined by the demand distribution and
other system parameters.
Furthermore, equations (12) and (13) indicate that the slot-charterer’s optimal selling price B∗

12
consists of two main parts, i.e., the amount paid to the slot-owner, namely, (1 − !)" , and for
each unit sold plus a constant revenue margin for herself, namely, $Z=
=�⋀(=) + C�.
Note that the slot-owner provides the slot-charterer a list price according to -. Later on in the
following analysis, we will further discuss whether - and the list price really affects the
expected revenue.
3.2.2 Slot-owner Decides List Price
At this stage of decision making procedure, namely stage 2, knowing that the slot-charterer
choose according to (12) and (13) at stage 3, the slot-owner aims to set the list price " to
maximize his own expected profit, for any given revenue ! proposed by the slot-charterer at
Stage 1. The slot-owner’s profit function, denoted by∏ ("|!O)B,� , is expressed as
∏ ("|!O) = (1 − !)"%&'()(�, �B)+ − ,��BB,� (14)
After integrating � = (B)� and �B = (B)-B into (14), the following equation can be
obtained:
∏ ("|!O) = (B)&(1 − !)"�-B − ⋀(-B)� − ,(1 − �)-B+B,� (15)
Since (B) = a����J and (B∗ , -B∗ ) are determined in (12) and (13) during Stage 3, (15) can
further be rephrased as
∏ ("|!O) = ����a(C�b)�cK EdFJ∗FJ∗ G⋀(FJ∗ )KL
Me&(1 − !)"�-B∗ − ⋀(-B∗ )� − ,(1 − �)-B∗ +B,� (16)
Theorem 3: For any given revenue share ! ∈ (0,1), the slot-owner’s unique optimal list price
"∗(!) is given by
"∗(!) = C(C�b) a$=J∗ (C�Z)
=J∗ �⋀(=J∗ ) + C�e (17)
From (17) we can see that the optimal list price "∗ is increasing in slot-charterer’s revenue
share !. Since the optimal -B∗ does not depend on the revenue share !, (17) further implies that
the amount earned by the slot-owner on each unit sold, namely, (1 − !)"∗ , is a constant. For
instance, if the slot-charterer raises her share ! of the revenue, the slot-owner would
accordingly increase the optimal list price "∗ to ensure the amount that he gets from each sold
unit is not affected, which is very realistic in liner shipping business. This is as expected,
since from the slot-owner’s point of view, given that all money transfers are based on the units
sold, what matters to himself is how much he earns on each unit sold. This also indicates that
the slot-charterer does not create any real bargain power by moving first, as a leader of this
game, to set up the revenue share scheme, as what can be seen based on Stage 1 of this
Section of the analyses. Incorporating (17) into (12), we then have

13
B∗ (-B∗ ) = $=J∗=J∗ �⋀(=J∗ ) + f
� (18)
Therefore, the slot-charterer’s bargain power might superficially been reflected as revenue
share. However, slot-charterer’s optimal selling price does not really depend on that revenue
share allocation !. This is a vital finding of this research as food for thought for the slot-
charterer, which is beyond the slot-charterer’s first instinct over the slot-agreement based
business.
3.2.3 Slot-charterer Decides Revenue Share
At Stage 1, the slot-charterer knows not only her own choice on (B∗ , -B∗ ) according to (12)
and (13) at Stage 3, but also the slot-owner’s best response at Stage 2, the slot-charterer is
going to choose revenue share !, to maximize her own expected profit.
However, as what is going be shown next, in equilibrium the slot-charterer’s profit does not
depend on her choice of !. Consequently, the slot-charterer can choose any ! ∈ (0,1) and
achieve the same profit.
Now by substituting (17) for " and (18) for B into (11), we can derive the slot-charterer’s
profit as
∏ = ����a EFJ∗FJ∗ G⋀(FJ∗ )Kg
MeB,�
=J∗ �⋀(=J∗ )� (19)
Where -B∗ is determined through (13) in which ! does not appear as a parameter. Consequently,
the slot-charterer’s final profit indeed does not depend on her choice of !.
Similarly, after substituting (17) for " and (18) for B into (15), we obtain the slot-owner’s
profit as shown below, which does not depend on the slot-charterer’s choice of ! either.
∏ = ����a EFJ∗FJ∗ G⋀(FJ∗ )Kg
MeB,h
=J∗ �⋀(=J∗ )� (20)
It is interesting to observe from (19) and (20) that in equilibrium the slot-charterer and the
slot-owner always earn equal profit. In other words, the slot-charterer and the slot-owner each
obtain 50% of the collective profit which is given as
∏ = ∏B,� + ∏B,h = 2����a EFJ∗FJ∗ G⋀(FJ∗ )Kg
MeB
=J∗ �⋀(=J∗ )� (21)
Briefly speaking, for the decentralized decision making process under the General Slot-
Chartering Agreement, the slot-charterer can choose any revenue share! ∈ (0,1); the slot-
owner then decides his corresponding list price according to (17). In equilibrium the slot-
charterer chooses the selling price and stocking factor as given by (18) and (13), respectively,

14
which leads to the total channel profit of (21). This total collective profit is shared equally
between the slot-charterer and the slot-owner.
Section 3.3 Performance under General Slot-Chartering Agreement
The expected profit of the channel depends on nothing but the choice on the final selling price
and the production quantity �, or equivalently, the selling price and the stocking factor -.
We know from the centralized collective profit sharing problem, the pair of selling price and
stocking factor ($∗, -$∗) that maximizes the collective profit is determined through (7) and (8).
While if follows the decentralized decision making process, (B∗ , -B∗ ) is determined through
(18) and (13). In general, the decentralized decision making process reaches a different output
from that of centralized decision making process, and hence a lower collective profit. We are
interested in measuring the difference between outputs derived from the decentralized
decision making process and the centralized decision making process. In the following, we
show that these measures of difference are monotone functions of a key system parameter,
namely, the slot-charterer’s share of channel cost � ≡ $j$ . In order to accomplish that goal, we
need the following Lemma about the property of any general probability distribution function
X(. ):
Lemma 1. Let l(-) ≡ CC�D(=) − =
=�⋀(=) with ⋀(-) ≡ 2 (- − 3)4(3)7356 . If the failure rate
function ℎ(3) ≡ ?(>)C�D(>) is increasing in 3, then l(-) is increasing in -.
With Lemma 1, we can prove the following set of properties when comparing the
decentralized decisions with the centralized decisions:
Proposition 1. -$∗ − -B∗ (�) is increasing in �, and -$∗ − -B∗ (�) = 0 when � = 1.
Proposition 2. $∗ − B∗ (�) is increasing in �, and $∗ − B∗ (�) = − C� when � = 1.
Propositions 1 and 2 show that as the slot-charterer incurs a bigger share of the collective cost,
the production quantity and selling price reached in the decentralized channel get closer to,
but never equal to, the collective quantity and selling price.
The explanation to this phenomenon is that, under the most extreme situation, the cost of the
slot-charterer would get closer to the cost of the slot-owner. Eventually, these two costs turn to
be equal to each other. Therefore, the performances of two types of decision making processes,
i.e., collective quantity and selling price deducted by centralized and decentralized decision
making process, get closer to each other, respectively.
This discussion based on aforementioned propositions indicates that as the slot-charterer
incurs more of the collective cost, the performance based on the decision making process gets
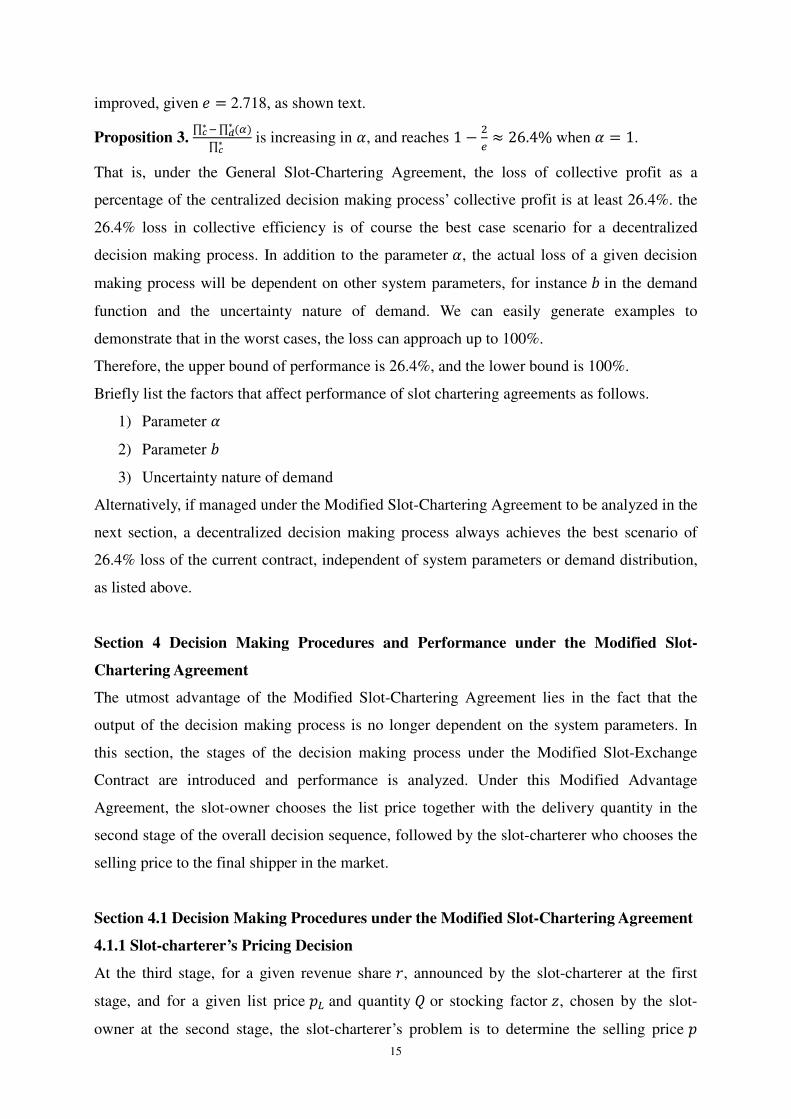
15
improved, given � = 2.718, as shown text.
Proposition 3. ∏ � ∏ (Z)∗J∗E
∏∗E is increasing in �, and reaches 1 − f
n ≈ 26.4% when � = 1.
That is, under the General Slot-Chartering Agreement, the loss of collective profit as a
percentage of the centralized decision making process’ collective profit is at least 26.4%. the
26.4% loss in collective efficiency is of course the best case scenario for a decentralized
decision making process. In addition to the parameter �, the actual loss of a given decision
making process will be dependent on other system parameters, for instance � in the demand
function and the uncertainty nature of demand. We can easily generate examples to
demonstrate that in the worst cases, the loss can approach up to 100%.
Therefore, the upper bound of performance is 26.4%, and the lower bound is 100%.
Briefly list the factors that affect performance of slot chartering agreements as follows.
1) Parameter �
2) Parameter �
3) Uncertainty nature of demand
Alternatively, if managed under the Modified Slot-Chartering Agreement to be analyzed in the
next section, a decentralized decision making process always achieves the best scenario of
26.4% loss of the current contract, independent of system parameters or demand distribution,
as listed above.
Section 4 Decision Making Procedures and Performance under the Modified Slot-
Chartering Agreement
The utmost advantage of the Modified Slot-Chartering Agreement lies in the fact that the
output of the decision making process is no longer dependent on the system parameters. In
this section, the stages of the decision making process under the Modified Slot-Exchange
Contract are introduced and performance is analyzed. Under this Modified Advantage
Agreement, the slot-owner chooses the list price together with the delivery quantity in the
second stage of the overall decision sequence, followed by the slot-charterer who chooses the
selling price to the final shipper in the market.
Section 4.1 Decision Making Procedures under the Modified Slot-Chartering Agreement
4.1.1 Slot-charterer’s Pricing Decision
At the third stage, for a given revenue share !, announced by the slot-charterer at the first
stage, and for a given list price " and quantity � or stocking factor -, chosen by the slot-
owner at the second stage, the slot-charterer’s problem is to determine the selling price

16
appropriately so that her own expected profit is maximized. Defining the stocking factor of
inventory as ≡ sT(�) , the slot-charterer’s expected profit can then be written as
∏ (|-, " , !)B,� = ()&� − (1 − !)."��- − ⋀(-)� − ,�-+ (22)
Where () and ⋀(-) are defined in (2) and (5), respectively.
Theorem 4. For any given - ∈ ��, ��, list price " > 0 and revenue share ! ∈ (0,1), the slot-
charterer’s unique optimal selling price B∗ (-, " , !) is given by
B∗ (-, " , !) = (1 − !)." + $Z==�⋀(=) + C
� (23)
Same as under the General Slot-Chartering Agreement, (23) indicates that slot-charterer’s
optimal selling price B∗ consists of two parts: the amount that the slot-charterer has to pay to
the slot-owner for each slot (unit) that she books, and a mark-up for herself.
4.1.2 Slot-owner’s Decision
At the second stage, knowing the slot-charterer’s best response B∗ of (23), the slot-owner
aims to set the list price "and the stocking factor - optimally to maximize his own expected
profit, for any given revenue share !, proposed by the slot-charterer at the first stage. The slot-
owner’s profit function is given by
∏ (" , O-|!)B,h = (B)&(1 − !)."�- − ⋀(-)� − ,(1 − �)-+ (24)
Since (B) = �����J , (22) can be rewritten as
∏ (" , O-|!)B,h = ����0(C�b)tcK EdFFG⋀(F)KL
M9 &(1 − !)."�- − ⋀(-)� − ,(1 − �)-+ (25)
We denote the optimal solution for the slot-owner by ("∗, -B∗ ), which maximizes the profit
function of (25) for a given revenue share ! .
Theorem 5. For any given - ∈ ��, ��, and revenue share ! ∈ (0,1), the slot-owner’s unique
optimal list price "∗(-) is given by
"∗(-) = C(C�b) 0$=(C�Z)
=�⋀(=) + C�9 (26)
And, depending on market structure, if the demand distribution satisfies IFR, his optimal -B∗
that maximizes ∏ ("∗(-), O-|!)B,h is uniquely determined by
$=J∗=J∗ �⋀[=J∗ \ + C
� = uC�D[=J∗ \ (27)
From (27), the optimal stocking level -B∗ chosen by the slot-owner under this modified
agreement is lower than that chosen by the slot-charterer under the original agreement as
given in (13). Moreover, it can be observed that the decentralized stocking level -B∗ here in (27)
is, in fact, exactly the same as the centralized stocking level -$∗ given by (8).
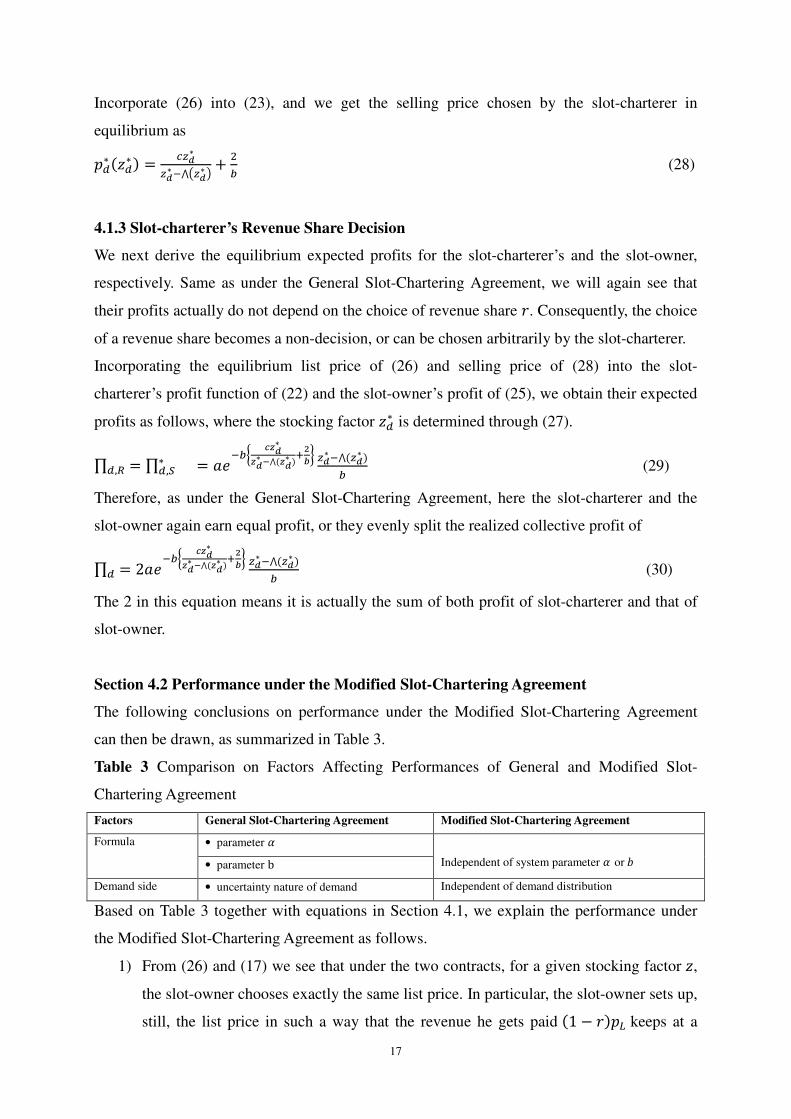
17
Incorporate (26) into (23), and we get the selling price chosen by the slot-charterer in
equilibrium as
B∗ (-B∗ ) = $=J∗=J∗ �⋀[=J∗ \ + f
� (28)
4.1.3 Slot-charterer’s Revenue Share Decision
We next derive the equilibrium expected profits for the slot-charterer’s and the slot-owner,
respectively. Same as under the General Slot-Chartering Agreement, we will again see that
their profits actually do not depend on the choice of revenue share !. Consequently, the choice
of a revenue share becomes a non-decision, or can be chosen arbitrarily by the slot-charterer.
Incorporating the equilibrium list price of (26) and selling price of (28) into the slot-
charterer’s profit function of (22) and the slot-owner’s profit of (25), we obtain their expected
profits as follows, where the stocking factor -B∗ is determined through (27).
∏ = ∏∗B,h = ����a EFJ∗FJ∗ G⋀(FJ∗ )Kg
MeB,�
=J∗ �⋀(=J∗ )� (29)
Therefore, as under the General Slot-Chartering Agreement, here the slot-charterer and the
slot-owner again earn equal profit, or they evenly split the realized collective profit of
∏ = 2����a EFJ∗FJ∗ G⋀(FJ∗ )Kg
MeB
=J∗ �⋀(=J∗ )� (30)
The 2 in this equation means it is actually the sum of both profit of slot-charterer and that of
slot-owner.
Section 4.2 Performance under the Modified Slot-Chartering Agreement
The following conclusions on performance under the Modified Slot-Chartering Agreement
can then be drawn, as summarized in Table 3.
Table 3 Comparison on Factors Affecting Performances of General and Modified Slot-
Chartering Agreement
Factors General Slot-Chartering Agreement Modified Slot-Chartering Agreement
Formula • parameter �
Independent of system parameter � or � • parameter b
Demand side • uncertainty nature of demand Independent of demand distribution
Based on Table 3 together with equations in Section 4.1, we explain the performance under
the Modified Slot-Chartering Agreement as follows.
1) From (26) and (17) we see that under the two contracts, for a given stocking factor -,
the slot-owner chooses exactly the same list price. In particular, the slot-owner sets up,
still, the list price in such a way that the revenue he gets paid (1 − !)" keeps at a

18
constant, independent of the choice of ! chosen by the slot-charterer.
2) From (27), the stocking factor chosen by the slot-owner under the Modified General
Slot-Chartering Agreement is, however, different from that chosen by the slot-
charterer under the General Slot-Chartering Agreement as given in (13).
3) It is interesting to observe that the decentralized stocking factor here in (27) is, in fact,
exactly the same as the centralized stocking factor of (9).
4) Note that although the expression of the selling price here in (28) is the same as that of
(18) under the General Slot-Chartering Agreement, since the stocking factor -B∗ here is
different from the -B∗ under the General Slot-Chartering Agreement, the equilibrium
selling prices under the two contracts will be different.
Section 4.3 Difference between the General Slot-Chartering Agreement and the
Modified Slot-Chartering Agreement
The Modified Slot-Chartering Agreement differs from the above General Slot-Chartering
Agreement only in one respect: it shifts the quantity decision of the Slot-charterer in Stage 3
to the Slot-owner in Stage 2. That is, in Stage 2, the Slot-owner now chooses the list price "
together with the quantity � to provide and deliver to the Slot-charterer, and in Stage 3 the
Slot-charterer only decides the freight rate to the final customers, i.e., shippers. The
decision making procedures for two mechanisms, respectively, are summarized in Table 4.
Table 4 Decision Making Procedures of the General and Modified Slot-Chartering
Agreements
Stages General Slot-Chartering Agreement Modified Slot-Chartering Agreement
Stage 1 The slot-charterer decides
• revenue share
Same as that of the General Slot-Chartering
Agreement
Stage 2 The slot-owner decides
• list price
The slot-owner chooses
• list price together with
• delivery quantity
Stage 3 The slot-charterer decides
• selling price of the slot to the market
together with
• order quantity of the slot
The slot-charterer decides
• selling price of the slot to the market
The performance of the decentralized decision-making procedure is compared with that of the
centralized decision-making procedure and the result of such comparison provide food for
thought for the slot-owner, slot-charterer for obtaining better benefit from the slot-agreement
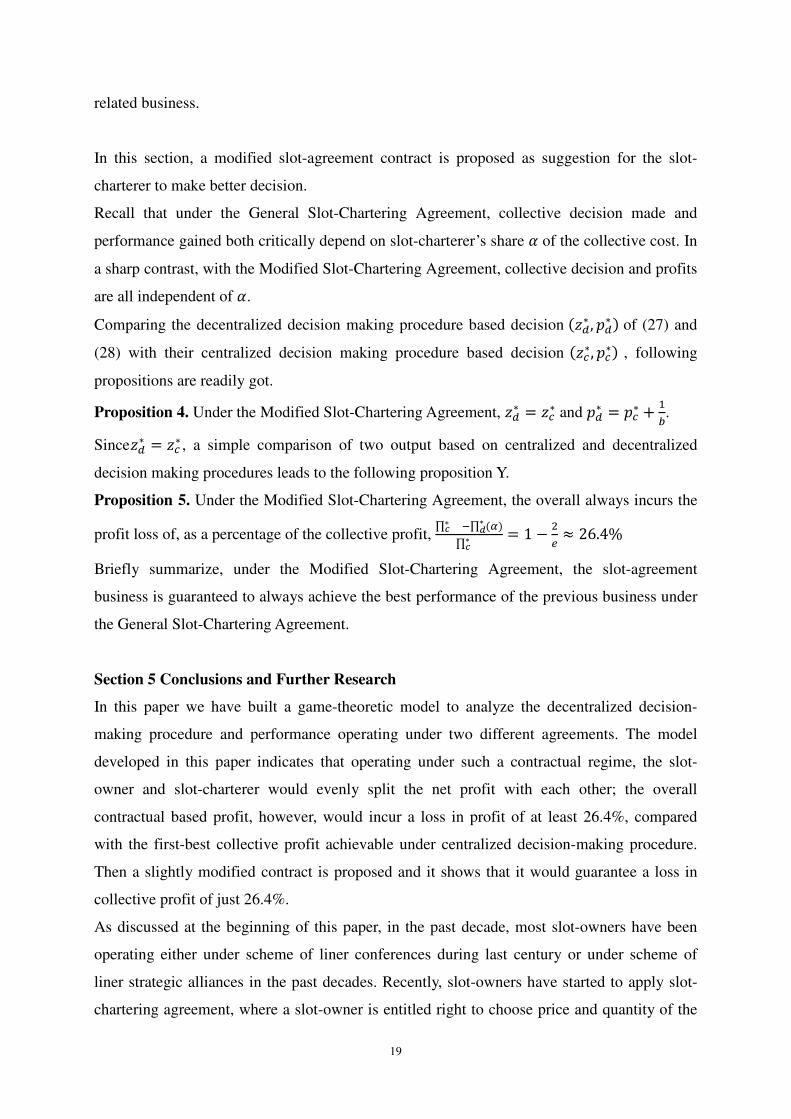
19
related business.
In this section, a modified slot-agreement contract is proposed as suggestion for the slot-
charterer to make better decision.
Recall that under the General Slot-Chartering Agreement, collective decision made and
performance gained both critically depend on slot-charterer’s share � of the collective cost. In
a sharp contrast, with the Modified Slot-Chartering Agreement, collective decision and profits
are all independent of �.
Comparing the decentralized decision making procedure based decision (-B∗ , B∗ ) of (27) and
(28) with their centralized decision making procedure based decision (-$∗, $∗) , following
propositions are readily got.
Proposition 4. Under the Modified Slot-Chartering Agreement, -B∗ = -$∗ and B∗ = $∗ + C�.
Since-B∗ = -$∗ , a simple comparison of two output based on centralized and decentralized
decision making procedures leads to the following proposition Y.
Proposition 5. Under the Modified Slot-Chartering Agreement, the overall always incurs the
profit loss of, as a percentage of the collective profit, ∏∗E �∏ (Z)∗J
∏∗E= 1 − f
n ≈ 26.4%
Briefly summarize, under the Modified Slot-Chartering Agreement, the slot-agreement
business is guaranteed to always achieve the best performance of the previous business under
the General Slot-Chartering Agreement.
Section 5 Conclusions and Further Research
In this paper we have built a game-theoretic model to analyze the decentralized decision-
making procedure and performance operating under two different agreements. The model
developed in this paper indicates that operating under such a contractual regime, the slot-
owner and slot-charterer would evenly split the net profit with each other; the overall
contractual based profit, however, would incur a loss in profit of at least 26.4%, compared
with the first-best collective profit achievable under centralized decision-making procedure.
Then a slightly modified contract is proposed and it shows that it would guarantee a loss in
collective profit of just 26.4%.
As discussed at the beginning of this paper, in the past decade, most slot-owners have been
operating either under scheme of liner conferences during last century or under scheme of
liner strategic alliances in the past decades. Recently, slot-owners have started to apply slot-
chartering agreement, where a slot-owner is entitled right to choose price and quantity of the

20
slots he would offer to the market.
Regarding further research that to be done, sensitivity analyses may be further carried out to
analyze the impact of different pricing strategies. The utmost aim of the whole paper is to
study a win-win solution for either of the players. The win-win situation can also be
interpreted as acceptable solution for all the involved players, i.e., the slot-owner, slot-
charterer and NVOCCs (Non Vessel Operating Common Carrier). We have discussed the slot-
owner and slot-charterer as players in this paper. However, NVOCCs can to some extend be
regarded as a buyer of the slot and its related service as well. In this sense, there is some
similarity between slot-charterer and NVOCCs. The only difference between these two kinds
of players might lies to the way how they decide the selling price of the slot, which might
deserve more research based on the analyses has been done in this research.
References
Cachon, G., 2003. Supply Chain Coordination with Contracts, in Handbooks in Operations
Research and Management Science 11, pp. 229-340.
Cachon, G. and Lariviere, M. 2005. Supply Chain Coordination with Revenue-Sharing
Contracts: Strengths and Limitations. Management Science 51(1): 30-44.
Chen, X., Simchi-Levi, D., 2004a. Coordinating Inventory Control and Pricing Strategies with
Random Demand and Fixed Ordering cost: The Infinite Horizon Case. Mathematics of
Operations Research 29, pp. 698-723.
Chen, X., Simchi-Levi, D., 2004b. Coordinating Inventory Control and Pricing Strategies
with Random Demand and Fixed Ordering Cost: The Infinite Horizon Case. Operations
Research 52, pp. 887-896.
Emmons, H., Gilbert, S., 1998. The Role of Returns Policies in Pricing and Inventory
Decisions for Catalogue Goods. Management Science 44 (6), pp. 276-283.
Federgruen, A., Heching, A., 1999. Combined Pricing and Inventory Control under
Uncertainty. Operations Research 47 (3), pp. 454-475
Granot, D., Yin, S., 2005. On the Effectiveness of Returns Policies in the Price-Dependent
Newsvendor Model. Naval Research Logistics 52 (8), pp. 765-779.
Granot, D., Yin, S., 2007a. On Sequential Commitment in the Price-Dependent Newsvendor
Model. European Journal of Operational Research 177, pp. 939-968.
Granot, D., Yin, S., 2007b. Price and Order Postponement in a Decentralized Newsvendor
Model with Multiplicative and Price-Dependent Demand. Operations Research 56 (1), pp.

21
121-139.
Karlin, S. and Carr, C.R. 1962. Prices and Optimal Inventory Policy, in Arrow, K.J., Karlin, S.,
Scarf, H. (Eds.), Studies in Applied Probability and Management Science. Stanford University
Press, Stanford, CA, pp. 159-172.
Mills, E.S. 1959. Uncertainty and Price Theory, Quarterly Journal of Economics 73, pp. 116-
130.
Mills, E.S. 1962. Price, Output and Inventory Policy, John Wiley, New York.
Petruzzi, N., Dada, M., 1999. Pricing and the Newsvendor Problem: A Review with
Extensions. Operations Research 47, pp. 184-194.
Ray, S., Li, S., Song, Y., 2005. Tailored Supply Chain Decision-Making under Price-
Sensitive Stochastic Demand and Delivery Uncertainty. Management Science 51 (12), pp.
1873-1891.
Ru, J., and Wang, Y., 2010. Consignment Contracting: Who Should Control Inventory in the
Supply Chain? European Journal of Operational Research 201: 760-769.
Song, Y., Ray, S., Li, S., 2006. Structural Properties of Buy-Back contracts for Price-Setting
Newsvendors. Manufacturing and Service Operations Management 10 (1), pp. 1-18.
Wang, Y., Jiang, L., Shen, Z., 2004. Channel Performance under Consignment Contract with
Revenue Sharing. Management Science 50 (1), pp. 34-47.
Whitin, T.M. 1955. Inventory Control and Price Theory, Management Science 2, pp. 61-68. Yano, C., and Gilbert, S., 2002. Coordinated Pricing and Production/Procurement decisions: A
Review. In: Chakravarty A. and Eliashbert J. (Eds.), Managing Business Interfaces: Marketing,
Engineering and Manufacturing Perspectives, Kluwer Academic Publisher, Norwell, MA

Journal of Organizational Computing and Electronic Commerce, 21: 1–16, 2011Copyright © Taylor & Francis Group, LLCISSN: 1091-9392 print / 1532-7744 onlineDOI: 10.1080/10919392.2011.614202
RFID TECHNOLOGY AND ITS APPLICATION TOPORT-BASED CONTAINER LOGISTICS
Xiaoning Shi,1,2 Dongkai Tao,1 and Stefan Voß2
1Department of International Shipping, Shanghai Jiao Tong University, Shanghai,China 52Institute of Information Systems, University of Hamburg, Hamburg, Germany
Radio frequency identification (RFID) technology is among the Internet of Things (IoT)technologies that have been proposed for substantially improving performance of containerport operations. In addition, more implementation is to be expected in the field of containeryard and depot as well as in logistics-related activities. Seaports, especially container termi-nals, are expected to become one of the efficient nodes among all logistics activities with thehelp of IoT technology in the operation practice of sea port, which plays an essential rolein transportation; there is a trend that IoT technology, including RFID technology, is to beadopted to fulfill future electronic identity verification and remote location and control overcargo. A goal of this article is to critically evaluate RFID application for operational proce-dures in port-based container logistics. Based on that, some previously used technologies arebriefly introduced with their effectiveness and efficiencies so that comparison can be made.We also discuss current application of RFID technology in the field of container logistics.Furthermore, RFID application trend from wider perspectives is also observed. That is tosay, applications derived from cargo demand side and supply chain/network managementside can also be triggers that lead to increase in the number of application in the near future.
10
15
20
Keywords: container; port operation; RFID
1. INTRODUCTION
1.1. Overview on RFID Technology
RFID has been successfully used in transportation and manufacturing since the mid- 251980s and its use is growing rapidly as costs come down and benefits are recognized. Theprimary advantage to RFID in a port/terminal application is that it is an “automatic” datacollection technology.
There are two types of RFID tags that are of primary interest: active and semi-active.Active RFID tags contain a battery to boost reading range. Active tags can have a range of 30up to 100 m. These tags have a relatively large memory capacity to store relevant data thatis typically encrypted to prevent unauthorized reading of, for example, a shipping manifest.Active tags may contain sensors, global positioning (GPS), satellite links, or other enhance-ments. Semi-active RFID tags contain a battery but this is not used to enhance reading
Address correspondence to Xiaoning Shi, Department of International Shipping, Mulan Building, NAOCE,Dongchuan Road 800, Shanghai, China. E-mail: [email protected]
1

2 SHI ET AL.
range. The battery is used to power sensors or volatile memory. Read range depends on the 35frequency and type of tags.
Also of interest are RFID identification cards, which may be contactless smart cards.These are passive since they contain no battery and have a more limited range. Currently,passive RFID tags may also be found on pallets and other load devices within shippingcontainers. 40
A barcode is an optical machine-readable representation of data, which shows dataabout the object to which it is attached. Originally, barcodes represented data by varyingthe widths and spaces of parallel lines, and may be referred to as linear or 1-dimensional(1D). Later they evolved into rectangles, dots, hexagons, and other geometric patterns in2-dimensions (2D). Although 2D systems use a variety of symbols, they are generally 45referred to as barcodes as well. Barcodes are scanned by special optical scanners.
Machine-to-machine (M2M) refers to technologies that allow both wireless andwired systems to communicate with other devices of the same ability. M2M uses a device(such as a sensor or meter) to capture an event (such as temperature, inventory level, etc.),which is relayed through a network (wireless, wired, or hybrid) to an application (soft- 50ware program) that translates the captured event into meaningful information (for example,items need to be restocked).
However, scenariorn M2M communication has expanded beyond a one-to-one con-nection and changed into a system of networks that transmits data to personal appliances.The expansion of wireless networks across the world has made it far easier for M2M 55communication to take place.
Recently, SMS has become an increasingly important transmission mechanism forM2M communication, with the ubiquity of GSM and the relatively low cost of SMS beingcited as advantages. Concerns have been raised over the reliability of SMS as an M2Mchannel; however the rise of direct Signaling System 7 (SS7) connected SMS gateways, 60which can offer increased reliability and the ability to confirm delivery, have allayed manyof these fears.
The RMM+ is a remote communication device designed for refrigerated containers.The RMM+ combine communication industry standard ISO10368 with wireless technolo-gies for fast data transfer, long distance communication, and tracking. It is further the key 65component in ISO 10368 power-line communication to monitor and control reefer con-tainers onboard vessels or terminals. Each container equipped with an RMM+ is able tosend data on its operating conditions and alarms to a local monitoring system, such as theREFCON system. Besides monitoring, the RMM+ can be used to remotely control variousreefer container functions, which is discussed in the forthcoming sections in this article. 70
The previously mentioned technology can be applied not only for cargo transporta-tion but also in health care logistics. For example, Zhou and Piramuthu (2010) developeda comprehensive framework and evaluation of health care–related processes with RFIDtechnology implementation. A similar idea also has been analyzed by Pamela, Nabil, andDominique (2011) for optimizing infectious medical waste collecting by using RFID tech- 75nology. Finkenzeller (1999) is of value as an introductory literature on fundamentals andapplications to different fields.
Based on RFID technology, no operator intervention or action is required. Whereasother forms of data collection, whether bar code or manual methods, depend on employ-ees to record information, RFID relieves them from this time-consuming and error-prone 80process.
Some of these applications offer benefits to the terminal/port operator, either directlyor as added services for shippers. Other benefits must be seen more as a means of
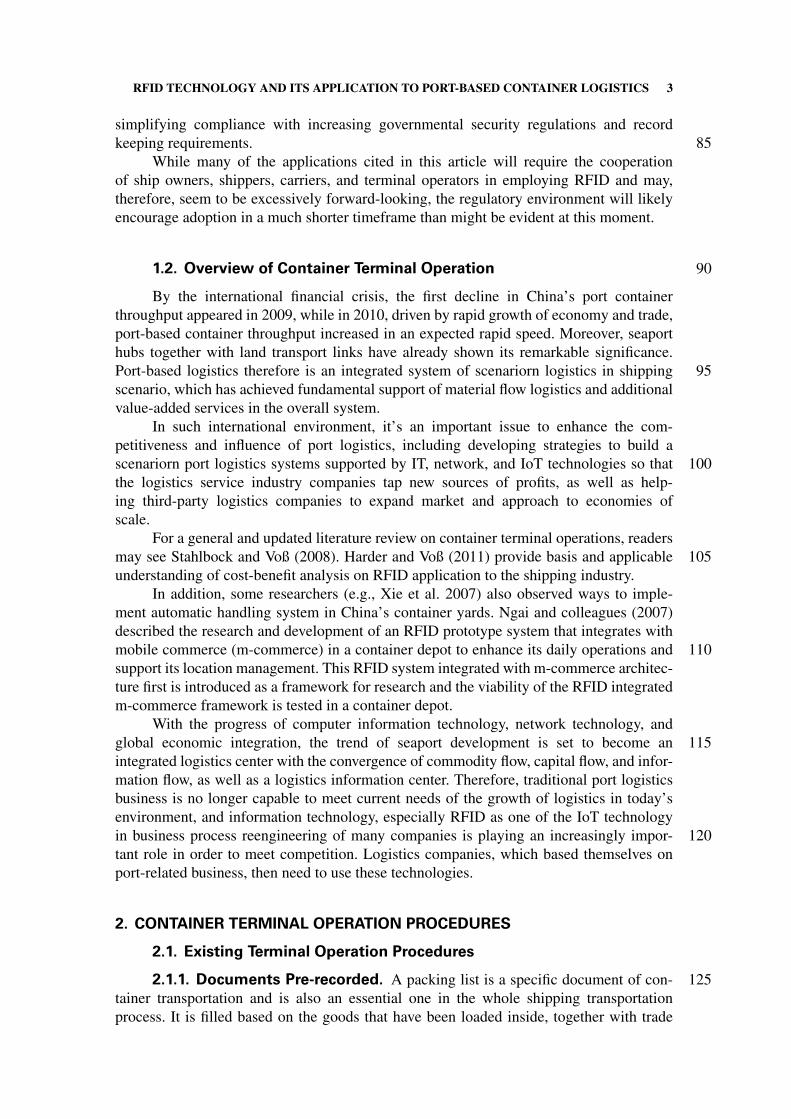
RFID TECHNOLOGY AND ITS APPLICATION TO PORT-BASED CONTAINER LOGISTICS 3
simplifying compliance with increasing governmental security regulations and recordkeeping requirements. 85
While many of the applications cited in this article will require the cooperationof ship owners, shippers, carriers, and terminal operators in employing RFID and may,therefore, seem to be excessively forward-looking, the regulatory environment will likelyencourage adoption in a much shorter timeframe than might be evident at this moment.
1.2. Overview of Container Terminal Operation 90
By the international financial crisis, the first decline in China’s port containerthroughput appeared in 2009, while in 2010, driven by rapid growth of economy and trade,port-based container throughput increased in an expected rapid speed. Moreover, seaporthubs together with land transport links have already shown its remarkable significance.Port-based logistics therefore is an integrated system of scenariorn logistics in shipping 95scenario, which has achieved fundamental support of material flow logistics and additionalvalue-added services in the overall system.
In such international environment, it’s an important issue to enhance the com-petitiveness and influence of port logistics, including developing strategies to build ascenariorn port logistics systems supported by IT, network, and IoT technologies so that 100the logistics service industry companies tap new sources of profits, as well as help-ing third-party logistics companies to expand market and approach to economies ofscale.
For a general and updated literature review on container terminal operations, readersmay see Stahlbock and Voß (2008). Harder and Voß (2011) provide basis and applicable 105understanding of cost-benefit analysis on RFID application to the shipping industry.
In addition, some researchers (e.g., Xie et al. 2007) also observed ways to imple-ment automatic handling system in China’s container yards. Ngai and colleagues (2007)described the research and development of an RFID prototype system that integrates withmobile commerce (m-commerce) in a container depot to enhance its daily operations and 110support its location management. This RFID system integrated with m-commerce architec-ture first is introduced as a framework for research and the viability of the RFID integratedm-commerce framework is tested in a container depot.
With the progress of computer information technology, network technology, andglobal economic integration, the trend of seaport development is set to become an 115integrated logistics center with the convergence of commodity flow, capital flow, and infor-mation flow, as well as a logistics information center. Therefore, traditional port logisticsbusiness is no longer capable to meet current needs of the growth of logistics in today’senvironment, and information technology, especially RFID as one of the IoT technologyin business process reengineering of many companies is playing an increasingly impor- 120tant role in order to meet competition. Logistics companies, which based themselves onport-related business, then need to use these technologies.
2. CONTAINER TERMINAL OPERATION PROCEDURES
2.1. Existing Terminal Operation Procedures
2.1.1. Documents Pre-recorded. A packing list is a specific document of con- 125tainer transportation and is also an essential one in the whole shipping transportationprocess. It is filled based on the goods that have been loaded inside, together with trade

4 SHI ET AL.
terms, stowage order, and related information of certain container ships. Packing listsare very important in container transport business they are one of the original docu-ments used during shipping process and the basis for follow-up documents, such as 130Bill of Lading (B/L). Previously, a paper copy of the packing list is carried by lorrydrivers when crossing into a gateway and is then manually input into port operationsystem. Since the terminal cannot receive this information in advance, the arrangementsof container operation and gateway traffic speed were terribly impacted. Now, termi-nals using EDI transmission allows for electronic packing list input in advance, and the 135driver could just make a simple confirmation of the serial number as long as the containertruck arrives, which greatly speeds up the clearance capacity and accumulates economicbenefits.
2.1.2. Entrance gateway. By using RFID, vehicle and driver informationthrough the RFID tag on the truck’s front window can be collected. The information of 140containers will be recorded through image recognition system by container number andchecked with the container shipping companies’ report as well as the extent of containerdamage. If the software fails to accurately identify the container number, staff will againconduct artificial recognition and type it into the port operation system. Truck drivers arejust required to enter the reservation number instead of getting off, and the machine auto- 145matically prints out a small note, written to remind the driver to put the required numberand location of container. At the same time, control instructions issued to the relevant boxarea facilitates the cable car to move quickly in place to do a good job working at the fastestspeed.
2.1.3. Landside operation area. Independent from the selected terminal oper- 150ations system, specific processes are performed at different areas. On the apron area theship-to-shore operations (loading and discharging of vessels) are carried out. In the begin-ning of container shipping the cargo handling on this area was mainly carried out withon-board lifting gear of the vessels or a regular quay crane. Nowadays this type of handlingis only used on terminals with a comparatively low container throughput. On medium- and 155large-sized terminals the ship-to-shore handling of containers is usually carried out withgantry cranes specialized for this purpose. Container vessels are the only ships that cantheoretically be loaded and discharged at the same time. The Ship-To-Shore gantry Crane(STS Crane) discharges a container moving landwards, and on its way back loads a con-tainer on to the vessel. This handling procedure requires good planning of the terminal 160equipment for container delivery as well as for container stacking in the yard and on thevessel.
The configuration of the area for landside operation is determined by hinterlandtransport scenarios or related interfaces, respectively. In case of predominant truck oper-ations, this functional area is often integrated in the yard area. The trucks are loaded 165and unloaded on dedicated spaces at the end of the stacking yard or in the middle ofthe yard, for example, by straddle carriers or yard cranes. In case of railway transport,loading/unloading should take place outside the stacking area to avoid the crossing of railtracks by the yard equipment. This would increase the terminal efficiency and performanceas well as the safety on the terminal. The loading/unloading process is carried out directly 170by the yard equipment or by gantry cranes being combined with appropriate vehicles forhorizontal transport between railway station and terminal yard.

RFID TECHNOLOGY AND ITS APPLICATION TO PORT-BASED CONTAINER LOGISTICS 5
2.2. Current Technologies Applied in Container Terminal Operation
2.2.1. Electronic devices in container terminals. Providing reliable serviceto the interacting elements of the transportation chain is a major objective of any container 175terminal. Within a port community, the effective flow of information is considered to be animportant variable. For example, in an eight-berth terminal where eight ships are berthedfor loading/unloading some 6000 containers simultaneously, a highly sophisticated infor-mation technology is required to provide reliable and timely information for hundreds ofpeople within the port/transport community. Among them are freight forwarders, transport 180companies, rail operators, crane operators, and container carriers in terminals. To carryout an effective data interchange, appropriate electronic devices must be used. However,despite the fact that several devices are available in the market, they are not employed inevery container terminal. While they can operate as individual devices in ports and outsideterminals (e.g., rail track), they should be integrated to the port and transport network com- 185munications via a computer system. Only a few international ports have taken maximumadvantage of existing devices to improve their operational efficiency, minimize terminalcongestion, and establish a fully integrated system. A brief description of the followingdevices aims to explain their importance in container tracking, recording, movements, andsegregation of imported/exported containers. 190
2.2.2. Microwave technology. At present, material handling systems are gen-erally manually operated. One of the few US terminals (e.g., Long Beach, Los Angeles)has gone beyond the experimental stage in advancing the state of material handling prac-tice. Some have employed computer process control to minimize crane travel time fromship’s hull to the quay. Microwave technology is simply employed to track the placing 195and pick-up of containers by recording relevant data on tags installed on the containers.In ship-to-rail direct loading at the terminal, for example, this method would reduce thecrane’s waiting time when the spreader is in the ship’s hull.
2.2.3. Tagging technology in rail transport. Recent advances in microwavetechnology include a tag that allows data read or write. The tag can contain up to 4000 char- 200acters of data that can be updated by radio signal broadcaster installed in the terminal oralongside of the train track (e.g., automated wagonload operations on the New Zealand rail-way system). The tags can be read while the train is moving at up to 110 km/hr. This systemmust be modified when the fast freight trains (160 km/hr operate in Japan and Germany)are used for freight transportation. The antenna used in this system creates an inductive 205radio frequency field to activate and receive data from tags. It contains a transmit-coil withassociated tuning and matching components and a receive-coil. When a consignment isloaded on the train, the computer will be able to provide relevant information on contentof containers loaded on the train, wagons, and destinations. Information is then passed tothe yard staff. Based on this information, a work order is passed to the crew of the train. 210As the train leaves the yard, an Automated Vehicle Identification (AVI) reader reads thetags on each wagon and sends a message to the central computer to compare the manifestwith information in the central computer. At the same time, the wagons are weighted tocheck for load discrepancies. Both sets of data are then sent ahead of the train to the nextstop so that the freight forwarders can be advised of arrival. 215
2.2.4. Barcode scanner. A barcode scanner would help the customs decidewhether physical inspection of containers is required particularly when several vesselssimultaneously unload thousands of containers. Barcode and optical character recognition

6 SHI ET AL.
are basically two automatic identification systems. They are environmentally sensitive andapplication restrictive. The scanner is easy to use where the ambient light environment in 220the container terminal is high. A barcode is ideal, especially for shipping manifests andouter packing cases or other exposed surfaces. This system is capable of providing promptinformation required by customs when vessels are at berth. It operates most effectively ina controlled environment particularly when relatively small amounts of data need to becaptured. 225
2.2.5. Radio frequency microcircuit system. Radio frequency microcircuitsystem (RF) is developed to identify the containers when traffic at terminals reaches thepeak. It is not easy to check and control the traffic at a terminal where thousands of con-tainers are stacked and hundreds of containers are on the move. Container carriers deliverthe stacked imported containers to the quay area and the newly unloaded containers occupy 230their slots. The system is ideally suited for operation in a harsh and outdoor environment.Nonconductive materials such as grime, snow, and rain that intrude between the interroga-tor and transponder do not appear to affect operation of the system. The system consistsof the reader or antenna (that is buried in the pavement of the terminal to keep it freefrom vandalism, accident, and weather) transponders (tags), an interrogator and computer 235interface tag. RF system offers high-speed and remote electronic identification of equip-ment. The heart of the system is the tag, powered either by a battery or by an RF beamfrom the antenna. Each tag can have a unique code that is related to the object to whichthe transponder is attached. The electronic components of the transponders are enclosed inrugged packages that may be as small as a credit card. One application for RF systems is in 240monitoring the movement of containers and their status in the terminal. This is the area thatassists the terminal operator to produce prompt reports for importers/exporters and otherrelevant agencies. The system can also track containers entering and leaving the terminalthrough the gate or as they pass the scanning points in the yard.
2.2.6. Voice recognition technology. Voice recognition technology provides 245communications between the crane operator and the ground personnel. This system couldbe used either as a standalone or it can be integrated with other technologies.
Voice systems use pattern recognition similar to that in barcode systems. Insteadof an image, the computer recognizes words in a preprogrammed vocabulary. When itis activated, crane operators speak into a microphone; the machine recognizes words or 250phrases and then converts them into electronic impulses for the micro- or host computer.The high-performance units operate at an accuracy rate of 99.5%. One of the advantages ofthe system is message recording. This would assist the terminal operator in providing thefinal report on the position of containers loaded on to the ship. When properly integrated,the system can assist in the automatic capture and processing of marine terminal data. 255
3. APPLICATION OF RFID TO CONTAINER TERMINAL OPERATION
3.1. RFID Container E-Seal
Port operators are striving to increase efficiency through effective supply chain man-agement, while focus is being placed on security, visibility, and control. The problem iscaused by the highly complex environment in which thousands of containers need to be 260

RFID TECHNOLOGY AND ITS APPLICATION TO PORT-BASED CONTAINER LOGISTICS 7
handled at high speeds without automated business processes. Many shippers still use man-ual methods, which can lead to tracking errors and mishandling. The modules that can beapplied in port operations are listed next.
3.1.1. Module
1. RFID Container Seal—RFID Container Seal records every single lock or unlock event 265performed and when it is performed. Unauthorized lock or unlock will tamper theseal and triggers the alarm when the container passes through the check point. RFIDContainer Seal comes with large memory, allowing detailed information to be stored inthe seal. The information stored in the seal can be used for faster customs clearance,e-document for port, etc. RFID Container Seal is reusable and it is environmentally 270friendly.
2. Handheld PC with RFID Reader—Handheld PC with RFID Reader is used to initialize,write, issue lock, or unlock command to the RFID Container Seal. Lock or unlock RFIDContainer Seal without command issued from the Handheld will tamper the seal.
3. Desktop RFID Reader—Desktop RFID Reader is used to initialize and write informa- 275tion into the RFID Container Seal in the convenience of office environment.
4. Readers at Check Points—RFID Readers are installed at a check point to read the infor-mation in the RFID Container Seal affixed to the container. Information collected isuploaded to the SmartrackTM EPCIS or other repository, allowing shipper, freight for-warder, ports, etc. to know the status of the container online. Container with RFID 280Container Seal intact is allowed to pass through without the need to physically check,which helps in faster clearance. Only a container with tampered RFID Container Sealwill be inspected.
5. Readers at Quay Crane—Readers at Quay Crane capture the status and information inthe RFID Container Seal when a container arrives. The status and information will then 285be uploaded to SmartrackTM EPCIS or other repository. It allows the shipper to knowwhen the container is loaded or offloaded from the vessel. On top of that, if the seal istampered, the shipper can easily identify when the seal was tampered and whether ithappened before or after the container was loaded or offloaded from the vessel.
3.1.2. Standards. Electronic Seals (E-Seals) present a very simple and at the same 290time very strong defense against different weaknesses in safety of containers in worldwidetrade. By implementing various types of E-Seals it is possible to enhance container securityas well as improve efficiency of container logistics processes throughout the whole supplychain.
According to the current ISO 18185 dentition, an E-Seal is a “Read-only, non- 295reusable freight container seal conforming to the high security seal defined in ISO/PAS17712 and conforming to ISO 18185 or revision thereof that electronically evidences tam-pering or intrusion through the container door.” At present, there are no global standardsfor frequencies and technical specification for electronic seals. The International StandardsOrganization’s (ISO) Technical Committee 104 is trying to specify data protection tech- 300nology, and as a result, ISO 18185-4 Gen 1 was released in August 31, 2005. However,the ISO 18185-4 Gen 1 did not satisfy requirements for the data protection and deviceauthentication for E-Seals.
8 SHI ET AL.
An E-Seal provides not just physical security but also can contain a set of usefulinformation such as seal number, container number, user data, security, battery, and envi- 305ronment status and some different data useful for supply chain management. An electronicseal has the great advantage of maintaining visibility en route and allows for real-time eventreports using satellite or cellular communications. With high-end capability it becomesmore attractive for security and business applications.
Finally, the adaptation of E-Seals is connected with additional expenses for container 310business providers and for government in particular. The problems of investments in suchsecurity devices on containers are evaluated in the article.
3.2. Scenarios and Development
In correspondence with the four hierarchies illustrated previously, the application ofRFID to container transportation could also be classified into four scenarios. 315
1. Scenario one—quasi closed loop application:A container terminal or a container yard or container freight station is more likely toimplement this RFID application scenario in the first place within the container trans-port industry. As the container terminal is the most dynamic node full of containerlogistics activities, the implementation of RFID within the terminal or yard could result 320in substantial benefits including but not limited to the following aspects:� Facilitating gatehouse operations through better container identification efficiency� Keep improving the container storage management via real-time data updates� Check container logistics operations to minimize operation errors
2. Scenario two—container shipping route application: 325This scenario can come into being only when at least two terminals have implementedRFID systems so that the container shipping routes between the ports can be integratedinto their systems, forming lines of RFID application routes. It is expected to bringabout the following benefits:� Facilitating the liner companies with their container scheduling and management 330� Better container tracking and tracing functions
3. Scenario three—RFID container application clusters:Based on well-implemented RFID within the shipping/port realm, other operatorsrelated to container logistics within the multimodal transportation systems can befurther integrated into the existing container RFID application clusters. This step is 335essential to the whole container transportation system’s efficiency improvement sincethe information of the containers within the clusters can be transmitted efficiently andin a timely manner. Information distortion can be eliminated significantly in intermodalcontainer transportation chains:� Satisfying container tracking and tracing functions 340� Comprehensive and prompt statistics
4. Scenario four—comprehensive application:Along with the roll out of RFID application to container transportation, under properinternational standards, the internationally compatible application can be expected incontainer transportation. This is the ultimate application of container RFID. If it is going 345to happen in the future, the following extended functions of container RFID system maybe realized:

RFID TECHNOLOGY AND ITS APPLICATION TO PORT-BASED CONTAINER LOGISTICS 9
� Public container data platform implementation for international customs organizationto monitor the container transportation and international trade security
� The efficiency perfection of the entire container transportation system 350
3.3. Improving workflows of the container terminal operation. The exist-ing RFID application to the entrance gate process of a container terminal can be found inFigure 1, where time taken for EIR can be dramatically shortened. As for processes thathappen inside of a container terminal, a flowchart is illustrated in Figure 2. Each activityunless it is container related, for example, EIR activity, can then turn to be more efficient 355in the case of RFID application.
3.4. Advantages and Disadvantages
The advantages of the large-scale application of RFID are analyzed next.
1. Overall improvement in operational efficiency, reduce clearance time, achieve paperlesstransportation. 360When the speed of operation and transportation is in the RFID tag’s signal range, dataexchange automatically ensuring seamless operation. It will completely change the flowof container transport operations, so there is no longer a need to approach EIR, whichis a completely paperless operation.
2. Accurate and timely data collection rate. 365The current way of data collection is single, and controllability is not high and the datasource does not guarantee real-time updates. Although the accuracy and timeliness ofthe arrival rate satisfies the current management but can still be improved to enhancethe management of all containers to reduce lost container rate, goods damage, and theftlosses. 370
Figure 1 RFID application at entrance gate of container terminal (color figure available online).
Source: Photo by Authors at Waigao Qiao Container Terminal in Shanghai, Apr. 2011.

10 SHI ET AL.
Invalid
Present related documents (EIR)
Identify documents by staff at Exit Gateway Departure Denied
Departure AuthorizedExit withContainer
ValidInvalid
Valid
WithoutEIR paper
With EIRpaper
Process and arrangemanually
Yes
Update yard information in RFID
Drive to Specified Area
Drive to ManualProcessing Parking Lot
Re-check the reservationPort Machinery Operation
Drive to Exit Gateway
Show yard number on TED screen
Re-scan RFID tags, including e-seals
Slow down to get scanned
Slow down to get scanned Valid
EIR,Heavy
Container
Lorry arrived at the portentrance gateway
Invalid
Figure 2 Flowchart of container related port operations.
Source: Authors own composition based on Xie et al. (2007).
3. Slash labor costs.Automation of electronic yard management will replace a large number of managers toachieve centralized and efficient management, reduction of labor costs, and costs of thelogistics of cargo owners reduced accordingly.
4. Integrate the entire supply chain optimization from a strategic perspective. 375The current logistics costs are often unclear for lack of control based on position,but the demand of data collection is especially very strong. Effective management ofthe supply chain means to successfully control every aspect of logistics costs, reduceshipping circulation, and increase owner of business interests. Information must there-fore be to achieve effective integration of RFID, mobility, and use only the most of its 380value.

RFID TECHNOLOGY AND ITS APPLICATION TO PORT-BASED CONTAINER LOGISTICS 11
The disadvantages of large-scale application of RFID are analyzed next.
1. Container transport is a global business.The circulation of each container is in a global range. If RFID electronic tags areplanned to be implemented, it needs to be promoted by the entire shipping and port 385industry, together with related companies or associations to promote an integratedimplementation. Currently, there are no plans to set up new organizations. Even if thenational policy supports, it is still difficult to advance in international business, whileallowing for development of pilots only for domestic transport.
2. Within the container shipping company, data acquisition and transmission has reached 390standards of accuracy and completion.Data are collected in the form of electronic telegraph messages, from the port, shipyard, and operating ships, updated regularly through the company’s EDI system for dataintegration summed to form a complete container information feedback. The currentelectronic message accuracy rate is more than 99% (according to the interview with 395staff working in China Shipping Container Line), with all operations contained in thereport. In addition, operating items reported on a daily routine.
4. TREND OF RFID APPLICATION TO LOGISTICS OPERATION
4.1. Practical Industry Views
Logistics and transportation are major areas of implementation for RFID technology. 400For example, yard management, shipping, and freight and distribution centers are someareas where RFID tracking technology is used. Transportation companies around the worldvalue RFID technology due to its impact on the business value and efficiency. From theperspective of logistics services, in most cases challenges arise from the demand side. Theinterested reader may refer to Kapoor, Zhou, and Piramuthu (2009). 405
4.2. From Perspective of Shipping Company
Some liner shipping company has carried out bar code label applications, where barcode labels are attached to the top of a corresponding container EIR, and has survey appli-cations and found that EIR in practice suffers the consequences due to improper care andother reasons. Therefore, scanner read information is often not timely, the greatly reduced 410efficiency of customs clearance, which is even slower than a skilled manual input speed.Ultimately such inconvenience leads to failure of multiple scan container station to giveup bar code scanning. How to ensure the speed of customs clearance and port readingaccuracy will be important in considering the adoption of RFID technology.
RFID technology gains little visible economic profits. Although the electronic tag on 415the container port operations and management control will be fully optimized to enhance,but from the economic point of view, the huge initial investment (the specific numbersneeded to be collected later in the survey data) and operating and maintenance costs in theprocess is unknown, and future income is not directly visible, we cannot directly addressthe main issues in the current operation. Only the lower labor costs have a certain role. 420Meanwhile, the investment costs of new technology will eventually be transferred on toshippers, causing increased shipping costs, which may affect the choice of the owner ofthe carrier thus causing loss of the customer base.
12 SHI ET AL.
The quality of the current mechanisms for monitoring and alarming of reefer-container has been improved. CSCL chips and refrigerators are supported by Daikin, 425the ambitious coproduction of such well-known air-conditioning manufacturer; every tinychange of the temperature of reefer-containers is meticulously recorded. As one of the mostleading monitoring and alarm systems, its temperature monitoring has reached Europe’sand the United States’ stringent requirements for various types of imported food. It is notclear whether the temperature monitoring and alarm systems are networked. All that has 430been learned is that the alarm system can still be in the yard field application.
Lack of demand on app level limits new breakthroughs. RFID is just one of themeans of data exchange, namely an alternative to existing technologies at physical level,while at the application level it still needs to explore new areas. To find RFID technologyin the logistics chain services to meet the new demands and the corresponding RFID tag 435technology breakthrough is an important breakthrough in application.
In sum, the attitude of the interviewees to some extent represents that of the ship-ping companies, that current RFID technology in existing systems and technologies canmeet business needs, and application of new technologies seems immature, without anyobvious visible benefit cases, shipping companies are powerless when it comes to imple- 440menting RFID tag technology. Of course, considering the interviewee positions and angleof individual characteristics, this conclusion does not fully represent the views of thedecision-making board in shipping companies.
4.3. From the Perspective of Emerging Market
The RFID technology can not only enable item-level retail pricing as studied by Zhou 445and colleagues (2009) but also facilitate logistics service designed for specific cargo, forexample, those packaged in reefer containers. Keeping real-time tabs on fresh food supplyhelps guarantee the quality of perishable goods.
In this niche market—the reefer-container market—Maersk Shipping Line Co. (here-inafter referred to as Maersk) has been leading the industry, and its technology and service 450solutions are able to fully meet customer demand for transport of different commoditiessuch as ultra-low temperature freezing and constant temperature refrigeration. In coop-eration with cooling technology companies, an exclusive agreement is often signed topurchase expensive container refrigeration technology in order to ensure its technolog-ical leadership. In addition, Maersk also generates great emphasis on its R & D and Q1455service improvement, invested heavily in R & D and technical personnel in the newreefer-container technology to ensure meeting the new demands of customers in a timelymanner.
At present, the reefer-container transportation of Maersk shipping company is nodifferent from other shipping companies. In the terminal yard, Maersk signed agreement 460with appropriate local agencies, requiring at least two patrol checks a day to ensure thenormal operation of reefer-containers, and downloading temperature data artificially withcable devices. On board transport, the Maersk container ships have a special placementfor reefer-containers, where there is the power and data transmission interface, and thetemperature data can be received directly in the ship control room and returns the corporate 465data center.
Reefer container transport has a relatively higher requirement on refrigeration tech-nology and status monitoring system. Reefer-container transport ship at the current stageprovides basic power supply and can ensure the timely transmission of data, but in the
RFID TECHNOLOGY AND ITS APPLICATION TO PORT-BASED CONTAINER LOGISTICS 13
terminal stage of yard and road transport, shipping companies and cargo owners are unsat- 470isfied of the control of status information, as a result of inefficiency to confirm whether itsagents’ services are in place. Moreover, all temperature data recorded on reefer-containershave to be manually downloaded, which means a heavy workload. Various data informa-tion of reefer-container is transmitted in real-time via wireless network carriers, ensuringreal-time monitoring of information in a timely manner for both shipping companies and 475cargo owners, particularly to deal with emergency situations and achieve preparation forship maintaining before docking. Thus, the data can be downloaded without having to man-ually work but also avoid cargo damage caused by the absence of timely inspections andthe practical realization of the container real-time transmission of data, a higher level ofservice to shippers. Since the market is not much demanding for such technology, relevant 480shipping companies that had originally intended only to develop have not yet entered thecommercial stage.
RFID tag technology has also been tested in the Maersk planned updates, but itsphysical security and data transmission limitations caused no large-scale application.In addition, RFID tag information is stored in relatively fixed form mainly designed for 485dry containers, with the main information being the container number. But for the past fewyears, image-recognition technology has developed faster than the application of RFID tagtechnology, mostly by which dry-containers identification is carried out instead of RFIDtags. Furthermore, the transmission limitations of large transmission networks need to besolved by accepting large-scale deployment. Compared to the service of mature network 490providers, the cost is too expensive.
At the entry gateway of ports, even if RFID tags were globally applied, it still maynot be achieved without stopping by. Because the plan of the container stacking yard is notpre-established, instead it is arranged according to the order of on-site container arrival,and the computer system is only secondary. When crossing the gateway, truck drivers have 495to collect a small ticket printed with the yard information and then know their own load-ing and unloading position. Therefore, unless there is further updating of communicationsequipment on trucks, it cannot be achieved without stopping clearance just relying on RFIDtags.
In short, from the perspective of these emerging markets, RFIDmay help the decision 500maker to identify where the bottleneck exist. In this case, the aim of such application ofRFID is to better fit the Standard for Work designed by a manufacturing enterprise, bettermanaging of key elements and spare parts, and better implementing of storage and deliveryservice.
4.4. From the Perspective of Device Manufacturer 505
RFID tags are divided into two types: passive and active. Passive tag is relativelysimple, generally thin in shape, suitable for short-range signal transmission within 1 meteror less, and usually operates in high-frequency. The main transmission scenario is to issuea changing magnetic field transmitter to activate reverberation within the loop current so asto provide energy for data processing chip and data transmission. A passive RFID tag costs 510about 1.5 RMB, of which the cost of individual electronic chips at 0.15 RMB, and in thecase of the scale of demand to reach tens of millions, a single electronic chip productioncost can be reduced to 0.1 RMB.
Active electronic tag chip and the memory itself are the same as passive ones, butthey require their own access to power devices. Its signal transmission distance is about 515

14 SHI ET AL.
1–30 meters, and the main transmission scenario for the electromagnetic waves are highfrequency signal, usually 900 mHz. The cost level of the power supply devices varies butwill be much higher than the cost of passive tags.
There is a signal blind area that requires multiple signals to simultaneously readthe transmitter address, or by reading the physical location of mobile objects when 520active electronic tags initiate long distance signal transmission, causing reflection ofelectromagnetic waves by obstacles, etc. Therefore, the practical deployment of long-distance transmission needs to be analyzed in container yards. Besides, there is noblind area for RFID devices to read if container trucks are within the prescribed speed.The foil inside electronic tags suffers from signal reception barriers, so it needs to 525be transformed into three-dimensional shape, which may give rise to the cost of thecontainer RFID tags to some extent. In addition, due to the same signal frequency sec-tion shared by both ultra-high-frequency RFID and GSM (Global System for MobileCommunications, originally Groupe Spécial Mobile, is a standard set developed by theEuropean Telecommunications Standards Institute to describe technologies for second gen- 530eration digital cellular networks), there exists interference, but it can be resolved if readingtimes are increased.
RFID technology update interval is generally 2–3 years, and now it is a second gen-eration technology, while the third generation has not yet applied. An RFID tag productionline is generally 10–20 million size of capital investment. So if a large number of tags are 535needed, investing in an independent production line is worth consideration and even thefounding of an appropriate company.
Currently, imported RFID read-write devices are about 1–2 million, while domes-tic one enjoys a price of 5–6 thousand RMB, and a single reader module is only200–400 RMB, which can be combined with other data readers or sensor equipment. The 540handheld reader devices are generally more expensive.
5. CONCLUSIONS
As we observed, the container transportation industry is still in the elementary stagesof its RFID applications. RFID applications in container transportation are not exactly thesame as the RFID applications to the customs requirement. In transportation and logistics 545realm, information management accuracy and efficiency is more important with a relativelylow system cost. Meanwhile, customs require more security guarantees. That is why thecustoms are working on smart container E-Seals to achieve their goals. Given the gapbetween the container transportation industry and the customs, as discussed in pervioussections, it is very likely that two types of RFID applications will coexist: one is a logistics 550tag for transportation applications and the other E-Seal, which when necessary, would beadded to the exporting container.
So far, for the RFID tags in container transportation field it seems that the containermanufacturer is one of the most suitable parties for container RFID tag installation becausethe manufacturer is the source of containers, which has the precedence to gain economies 555of scale and technical standards establishment and implementation.
This article does not only give a detailed explanation of RFID application but alsoprovides the reader with the fundamental principles and a critical review of potential solu-tions as well as the bibliography to be checked in case someone wishes to deepen theirknowledge on some aspects of this topic. 560

RFID TECHNOLOGY AND ITS APPLICATION TO PORT-BASED CONTAINER LOGISTICS 15
Last but not least, further research topics such as confidentiality protection, deacti-vating waste tag, legal framework of RFID application deserved detailed research in thenear future.
REFERENCES
Finkenzeller, K. 1999. Radio-frequency identification: fundamentals and applications. Munich, 565Germany: Wiley & Sons.
Harder, F-C., and S. Voß. 2011. “A simple RFID cost scenario for the container shipping industry.”International Shipping and Transport Logistics, forthcoming. Q2
Kapoor, G., W. Zhou, and S. Piramuthu. 2009. “Challenges associated with RFID tag implementa-tions in supply chains.” European Journal of Information Systems 3:526–533. 570
Ngai, E. W. T., T. C. E. Cheng, S. Au, and K.-H. Lai. 2007. “Mobile commerce integrated with RFIDtechnology in a container depot.” Decision Support Systems 43(2):62–76.
Pamela, C. N., A. Nabil, and F. Dominique. 2011. “Optimization of infectious medical wastecollection using RFID.” Lecture Notes on Computer Science, forthcoming. Q3
Stahlbock, R., and S. Voß. 2008. “Operations research at container terminals—a literature update.” 575OR Spectrum 30: 1–52.
Vanelslander, T. 2005. “The economics behind cooperation and competition in sea-port containerhandling.” PhD Thesis, Faculty of Applied Economics, University of Antwerp. Q4
Xie, Y., Q. Bao, Z. Yao, and Z. Ge. 2007. “Research on the automatic handling system in Waigaoqiaoautomatic container yards.” Machine Design and Research 23(4):106–108. 580
Zhou, W., and S. Piramuthu. 2010. “Framework, strategy and evaluation of healthcare processes withRFID.” Decision Support Systems 50(1):222–233.
Zhou, W., Y.-J. Tu, and S. Piramuthu. 2009. “RFID-enabled item-level retail pricing.” DecisionSupport Systems 48(1):169–179.
AUTHOR BIOS 585
Xiaoning Shi is a PhD candidate jointly affiliated with the Institute of Information Systemsat the University of Hamburg, Germany, and the Department of International Shipping andLogistics at the Shanghai Jiao Tong University, China. Since 2003 she has been working asa teaching assistant and later on as a lecturer at the Department of International Shippingand Logistics, School of Naval Architecture Ocean and Civil Engineering, Shanghai Jiao 590Tong University. In 2005, 2008, and 2009, she was a visiting researcher at the Universityof Hong Kong, at the University of Antwerp, and an intern at the UNCTAD, respectively.In 2002 she worked at the Maersk Line Corp, Shanghai Branch. She holds bachelor’sand master’s Degrees in engineering from Dalian Maritime University, China. Her cur-rent research interests are in econometric and game theoretic applications in shipping/port 595industries and optimization of logistics networks.
Dongkai Tao has done research on the edge of technologies applied in transportation,especially in the field of international shipping, and analyzed practical scenarios of RFIDapplication to port operation in his graduate thesis. He also holds a bachelor’s degree ofengineering from Shanghai Jiao Tong University with a major in International Shipping 600and Logistics.
Stefan Voß is Professor and Director of the Institute of Information Systems at theUniversity of Hamburg, Germany. Previous positions include full Professor and Headof the Department of Business Administration, Information Systems and Information

16 SHI ET AL.
Management at the University of Technology Braunschweig, Germany, from 1995 to 6052002. He holds degrees in mathematics (diploma) and economics from the Universityof Hamburg and a PhD and the habilitation from the University of Darmstadt. His cur-rent research interests are in quantitative/information systems approaches to supply chainmanagement and logistics including public mass transit and telecommunications. He isauthor and coauthor of several books and numerous papers in various journals. Professor 610Voß serves on the editorial board of some journals including being Editor of Netnomics,Editor of the Annals of Information Systems, Associate Editor of the INFORMS Journalon Computing, and Area Editor of the Journal of Heuristics. He frequently organizesworkshops and conferences. Furthermore, he is consulting with several companies.
IAME�2011�conference�
� �
�
SANTIAGO�DE�CHILE,�THE�25th�–�28th�of�OCTOBER�2011�–�www.iame2011.org�
����������� ������������������������� �����
������������ ���������
XIAONING�SHI�
Shanghai�Jiao�Tong�University�
gchuan�Road,�Shanghai,�200240�
University�of�Hamburg,�IWI�Von�Melle�Park�5,�20146,�Hamburg,�Germany�
[email protected]�hamburg.de�Phone:�0049�40�42838�3064�Fax:�0049�40�42838�5535�
YI�ZHANG�
Shanghai�Jiao�Tong�University�(on�leave)�Email:�[email protected]�
�
STEFAN�VOSS�
University�of�Hamburg,�IWI��Von�Melle�Park�5,�20146,�Hamburg,�Germany�
Stefan.voss@uni�hamburg.de�

IAME�2011�conference�
� �
�
SANTIAGO�DE�CHILE,�THE�25th�–�28th�of�OCTOBER�2011�–�www.iame2011.org�
Abstract�
With�the�convening�of�the�COP15�United�Nations�Climate�Change�Conference�Copenhagen�2009,�the�reduction�of�Greenhouse�Gas�(GHG)�emissions�has�once�again�become�a�popular�topic.�All�countries�present�at�the�meeting�have�discussed�on�the�standard�of�emissions,�but�failed�to�reach�an�agreement�as�one�might�ever�have�expected.�
Although�the�shipping�industry�has�not�been�included�in�the�mandatory�emission�reduction�list�in�the�"Kyoto�Protocol",�as�the�global�climate�problem�turns�to�be�severe,�countries�in�Annex�I�in�the�"Kyoto�Protocol"�and�the�EU�begin�to�put�pressure�on�the�International�Maritime�Organization�(IMO).�As�a�result,�IMO�has�put�the�issue�of�reducing�GHG�emissions�in�the�shipping�industry�on�the�agenda�and�committed�to�introduce�a�specific�standard�for�emissions�reduction�by�2011.�
Moreover,�in�March�2009,�the�State�Council�of�the�People’s�Republic�of�China�has�issued�a�strategic�policy�on�the�promotion�of�transforming�Shanghai�into�an�international�financial�and�shipping�centre.�Under�such�circumstance,�an�in�depth�study�of�a�carbon�emission�reduction�model�is�far�reaching�not�only�for�the�development�of�the�Chinese�shipping�industry,�but�also�for�shipping�companies�to�gain�a�favourable�position�in�the�carbon�credits�exchange�market.�
In�addition,�the�Cost�Benefit�Analysis�is�applied�to�get�a�cost���benefit�ratio�in�GHG�emissions�trading.�It�is�compared�with�the�cost���benefit�ratio�resulting�from�GHG�emissions�reduction�through�technical�methods�in�the�shipping�industry,�thus�showing�the�feasibility�of�GHG�emissions�trading.�
In�this�paper,�an�in�depth�study�is�carried�out,�aiming�to�enhance�the�professionalism�and�technical�knowledge�of�the�Chinese�shipping�industry�regarding�GHG�emissions�reduction.�In�addition,�proposals�for�corresponding�actions�are�raised�for�shipping�companies’�reference,�so�that�they�will�have�an�advanced�position�in�the�GHG�emissions�exchange�market�in�the�near�future.�
Keywords�
GHG,�emissions�reduction,�international�GHG�emissions�trading�scheme,�shipping��

�
SANTIAGO�DE�CHILE,�THE�25th�–�28th�of�OCTOBER�2011�–�www.iame2011.org�
����������� ������������������������� �����
������������ ���������
1 Introduction With�the�convening�of�the�COP15�United�Nations�Climate�Change�Conference�in�Copenhagen�in�Dec�2009,�developed�and�developing�countries�have�argued�on�their�duties�of�GHG�emissions,�but�failed�to�reach�an�agreement.�People�from�all�areas�of�life�have�discussed�on�the�reaction�plans�to�the�standard�of�emissions�that�will�be�set�in�2011.�While�in�March�2009,�the�State�Council�issued�a�national�strategic�plan�regarding�further�promoting�Shanghai�as�an�international�financial�and�shipping�clustering�city�by�2020.�Under�such�circumstance,�an�in�depth�study�of�the�modes�to�reduce�carbon�emission�is�not�only�far�reaching�but�also�urgent.�The�main�focus�of�this�paper�is�two�fold.�One�concern�is�to�improve�the�professional�qualities�and�technical�knowledge�of�GHG�emissions�in�the�Chinese�shipping�industry,�thus�providing�proposals�at�the�time�of�making�decisions.�The�other�is�to�propose�a�corresponding�program�under�GHG�emissions�trading�scheme�from�the�shipping�companies’�perspective�through�an�in�depth�analysis.�In�our�research,�the�following�actions�are�taken:�
1.1�Research�Outline�(1)�International�organizations,�historical�agreements�and�conventions�about�GHG�emissions�standard�is�studied,�through�which�knowledge�is�gained�about�the�allocation�of�emission�credits.�
(2)�The�overall�level�of�emissions�in�the�domestic�shipping�industry�and�in�China�is�analyzed.�Moreover,�we�explore�what�role�shipping�companies�would�play�in�China�in�the�GHG�emissions�trading�market.�
(3)�Measurement�indicators,�such�as�EEOI�(Energy�Efficiency�Operational�Index)�are�discussed�to�have�a�quantitative�analysis�on�greenhouse�gas�emissions,�indicating�our�capability�to�win�profits�from�GHG�emissions�trade.�
(4)�Current�solutions�to�reduce�GHG�emissions�are�studied�like�improvement�of�engines�and�hull,�grease�brushing,�slow�steaming�sailing,�fuel�consumption�saving,�minimizing�waiting�time�when�loading�and�unloading�containers.�In�addition,�other�feasible�solutions�are�discussed�on�this�basis�for�future�application.�
(5)�The�CDM�(Clean�Development�Mechanism)�projects�which�are�carried�out�in�the�current�market�situation�are�studied,�including�foresting�projects�in�Guangxi,�hydropower�projects,�so�as�to�offer�suggestions�for�Chinese�shipping�enterprises�when�investing�in�CDM�projects.�Besides,�the�GHG�emissions�trading�market�is�introduced�for�a�better�understanding�of�the�existing�carbon�trading�scheme�and�its�future�developing�trends.�
1.2�Research�Procedures�(1)�Information�Collection�
�
SANTIAGO�DE�CHILE,�THE�25th�–�28th�of�OCTOBER�2011�–�www.iame2011.org�
Regarding�research�methodology,�we�first�focus�on�collection�of�information.�Through�a�relevant�literature�review,�including�the�review�of�"Kyoto�Protocol",�"Copenhagen�agreement",�etc.�and�the�information�on�the�internet,�the�policies�carried�out�by�the�government�and�the�Carbon�trace�tracking�devices�in�all�countries�should�be�acknowledged.�
(2)�Survey�to�Enterprises��
Survey�of�targeted�shipping�companies�and�related�institutions�are�carried�out�to�understand�the�level�of�Chinese�carbon�emissions,�current�corresponding�actions�of�shipping�companies�and�future�development�in�GHG�emissions�trade.�
(3)�Mathematical�Modelling�
Some�alternative�Carbon�Trading�Programs�are�analyzed�by�applying�mathematical�modelling,�using�an�integrated�method�to�estimate�their�cost,�cost���benefit�analysis�to�examine�their�feasibility�thus�finding�out�the�most�reasonable�program.�
2 GHG and GHG Emissions Trading
�GHG�means�those�gases�that�can�absorb�solar�radiation�reflected�from�the�ground,�and�re�release�the�radiation,�such�as�water�vapor,�carbon�dioxide�and�most�of�the�refrigerants.�They�can�make�the�earth's�surface�warmer,�similar�to�the�greenhouse’s�interception�of�solar�radiation,�then�heat�the�air�inside�the�greenhouse.�This�kind�of�effect�is�called�"greenhouse�effect."�
Currently�GHG�mainly�include�water�vapor�(H2O),�ozone�(O3),�carbon�dioxide�(CO2),�nitrous�oxide�(N2O),�methane�(CH4),�hydrogen�CFCs�class�(CFCs,�HFCs,�HCFCs),�perfluorocarbons�(PFCs)�and�sulfur�hexafluoride�(SF6),etc.�[1]�As�carbon�dioxide�account�for�the�largest�proportion�in�GHG,�it�gives�the�largest�contribution�to�global�warming,�for�about�55%�[1].�Nowadays�carbon�dioxide�is�usually�regarded�as�the�research�objective�in�the�international�study�of�GHG,�and�other�GHGs�are�converted�to�carbon�dioxide�equivalents.�
2.1�IMO�Regulations�and�International�Conventions�on�GHG�Emissions�in�the�Shipping�Industry�The�United�Nations�Intergovernmental�Negotiating�Committee�has�reached�an�agreement�on�UNFCCC�on�May�22,�1992�and�approved�in�the�Environment�and�Development�Conference��held�in�Rio�de�Janeiro�on�June�4,�1992.�
The�goal�of�the�UNFCCC�is�to�reduce�GHG�emissions,�thus�reducing�human�activities’�damage�to�the�climate�system,�mitigate�the�climate�change,�thus�enhancing�ecosystem�resilience�to�climate�change�and�ensuring�food�production�and�sustainable�economic�development.��
The�3rd�session�within�the�Parties�of�UNFCCC�was�held�in�Kyoto,�Japan�on�December�11,�1997.�Representatives�from�149�countries�and�regions�adopted�the�"Kyoto�Protocol"�and�took�effect�on�February�16,�2005,�requiring�developed�countries�to�take�the�obligations�from�2005�while�developing�countries�from�2012.�[2]�

�
SANTIAGO�DE�CHILE,�THE�25th�–�28th�of�OCTOBER�2011�–�www.iame2011.org�
In�1997�the�IMO�adopted�a�new�protocol�of�The�International�Convention�for�the�Prevention�of�Pollution�from�Ships�(MARPOL),�namely,�prevention�of�air�pollution�(Annex�VI).�It�has�taken�effect�on�May�19,�2005�and�its�main�purpose�was�to�limit�the�emissions�of�Ozone,�sulfur�oxides,�nitrogen�oxides,�hydrocarbons�and�particulate�matters,�etc.�[3]�As�the�emissions�of�CO2�account�only�2.7%�of�total�GHG�emissions,�the�IMO�did�not�consider�it�an�urgent�task�limiting�its�emissions.�
With�the�climate�issues�becoming�severe,�countries�listed�in�Annex�I�of�"Kyoto�Protocol",�EU�and�some�developed�countries�began�to�put�pressure�on�the�IMO�to�take�the�issue�of�reducing�emissions�on�to�its�agenda.�However,�in�shipping�practice,�it�is�always�difficult�to�allocate�the�responsibilities�and�emissions�regions�[4].�And�in�the�recent�two�years,�the�IMO�has�been�trying�to�reach�a�breakthrough�in�standardizing�CO2�emissions.�
In�April�2008,�all�parties�discussed�and�reached�an�agreement�on�the�principles�to�regulate�the�GHG�emissions�in�the�shipping�industry�in�the�57th�session�of�the�MPEC:�1)�It�should�effectively�reduce�GHG�emissions�on�the�global�basis;�2)�It�should�be�compulsorily�and�equally�applied�to�all�flag�States;�3)�The�reduction�measures�should�be�based�on�the�cost��benefit�analysis;�4)�It�should�at�least�make�the�minimum�distortion�of�competition;�5)�It�should�be�a�sustainable�development�to�the�environment�without�compromising�the�development�of�global�trade;�6)�It�should�be�a�target�oriented�approach,�not�just�providing�a�certain�method;�7)�It�should�stimulate�technological�innovation,�research�and�development�in�the�shipping�industry;�8)It�should�consider�advanced�technology;�9)�It�should�be�practical,�transparent,�fraud�free�and�easy�to�be�supervised.�[5]�
In�the�58th�session�of�the�MEPC�in�October�2008,�the�principled�consensus�on�the�regulatory�of�GHG�emissions�was�approved,�which�was�pointed�out�in�paragraph�2�in�that�the�mandatory�emissions�reduction�was�equally�applicable�to�all�flag�States.�[6]��
In�the�59th�session�of�the�MEPC�in�July�2009,�the�"EEDI�Calculation�Provisional�Guidance,"�"EEDI�Voluntary�Certification�Interim�Guidance,"�"Ship�of�Energy�Efficiency�Management�Plan�(SEEMP)"�and�"Guidelines�to�EEOI�Voluntary�Use"�were�adopted.�
In�the�60th�session�of�the�MEPC�in�March�2010,�the�guidelines�to�EEOI�voluntary�use�were�further�promoted,�applied�to�ships�of�different�sizes,�including�unconventionally�designed�ships�and�ships�not�using�the�existing�exponential�equation�in�propulsion�systems.�By�far,�GHG�emissions�reduction�has�become�an�inevitable�responsibility�to�Chinese�shipping�companies.�
2.2�GHG�Emissions�Trading�Scheme�
2.2.1�Definition�of�GHG�Emissions�Trading��With�the�Kyoto�Protocol�coming�into�force�in�2005,�Annex�I�listed�countries�have�to�face�the�obligations�to�reduce�emissions�by�5.2%�[7]�compared�with�that�in�1990�during�the�period�2008�to�2012.�In�the�specific�implementation�process,�emissions�quota�will�be�allocated�to�enterprises.�If�they�surpass�the�quota,�they�have�to�face�with�a�high�fiscal�penalty�and�be�deducted�the�corresponding�amount�of�emissions�quota�next�year.�The�“Kyoto�Protocol"�regulated�that�countries�can�exchange�extra�quota�through�GHG�emissions�trade�to�meet�the�standard,�which�is�called�the�GHG�emissions�trading�scheme,�thus�shaping�the�market�mechanism.�

�
SANTIAGO�DE�CHILE,�THE�25th�–�28th�of�OCTOBER�2011�–�www.iame2011.org�
2.2.2�Carbon�Trading�Mechanism��The�overall�carbon�market�is�divided�into�quota�trading�market�and�voluntary�market.�Quota�trading�market�provides�emissions�trading�places�for�developed�countries�to�complete�its�obligations.�While�the�voluntary�market�is�available�for�countries�or�enterprises�to�carry�out�the�voluntary�carbon�trading�to�take�responsibilities�regarding�protecting�environment,�to�cumulate�brand�reputation,�to�accomplish�social�responsibilities�and�economic�benefits.�
(1)�Quota�Trading�Market�
Carbon�quota�traded�in�such�market�is�bound�by�law�or�agreement.�"Kyoto�Protocol"�provides�three�types�of�market�mechanisms�to�promote�the�trade.�They�are,�Emissions�Trading�(ET),�Joint�Implementation�(JI)�and�CDM.�
According�to�Article�XVII�of�"Kyoto�Protocol",�ET�refers�to�the�trading�among�national�registries�in�Annex�I�countries,�including�the�transfer�or�acquisition�of�"emission�reduction�unit",�"emission�reduction�warrants�",�"assigned�amount�Units�"(AAUs),"�removal�units�"(�RMUs),etc.�
According�to�Article�VII�of�"Kyoto�Protocol",�JI�refers�to�the�exchange�of�"emissions�reduction�units�"(ERU)�among�Annex�I�countries�under�the�supervision�of�Supervisory�Committee.�
Under�the�Article�XII�of�"Kyoto�Protocol",�CDM�regulated�the�trade�between�Annex�I�countries�and�non�Annex�I�countries�in�CDM�Registry.�The�purpose�is�to�let�non�Annex�I�countries�reduce�the�emissions�under�the�premise�of�sustainable�development�and�Annex�I�countries�get�"certified�emission�reductions"�(CERs)�to�reduce�the�costs�of�implementing�the�commitment�of�UNFCCC.�[7]�
(2)�Voluntary�Market�
Voluntary�trade�includes�personal�or�business�specific�activities�to�compensate�their�GHG�emissions,�mainly�out�of�marketing,�environmental�responsibility,�brand�building.�Voluntary�transactions�not�only�take�place�in�exchanges,�but�also�over�the�counter.�As�there�are�no�laws�or�regulations,�OTC�transactions�usually�cost�low�and�provide�a�wider�variety�of�trades,�including�the�Verified�Emission�Reductions�(VERS),�Unverified�Emission�Reductions�(NER)�and�Prospective�Emission�Reduction�(PR)�and�so�on.�
2.2.3�Main�Trading�Markets�(1)International�Exchanges��
Up�to�2010,�there�were�four�international�GHG�emissions�trading�exchanges�in�the�world,�i.e.,�European�Union�Greenhouse�Gas�Emission�Trading�Scheme�(EU�ETS),�UK�Emissions�Trading�Group�(ETG),�Chicago�Climate�Exchange�(CCX),�National�Trust�of�Australia�(NSW)�[8],�etc.�
EU�ETS�was�a�framework�for�reducing�emissions�founded�by�the�EU�on�October�25,�2003.�It�is�a�multi�national�GHG�emissions�trading�system�with�the�most�participation�countries,�primarily�in�the�areas�of�high�energy�intensive�heavy�industry�sectors,�including�energy,�mining,�smelting,�steel,�cement,�glass,�paper�and�other�industries.�
CCX�is�the�world's�first�platform�for�voluntary�emissions�trading.�It�has�about�300�member�companies,�concerning�aviation,�electricity,�environment,�automobile�transportation,�energy�and�

�
SANTIAGO�DE�CHILE,�THE�25th�–�28th�of�OCTOBER�2011�–�www.iame2011.org�
other�areas.�Five�of�the�member�companies�are�from�China.�And�its�trading�products�include�CO2,�CH4,�N2O,�NFCs,�PFCs,�SF6,�etc.�
As�for�the�four�exchanges,�the�US�and�Australia�are�not�"Kyoto�Protocol"�member�states,�therefore,�only�the�EU�ETS�and�the�ETG�are�truly�international�exchanges.�In�addition�to�the�above�four�exchanges,�there�are�other�small�scale�but�fast�growing�markets.�For�example,�Regional�Greenhouse�Gas�Initiative�(RGGI)�in�East�America�aims�to�maintain�the�level�of�emissions�during�2009�to�2014�as�the�current�level,�and�to�cut�the�emissions�during�2015�to�2018�by�10%�compared�with�that�in�2009.�[9]�There�is�also�New�South�Wales�GHG�emissions�trading�system�which�was�officially�launched�in�January�2003�and�Canada's�first�CO2�emission�quota�trading�market:�the�Montreal�Climate�Exchange.��
Moreover,�in�Asian,�Hong�Kong�HK�Exchange�is�preparing�for�a�GHG�emissions�trading�floor.�Also�another�20�exchanges�including�BlueNext�Exchange�in�France,�ACX�CHANGE,�and�the�European�Energy�Exchange�are�all�operating�in�different�business�modes.�
(2)�Exchanges�in�Mainland�China��
There�are�also�several�Exchanges�in�China,�such�as�Wuhan�Optics�Valley�United�Assets�and�Equity�Exchange,�Changsha�Environmental�Resource�Exchange,�Tianjin,�Shanghai,�Beijing�Environment�Exchange.�Xiamen�is�also�planning�to�launch�an�international�exchange�in�the�coming�years.�However,�lacking�of�relevant�laws�and�supporting�measures,�there’s�not�a�single�regulation�carried�out�by�China�to�standardize�the�voluntary�trading�market�and�audit�the�carbon�trading�transaction�system.�Because�of�this,�China�always�stays�in�an�unfavourable�situation�when�doing�transactions�in�the�international�exchanges�
Along�with�Copenhagen�2009,�China�Beijing�Environment�Exchange�launched�the�so�called�"Panda�Standard",�which�is�regarded�as�the�first�voluntary�emission�reduction�standard�of�China.�While�no�specific�measures�were�announced,�the�"Panda�standard"�established�voluntary�emission�reduction�standards�and�testing�principles�and�provisions�of�the�voluntary�emission�reduction�processes,�assessment�bodies,�and�such�rules�limit�the�content�to�improve�China's�carbon�emissions�trading�market�mechanisms.�The�introduction�of�this�standard�also�indicates�that�China's�carbon�exchange�in�a�more�standardized�step�on�the�road,�but�also�for�the�future�implementation�of�China's�carbon�trading�mechanism�to�provide�favourable�conditions.���
Moreover,�in�order�to�obtain�favourable�position�during�negotiation�in�the�future�international�GHG�emission�trading�market,�China�has�carried�out�the�first�voluntary�emissions�standard�set�by�China:�the�"Panda�standard"�in�Copenhagen�Conference,�which�indicates�that�the�GHG�emissions�trading�will�become�more�standardized�and�more�initiative�in�China.�The�"Panda�Standard"�Version�1.0�was�drafted�by�four�organizations,�Beijing�Environment�Exchange�and�the�BlueNext�Environmental�Exchange�as�the�initiator,�and�the�Chinese�forest�rights�organization�exchanges�and�Winrock�International�Agricultural�Development�Center�as�the�co�sponsors.[10]�It�is�learnt�that�"Panda�standard"�is�to�establish�a�standard�for�voluntary�emissions�reduction�processes,�assessment�institutions,�etc.�
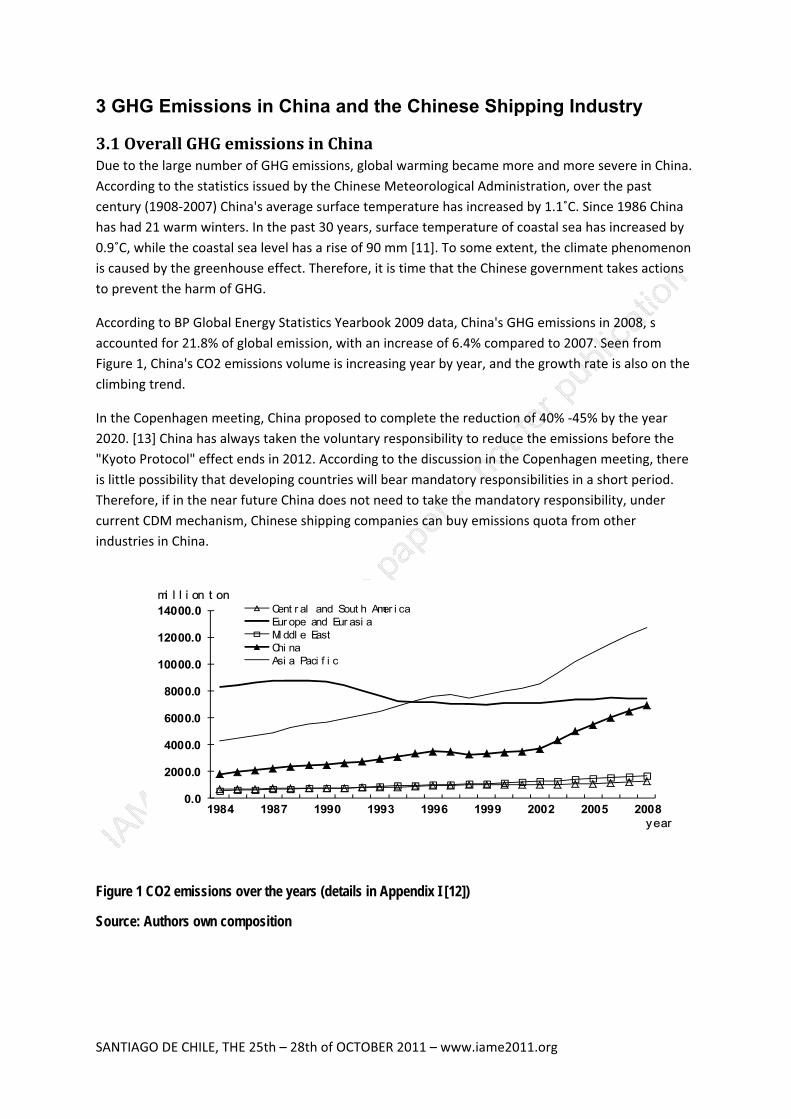
�
SANTIAGO�DE�CHILE,�THE�25th�–�28th�of�OCTOBER�2011�–�www.iame2011.org�
3 GHG Emissions in China and the Chinese Shipping Industry
3.1�Overall�GHG�emissions�in�China�Due�to�the�large�number�of�GHG�emissions,�global�warming�became�more�and�more�severe�in�China.�According�to�the�statistics�issued�by�the�Chinese�Meteorological�Administration,�over�the�past�century�(1908�2007)�China's�average�surface�temperature�has�increased�by�1.1�C.�Since�1986�China�has�had�21�warm�winters.�In�the�past�30�years,�surface�temperature�of�coastal�sea�has�increased�by�0.9�C,�while�the�coastal�sea�level�has�a�rise�of�90�mm�[11].�To�some�extent,�the�climate�phenomenon�is�caused�by�the�greenhouse�effect.�Therefore,�it�is�time�that�the�Chinese�government�takes�actions�to�prevent�the�harm�of�GHG.��
According�to�BP�Global�Energy�Statistics�Yearbook�2009�data,�China's�GHG�emissions�in�2008,�s�accounted�for�21.8%�of�global�emission,�with�an�increase�of�6.4%�compared�to�2007.�Seen�from�Figure�1,�China's�CO2�emissions�volume�is�increasing�year�by�year,�and�the�growth�rate�is�also�on�the�climbing�trend.�
In�the�Copenhagen�meeting,�China�proposed�to�complete�the�reduction�of�40%��45%�by�the�year�2020.�[13]�China�has�always�taken�the�voluntary�responsibility�to�reduce�the�emissions�before�the�"Kyoto�Protocol"�effect�ends�in�2012.�According�to�the�discussion�in�the�Copenhagen�meeting,�there�is�little�possibility�that�developing�countries�will�bear�mandatory�responsibilities�in�a�short�period.�Therefore,�if�in�the�near�future�China�does�not�need�to�take�the�mandatory�responsibility,�under�current�CDM�mechanism,�Chinese�shipping�companies�can�buy�emissions�quota�from�other�industries�in�China.�
0.0
2000.0
4000.0
6000.0
8000.0
10000.0
12000.0
14000.0
1984 1987 1990 1993 1996 1999 2002 2005 2008
Figure 1 CO2 emissions over the years (details in Appendix I [12])
Source: Authors own composition
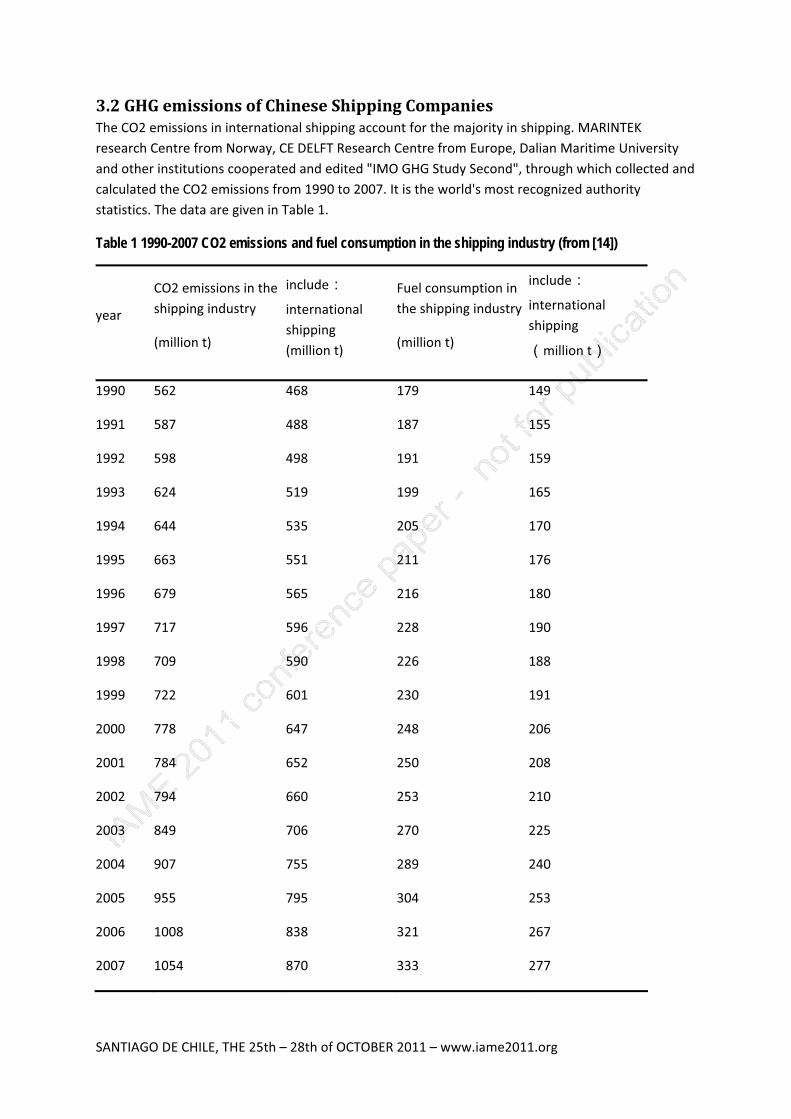
�
SANTIAGO�DE�CHILE,�THE�25th�–�28th�of�OCTOBER�2011�–�www.iame2011.org�
3.2�GHG�emissions�of�Chinese�Shipping�Companies�The�CO2�emissions�in�international�shipping�account�for�the�majority�in�shipping.�MARINTEK�research�Centre�from�Norway,�CE�DELFT�Research�Centre�from�Europe,�Dalian�Maritime�University�and�other�institutions�cooperated�and�edited�"IMO�GHG�Study�Second",�through�which�collected�and�calculated�the�CO2�emissions�from�1990�to�2007.�It�is�the�world's�most�recognized�authority�statistics.�The�data�are�given�in�Table�1.�
Table 1 1990-2007 CO2 emissions and fuel consumption in the shipping industry (from [14])
year�
CO2�emissions�in�the�shipping�industry�
(million�t)�
include
international�shipping�(million�t)�
Fuel�consumption�in�the�shipping�industry
(million�t)�
include
international�shipping�
million�t �
1990� 562� 468� 179� 149�
1991� 587� 488� 187� 155�
1992� 598� 498� 191� 159�
1993� 624� 519� 199� 165�
1994� 644� 535� 205� 170�
1995� 663� 551� 211� 176�
1996� 679� 565� 216� 180�
1997� 717� 596� 228� 190�
1998� 709� 590� 226� 188�
1999� 722� 601� 230� 191�
2000� 778� 647� 248� 206�
2001� 784� 652� 250� 208�
2002� 794� 660� 253� 210�
2003� 849� 706� 270� 225�
2004� 907� 755� 289� 240�
2005� 955� 795� 304� 253�
2006� 1008� 838� 321� 267�
2007� 1054� 870� 333� 277�

�
SANTIAGO�DE�CHILE,�THE�25th�–�28th�of�OCTOBER�2011�–�www.iame2011.org�
�
Figure�2�1990�2007�CO2�emissions�in�the�shipping�industry�
<Heading�3>�
<Heading�3>�
<Heading�3>��
According�to�the�data�above,�in�2007,�CO2�emissions�from�the�shipping�industry�accounted�for�about�3.3%�of�the�global�CO2�emissions.�And�international�shipping�emissions�account�for�2.7%�of�total�emissions.�According�to�the�forecast�in�this�literature,�if�there’s�not�any�reduction�measures�taken,�by�2050,�the�international�shipping�emissions�will�grow�by�2.4�3.0%,�account�for�about�6%�of�overall�emissions.�[14]�
The�European�Committee�(EC)�issued�that�it�will�create�a�regional�shipping�system�to�regulate�CO2�emissions�if�the�IMO�continues�not�to�take�actions.�[4]�In�any�case,�the�IMO�is�facing�great�pressure�to�reduce�emissions.�
In�the�58th�convention�of�the�MEPC,�the�IMO�has�already�reached�a�consensus�that�mandatory�responsibility�should�be�equally�allocated�to�all�ships,�but�the�detailed�allocation�is�still�in�discussion,�hoping�to�differentiate�the�responsibility�between�developed�and�developing�countries�though�schemes�like�carbon�taxes�and�emissions�trading.�While�up�to�the�60th�convention�of�MPEC,�it�is�still�a�deadlock.�
Although�the�emissions�of�in�the�shipping�industry�account�for�a�small�portion�of�the�overall�emissions,�the�growth�rate�is�high.�As�China's�total�emissions�are�exceedingly�large,�in�accordance,�the�emissions�in�the�Chinese�shipping�industry�are�also�very�large.�Once�taken�a�mandatory�responsibility,�Chinese�shipping�companies�must�face�severe�pressures.�
�
0
200
400
600
800
1000
1200
1990 1992 1994 1996 1998 2000 2002 2004 2006
CO2 emissions in shipping industry
CO2 emissions in international shipping
�
SANTIAGO�DE�CHILE,�THE�25th�–�28th�of�OCTOBER�2011�–�www.iame2011.org�
4 Difficulties of Chinese Shipping Companies Implementing GHG Emissions Trading
4.1�Forecast�of�Future�Emissions�Reduction�Policies��In�recent�years,�the�IMO�has�discussed�the�guidelines�of�GHG�emissions�reduction,�looking�for�a�consensus�of�GHG�emission�reduction�mechanism�in�the�industry.�According�to�the�recent�discussion,�there�are�several�options�as�follows:�
(1)�Market�based�instruments�(MBI)��
a)�Levying�Marine�fuel�tax,�which�is�raised�by�Denmark,�is�the�simplest�and�most�detailed�program�of�MBI,�but�there�are�still�many�controversial�issues,�such�as�who�will�manage�the�fund,�how�much�fuel�tax�should�be�levied,�whether�the�fuel�tax�levied�should�be�spent�on�CDM�projects,�etc.�
b)�Emissions�trading,�which�has�strong�support�of�the�EC,�EU�governments�and�some�industry�groups,�is�considered�as�the�most�appropriate�option�of�MBI.�While�there�is�not�a�single�standard�operational�process,�it�still�remains�controversial.�
c)�Other�programs�
There�are�other�programs,�such�as�levying�less�fuel�tax�if�the�ship�formula�is�optimized,�but�there�are�also�objections�that�it�will�be�easier�for�old�ships�to�reduce�fuel�duty.��
The�United�States�raised�a�program�that�can�trade�EEDI�index�between�efficient�hull�and�low�efficient�hull,�instead�of�carbon�emissions�trading.�But�there�is�no�clear�standard�for�ship�coefficient,�especially�"which�kind�of�ship�is�below�the�standard".�[15]��
Among�MBI,�GHG�emissions�trading�scheme,�despite�many�disputes,�shares�the�most�support�and�is�considered�the�most�suitable�option.��
�(2)�Technical�Program��
The�IMO�has�encouraged�the�voluntary�use�of�parameters�such�as�EEDI�to�optimize�the�design�of�new�ships.�Fuel�consumption�can�be�reduced�by�20��30%�through�such�method,�thus�saving�the�fuel�cost.�
However,�this�method�also�has�some�limitations.�For�example,�for�a�number�of�existing�vessels,�it�costs�too�much�to�achieve�the�optimization.�In�addition,�with�the�"NOx�Technical�Code"�coming�into�effect,�many�of�the�existing�ship�engines’�efficiencies�have�been�improved�[16],�it�is�difficult�to�be�further�improved.�
�(3)�Operating�Program�
Operating�program�refers�to�the�emissions�reduction�through�the�means�of�using�shore�power,�slowing�down,�making�use�of�large�ships,�etc.�However,�the�effect�is�not�that�significant�as�that�of�the�other�two�programs�because�it�will�affect�normal�operation�of�shipping�companies.�
According�to�the�"Discussion�Paper�of�GHG"�by�the�World�Shipping�Council�(WSC),�Copenhagen�Conference�might�not�overturn�the�current�agreement�on�controlling�emissions;�instead,�it�only�
�
SANTIAGO�DE�CHILE,�THE�25th�–�28th�of�OCTOBER�2011�–�www.iame2011.org�
further�regulates�the�existing�agreement.�The�shipping�industry�is�now�concerned�about�what�rules�it�will�carry�out,�such�as:�1)�whether�it�will�reach�a�consensus�reduction�target,�2)�whether�it�will�levy�carbon�tax�to�establish�the�UNFCCC�funds,�3)�whether�a�cross�regional�emissions�trading�will�be�shaped.�[15]�
Once�a�consensus�is�reached,�the�solutions�will�be�introduced�no�later�than�2011.�Most�likely�the�solution�will�be�a�combination�of�several�programs.�
4.2�Present�Disputes�and�Difficulties�of�International�GHG�Emissions�Trading��Among�various�programs�of�MBI,�there�is�one�about�GHG�emissions�trading,�which�still�remains�controversial�and�cannot�be�approved.�
There�exist�difficulties�and�stress�to�implement�GHG�emissions�trading�with�a�uniform�standard�and�the�controversies�are�predicted�in�the�following�subsections.�
4.2.1�Allocation�of�Emissions�Quota�and�the�Setup�of�Emissions�Baseline�It�is�difficult�to�determine�emissions�reduction�credits;�even�if�determined,�there�are�still�problems�to�remain,�such�as�how�emission�credits�will�be�allocated?�Whether�it�should�be�for�free?�Who�should�do�the�distribution?�What�criteria�should�be�taken?��
Another�important�problem�is�determining�the�emissions�baseline.�However,�as�developed�countries�have�emitted�a�lot�of�carbon�dioxide�in�the�previous�stage�of�development,�which�developing�countries�have�not�experienced,�it�will�be�unfair�using�the�same�baseline�to�limit�emissions.�
4.2.2�Allocation�of�Obligations�Whether�the�obligations�should�be�allocated�to�ship�owners�or�operators�remains�controversial,�as�the�two�sides�have�quite�close�relationship.�
It�was�suggested�that�the�obligations�can�be�distinguished�by�registration�country�or�flag�State,�but�it�is�easy�to�shirk�obligations�by�changing�flags.�
There�are�also�views�to�distinguish�obligations�according�to�the�destination�of�the�voyage�to�achieve�"common�but�differentiated�obligations."�But�there�is�a�problem�for�liner�shipping,�because�the�liner�is�not�a�point�to�point�transport�and�it�is�hard�to�determine�the�responsibility�of�intermediate�or�transhipment�ports.�
4.2.3�Completion�of�Emissions�Reduction�and�Punitive�Measures��The�IMO�should�take�the�audit�of�completion�of�emissions�reduction�into�account,�whether�audit�it�by�fuel�consumption�or�by�other�means.�If�monitored�by�fuel�consumption,�it�will�come�across�the�problem�of�inter�regional�audit.�
Meanwhile,�if�ships�cannot�meet�the�target,�whether�to�give�a�fiscal�penalty�is�also�a�problem.�Assuming�that�giving�a�fiscal�punishment,�then�how�to�set�up�the�amount?�And�who�is�going�to�keep�that�account?�
4.2.4�Transaction�Mode�Even�if�the�above�problems�have�been�solved�and�it�comes�to�GHG�emissions�trade,�there�would�inevitably�be�the�following�problems�encountered.��
�
SANTIAGO�DE�CHILE,�THE�25th�–�28th�of�OCTOBER�2011�–�www.iame2011.org�
Where�can�the�trade�take�place�and�how�to�set�the�price,�whether�it�should�be�fixed�or�unfixed?�What�should�be�the�transaction�mode?�Should�they�trade�by�annual�quota�or�several�year�quota?�Should�there�be�a�limit�to�the�trading�quota?�Is�there�a�regulation�that�is�only�part�of�the�companies�that�can�take�part�in�the�transaction?��
Most�of�the�participating�countries�supported�that�the�shipping�industry�can�buy�emissions�quota�from�other�industries,�while�the�precondition�is�that�there�exists�a�global�trading�system.�However,�the�difficulty�lies�in�who�is�going�to�set�up�such�a�system,�the�governments�or�the�UN?�Even�if�the�system�is�set�up,�how�to�guarantee�that�it�is�in�consensus�with�the�Copenhagen�agreement?�
Also,�how�to�ensure�the�enforcement�of�GHG�emissions�trading�is�a�difficulty.�It�is�easy�to�shirk�responsibility�if�there�is�no�clear�cut�punishment.�
All�the�above�aspects�are�still�in�discussion,�and�they�are�questions�that�cannot�be�solved�within�a�short�period.�Currently�we�can�only�wait�for�the�policies�carried�out�by�the�IMO,�predicting�and�doing�early�preparation�for�these�policies.�
5 Corresponding Programs of GHG Emissions Trading
5.1�Mathematical�Modelling�In�the�following�we�introduce�several�sets�of�programs�for�Chinese�shipping�companies’�reference�in�the�future�emissions�trading,�and�compare�them�with�operating�and�technical�programs�to�judge�whether�they�are�economical�and�practical.�A�comprehensive�estimation�method�is�used�to�calculate�the�cost�of�the�following�programs.�
The�comprehensive�estimation�method�includes�three�basic�components:��
A.�Work�Breakdown�Structure�(WBS).�WBS�is�a�clear�definition�of�the�work�elements�in�a�project�and�the�relationship�between�them.�And�the�cost�and�revenue�of�the�project�is�estimated�through�WBS.�
B.�Cost�and�revenue�classification.�In�order�to�estimate�the�cash�flow�of�all�levels�in�WBS,�there�is�a�classification�of�costs�and�revenues.�
C.�Estimation.�Mathematical�models�are�selected�to�estimate�the�costs�and�revenue�during�the�research�period.�[18]��
The�WBS�chart�is�shown�in�Figure�3.�

�
SANTIAGO�DE�CHILE,�THE�25th�–�28th�of�OCTOBER�2011�–�www.iame2011.org�
�
Figure 3: WBS Chart of Emissions Reduction Program
�
5.2�Emissions�Reduction�Examples�The�corresponding�actions�are�divided�to�two�programs,�self�reduction�program�and�emissions�trading�program.�And�emissions�trading�can�be�inside�and�outside�the�industry.�And�there�will�be�a�cost���benefit�analysis�between�the�two�programs�to�state�the�feasibility�of�emissions�trading.�
5.2.1�Self�reduction�Program�According�to�a�survey,�Chinese�shipping�companies�now�have�their�own�way�in�the�implementation�of�emissions�reduction,�among�which�the�"Ship�Adding�and�Slow�Steaming�Sailing"�is�the�most�economic�and�commonly�used�temporary�solution�as�it�can�also�deploy�the�extra�capacity�on�the�market.��
Figure�4�is�the�cost�benefit�analysis�of�various�international�shipping�routes�when�adding�one�ship�and�two�ships.�The�calculated�operating�costs�and�carbon�emissions�scatter.�When�adding�one�ship,�the�speed�will�be�decreased�by�about�3�and�when�adding�two�ships,�the�speed�will�be�decreased�by�about�6,�so�the�cost�saving�equals�(annual�fuel�cost�saved�–�annual�fixed�cost�increased).�

�
SANTIAGO�DE�CHILE,�THE�25th�–�28th�of�OCTOBER�2011�–�www.iame2011.org�
�500
0
500
1000
1500
2000
2500
3000
3500
0 5000 10000 15000 20000 25000 30000 35000 40
annual�cost�saved(ten�
thousand�yuan)
annual emissions re
one�ship�added
two�ships�added
�
Figure 4: Cost-benefit analysis of slow-steaming sailing solution in various routes of international shipping
(Source:�survey�to�shipping�companies)�
5.2.2�Trade�inside�the�Industry�(1)�Transactions�among�shipping�companies�of�different�countries�
If�the�audit�of�the�emissions�reduction�implementation�is�differentiated�in�different�countries,�then�developed�countries�will�take�more�responsibilities�and�there�is�a�possibility�to�have�transactions�between�developing�and�developed�countries.�
(2)�Transactions�between�different�types�of�shipping�companies��
Operating�under�the�IMO�Energy�Efficiency�Index,�according�to�the�following�equations:�
�
�
Where:��
i���fuel�type;��
FCi���ship�sailing�in�the�total�consumption�of�fuel�i,�unit:�t;��
CFi���CO2�emission�factor,�refers�to�consumption�of�1�ton�per�fuel�i�CO2�emissions�quality,�unit:�t�(CO2)�/�t�(fuel);��
mcargo���cargo�capacity,�unit:�t,�TEU,�or�people�(for�passenger�ships),�as�the�case�may�determine;��
D���navigation�mileage,�that�ships�in�the�transport�operation�in�the�actual�sailing�distance,�unit:�nm.��

�
SANTIAGO�DE�CHILE,�THE�25th�–�28th�of�OCTOBER�2011�–�www.iame2011.org�
EEOI�units�need�to�be�determined�by�goods�species,�can�be:�t�/�t�•�nm,�t�/�TEU�•�nm,�t�/�person�•�nm,�etc.��
The�smaller�EEOI�value�is,�the�higher�the�energy�efficiency�of�the�ship�is.��
According�to�"Index�of�ships�operating�efficiency,"�selecting�normal�operating�status�for�a�variety�of�ships�(assuming�the�standard�container�ship�operating�status:�Vs0�=�22kn,�D0�=�6000nm,�R0�=�70%,�tp0�=�96h;�tanker�standard�operating�status�:�Vs0�=�12kn,�D0�=�6000nm,�R0�=�70%,�tp0�=�96h;�bulk�carrier�standard�operating�status:�Vs0�=�12kn,�D0�=�6000nm,�R0�=�70%,�tp0�=�96h),�get�the�result�of�typical�ship�EEOI�index�as�follows:�
Table 2 Typical Ship EEOI index
Source:�Reference�[20]�
Dwt(t)�Container�Ships�
Bulks� Oil�Tanks�
15563� � 16.36� �
29049� � 11.41� �
34748� � � 8.48�
38521� � 5.89� �
41983� � � 7.43�
45541� � � 7.34�
50137� 18.92� � �
52242� 17.84� � �
57596� � 5.84� �
62127� � � 7.02�
68635� � � 6.04�
69229� 16.57� � �
73937� � 4.15� �
75493� � � 4.86�
98500� 15.09� � �
102453� 14.99� � �
111572� 13.64� � �

�
SANTIAGO�DE�CHILE,�THE�25th�–�28th�of�OCTOBER�2011�–�www.iame2011.org�
Dwt(t)� Container�Ships� Bulks�
15563� � 16.36�
�
The calculation results are as follows:
Figure 6: EEOI index of different types of ships
According�to�the�calculation�results,�in�normal�operation,�container�ships�share�the�most�CO2�while�bulk�cargo�ships�emit�the�least.�Therefore,�it�is�possible�that�different�types�of�shipping�companies�can�have�transactions,�particularly,�subsidiaries�of�some�shipping�companies�can�easily�exchange�emissions�quota�in�internal�coordination.��
Since�whether�the�transaction�is�taken�place�among�shipping�companies�from�different�countries�or�among�different�types�of�shipping�companies,�the�transaction�price�and�scope�can�only�be�fixed�after�the�IMO�has�set�the�emissions�standard.�Therefore,�this�article�will�not�calculate�the�cost�benefit�of�trade�inside�the�industry,�just�clarify�its�possibility.�
5.2.3�Transactions�outside�the�Industry�(1)�Collaboration�with�other�modes�of�transportation�
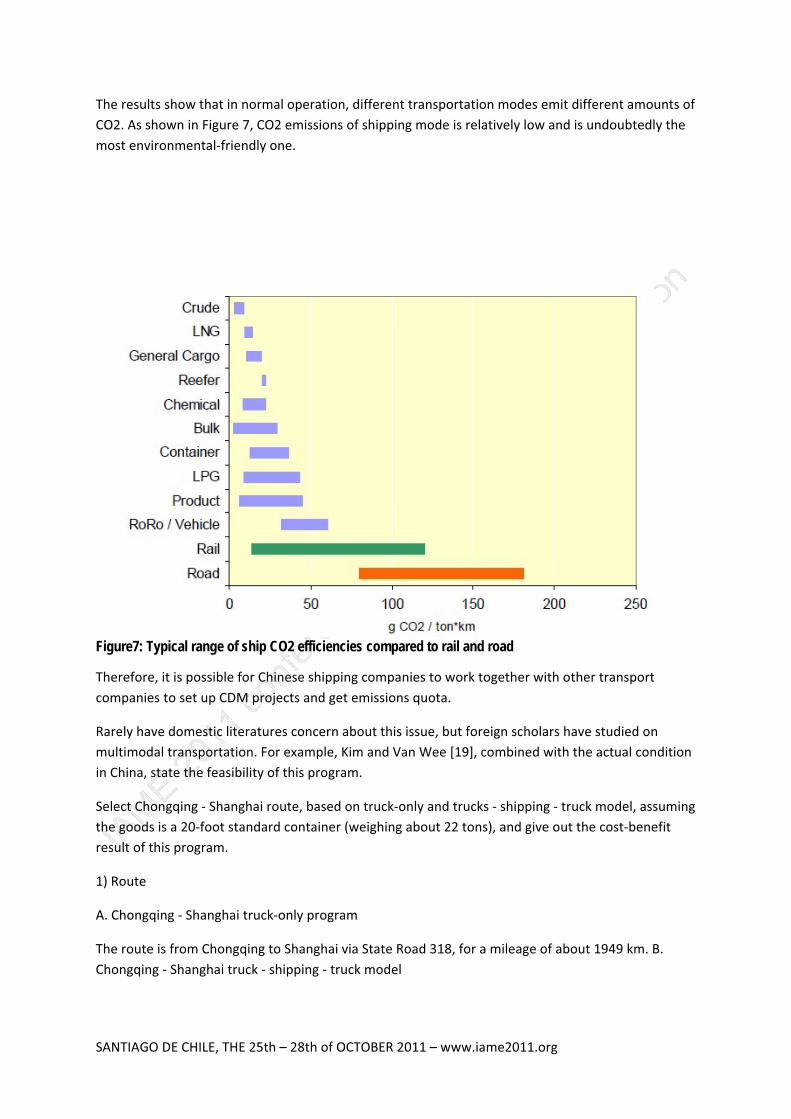
�
SANTIAGO�DE�CHILE,�THE�25th�–�28th�of�OCTOBER�2011�–�www.iame2011.org�
The�results�show�that�in�normal�operation,�different�transportation�modes�emit�different�amounts�of�CO2.�As�shown�in�Figure�7,�CO2�emissions�of�shipping�mode�is�relatively�low�and�is�undoubtedly�the�most�environmental�friendly�one.�
�
�
�
Figure7: Typical range of ship CO2 efficiencies compared to rail and road
Therefore,�it�is�possible�for�Chinese�shipping�companies�to�work�together�with�other�transport�companies�to�set�up�CDM�projects�and�get�emissions�quota.�
Rarely�have�domestic�literatures�concern�about�this�issue,�but�foreign�scholars�have�studied�on�multimodal�transportation.�For�example,�Kim�and�Van�Wee�[19],�combined�with�the�actual�condition�in�China,�state�the�feasibility�of�this�program.��
Select�Chongqing���Shanghai�route,�based�on�truck�only�and�trucks���shipping���truck�model,�assuming�the�goods�is�a�20�foot�standard�container�(weighing�about�22�tons),�and�give�out�the�cost�benefit�result�of�this�program.�
1)�Route�
A.�Chongqing���Shanghai�truck�only�program�
The�route�is�from�Chongqing�to�Shanghai�via�State�Road�318,�for�a�mileage�of�about�1949�km.�B.�Chongqing���Shanghai�truck���shipping���truck�model�

�
SANTIAGO�DE�CHILE,�THE�25th�–�28th�of�OCTOBER�2011�–�www.iame2011.org�
The�sailing�route�from�Chongqing�to�Shanghai�is�along�the�Yangtze�River,�passing�ports�or�cities�including�Yueyang,�Wuhan,�Jiujiang,�Wuhu,�Nanjing,�Zhangjiagang.�The�total�length�of�the�route�is�about�2399�km,�of�which�648�km�is�from�Chongqing�to�Yichang,�626�km�is�from�Yichang�to�Wuhan,�1125�km�is�from�Wuhan�to�Shanghai.�It�is�assumed�that�both�ends�of�trial�are�50�km.�The�basic�parameters�of�these�two�modes�are�assumed�according�to�the�data�of�[19],�listed�in�Table�3.�
Table�3�Basic�parameters�of�two�nodes�
Mode� Energy� Distance km � Average�speed
km/h �
Time�consum
ed h �
Truck�only� Diesel� 1949� 60� 32.5�
Truck�shipping�truck�
Diesel� 2399(Shipping)+10
0 Truck =2499�
20nm/h/ship��60/truck�
66.4�
�
In�2008,�the�cost�of�a�normal�truck�transport�is�10�RMBs�/�km�*�box,�so�the�total�cost�of�truck�transportation�is�10�*�1949�=�19,490�RMBs�/�case.�While�the�multimodal�model�costs�4663�RMBs�/�case,�14,827�RMBs�/�case�cheaper�than�truck�only�mode.�The�specific�cost�is�shown�in�Table�4.�
Table�4�Cost�of�truck�shipping�truck�multi�modal�transportation�
� Item� Cost�
I� Truck�cost������������Yuan/case� 630�
II� Sail�cost� �
1� Chongqing�to�Yichang���Yuan/case� 1126�
2� Yichang�to�Wuhan������Yuan/case� 997�
3� Wuhan�to�Shanghai�����Yuan/case� 1110�
III� Port�fee��������������Yuan/case� 400*2�
Total� � 4663�
�
Emission�Reductions�
Based�on�the�data�of�"Second�IMO�GHG�Study",�calculate�the�emissions�reduction�quota.�Generally,�trucks�emits�90�190�g�CO2�/�t���km,�take�an�average�of�140�g�CO2�/�t���km;�container�ship�emits�7�50�g�CO2�/�t���km,�take�an�average�of�28.5�g�CO2�/�t���km.�
Total�emissions�of�truck�only�mode�=�1949�*�22�*�140�=�6002920�g�=�6�t�CO2,�

�
SANTIAGO�DE�CHILE,�THE�25th�–�28th�of�OCTOBER�2011�–�www.iame2011.org�
Total�emissions�of�truck���Shipping���Truck�mode=�100�*�22�*�140�+2399�*�28.5�*�22�=�1812173�g�=�1.8�t�CO2,�
Compared�to�truck�only�mode,�multimodal�transport�mode�emits�about�4.2�tons�CO2�less.�
Cost�Benefit�Analysis��
Using�the�multimodal�transport�mode�can�not�only�get�a�certain�amount�of�CO2�emissions�quota�but�also�save�the�transportation�cost.�If�Chinese�shipping�companies�take�a�mandatory�emissions�responsibility�in�2011,�then�they�can�work�together�with�logistics�companies�to�realize�the�reduction�and�pay�them�fees�to�get�the�emissions�quota.�The�minimum�cost�=�(transport�loss�of�logistics�company���transport�fees�get�by�shipping�companies)�=�14,827�Yuan�/�box,�the�CO2�emissions�reduction�=�4.2�tons,�that�is�for�1�ton�CO2�emissions�reduction�required�for�about�515�U.S.�expenses.�
According�to�the�above�results,�it�is�possible�to�realize�the�GHG�emissions�trade�through�cooperation�with�logistics�companies�while�there�are�still�some�limitations:��
First�of�all,�this�kind�of�reduction�can�only�be�practiced�in�inland�waterway�shipping�as�international�transportation�rarely�uses�truck�only�mode.�However,�inland�waterway�shipping�emissions�accounted�little�for�the�total�emissions�of�shipping�companies.�Secondly,�because�of�the�geographical�constraints,�it�is�not�easy�to�conduct�multimodal�transport�in�mainland�China.�Lastly,�the�Chinese�political�environment�determines�that�the�China�Ministry�of�Communications,�Ministry�of�Railways�and�shipping�companies�work�separately.�Therefore,�multi�party�negotiations�and�efforts�are�needed�to�achieve�cooperation.�
Investing�in�CDM�Projects�of�Other�Industries�
According�to�data�given�by�the�Chinese�Bureau�of�Statistics,�the�operating�costs�of�various�industries�to�manage�the�waste�each�year�is�listed�below�in�descending�order�(including�carbon�dioxide,�carbon�disulfide,�hydrogen�sulfide,�fluoride,�nitrogen�oxides,�chlorine,�hydrogen�chloride�flower,�carbon�monoxide,�sulfuric�acid�(fog),�lead,�mercury,�beryllium�compounds,�production�of�soot�and�dust);�see�Figure�8.�
�


�
SANTIAGO�DE�CHILE,�THE�25th�–�28th�of�OCTOBER�2011�–�www.iame2011.org�
projects�by�developing�countries,�then�selling�the�CERs�in�the�market;�bilateral�model�means�developing�and�developed�countries�cooperate�and�develop�CDM�projects�or�all�invested�by�developed�countries,�and�developed�countries�get�the�CERs;�multilateral�mode�refers�to�several�developed�countries�to�establish�a�foundation�to�invest�in�the�CDM�projects,�and�the�CERs�are�owned�by�the�Foundation.��
If�in�2011�the�Chinese�shipping�industry�was�given�mandatory�responsibility�to�cut�in�emissions,�then�the�shipping�industry�buy�CERs�in�international�emissions�transactions�or�invest�in�CDM�projects�of�other�industries.�However,�there�is�a�precondition�that�Chinese�shipping�companies�should�spend�less�to�purchase�CERs�from�other�industries�than�reduce�emissions�through�operation�and�technical�programs�so�that�the�investment�is�meaningful.�A�CDM�project�developer,�in�general,�should�bear�the�cost�as�shown�in�Table�5.�
Table : Costs C pro ects
Cost�to�develop�a�CDM�project�
Project�screening�
Develop/select�methodology�and�estimate�the�emissions�reduction��
Prepare�relevant�technical�documents���
Permission�of�the�host,�consultation�from�stakeholders,�environmental�impact�assessment��
CER�purchase�agreement��
DOE�approval�of�the�project�
Registration�fee�
Monitoring�
Verification�and�certification�costs�
Adaptation�costs�(2%�of�the�total�CERs)�
Source: Authors' own composition �
To�further�explain�the�feasibility�of�shipping�enterprises�investing�in�CDM�projects�of�other�industries,�"Hydropower�CDM�Project�case�study"�by�[24]�is�applied�as�follows:�
In�the�hydropower�CDM�project�case,�the�project�can�get�an�electronic�capacity�EGy�=�1.09��105MWh,�based�on�the�emissions�formula,�the�available�emissions�reduction:�ERy�=�EGy��EFy�=�102.95��106kg�(EGy�for�the�electronic�capacity;�EFy�for�the�comprehensive�emission�factor�of�Central�China�Power�Grid)�

�
SANTIAGO�DE�CHILE,�THE�25th�–�28th�of�OCTOBER�2011�–�www.iame2011.org�
The�parameters�for�the�project�are�stated�in�Table�6.�
Table : Parameters of hydropower C pro ects
Source:�Reference�[24]�
Serial� key�parameter� values�
1� An�installed�capacity�/�MW� 35�
2� line�capacity�/�MWh� 93170�
3� Tariff�/�(dollars���kWh�1)� 0.301�
4� years�generating�revenue�/�million�RMB� 2804�
5� project�life�cycle�/�a� 30�
6� unit�price�reductions�(CO2)�/�(dollars���t�1)� 9.5�
7� rate�/�(USD�/�RMB)� 1/7.95�
8� hydropower�industry�benchmark�yield�/%� 8�
Tax���VAT�/%� 17�9�
Tax���surcharge�for�education�/%� 8�
investment�in�fixed�assets�of��/�0,000RMB� 29229.15�10�
Of�which:�Capital�/0,000RMB� 5976.69�
11� operating�costs�/�0,000RMB� 254.8�
12� construction�period�interest�rate�/%� 6.84�
Despite�the�value�added�taxes�and�time�effect,�annual�earnings�of�the�project�=�annual�energy�revenues���(fixed�assets�investment�+�operating�costs)�/�project�life�cycle�=�2804���(29229.15�+254.8)�/�30�=�18.212�million�Yuan,�that�is�when�invest�in�the�project�can�get�the�maximum�profit�of�about�18.212�million�Yuan,�while�get�about�102,950�tons�of�CO2�emissions�reduction,�equivalent�to�a�profit�of�about�26�U.S.�dollars�for1�ton�reduction�per�year.�
This�section�has�listed�several�possible�programs�of�GHG�emissions�trade,�the�cost�benefit�result�of�all�programs�are�shown�in�Table�7.�
Table 7: Cost- benefit of all programs
� Self��
reduction�program�
Trade�inside�the�industry�
Trade�outside�the�industry�(cooperate�
Trade�outside�the�industry�

�
SANTIAGO�DE�CHILE,�THE�25th�–�28th�of�OCTOBER�2011�–�www.iame2011.org�
with�other�logistic�companies)�
(invest�in�CDM�projects�of�other�industries)�
Cost�benefit� Annual�operating�cost�savings�of��34�to�132�U.S.�dollars�per�CO2�emissions�reduction�
No�specific�calculation�
A�pay�for�515$/�carton�operating�cost�per�CO2�emissions�reduction��
Maximum�annual�profit�of�26$�per�CO2�emissions�reduction��
Source: Authors' own composition From�the�economic�point�of�view,�investment�in�CDM�projects�of�other�industries�is�quite�economic,�not�only�able�to�achieve�some�economic�benefits,�but�also�get�emissions�reduction�credits.�Although�it�is�not�as�economic�as�the�self�reduction�program�of�shipping�companies,�it�has�no�limited�amount�of�reductions�while�the�self�reduction�program�has.�
If�shipping�companies�exceed�the�IMO�emissions�standard�a�lot,�they�have�to�purchase�emissions�quota�from�other�companies�or�countries.�Regardless�of�its�economy,�the�cooperation�with�logistics�companies�has�certain�practical�limitations�and�is�complicated,�trade�inside�the�industry�is�simple�while�its�economy�is�unknown,�and�investment�in�CDM�project�of�other�industries�can�be�seen�as�a�quite�simple�and�economic�program,�recommending�shipping�companies�to�have�practices�in�the�future.�
6 Conclusions and Further Research Under�the�background�of�the�Copenhagen�Conference,�the�IMO�forced�to�carry�out�criteria�for�emissions�made�by�the�shipping�industry.�As�Shanghai�is�accelerating�itself�to�be�an�international�financial�and�shipping�centre,�this�research�has�predicted�the�potential�programs�taken�out�by�the�IMO,�market�based�instruments,�from�both�the�technical�and�the�operational�perspective.�
Whatever�programs�the�IMO�would�introduce,�it�is�necessary�for�Chinese�shipping�companies�early�involved�in�GHG�emissions�trade�to�gain�an�advantage�place�in�the�market,�reacting�better�in�2011�in�case�there�is�a�mandatory�responsibility�coming�up.�
An�integrated�estimation�method�and�a�Cost�Benefit�Analysis�are�introduced�in�this�article�to�compare�all�the�possible�trading�programs�,�among�them,�investing�in�CDM�projects�of�other�industries�is�the�most�economic�and�practical,�which�is�recommended�for�practitioners.�
This�article�aims�to�enhance�professionalism�and�technical�knowledge�of�Chinese�shipping�industry�to�emissions�reduction�and�have�better�corresponding�actions�to�2010�IMO�policies.�

�
SANTIAGO�DE�CHILE,�THE�25th�–�28th�of�OCTOBER�2011�–�www.iame2011.org�
So�far,�there�are�no�specific�emission�reduction�standards,�the�corresponding�actions�in�this�article�are�based�on�predictions�of�the�IMO�policies.�With�the�IMO�proceeding�the�discussion�the�responding�actions�will�change�accordingly.�Moreover,�with�the�market�becoming�mature,�the�economy�and�practice�of�GHG�emission�trade�will�gradually�become�more�feasible.�This�article�just�proposed�the�feasibility,�looking�for�further�standardization�and�amendments.��
Because�of�time�constraints,�part�of�the�quoting�data�is�not�shown�in�detail.�In�the�forthcoming�study,�further�research�can�be�obtained�to�get�more�specific�results�for�certain�CDM�projects.�
References[1]� . [G/OL]. :�[2007�10�18].�
http://www.eehome.com.tw/greenhousegas.htm�
[2]� , , , . [J/OL]. �
.��[2007]�http://162.105.153.160/bianj/paper/05/5.pdf�
[3] . MARPOL73/78 [J].
,2010:551�
[4]� . [C].�
http://ncc.cma.gov.cn/Website/index�
[5] . [J]. .2009.5:47�49�
[6]�IMO�MEPC 58 ,�[OL]
.2008.10�http://www.simic.net.cn/�
[7]� . .�
���[OL].United�Nations:[2009].�http://untreaty.un.org/cod/avl/pdf/ha/kpccc/kpccc_c.pdf�
[8] [OL].�[2010�05�07].http://baike.baidu.com/�
[9]�Regional�Greenhouse�Gas�Initiative.[OL].�[2010].�http://cn.bing.com/reference/semhtml/Regional_Greenhouse_Gas_Initiative�
[10] . :[OL].[2010].�
���http://vers315.blog.hexun.com/45294431_d.html�
[11]� .[R].� . .2008.10��
[12]� .[OL].[2010].www.bp.com�

�
SANTIAGO�DE�CHILE,�THE�25th�–�28th�of�OCTOBER�2011�–�www.iame2011.org�
[13]� [OL].[2010].�
http://qq1287889.blog.163.com/blog/static/518013692009119111540614/�
[14]�Second�IMO�GHG�Study�2009[R].London:�IMO,�2009:178�
[15]�GHG�Discussion�Paper.WSC�Meetings�Sept�2009[R].2009.8.31�
[16]� � � . [R].�2008
,2008.�7.�1:50�
[17]� [N]. .2009.12.10�
[18]� � . . [M]. : ,2005:78�
[19]�Nam�Seok�Kim�Bert�Van�Wee.�Assessment�of�CO2�Emissions�for�Intermodal�Freight�Transport�Systems�and�Truck�only�System:�A�Case�Study�of�the�Western�eastern�Europe�Corridor.�Transport�Geography[J].Transport�Geography.2008:8�9�
[20]� . [D]. .2010.1:49�
[21] [S]. .2004.5.19�
[22] [OL].[2010].http://www.stats.gov.cn/�
[23]� CDM [OL].[2010].http://www.cdm123.com�
[24]� � � . CDM [J]. ,�2008,�4:130�

IAME 2011 conference
SANTIAGO DE CHILE, THE 25th – 28th of OCTOBER 2011 – www.iame2011.org
LOCATION PLANNING OF DRY PORT BASED ON LOGIT‐THE CASE OF SOUTHWEST CHINA
FANG LI
Shanghai Jiao Tong University 800# Dongchuan, Minhang, Shanghai
[email protected] (86)13564291848
XIAONING SHI, HAO HU
Shanghai Jiao Tong University 800# Dongchuan, Minhang, Shanghai [email protected];[email protected]
Abstract
In the face of increasing international trade and subsequent transportation demand, dry port is positively being considered as one good solution to not only relieve problems at seaports like congestion, service in short supply, etc. What's more, it's one kind of way to improve inland cities through facilitating local import and export transportation and forming advantages to attract other investment. With this respect, governments of inland cities are competing to attract more transshipment in order to achieve economic balance between the profits and large cost spent in the process of constructing dry port. Multinomial Logit model, standing from shippers' preferences, provides particular prospective for decision makers in an much intuitive form, according to which, different influence factors and respective coefficients can be discerned on the base of demand from dry port users, and then by taking measures to exert strength and enhance weakness of candidate locations, relatively large probability of being chosen as dry port construction location is available. This paper forms a location planning model with combining multinomial logit and objective optimization and then a case from southwest china is given to verify such model.
Keywords
Dry Port, Multinomial Logit, Customer Preference, Objective Optimization

LOCATION PLANNING OF DRY PORT BASED ON MULTINOMIAL LOGIT
SANTIAGO DE CHILE, THE 25th – 28th of OCTOBER 2011 – www.iame2011.org
1. Introductions With international trade increasing among countries all over the world, container shipping surged and also give rise to two kinds of main situations: onerous burden of containers for seaport to deal with, and emerging seaports conforming to such trend exacerbate the competition among them.
Regarding the first situation, from reported delays, seaport is facing with capability not high enough in handling those containers resulted by increasing trade turnover across international countries; Together with this situation seaport is at risk of losing the opportunity of attracting more ships' berthing. Besides, carbon dioxide emission produced in the waiting hour from vehicles caused by congestion in the inner seaport station should be seriously taken into consideration in the environmental friendly focused age.
For another situation, due to the internationally economic development and growing trade volume across countries, governments paied vigorous attention on developing seaports including efficiency improvement by ameliorating seaports' operation environment, and new seaports' building to add service supply. All these policies and activities from administration have made seaport industry a much intensely competitive area. Besides, seaports have actively joined in the trend of developing into the fourth generation, for which, the competition among ports is substituted by the competition among ports' supply chain originated from hinterland. Broad hinterland denotes strong support to connected seaport in the form of huge commodity supply, hence that's guaranteed the seaport get more chance to win in such fierce competition.
Given these two situations, dry port is gradually approached, one inland inter‐modal terminal directly connected with a seaport by rail, with shippers (consignees) can leave and/or collect their goods in intermodal loading units as if directly at the seaport (Woxenius, 2004). Firstly, dry port exactly make up for those shortages faced with seaports. Efficiency can be enhanced in the seaport for the inland terminal with much similar functions has shared large workload and responsibility, like Customs clearance, etc. Simultaneously, a dry port in inland area can gather more source of goods from more cities for the connected seaport, which would not reach that far into inland by itself. In addition, except those benefits gotten by seaport, inland cities does not earn less: rail access strengthening inland‐seaport communication, close trans‐modal terminal facilitating import and export transportation of both local and adjacent cities, dry port construction attracting more business and investment for better development. Finally, for shippers and governments, benefits are also available. An inland constructed terminal save land cost to a great extent compared to expanding seaport area along the coastline. And it's more environmentally efficient and expense cutting with resource integration from delivering cargos to the seaport respectively by shippers to large volume of cargoes delivery by one actor (Roso, 2009).

SANTIAGO DE CHILE, THE 25th – 28th of OCTOBER 2011 – www.iame2011.org
Since the benefits of dry port construction are so obvious, and several local governments are dedicated to justify its reliability before building due to its great exspense. This paper is focused on analysing such situation from the prospective of demand of dry port's users with Multinomial Logit model in order to identify key factors in affecting probability of cities being chosen as dry port. In this paper, a background introduction above in Section 1 is followed by a literature review about dry port researches mainly in the aspect of location selection in Section 2. Section 3 describes the core methodology: Multinomial Logit model, and then one example is given to better illustrate the application of such analysis. In Section 4, a model combining multinomial logit and objective optimization is proposed to fix location selection problem of dry port. Finally, conclusion is given as Section 5.
2. Literature Review Dry port, also called inland port (Rodrigue et al., 2010) , can be understood as an inland seaport except berthing facilities. The same as seaport, it allows several functions to be performed, including consolidation and deconsolidation, distribution and temporary storage, customer clearance, transshipment between two different traffic modes, etc.
About dry port, lots of study have been done by former researchers, ranging from qualitative terminology definition (Andrius Jaržemskis, 2007; Woxenius, 2004; Sciomachen, 2005; Roso, 2007; Rodrigue et al., 2010), functions discerning (Xu and Lu, 2006; Ye, 2005; Jaržemskis, 2007; van Klink and van den Berg, 1998; Parola and Sciomachen, 2005; Dadvar and Ganji, 2010; Dadvar, 2010), to quantitative research, like the effect made by dry port on reducing carbon dioxide emission (Roso, 2009).
Among those researches, location selection of dry port is stressed for its practical significance in supporting decision making. The location planning of a dry port is the critical issue for the whole supply chain and its relationship with seaports, shippers, transportation operators and the hinterland. As for the methods used to locate dry ports, studies show several representative models, as followed:
Hua (2005) developed a Multiple‐Attribute Decision Making (MADM) method based on the TOPSIS dedicated to change fuzzy data into crisp data for selecting the most acceptable inland port from a set of candidate sites under multiple potentially conflicting objectives in a group decision‐making environment, and then Multiple‐Objective Decision Making (MODM) method is added with consideration of investment.
DEA is used by Yang (2006) to plan dry port location. Narrow the location scope firstly with keeping the locations that meet the main factors which take great influence in choosing dry port location, such as transportation cost, time length, shippers' satisfaction, etc, and simultaneously filtering out failed ones, in which way the locating process is much simplified. Then AHP‐F is cited to list the priority sequence of the rest cities, which consider many factors that influence the competitive strength of each candidate location, like governmental policy, living culture of local citizen, transport infrastructures and facilities, etc, within which governmental policy takes a great proportion.

SANTIAGO DE CHILE, THE 25th – 28th of OCTOBER 2011 – www.iame2011.org
Government attitude toward the development of dry port always accout for the most disparities among high and low‐developing cities.
Mansour Rahimi(2008) designed one model called location‐ allocation to locate inland ports for 5 counties served by two sea‐ports in California. Location‐ allocation is a mathematical model to find the optimal location for more than one inland port. This model, based on a set of candidate locations obtained by using the simple facility location model for each of the five regions, not only determines the optimal number as well as the location of each inland port (i.e., a location problem), but it also determines which transportation nodes will be served by which inland port (i.e., an allocation problem). The main characteristic of the research lies in letting the evaluation of truck VMT(Vehicle‐Miles Travelled) as the platform of the basic work, which considers the availability of data as well as environmental pollution. And a combined set of homogeneous traffic analysis zones (TAZs) are adopted to form new regional boundaries differing from the geological boundaries, which can be called transportation nodes (TN).
Lv and Li (2009) applied ANP, kind of like AHP, to chose dry port for Tianjin port from 4 candidate cities. A two‐tier evaluation indicator system is constructed, including traffic convenience, cost, labour resource, etc. And the calculation process is done by software named super decision, the result is also verified with reality.
Fuzzy‐C clustering is the most common seen method among prior researchs in location planning for dry port, the application of which is based on the uncertainty of describing local economic development and geographical location, as a result the evaluation index is of fuzziness when quantified. Zhong et al. (2008) used fuzzy c‐means clustering algorithm to find the most suitable location as candidate dry port for Dalian port among 34 inland hinterland cities. It validates the adaptability and rationality of applying a fuzzy c‐means clustering algorithm into the location planning of a dry port. A comparison with the existing development and layout of the dry port provides the government with a theoretical underpinning for an inland dry port location. Besides, Fuzzy Factor Rating System and Fuzzy Logic(Ou and Chou, 2009; Kuo et al., 2009) are also proposed to locate international distribution center. A fuzzy multi‐objective model is developed to optimize fire station location through genetic algorithm (Yang et al., 2007).
Seen from the literature review of location planning methods, most of them have to decide the factors affecting such choice firstly, and then methodology can be carried out. However, most of related factors are added only from an subjective prospective without any data support, and location result from applied methods can not conversely verify those factors' rationality. As described in Section 1, governments or other institutions eager to make policies based on reliable analysis to perfectly make sure their decisions are feasible and profitable. Given this condition, factors' identification like those making effect to dry port location outcome forms great effect, according to which, decision makers can take measures to exert strength and enhance weakness in related fields. In some way, literatures help in suppling original factors, like distance between production base to seaports (Ng and Gujar, 2009), transportation expense and logistic spending (Wang, 2004), economy development (Zhong et al., 2008), interests conflict of different partners (Dadvar, 2010), policy regulation, infrastructure, environment, and land cost (Roso, 2008), etc. Most

SANTIAGO DE CHILE, THE 25th – 28th of OCTOBER 2011 – www.iame2011.org
of those factors are going to enter the the initial step of multinomial logit model in Section 4 of this paper.
After factors are laid down, standpoint of this study needs to be clear. There's no doubt optimal service, fine transportation environment and other offerings from dry port are used to attract potential shippers using their services. Even when partners' interests are not in a line, cooperators have to acknowledge that customer is the first part who should be satisfied by co‐efforts without negotiation. Considering such requirement and prerequisites of dry port implementation, an appropriate model is necessary to help decision makers find ways to satisfy customers' demands. In this paper, Multinomial Logit model (Wang, 2004; Cao, 2008) is proposed to offer one decision support, based on taking customers' preference about transportation into account. And then a model combining multinomial logit and objective optimization is raised to plan location of dry port.
3. Methodology
3.1 Logit Model Logit model, one kind of discrete model, is generally used to analyse coefficients before factors and then evaluate probability of individual choice behaviour if relative data are available (usually through questionnaire survey). It derives several forms, like multinomial logit, conditional logit, nested logit, mixed logit, exploded logit, and ordered logit, etc, and each has its special characteristics and corresponds to appropriate situation.
Nested logit can deal with situation which violates IIA (independence of irrelevant alternatives) hypothesis while multinomial has to comply with. Mixed logit arises from the limitations of the standard logit model by allowing for random taste variation, unrestricted substitution patterns, and correlation in unobserved factors over time. Ordered logit regression is used in cases where the dependent variable in question consists of a set number (more than two) of categories which can be ordered in a meaningful way (for example, highest degree, social class) while multinomial logit model is used in similar cases but with a set of categorical (not ordianl) dependent variables.
All of these kinds of logit model are extensively employed in economics, transportation, social and marketing researches, like bank credit risk prediction (Fang and Zeng, 2004), financial prewarning (Jiang and Han, 2004), enterprise growth forecast (Qiao and Zeng, 2009); path selection (Liu and Wu, 2008), traffic modes allocation (Yi and Deng, 20009), freight distribution into different routes (Zhao and Zhang, 2010); like transport charges evaluation (Wang, 2007; Hu and Xu, 2001), factors' identification influencing local farming companies' export (Zhang, 2004; Ye, 1998); market research (Huang and Shen, 2002), etc.
Among them, few found related to solving location planning problem. Cao (2008) cited logit model in his dissertation locating competitive stores, in which he expressed utility of one store as the function related to distance from a certain demand area to each store, and this function has been proved as logit model. Demand is then put into the final goal function as one factor to compute profits. Wang (2004) calculate income via multinomial logit model with consideration of transportation cost and logistic activities spending as two main influencing factors, from which the probability of one
SANTIAGO DE CHILE, THE 25th – 28th of OCTOBER 2011 – www.iame2011.org
candidate inland port being chosen by single shipper can be gotten and put into income forecast related to transportation demand.
Accurately, logit model can also be used in location selection area as its application in traffic route choosing behaviour, based on deciding factors' coeffcients. Regarding its convenience (software support) and its general employment in researches, this paper is going to cite multinomial logit model to analyse the problem of dry port location selection, hence elements and respective coefficients related to which can be discerned to help governments form active regulations and measures to construct local dry port.
3.2 Modelling In this section, this paper proposes an model based on multinomial logit to choose location for dry port, in which the transshipments one dry port collect is the key.
In this model, we assumes:
1)Both the logistic cost of each freight category and the profit each one brings are assumed to be the same;
2)And each candidate place spend the same to construct and run a dry port;
3)This model in this paper will choose dry port according to the amount of transshipment it attracts.
According to the logit model, probability of individual choice and transshipment amount can be computed through the formula:
1) Vij=0.34xij1+0.4xij2+0.26xij3 means the contribution of candidate city j to city i; the value of xij1, xij2, xij3 can be found in the above table;
2)
∑=
= 5
1j
v
v
Pijij
ij
e
e
∑=
=16
1*
iijij PTM
i indicates choice behaviour, i=1,2...16; j=1,2,...5, means candidate city;
3) means the summed freight that probably will be processed by candidate dry port
j;
4. Case Study——The Southwest China In order to demonstrate the application of multinomial logit model in dry port problem, this paper will illustrate an case study in this section.
4.1 Case Description Yunnan province, lied in the inland southwest of China, is famous in exporting products like electromechanical, tobacco, biomedical, tourism, etc, to the contiguous countries such as ASEAN, Europe, Peru, India, Australia. Most of the exports are completed by shipping through Guangzhou

SANTIAGO DE CHILE, THE 25th – 28th of OCTOBER 2011 – www.iame2011.org
port. Such export, in the strongest way, supports the full development of Yunnan province which now just awares local government to form a dry port in one of its cities. On one side, with the increasing trade amount, guangzhou port is challenged by pressure of long waiting cargos which cannot be processed in time due to lack of enough land resource and port facilities. On the other side, shippers are bothered with the high cost caused by time waste, which may harm companies' reputation and eventually the commercial profits. Current transport pattern can not satisfy emerging requirements any more. Dry port, in this case, located in one city of Yunnan, can offer an solution with better service to save cost for shippers. At the same time, dry port gives an perfect opportunity for Yunnan province to develop as an regionally international logistical hub, an portal open to the whole south Asian. Third‐party logistics suppliers including freight forwarding, shipping agency, will offer "one‐package", "door‐to‐door" solution to imports and exports with their freight, that is, freight will be processed with multimodal transport. And dry port in inner land can facilitate freights' declaration and inspection, hence congestion in Guangzhou port will be relieved effectively since freights are ready to be loaded onto ship directly rather than waiting for customs declaration activities.
Regarding the practical requirement for building dry port in Yunnan province, this paper is going to deal with the issue of location selection from all of the administrative cities in Yunnan. In such case, 5 candidate cities(Kunming, Jinghong, Hekou, Ruili, Qujing) have been selected from the whole 16 cities, and then multinomial logit is employed to choose the best candidate city, from above, it's known that the best city should be the one most attactive to collect transfreights.
4.2 Data Description Through literature review and investigation in Yunnan, railway container hub(yes‐1;else‐0), accessibility, import and export trade are considered as the three influencing factors in logit model. Each factor implicates specific meaning, explained in table 2.
Table 1: Factors Connotation
Factors Connotation
f1:wether railway container hub(yes‐
1;else‐0)
Most dry ports built in our country base on the 18 railway container hubs construct by the railway ministry; container transportation from dry port to seaport is mainly completed by railway, in this way, a railway container hub contributes to such
transportation to an extreme extent.
f2:accessibility The number of city each candidate can reach in the same period of time. It's measured by road transport which is mostly applied in the transportation from inner shippers to
dry port. Accessibility is calculated by summed distance from one candidate to all of the rest cities divided by average velocity(Cao et al., 2005).
f3:import and export trade
Import and export trade of one candidate indicate its economic vitality and future development, which just support the effective operation of dry port.
Value of three factors are defined as below:
1)According to the plan of railway ministry, Kunming belongs to one of 18 railway container hubs, hence the value of this factor is 1, and the value of other cities in this case is 0;
2)Table 2: Accessibility value of candidate cities(units)

SANTIAGO DE CHILE, THE 25th – 28th of OCTOBER 2011 – www.iame2011.org
Candidate cities Accessibility (Time period=8 hours(normal working hours));
velocity=100km/h)
Normalization(divided by the maximum)
Kunming 15 1.000
Jinghong 10 0.667
Hekou 9 0.600
Ruili 9 0.600
Qujing 14 0.933
Source:composed by authors 3)Table 3: Import and export trade value of each cities in Yunnan(10,000$)
Cities Trade(Ti) Normalization Cities Trade(Ti) Normalization
1 Kunming 563,030 1.000 9 Lijiang 8,544 0.015
2 Jinghong 20,270 0.036 10 Puer 11,449 0.020
3 Hekou 44,152 0.078 11 Lincang 6,176 0.010
4 Ruili 76,279 0.135 12 Chuxiong 6,403 0.011
5 Qujing 15,201 0.027 13 Wenshan 7,703 0.014
6 Yuxi 15,652 0.028 14 Dali 14,405 0.026
7 Baoshan 10,403 0.018 15 Nujiang 551 0.001
8 Zhaotong 998 0.002 16 Diqing 696 0.001
Source:Yunnan statistical yearbook 2010
4.3 Data Processing According to multinomial logit, each candidate has its own utility towards different behaviour, in this paper, that means the 16 cities. Utility function can be written as Uij=Vij+�ij, while visual part Vij=b1x1+b2x2+b3x3, b1,2,3 mean the weights of 3 factors, which are defined as the average evaluation of different experts. In this paper, b1=0.34, b2=0.4, b3=0.26.
The value of x1, x2, x3 in the utility function depends on each of 16 city. Factors in logit model has two kinds of characteristic, one describing nature of candidate, like f1, f2, f3, the other reflecting the feature of individual behaviour. Standing from the point of choice individual, logit model includes former factors as the contribution each candidate city makes to choice behaviour, that is, satisfaction. As a result, 50 shippers in each of 16 cities will evaluate the contribution from value of f1, f2, f3, scoring from 1‐5, and the average evaluation in each city will be put into final utility function as the value of x1, x2, x3 to calculate the corresponding probability. For example, if the average evaluation score from Yuxi city to f1, f2, f3 of candidate Kunming city are 5, 5, 4, the utility of candidate Kunming relative to Yuxi will be 0.34*5+0.4*5+0.26*4=4.74.
Table 4: Average evaluation of factors' value

SANTIAGO DE CHILE, THE 25th – 28th of OCTOBER 2011 – www.iame2011.org
Kunming Jinghong Hekou Ruili Qujing
x1 x2 x3 x1 x2 x3 x1 x2 x3 x1 x2 x3 x1 x2 x3
Kunming 5 5 5 1 2 1 1 2 1 1 2 1 1 3 1
Jinghong 5 4 5 3 4 2 1 1 2 1 1 2 1 2 2
Hekou 5 4 5 1 3 2 2 4 2 1 2 2 1 3 3
Ruili 5 4 4 1 2 1 1 3 2 2 3 2 1 4 2
Qujing 5 3 5 1 2 2 1 2 3 1 3 3 2 5 3
Yuxi 5 3 5 2 2 3 2 2 2 2 2 4 2 4 2
Baoshan 4 4 5 2 2 2 2 2 3 2 2 3 2 4 3
Zhaotong 5 5 5 2 3 3 2 3 2 2 3 4 1 4 4
Lijiang 5 3 5 3 2 3 1 2 3 3 2 3 2 3 4
Puer 5 4 4 2 1 2 1 1 2 2 1 4 2 2 2
Lincang 5 4 5 1 1 3 2 1 3 2 2 3 2 3 3
Chuxiong 5 3 4 2 2 3 1 2 2 2 1 4 2 3 3
Wenshan 5 4 5 1 3 2 2 3 3 2 3 4 2 4 3
Dali 4 3 4 1 2 2 1 2 2 2 2 3 2 3 2
Nujiang 5 4 5 2 2 3 2 2 2 2 3 4 1 3 4
Diqing 5 4 5 2 2 3 2 3 3 2 2 4 2 3 3
Note: 1‐quite unsatisfied, 2‐unsatisfied, 3‐normal, 4‐good, 5‐excellent
Source: Questionnaire survey, Aug, 16, 2011, Kunming
4.4 Result Analysis Table 5: Probability of each choice(Pij) and summed trade of each candidate dry port(Mj)
i i Ti (10,000$) Kunming Jinghong Hekou Ruili Qujing
Kunming 563,030 1 0 0 0 0
Jinghong 20,270 0.387 0.262 0.106 0.106 0.139
Hekou 44,152 0.342 0.153 0.208 0.124 0.173
Ruili 76,279 0.343 0.111 0.163 0.190 0.193
Qujing 15,201 0.310 0.122 0.142 0.171 0.255
Yuxi 15,652 0.305 0.164 0.145 0.183 0.203

SANTIAGO DE CHILE, THE 25th – 28th of OCTOBER 2011 – www.iame2011.org
Baoshan 10,403 0.308 0.145 0.163 0.163 0.221
Zhaotong 998 0.313 0.167 0.150 0.183 0.187
Lijiang 8,544 0.295 0.183 0.135 0.183 0.204
Puer 11,449 0.367 0.145 0.114 0.192 0.182
Lincang 6,176 0.357 0.118 0.144 0.175 0.206
Chuxiong 6,403 0.312 O.179 0.131 0.168 0.210
Wenshan 7,703 0.301 0.135 0.174 0.191 0.199
Dali 14,405 0.311 0.143 0.143 0.195 0.208
Nujiang 551 0.320 0.157 0.139 0.203 0.181
Diqing 696 0.313 0.154 0.181 0.171 0.181
Mj (10,000$) 643258.396 33875.452 37828.749 39887.869 45915.397
Source: composed by authors From table 4 in the above, it's apparent that Kunming is probable to collect the most freight if dry port is developed there, while other 4 candidate cities are far cry behind. In fact, this result is reasonable since Kunming scores much higher than other cities on the value of selected factors. Firstly, Kunming is one of 18 railway container hubs issued by railway ministry, which takes significant role in facilitating distribution of freights from all cities in Yunnan province. In addition, Kunming lies in the center of provincial road transport web, for which it almost connects all of other cities in Yunnan and and it also will take much less time to reach destinations where shippers are. Finally, larger amount of transportation demand based on import and export trade, relatively to its counterparts, strongly sustains the city in the way that dry port built there will be fully feed and effectively used. From the prospective of shippers, cost saving is commonly concerned at the first. Freight forwarders or other Third‐party logistic suppliers in Kunming are able to offer much cheeper but better service. Their advantages lie in being close to railway container distribution, hence transportation on road between shippers and dry port is shorten, so is the road transportation cost; the same cost reduction can also be possibly realized when logistic providers find an easy way to get shippers or dry port; cheeper logistic cost also comes with scale economy when local land can produce large amounts of import or export trade. For these reasons, Kunming, selected by most of shippers, is appropriate to develop a dry port, and this is also in line with recent plans of Yunnan government, who intends to develop Kunming toward an international portal in southeast Asian.
5. Conclusions In this paper, logit model is applied to fix the traditional location selection problem, and then an case study from southwest China is employed to verify such application. Firstly, the characteristics of logit model are specifically studied, that is it's an tool mainly targeted to investigate preferences of choice behaviour while other tools like AHP or Clustering algorithm(Li, 2011) only concern features of candidate in location selection field. In addtion, location selection of dry port counts mostly on the

SANTIAGO DE CHILE, THE 25th – 28th of OCTOBER 2011 – www.iame2011.org
transshipment it can collect and distribute, if the portal service can not been well used, the original intention of building a dry port will just waste resources. Enough freight source guarantees the effective operation which will support future development of a dry port, and even a whole city where dry port lies. In this way, what shippers think about dry port deserves consideration of decision makers. Only the dry port meets most of shippers' preferences will accumulate most transshipments, therefore create highest profits. From these two prospects, logit model is quite appropriate to deal with location selection of dry port, which is also the goal completed in this paper. However, lots of work in this paper still deserves further research. For instance, transportation demand in this paper is set off by administrative district, but more specific division can be set by freight category. The weight in utility function is decided by average evaluation of experts, and if data is available, weights should be given by MLE. Other problems like operation pattern of dry port is also an hot topic in this area.
References Woxenius, J., Roso, V., Lumsden, K., 2004. The dry port concept ‐ connecting seaports with their hinterland by rail. In Proceedings of the First International Conference on Logistics Strategy for Ports. China: Dalian.
Woxenius, J., Roso, V., Lumsden, K., 2009. The dry port concept ‐ connecting seaports with their hinterland. Journal of Transport Geography 17, p: 338‐345.
Ng, K. Y., Gujar, G. C., 2009. The spatial characteristics of inland transport hubs: evidences from Southern India. Journal of Transport Geography 17, p: 346‐358.
Rodrigue, Jean‐Paul., Debrie, J., Fremont, A., Gouvernal, E., 2010. Functions and actors of inland ports: European and North American dynamics. Journal of Transport Geography 18, p: 519‐529.
Roso, V., 2008. Factors influencing implementation of a dry port. International Journal of Physical Distribution & Logistics Management, Vol. 38, No. 10, p: 782‐298.
Jaržemskis, A., Vasiliauskas, A. V., 2007. Research on dry port concept as intermodal node. Transport, Vol XXII, No 3, p: 207‐213.
E. Dadvar., S. R. S. Ganji., 2010. Feasibility of establishment of "Dry Ports" in the developing countries ‐ the case of Iran. Journal of Transport Security.
Ou, C‐W., Chou, S‐Y., 2009. International distribution center selection from a foreign market perspective using a weighted fuzzy factor rating system. Expert System with Applications 36, p: 1773‐1782.
Fang, Q., 2008. The optimal location planning of dry port in Guizhou province. Journal of Guizhou University of Technology. Vol. 37, No. 6, May.
Yang, L‐L., Bryan, F. J., Yang, S‐H., 2007. A fuzzy multi—objective programming for optimization of fire station locations through genetic algorithm. European Journal of Operational Research. Vol. 181, No. 2, p: 903‐915.
Jin, A., 2004. On Methodology of Parameter Estimation in LOGIT Model. Journal of Transportation Systems Engineering and Information Technology, Vol. 4, No. 1.
Qian, Z., Zeng, G‐S., 2003. Product line optimization based on discrete choice model. Journal of China Agricultural University, Vol. 8, No. 2, p:78‐83.

SANTIAGO DE CHILE, THE 25th – 28th of OCTOBER 2011 – www.iame2011.org
Cao, Y., 2008. Competitive Facility Location Research on the Customer Behaviour Logit Function. Fu Dan University.
Hu, Y‐C., Xu, J‐M., Jin, W‐Z., 2001. Application of LOGIT Model in Evaluating Passenger Transport Charges. Journal of Highway and Transportation Research and Development, Vol. 18, No. 6.
Fang, H‐Q., Zeng, Y., 2004. An Empirical Comparative Study on Credit Risk Evaluation System of Financial Enterprise. Systems Engineering‐Theory Methodology Applications, Vol. 13, No. 3.
Jiang, T., Han, L‐Y., 2004. Forecast of Financial Distress for Chinese Pre‐losing Listed Companies Based on the Logistic Model. Journal of Beijing University of Aeronautics and Astronautics(Social Sciences Edition), Vol. 17, No. 1.
Huang, X‐L., Shen, H., 2002. Application of Discrete Choice Model in Marketing Research. Journal of Beijing Broadcasting Institute (Natural Science Edition),Vol. 12, No. 4.
Wang, J‐N., Sheng, Z‐H., Li, X‐D., 2003. A Demonstration on Investment Inclinations of Investors Based on Logit Model. Journal of Industrial Engineering/Engineering Management, Vol. 17, No. 4.
Zhou, H., Liao, X‐Z., 2003. Study on Logit Combined Forecasting of the Market Demand. Systems Engineering‐Theory Methodology Applications, Vol. 7.
Zhang, T., 2004. Empirical analysis of influencing factors for exportation level of leading agri‐businesses in Jiangsu. Journal of Nanjing Agricultural University (Social Sciences Edition), Vol. 4, No. 2.
Wang, W‐H., Guan, H‐Z., Wang, S‐C., 2008. Application of Nested‐Logit Mode in Railway Transfer Mode Selection. Urban Mass Transit, Vol. 11, No. 7.
Liu, Z., Zhou, X‐H., 2006. Application on nested Logit mode of traffic mode choice. Journal of Shanghai Maritime University, Vol. 27, No. 3.
Liu, Y., Wu, J‐R., Lin, H‐F., 2008. Study on Pedestrian Route Choice within a Rail Transit Station. Urban Transport of China, Vol. 6, No. 6.
Zhao, X‐R., Zhang, J‐H., 2010. Freight Shipping Allocation Research Based on Logit Model. Public Communication of Science & Technology, Vol. 14.
Li, C., 2004. Traffic Mode Distribution. He Hai University.
Wang, Y‐H., 2007. Traffic Price Formulation of Urban Rail Based on Logit. Bei Jing Jiao Tong University.
Cao, X‐S., Xue, D‐S., Yan, X‐P., 2005. Accessibility of China road web connection. Geographical Journal, Vol. 06.
Li, F., 2011. Location selection of dry port based on AP Clustering‐the case of southwest China. ISBN:978‐989‐8425‐66‐9, p:255‐260.
Author's personal copy
Verifying liner Shipping Alliance’s stability by applying core theory
Dong Yang a,*, Miaojia Liu b, Xiaoning Shi c
aCentre for Maritime Studies, National University of Singapore, 12 Prince George’s Park, Singapore 118411, SingaporebBIMCO, Bagsværdvej 161, 2880 Bagsværd, DenmarkcDepartment of International Shipping and Logisitics, NAOCE, Shanghai Jiao Tong University, China
a r t i c l e i n f o
Article history:Available online 17 August 2011
Keywords:Liner shipping allianceCost functionCore theoryMega container shipStability
a b s t r a c t
The core is a vital concept in cooperative game theory and has been widely used in analyzing alliance’sstability. It is especially interesting to apply core theory in liner shipping market due to the latter’sexceptional characteristic of non-homogeneous cost curves as well as divisible and fluctuant demand.Having observed some new phenomena and trends in the industry, this paper studies the economicperformance and stability of liner shipping alliance by applying core theory where business cooperationis partly realized by delivering joint-service with mega container ships. To demonstrate the core situationin liner shipping alliance, a cost function is first identified on the basis of two assumptions regardingcooperation: 1) sharing or pooling vessels and 2) deploying mega container ships if needed. Taking costfunctions as basis, two conditions of approaching core may be groomed, i.e., collective rationality andindividual rationality. The first condition is discussed from the perspective of market, while the secondcondition is studied within the alliance. Stability of liner shipping alliance is then observed based onthese two conditions. An illustrative case study is conducted in order to show some implications andexplicitly clarify the theory.
� 2011 Elsevier Ltd. All rights reserved.
1. Introduction
One of the most significant developments in liner shippingindustry over the past decades is the formation of strategic alli-ances. Since mid-1870s, the liner conference system has alreadybeen developed in an attempt to deal with excessive capacity andcut-throat price competition. Over the following century, numbersof agreements on freight rates, numbers of services, ports served,goods carried and acceptable mechanism of revenue sharing havebeen constantly developed. With the trend of containerization,standardization and global competition, liner conference systemwas almost exempted from anti-trust legislation step by step untilthe end of 2008 (Stopford, 2009). As alternative strategy of coop-eration, various alliances appeared that aimed to achieve lower unitcosts.
Since 2008, the financial crisis put enormous strains on the oncebooming global economy. Shipping industry benefits from global-ization more than almost any other sectors, but has also been mademore vulnerable to the economic slowdown. Freight rates andcharter rates have plunged with vessels being laid off and orderbooks being canceled. Although the recent decade has witnessed
a steady increase in the size of container ships deployed along theworld’s busiest maritime lanes seeking for the benefit of economiesof scale (Imai et al., 2006), these ships cannot fully enjoy thisadvantage in the current market as there is a clear surplus of fleetcapacity and loading factors are low. They often start their voyageswith half-empty slots - if start at all. These mega ships may presentsunk cost for ship-owners. As the consequence, an extensiveformation and recombination of new liner shipping alliances mightbe resulted and a new framework of the shipping industry mightemerge soon. There have been some convincing cases. With freightrates continuing to soften, some ocean carriers start to announcenew joint services on some trade lanes. The world’s three largestcontainer lines: Maersk Line, MSC and CMA CGM have announcedin March 2011 that they are prepared to introduce a joint newservice on transpacific route utilizing five 6000 TEU ships by thesecond half of this year. A number of other carriers have similarexpansion plans, withmarket report counting at least six new loopsin total that are either confirmed or being discussed.
In terms of the economic stability of competitive marketsdeveloped in the last century, game theory has been regarded asone of the most effective tools for analyzing market behavior. Inparticular, core theory makes predictions of the relation betweencosts and feasibility of cooperation by modeling the self-interestedinteractions of economic decision-maker. Liner shipping industryhas been a main field for core application due to its natural
* Corresponding author. Tel.: þ65 6516 5612; fax: þ65 6775 6762.E-mail addresses: [email protected] (D. Yang), [email protected]
(M. Liu), [email protected] (X. Shi).
Contents lists available at ScienceDirect
Research in Transportation Economics
journal homepage: www.elsevier .com/locate /retrec
0739-8859/$ e see front matter � 2011 Elsevier Ltd. All rights reserved.doi:10.1016/j.retrec.2011.06.002
Research in Transportation Economics 32 (2011) 15e24

Author's personal copy
characteristic of demand and cost curve. As for other transportationmodes such as air, railway and road, the unit capacities are insig-nificant in comparison to the demand of the entire market.However the capacity of a single container ship, especially themega container ship during one week in one lane is too large to beignored. Hence, the marginal cost can be regarded as continuous inland and air transport but discontinuous with several sub-functionsin shipping market. The liner shipping industry is also character-ized by unit or box transportation where commodities are identicalin shape and volume which makes the demand divisible to eachcarrier in the market. In addition with the variability of demand,empty core always exists in liner shipping market and shippingalliances.
Considering the increase of ship size and new strategy of alli-ance, this paper aims to sequentially expand the application of coretheory to explore more inner mechanism of liner shipping marketand alliance. The rest of the paper is organized as follows: in Section2, a literature review of liner shipping alliance, deployment of megacontainer ships and the application of core theory into liner ship-ping industry is put forward. After a brief introduction of coretheory in Section 3, Section 4 discusses market characteristics andthe cost functions of both competitive and cooperative market.Section 5 discusses the stability of the alliance employing jointmega container ship by looking into market profitability (costsaving). In Section 6, an analysis on demand structure inside alli-ance corresponding to different joint-ship sizes is represented frommembers’ perspective. An illustrative case is introduced in bothSection 5 and Section 6 aiming to explicitly demonstrate thetheoretical analysis. Conclusion is drawn in Section 7.
2. Literature review
Shipping conference as well as strategic alliance has a longhistory among liner companies because of fierce competition.Poulsen (2007) addresses liner shipping strategic alliance froma historical aspect. It is pointed out that historians and shippinganalysts have argued that it is the technological innovation ofcontainer that has driven shipping companies toward deepercooperation because the investment in such a new technologyrequired access to a very large group of customers and largequantities of cargo. By means of cooperating, liner companies areable to handle a critical mass of cargo and capital for such a majorinvestment. Haralambides, Benacchio, and Cariou (2002) denotesmore details on cooperative motivations, which include widergeographical coverage, operational efficiency, risk and investmentsharing, economies of scale and so on. Brooks (2000) identifies thetypes of technical cooperation agreements such as slot-charteringagreements, coordinated services, equipment sharing agreementsand vessel-pooling consortium or joint venture. Cariou (2002)provides an “empirical estimation of horizontal effect” in allianceoperational synergies and its result shows that collective actionworks better in achieving economies of scale.
As for deployment of mega container ships, Cariou (2002)explains that economies of scale does not restrict to the vesselsonly, but requires an upgrade of the whole string with large vessels.Imai, Nishimura, Papadimitriou, and Liu (2006) analyzes viability ofmega container ships considering competitive circumstances byusing game theory. This paper concludes that mega container shipsare competitive in all scenarios for AsiaeEurope lane but viable forAsiaeNorth America lane only when the freight rates and costs offeeder services are low. Furthermore, it is also addressed that asworld trade increases, the ship size will increase in a correspondingmanner in order to better enjoy economies of scale. Veldman(2009) assesses the elasticity of shipping costs versus ship size
for Post-Panamax ships ranging from 4000 TEU to 20000 TEU andpredicts that it is time to introduce bigger ships up to 20000 TEU.
Liner shipping market is regarded as a very special studyobjective among all the transportation market because of itsnature characteristic. By taking core theoretic approach, econo-mists argue that under free market condition, liner shippingmarket will not achieve equilibrium and therefore spontaneouscollusion and alliances must exist. Sjostrom (1989, 1993) indicatesthat the reason for collusion in the liner market is to imposeequilibrium where non-empty core exists. He proves that emptycore is more likely to appear in liner shipping market wherecarriers’ minimum average costs demonstrate limited variability,demand is less elastic and the excess capacity exists. He alsorecognizes that inefficient entry is the main cause for an emptycore to occur in liner shipping market. Pirrong (1992) furthersummarizes that the instability is consist with a market whencosts are characterized by indivisibilities and demand is finelydivisible. Whether core is empty or not is independent frommarket size. The existence of such discontinuities in cost data ofliner market is also tested in this paper. Zhao (2009) concludes inhis paper that “the non-empty core analysis not only helps toestimate cooperative costs and to explain why profitable cooper-ation might not be formed, but also provides an understanding ofpossible future breakups of completed cooperation. With regardsto the shipping industry, core sheds light on both understandingthe stylized fact that cooperation is likely to occur in marketsplagued by excess capacities and explaining the finding thatindustries for lumpy goods will have an empty core when demandis low”.
Song and Panayides (2002) apply core theory to liner shippingstrategic alliance where they analyze not only the cost allocationbut also fair profit allocation among members within the alliance.Fair allocation could be considered as one of the conditions thatkeeps consortia or alliance stable. A similar idea can also be seen inRyoo and Thanopoulou (1999), which shows that core is a prom-inent and widely accepted notion of fair allocation of costs andstability in cooperative game theory. Agarwal and Ergun (2009)study the liner alliance from companies’ perspective with a coretheory approach. They designed allocation mechanism througha capacity exchange cost structure, among which one possiblemechanism could be to provide side payments to companies as anadditional incentive for a partially decentralized alliance to sharethe benefits of the collaboration. By doing so, all members aremotivated to act in the best interest of the alliance.
Applications of core theory can also be found in other transportfields. Button (2003); Button and Nijkamp (1998) explains whyempty core may emerge in network industries such as trans-portation and explores both the application of core theory in airtransport and the desirability of government actions to alleviateassociated players’ performance. Yang and Odani (2005) as well asKrajewska and Kopfer (2006) work on similar topics of optimizingin land cooperative transport system to pursue maximal commonprofit and calculate reasonable side payments for each member inthe system.
This paper extends the above mentioned research in two ways:Firstly, most researches applied core theory by focusing on inherentcharacteristic of liner market but failed to consider the impact ofcurrent strategy and technology development. This paper takessome new phenomena and trends into consideration such as joint-service by vessel sharing or pooling and mega ships in order toshow their influences on the market. Secondly, previous researcheseither stressed the market structure and fluctuant demand frommacro perspective or highlighted the cost or profit allocationmethods inside alliance from micro point of view. This paperapplies core theory to a miniature market where there are few liner
D. Yang et al. / Research in Transportation Economics 32 (2011) 15e2416
Author's personal copy
carriers in a certain shipping lane and considers the change ofoperating slots as the only variable from both the market andcarrier’s perspective.
3. A brief introduction of core theory
Traditional game theoretic approach assumes that players actindependently, not cooperatively. Comparing to non-cooperativegame, core theory aims to solve problems when a group ofdecision-makers decide to undertake a project together with tightbinding agreements for achieving their joint objectives such as toincrease total revenues (profit maximization) or to reduce totalcosts (Song & Panayides, 2002). Simply speaking, core is a set ofequilibrium outcome. If competitive equilibrium does not exist, itmight be because the core of the market is empty. To use core tojudge an alliance’s stability is based on two rationalities: thecollective rationality which means cooperation should generateprofit, and a more important one, the individual rationality whichpostulates that the split of a cooperative profit to each member inthe coalition is better off than any potential profit they could obtainby forming any other coalition. In particular, a group of unalignedplayers can also be regarded as a coalition. The condition of a core isdemonstrated mathematically below.
Suppose R is a set of coalition structure bi defined for a coalitionN ¼ {1, 2,.., n } as:
R ¼ fb1; b2;. bmg;
bi ¼ fBi1;Bi2;.Bimg Bi1WBi2W.WBim ¼ S
Where Bip is a sub-coalition which could be an individual ora combination of individuals, p ¼ 1, 2,...m. If p s q, BipXBiq ¼ Ø.
Heuristically, a coalition structure represents the breaking up ofset N into mutually disjoint sub-coalitions. Suppose such a struc-ture is reached. It is assumed that each of the sub-coalitions Bipcosts C(Bip). Then each coalition structure bi presents an imputa-tion, which is stable in the sense that no coalition has the power orinclination to change it. Suppose its unit cost configuration is X¼(x1,x2,..xn,). To reach this goal, an obvious requirement will be thatof individual rationality
xi � CðiÞ for all xi ˛ X
A further possible requirement might be that no coalition structurebwill form instead of the grand coalition if one of its sub-coalitionscan cost less than the cost vector xi gives it. Thus
Xi˛s
xi � minbi˛R
( Xbip˛S
C�bip
�)xi ˛ X
The following sections will discuss empty core in liner shippingalliance based on the above mentioned two conditions with thenew alliance characteristic.
4. Cost function of liner companies
Strategic alliance is based on cooperative arrangements amongfirms. There are several main forms of these arrangements in linershipping industry. Slots charter and slots exchange are simplearrangements in which a carrier on a lane may offer anothercarrier a fixed number of spaces per voyage for a fixed period oftime at an agreed price or slots in some other shipping service.Vessel sharing is more advanced and is an agreement betweentwo or more carriers in which an equal number of slots arereserved on particular vessels for each of the participants. Thenumber of slots and thereby space of each party on different ships
on the same lane can vary by ship type and direction. These kindsof arrangements are commonly found in conjunction with coor-dinated service, where two carriers coordinate sailing schedulesso as to jointly offer regular frequency. The characteristic of thisform of cooperation is that carriers retain their independentidentities and market organizations. Joint venture is a morecomplex cooperative arrangement such as equipments sharingagreements and vessel-pooling consortium where carrierscontribute ships and other resources to create a new brandoffering more frequent service than each could provide alone.Joint-venture, on the other hand, is organized in such a way that itis closer to a merger in effect because of their common brand tothe customer.
By March 2011, there are 29 shipping lines providing 145services on the trade lane between Far East and North Europe(including Scandinavian and Baltic countries). A total number of350 container ships are employed on this route with an averageship size of 7635 TEU. It is difficult to ignore that the maximumship size is 15550 TEU, the biggest container ships so far. In total,there are 64 mega container ships serving this route and each ofthem can carry no less than 10000 TEU. However this picture willsoon be replaced with Maersk Line announcing its order of tenTriple-E class container ships in South Korea, which will be usedfor Far East e Europe trade when completed. These new Triple-Eclass ships have an impressive capacity of 18000 TEU each and tosome extent they are leading liner shipping sector into anunknown territory. These jumbo ships will on the one hand enjoya lower unit cost and hence economies of scale, but on the otherhand they have more physical limitations and are less flexible.Most importantly, the cargo volume on this lane has alreadydecreased greatly with the current economic slowdown. Howquickly would the demand starts to pick up and the marketrecover are still unclear. Therefore it is doubtable if these Triple-Eclass ships can be fully utilized when join the service in two tothree years.
In order to explain the analysis explicitly, an illustrative case isdesigned and brought along with the following theoretic analysisbased on the description above. It is important to note the followingassumptions:
� A certain shipping lane from Far East to North Europe isconsidered as an independent market;
� Assume n liner carriers L1, L2 . Li. Ln have been identified inthis shipping lane. Carriers provide similar weekly service andhave a regular weekly demand of qi for carrier Li respectively;
� The market demand Q as well as individual demand qi isfluctuant in certain period;
� Carriers are free to form coalitions. Vessel sharing and vesselpooling are recognized as available strategies for all possiblecoalitions and carriers can retain their market organization.
� Coalitions will probably deploy larger ships in order to meetthe combined demands Q from alliance’s member. If {L1, L2, L3}is a grand coalition, the joint-ship size of {L1, L2, L3} is siþn. Forany two carrier coalition {Li, Lk}, the joint-ship size is siþk. Forany single carrier Li, its ship size is si;
� There are 8 sizes of ships available for carriers to deploy in thisshipping lane and the minimum increment of ship size is 2000TEU.We define that s1 is 6000 TEU ship, s2 is 8000 TEU ship ands8 is 20000 TEU ship accordingly. Any carrier i in this shippinglane must have si � qi;
� The unit cost per TEU for ship si is c(si).
Based on the hypotheses, two cost functions are identified asf(qi) and g(qi). f(qi) indicates unit cost of different ship size whenships are fully loaded. g(qi) denotes the unit cost for ship si with
D. Yang et al. / Research in Transportation Economics 32 (2011) 15e24 17

Author's personal copy
variable loading factors. Especially, the loading factors of onecertain ship also can be looked as carry capacity.
f ðqiÞ ¼�cðs1Þ qi � s1cðsnÞ sn�1 � qi � sn
�n ¼ 1;2;3.
gðqiÞ ¼ cðsiÞ$siqi
qi � si
Fig. 1 presents the unit costs of different ship sizes in a certainEurope - Far East trade lane from literature. Fig. 2 shows thechange of unit costs with increasing loading factors based on datafrom Fig. 1.
Fig. 1 indicates that f(qi) is a decreasing segment functioncomposed by a series of sub-functions corresponding to differentship sizes. It can be noted that the marginal unit cost is decreasingwith ship size increasing which means the unit cost is less elastic toship size. In contrast, g(qi) is a continuous sloping-down concavefunction to a certain ship size si. Given the demand volume, wehave:
f�qi þ qj
��qi þ qj
� � f ðqiÞqi þ f�qj�qj
g�qi þ qj
��qi þ qj
� � gðqiÞqi þ g�qj�qj qi; qj; qi þ qj � si
This characteristic is defined as sub-additivity, which is an impor-tant concept in game theory. Any cost saving strategies must besupported by stable solutions which are non-empty core, if itscharacteristic function is sub-additive.
If the carriers decide to form an alliance and share their vessels,the total weekly demand Q in all probability will exceed the indi-vidual capacity in use, i.e. any si. This means a larger ship siþnwill beneeded in the joint-service that will lead to changes of both loadingfactors and ship sizes. As a result, the cost function of joint-servicestrategy, expressed by h(qi) as Fig. 3 shows, can be calculated by f(qi)∙g(qi). h(qi) is the unit cost for cooperative operation and has nocharacteristic of sub-additivity. h(qiþqj)(qiþqj) can be either greateror less than h(qi)qi þ h(qj)qj.
As is shown in Fig. 3, different curves present unit costs ofdifferent given ship sizes. The optimal unit cost (h(Q)) for cooper-ative operation is marked with shadows, which refers to the unitcost of only one larger ship deployed in the market to meet theweekly demand of all members.
The unit cost function for individual carrier in competitivemarket is:
hðqiÞ ¼
8>><>>:
cðs1Þsiqi
qi � s1
cðsnÞsnqi
sn�1 < qi � sn
The average unit cost function for the competitive market is:
h�X
qi�
¼X
i¼1.n
mðsiÞcðsiÞsiPi¼1.n
qiqi � s1
Here, m(si) indicates the number of si size ship that is deployed inthe market. We then have the collective unit cost function for thegrand alliance in the market:
hðQÞ ¼
8>><>>:
cðs1ÞsiQ
Q � s1cðsnÞsn
Qsn�1 < Q � sn
Q ¼X
qi
Generally speaking, cooperative agreement among alliancemembers is only valid over a specific period of time. Therefore weassume that this cost function is suitable to consider short-termmarket and will rarely have any impact on long-term market.
5. Empty core in liner shipping market
Imagine there are three carriers L1, L2 and L3 that serve thisshipping lane. In Fig. 4, the competitive cost function C1 shows thecase where L1 is the only carrier in the market who deploys6000 TEU ships to provide weekly service. Now suppose L2 and L3then enter the market in sequence and also deploy 6000 TEU ships
Fig. 1. Unit costs of different size of container ships when fully loaded. Source:Author’s elaboration with data from Veldman 2009.
Fig. 2. Unit costs of different size of container ships with different loading factors.Source: Authors’ own composition.
Fig. 3. Optimal unit cost of cooperative operation. Source: Authors’ own composition.
D. Yang et al. / Research in Transportation Economics 32 (2011) 15e2418

Author's personal copy
to provide weekly service separately. We use C2 and C3 to presentcompetitive average cost functions of the market when there aretwo and three carriers in the market, respectively. Assume twodemand curves D2 and D3 which are less elastic than the cost havebeen fixed, then the follows deserve discussion regarding Figs. 4and 5.
In Fig. 4, point P1 is the intersection of demand curveD2 and costfunction C2. The part of C2 to the left of P1 indicates that themarginal cost fails to cover unit operating cost when carrier oper-ates below capacity. In practice it implies that when there is excesscapacity than the demand, then at least one carrier is not able to fillhis ship to its profitable capacity. To meet the shippers’ demands,carriers would have to accept the loss by running at lower loadingfactors or even keeping the ship idle to save avoidable cost.Mathematically, it is expressed as h(
Pqi) >c(si).
When there is no profit in the market, the core is emptyaccording to core’s first condition of profitability. The area to theright of point P1 on the contrary means it is profitable of twocarriers when the market demand is between P1 and 12000 TEU.But when the market demand exceeds 12000 TEU, demand cannotbe met because the two carriers in the market can only offer a totalcapacity of 12000 TEU (by two ships) at the cost of P2. Since themarket is free entry, a third carrier must enter the market to meetthe exceeded demand. Assume the new entry also brings ina capacity of 6000 TEU, then the competition will probably drivethe average unit cost to curve C3. Suppose the demand has widedeviation from D2 to D3 (Demand increases but the elasticity ofprice and demand remain the same), the situation will repeat and
there is no way out with empty core dilemma. Pirrong (1992)indicates that “the divergence between minimum acceptable andmaximum feasible surplus does not systematically decline even inlarge markets with lumpy commodity”. When there are disconti-nuities in marginal costs, one cannot expect the market size tomitigate the severity of empty core problems. Excess capacityoccurs periodically due to variations in demand and hence the coreis periodically empty. Due to this character, collusion appearedsince the beginning of liner market formation. Carriers built theconference system to specify output quotas or prices tomitigate theseverity of core.When freight rate is set higher than the cost at P1 orwhen the market capability supply is less than the demand of P1,core will not be empty no matter how demand changes. Howeverthese regulations have been prohibited with the collapse ofconference system in some regions and instead strategic allianceshave been promoted. The following issues are then derived fromthe above mentioned discussion: 1) what happens in the market ifnew forms of cooperative strategies appear, e.g., deployment jointmega container ships; 2) how new phenomena and trends affectthe conditions of empty core.
Suppose a slump market where the core is empty, carrier L1, L2and L3 decide to form an alliance through sharing or pooling vesselsto avoid lost. They employ a larger ship to provide weekly service toall their customers. Assume 5 ship sizes from 6000 TEU to14000 TEU are available for sharing or pooling. Fig. 5 shows theh(Q) under the market demand condition of D2 which is totallysame D2 in Fig. 4. It is obvious that the alliance can save costs andavoid the periodical empty core under such condition.
Fig. 4. Cost function of competitive liner market. Source: Adapted from Sjostrom(1989).
Fig. 5. .Cost function of cooperative liner market. Source: Authors’ own composition.
Fig. 6. Comparison of cost function of competitive and cooperative liner market.Source: Authors’ own composition.
Fig. 7. Comparison of profit function of competitive and cooperative liner market.Source: Authors’ own composition.
D. Yang et al. / Research in Transportation Economics 32 (2011) 15e24 19
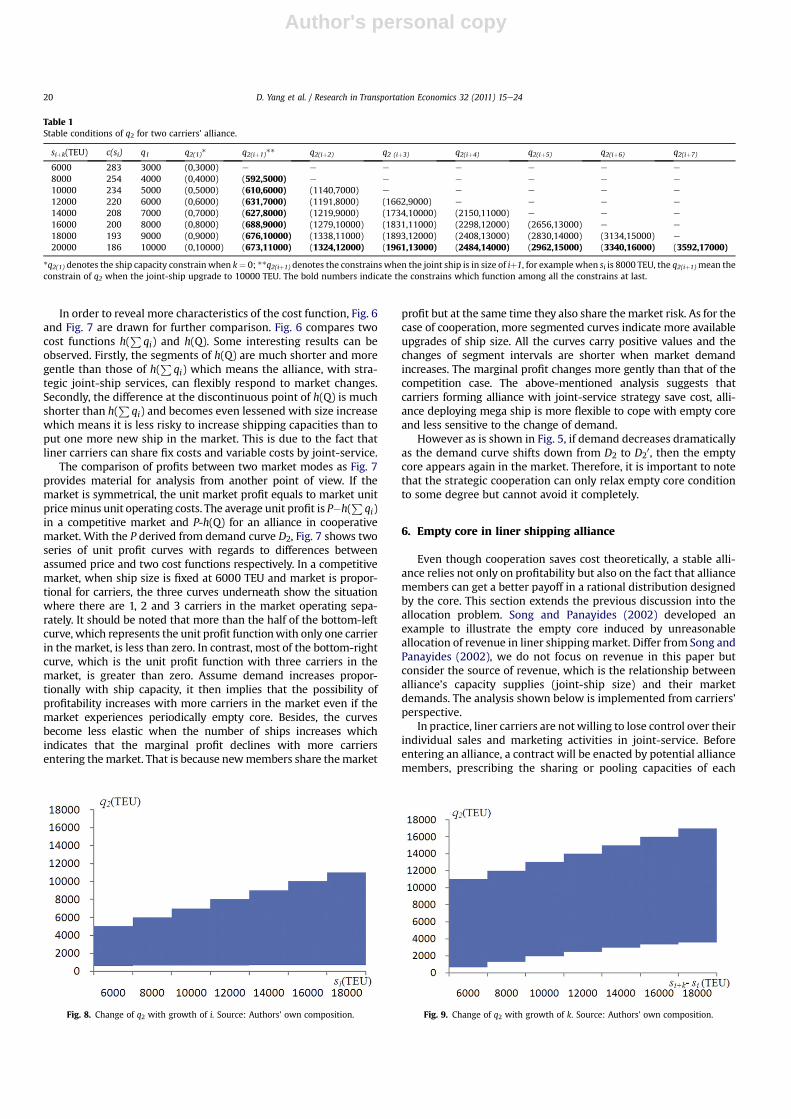
Author's personal copy
In order to reveal more characteristics of the cost function, Fig. 6and Fig. 7 are drawn for further comparison. Fig. 6 compares twocost functions h(
Pqi) and h(Q). Some interesting results can be
observed. Firstly, the segments of h(Q) are much shorter and moregentle than those of h(
Pqi) which means the alliance, with stra-
tegic joint-ship services, can flexibly respond to market changes.Secondly, the difference at the discontinuous point of h(Q) is muchshorter than h(
Pqi) and becomes even lessened with size increase
which means it is less risky to increase shipping capacities than toput one more new ship in the market. This is due to the fact thatliner carriers can share fix costs and variable costs by joint-service.
The comparison of profits between two market modes as Fig. 7provides material for analysis from another point of view. If themarket is symmetrical, the unit market profit equals to market unitpriceminus unit operating costs. The average unit profit is P�h(
Pqi)
in a competitive market and P-h(Q) for an alliance in cooperativemarket. With the P derived from demand curve D2, Fig. 7 shows twoseries of unit profit curves with regards to differences betweenassumed price and two cost functions respectively. In a competitivemarket, when ship size is fixed at 6000 TEU and market is propor-tional for carriers, the three curves underneath show the situationwhere there are 1, 2 and 3 carriers in the market operating sepa-rately. It should be noted that more than the half of the bottom-leftcurve, which represents the unit profit functionwith only one carrierin the market, is less than zero. In contrast, most of the bottom-rightcurve, which is the unit profit function with three carriers in themarket, is greater than zero. Assume demand increases propor-tionally with ship capacity, it then implies that the possibility ofprofitability increases with more carriers in the market even if themarket experiences periodically empty core. Besides, the curvesbecome less elastic when the number of ships increases whichindicates that the marginal profit declines with more carriersentering themarket. That is because newmembers share themarket
profit but at the same time they also share themarket risk. As for thecase of cooperation, more segmented curves indicate more availableupgrades of ship size. All the curves carry positive values and thechanges of segment intervals are shorter when market demandincreases. The marginal profit changes more gently than that of thecompetition case. The above-mentioned analysis suggests thatcarriers forming alliance with joint-service strategy save cost, alli-ance deploying mega ship is more flexible to cope with empty coreand less sensitive to the change of demand.
However as is shown in Fig. 5, if demand decreases dramaticallyas the demand curve shifts down from D2 to D2
0, then the emptycore appears again in the market. Therefore, it is important to notethat the strategic cooperation can only relax empty core conditionto some degree but cannot avoid it completely.
6. Empty core in liner shipping alliance
Even though cooperation saves cost theoretically, a stable alli-ance relies not only on profitability but also on the fact that alliancemembers can get a better payoff in a rational distribution designedby the core. This section extends the previous discussion into theallocation problem. Song and Panayides (2002) developed anexample to illustrate the empty core induced by unreasonableallocation of revenue in liner shippingmarket. Differ from Song andPanayides (2002), we do not focus on revenue in this paper butconsider the source of revenue, which is the relationship betweenalliance’s capacity supplies (joint-ship size) and their marketdemands. The analysis shown below is implemented from carriers’perspective.
In practice, liner carriers are not willing to lose control over theirindividual sales and marketing activities in joint-service. Beforeentering an alliance, a contract will be enacted by potential alliancemembers, prescribing the sharing or pooling capacities of each
Table 1Stable conditions of q2 for two carriers’ alliance.
siþk(TEU) c(si) q1 q2(1)* q2(iþ1)** q2(iþ2) q2 (iþ3) q2(iþ4) q2(iþ5) q2(iþ6) q2(iþ7)
6000 283 3000 (0,3000) e e e e e e e
8000 254 4000 (0,4000) (592,5000) e e e e e e
10000 234 5000 (0,5000) (610,6000) (1140,7000) e e e e e
12000 220 6000 (0,6000) (631,7000) (1191,8000) (1662,9000) e e e e
14000 208 7000 (0,7000) (627,8000) (1219,9000) (1734,10000) (2150,11000) e e e
16000 200 8000 (0,8000) (688,9000) (1279,10000) (1831,11000) (2298,12000) (2656,13000) e e
18000 193 9000 (0,9000) (676,10000) (1338,11000) (1893,12000) (2408,13000) (2830,14000) (3134,15000) e
20000 186 10000 (0,10000) (673,11000) (1324,12000) (1961,13000) (2484,14000) (2962,15000) (3340,16000) (3592,17000)
*q2(1) denotes the ship capacity constrain when k¼ 0; **q2(iþ1) denotes the constrains when the joint ship is in size of iþ1, for example when si is 8000 TEU, the q2(iþ1)mean theconstrain of q2 when the joint-ship upgrade to 10000 TEU. The bold numbers indicate the constrains which function among all the constrains at last.
Fig. 8. Change of q2 with growth of i. Source: Authors’ own composition. Fig. 9. Change of q2 with growth of k. Source: Authors’ own composition.
D. Yang et al. / Research in Transportation Economics 32 (2011) 15e2420

Author's personal copy
member. Conventionally, this is decided by their current marketshare. Therefore their voyage costs after cooperation are also ina large degree proportional to their previous transport capability inthe market. In another word, the carriers’ voyage costs pre-allianceand post-alliance are in the same structure. On the other hand, asmany large ships have already been ordered, we assume the capitalcosts of these vessels are not affected by the cooperative strategies.Therefore carriers’ capital costs will not be taken into consideration.Note that in the following analysis, we consider the carriers’ voyagecosts are in the same proportion pre-alliance and post-alliance.
The following case illustrates the situation in which a profitablecooperation still has an empty core. Imagine s1 ¼ s2 ¼ s3 ¼ 6000TEU, q1 ¼ q2 ¼ 4900 TEU, q3 ¼ 2300 TEU. If there forms a grandcoalition {L1, L2, L3} through deploying a 14000 TEU ship, then theunit cost h(Q) is 241 based on the cost function built in Section 4.The h(q1), h(q2) and h(q3) can also be obtained as 347, 347 and 738,respectively. Because h(Q) < h(qi), the grand coalition is profitablethan carriers operating individually. However, the cooperation of{L1, L2, L3} is not stable since a sub-coalition {L1, L2} has a lower unitcost of 239 by deploying a 10000 TEU joint-ship. Therefore the corefor grand coalition {L1, L2, L3} in this market is empty.
Core theory can be used to identify which coalition is stable andwhat is the optimal number of qi for the coalition members.According to the description in Section 3, the core’s condition forgrand coalition N ¼ {L1, L2, L3} in this market is:
hðq1 þ q2 þ q3Þ ¼ hðQÞ
hðq1 þ q2Þ � minðhðq1Þ;hðq2ÞÞ
hðq1 þ q2 þ q3Þ � minðhðq1 þ q3Þ; hðq1 þ q2Þ; hðq2 þ q3ÞÞThese equations mean that the unit cost of the grand coalitionshould be less than any possible sub-coalition of these members. Asshown in Section 5, they also indicate that marginal profit ofoperating slots for the alliance should be greater than the marginalcost including updating ship size.
Assume the cooperation starts from a two carriers’ coalition andis then extended to a three carriers’ coalition. When two carriers’alliance {L1, L2} forms, the following equations hold for cost function:
q2 � siþk � q1
cðsiþkÞsiþk=ðq1 þ q2Þ ¼ cðsiÞsi=q1ðq2Þ; k ¼ 0;1;2;3.qi; q2� si; q1 þ q2 � siþn
Since c(si), c(siþk) and si, siþk are known, if q1 is fixed, then therelationship of q1 and q2 is
q2 � ��C�sðiþkÞ
�sðiþkÞ
��ðCðsiÞsiÞ � 1�q1
In order to keep the core of {L1, L2} non-empty, ally L20s oper-ating slot q2 is decided by two parts. The first part is the ratiobetween alliance’s joint-ship cost c(siþk)siþk and the original ship’sindividual cost c(si)si. The second deciding factor is q1. Assume the
market is slump and q1 is down to half of its weekly supply si, thenthe boundary conditions of q2with increasing sizes of joint-ship arecalculated.
When k ¼ 0, the maximal q2 equals to the remaining slots of L1’scapacity supply which is si/2. If k > 0 (k ¼ 1.7), the row of q2(iþk)
shows possible q2 to keep the alliance’s core non-empty when theship is upgraded to siþk size. Because there are two variables i and k,it is interesting to investigate the changes of q2 in two scenarios.
Firstly, fix k to 1 and increase i, this means the incrementbetween L1’s ship si and joint-ship siþk for {L1, L2} is always2000 TEU but si increases from 6000 TEU to 18000 TEU and siþ1
increases from 8000 TEU to 20000 TEU accordingly. Secondly, fix ito 1 and increase k, this means L1’s ship si is constantly 6000 TEUbut the joint-ship size siþk increases from 8000 TEU to 20000 TEU.
Table 1 shows the boundaries of q2 under different constraints.The row of q2(iþ1) gives the trend of q2 in the first scenario and thelast column for the second scenario.
Fig. 8 and Fig. 9 are drawn in order to illustrate the two scenariosin a more explicit way. As Fig. 8 shows, in scenario 1 the increase ofq2’s lower boundary can almost be ignored comparing to thesignificantly increase of its upper boundary. As a result, q2 is stable ina much broader area when i becomes relatively large. It implies thatin order to keep core non-empty for the two carriers’ alliance {L1, L2},L2 turns to havemore choiceswith the growth of ship size si of L1 andsiþ1 of {L1, L2} at the same time. Fig. 9 presents that although q20slower boundary shows a clear growth, the increase of q2’s stable areais still apparent with increase of k. This is because the increase rate oflower boundary is slower than that of the upper boundary. It impliesthe range of choice for L2 also becomes wider when the incrementbetween joint-ship size s1þk and L1’s ship size si increases.
In summary, the above results show that the low boundary of q2is only slightly change with increase of the joint ship size no matterwhat s1 is. It reveals that the stability of cooperation is not affectedsignificantly by the increasing marginal unit cost of larger ship intwo carriers’ coalition. On the other hand, the upper boundaryequals to the joint ship’s capacity in both scenarios and increases
Table 2Stable conditions of q3 when k ¼ 1, n ¼ 2 and q2 is relatively weak.
si(TEU) siþk siþn q1 q2 q31 q3
2 q33 q3
4 q35 q3
6 q37 q3
6000 8000 10000 3000 592 �6408 ‡548 £885 �19082 ‡548 �331 �9453 (548,885)8000 10000 12000 4000 610 �7390 ‡582 £835 �31097 ‡582 ��3818 �15476 (582,835)10000 12000 14000 5000 631 �8369 ‡588 £1036 �47212 ‡588 ��4846 �23091 (588,1036)12000 14000 16000 6000 627 �9373 ‡652 £377 �60392 ‡652 ��5866 �31096 (652,377)14000 16000 18000 7000 688 �10312 ‡649 £1150 �82192 ‡649 ��6868 �40233 (649,1150)16000 18000 20000 8000 676 �11324 ‡649 £1037 �106324 ‡649 ��7888 �52408 (649,1037)
Fig. 10. Change of stable area of q3 with growth of k (large q2). Source: Authors’ owncomposition.
D. Yang et al. / Research in Transportation Economics 32 (2011) 15e24 21

Author's personal copy
significantly comparing to increasing marginal unit cost. Therefore,in a two carriers’ coalition, L1 has broader chances to find an ally L2when s1 is relatively large.
In general, a game with more than two players shows morecharacteristics of core theory. Suppose a third carrier L3 enters themarket, core’s condition of grand coalition { L1, L2, L3 } is then:
q3 ¼ siþn�q2�q1 (1)
cðsiþnÞsiþn=ðq1 þ q2 þ q3Þ � cðsi þ kÞsiþk=ðq1 þ q2Þ;k;n ¼ 0;1;2;3.q1 ¼ si; q1 þ q2 ¼ si þ k fL1; L2g ð2Þ
cðsiþnÞsiþn=ðq1 þ q2 þ q3Þ � cðsi þ kÞsiþk=ðq1 þ q3Þ;k;n ¼ 0;1;2;3.q1 ¼ si; q1 þ q2 ¼ si þ k fL1; L2g ð3Þ
cðsiþnÞsiþn=ðq1 þ q2 þ q3Þ � cðsi þ kÞsiþk=ðq2 þ q3Þ;k;n ¼ 0;1;2;3.q1 ¼ si; q1 þ q2 ¼ si þ k fL1; L2g ð4Þ
cðsiþnÞsiþn=ðq1þq2þq3Þ� cðsiÞsi=q1; k; n ¼ 0;1;2;3.q1 � si;q1þq2 � siþk;q1þq2þq3 � siþn L1 ð5Þ
cðsiþnÞsiþn=ðq1þq2þq3Þ� cðsiÞsi=q2; k; n ¼ 0;1;2;3.q1 � si;q1þq2 � siþk;q1þq2þq3 � siþn L2 ð6Þ
cðsiþnÞsiþn=ðq1þq2þq3Þ� cðsiÞsi=q3; k; n ¼ 0;1;2;3.q1 � si;q1þq2 � siþk;q1þq2þq3 � siþn L3 ð7Þ
The relationships of q3 and q1, q2 then can be expressed as:
q3 ¼ siþn�q2�q1;
q3 � ðq1 þ q2ÞCðsiþnÞsiþn
CðsiþkÞsiþk� 1
;
q3 � CðsiþkÞsiþk
CðsiþnÞsiþn � CðsiþkÞSiþkq2 � q1;
q3 � CðsiþkÞsiþk
CðsiþnÞsiþn � CðsiþkÞSiþkq1 � q2
q3 � CðsiþnÞsiþn � CðsiÞsiCðsiÞsi
q1 � q2;
q3 � CðsiþnÞsiþn � CðsiÞsiCðsiÞsi
q2 � q1;
q3 �
CðsiÞsiCðsiþnÞsiþn � CðsiÞsi
q1 þ q2
Set q1 to si/2. When i ¼ k ¼ n, L2 and L3 will share the remainingjoint-ship capacity of L1 as si/2. If i ¼ k � n, then it becomes a two
carriers’ game. Therefore we only consider scenarios wheni < k < n. Three scenarios are prepared as follows in order to lookinto the relationship among q1, q2 and q3.
In the first scenario, we suppose k ¼ 1 and n ¼ 2 constantly. Setq2 to be the lower boundaries of two carriers’ coalition as is shownin the row of q2(iþ1) of Table 1 and we change n. Table 2 shows theboundary conditions of q3 under these assumptions. q13 to q73corresponds to the core’s conditions from equation (1)e(7). Theseequations carry different implications. For examplewhen si¼ 6000,siþk ¼ 8000, siþn ¼ 10000 and q2 is fixed at 592. We can obtain 7boundaries for q3 from equation (1)e(7) as the first row of Table 2shown. The final stable area of q3 is between the smallest upperboundary in equation (6) and the largest lower boundary fromequation (4) as (548,885). The lower boundary of q3 needs to behigher than 548 because otherwise the sub-coalition {L1, L2} or {L1}will overtake the grand coalition {L1, L2, L3}. It means the total Q for{L1, L2, L3} is not significant enough to reach the profitable loadingfactor for joint-ship siþn in order to achieve lower unit cost thanthat of {L1, L2} or {L1} in practical. This value is shown by the pointMas an example in Fig. 5. q3 also needs to be less than 885 otherwisesub-coalition {L1, L3} will be formed instead. From the cost functionin Fig. 5 we can observe that the unit cost of larger ship is less elasticto the demand than that of smaller ship. Therefore when q3 is largeenough to achieve lower unit cost for {L1, L3}, there is no reason forL1 and L3 to accept L2 to form the grand coalition {L1, L2, L3}. Fig. 10shows the stable operating area of q3 in this scenario, which doesnot change much with the increase of i. In particular, core iswhatever empty when si, siþk, siþn are 10000, 12000 and 14000respectively. In short, when q2 is as small as the lower boundary fortwo carriers’ coalition, the stable area for L3 is very limited andhardly affected by the growth of ship size.
The following scenario exams q3 when q2 is large. Still assumingk ¼ 1 and n ¼ 2 but set q2 to the upper boundary of two carriers’coalition. Thenwe have Table 3 accordingly. The lower boundary ofq3 is now only from restriction of {L1, L2} but the upper boundary ofit is replaced by the joint-ship size limitation. Fig. 11 shows thestable area for the q3 in this scenario, the area is a little wider than
Table 3Stable conditions of q3 when k ¼ 1, n ¼ 2 and q2 is relatively strong.
si(TEU) siþk siþn q1 q2 q31 q3
2 q33 q3
4 q35 q3
6 q37 q3
6000 8000 10000 3000 5000 £2000 ‡1220 £29791 �14674 ‡�3860 ��1100 �21050 (1220,2000)8000 10000 12000 4000 6000 £2000 ‡1262 £43561 �25707 ‡�4809 ��2213 �33571 (1262,2000)10000 12000 14000 5000 7000 £2000 ‡1254 £61980 �40843 ‡�5781 ��3293 �49211 (1254,2000)12000 14000 16000 6000 8000 £2000 ‡1377 £75358 �53019 ‡�6721 ��4295 �65692 (1377,2000)14000 16000 18000 7000 9000 £2000 ‡1351 £99560 �73880 ‡�7662 ��5280 �83728 (1351,2000)16000 18000 20000 8000 10000 £2000 ‡1346 £125750 �97000 ‡�8676 ��6345 �10873 (1346,2000)
Fig. 11. Change of stable area of q3 with growth of i (small q2). Source: Authors’ owncomposition.
D. Yang et al. / Research in Transportation Economics 32 (2011) 15e2422

Author's personal copy
previous scenario but it is slightly declining when the ship sizeincreases.
The third scenario naturally focuses on the change of q3 causedby the increase of q2 when q1 is si/2, and si, siþk, siþn are fixed to16000, 18000 and 20000 TEU, respectively. Table 4 illustrates theboundaries of q3 in this scenario. the lower boundary is still underrestriction from {L1, L2}, however the upper boundary is muchdifferent with the previous scenarios. it is inverted ‘L’-shaped asFig. 12 shows. the left part increases sharply and it is constrainedfrom the condition of the sub-coalition {L1, L3}. the right part isunder the capacity limitation of joint-ship, which is siþneq1eq2,since siþneq1 is constant under our assumption, this limitation isliner regressive with q2. the intersection point is the maximumvalue of q3, which is (c(siþn)siþn-c(siþk)siþk)/c(siþn), equals to10609TEU. This value in meaning actually indicates that the profit withincremental demands brought by L3 to the grand alliance {L1, L2, L3}needs at least more than the cost for upgrading ship size from siþk
to siþn. q2 at this point is 1391 TEUThe three scenarios demonstrate that the stable area of q3 is
not affected significantly by the magnitude of ship size if q1 and q2are fixed. If only q1 is fixed, there is a maximum option for q3 withthe change of q2. In another word, it implies that the third ally L3 ismuch dependent on q2. In the illustrative case, under theassumption of certain joint-ship size, the two carriers’ coalitionwhich includes one carrier with large demand (8000 TEU) and theother one with relatively small demand in number (1391 TEU) hasthe most potential to take in new member. The choice areadeclines at both side of this number. The left side decreases fasterthan the right side, which means the increase of ship size is lesselastic to the feasible choices of q3 than the threaten from sub-coalition {L1, L2}, but the threaten from sub-coalition {L1, L2}only functions in a very narrow area (less than 1391 TEU in thescenario). To sum up, the optimal combination of liner shippingalliance can be evaluated by the demands and capacity of jointship size of alliance and the stable structure can be forecastedthrough core theory.
7. Conclusions and further research
International shipping market can be recognized as an unstablemarket inwhichmore andmore carriers adopted shipping alliancesas their strategy to ensure operations and market shares. This isparticularly true with increasing ship size where alliance has theadvantage to guarantee loading factors and reduce voyage cost.However, participating alliance or employing bigger ships can onlyhelp to avoid the uncertainties to some degree but is not always theperfect solution to the ever-changing market.
To the authors’ best knowledge, this paper is the first attempt totake both the mega container ships and alliance’s strategy togetherinto consideration and apply core theory to investigate the influ-ence of increasing ship size to the stability of shipping alliance. Twoconditions of core theory, i.e., profitability and inner profit alloca-tion, are mentioned and applied in the analyses of this research.The former condition is proved by introducing a cost function forliner shipping alliance that adopts the strategy of joint-service. Theperiodically empty core of shipping market caused by unprofit-ability is explained firstly. Joint-mega ship strategy adopted by analliance in the hope of reducing unit costs of its members. Althoughthe strategy does not prevent empty core from appearing period-ically, it is proved that they indeed improve the alliance’s stabilityto some degree. In order to further describe how this strategyinfluences the stability of alliance, the latter condition–profitallocation principles are discussed in the text of alliance capacitysupply and demand structure. As for two carriers’ alliance, if onecarrier’s demand is fixed, the slow-growing slot marginal cost ina large ship will increase the lower boundary of the cooperator butis negligible when the growth of upper boundary caused by theincreasing ship size is taken into consideration. This means that theadvantage of employing larger vessels to overcome empty corebecomes more significant with increasing ship sizes. Regardingthree carriers’ alliance, the situation is more complex but alsomanifests more interesting implications. When the demands oftwo liner carriers are fixed, the demand limitation to the third allybrought by the increasing ship size is not apparent. The lowerboundary of the third carrier is always restricted by the possibleovertaken of sub-coalition composed by the original existing twocarriers because of its even lower unit cost. The upper boundary isrestricted either by the possible overtaken of sub-coalitioncomposed by the existing relatively large carrier and the newcomer when the other existing carrier is relatively small in demandor by joint-ship capacity when the other existing carrier is rela-tively large in demand. When only one existing liner carrier’sdemand and joint-ship size are fixed and another’s demand is setas the independent variable to the third comer’s demand, a certainnumber of the second carrier’s demand can be calculated asoptimal, in which the third ally has the widest choice of itsdemand. If the second carrier’s demand is larger than this number,whether the core is empty or not depends on the capacity limita-tion of the joint-ship, otherwise it depends on the possible over-taken of sub-coalition composed by the first and the secondcarriers. In general, the alliance’s stability is significantly related to
Fig. 12. Change of stable area of q3 with growth of q2. Source: Authors’ owncomposition.
Table 4Stable conditions of q3 with the growth of q2.
si(TEU) siþk siþn q1 q2 q31 q3
2 q33 q3
4 q35 q3
6 q37 q3
16000 18000 20000 8000 650 £11350 �647 £694 £106350 ‡674 ‡�7892 £52253 (647,694)16000 18000 20000 8000 1000 £11050 �673 £5375 £106000 ‡324 ‡�7834 £54367 (673,5375)16000 18000 20000 8000 1391 £11000 �702 £10609 £105609 ‡�67 ‡�7770 £56731 (702,10609)16000 18000 20000 8000 1391 £10609 ‡702 £10605 £105609 ‡�67 ‡�7770 £56729 (702,10605)16000 18000 20000 8000 4000 £10609 ‡897 £45500 £103000 ‡�2676 ‡�7338 £72490 (897,8000)16000 18000 20000 8000 6000 £9000 ‡1047 £72250 £101000 ‡�4676 ‡�17007 £84571 (1047,6000)
D. Yang et al. / Research in Transportation Economics 32 (2011) 15e24 23

Author's personal copy
the structure of member’s demands and joint-ship’s capacity whenthey decide to use joint-service strategy.
Although the anti-trust legislation has been promoted torestrain the conference system, many new alternative strategieshave appeared in the market to avoid empty core. It is the authors’hope that this study will enhance understanding and decision-making behavior in liner shipping sector.
Due to limited time and data access, the authors recognize thatthere is still space to further study this topic. Potential directionsinclude, but are not limited to: 1) to consider more factors regardingstrategies of deploying mega container ships such as using newshipping lanes or reducing frequencies; 2) to investigate other formsof cooperation in liner shipping industry; 3) to look into cases withmore than three players and 4) to obtain precise data and morepractical information on demand curve and alliance’s operation inorder to describe the market in a more appropriate manner.
References
Agarwal, R., Ergun, O., 2009. Network design and allocation mechanisms for carrieralliances in liner shipping. Submitted and under revision for Operations Research.
Brooks, M. R. (2000). Sea change in liner shipping: Regulation and managerialdecision-making in a global industry. Pergamon.
Button, K. J., & Nijkamp, P. (1998). Economic Stability in Network Industries,Transport Research Part E. Logistics and Transportation Reviews, 34E(1), 13e24.
Button, K. (2003). Does the theory of the ‘core’ explain why airlines fail to covertheir long-run costs of capital? Journal of Air Transport Management, Vol 9(Issue1, January 2003), 5e14.
Cariou, P., 2002. Strategic alliances in liner shipping: an analysis of "operationalsynergies". Working paper.at Laboratoire d’Economie de Nantes e CORRAILUniversity of Nantes.
Haralambides, E. H., Benacchio, M., & Cariou, P. (2002). Costs, benefits and pricing ofdedicated container terminals. International Journal of Maritime Economics, Vol.4-1(March), 21e34.
Imai, A., Nishimura, E., Papadimitriou, S., & Liu, M. (2006). The economic viability ofcontainer mega ships. Transportation Research Part E, 42(1), 21e41.
Krajewska, M. A., & Kopfer, H. (2006). Collaborating freight forwarding enterprisesrequest allocation and profit sharing. OR Spectrum, 28, 301e317.
Pirrong, S. (1992). An application of the core theory to the analysis of ocean ship-ping markets. Journal of Law and Economics, 35, 89e131.
Poulsen, R. T. (2007). Liner shipping and technological innovation: ostasiat and thecontainer revolution, 1963e75. Scandinavian Economic History Review, 55,83e100.
Ryoo, D. K., & Thanopoulou, H. A. (1999). Liner alliances in the globalisation era:a strategic tool for Asian container carriers. Maritime Policy & Management, Vol.26(No. 4), 349e367.
Sjostrom, W. (1989). Collusion in ocean shipping: a test of monopoly and emptycore models. Journal of Political Economy, Vol. 97, 1160e1179.
Sjostrom, W. (1993). Antitrust immunity for shipping conferences: an empty coreapproach. Antitrust Bulletin, 38, 419e423.
Song, D. W., & Panayides, M. (2002). A conceptual application of cooperative gametheory to liner shipping strategic alliances. Maritime Policy and Management,Vol. 29(No.3), 285e301.
Stopford, M. (2009). Maritime economics. Routledge.Veldman S., 2009. Past and future development of containership size. Conference
proceedings of annual conference of the International Associate of MaritimeEconomists, 2009.
Yang, D., & Odani, M. (2005). Study on finding expected share for logisticscompanies in a cooperative transport system. In Proceedings of the fifth inter-national conference on traffic and transportation studies (pp. 134e145).
Zhao, J. (2009). Estimating merging costs by merger preconditions. Theory andDecision, 66, 373e399.
D. Yang et al. / Research in Transportation Economics 32 (2011) 15e2424

Netnomics (2010) 11:1–4DOI 10.1007/s11066-010-9053-2
EDITORIAL
Design and evaluation of transportationnetworks: constructing transportation networksfrom perspectives of service integration,infrastructure investment and informationsystem implementation
Xiaoning Shi · Thierry Vanelslander
Published online: 1 June 2010© Springer Science+Business Media, LLC 2010
Many enjoy services that are provided by current transportation networksworldwide. Meanwhile, researchers are engaged in further improving thetransport services by various means, e.g., service integration, infrastructureinvestment and information systems implementation. The main aims of suchimprovements would be to enhance human well-being, eliminate externalities,facilitate decision making processes, etc.
In an attempt to show readers of this journal, especially those who majorin kinds of perspectives of transportation, a number of critical ideas and casesdemonstrating how transport research can be of help both in daily business andpolicy making, this special issue on Design and Evaluation of TransportationNetworks was set up.
Firstly, it is now clear that the transportation business features verticaland horizontal integration together with competition [1, 2]. Transportationnetworks are then constructed from the infrastructural perspective as well
X. Shi (B)Institute of Information Systems, University of Hamburg,Von-Melle-Park 5, 20146 Hamburg, Germanye-mail: [email protected]
X. ShiShanghai Jiao Tong University, 1954 Hua Shan Road,Shanghai 200030, People’s Republic of China
T. VanelslanderDepartment of Transport and Regional Economics, University of Antwerp,Prinsstraat 13, 2000 Antwerpen, Belgiume-mail: [email protected]

2 X. Shi, T. Vanelslander
as from the service perspective. Since the start of the current financial crisis,the on-going integration within the transportation industry, to a great extent,seems to have come to a temporary halt. However, if we have a look at what theresearch & development departments of nearly all transport service providersare now focusing on, the cumulated power of the next round of integration andcompetition can be felt and a reboot of infrastructure investment is to materi-alize as soon as the economy situation turns brighter again. In the meantime,many transportation providers may not survive the economic downturn. Thisshort-run perspective is not the core focus of this special issue. However, someof its papers put attention to short-run issues, like the elastic demand of facilityfactors, the analysis of what is extremely valuable in view of the current over-capacity situation and similar factors.
Secondly, from the perspective of information systems implementation,many actors involved in the transportation networks are eager to constructor implement more effective and efficient decision support systems and ap-propriate portals. This kind of decision support tools seems indispensableto reach the aforementioned service integration in a smooth way. However,there are some practical issues that need attention. For instance, a conflicton data sharing might occur between those business-related agents. Imaginethat a liner shipping company, as one of the papers in this special issuementions, would make her operational and consequent financial analysisbased on the fleet schedule, but that port operators would not like to sharetheir operational details with the liner shipping carrier during the negotiationprocedures. Hence, it would be hard for the liner to choose ports of call andconsequently to optimize its schedule. Another instance of such conflict of datasharing could be the reluctance to co-operate with adjacent local authorities,especially when they are governing almost the same hinterland. Regionalor local authorities could be of help to implement for instance a commoninformation platform. If such co-operation is not possible, it might be hardto reach optimal planning from the perspective of many of the chain playersinvolved, which is detrimental to the entire supply chain in the end. Equally,such tool could be of great help to governments in optimally planning theirports and hinterland connections.
Thirdly, specific interest goes to the perspective of passenger transportation.The environment needs to be protected in different ways, and releasingless green house gas (GHG) might be one of the most popular ways. Onecontribution in this special issue, directly or indirectly, provides food forthought on how better public mass transit networks could be designed, withoutignoring passengers’ well-being, so that more and more passengers are self-motivated to taking public mass transit instead of using less-environmental-friendly transport modes.
In this context, this special issue of Design and Evaluation of TransportationNetworks includes a collection of outstanding papers, made after a thoroughselection and refereeing process. This special issue covers topics at the cuttingedge of transportation research: evaluating transport mode decision making bytaking into account user’s happiness; designing liner shipping services by taking

Design and evaluation of transportation networks 3
into account cooperative stability; setting pricing policy of a short sea shippingservice; using information systems to support ocean–sea shipping services; andcomparing different strategies of port operators along adjacent geographicranges.
The first paper, on a New Approach in Transportation Planning: Happi-ness and Transport Economics, by André Duarte, Camila Garcia, GrigorisGiannarakis, Susanna Limão, Amalia Polydoropoulou and Nikolaos Litinas,analyses the relationships between happiness and transport economics interms of incorporating well-being measurement when choosing between aprivate and a public transport mode, e.g., between owned car and metro.This paper proposes a novel idea in applying behavioural analysis togetherwith psychology in transport economics analysis. The approach seems verypromising and interesting, though this respect has not yet been heavily stressedby previous research. This paper can be regarded as a good example of howhuman behaviour affects transport economics as well as the other way around.
The second paper, on an Integrated Approach for Port Selection ShipScheduling and Financial Analysis, by Jasmine Siu Lee Lam, researches thepopular topic on the ship routing and scheduling problem at both planninglevel and operational level, taking into account the financial analysis andmarket dynamics simultaneously. An integrated intelligent system is designedand demonstrated to support the decision making process. Therefore, thedemonstration of this Decision Support System (DSS) is of great interest tothe liner shipping carrier.
The third paper, on Short Sea Shipping Intermodality and ParametersInf luencing Pricing Policies: The Mediterranean Case, by Monica Grosso,Ana-Rita Lynce, Anne Silla and Georgios K. Vaggelas, begins with theidentification of factors and/or parameters influencing the pricing policy andthe cost structure of intermodal transport. An overview of current policy isalso made. Later on, a questionnaire is applied as a means to collect data andobserve different elements that are influencing price and cost. The way thatthe authors implement interviews as well as the results of this paper can bevery useful for the peers who are to examine the pricing scheme and the coststructure of intermodal transportation.
These papers mentioned above were presented at the first TRANSPORT-NET Seminar (Dec 2007) in Chios, Greece, the International Association ofMaritime Economists annual conference (Apr 2008) in Dalian, China, theItalian Congress of Transport Economists (Jun 2008) in Sassano, Italy, andthe Swiss Transport Conference (Oct 2007) in Switzerland. The various papersbenefited from the many constructive comments and suggestions made duringthose conferences.
We would also like to stress that the successful implementation of thisspecial issue owes to a whole range of individuals, including not only theenthusiastic authors but also the patient and knowledgeable referees who havespent lots of time and effort to provide valuable suggestions and comments.We would like to thank again the referees who have contributed in this specialissue.
4 X. Shi, T. Vanelslander
Last but not least, we would like to express our gratitude to the TRANS-PORTNET Marie Curie Program under the 6th Framework of the EuropeanUnion, which provided most of the authors with enormous opportunities to ad-vance their research in terms of attending conferences and organizing researchrelated activities, of which the contributions in this issue are a valuable proof.
Xiaoning ShiThierry Vanelslander
Guest editorsFebruary 2010
References
1. Shi, X., & Voß, S. (2007). Container terminal operations under the influence of shippingalliances. In K. Bichou, M. G. H. Bell, & A. Evans (Eds.), Risk management in port operations,logistics and supply chain security (pp. 135–167). London: Lloyd’s List.
2. Van de Voorde, E., & Vanelslander, T. (2009). Market power and vertical and horizontalintegration in the maritime shipping and port industry. Paris: OECD, Joint Transport ResearchCentre (Discussion paper/OECD; 2009-2).

UNCTAD Transport Newsletter
No. 43
Second and third Quarter 2009
NOTE The designations employed and the presentation of the material in this publication do not
imply the expression of any opinion whatsoever on the part of the Secretariat of the United Nations concerning the legal status of any country, territory, city or area, or of its authorities, or concerning the delimitation of its frontiers or boundaries.
UNCTAD/WEB/DTL/TLB/2009/2 Published by the United Nations Conference on Trade and Development (UNCTAD) Trade Logistics Branch, DTL Palais des Nations Geneva www.unctad.org Subscriptions To subscribe or unsubscribe to the UNCTAD Transport Newsletter, please use the following
online form: http://extranet.unctad.org/transportnews. For past issues of the Transport Newsletter, please visit www.unctad.org/transportnews.
2

Liner Shipping Connectivity in 2009 Generated in its sixth year, UNCTAD’s Liner Shipping Connectivity Index (LSCI) aims at
capturing how well countries are connected to global shipping networks.6 In 2009, China continues to be the country with the highest LSCI, followed by Hong Kong (China), Singapore, Netherlands and Republic of Korea (table 1). Developing countries which have significantly improved their LSCI ranking since 2004 include Republic of Korea (regaining important transhipment business for East Asian traffic in 2008), Morocco (moving up in the ranking since 2007 thanks to a new international transhipment facility in Tangier), Lebanon (benefiting from port reforms since 2006), and Djibouti (after investment from Dubai-based port operator DPW).
Figure 1: Trends in connectivity indicators. Index of country averages 2004 = 100
Maximum vessel size
TEU
VesselsServices
Companies
70
80
90
100
110
120
130
140
150
160
2004 2005 2006 2007 2008 2009
Source: UNCTAD, based on data from Containerization International Online
As regards global developments of the individual LSCI components, the 2009 data also reflects the impacts of the economic crisis. Between July 2008 and July 2009, the number of ships, their total TEU carrying capacity, the number of services and the number of companies have all decreased. Only the maximum vessel size has continued to increase: In spite of the economic crisis, new and larger vessels are being delivered by the world’s ship yards. Many of these larger ships then replace smaller vessels, leading to a significant reduction in the average number of vessels per country. For the first time since UNCTAD records the data, the average container carrying capacity TEU assigned per country has discontinued its rise. Following the continued trend of mergers and acquisitions, the average number of companies offering services per country has decreased by 17 per cent since 2004 (figure 1). Honey Tousypanah, Xiaoning Shi and Jan Hoffmann, [email protected], Trade Logistics Branch, DTL, UNCTAD 6 The first version of the 2004 LSCI was introduced in Transport Newsletter No. 27, first Quarter 2005. The current version of the LSCI is generated from the five components: (a) number of ships; (b) the container carrying capacity of those ships; (c) the maximum vessel size; (d) the number of services; and (e) the number of companies that deploy containerships on services from and to a country’s ports. The data is derived from Containerisation International Online. The index is generated as follows: For each of the five components a country’s value is divided by the maximum value of that component in 2004, and for each country, the average of the five components is calculated. This average is then divided by the maximum average for 2004 and multiplied by 100. This way, the index generates the value 100 for the country with the highest average index of the five components in 2004.
6

Table 1: LSCI, 2004 - 2009 Country 2004 2005 2006 2007 2008 2009 Rank
2009 Change
2009/2008 Change
2009/2004 China 100.00 108.29 113.10 127.85 137.38 132.47 1 -4.91 32.47 Hong Kong (China) 94.42 96.78 99.31 106.20 108.78 104.47 2 -4.30 10.05 Singapore 81.87 83.87 86.11 87.53 94.47 99.47 3 5.01 17.60 Netherlands 78.81 79.95 80.97 84.79 87.57 88.66 4 1.09 9.85 Korea, Republic of 68.68 73.03 71.92 77.19 76.40 86.67 5 10.28 18.00 United Kingdom 81.69 79.58 81.53 76.77 77.99 84.82 6 6.83 3.14 Germany 76.59 78.41 80.66 88.95 89.26 84.30 7 -4.96 7.71 Belgium 73.16 74.17 76.15 73.93 77.98 82.80 8 4.82 9.64 United States 83.30 87.62 85.80 83.68 82.45 82.43 9 -0.02 -0.87 Malaysia 62.83 64.97 69.20 81.58 77.60 81.21 10 3.61 18.38 Spain 54.44 58.16 62.29 71.26 67.67 70.22 11 2.56 15.78 Italy 58.13 62.20 58.11 58.84 55.87 69.97 12 14.10 11.84 France 67.34 70.00 67.78 64.84 66.24 67.01 13 0.77 -0.33 Japan 69.15 66.73 64.54 62.73 66.63 66.33 14 -0.30 -2.82 Taiwan Province of China
59.56 63.74 65.64 62.43 62.58 60.90 15 -1.67 1.34
United Arab Emirates 38.06 39.22 46.70 48.21 48.80 60.45 16 11.65 22.40 Egypt. 42.86 49.23 50.01 45.37 52.53 51.99 17 -0.55 9.12 Saudi Arabia 35.83 36.24 40.66 45.04 47.44 47.30 18 -0.14 11.47 Oman 23.33 23.64 20.28 28.96 30.42 45.32 19 14.90 21.98 Greece 30.22 29.07 31.29 30.70 27.14 41.91 20 14.77 11.68 Canada 39.67 39.81 36.32 34.40 34.28 41.34 21 7.06 1.68 India 34.14 36.88 42.90 40.47 42.18 40.97 22 -1.21 6.83 Morocco 9.39 8.68 8.54 9.02 29.79 38.40 23 8.61 29.02 Malta 27.53 25.70 30.32 29.53 29.92 37.71 24 7.78 10.17 Thailand 31.01 31.92 33.89 35.31 36.48 36.78 25 0.30 5.77 Sri Lanka 34.68 33.36 37.31 42.43 46.08 34.74 26 -11.34 0.06 Portugal 17.54 16.84 23.55 25.42 34.97 32.97 27 -2.00 15.43 Panama 32.05 29.12 27.61 30.53 30.45 32.66 28 2.21 0.60 South Africa 23.13 25.83 26.21 27.52 28.49 32.07 29 3.58 8.94 Turkey 25.60 27.09 27.09 32.60 35.64 31.98 30 -3.66 6.38 Mexico 25.29 25.49 29.78 30.98 31.17 31.89 31 0.73 6.60 Sweden 14.76 26.61 28.17 25.82 30.27 31.34 32 1.07 16.59 Brazil 25.83 31.49 31.61 31.64 30.87 31.08 33 0.21 5.25 Lebanon 10.57 12.53 25.57 30.01 28.92 29.55 34 0.63 18.98 Iran, Islamic Rep. of 13.69 14.23 17.37 23.59 22.91 28.90 35 5.99 15.21 Australia 26.58 28.02 26.96 26.77 38.21 28.80 36 -9.40 2.22 Denmark 11.56 24.25 25.39 22.10 26.49 27.68 37 1.19 16.12 Pakistan 20.18 21.49 21.82 24.77 24.61 26.58 38 1.98 6.41 Vietnam 12.86 14.30 15.14 17.59 18.73 26.39 39 7.65 13.53 Argentina 20.09 24.95 25.58 25.63 25.70 25.99 40 0.29 5.90 Indonesia 25.88 28.84 25.84 26.27 24.85 25.68 41 0.83 -0.20 Jordan 11.00 13.42 12.98 16.46 16.37 23.71 42 7.34 12.71 Romania 12.02 15.37 17.61 22.47 26.35 23.34 43 -3.02 11.32 Colombia 18.61 19.20 20.49 29.13 21.64 23.18 44 1.54 4.56 Ukraine 11.18 10.81 14.88 16.73 23.62 22.81 45 -0.81 11.63 Uruguay 16.44 16.58 16.81 21.28 22.88 22.28 46 -0.60 5.84 Dominican Republic 12.45 13.95 15.19 19.87 20.09 21.61 47 1.53 9.16 Russian Federation 11.90 12.72 12.81 14.06 15.31 20.64 48 5.32 8.73 Venezuela, RB 18.22 19.90 18.62 20.26 20.46 20.43 49 -0.03 2.21 Nigeria 12.83 12.79 13.02 13.69 18.30 19.89 50 1.59 7.05 Slovenia 13.91 13.91 11.03 12.87 15.66 19.81 51 4.15 5.91 Jamaica 21.32 21.99 23.02 25.50 18.23 19.56 52 1.33 -1.76 Côte d'Ivoire 14.39 14.52 12.98 14.98 16.93 19.39 53 2.46 5.00
7

Country 2004 2005 2006 2007 2008 2009 Rank 2009
Change 2009/2008
Change 2009/2004
Ghana 12.48 12.64 13.80 14.99 18.13 19.33 54 1.21 6.86 Bahamas, The 17.49 15.70 16.19 16.45 16.35 19.26 55 2.91 1.77 Chile 15.48 15.53 16.10 17.49 17.42 18.84 56 1.42 3.36 Israel 20.37 20.06 20.44 21.42 19.83 18.65 57 -1.17 -1.71 Djibouti 6.76 7.59 7.36 10.45 10.43 17.98 58 7.56 11.22 Ecuador 11.84 12.92 14.17 14.30 13.16 17.09 59 3.93 5.25 Peru 14.79 14.95 16.33 16.90 17.38 16.96 60 -0.42 2.17 Philippines 15.45 15.87 16.48 18.42 30.26 15.90 61 -14.36 0.45 Trinidad and Tobago 13.18 10.61 11.18 13.72 12.88 15.88 62 3.01 2.70 Senegal 10.15 10.09 11.24 17.08 17.64 14.96 63 -2.67 4.81 Mauritius 13.13 12.26 11.53 17.17 17.43 14.76 64 -2.67 1.63 Guatemala 12.28 13.85 18.13 15.40 15.44 14.73 65 -0.71 2.45 Yemen, Rep. 19.21 10.18 9.39 14.28 14.44 14.61 66 0.17 -4.60 Costa Rica 12.59 11.12 15.08 15.34 12.78 14.61 67 1.83 2.02 Togo 10.19 10.62 11.09 10.63 12.56 14.42 68 1.86 4.23 Namibia 6.28 6.61 8.52 8.37 11.12 13.61 69 2.49 7.33 Benin 10.13 10.23 10.99 11.16 12.02 13.52 70 1.50 3.39 Cyprus 14.39 18.53 17.39 18.01 11.81 13.31 71 1.50 -1.08 Kenya 8.59 8.98 9.30 10.85 10.95 12.83 72 1.88 4.24 Cameroon 10.46 10.62 11.41 11.65 11.05 11.60 73 0.55 1.14 Congo, Republic of 8.29 9.10 9.12 9.61 11.80 11.37 74 -0.43 3.08 Angola 9.67 10.46 9.46 9.90 10.22 11.31 75 1.09 1.64 Syrian Arab Republic 8.54 11.84 11.29 14.20 12.72 11.03 76 -1.70 2.49 Puerto Rico 14.82 15.23 14.68 15.96 15.62 10.92 77 -4.70 -3.90 Honduras 9.11 8.64 8.29 8.76 9.26 10.68 78 1.42 1.57 New Zealand 20.88 20.58 20.71 20.60 20.48 10.59 79 -9.89 -10.29 Nicaragua 4.75 5.25 8.05 7.89 8.91 10.58 80 1.68 5.83 El Salvador 6.30 7.32 8.07 7.90 8.67 10.34 81 1.67 4.04 Finland 9.45 10.16 8.58 10.70 9.72 10.15 82 0.43 0.70 Tanzania, UR of 8.10 8.59 8.71 10.58 10.46 9.54 83 -0.92 1.44 Libyan Arab Jamahiriya 5.25 5.17 4.71 6.59 5.36 9.43 84 4.07 4.18 Mozambique 6.64 6.71 6.66 7.14 8.81 9.38 85 0.57 2.74 Sudan 6.95 6.19 5.67 5.66 5.38 9.28 86 3.89 2.33 Poland 7.28 7.53 7.50 7.86 9.32 9.21 87 -0.12 1.93 Gabon 8.78 8.76 8.72 8.57 8.93 9.16 88 0.23 0.38 Fiji 8.26 8.32 7.24 7.35 10.31 8.74 89 -1.57 0.48 New Caledonia 9.83 10.34 9.00 8.81 9.23 8.74 90 -0.49 -1.09 Madagascar 6.90 6.83 8.31 7.97 7.82 8.64 91 0.82 1.74 Netherlands Antilles 8.16 8.23 7.82 9.22 8.56 8.57 92 0.01 0.41 Guam 10.50 10.52 9.56 8.73 8.56 8.57 93 0.00 -1.93 Croatia 8.58 12.19 10.47 12.33 15.36 8.48 94 -6.88 -0.10 French Polynesia 10.46 11.14 8.91 8.60 9.01 8.39 95 -0.62 -2.07 Algeria 10.00 9.72 8.70 7.86 7.75 8.37 96 0.62 -1.63 Guinea 6.13 6.89 8.71 8.47 6.41 8.32 97 1.91 2.19 Lithuania 5.22 5.88 5.66 6.83 7.76 8.11 98 0.35 2.88 Bahrain 5.39 4.34 4.44 5.99 5.75 8.04 99 2.29 2.65 Norway 9.23 8.31 7.34 7.80 7.91 7.93 100 0.03 -1.30 Bangladesh 5.20 5.07 5.29 6.36 6.40 7.91 101 1.51 2.71 Ireland 8.78 9.66 8.18 8.85 7.64 7.60 102 -0.04 -1.18 Gambia, The 4.91 6.13 4.80 4.74 4.97 7.53 103 2.56 2.62 Mauritania 5.36 5.99 6.25 7.90 7.93 7.50 104 -0.44 2.14 Papua New Guinea 6.97 6.40 4.67 6.86 6.92 6.58 105 -0.34 -0.39 Kuwait 5.87 6.77 4.14 6.22 6.14 6.54 106 0.40 0.66 Tunisia 8.76 7.62 7.04 7.23 6.95 6.52 107 -0.43 -2.24 Cuba 6.78 6.51 6.43 6.71 6.12 5.92 108 -0.20 -0.86 Bulgaria 6.17 5.61 4.47 4.83 5.09 5.78 109 0.70 -0.38
8
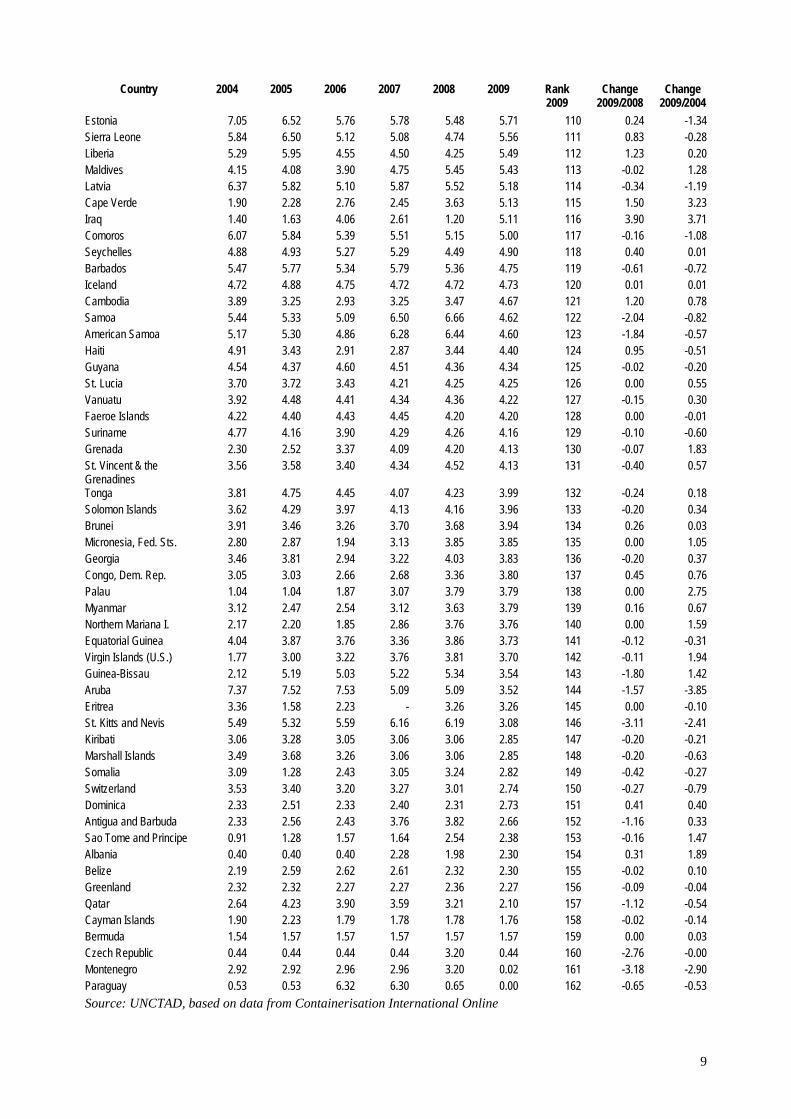
9
Country 2004 2005 2006 2007 2008 2009 Rank 2009
Change 2009/2008
Change 2009/2004
Estonia 7.05 6.52 5.76 5.78 5.48 5.71 110 0.24 -1.34 Sierra Leone 5.84 6.50 5.12 5.08 4.74 5.56 111 0.83 -0.28 Liberia 5.29 5.95 4.55 4.50 4.25 5.49 112 1.23 0.20 Maldives 4.15 4.08 3.90 4.75 5.45 5.43 113 -0.02 1.28 Latvia 6.37 5.82 5.10 5.87 5.52 5.18 114 -0.34 -1.19 Cape Verde 1.90 2.28 2.76 2.45 3.63 5.13 115 1.50 3.23 Iraq 1.40 1.63 4.06 2.61 1.20 5.11 116 3.90 3.71 Comoros 6.07 5.84 5.39 5.51 5.15 5.00 117 -0.16 -1.08 Seychelles 4.88 4.93 5.27 5.29 4.49 4.90 118 0.40 0.01 Barbados 5.47 5.77 5.34 5.79 5.36 4.75 119 -0.61 -0.72 Iceland 4.72 4.88 4.75 4.72 4.72 4.73 120 0.01 0.01 Cambodia 3.89 3.25 2.93 3.25 3.47 4.67 121 1.20 0.78 Samoa 5.44 5.33 5.09 6.50 6.66 4.62 122 -2.04 -0.82 American Samoa 5.17 5.30 4.86 6.28 6.44 4.60 123 -1.84 -0.57 Haiti 4.91 3.43 2.91 2.87 3.44 4.40 124 0.95 -0.51 Guyana 4.54 4.37 4.60 4.51 4.36 4.34 125 -0.02 -0.20 St. Lucia 3.70 3.72 3.43 4.21 4.25 4.25 126 0.00 0.55 Vanuatu 3.92 4.48 4.41 4.34 4.36 4.22 127 -0.15 0.30 Faeroe Islands 4.22 4.40 4.43 4.45 4.20 4.20 128 0.00 -0.01 Suriname 4.77 4.16 3.90 4.29 4.26 4.16 129 -0.10 -0.60 Grenada 2.30 2.52 3.37 4.09 4.20 4.13 130 -0.07 1.83 St. Vincent & the Grenadines
3.56 3.58 3.40 4.34 4.52 4.13 131 -0.40 0.57
Tonga 3.81 4.75 4.45 4.07 4.23 3.99 132 -0.24 0.18 Solomon Islands 3.62 4.29 3.97 4.13 4.16 3.96 133 -0.20 0.34 Brunei 3.91 3.46 3.26 3.70 3.68 3.94 134 0.26 0.03 Micronesia, Fed. Sts. 2.80 2.87 1.94 3.13 3.85 3.85 135 0.00 1.05 Georgia 3.46 3.81 2.94 3.22 4.03 3.83 136 -0.20 0.37 Congo, Dem. Rep. 3.05 3.03 2.66 2.68 3.36 3.80 137 0.45 0.76 Palau 1.04 1.04 1.87 3.07 3.79 3.79 138 0.00 2.75 Myanmar 3.12 2.47 2.54 3.12 3.63 3.79 139 0.16 0.67 Northern Mariana I. 2.17 2.20 1.85 2.86 3.76 3.76 140 0.00 1.59 Equatorial Guinea 4.04 3.87 3.76 3.36 3.86 3.73 141 -0.12 -0.31 Virgin Islands (U.S.) 1.77 3.00 3.22 3.76 3.81 3.70 142 -0.11 1.94 Guinea-Bissau 2.12 5.19 5.03 5.22 5.34 3.54 143 -1.80 1.42 Aruba 7.37 7.52 7.53 5.09 5.09 3.52 144 -1.57 -3.85 Eritrea 3.36 1.58 2.23 - 3.26 3.26 145 0.00 -0.10 St. Kitts and Nevis 5.49 5.32 5.59 6.16 6.19 3.08 146 -3.11 -2.41 Kiribati 3.06 3.28 3.05 3.06 3.06 2.85 147 -0.20 -0.21 Marshall Islands 3.49 3.68 3.26 3.06 3.06 2.85 148 -0.20 -0.63 Somalia 3.09 1.28 2.43 3.05 3.24 2.82 149 -0.42 -0.27 Switzerland 3.53 3.40 3.20 3.27 3.01 2.74 150 -0.27 -0.79 Dominica 2.33 2.51 2.33 2.40 2.31 2.73 151 0.41 0.40 Antigua and Barbuda 2.33 2.56 2.43 3.76 3.82 2.66 152 -1.16 0.33 Sao Tome and Principe 0.91 1.28 1.57 1.64 2.54 2.38 153 -0.16 1.47 Albania 0.40 0.40 0.40 2.28 1.98 2.30 154 0.31 1.89 Belize 2.19 2.59 2.62 2.61 2.32 2.30 155 -0.02 0.10 Greenland 2.32 2.32 2.27 2.27 2.36 2.27 156 -0.09 -0.04 Qatar 2.64 4.23 3.90 3.59 3.21 2.10 157 -1.12 -0.54 Cayman Islands 1.90 2.23 1.79 1.78 1.78 1.76 158 -0.02 -0.14 Bermuda 1.54 1.57 1.57 1.57 1.57 1.57 159 0.00 0.03 Czech Republic 0.44 0.44 0.44 0.44 3.20 0.44 160 -2.76 -0.00 Montenegro 2.92 2.92 2.96 2.96 3.20 0.02 161 -3.18 -2.90 Paraguay 0.53 0.53 6.32 6.30 0.65 0.00 162 -0.65 -0.53 Source: UNCTAD, based on data from Containerisation International Online

Paper From transocean routes
to global networks: a framework for liner
companies to build service networksXiaoning Shi and Stefan Voß
Abstract—During the previous two decades liner carriers
within maritime shipping have broken the barriers from being
pure transportation providers towards being logistics service
providers. Most of the top 20 liner carriers worldwide have
set up spin-offs providing services from local booking up to
3rd party logistics services, combining the business advantages
of tight linkages with liners together with the negotiation free-
dom with demanding customers by providing an extension of
service coverage. Economical evaluations of transocean routes
and global networks are of interest for decision makers re-
sponsible for business strategies as well as for operations. It
is crucial to achieve appropriate judgements about which liner
routes are profitable and how to build better service networks
so that the companies’ brand could be attractive to, e.g., ship-
pers, including exporters, importers and forwarding agents.
In this paper we discuss the corresponding trade-offs as well as
related decision support systems of relevant service providers
and companies.
Keywords— liner, port, logistics, networks, decision support
system.
1. Introduction
Stemming from the inherent characteristics of world trade,
the international shipping industry faces general issues of
globalization, volatility, capital-intensity and periodicity.
These issues, among others, provide the maritime ship-
ping and logistics industry with a wealth of opportuni-
ties, however, with considerable uncertainties. The fact
that liner carriers have already broken the barriers from
being transportation providers towards being logistics ser-
vice providers during the last two decades lets researchers
consider related improvements and optimization after those
extensions of business processes. Most of the top 20 liner
carriers set up spin-offs providing different services, from
local booking services up to 3rd party logistics services,
combining the business advantages of tight linkages with
the liners together with the negotiation freedom with de-
manding customers. A trade-off results from the relatively
ambitious goals of the liner carriers and the marketing
pressure of their spin-offs focusing on 3rd party logis-
tics services, namely, the economical comparison between
transocean routes and global networks. On one hand, as
top liners deploy mega ships, economies of scale and single
voyage efficiency are needed in order to accomplish the aim
of unit cost saving. Thus, there is a need to focus on (long
haul) transocean routes. On the other hand, for a 3rd party
logistics provider (3PL), a global network with reliability
and agility is crucial, too. Decision makers handling busi-
ness strategies as well as operations, who are willing to
resolve this trade-off, must be aware of which routes are
productive and how to build up better service networks so
that the brand and the reputation of affiliated companies
is attractive to shippers, including exporters, importers and
forwarding agents.
In this paper, besides presenting a literature review on
a variety of papers relevant to the topic, we also attempt to
discuss the evaluation and analysis of route choice and the
optimization of networks. We start with the ingredients of
related networks – ports and routes – and later extend by
addressing different functions of the liners and the 3PL, as
well as illustrating several criteria suitable for the selection
of a transhipment hub as well as inland feeders. Regarding
the dynamic competition and cooperation within the liner
market, we finally sketch a theoretical framework, which
may be of use regarding the development of decision sup-
port systems (DSS) of the liner companies, on how to build
efficient service networks.
2. Ingredients of the networks – routes
and ports
Logistics services could be identified as appropriate exten-
sions of existing networks. Therefore, cf. [3], we interpret
the connections among routes and ports of call as sub-
networks. As the definition of logistics can be quite broad
we need to focus. That is, in this paper we are mainly con-
cerned with door-door service derived from long-distance
shipping services. Short-distance inland distribution logis-
tics without any shipping is not covered in this paper. In
order to gain better understanding about the networks of
shipping and logistics, the routes and the ports could be
defined as the links and the nodes, respectively, as basic
ingredients forming the networks.
2.1. Routes – links/ports – nodes
There are three main transocean lanes, namely transat-
lantic, transpacific and far-east to Europe [5], playing sig-
nificant roles as the cheapest transportation mode serving
commodity flows. Besides these main lanes, each liner
carrier would arrange its services based on given freight
requirements, thus, the required routings from the shippers
35

Xiaoning Shi and Stefan Voß
motivate the liner carriers to construct complete world-wide
networks. The lanes and routes connecting the ports can
be viewed as the links in a graph with the seaborne trans-
portation demands of the links denoted as weights.
Various researchers have addressed the definition of
a “port”. For instance, Carbone and De Martino [4] define:
“Ports have been natural sites for transhipment in order
to transfer goods from one mode of transport to another.
They have historically provided the link between maritime
and inland transport, and the interface between the sea,
rivers, roads and railways”. This definition is not fully
comprehensive, as ports often also function as nodes with-
out any mode diversity, e.g., from ship to ship. At least this
statement indicates that ports are nodes with cargo in-flow
and out-flow. (See, e.g., [31, 32] for a container terminal
oriented survey.)
Considering the ports as nodes, we note that the liner car-
riers and their logistics spin-offs discussed in this paper are
also of other characteristics – direct service networks to-
gether with indirect physical networks. For instance, a ship-
per as customer may book a door-to-door service in terms
of local booking service1 provided by a 3PL spin-off of the
liner carriers. That is, the shipper and the service provider
have direct service connections. However, it does not mean
that this cargo freight is transported by the 3PL related
liner carrier2 only, not even within multi-modal transporta-
tion including inland-haul and short-sea distribution, if any,
according to the service contract between the shipper and
the 3PL. Therefore, indirect physical networks exist, which
urges smooth and seamless connection.
2.2. Similarities among networks
Not only maritime shipping (transportation) networks have
the features discussed in Subsection 2.1. Also some other
(service) industries share the features which can be inves-
tigated by applying similar methods. It deserves to be
noted that shipping and the logistics industry, as well as the
telecommunications industry, share common characteristics
of networks such as facility indivisibilities, technology in-
terconnectedness and utility externalities, etc. A simplified
comparison between the telecommunications and the port
operations as well as freight shipping can be shown as fol-
lows. Similarities mainly exist regarding four aspects: gen-
eration and infrastructure development, distribution, mode
choice and assignment. A brief comparison is that telecom-
munication service carries packages which contain data and
messages; port operation moves containers either vertically
up/off to/from ship or horizontally connected with trucks or
trains; and also freight transport carries commodities from
origins to destinations. Moreover, we can state that in all
1For reason of domestic maritime regulation and territory security, most
countries do not authorise the foreign liners full authority of direct-
booking. This is one of the reasons that foreign liners set up 3PL spin-offs
as interfaces providing local-booking services to the shippers.2It refers to a liner carrier who sets up a 3PL spin-off. Later, those two
companies might become sister companies belonging to the same group.
these “systems” we are concerned with consolidation and
transhipment points.
Regarding the basic features of those industries and their
similarities, theoretically, the literatures and research out-
comes from each area could be applied to each other
if done in an appropriate manner. For a review on the
service network design for freight transportation see,
e.g., Wieberneit [36] who specifically investigates tacti-
cal planning problems in freight transportation. Regarding
the classification of the planning of a transport system, we
refer to, e.g., [6]. In Section 3, we focus on the freight
shipping industry.
3. Selection and preference of ports
and networks
From a historical point of view, the main routes that con-
tain lots of cargo desires are those routes firstly developed
by ancient traders, and those nowadays need to be deployed
with mega ships. However, taking basic logistics require-
ments into account, a superficial contradiction seems to
arise from the liner companies and their 3PL spin-offs.
3.1. A superficial contradiction
On one hand, the target market niche of liner services is to
provide transportation by visiting fixed ports according to
pre-announced fixed schedules, meanwhile at a relatively
stable freight of all kinds (FAK) price. More specifically,
even the names of liners’ vessels are settled and announced
in advance once the liners are willing to provide liner ser-
vices, and those container vessels are supposed to visit se-
lected ports one by one in a timely fashion, also based
on pre-announced fixed schedules. Cargo fitting into con-
tainers are shipped at settled prices (in this paper we ignore
the issue of setting booking prices and the strategic contrac-
tual wholesale prices) disregarding what the cargoes really
are. As a result, we refer to any TEU (twenty-foot equiva-
lent unit; measurement of containers) as a profitable “unit”.
A fundamentally common aim of the liner companies is to
achieve economies of scale together with significant cost
savings per unit, achieved by deploying bigger ships along
profitable routes consisting of productive ports with deep
drafts.
On the other hand, attractive service offerings provided
by the logistics companies could be increased frequency,
less quantity per shipment and higher agility based on cus-
tomers’ specialized requirements. Logistics companies pro-
viding 3rd party services with local booking authorities,
especially those spin-offs of the liner companies consid-
ered here, are actually blooming since the last decline of
the liner industry under the hope of attracting more cus-
tomers from competitors providing similar liner services.
Those 3PL spin-offs are endowed with the advantages of
getting allocated capacities at lower contractual prices with
their head companies or sister companies. Nevertheless,
36

From transocean routes to global networks: a framework for liner companies to build service networks
they are trying every effort to accomplish and fulfil door-
to-door and even value-added services as well as to expand
networks by means of visiting feeder ports and setting up
inland distribution centres.
Then a superficial contradiction occurs between the se-
lection of transhipment hubs and the expansion of net-
works under the capital constraint and management con-
straint of the head-corporation of the liner company and
the involved 3PL. In this paper, we consider the network
design problem as a strategic issue.
Note that we regard a spin-off of the liner carriers providing
logistics service as 3PL. However, other researchers might
rate liner carriers themselves as 3PL considering buyer and
seller of the respective trade contract ([28], p. 252). Here
we somewhat ignore the debate of who can actually be re-
garded as 3PL or even “4PL”. Instead, we focus on the per-
formance and value of the service networks. For a frame-
work for evaluating 3PL see, e.g., [33].
3.2. Possible solutions to solve the contradiction
In this section, we investigate liner carriers and their 3PL
spin-offs from a network theory perspective, which might
shed some light on resolving the above mentioned contra-
diction. Applying network theory allows the liner carriers
to optimize their current networks as well as aggregate po-
tential partners’ network [3]. Consequently, a multi-criteria
optimization system should be set so that a rational selec-
tion on transhipment hubs and feeder ports could be accom-
plished. For a comprehensive literature review up to 2000
on freight transportation structuring from the viewpoint of
choice processes we refer to [18]. Here we further discuss
some other criteria in terms of networks, information as
well as the 3PL spin-offs.
In practice, the selection of ports of call, including tranship-
ment hubs and feeder ports, could be viewed as selection
processes for business partners, no matter whether it relates
to vertical or horizontal partnerships. However, before they
become business partners, port operators, to great extent,
might be competitors within the same industry. That is,
players belonging to the same region, neighbouring each
other and sharing overlapping hinterland, form a compet-
itive relationship (e.g., the so-called North-Range in Eu-
rope). As some literatures address, financial health, ade-
quate physical facilities, intangible assets [1, 10] are crucial
as contributing factors during preliminarily screening the
potential ports of call. Further references regarding port
selection can be found in, e.g., [17, 24].
3.2.1. Criteria of hubs/transhipment hubs
Distribution network. One difference between hubs and
transhipment hubs is whether there exists an advanced dis-
tribution network to connect to the hinterland. If there is
an advanced distribution network, the hub may not only
act as a media to move cargoes from one ship to another
(cf. the term crossdocking in slightly different context),
but also between different transport modes, e.g., from ships
either to trains or to trucks. However, for many tranship-
ment hubs, like Hong Kong or Singapore, a high percentage
of the whole throughput refers to ship-to-ship movements.
Thus, in such a case the hinterland distribution network is
not of utmost importance (compared to, e.g., Hamburg).
Most important are the free-port regulation and a sophis-
ticated handling system that make the B/L transaction and
water-water transhipment convenient.
Information system. Congestion, either on the seaside or
on the landside could enlarge the total time of a vessel in
the port, which would actually imply increased operational
costs for the liner carriers. However, congestion free access
to a port or congestion within the port is usually not one
of the (main) criteria for choosing the hubs. As a matter
of fact, several hubs suffer congestion quite often. It seems
most important whether there is an efficient and effective
information system to support the daily operations within
the port so that even if congestion happens, a construc-
tive solution would be suggested by the information sys-
tem quickly. Recent discussion in this respect refers to so-
called port community systems (see, e.g., www.dakosy.de
for some example).
The 3PL spin-offs. In the hubs that the liner carrier or
its corporation chooses, usually a related 3PL spin-off is
set up, too, to ensure the convenience of the service that
they could provide to the customers as a package. Compar-
ing the local forwarder agent located in other feeder ports,
the 3PL spin-off has stronger linkage with the liner car-
rier and, in return, might get more allocated capacities as
support.
3.2.2. Criteria of feeder ports
Local forwarder agent. In practice, the selection of feeder
ports is usually combined with the selection of the local
forwarder agents. In most cases, if one forwarder agent
distinguishes himself by his performance in one port, then
other ports covered by this forwarder agent’s business are
probably also selected by the liner carrier as feeder ports.
One superficial reason could be that the forwarder agent
has a long cooperation with the liner carrier and gets
used to follow all the managerial habits of the liner car-
rier which satisfies the liner carrier’s requirements and fur-
ther brings the liner carrier more freight. Another reason
is that this forwarder agent could to great extent support
the freight and fill capacities of the liner carrier by util-
ising his own network and attract shippers located in the
hinterland. Considering the transocean routes initially con-
structed by the liner company, we define the extended in-
land or short-sea network of the local forwarder agent as the
sub-network.
This phenomenon indicates that potential feeder ports
would be selected due to their contribution to the original
networks in fashion of better sub-network connection and
accessibility. It should also be noted that such expected
contribution might not happen as soon as the alternative
feeder ports are added into the network, they might play
37

Xiaoning Shi and Stefan Voß
their roles step by step. Unfortunately, as time goes by, the
freight flow may amplify itself and then the profit-driven
liner carriers may set up their own spin-off or stock-holding
companies there instead of cooperating with the former for-
warder agents. Consequently, this feeder port may even
have the chance to be upgraded as hub within the ports of
call of this liner.
Besides the practical criteria mentioned above, Lirn
et al. [15] apply the analytic hierarchy process (AHP) as
a method for evaluation and selection of transhipment ports
from a global perspective. In addition, other researchers
propose multi-criteria optimization for partner selection is-
sues, which could be regarded as the amendment and de-
velopment of an AHP application, see [9, 10].
4. Network optimization for a dynamic
liner market
In this section we discuss aspects of optimizing service
networks regarding the dynamic liner shipping market by
taking into account the capacity of other sub-networks with
a whole networks perspective. General concerns of cost
efficiency in container shipping can be found, e.g., in [30].
4.1. Dynamics as a characteristic of the liner shipping
industry
In spite of the cooperation among the liner carriers and
other players involved in the liner shipping industry, many
observations disclose the fact that the liner shipping in-
dustry is full of dynamics, including membership diver-
sity, partnership reshuffling, network restructuring, etc.
Rimmer [27] provides a historical description on the mem-
bership diversity among the liner shipping alliances up to
the mid nineties. A more recent exposition of coopera-
tion, mergers and acquisitions within the liner shipping in-
dustry is given by Notteboom [25]. Furthermore, for an
up-to-date review on the dynamics existing in this indus-
try see [29].
In short, the membership of the shipping alliances can
switch from partnership towards being competitors and vice
versa. This not only results in fleet capacity changes but
also leads to diversity between the services that the alliances
can provide. In this case, the related liner carriers’ behavior
of changing membership can be interpreted as attempting
to combine new sub-networks with other players, no matter
whether the other players are carriers or local in-land haul
service providers.
4.2. Flexibility as response
Due to the dynamic environments of the transportation
industry, flexibility plays a vital role if relevant compa-
nies are willing to survive. Reasons for the importance
of flexibility include network externalities, as pointed out
by David [7]; benefits of users/producers of the services
are depending on the presence of other users/producers.
Robinson ([28], p. 248) states that “shipping lines are in
the business of delivering value to buyers and sellers – and
of capturing value to ensure they remain in business”. Con-
sidering the dynamics of the liner market, we address the
flexibility of the network as one of the competitive advan-
tages to ensure that shipping lines remain competitive and
survive in business.
Once liner carriers have to compete in context of flexibility,
the selection and integration of sub-networks becomes vital.
Min and Guo [22] investigate the location of hub-seaports
in the global supply chain network from the point of view
of cooperative game theory. They develop a cooperative
strategy in order to support the liner carriers and the ship-
pers to determine optimal locations for the hub-seaports.
However, our approach is slightly different as we do not as-
sume the liner carriers and the local sub-network providers
having binding agreements among each other. To some ex-
tent, we deepen our research based on the non-cooperative
assumption, which is more realistic in the real business.
As discussed in Subsection 2.1, routes and ports would be
regarded as the basic features of the service networks of
the liner carriers. The following four aspects need to be
taken into account: generation of seaborne transportation,
distribution of the shipping requirements, modal split and
assignment of the shipping volume.
4.2.1. Zoning
While discussing ports serving the container flows, related
regions are actually divided within the overall transporta-
tion networks by means of zoning. Zoning is a process
that combines similar nodes into different zones and
separates them from each other. Such zoning process de-
pends a lot on the objectives of the networks, the avail-
able data, budget and time constraints as well as the zones
homogeneity. Furthermore, due to the limited knowledge
of all the details of every node almost all information
(or expectation) of the nodes could be integrated into the
“zone” and lateron each zone is reduced to a point. Then,
spatial dimensions of a zone diminish. For instance, once
ports A and B are integrated into one zone, the spatial
distance between A and B is not important any more. In
contrast, whether A or B would act as the hub of this zone
would be an important decision. Once A acts as the hub
and B acts as the feeder port, the assignment of the in-
bound and outbound links to and from this zone is related
to the network design, while the volume between A and B
within this zone is related to the sub-network design. In
other words, one of the ports, say A, is selected as the cen-
tral port because of advantageous transportation conditions
while utilizing other ports, say B, as subsidiary within the
zone. We note in passing, that a comprehensive survey of
operations research approaches for the design of hub and
spoke systems is provided in [34]. A simple adoption of
hub and spoke systems to ship assignment is provided by
Mourao and Pato [23].
38

From transocean routes to global networks: a framework for liner companies to build service networks
4.2.2. Coding
The whole network is simplified by means of zoning and
coding. Coding is a process that captures network links
and centroids to represent the characteristics of the zone,
respectively, instead of the former random links and nodes.
That is, the network links and centroid are more relevant
for the networks rather than the sub-network.
Now we are prepared to explain the behavior of the liner
carriers: sometimes they set up 3PL spin-offs located in
different areas and sometimes they simply select some lo-
cal agents to act as the forwarder service and logistics
service provider. However, the in-depth ideas are simi-
lar. The liner carriers set up their own 3PL spin-offs after
zoning their current and potential traffic network and let
the 3PL spin-off represent (the features of) this zone so
that it could serve in the best possible way. As a differ-
ent option, they select the local agents acting as a repre-
sentative of a sub-network, whoever could contribute best
to the whole network. Thus, the competition of the liner
carriers, to some extent, is a competition of network in-
tegration. Furthermore, the turbulence of the liner market
requires the flexibility of the network to ensure the just-in-
time change. Once the circumstances or factors change as,
e.g., observed with respect to the Panama Canal expansion,
the sub-network and the whole network of the liner carriers
should change accordingly to match customer demands and
the circumstances.
In general, all the cargoes currently are served by the net-
works and the containerized shipments are transported from
door to door, and during this procedure, at least two hubs
are chosen (maybe more than two if the transhipment is
included regarding the long distance). One hub locates
in the zone of the origin, and the other hub locates in
the zone of destination. Thus, the whole logistics proce-
dure could be decomposed into the liner carrier’s network
and its 3PL spin-off/local service’s sub-network. Further-
more, the sub-network selection and their connectivity are
of great importance. We note that this is closely related to
intermodal transportation problems, airline transportation
networks as well as problems in telecommunications net-
work design. For the latter see, e.g., the formal modeling
approaches in [13, 20]. Route design in a specific liner
shipping problem is considered in, e.g., [12].
In the following, we describe the problem from two as-
pects: sub-network selection and shipment distribution. Let
G = (N,A) be a graph consisting of a set of nodes N and
a set of arcs A. G represents a physical network provided
by the liner carriers and the logistics providers. Let K
define a set of cargo shipments. A specific sea cargo ship-
ment k ∈K is defined by an origin-destination or O−D pair,
with o(k) as origin and d(k) as destination. The set of all
paths from o(k) to d(k) for k is defined as Pk and the set
of all O−D-pairs throughout the network is defined as P.
The demand of a network or sub-network related to ship-
ment k is denoted as dk, which has to be transported
from o(k) to d(k). In this paper important constraints
such as time window constraints are not considered as key
constraints as we ignore operational details. The main con-
straints refer to arc-capacity so that they could fulfil the de-
mands dk. Considering the integration of some networks,
the total capacity of the involved links should be enough
to cover the total demands. One might include binary de-
cision variables indicating whether a sub-network is to be
added to the whole network, or not. Another variable xkp
is a nonnegative shipment flow variable, which indicates
the flow of shipment k ∈ K transported via the path p ∈ P,
i.e., the amount of cargo to be shipped. Fkp denotes the
freight rate of the shipment k ∈ K via the path p ∈ P.
F sP denotes the freight rate of the additional shipment s ∈ S,
which is attracted by the newly-added sub-network de-
fined as S.
By adding appropriate arc inclusion indicator variables as
well as flow variables we can model a multicommodity flow
problem similar to those in telecommunications network
design, see, e.g., [13, 20]. Here we concentrate on the
objective function.
Let Ckp be the shipment flow cost or variable cost of han-
dling the goods per unit flow of k along path p ∈ Pk. The
fixed costs of the network are not considered, because they
are sunk costs in this problem. When the liner carrier de-
cides to integrate with some potential sub-networks, the
fixed cost of the carriers’ network had already been in-
vested before, and the amount of it would not be taken into
account for the next stage. In contrast, the fixed costs of the
potential sub-networks should be considered because they
are among the main factors of the decision making process.
The objective function can then be formulated as follows:
max ∑k∈K
∑p∈Pk
Fkp xk
p + ∑s∈S
∑p∈Pk
F spxs
p − ∑k∈K
∑p∈Pk
Ckpxk
p ,
where:xk
p ≥ 0, ∀k ∈ K, p ∈ Pk.
The objective is to maximize the total profit of the inte-
grated network by taking into account not only the original
shipping demand but also the additional shipping demand
attracted by the improved network.
The nodes can be denoted as ni and the zones can be de-
noted as zi after zoning. Suppose that the liner carrier
attempts to construct the global network or just to improve
some part of the whole network. Figure 1 demonstrates
the nodes, zones and the links of the sub-network and the
whole network, respectively. We could not clearly sepa-
rate the procedures of selection (set up 3PL spin-offs or
select local agents) and zoning because they actually hap-
pen almost at the same time. However, slight differences
still exist. As for setting up a 3PL spin-off of the liner car-
rier, it might happen after zoning because at the moment
of location selection the liner carrier has already build up
a global service network and most probably the headquarter
of the 3PL spin-off will be located just in the centroid of
the zone. In contrast, the selection of the local agents may
influence the zoning of the liner carrier because some of
the local agents are so strong that the shipping volume of
the related zone changes too much. However, the common
39

Xiaoning Shi and Stefan Voß
idea of the setting up and selection is whether such deci-
sion would contribute to the payoff of the whole network
as well as the sub-network itself. Suppose that one liner
carrier attempts to cover the two main lands. The zon-
ing process follows the criteria of covering as many freight
nodes and simplifying the whole area as much as possible.
The coding process lets the zi represent instead of ni, which
tremendously decrease the links and the voyage time of the
vessels. However, once comparing the potential options of
the local agents of z6 and z7, an overlap of these two zones
is found. This infers that if the first local agent of z6 is
not strong, the initial zoning result can be obtained, but if
another alternative local agent is to be integrated, then the
zoning of z6 and z7 shall be reorganized.
Fig. 1. The zoning of the origin and the destination of long
distance transportation.
In Fig. 1, without loss of generality, we take z4 as the
origin area and the left side as the options of destination,
including z1, z2 and z3. The optimal route from the right
hand side to the left hand side of this figure depends on
the sub-networks inside the zones z1, z2 and z3 and their
connectivity.
Regarding the integration of any sub-network into the whole
network, both the payoff of the sub-network provider, in
this case, a 3PL or local agent, and the payoff of the whole
network must be positive and bigger than the former stages.
Otherwise, such integration usually makes no sense to the
liner carriers.
For possible heuristics to solve and validate some concept
proposed in this paper, we refer to [35]. Regarding a math-
ematical proof of a similar port-of-call scheduling problem
we refer to [19]. In addition, an interesting case study in-
cluding six European ports in the context of port selection
in the hinterland of Europe is [8].
5. Decision support systems
in transportation companies
As indicated in Section 3, competition among the liner
carriers currently relies on the implementation of the ser-
vice networks by means of selecting sub-network providers
and cooperating with them. Furthermore, in order to
have a smooth coordination and integration of different
sub-networks some sophisticated information systems are
necessary.
5.1. Liner carriers and port operators integration
for efficient supply chain management
Stepping back in history and the development of trade,
transportation and logistics, liner carriers or shipping car-
riers in general were pure traders centuries ago. However,
nowadays they tend to have the ambition of being more
comprehensive players. The shipping carriers attempt to
touch inland-haul service, short-sea connections and cer-
tainly logistics service mainly related to door-door trans-
portation (here we do not refer to the so-called value-added
activities inside manufacturing factories which are always
included as logistics, too).
Shippers and consignees are exporting and importing the
cargoes and pay the freight rates, accordingly. However, as
they only have direct service contracts with the liner car-
riers or the 3PL rather than with the port operators [29],
the detailed operations between logistics providers and port
operators are of less interest for them. Consequently, the
efficient and effective integrated services including trans-
portation services and port operations would be most wel-
comed by the customers, i.e., the shippers and the con-
signees.
In order to obtain better performance of service integra-
tion, DSS are of great importance for the liner carriers.
Regarding the difference between DSS and decision mak-
ing systems we distinguish whether the systems recom-
mend several potential actions or automatically implement
actions [16]. For the current solution methodologies,
optimization-based solutions of information systems focus
more on the average demands and requirements under static
conditions, and simulation-based solutions accommodate
the system dynamics which could be more suitable for
the real-world business [16]. Furthermore, heuristic-based
models contain the capability taking into account almost
all network configurations providing optimized solutions
accordingly.
5.2. Decision support system applications in liner and
logistics companies
Since the last decade internet-based business (or e-business)
activities have become a new technological challenge for
the shipping industry. However, beyond the introduction
of electronic data interchange (EDI) little systematic and
theoretical research on e-business has been undertaken
within this area so far. Therefore, we attempt to investi-
gate the application of information systems in the shipping
industry (the container shipping industry is focused in this
paper) and their impacts of e-business on the container ship-
ping industry in order to provide the liner carriers with the
managerial recommendations accordingly. For a literature
review on general business dynamics and the technology
40

From transocean routes to global networks: a framework for liner companies to build service networks
strategies of six different e-business models in the con-
tainer shipping industry see [2]. Moreover, we should note
that various areas lack the practical application of DSS,
largely due to the lack of unified generally applicable
systems, cf. [11].
While business activities could be divided into opera-
tional, tactical and strategic activities, the respective sub-
information systems perform various functions. End users
of a container shipping company could be basically distin-
guished regarding activities along those time horizons from
strategy promoters up to in-putters of daily operational data.
These include vessel positions, container status, service re-
quirements, payment transactions and so on.
As an example we consider Maersk Sealand which is re-
garded as a benchmark from almost every aspect in the
shipping industry. We focus on a “handwaving” description
of its information systems applications as well as imple-
mentations. The whole information system could be called
MGM, consisting of three subsystems, namely MARS,
GCSS and FACT, aiming at handling contracts, booking
accomplishment and finance accounting, respectively.
Once we start our observation from the most basic activ-
ities – slot booking and bill of lading (B/L) issuing – of
a container shipping company, it would shed light on the
whole applied information system. As shown in Fig. 2,
the exporter books capacity based on his planned cargo
transportation3, which is going to be transported to the im-
porter. To simplify the process, we regard the exporter as
the shipper and the importer as the consignee regardless the
pure medium trader who actually does not produce or own
cargo. The pure medium trader gains profits by buying and
selling cargo at different price, or maybe only transacting
the B/L rather than cargo itself.
Fig. 2. The service integration and its cash/cargo/information
flows (CRM – customer relationship management).
There are older and mature information systems applied
within Maersk Sealand, namely MARS and RKDS, which
help sales representatives and customer service staff to ad-
3Here we assume trade contracts in terms of CIF (cost, insurance and
freight). In applying other INCOTERMS, the analysis is similar. For
basic knowledge on INCOTERMS, we refer to, e.g., [14].
vise transportation services, arrange routes, input and out-
put data. The interfaces of those systems were long-time
criticized as not being user-friendly enough. They are still
simultaneously applied together with a new system called
global customer service system (GCSS) designed and devel-
oped by IBM. The GCSS is currently used mainly by the
customer service group globally providing functions like
routing, tracking, on-line publishing, etc. A “rater” – pro-
viding customer service – is supposed to use GCSS to fig-
ure out the service contract of a shipper and fix the service
price according to this shipper’s booking. Beyond expecta-
tion, more “raters” are now hired in Maersk Sealand than
during the period of applying the old systems, as it turns
out to be even harder to exchange data using the new in-
formation system. Moreover, the interface of GCSS with
other subsystems is not as smooth as expected. Manual
work is arranged to supplement system problems.
Regarding tactic and strategic level business management,
profit judgement and risk evaluation would be two main as-
pects for which information systems perform decision sup-
port functionality.
Process standardization. From a customers’ perspective,
requirements would be well satisfied if they are met timely
and specifically. In the past, once the requests of VIP cus-
tomers change, the workflow of the carriers may change
as well. However, implementing a new information system
results in a situation where most customers are regarded ex-
actly the same no matter what amount of cargo they trans-
port, while those customized requirements would be noted
in the specific entries inside the systems. Due to standard-
ized workflows within the system even exception handling
is assumed to be more streamlined especially when faced
by employees who are new to specific situations.
Profit pre-analysis. Continuous deficits push decision
makers to consider whether persisting transportation op-
erations along the involved routes and ports are profitable
or not. Various aspects are vital since any change of the
liner routes and logistics networks would lead amounts of
investment not only in marketing surveys but also in acqui-
sition of infrastructures including vessels and cranes, etc.
That is, it is a capital-condensed and cost-sensitive industry.
Similar to the operational systems of other liner carriers
and logistics companies, MARS in Maersk Sealand pro-
vides distinctive options for cost per unit and expected
benefit calculation for various types of containers regard-
ing, e.g., volumes they occupy on deck and in haul (such as
20DC/40DC, i.e., a single 20- or 40-foot container contain-
ing dry cargo; HC, i.e. a 45-foot high cube container; etc.).
Currently, an SAP R/3 package is implemented, namely fi-
nancial accounting for container transport (FACT), and it
is planned to be released by the end of 2008.
Risk evaluation. Risk evaluation based on historical data,
service simulation, and expert judgement is of importance
to demonstrate whether to accept specific transportation
requirements. For risk management considerations regard-
ing other types of cargo, such as crude and product oil
see, e.g., [21].
41

Xiaoning Shi and Stefan Voß
Different types of containers as well as cargo need to be
handled differently, especially reefer and hazmat containers.
On December 18, 2006, the REACH (registration, evalua-
tion, authorisation and restriction of chemicals) regulation
was formally adopted by the European Union and is en-
forced since June 1, 2007. In order to save the testing cost
on chemicals and to get an overview about which studies
are available, a system which could serve as data sharing
platform is currently under construction. A supplementary
but vital requirement of this system is to ensure that not
only manufacturers and importers but also their customers
and distributors have the information they need to use and
transport chemicals safely. Information relating to health,
safety and environment properties, and risk measurement is
required to be shared along the supply chain. Commercially
sensitive information is not required to be exchanged [26].
Although REACH has just been put into force recently,
its effect on information flow management within supply
chains is regarded as huge.
However, it should be noted that, due to fast EDI processes,
the information centre of the liner carrier need not be the
centroid of any zone defined in Section 4. Actually, some of
the information centres of the liner carriers are even located
far from hubs, following various criteria such as human
resources availability and cost. The geographic location of
an information centre is not a key issue in this paper and it
may be viewed as a fictitious node that contributes to the
whole service network.
6. Conclusions and further research
In this paper, we have discussed the network structure
of the maritime liner shipping companies and their spin-
offs providing 3rd party logistics services. Commonalities
with intermodal transportation in general as well as with
telecommunications network design may serve as a means
for advancing the subject. Moreover, game theoretical ap-
proaches may help to support strategic as well as tactical
decision making in liner shipping. This may involve the
assumption of cooperative as well as non-cooperative be-
haviors of involved players on different levels.
References
[1] K. W. Artz and T. H. Brush, “Asset specificity, uncertainty and
relational norms: an examination of coordination costs in collabora-
tive strategic alliances”, J. Econom. Behav. Organiz., vol. 41, no. 4,
pp. 337–362, 2000.
[2] J. H. Auh, “Analysis of the impacts of internet-based business ac-
tivities on the container shipping industry: the system dynamics
modelling approach with the framework of technological evolution”,
Ph.D. thesis, Cambridge, MIT, 2005.
[3] A. S. Bergantino and A. W. Veenstra, “Interconnection and co-
ordination: an application of network theory to liner shipping”, Int.
J. Marit. Econom., vol. 4, no. 3, pp. 231–248, 2002.
[4] V. Carbone and M. De Martino, “The changing role of ports in
supply-chain-management: an empirical analysis”, Marit. Policy
Manage., vol. 30, no. 4, pp. 305–320, 2003.
[5] P. Cariou, “Strategic alliances in liner shipping: an analysis of “op-
eration synergies”, Ph.D. thesis, University of Nantes, 2000.
[6] T. G. Crainic, “Service network design in freight transportation plan-
ning”, Eur. J. Oper. Res., vol. 122, pp. 272–288, 2000.
[7] P. A. David, “Information network economics: externalities, inno-
vations and evolution”, in The Economics of Information Networks,
C. Antonelli, Ed. Amsterdam: North Holland, 1992, pp. 103–106.
[8] P. W. de Langen, “Port competition and selection in contestable
hinterlands; the case of Austria”, Eur. J. Transp. Infrastr. Res.,
vol. 7, no. 1, pp. 1–14, 2007.
[9] J.-F. Ding and G.-S. Liang,“Using fuzzy MCDM to select part-
ners of strategic alliances for liner shipping”, Inform. Sci., vol. 173,
pp. 197–225, 2005.
[10] J.-F. Ding, G.-S. Liang, C.-H. Yeh, and Y.-C. Yeh, “A fuzzy multi-
criteria decision-making model for the selection of courier service
providers: an empirical study from shippers’ perspective in Taiwan”,
Marit. Econom. Logist., vol. 7, pp. 250–261, 2005.
[11] J. Engelke and H. Simon, “Decision support systems in marketing”,
J. Bus. Mark. Manage., vol. 1, pp. 289–307, 2007.
[12] K. Fagerholt, “Designing optimal routes in a liner shipping prob-
lem”, Marit. Policy Manage., vol. 31, no. 4, pp. 259–268, 2004.
[13] H. Höller and S. Voß, “Software tools for a multilayer network de-
sign”, J. Telecommun. Inform. Technol., no. 3, pp. 57–63, 2005.
[14] INCOTERMS, 2007 (last call 15.12.2007), http://www.iccwbo.org/
incoterms/id3045/index.html
[15] T. C. Lirn, H. A. Thanopoulou, M. J. Beynon, and A. K. C. Beres-
ford, “An application of AHP on transhipment port selection:
a global perspective”, Marit. Econom. Logist., vol. 6, pp. 70–91,
2004.
[16] G. M. Magableh, “A dynamic replenishment system for integrating
supply chain functions”, Marit. Econom. Logist., vol. 9, pp. 52–66,
2007.
[17] M. Malchow and A. Kanafani, “A disaggregate analysis of factors
influencing port selection”, Marit. Policy Manage., vol. 28, no. 3,
pp. 265–277, 2001.
[18] J. Mangan, C. Lalwani, and B. Gardner, “Identifying relevant vari-
ables and modelling the choice process in freight transportation”,
Int. J. Marit. Econom., vol. 3, pp. 278–297, 2001.
[19] T. Matsumura and D. Shimizu, “Cournot and Bertrand in shipping
models with circular markets”, Reg. Sci., vol. 85, no. 4, pp. 585–598,
2006.
[20] B. Melian, H. Höller, and S. Voß, “Designing WDM networks by
a variable neighborhood search”, J. Telecommun. Inform. Technol.,
no. 4, pp. 15–20, 2006.
[21] J. R. W. Merrick, J. R. Van Dorp, J. Harrald, T. Mazzuchi,
J. E. Spahn, and M. Grabowski, “A systems approach to manag-
ing oil transportation risk in prince William Sound”, Syst. Eng.,
vol. 3, no. 3, pp. 128–142. 2000.
[22] H. Min and Z. Guo, “The location of hub-seaports in the global
supply chain network using a cooperative competition strategy”, Int.
J. Integr. Supply Manage., vol. 1, no. 1, pp. 51–63, 2004.
[23] M. C. Mourao and M. V. Pato, “Ship assignment with hub and spoke
constraints”, Marit. Policy Manage., vol. 29, no. 2, pp. 135–150,
2001.
[24] A.-S. Nir, K. Lin, and G.-S. Liang, “Port choice behaviour-from the
perspective of the shipper”, Marit. Policy Manage., vol. 30, no. 2,
pp. 165–173, 2003.
[25] T. E. Notteboom, “Container shipping and ports: an overview”, Rev.
Netw. Econom., vol. 3, no. 2, pp. 86–106, 2004.
[26] REACH, 2007 (access date Apr. 24th, 2007), http://ec.europa.eu/
environment/chemicals/reach/reach in brief04 09 15.pdf
[27] P. J. Rimmer, “Ocean liner shipping services: corporate restructuring
and port selection/competition”, Asia Pac. Viewp., vol. 39, no. 2,
pp. 193–208, 1998.
[28] R. Robinson, “Liner shipping strategy, network structuring and
competitive advantage: a chain systems perspective”, Res. Transp.
Econom., vol. 12, pp. 247–289, 2005.
42

From transocean routes to global networks: a framework for liner companies to build service networks
[29] X. Shi and S. Voß, “Container terminal operations under the influ-
ence of shipping alliances”, in Risk Management in Port Operations,
Logistics and Supply Chain Security, K. Bichou, M. G. H. Bell, and
A. Evans, Eds. London: Informa, 2007, pp. 135–163.
[30] D. P. Song, J. Zhang, J. Carter, T. Field, J. Marshall, J. Polak,
K. Schumacher, P. Sinha-Ray, and J. Woods, “On cost-efficiency
of the global container shipping network”, Marit. Policy Manage.,
vol. 32, no. 1, pp. 15–30, 2005.
[31] R. Stahlbock and S. Voß, “Operations research at container termi-
nals – a literature update”, OR Spectrum, vol. 30, pp. 1–52, 2008.
[32] D. Steenken, S. Voß, and R. Stahlbock, “Container terminal opera-
tion and operations research – a classification and literature review”,
OR Spectrum, vol. 26, pp. 3–49, 2004.
[33] G. Vaidyanathan, “A framework for evaluating third-party logistics”,
Commun. ACM, vol. 48 no. 1, pp. 89–94, 2005.
[34] B. Wagner, Hub&Spoke-Netzwerke in der Logistik: Modellbasierte
Lösungsansätze für ihr Design. Wiesbaden: Gabler, 2006.
[35] K. Weng, C. Yang, and Y. Ma, Two Artificial Intelligence Heuris-
tics in Solving Multiple Allocation Hub Maximal Covering Problem,
LNCS. Berlin-Heidelberg: Springer, 2006, vol. 4113, pp. 737–744.
[36] N. Wieberneit, “Service network design for freight transportation:
a review”, OR Spectrum, vol. 30, pp. 77–112, 2008.
Xiaoning Shi is a Ph.D. can-
didate jointly affiliated with the
Institute of Information Sys-
tems at the University of Ham-
burg, Germany, and the De-
partment of Management at the
Shanghai Jiao Tong University,
P. R. China. Her position in
Hamburg is supported by the
DAAD (Deutscher Akademis-
cher Austauschdienst) and CSC
(China Scholarship Council). Formerly, she was working
as a teaching assistant and later as a lecturer at the
Institute of International Shipping, Department of Navel
Architecture Ocean and Civil Engineering, Shanghai Jiao
Tong University. In 2005, she was a visiting research assis-
tant at the University of Hong Kong and in 2002 she was
working at Maersk-Sealand Shipping Corporation, Shang-
hai. She holds Bachelor and Master degrees in engineering
from Dalian Maritime University (China). Her current
research interests are in econometrical and game theo-
retical applications in the shipping/port industry and opti-
mization of logistics networks.
e-mail: [email protected]
Institute of Information Systems
University of Hamburg
Von-Melle-Park 5
D-20146 Hamburg, Germany
Shanghai Jiao Tong University
1954 Hua Shan Road
Shanghai 200030, P. R. China
Stefan Voß is Professor and Di-
rector of the Institute of In-
formation Systems at the Uni-
versity of Hamburg, Germany.
Previous positions include full
Professor and Head of the De-
partment of Business Admin-
istration, Information Systems
and Information Management at
the University of Technology
Braunschweig, Germany, from
1995 up to 2002. He holds degrees in mathematics
(diploma) and economics from the University of Ham-
burg and a Ph.D. and the habilitation from the Univer-
sity of Technology Darmstadt. His current research in-
terests are in quantitative/information systems approaches
to supply chain management and logistics including pub-
lic mass transit and telecommunications. He is author and
co-author of several books and numerous papers in various
journals. Professor Voß serves on the editorial board of
some journals including being Editor of “Netnomics”, Edi-
tor of “Annals of Information Systems”, Associate Editor of
“INFORMS Journal on Computing” and Area Editor of
“Journal of Heuristics”. He is frequently organizing work-
shops and conferences. Furthermore, he is consulting with
several companies.
e-mail: [email protected]
Institute of Information Systems
University of Hamburg
Von-Melle-Park 5
D-20146 Hamburg, Germany
43

60
container yard, container freight station, and door to meet customers’different demands.
In regard to business practice, the discussion and conclusion ofthis paper is useful not only for researchers but also for practitioners.First, this paper helps managers engaged in liner services. A betterunderstanding of the structure and formation of the liner shippingstrategic alliances sheds light on more effective cooperation amongthem. Second, this paper helps managers engaged in port operations.As many sources state (1–5), the capacity and utilization of con-tainer ports are determined, to a great extent, by those liners and thealliances who select these ports as service providers. Thus, portoperators could provide more advanced service to meet the require-ments of the liner carriers by means of understanding how these lineralliances transform (6–9).
From the aspect of theoretical methodology, game theory is consid-ered as a suitable tool to analyze competitive structures and competi-tive advantages in various industries. Because of common imbalancesbetween supply and demand in the liner shipping market (10), com-petition in the liner shipping industry is fierce. There is a need tocreate a theoretical framework for understanding shipping’s com-petitive structures and the competitive advantages of being mem-bers of liner shipping alliances, especially those of fast-developingliner shipping carriers. To create this framework, it is necessary toidentify and understand different elements in the games of linermarkets. The aim of this paper is to analyze liner shipping strategicalliances and their establishment as well as possible transformationsunder market uncertainties within the framework of game theory.
The paper is organized as follows. The next section presents a briefsketch of the liner industry, including the turbulence in it. That is fol-lowed by a review of the literature on the applications of game theoryto liner shipping alliances and other industries. Motivations of short-term cooperation among liner carriers are discussed next, followed bya discussion of a conceptual framework of long-term strategies forshipping companies. Finally, after a scenario demonstration, someconclusions are reported together with suggestions for further research.
REVIEW OF LINER SHIPPING ALLIANCES
Fundamentals of Alliances
An alliance is a close, collaborative relationship between two or morefirms with the intent of accomplishing mutually compatible goals thatwould be difficult for each to accomplish alone (11). Liner shippingalliances are collaborative relationships among different companies,with each member being financially independent. If the expectedbenefits are not gained, however, a liner company would no longer
Iterated Cooperation and PossibleDeviations Between Liner Shipping CarriersBased on Noncooperative Game Theory
Xiaoning Shi and Stefan Voss
The top liner shipping carriers have already established alliances in theshipping industry and are investigating new business connections withcustomers, suppliers, competitors, consultants, and other companies.Several studies have attempted to explain this phenomenon using avariety of conceptual and theoretical frameworks. This paper focuseson liner shipping strategic alliances and their establishment and trans-formation within the framework of noncooperative game theory, whichis considered an effective tool to analyze motivations, competitive struc-tures, strategies, and potential payoffs in a number of industries, includ-ing the turbulent liner shipping industry. Not only can a liner shippingcompany be seen as a player in a shipping alliance, but a liner shippingstrategic alliance itself can be viewed as a player when it competes withother alliances. In this paper, more attention is paid to the former situa-tion by assuming that those liner companies are unable to make enforce-able contracts through outside parties. This paper aims to (a) indicatethe motivations for short-term cooperation among several liner carri-ers, (b) analyze the pros and cons of being a member of a liner shippingstrategic alliance, (c) explain a player’s deviation or departure behaviorwhen it faces turbulence and unpredictable shipping circumstances, and(d) recommend ways to enhance long-term alliance stability by increas-ing benefits while decreasing drawbacks. Of those four main points, thedifferences between short-term cooperation and long-term alliance arethe number of subgames and the potential future payoff. Specific mod-els based on the assumption of noncooperative behavior are set up asiterated games to give those differences clear explanations. The outcomeof this paper will be helpful for liner shipping carriers attempting to suc-ceed in the shipping industry with greater efficiency, better customerservice, and lower cost.
Expanding global transportation requires paying more attention tothe strategic and operational analyses as well as planning issues fortransport companies. Transportation desires include containerizedcargo transportation, tramp shipping, and oil and liquefied chemi-cal transportation, among others. In this paper, the focus is on sup-pliers such as liner shipping carriers who meet one specific aspectof transportation—containerized cargo. Liner shipping carriers pro-vide types of services as linkages connecting nodes including port,
X. Shi and S. Voss, Institute of Information Systems, University of Hamburg, Von-Melle-Park 5, D-20146, Hamburg, Germany. Further affiliation for X. Shi: Shang-hai Jiao Tong University, 1954 HuaShan Road, 200030, Shanghai, China.Corresponding author: X. Shi, [email protected].
Transportation Research Record: Journal of the Transportation Research Board,No. 2066, Transportation Research Board of the National Academies, Washington,D.C., 2008, pp. 60–70.DOI: 10.3141/2066-07
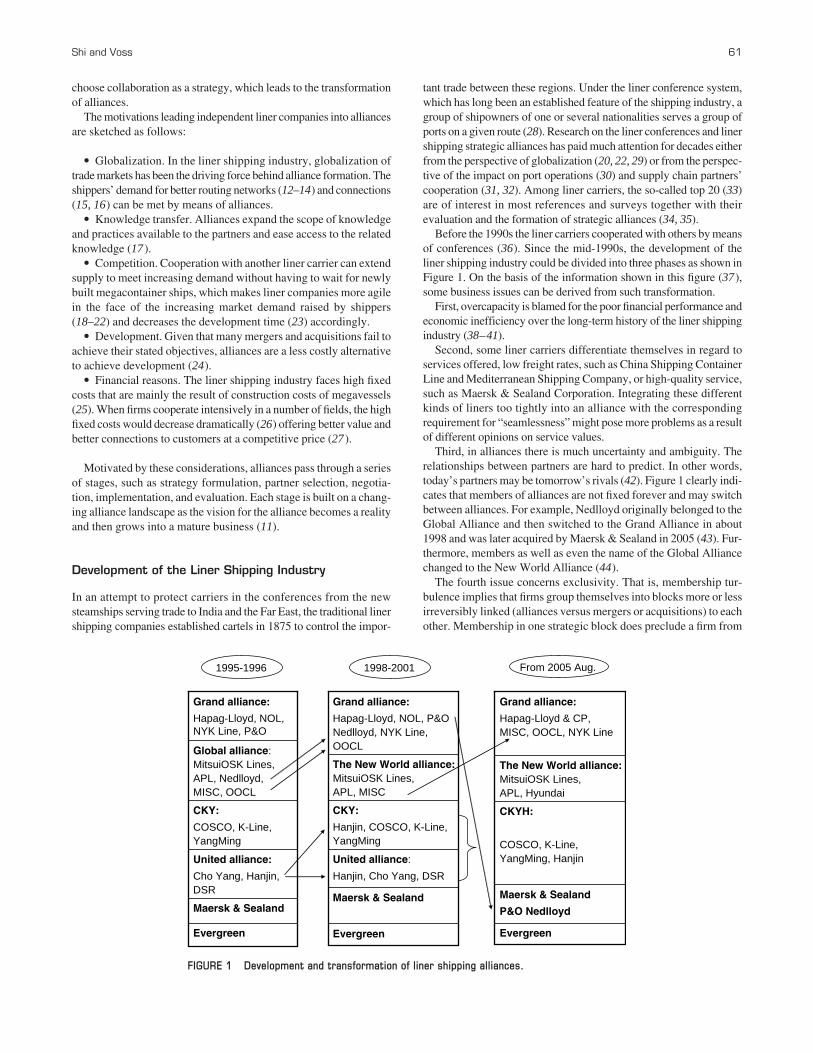
Shi and Voss 61
choose collaboration as a strategy, which leads to the transformationof alliances.
The motivations leading independent liner companies into alliancesare sketched as follows:
• Globalization. In the liner shipping industry, globalization oftrade markets has been the driving force behind alliance formation. Theshippers’ demand for better routing networks (12–14) and connections(15, 16) can be met by means of alliances.
• Knowledge transfer. Alliances expand the scope of knowledgeand practices available to the partners and ease access to the relatedknowledge (17 ).
• Competition. Cooperation with another liner carrier can extendsupply to meet increasing demand without having to wait for newlybuilt megacontainer ships, which makes liner companies more agilein the face of the increasing market demand raised by shippers(18–22) and decreases the development time (23) accordingly.
• Development. Given that many mergers and acquisitions fail toachieve their stated objectives, alliances are a less costly alternativeto achieve development (24).
• Financial reasons. The liner shipping industry faces high fixedcosts that are mainly the result of construction costs of megavessels(25). When firms cooperate intensively in a number of fields, the highfixed costs would decrease dramatically (26) offering better value andbetter connections to customers at a competitive price (27).
Motivated by these considerations, alliances pass through a seriesof stages, such as strategy formulation, partner selection, negotia-tion, implementation, and evaluation. Each stage is built on a chang-ing alliance landscape as the vision for the alliance becomes a realityand then grows into a mature business (11).
Development of the Liner Shipping Industry
In an attempt to protect carriers in the conferences from the newsteamships serving trade to India and the Far East, the traditional linershipping companies established cartels in 1875 to control the impor-
tant trade between these regions. Under the liner conference system,which has long been an established feature of the shipping industry, agroup of shipowners of one or several nationalities serves a group ofports on a given route (28). Research on the liner conferences and linershipping strategic alliances has paid much attention for decades eitherfrom the perspective of globalization (20, 22, 29) or from the perspec-tive of the impact on port operations (30) and supply chain partners’cooperation (31, 32). Among liner carriers, the so-called top 20 (33)are of interest in most references and surveys together with theirevaluation and the formation of strategic alliances (34, 35).
Before the 1990s the liner carriers cooperated with others by meansof conferences (36). Since the mid-1990s, the development of theliner shipping industry could be divided into three phases as shown inFigure 1. On the basis of the information shown in this figure (37),some business issues can be derived from such transformation.
First, overcapacity is blamed for the poor financial performance andeconomic inefficiency over the long-term history of the liner shippingindustry (38–41).
Second, some liner carriers differentiate themselves in regard toservices offered, low freight rates, such as China Shipping ContainerLine and Mediterranean Shipping Company, or high-quality service,such as Maersk & Sealand Corporation. Integrating these differentkinds of liners too tightly into an alliance with the correspondingrequirement for “seamlessness” might pose more problems as a resultof different opinions on service values.
Third, in alliances there is much uncertainty and ambiguity. Therelationships between partners are hard to predict. In other words,today’s partners may be tomorrow’s rivals (42). Figure 1 clearly indi-cates that members of alliances are not fixed forever and may switchbetween alliances. For example, Nedlloyd originally belonged to theGlobal Alliance and then switched to the Grand Alliance in about1998 and was later acquired by Maersk & Sealand in 2005 (43). Fur-thermore, members as well as even the name of the Global Alliancechanged to the New World Alliance (44).
The fourth issue concerns exclusivity. That is, membership tur-bulence implies that firms group themselves into blocks more or lessirreversibly linked (alliances versus mergers or acquisitions) to eachother. Membership in one strategic block does preclude a firm from
Evergreen
Maersk & Sealand
United alliance:
Cho Yang, Hanjin,DSR
CKY:
COSCO, K-Line, YangMing
Global alliance: MitsuiOSK Lines, APL, Nedlloyd, MISC, OOCL
Grand alliance:
Hapag-Lloyd, NOL, NYK Line, P&O
Evergreen
Maersk & Sealand
United alliance:
Hanjin, Cho Yang, DSR
CKY:
Hanjin, COSCO, K-Line, YangMing
The New World alliance: MitsuiOSK Lines, APL, MISC
Grand alliance:
Hapag-Lloyd, NOL, P&O Nedlloyd, NYK Line, OOCL
Evergreen
Maersk & Sealand
P&O Nedlloyd
CKYH:
COSCO, K-Line, YangMing, Hanjin
The New World alliance: MitsuiOSK Lines, APL, Hyundai
Grand alliance:
Hapag-Lloyd & CP, MISC, OOCL, NYK Line
1995-1996 1998-2001 From 2005 Aug.
FIGURE 1 Development and transformation of liner shipping alliances.

membership in a different strategic block. However, to some extentthere seems to be some tolerance. As long as the linkage that is estab-lished with a third firm does not conflict with the objectives of theblock, a firm might be linked with firms outside the block. That is, inthe long run, alliance relationship management is more importantthan the initial formal design.
The fifth issue is related to the market cycle. Forming alliancesand other types of firm linkages can be considered to be the result ofstrategic decision making caused by a turbulent business environ-ment. The speed of change to which today’s markets are subjectedcreates a great deal of uncertainty in regard to which are the beststrategic activities for competing in the present markets. Firms can-not internally adapt to these strategic options at the required speedand have to possess the strategic capabilities needed to pursue thosemarket opportunities (45). Thus, the formation of alliance networksis a response to an uncertain market for strategic capabilities. Firmshave to keep reshaping their strategic capabilities to match the needsof the ever-changing business. Every firm has to incorporate or gainaccess to the complementary capabilities of other firms to be able torespond to the demands of a continuously changing marketplace.
Last but not least in importance, the (de-)regulations of the linershipping industry make sense (39). Antitrust policy pushed the linercarriers, to some extent, to form strategic alliances (46, 47 ) insteadof keeping liner conferences as in the past. In addition, some contri-butions (48, 49) explain the advantages and disadvantages, from thepoint of view of the liners, of entering into alliances and explore theimpact of the U.S. regulatory regime of cooperative agreements.
Besides the general issues discussed above, some researchers alsoobserved specific routes. For instance, Rimmer (50–53) as well asBendall and Stent (54) did a series of surveys in the 1990s focusingon the liner shipping strategic alliances in the Pacific Economic Zone.
The essence of strategy formulation of a liner carrier is copingwith fierce competition in the liner shipping industry. Concerningthe status of the liner shipping market, some research has been donefrom the perspective of an oligopoly model (55) and the problem offree riders when there is entry deterrence (56). However, taking intoaccount the relationships between the liner carriers, to be able toplay the alliance game, managers have to identify the rules that gov-ern the formation of an alliance. Moreover, in the fight for marketshare, competition is not manifested only with other players. It isclear that liner carriers cannot accomplish their cooperative strategyin isolation. They are embedded in a network of corporate relation-ships that influence the available options for each other. Once analliance is formed, the relatively competitive positions in an indus-try change as a result of the bargaining power of suppliers and cus-tomers. And the newly formed alliances build up barriers that defendagainst other entrants and substitutes, accordingly.
Thus, to explain and solve the key issues of strategic alliances, thetool of choice is game theory, which plays vital roles in shaping com-petition and cooperation in the liner shipping industry. This industryhas an underlying structure and a set of fundamental economic andtechnical characteristics implying the turbulence mentioned above.Other liner carriers, customers, suppliers, potential entrants, andsubstitute products are all players that may be more or less prominentor active depending on this industry. Also, the strategies of rationalplayers obviously depend on the strategies of other players (57) sur-viving in the same market. The strategists have to learn which moti-vations and factors make the environment change. Then they canposition the company to cope best with the shipping industry envi-ronment and to influence that environment in the company’s favor.Game theory thus makes an appropriate tool to analyze strategies ofcompanies in the liner shipping industry.
62 Transportation Research Record 2066
APPLICATION OF GAME THEORY TO LINER SHIPPING ALLIANCES
Game theory applications in various industries seem to be a dime adozen. Here a very short selection is provided as they may be relatedto liner shipping alliances.
One motivation of cooperation is that rational players realize thatif they arrange the business from a collective rationality perspective,more payoffs can be achieved (58). However, those players do nothave the confidence that other rivals, their potential business part-ners, would like to cooperate in a fair way. Concerning the criteriaof selecting partners, multicriteria decision-making models (59, 60)are referred to here as well as other methodologies (61) based on themotivations and former performance of the potential partners (62).Some bargaining or even several rounds of negotiation thus mayoccur before real cooperation takes place. The bargaining and nego-tiations are aiming at balancing risks and benefits (63, 64) to im-prove mutual capabilities of the partners to survive in the turbulentmarket. In liner service cooperation, the main negotiation and com-promise lie in vessel capacity allocation.
Tijs and Driessen (65) applied the concept of Shapley’s core (66,67 )—an important concept of fairness in cooperative games—toanalyze varieties of allocation problems, including marginal cost inentering coalitions, minimizing maximum unhappiness or maximumregret and separable and nonseparable costs. Moreover, this researchwas advanced toward the cost gap allocation method by using a valueconcept introduced in 1981. Skorin-Kapov formulates cost allocationproblems in industries as a cost cooperative game (68). The main ideais to find a fair share of the total cost for those who attempt to use thenetworks independent from the network’s purposes and utilities (69).Since the late 1980s and the 1990s, the application of core theory in theshipping industry arose to analyze the monopoly market status (70),market equilibrium (71), and noncooperative entry deterrence (72),among other factors. Some of the optimized output, or a good outputcomputed by a core heuristic, could be applied to any related industryonce it incorporates competition and cooperation. The researchmentioned above is based mainly on the cooperative behaviors of theinvolved players. As for the general survey on the cooperative strate-gies of international business, refer to partner cooperation (73) as wellas the solution of the partner asymmetries problem (74). In 2002, Songand Panayides (26), who focus their research specifically on mar-itime transportation, applied cooperative game theory to liner shippingstrategic alliances. They not only analyzed the cost allocation but alsomentioned fair profit allocation among members of liner shippingalliances based on the assumption of cooperative behaviors. This couldbe one of the factors that keep consortia or alliances stable. Similarideas are also mentioned by Ryoo and Thanopoulou (75).
However, the essence of formulating a strategy is relating a com-pany to its environment. Although the previous paragraph mentionedmethods to allocate costs and benefits with acceptable fairness andsatisfactory solutions, the fact that the environment of a companychanges every now and then should not be ignored (76). When themarket and rivals are beyond what a company or an alliance forecastbefore, turbulence inevitably occurs (77). It may then be the right timeto apply noncooperative game theory to restructure the status and sit-uation in such an industry because, unlike cooperative game theory,noncooperative game theory does not assume that all players haveincentives to cooperate with each other with tight binding agreements,which provides more possibilities to better simulate real-world scenar-ios. The common assumption of cooperative and noncooperativegame theory is that the players are rational. This is a suitable assump-tion for members and competitors of liner shipping alliances. Top liner

Shi and Voss 63
carriers can be regarded as rational players in games (subgames anditerated games) because they all have long-time experience and havesurvived successfully as carriers providing liner shipping services.
The Cournot model is by far the most widely used framework forperforming an assessment of the profit potential in various industries(78). It is also suitable for the liner shipping industry based on itsoligarchic characteristic as discussed previously.
APPLICATION FOR SHORT-TERM STRATEGYFOR LINERS IN THE LINER INDUSTRY
Incentives of Liner Carriers as Players
First, some notation is defined:
li = liner i, acting as one of the players in the game discussed,qi = slot (ship) supply of liner i in a certain lane,ui = payoff of liner i in a certain lane,Q = entire slot (ship) supply in a certain lane,U = entire payoff of all liners in a certain lane,R = entire demand in a certain lane,n = number of liners,di = number of liner i’s ships in a certain lane,p = slot selling price that could sell out all the slots,
a, b = two positive parameters in the price function,ci = unit variable cost of liner i,
q*icnt = best slots (ship) supply of liner i based on the Cournot
model in static games,uicnt = maximum payoff of liner i based on the Cournot model in
static games,cavg = average unit variable cost of those liner carriers in a
certain lane,Q* = best slots (ship) supply from integral point of view,U* = maximum payoff from integral point of view,
q*icop = from integral point of view the best ship supply of liner i
based on cooperation,u*
icop = from integral point of view the maximum payoff of lineri based on cooperation,
q*idym = best slot (ship) supply of liner i in dynamic games,
u*idym = maximum payoff of liner i in dynamic games,Qcnt = entire slot (ship) supply based on the Cournot model in
static games,Qdym = entire slot (ship) supply in dynamic games,Pcnt = freight rate based on Cournot model in static games,
Pdym = freight rate in dynamic games,λi = percentage that liner i shares the additional payoff caused
by cooperation,γ = discount factor,δ = present value rate,
q*idev = best slot (ship) supply of liner i when it deviates from
cooperation in iterated games,u*
idev = maximum payoff of liner i when it deviates from coop-eration in iterated games,
t = stages of iterated games, andxi = penalty ship supply of liner i based on iterated games.
But the customer’s transportation desire sometimes exceeds theship supply in the liner shipping market. Meanwhile, liner companiesare aware that an increased ship supply would increase freight incomeby transporting more goods. However, the average period of buildinga new vessel (18 months) is relatively longer than the lead times thatcould respond to the market well. In other words, the market
supply–demand situation might change a great deal while new ves-sels are being built and after those vessels are launched. Thus, in mostcases, cooperation with other liner companies could be a better choicethan investing too much capital in new vessels. Besides cost saving,providing an agile response to the liner shipping market leads to thiskind of cooperation.
On the other hand, the ship supply sometimes exceeds customerdesire in the liner shipping industry, resulting in overcapacity (78, 79).Under this situation, the motivation for cooperation is to improve trans-portation services by approaches such as extending hinterland, reduc-ing voyage time, increasing feeder ports, and strengthening transportnetworks. There are two main modes of cooperation, common ves-sel scheduling and slot agreement, which include slot-exchangingand slot-chartering business.
When transportation desire exceeds ship supply, the liners needto improve their services to meet customer demands and provide aquick response to the liner market as well. Therefore, cooperationamong the liners is built based on the liners’ common benefits. How-ever, when overcapacity occurs in the liner industry, it is not thateasy to understand why the liners still cooperate with others. There-fore, in this paper, more effort is put into discussing how short-runand long-run cooperation are set up when overcapacity occurs.
Ship Supply Exceeding Transportation Desire
A static game is first constructed and later further developed into adynamic game. A static game in this case means that all the compet-itive liner carriers make their decisions on slot supply at the sametime or perhaps not at exactly the same time, but without knowingthe others’ decisions in advance. The following assumptions andformulations are made:
When liners l1, l2, . . . , ln service ship supply q1, q2, . . . , qn, thenthe entire ship supply in the liner market should be
The freight rate price is p, which varies according to the followingfunction:
Fixed costs of vessels do not change according to different use ofslots. That is, those fixed costs are not related to the subsequentstrategies and can be viewed as sunk costs.
The marginal cost ci of liner li (i = 1, 2, . . . , n) is equal to the aver-age variable cost, because fixed costs are regarded as sunk costs asdiscussed above. The payoff of liner li (player li) could be defined asfollows:
From this objective function, it can be deduced that the bestresponse of li depends on the strategies of other players lj, i ≠ j.
max , , . . . ,u bq a b q c q ii i j ij
n
i= − + − −⎛⎝⎜
⎞⎠⎟
==
∑2
1
1 2 nn j i; ( )and ≠ 1
u q p Q c q q a b q qi i i i i i jj
n
= ( ) − = − +⎛⎝⎜
⎞⎠⎟
⎡
⎣⎢
⎤
⎦⎥ −
=∑
1
cc q
i n j i
i i
= ≠1 2, , . . . , ; and
p p Q a b qii
n
= ( ) = −=
∑1
Q qii
n
==
∑1

64 Transportation Research Record 2066
Let
then
According to the definition of Nash equilibrium (57), to obtain asmuch payoff as possible, the best response of li is
Then
With different i one obtains different q*icnt, u*
icnt. However, eachplayer makes the decision based on individual rationalities.
Another scenario is now considered, one in which the same prob-lem is discussed from an integration point of view, in other words, fromthe aspect of collective rationality rather than individual rationalities.
Let
then
Compared with the results obtained based on individual rational-ities of the players, if
and
the formulations above denote that the efficiency of collective ratio-nality (i.e., alliances or consortia) is higher than that of individual ratio-nalities (i.e., individually operate in the market). In the liner shippingindustry, this means that a relative lower slot supply could imply aneven higher payoff and make the market reach status with higher effi-
u Uii
n
=∑ ≤
1
*
q Qii
n
=∑ ≥
1
*
Ua c
b* ( )=
−( )avg
2
45
Qa c
b* ( )=
−( )avg
24
dU
dQ= 0
U Q p Q c Q Q a bQ c Q
bQ a c
= ( ) − = −( ) −
= − + −(i i i
avg avg
avg2 ))Q
u
a b q c
bi ji
i ij
n
cnt* ( )=
− −⎛⎝⎜
⎞⎠⎟
≠=∑
1
2
43
q
a b q c
bi ji
j ij
n
cnt* ( )=
− −⎛⎝⎜
⎞⎠⎟
≠=∑
1
22
− + − −⎛⎝⎜
⎞⎠⎟
= ≠=
∑2 01
bq a b q c i ji j ij
n
∂∂
= =u
qi ni
i
0 1, 2, . . . ,
ciency, namely Pareto-optimality movement. That is, once liner carri-ers break the barriers of individual rationalities, better payoffs can beachieved compared with operating the businesses individually. How-ever, the Nash equilibrium (57), which is based on individual rational-ities, is stable if neither outside factors nor other players change. Ifthere are changes, the conflict of individual rationalities and collectiverationality occurs. Even if there is a former stable equilibrium, atten-tion will be paid to those motivations that induce the cooperation andthe stability as well as the turbulence of it.
Negotiation on Capacity Allocation Before Cooperation
Here a dynamic game is constructed that is started by l1. Because l1
is the first mover of this game, when l2 moves, l2 already knows howl1 acts. The optimal response of l1 is to make every effort to obtainmaximized payoff. Therefore, l2 should be analyzed first, althoughl2 is not the first mover in this game.
Let
Then
Compared with results obtained from the Cournot model basedon the static game:
ua c c
b11 2
22
915cnt
* ( )=− +( )
qa c b q
b
a c c
b22 1 1 2
2
2
314cnt
* ( )=− −( )
=+ −( )i
qa c b q
b
a c c
b11 2 2 1
2
2
313cnt
* ( )=− −( )
=+ −( )i
p a b Qa c c
dym dym= − =+ +( )
i 1 2
412( )
Q q qa c c
bdym dym dym= + =− −( )
1 21 23
411* * ( )
ua c c
b21 2
23
1610dym
* ( )=+ −( )
qa c c
b21 23
49dym
* ( )=+ −( )
ua c c
b11 2
2
88dym
* ( )=− +( )
qa c c
b11 2
27dym
* ( )=− +( )
∂∂
=u
qi
i
0
u b q a b q c q1 12
2 1 1= − + − −( )i i
qa b q c
b21 2
26dym
* ( )=− −( )i

Add Equations 13 and 14,
Some important conclusions can now be made. First,
Second, from Equations 7 and 13, c2 > 0, q2 > 0, so q*1dym > q*
1cnt:
From Equations 8 and 14, c1 > 0, a − c1 + c2 > a − 2c1 + c2, and 8b <9b, so
u*1dym > u*
1cnt
Third,
Qdym > Qcnt
From Equations 11 and 17, while a > 0 > −(c1 + c2), then
9a − 3(c1 + c2) > 8a − 4(c1 + c2)
so Qdym > Qcnt.
Fourth,
pdym < pcnt.
From Equations 12 and 18 together with the third conclusion, pdym
< pcnt is derived.On the basis of the conclusions above, it is clear that static games
and dynamic games are quite different and lead to different payoffs,accordingly. Furthermore, dynamic games consider the steps of theplayer and the strength differences between players, too. This providesa possible foundation to observe the leader and the followers in thegame. It is proposed that the power ratio of players is λ1 : λ2 = q1dym :q2dym. This means that an intuitive strength difference between play-ers is indicated by their supplies in dynamic games if consequencesof the games are taken into account. This original proposal is anassumption used in the further discussion of modeling approaches.
CONCEPTUAL FRAMEWORK OF LONG-RUNSTRATEGIES FOR LINER SHIPPING CARRIERS
“Tit-for-Tat” as a Strategy to Survive in Iterated Subgames
To make the games “play” in a long run requires players to repeat anditerate the subgames several times, no matter whether the followinggames are exactly the same as before or not. This fits the liner marketwell if the continuous competition year after year is considered. Thenthe decisions about prices and supplies could be regarded as sub-games. When the subgames repeat infinitely, how can cooperationcontinue and succeed?
At the first stage, two players choose (q*1cop, q*
2cop) together withrespective payoffs and keep it until stage t − 1. If at stage t − 1,
u u1 1dym cnt* *>
q q1 1dym cnt* *>
p a b Qa c c
cnt cnt= − =+ +( )
i 1 2
318( )
Q q qa c c
bcnt cnt cnt= + =− −( )
1 21 22
317* * ( )
ua c c
b22 1
22
916cnt
* ( )=− +( )
Shi and Voss 65
both players’ supplies meet (q*1cop, q*
2cop), the cooperation continues.Otherwise, the supplies change to (q*
1cnt, q*2cnt).
The main idea of this tit-for-tat strategy is to attempt cooperation atthe first stage. If other players deviate from the former cooperation, apenalty from the cooperation partner is waiting for them.
Suppose that l1 has already taken the tit-for-tat strategy, then l2
would take it also. The payoff for every year could be defined as(u*
1cop, u*2cop). The present value of payoff after iterated games could
be presented as
When l2 deviates from the former cooperation, the first stage sup-ply decision must lead l2’s payoff as much as possible so that it isattractive enough to let him deviate (and if it happens at a certainstage t, the analysis is the same because the former t − 1 stages couldrationally be deleted). In other words, l2’s decision q*
2dev depends onhis former partner’s decision q*
1cop.
The following can be obtained:
This payoff result is higher than what he can get at the first stageu*
2cop. However, from the second stage, l1 would take strategy q*1cnt,
accordingly. Then l2 will compulsively take strategy q*2cnt as a
countermeasure; meanwhile the payoff would be u*2cnt, accordingly.
Therefore, when there are infinitely many iterated subgames, thepresent value of l2’s payoff would be as follows:
If Equation 19 and Equation 23 are compared, the infinite iteratedsubgames based on the Cournot model have actually changed to be theplayer’s decision selection between q*
icop and q*idev. As for l2, tit-for-tat
is the optimal strategy only when l2 obtains more payoff when takingthe tit-for-tat than when not taking it. Otherwise, l2 would like todeviate from the cooperation, that is, give up being a member of thelong-term strategic alliance.
That is,
The following is obtained:
Inequality 24 indicates that a player’s optimal decision depends onthe present value rate δ.
δ ≥−( )−( )
u u
u u2 2
2 2
24dev cop
dev cnt
* *
* *( )
uu u2
2 21 1cop
dev cnt
** *
−( ) ≥ +−
⎛⎝⎜
⎞⎠⎟δ
δδ
u u u un2 2
22 2 1dev cnt dev cnt
* * . . . * *+ + + +( ) = +−
δ δ δ δδδ
δ
⎛⎝⎜
⎞⎠⎟
→ < <n ∞; ( )0 1 23
ua bq c
b21 2
2
422dev
cop* ( )=− −( )
qa bq c
b21 2
221dev
cop* =− −( )
( )
max max
max
u a b Q q c q
bq
2 2 2 2
2
dev dev dev
d
= −( ) −[ ]= −
i
eev cop dev2
1 2 2 20+ − −( )⎡⎣ ⎤⎦a bq c q ( )
uu
nin i
copcop 0 < < 1* . . .*
, (11
2+ + + +( ) =−( ) →δ δ δ
δδ∞ 119)

66 Transportation Research Record 2066
If δ is too small to fit Inequality 24, the payoff in the future isnot important and attractive enough to affect the player’s decision.Players concentrate more on the present value instead of long-termpayoffs. Furthermore, the players are not afraid of the penalty fromother alliance members, which means that deviation from the allianceis the best response for l2 against the tit-for-tat from l1. In short, thetit-for-tat would not help the alliance’s stability if δ is too small.
On the contrary, if δ is significant enough to fit Condition 24, thepayoff in the future is attractive enough for the liner carrier. Obvi-ously, it is not an optimal decision to inflame his partner and to giveup the long-run cooperation while obtaining only the present short-run payoff. The closer δ approaches to 1, the more vital the futurepayoff is. As a result, two liner carriers would like to take coopera-tion as strategies for both as equilibrium. The subgame of the infi-nitely iterated game is still an infinitely iterated game, and then it iseasy to understand that both players take the tit-for-tat as an equilib-rium strategy to set up a perfect subgame Nash equilibrium route ofevery stage of the subgames. Consequently, a more efficient long-termalliance is established under this circumstance.
Penalty If Deviation Occurs
Concerning the former discussion of infinitely iterated games, whenδ fits Condition 24, the tit-for-tat presented in the last stage would behelpful to set up a relatively long-term stable alliance. However, thereal-world competition keeps changing constantly. When δ becomessmaller and does not fit Condition 24 any longer, what strategy couldliner l1 deploy so that the long-term cooperation with l2 would con-tinue? Then a much looser additional condition together with δ isneeded to ensure a subgame equilibrium with higher efficiency.
At the first stage, two players l1 and l2 provide (q*1cop, q*
2cop); at staget, if the transport service provided at stage t − 1 is (q*
1cop, q*2cop), then
continue the decision (q*1cop, q*
2cop) at the next stage. If the vessel sup-ply at stage t − 1 is (x1, x2), then provide (q*
1cop, q*2cop) at the next stage,
also. Otherwise, this means that the slot supply at stage t − 1 is dif-ferent from the two possibilities mentioned above, and then thosetwo players provide (x1, x2) at the coming stage.
The variable xi is called “penalty supply” here, and this strategy isnamed the “penalty of deviation.” The penalty supply xi would neverbe the supply decision q*
icnt based on the Cournot model. The penaltyshould be regarded as a way to prohibit other players from the devi-ation rather than as a permanent strategic equilibrium. If the penaltysupply itself is set as the static q*
icnt from the Cournot model, then itperforms more like a static equilibrium than what players originallyexpected.
In other words, a certain player makes this decision at the next stagewhen the other partner acts differently from the way the player acts.If the partner acts the same as the player, there should be no penalty.Therefore, this kind of penalty of deviation could be viewed as a“carrot-and-stick” strategy. The “carrot” is the positive attitude andcooperative action, and the “stick” is the penalty once deviation occurs.
If both players take the above-mentioned strategies, then they sup-ply capacity (q*
1cop, q*2cop) at every stage and obtain payoff (u*
1cop, u*2cop)
at the same time. After repeating the subgame infinitely, the presentvalue of payoff for li is
Next, the processes are explained in detail. If l1 has already chosenthis strategy, then the present value of payoffs for l2 is
u2cop*
1−( )δ
u1cop*
1−( )δ
when l2 chooses this strategy, too. However, if l2 deviates at the firststage with supply vessel q*
2dev, then certainly he wants to enlarge hispayoff u2dev as much as possible.
As supply,
is obtained, and as payoff,
is obtained. At the second stage l1 will supply capacity x1 as apenalty, then l2 has to supply capacity x2 as a countermeasure. Thereason this happens is not that (x1, x2) is a static Nash equilibrium(actually, it is not the Nash equilibrium); the reason is that l2 couldmake this decision only to avoid the next penalty from his partnerl1. Then one can obtain:
To make u2 maximum, one gets
From now on, the cooperation restarts and continues even ifdeviation occurs at some stage. Two liner companies supply vessel(q*
1cop, q*2cop) at every following stage. On the basis of that, whether
l2 chooses to deviate at the first stage or not depends on whether theprofit of deviating could cover the present value of the penalty hefaces at the second stage. That is, l2 will not deviate if
Together with Equation 27, one could get
And Inequality 28 points to the fact that whether the long-runalliance is to continue or not depends not only on δ, but also on theamount of penalty x1.
When δ is fixed, the smaller x1 is, the easier it is for player l2 to devi-ate. That means that the penalty is not strong enough to force l2 toalways stay with the cooperation approach. When δ is fixed, the morex1 is, the more loyal player l2 is. This means that the penalty is effectiveenough to keep l2 in cooperation, and an alliance is then established.
This paper has discussed only l2’s decision at the first stage until theestablishment of the long-term alliance. Actually, even if l2 deviates atany stage except the first one, the situation that the other player facesis exactly the same as in the discussion above. Because it is an infinitelyiterated game, the former stages could be ignored without affecting thefinal result, and the stage in which deviation occurs could be regardedas the “first-stage” rationality. Furthermore, the discussion for l2 is suit-able for l1, as well. An explanation has been given for why and how along-term alliance is established and survives. To make the wholeprocess more comprehensive, the flowchart shown in Figure 2 couldbe helpful in providing an understanding of the main idea and theprocess of this research. It is assumed that supply exceeds demand;meanwhile the demand is kept relatively static in the research period.
δ a bx c
bu
− −( )≤1 2
2
2428* ( )cop
δ i u u2 2dev cop≤ *
ua bx c
b21 2
2
427dev
* ( )=− −( )
xa bx c
b21 2
226=
− −( )( )
u a b x x x c x2 1 2 2 2 2 25= − +( )[ ] − i ( )
ua b q c
b21 2
2
4devcop* =
− −( )i
qa b q c
b21 2
2devcop* =
− −( )i

Objective function:
Variables q1, q2 (the objective function is a recessive function ofthese variables)
subject to
q q R1 2 31+ ≥ ( )
q q Q1 2 30+ ≤ cnt* ( )
q q1 2 0 29, ( )≤
max * * *cnt cop cntu u U U1 1= + − )(λ
Shi and Voss 67
Constraint 30 indicates that the total supply of the liners who coop-erate in alliances should not be more than the total supply if they
δa bx c
bu
− −( )≤1 2
2
2433cop
* ( )
δ ≥−( )−( )
u u
u u2 2
2 2
28dev cop
dev cnt
* *
* *( )
U U2cop 2cnt* * ( )≥ 24
U Ucop cnt* * ( )≥ 32
Analyze target liner markets
Supply falls short of demand Supply exceeds demand
Aim:
To provide higher-
quality service
Aim:
To decrease supply
acceleration and control
Analyze the potential partner or
coordinator l2
Negotiation based on common
knowledge of rationality
Vessel
capacity allocation
Short-term cooperation
Cooperate in
the next stage
“Carrot and stick” strategy
Discount factor
Long-term alliance based on binding agreement
Begins from l1
Y
N
Y
N
Using
Cooperative
Game
Theory
Slot
agreement
Adjust “stick” and push
the development trend
Using Non-
cooperative
Game Theory
FIGURE 2 Flowchart of short-term and long-term cooperation between liner carriers.

68 Transportation Research Record 2066
operate individually in the market. Otherwise, the cooperation makesno sense in regard to investment control and price increase.
Constraint 31 (where R = shipping demand or requirements) meansthat the total supply of liner carriers should satisfy the liner marketdemand. Constraint 32 points out that the profit of the cooperationshould at least be more attractive than that of the Cournot model. Con-straint 33 indicates that the profits of l2 should be greater than or equalto those of the Cournot model, so that l2 is going to cooperate.
Constraint 24 ensures that in iterated games l1 and l2 would taketit-for-tat, also. If all players choose to cooperate again and again,then long-term cooperation is expected to be accomplished. If δ doesnot meet Constraint 24, then use Constraint 28 to get x1.
Scenario Demonstration
For this scenario, the following assumptions are made:
First, one must calculate the supply q*1cnt and q*
2cnt and the payoff u*1cnt
and u*2cnt (shown in the upper part of the Volume A column of Table 1)
based on the static Cournot model. Then one refers to supply Q*cop
and payoff U*cop (shown in the lower part of Volume A column of
Table 1) based on the short-run cooperation.The Volume B column takes the dynamic point of view to mea-
sure the different power of l1 and l2 in the same market, which indi-cates who the leader is, with the other being the follower.
The power measurement ratio should be acceptable to both whenλ1: λ2 = 6,346 : 1,417, which followed the assumption mentionedpreviously and related to q*
1dym and q*2dym. On the basis of this mea-
γ = 3%
R = 4 200, TEU
c2 390= USD
TEU
c1 341= USD
TEU
b = 0 125.
a = 1537 5.
p Q= −1537 5 0 125. .
surement, the allocation of the additional profit (u*cop − u*
cnt) is rea-sonable and acceptable in their eyes. Consequently, the playersobtain extra utilities Δu1cop and Δu2cop, respectively.
As for l1,
As for l2,
Results fit Constraints 29 through 33, the short-run cooperationsetup.
Player l1 tries to set a tit-for-tat, then an analysis is done onwhether or not l2 will set up another tit-for-tat.
While
The result fits Constraint 24, which means that once l1 sets the tit-for-tat, the rational player l2 would like to keep it without any devi-ation in the market. The long-run alliance is built up. Without lossof generality, the discussion continues on the γ in Conclusion 3 afterConclusions 1 and 2 in the context of market uncertainty.
Once the market circumstance changes as if γ = 15%, then δ =1/(1 + γ) ≈ 0.87, which does not fit Constraint 24 any longer, playerl1 should set his penalty supply in the cooperation agreement to keepl2 in the alliance.
Then, the amount of penalty supply is obtained: x1 ≥ 2,740(TEU).Finally, the turbulence of the liner market should be taken into
account. The freight rate stability and the modeling performance(80, 81) should be related to the market environment, also. Thus, asensitivity analysis is given in Table 2. The table shows that when δfits Constraint 24, players will keep tit-for-tat as strategies and fol-low the perfect Nash equilibrium for subgames. Once δ does not fitConstraint 24, the smaller δ is, the smaller is the range of x1. In otherwords, as the effect of future profit decreases, the power of the penaltydecreases accordingly.
CONCLUSIONS AND FURTHER RESEARCH INTERESTS
In this paper, the motivations of taking part in liner alliances werediscussed. In addition the transformation of alliances was observed.
δ a bx c
bu
x
− −( )≤
− ≤ − −
1 2
2
2
1
4
805 1 537 5 0 125 3
cop*
, . . 990 805≤
δγ
=+( ) ≈ >1
10 97 0 89. .
Δu2 302 4131 417
6 346 1 41755 341 6cop = ×
+( ) ≈,,
, ,, .
Δu1 302 4136 346
6 346 1 417247 071 4cop = ×
+( ) ≈,,
, ,, .
TABLE 1 Individual and Collective Rationalities in Staticand Dynamic Games
Volume A (static) Volume B (dynamic)
q *1cnt 3,321 TEU q *
1dym 6,346 TEU
q *2cnt 2,929 TEU q *
2dym 1,417 TEU
Q *cnt 6,250 TEU Δu1cop
a 247,071.4 USD
p *cnt 756.25 USD/TEU Δu2cop 55,341.6 USD
u *1cnt 1,379,045.25 USD u *
1cop 1,626,116.7 USD
u *2cnt 1,072,746.25 USD u *
2cop 1,128,087.9 USD
U *cnt 2,451,791.5 USD q *
1cop 2,053 TEU
cavg 364 USD/TEU q *2cop 2,641 TEU
Q *cop 4,694 TEU q *
2dev 3,563.5 TEU
U *cop 2,754,204.5 USD u *
2dev 1,587,316.53 USD
p *cop 950 USD/TEU δ 0.97
aΔ = utility gotten by associated player.
TABLE 2 Sensitivity Analysis of �, x1, and �
Incremental Change on γ, δ and Its According Value Variable on x1 as Decision Output
γ <0.12 0.15 0.18 0.20 0.22
δ >0.89 0.87 0.847 0.833 0.82
x1 Not necessary >2,740 >2,651 >2,597 >2,545

Actually, it is a tit-for-tat strategy that controls the direction ofliner alliances. Once a leading player wants his partners to followhis advice and signal, what the leading player should do is adjustthe additional benefit that the other players would gain from thecooperation or adjust the penalty once deviation from other part-ners occurs. Thus, the way that these liners make cooperationcontracts could be regarded as the mechanism design among theliner shipping industry. Once practitioners in the liner shippingindustry take the advice from this research, better payoff andcooperation are expected to be achieved.
Future research interests are as follows: (a) The rates and number ofslots based on the slot chartering agreements by applying the Leontiefmodel might be possible once the negotiations between two cooperat-ing partners are regarded as sequential games. (b) Although the marketuncertainties are discussed in this paper by means of sensitivity analy-sis, further observation of market uncertainties can also be advanced bytaking into account the imperfect information and fake signals thatplayers occasionally issue. (c) Comparison of the similarity betweenairline alliances and liner shipping alliances would be helpful inadvancing this research on the liner shipping industry. The develop-ment that had already appeared in the airline industry (82, 83) and whatwas going to happen in it would be food for thought for researchers anddecision makers engaged in the liner shipping companies. In addition,the logistics services integration and the liners’ affiliated third-partylogistics service providers have been developing since the 1990s (84,85). The networks integration of affiliated third-party logistics serviceproviders and their performance need to be closely observed as well.
ACKNOWLEDGMENTS
The authors acknowledge the German Academic Exchange Serviceand the University of Hong Kong Small Project Funding for the finan-cial support that has allowed the development of this line of research.The interviews and technical communications with HamburgischeSchiffbau-Versuchsanstalt GmbH, Maersk & Sealand Corporation,and China Ocean Shipping Company are greatly appreciated as well.During the final phase of this paper, the first author benefited from theTransportNET program supported by Marie Curie Action under theEU 6th Framework as well as from discussions with Hilde Meersman,Eddy Van de Voorde, and Thierry Vanelslander. The authors alsothank the five reviewers for providing detailed and useful suggestions.
REFERENCES
1. Suykens, F., and E. Van de Voorde. A Quarter Century of Port Manage-ment in Europe: Objectives and Tools. Maritime Policy & Management,Vol. 25, No. 3, 1998, pp. 251 –261.
2. Heaver, T. D. Canada and the Evolving System of International ShippingConferences. In Canada and International Economic Regimes (M. Zacherand C. Cutler eds.), U.B.C. Press, Vancouver, British Columbia, Canada,1992, pp. 215–237.
3. Heaver, T. D. The Opportunities and Challenges for Shipping Lines inInternational Logistics. Paper presented at 1st World Logistics Conference,London, 1996.
4. Heaver, T. D. Vertical Integration in Liner Shipping: Strategy and Status.Proc., Canadian Transportation Research Forum, 2001, pp. 292–308.
5. Heaver, T. D., H. Meersman, and E. Van de Voorde. Co-operation andCompetition in International Container Transport: Strategies for Ports.Maritime Policy and Management, Vol. 28, No. 3, 2001, pp. 293–305.
6. Heaver, T. D., H. Meersman, F. Moglia, and E. Van de Voorde. Do Merg-ers and Alliances Influence European Shipping and Port Competition?Maritime Policy and Management, Vol. 27, 2000, pp. 363–373.
7. Meersman, H., F. Moglia, and E. Van de Voorde. Mergers and Alliancesin Liner Shipping. What Do European Port Authorities Have to Fear?
Liner Shipping: What’s Next? Proc., International Association of Mar-itime Economists Annual Conference (M. R. Brooks, ed.), Halifax,Nova Scotia, Canada, 1999, pp. 204–220.
8. Molenaar, H. J., and E. Van de Voorde. Competition Policy in Liner Ship-ping. Proc., International Association of Maritime Economists AnnualConference, Antwerp, Belgium, 1994.
9. Slack, B., C. Comtois, and G. Sletmo. Shipping Lines as Agents ofChange in the Port Industry. Maritime Policy and Management, Vol. 23,No. 3, 1996, pp. 289–300.
10. Hoffmann, W. H. How to Manage a Portfolio of Alliances. Long RangePlanning, Vol. 38, 2005, pp. 121–143.
11. Spekman, E., L. A. Isabella, and T. C. MacAvoy. Alliance Competence:Maximizing the Value of Your Partnerships. John Wiley & Sons, Inc.,New York, 2000.
12. Fagerholt, K. Designing Optimal Routes in a Liner Shipping Problem.Maritime Policy and Management, Vol. 31, 2004, pp. 259–268.
13. Gilman, S. The Size Economies and Network Efficiency of Large Con-tainerships. International Journal of Maritime Economics, Vol. 1, 1999,pp. 5–18.
14. Lim, S-M. Economies of Scale in Container Shipping. Maritime Policyand Management, Vol. 25, 1998, pp. 361–373.
15. Notteboom, T. A Carrier’s Perspective on Container Network Configu-ration at Sea and on Land. Journal of International Logistics and Trade,Vol. 1, 2004, pp. 65–87.
16. Haralambides, H. E., C. Cheung, and S. Tsolakis. The Future of the Huband Spokes System in Liner Shipping. World Conference on TransportResearch (WCTR), Pre-WCTR Workshop, Genoa, Italy, 2000.
17. Mowery, D. C., J. E. Oxley, and B. S. Silverman. Strategic Alliances andInterfirm Knowledge Transfer. Strategic Management Journal, Vol. 17,Special Issue: Knowledge and the Firm, 1996, pp. 77–91.
18. Brooks, M. R. Determinants of Shipper’s Choice of Container Carriers:A Study of Eastern Canadian Exporters. PhD diss. Department of Mar-itime Studies and International Transport, University of Wales, Collegeof Cardiff, United Kingdom, 1983.
19. Brooks, M. R. International Competitiveness—Assessing and Explor-ing Competitive Advantage by Ocean Container Carriers. Logistics andTransportation Review, Vol. 29, No. 3, 1993, pp. 275–293.
20. Brooks, M. R., R. G. Blundel, and C. I. Bidgood. Strategic Alliances inthe Global Container Transport Industry. In Multinational StrategicAlliances (R. Refick, ed.), International Business Press, London, 1993.
21. Brooks, M. R. Sea Changes in Liner Shipping. Elsevier Science,Oxford, United Kingdom, 2000.
22. Baird, A. J., and A. J. Lindsay. Strategic Choice in the Global ContainerShipping Industry: A Resource-Based Approach. Proc., InternationalAssociation of Maritime Economists Annual Conference, Vancouver,British Columbia, Canada, 1996.
23. Notteboom, T. The Time Factor in Liner Shipping Services. MaritimeEconomics and Logistics, Vol. 8, 2006, pp. 19–39.
24. Dodgson, M. The Strategic Management of R&D Collaboration.Technology Analysis and Strategic Management, Vol. 4, No. 3, 1992,pp. 227–244.
25. Cullinane, K. P. B., M. Khanna, and D.-W. Song. How Big Is Beauti-ful: Economies of Scale and the Optimal Size of Containership. Proc.,International Association of Maritime Economists Annual Conference,Halifax, Nova Scotia, Canada, 1999, pp. 108–140.
26. Song, D. W., and M. Panayides. A Conceptual Application of Coopera-tive Game Theory to Liner Shipping Strategic Alliances. Maritime Policyand Management, Vol. 29, No. 3, 2002, pp. 285–301.
27. Yoshida, S., J. H. Yang, and K. H. Kim. The Network Economy of theAlliance in Liner Shipping. Proc., International Association of MaritimeEconomics Conference, Naples, Italy, 2001, pp. 333–343.
28. Branch, A. E. Economics of Shipping Practice and Management.Chapman and Hall, London and New York, 1982.
29. Brooks, M. R., R. G. Blunder, and C. I. Bidgood. Strategic Alliances in theGlobal Container Transport Industry. In Multinational Strategic Alliances(R. Culpan, ed.), 1993, pp. 221–250.
30. Araujo de Souza, G., Jr., A. Beresford, and S. Pettit. Liner Shipping Com-panies and Terminal Operators: Internationalisation or Globalisation?Maritime Economics and Logistics, Vol. 5, 2003, pp. 393–412.
31. Heaver, T. The Evolving Roles of Shipping Lines in InternationalLogistics. International Journal of Maritime Economics, Vol. 4, 2002,pp. 210–230.
32. Heaver, T. Supply Chain and Logistics Management: Implications forLiner Shipping. In The Handbook of Maritime Economics and Business(C. T. Grammenos, ed.), 2002.
Shi and Voss 69
70 Transportation Research Record 2066
33. Heaney, S. Top 20 Container Shipping Lines in the World. AmericanShipper, Vol. 44, No. 10, 2002, pp. 33–36.
34. Midoro, R., and A. Pitto. A Critical Evaluation of Strategic Alliancesin Liner Shipping. Maritime Policy and Management, Vol. 27, 2000,pp. 31–40.
35. Lorange, P. Strategic Re-thinking in Shipping Companies. MaritimePolicy and Management, Vol. 28, No. 1, 2001, pp. 23–32.
36. Clarke, R. L. An Analysis of the International Ocean Shipping ConferenceSystem. Transportation Journal, Vol. 38, 1997, pp. 17–29.
37. Shi, X. and S. Voß. Container Terminal Operations Under the Influenceof Shipping Alliances. In Risk Management in Port Operations, Logis-tics and Supply Chain Security (K. Bichou, M. G. H. Bell, and A. Evans,eds.), Informa, London, 2007, pp. 135–164.
38. Evangelista, P., and A. Morvillo. Alliances in Liner Shipping: AnInstrument to Gain Operational Efficiency or Supply Chain Integration?International Journal of Logistics: Research and Applications, Vol. 2,No. 1, 1999, pp. 21–38.
39. Brooks, M. R. Sea Change in Liner Shipping: Regulation and ManagerialDecision-Making in a Global Industry. Pergamon, Oxford, England, 2000.
40. Slack, B., C. Comtois, and R. J. McCalla. Strategic Alliances in the Con-tainer Shipping Industry: A Global Perspective. Maritime Policy andManagement, Vol. 29, 2002, pp. 65–75.
41. Fusillo, M. Excess Capacity and Entry Deterrence: The Case of OceanLiner Shipping Markets. Maritime Economics and Logistics, Vol. 5,2003, pp. 100–115.
42. Kleymann, B., and H. Seristo. Levels of Airline Alliance Membership:Balancing Risks and Benefits. Journal of Air Transport Management,Vol. 7, 2001, pp. 303–310.
43. Announcement of Maersk and P&O Nedlloyd. events.simplywebcast.com/maersk/may_2005/index.html. Accessed May 12, 2006.
44. Brent, J. TUI Wins Over CP Ships for $2 billion. 2005. www.theglobeandmail.com/servlet/Page/document/v4/sub/MarketingPage?user_URL=http://www.theglobeandmail.com%2Fservlet%2Fstory%2FRTGAM.20050821.wcpcpc0821%2FBNStory%2FBusiness%2F%29&ord=1125892481700&brand=theglobeandmail&force_login=true. Accessed Aug. 22, 2006.
45. Nohria, N., and C. Garcia-Pont. Global Strategic Linkages and IndustryStructure. Strategic Management Journal, Vol. 12, 1991, pp. 105–124.
46. Bittlingmayer, G. Did Antitrust Policy Cause the Great Merger Wave?Journal of Law and Economics, Vol. 73, 1985, pp. 77–118.
47. Clyde, P. S., and J. D. Reitzes. The Effectiveness of Collusion UnderAntitrust Immunity, The Case of Liner Shipping Conferences. FederalTrade Commission, Dec. 1995, p. 56.
48. Gardner, B., P. Marlow, and R. Nair. The Economic Regulation of LinerShipping: The Impact of US and EU Regulation in US Trades. In TheHandbook of Maritime Economics and Business (C. T. Grammenos, ed.),2002.
49. Graham, M. G. Stability and Competition in Intermodal Container Ship-ping: Finding a Balance. Maritime Policy and Management, Vol. 25,1998, pp. 129–147.
50. Rimmer, P. J. Transport and Communications in the Pacific EconomicZone During the Early 21st Century. In Pacific Asia in the 21st Century:Geographical and Developmental Perspectives (Y.-M. Yeung, ed.),Chinese University Press, Hong Kong, 1993.
51. Rimmer, P. J. Shipping Patterns in the Western Pacific: The China Factor.Maritime Studies, Vol. 94, 1997, pp. 1–27.
52. Rimmer, P. J. Impact of Global Strategic Alliances on Pacific RimSeaports. Maritime Studies, Vol. 98, 1998, pp. 1–29.
53. Rimmer, P. J. Ocean Liner Shipping Services: Corporate Restructuringand Port Selection/Competition. Asia Pacific Viewpoint, Vol. 39, No. 2,1998, pp. 193–208.
54. Bendall, H., and A. Stent. Longhaul Feeder Services in an Era of Chang-ing Technology: An Asia–Pacific Perspective. Maritime Policy andManagement, Vol. 26, 1999, pp. 145–159.
55. Fox, N. An Oligopoly Model of Ocean Liner Shipping. Review ofIndustrial Organization, Vol. 9, No. 4, 1994, pp. 343–357.
56. Gilbert, R. J., and X. Vives. Entry Deterrence and the Free Rider Problem.Review of Economic Studies, Vol. 53, 1986, pp. 71–83.
57. Nash, J. F. Equilibrium Points in n-Person Games. Princeton University,Princeton, N.J., 1949.
58. Tsang, W. K. Motives for Strategic Alliances: A Resource-BasedPerspective. Journal of Management, Vol. 14, No. 3, 1998, pp. 207–221.
59. Ding, J.-F., G.-S. Liang, C.-H. Yeh, and Y.-C. Yeh. A Fuzzy Multi-Criteria Decision-Making Model for the Selection of Courier Service
Providers: An Empirical Study from Shippers’ Perspective in Taiwan.Maritime Economics and Logistics, Vol. 7, 2005, pp. 250–261.
60. Ding, J.-F., and G.-S. Liang. Using Fuzzy MCDM to Select Partners ofStrategic Alliances for Liner Shipping. Information Sciences, Vol. 173,2005, pp. 197–225.
61. Geringer, J. M. Strategic Determinants of Partner Selection Criteria inInternational Joint Ventures. Journal of International Business Studies,Vol. 22, No. 1, 1991, pp. 41–62.
62. Tang, S. M., and S.-J. Lin. Creating and Verify the Correlation Model ofStrategy Alliance Management and Performance. Journal of Managementand Systems, Vol. 8, No. 1, 2001, pp. 37–60.
63. Kleymann, B., and H. Seristo. Levels of Airline Alliance Membership:Balancing Risks and Benefits. Journal of Air Transport Management,Vol. 7, No. 5, 2001, pp. 303–310.
64. Klopack, T. G. Strategic Outsourcing: Balancing the Risks and theBenefits. Drug Discovery Today, Vol. 5, No. 4, 2000, pp. 157–160.
65. Tijs, S. H., and T. S. H. Driessen. Game Theory and Cost AllocationProblems. Management Science, Vol. 32, No. 8, 1986, pp. 1015–1028.
66. Shapley, L. S. A Value of n-Person Games. Annals of MathematicsStudies, Vol. 28, 1953, pp. 307–317.
67. Shapley, L. S. Cores of Convex Games. International Journal of GameTheory, Vol. 1, 1971, pp. 11–26.
68. Skorin-Kapov, D. On the Core of the Minimum Cost Steiner Tree Gamein Networks. Annals of Operations Research, Vol. 57, 1995, pp. 233–249.
69. Skorin-Kapov, D. On Cost Allocation in Steiner Tree Networks. In SteinerTrees in Industries (D.-Z. Du and X. Cheng, eds.), Kluwer, Boston, Mass.,2001.
70. Sjostrom, W. Collusion in Ocean Shipping: A Test of Monopoly andEmpty Core Models. Journal of Political Economy, Vol. 97, No. 5, 1989,pp. 1160–1179.
71. Pirrong, S. An Application of Core Theory to the Analysis of OceanShipping Markets. Journal of Law and Economics, Vol. 35, 1992, pp. 89–131.
72. Waldman, M. Non-cooperative Entry Deterrence, Uncertainty and theFree Rider Problem. Journal of Economic Studies, Vol. LIV, 1987,pp. 301–310.
73. Das, T. K., and B.-S. Teng. Between Trust and Control: DevelopingConfidence in Partner Cooperation in Alliances. Academy of ManagementReview, Vol. 23, No. 3, 1998, pp. 491–512.
74. Harrigan, K. R. Strategic Alliances and Partner Asymmetries. In Cooper-ative Strategies in International Business (F. Contractor and P. Lorange,eds.), Lexington Books, Lexington, Mass., 1988, pp. 205–226.
75. Ryoo, D. K., and H. A. Thanopoulou. Liner Alliances in the Globaliza-tion Era: A Strategic Tool for Asian Container Carriers. Maritime Policyand Management, Vol. 26, No. 4, 1999, pp. 349–367.
76. Leach, P. T. Shipping Service Slips. Traffic World, May 2005, p. 1.77. McConville, J. Running Rings Around the Liner Industry. Maritime
Policy and Management, Vol. 31, No. 1, 2004, pp. 1–2.78. Gibbons, R. Game Theory for Applied Economics. Princeton University
Press, Princeton, N.J., 1992.79. Fusillo, M. Is Liner Shipping Supply Fixed? Maritime Economics and
Logistics, Vol. 5, 2004, pp. 220–235.80. Haralambides, H. E. Determinants of Price and Price Stability in Liner
Shipping. Workshop on the Industrial Organization of Shipping andPorts, National University of Singapore, Singapore, 2004.
81. Haralambides, H. E., and A. W. Veenstra. Modelling Performance inLiner Shipping. In Handbook of Transport Modelling (K. J. Button andD. A. Hensher, eds.), Pergamon-Elsevier Science, New York, 2000.
82. Knorr, A., and A. Arndt. Alliance Strategy and the Fall of Swissair:A Comment. Journal of Air Transport Management, Vol. 10, 2004,pp. 119–123.
83. Morrish, S. C., and R. T. Hamilton. Airline Alliances—Who Benefits?Journal of Air Transport Management, Vol. 8, 2002, pp. 401–407.
84. Evangelista, P., and A. Morvillo. Logistical Integration and CooperativeStrategies in Liner Shipping: Some Empirical Evidence. InternationalJournal of Maritime Economics, Vol. 2, No. 1, 2000, pp. 1–16.
85. Heaver, T. Restructuring Carriers to Logistics Suppliers: The Challengefor International Liner Shipping. Canadian Transportation ResearchForum, Victoria, Canada, 1994.
The International Trade and Transportation Committee sponsored publication ofthis paper.

THE WIN-WIN GAME IN SLOT-CHARTERING AGREEMENT AMONG THE
LINER COMPETITORS AND COLLABORATORS
Xiaoning SHI
Department of Transportation and Regional Economics, University of Antwerp, Belgium
E-mail: [email protected]
S.B.418, Prinsstraat 13, Antwerp, Belgium
Tel: +32-(0)3-220-4914
Fax: +32-(0)3-220-4395
Institute of Information Systems, University of Hamburg, Germany
E-mail: [email protected]
Hilde MEERSMAN
Department of Transportation and Regional Economics, University of Antwerp, Belgium
E-mail: [email protected]
S.B.423, Prinsstraat 13, Antwerp, Belgium
Tel: +32-(0)3-220-4119
Fax: +32-(0)3-220-4395
Stefan VOSS
Institute of Information Systems, University of Hamburg, Germany
E-mail: [email protected]
Von-Melle-Park 5, D-20146, Hamburg, Germany
Tel: +49-(0)40-42838-3064
Fax: +49-(0)40-42838-5535

THE WIN-WIN GAME IN SLOT-CHARTERING AGREEMENT AMONG THE LINER
COMPETITORS AND COLLABORATORS
3. April
2008
In Proceedings of Annual Conference of International Association of Maritime Economists
ABSTRACT
Besides the liner alliances as one of the means to cooperate in the liner industry, vessel-
sharing and slot-chartering agreements are also very common among the liner
collaborators even if they are competitors at the same time. In this paper, we focus on
slot-chartering agreements. The co-existing competition and collaboration make the
negotiation of slot-chartering agreements quite tough. The liner carriers who are involved
in the slot-chartering agreements are regarded as the players in this paper and the pay-off
of the games should be win-win games rather than zero-sum games. Otherwise, such slot-
chartering agreements may not be attractive enough to keep their either short-term or
long-term cooperation.
Thus, the main idea of this research is to explain the negotiation stages as well as to
design an efficient mechanism to balance the slot requirements and the equilibrium prices
under different circumstances. Furthermore, the negotiation and pricing model is to be
applied and demonstrated. The output of this paper is of interest to decision makers
working in the liner shipping companies as well as in some other business domains.
Keywords: liner shipping, game, price, slot-chartering, negotiation

THE WIN-WIN GAME IN SLOT-CHARTERING AGREEMENT AMONG THE LINER
COMPETITORS AND COLLABORATORS
3. April
2008
In Proceedings of Annual Conference of International Association of Maritime Economists
THE WIN-WIN GAME IN SLOT-CHARTERING AGREEMENT AMONG THE
LINER COMPETITORS AND COLLABORATORS
1. INTRODUCTION
Since the decline of the liner conferences there were three reshuffles of the liner shipping
strategic alliances re-integrations, which had been observed by many researchers (Brooks
1993 2000; Clark 1997; Fusillo 2003 2004; Heaver et al. 2000 2001; Hoffmann 2005; Shi
and Voß 2007a; Slack et al. 2002). However, recently even the ‘outsiders’ of the liner
shipping strategic alliances announced their vessel-sharing or slot-chartering agreement in
order to develop more reliable service networks to their customers. For instance, the
Maersk Line rebuilt the Asia-Europe route by cooperating with Evergreen Marine Corp.;
meanwhile, NYK phased out its vessels from associated services.
The aforementioned turbulences within the liner shipping industry reflect the following
facts: the liner shipping service could reach economies of scale (Lim 1998; Lorange
2001) by means of deploying mega container ships (Cullinane et al. 1999) as well as
reach economies of scope by means of integrating sophisticated networks (Baird and
Lindsay 1996; Akio et al. 2006). In addition, it could also reach economies of fitness, as
the main task of this paper, by means of vessel-sharing, slot-exchanging and slot-
chartering agreements.
Thus vessel-sharing, slot-exchanging and slot-chartering problems are of great
importance to the liner carriers as well as of great interest to the researchers. The main
difference between vessel-sharing, slot-exchanging and slot-chartering is that vessel-
sharing focuses more on network integration (Evangelista and Morvillo 2000; Shi and
Voß 2007b) and fleet deployment, and slot-exchanging focuses more on routes
implementation, and slot-chartering more on price-and-quantity decisions. The price of
the vessel-sharing and/or slot-exchanging business is represented by exchanging slots in
partners’ vessels or other service routes. In other words, either the price of the slots or the
cost of bunker are not paid in monetary means. And the slots allocation of each liner
carrier on the associated vessels is simply assigned according to the ratio of their
deployed vessels for the associated services, as shown in Table 1.
Party Allocation on liner A operated
vessels
Allocation on liner B operated
vessels
1 Liner A who operates a capacities Associated vessel’s capacity x
a/(a+b)
Associated vessel’s capacity x
a/(a+b)
2 Liner B who operates b capacities Associated vessel’s capacity x
b/(a+b)
Associated vessel’s capacity x
b/(a+b)
Table 1: The slot allocation mechanism in vessel-sharing agreements
For reefer containers the allocations follow the same rule. Considering the fact that the
top layer of a container ship usually consists of empty containers without jeopardizing
stability and compatibility of the vessel, the approximated total weight limitation of all
these mentioned slots stands at approximate 10 times the quantities of them even if the
full load TEU might be loaded at 14 tons.

THE WIN-WIN GAME IN SLOT-CHARTERING AGREEMENT AMONG THE LINER
COMPETITORS AND COLLABORATORS
3. April
2008
In Proceedings of Annual Conference of International Association of Maritime Economists
However, in most cases of the slot-chartering business, the charterer could not take the
advantage of ‘exchanging’ without monetary payment due to the fact that the charterer
does not deploy any vessel for the associated service. Within the framework of
operational exchanges, vessel-sharing agreements skip negotiation of either price or
quantity. However, things are different for the slot-chartering agreements. The charterer
and the owner of the vessels need to negotiate on both price and quantity. Furthermore, at
different levels of the prices, the charterer decides to accept different quantities that he
would like to charter, on the other hand, the owner also decides to offer different
quantities, respectively. Thus, there exist tough price-and-quantity negotiations with
respect to iterated non-cooperative games, which is the main topic of this paper.
2. PROBLEM DESCRIPTION
2.1 Definitions
From the perspective of the shipping business there are slightly different definitions
applied in vessel-sharing, vessel-exchanging or slot-chartering agreements. We discuss
them and then define what we apply in the rest part of this paper.
Vessel Provider: The party providing the vessels and/or space, who may be the registered
owner or a disposing owner. Vessel provider is usually applied in the vessel sharing
business.
Slot owner: The operating liner which provides and maintains vessels (which contain the
slots to be chartered) within the terms of the agreement; regardless of whether the vessels
are owned or chartered for other parties regarding other contracts.
Slot charterer: The liner which purchases and utilizes the agreed number of slots as
specified in the agreement. Slot owner and slot charterer are usually applied in the
agreements related to slots, i.e., slot-exchanging agreement and slot-chartering
agreements.
Slot: The space on board a ship occupied by one 20’x8’x8’6 ISO container or the
equipment weight of 10 GWT/TEU (Gross Weight Tonnage including tare
weight/Twenty Feet Equivalent Unit), whichever is reached first, transported on the
routes as defined in the associated agreements. Usually, according the real world
business, a slot is prefixed with the direction that it is supposed to be shipped, e.g., prefix
EB denotes east bound and prefix WB denotes west bound. However, it should be noted
that different liners might apply prefix and abbreviations differently.
Comparing the definitions of vessel provider and slot owner, in the remainder of this
paper we assume the slot owner to denote the party of an agreement who provides slots,
and assume the slot charterer to denote the party of an agreement who charters slots. In a
simple way, owner and charterer in this paper mean the slot owner and the slot charterer,
respectively.
In case that the slot owner fails to provide slots as agreed, e.g., clashing of sailing and
force majeure, slot spaces compensation in later voyages or other means of compensation
shall be discussed and agreed in good faith. However, in this paper we ignore such risk
management problems to avoid redundancy.

THE WIN-WIN GAME IN SLOT-CHARTERING AGREEMENT AMONG THE LINER
COMPETITORS AND COLLABORATORS
3. April
2008
In Proceedings of Annual Conference of International Association of Maritime Economists
From the perspective of methodology there is a variety of academic papers discussing
business negotiations and behaviors in terms of game theory by applying slightly different
definitions. In order to make our paper authentic and uniform, we briefly discuss some
similar definitions as follows.
In most of the classical references which introduce fundamental game theory or advanced
proofs (Gibbons 1992; Nash 1949; Phlips 1995; Shapley 1953 1971; Von Neumann and
Morgenstern 1944), a player is applied to represent the individual person or group who is
involved in the decision making process, especially the individual rationality conflicts
with collective rationality. As time goes by, both theory itself and applications develop
some other concepts to be used, e.g., agent, party, decision making unit (DMU), etc. For
instance, in Gomes and Lins (2007) DMU is applied. They assume that each DMU would
search at the same time for the sake of maximizing its efficiency either by means of
competition or by means of cooperation. In addition, it deserves special consideration
when an agent is applied to represent players involved in games, together with principal-
agent mechanism and multi-agent based calculation that the appropriate comprehension
of the definition is really necessary. In the remainder of this paper, agents are applied to
denote the liners who are involved in the slot-chartering agreements.
2.2 Main Issues arising from the Liner Market
2.2.1 Evolution of Liners Cooperations
To avoid redundancy, here we only demonstrate the comparison of the top 20 liners listed
in January 2007 in terms of operating capacities; see Table 2. For the historic ranking of
the liners and the alliances, interested readers might refer to (Brooks 2000; Meersman et
al. 1999; Shi and Voß 2007a) as well as most updated rankings via www.alphaliner.com.
Liner
Jan 2000 Jan 2007 Capacity Growth
Rank Share Rank Share Total Per year
A.P. Möller-Maersk 1 12.0 % 1 16.8 % 184 % 16.1 %
MSC 5 4.4 % 2 9.8 % 357 % 24.2 %
CMA CGM Group 12 2.4 % 3 6.5 % 458 % 27.8 %
Evergreen Group 2 6.2 % 4 5.2 % 73 % 8.1 %
Hapag-Lloyd 14 2.0 % 5 4.4 % 346 % 23.8 %
CSCL 18 1.7 % 6 3.8 % 363 % 24.5 %
COSCO Container L. 7 3.9 % 7 3.7 % 95 % 10.0 %
Hanjin/ Senator 4 4.8 % 8 3.3 % 42 % 5.2 %
APL 6 4.0 % 9 3.2 % 63 % 7.2 %
NYK 8 3.2 % 10 3.1 % 98 % 10.3 %
MOL 10 2.6 % 11 2.7 % 107 % 11.0 %
OOCL 16 2.0 % 12 2.7 % 178 % 15.7 %
K Line 13 2.2 % 13 2.6 % 144 % 13.6 %
CSAV Group 20 1.4 % 14 2.4 % 259 % 20.0 %
Zim 11 2.6 % 15 2.3 % 82 % 9.0 %
Yang Ming Line 17 1.8 % 16 2.3 % 157 % 14.5 %

THE WIN-WIN GAME IN SLOT-CHARTERING AGREEMENT AMONG THE LINER
COMPETITORS AND COLLABORATORS
3. April
2008
In Proceedings of Annual Conference of International Association of Maritime Economists
Hamburg-Süd Group 21 1.3 % 17 2.0 % 201 % 17.0 %
Hyundai Merchant
Marine 15 2.0 % 18 1.6 % 61 % 7.0 %
PIL (Pacific Int’l Line) 24 1.2 % 19 1.4 % 140 % 13.4 %
Wan Hai Lines 22 1.2 % 20 1.1 % 81 % 8.8 %
Table 2: The capacity competition among the top-20 liner carriers
Source: AXS-Alphaliner: Liner Shipping Report
Based on those data, among all kinds of vessels in fleets, the VLCS (Very Large
Container Ship) is the key market that represents the corporations’ ship financing
capabilities. The three leading liners, i.e., Maersk Line, MSC and CMA CGM, control
40% of all the VLCS (both existing and on order). However, the competition in the VLCS
market also results into overcapacity problems as well as the problem of unreasonable
pricing, which might either reduce the level of collective rationality of the supply side or
let the demand side bear too much unreasonable cost.
2.2.2 Overcapacity
It is well known, as reported by Alphaliner (www.alphaliner.com), that some carriers
prefer to luring competition observers in terms of under valuating the capacity of ships
deployed, which might be because this liner does not want to terrify the competitors
especially when the ships are to be launched for a new service. A good example is
EMMA Maersk with 11,000 TEU as announced capacity. However, once the fully
designed capacity of it is to be utilized, the capacity might reach 15,000 TEU with four-
tier on deck containers. To make things even worse, there are eight EMMA class vessels
booked and to be delivered in 2008 for the Asia-Europe route. Falling under this case, the
overcapacity of some trade routes might, to great extent, be expected. Furthermore, the
order book has since risen rapidly to reach 60% of current capacity. The pace of ordering
continues and is causing some concern over the possibility of future overcapacity in the
East/West trades (Drewry 2007). Liu (2007) demonstrates the selection of feasible
container services under the circumstance of employing mega containerships. For a
summary on vessels size evolution and its impact, i.e., deploying Post-Panamax, Super-
Panamax and Supra-Panamax, we refer to Shi and Voß (2007c).
2.2.3 Asymmetric Information
Concerning the information sharing among the slot-chartering agreement parties, it is not
surprising that the information is asymmetric. That is, the owner of the slots gets better
access to the information of the costs of slots while the charterer gets less relevant
information about it. The effective transparency of the information sharing among
owners and charterers might improve the efficiency of the whole agreements. However,
with regard to the published vessel-sharing, slot-exchanging and slot-chartering
agreements, e.g., published on the FMC (Federal Maritime Commission) website, the
amount and price of the slots are by no means transparent since they are regarded and
protected as business.
2.2.4 Pricing
Taking into account three main routes, i.e., Far East to Europe, transatlantic and
transpacific, lots of changes have happened considering the trade flows, cargo/value

THE WIN-WIN GAME IN SLOT-CHARTERING AGREEMENT AMONG THE LINER
COMPETITORS AND COLLABORATORS
3. April
2008
In Proceedings of Annual Conference of International Association of Maritime Economists
structure under influence of globalization. For instance, the supply-demand balance will
weaken in the long-term with a large number of 10,000 and 12,000 TEU due to being
deployed in the East-West trades in 2010-2012, demand growth will be unable to keep
pace. Then a question derives from the aforementioned fact ‘big is beautiful but at what
cost?’ The ship operation costs continue to rise and are of major concern. Once the liner
carriers decide to start their cooperation by applying slot-chartering agreements as the
first step, the pricing mechanism on chartered slots is vital, which is the main task of this
paper.
2.3 Advantages and Disadvantages
2.3.1 Advantages
The liners desire to cooperate with each other in containerized trade to obtain optimum
efficiency of fleet operation and to maximize slot utilization through slot allocation; so as
to offer improved services to the shipping public. Such business optimizes capacity
utilization in terms of balancing the freight flows if cooperate with partners who could
occupy the inbound empty containers.
The involved liners of the slot-chartering agreement, i.e., the owner and the charterer,
still retains its separate identity and shall have separate sales, pricing, and marketing
functions. And each liner issues its own B/L (Bill of Lading).
From the viewpoint of cost savings, either the owner or the charterer could take advantage
of the slot-chartering agreement.
Being the owner, he shall pay all wages, insurance premiums, charges, dues, taxes,
agencies, commissions, fees and all other expenses whatsoever incurred in connection
with the operation of the running vessels.
Being the charterer, things seem to be much simpler. The charterer only needs to pay the
price that the owner requires and regards that as the unit cost of the charterer.
Theoretically, such unit cost might be higher than if the charterer operates the vessels by
himself. However, by means of slot-chartering, it is much easier for the charterer to focus
on his marketing issues as well as customer relationship management without paying too
much detailed efforts on operating the vessels by himself, not even to say the transferred
risks to the owner in case of bad weather, force majeure and/or market decline, etc.
Furthermore, the slot-chartering business could also function as the trials of long-term
cooperations among these involved liners, especially when some liner is attempting to
amplify some sub-network. For instance, CMA CGM consolidated its 3rd
rank with a fleet
grew by 5.7%. Besides taking many unwanted ships by others, it also developed a
relatively stable slot-chartering business step by step with CSCL and Zim, as summarized
in Table 2.
2.3.2 Disadvantages
For the owner slot-chartering agreements lose, to some extent, the chance to get higher
freight rates per TEU facing the flexible liner market environment (Haralambides 2004).
Moreover, the performance of cooperation compared to individual operations has been
tested by Haralambides and Veenstra (2000).

THE WIN-WIN GAME IN SLOT-CHARTERING AGREEMENT AMONG THE LINER
COMPETITORS AND COLLABORATORS
3. April
2008
In Proceedings of Annual Conference of International Association of Maritime Economists
In addition, the asymmetric information sharing situation (Harrigan 1988) between slot-
chartering parties might result in problems on the operation control and trust development
within the further agreements (Das and Teng 1998).
Furthermore, the slots as resources of the liner carriers (Tsang 1998), once chartered by
other competitors according the charter agreements, might negatively affect the ship
scheduling (Ting and Tzeng 2003) and schedule reliabilities (Vernimmen et al. 2007) due
to the uncertainties from the charterers’ sides. In case of delays, the supposed total
turnaround time (Notteboom 2006) together with the seamless linkages with ports would
not be sustained.

THE WIN-WIN GAME IN SLOT-CHARTERING AGREEMENT AMONG THE LINER
COMPETITORS AND COLLABORATORS
3. April
2008
In Proceedings of Annual Conference of International Association of Maritime Economists
2.4 Different Levels of Cooperation
In our research, we divide different kinds of cooperation among the liners on three levels.
The first level is slot-chartering in some routes, the second level is slot-exchanging in
different routes, and the third level is common vessel deployment or, in other words,
vessel-sharing. For the first level of cooperation, the charterer needs to pay the monetary
instruments to the owners, as mentioned before. For the latter two levels of cooperation,
the involved liners might either exchange the slots or deploy vessels instead of paying in
terms of monetary instruments, which seems to be more convenient together with higher
risk of mistrust. Usually, the first level of cooperation could be rated as the temptation of
the latter two levels of cooperation, say, the long-term strategic alliances. Whether one
liner starts with first level or skips it directly to the latter two levels, is depending on his
willingness together with his investment capability. Table 3 provides a summary of
current service cooperation among the liners, where we allocate them into three different
levels and focus more on the first level, i.e., slot-chartering, in this paper.
Trade
Flows
Levels of Cooperation
1. Slot-chartering 2. Slot-
exchanging
3. Vessel-
sharing
Transpacific ANL from CMA CGM on PRX (as USW1)
ANL on CSCL/CMA CGM AAC2/Yang Tse (as USW2)
Safmarine on Maersk Line loops
Zim on CSCL AAC2 and ANW
HMM on Evergreen NUE
UASC on Hanjin AWH (as AWH) and K Line AWK (as
AWS)
CSCL on CMA CGM PEX3 (as AAE4)
Emirates on Zim/Evergreen AUX
Maersk on Evergreen NUE
Evergreen on Maersk TP8
Evergreen from the New World Alliance on ESX and
SZX loops
CSCL and Zim
(AAS/ZCS)
See Shi and
Voß (2007a
2007b) for a
detailed
categorization
of common
vessel sharing
and strategic
alliances
evolutions.
Europe-Far East ANL from CMA CGM on FAL1, FAL2 and FAL3
Zim on CSCL AEX1
UASC on COSCO SCX
APL on CMA CGM FAL1 (as CFX) and FAL3 (as NCE)
CMA CGM from APL on the New World Alliance JEX,
SCX and AEX (as KEX)
Yangming on TNWA AEX (as KEX)
Grand Alliance lines on New World Alliance AEX, CEX
and SCX
APL on Grand Alliance EU2 and EU3
HMM on Grand Alliance EU3/EU4 (as LP3/LP4) and
CMA CGM FAL3 (as FA3)
MOL on Grand Alliance EU4 (as LP4) and CMA CGM
FAL3 (as NCE)
CSCL and CMA
CGM
(AEX1/FAL1,
FAL3)
CMA CGM and
Evergreen (FAL1,
FAL3)

THE WIN-WIN GAME IN SLOT-CHARTERING AGREEMENT AMONG THE LINER
COMPETITORS AND COLLABORATORS
3. April
2008
In Proceedings of Annual Conference of International Association of Maritime Economists
Safmarine on Maersk Line loops
Zim on CSAV Norasia AME (as Asia North Europe
Express)
IRISL on CSCL AEX1
Far East-
Mediterranean
ANL from CMA CGM on MEX, FAL1 and FAL3
Evergreen on CMA CGM FAL1 and FAL3
APL on CMA CGM MEX
HMM and MOL on Yangming AME (as AMS/MED)
K Line from Hanjin on EMA/MEX
APL on CMA CGM/MOL FAL1 (as NCE) and CMA
CGM FAL3 (as CFX)
APL and MOL on Grand Alliance EUM
HMM on Grand Alliance EUM and EU2 (as LPM and
LP2)
Safmarine on Maersk Line Loops
Zim on Cosco/CMA CGM AMX/MEX2
UASC on Hanjin MAP
Senator on Hanjin MAP and Yangming AME (as NMX)
HMM on CMA CGM/MOL FAL3 (as FA3)
APL on Grand Alliance EU2
Yangming on Hanjin AMP (as CMX)
HMM on Evergreen UAM
CSCL and CMA
CGM
(AEX1/FAL1,
FAL3)
CMA CGM and
Evergreen
(MEX/UAM)
Transatlantic Cosco, K Line, Yangming on MSC South Atlantic/ Gulf
loop (as TAS5/EGS)
Zim on Cosco/Hanjin/K Line/Yangmign (as AUE)
Hapag-Lloyd on CMA CGM/ Marfret Panama pendulum
ANL from CMA CGM on Liberty Bridge (as EUS2)
Victory Bridge (as EUS1) and Panama pendulum
ACL and Hapag-
Lloyd (ACL on
Grand Alliance
PAX, ATX and
GAX)
Maersk Line and
New World
Alliance
Mediterranean-
North America
APL on Maersk Line Gulf/Med services (as MGS)
CSCL from Zim on ZCS (as MAX)
Zim on CMA CGM/Evergreen/Gold Star Amerigo
Express (as Med USA service)
Cosco from Zim on ZCS (as TAS5, Haifa/USEC/Haifa
only)
Zim on Hapag-Lloyd Med Gulf service (as Med Gulf
Express)
Hapag-Lloyd on Maersk West Med (as MNX)
Hapag-Lloyd on Zim ZCS (as ZCX)
CSCL on CMA CGM/Evergreen/Gold Star Amerigo
Express (as MAX4)
Cosco, K Line and Yangming on MSC N.Atlantic loop
(as TAS6)
North
America/Mid
East/South Asia
Safmarine on Maersk Line services
MacAndrews and MOL on Indamex

THE WIN-WIN GAME IN SLOT-CHARTERING AGREEMENT AMONG THE LINER
COMPETITORS AND COLLABORATORS
3. April
2008
In Proceedings of Annual Conference of International Association of Maritime Economists
Table 3: Three levels of cooperation among the liner carriers
Source: Own composition based on Drewry (4th quarter report 2007) and BRS online information
Other recent significant moves within the liner shipping market are outlined as follows.
As of 12 February 2006, Maersk Sealand and P&O Nedlloyd started to trade as Maersk
line. As of 1 May 2007, the Evergreen Group unified its three brands Evergreen Marine
Corp Ltd (EMC), Italia Marittima SpA (ITS) and Hatsu Marine Ltd (HML) under the
unified common trade name ‘Evergreen Line’. Kawasaki Kisen Kaisha Ltd (K Line)
(Japan) and Hanjin Shipping Co Ltd have swapped shares in a proportion of around 3%.
Geveran Trading, a Cyprus-based firm which is part of Greenwich Holding Ltd, a
company indirectly controlled by Norwegian shipowner John Fredriksen, raised its share
in Hyundai Merchant Marine , triggering a reaction by HMM main shareholders to
counter-act what was interpreted as a possible attempt by Geveran to take control of the
company.
The Hamburg Süd group has replaced its brand Ybarra Cia. Sudamerica S.A. (Ybarra
Sud) with the brand Hamburg Süd Iberia S.A., effective 1st Janurary 2007 (Ybarra Sud
came under full control of Hamburg Süd on 31 December 2005). The organizational
consolidation of Hapag-Lloyd AG and Hapag-Lloyd Container Linie GmbH (HLCL)
already realized in 2005 has been formalized in 2006 in the context of the integration of
CP Ships. Besides, all the CP Ships services were integrated into Hapag-Lloyd’s network
by September 2006.
All the liners mentioned in this paper are either operating individually or are consolidated
with their subsidiaries, detailed information refer to appendix-2.
The behaviors of liner players and aforementioned real world business turbulence provide
us more motivation to analyze and evaluate them in terms of game theoretical application.
3. RESEARCH METHODOLOGY
3.1 Problem Formulation
Concerning the competition and cooperation among the liner carriers, a lot of research
had been done based on a variety of analysis including shippers’ choice (Brooks 1983
1993), oligopoly market status (Fox 1994), overcapacity issues (Fusillo 2004) and
additional profit allocation approaches as well as fairness based on Shapley value derived
from cooperative game theory (Wang et al. 2001; Song and Panayides 2002; Liu and
Akio 2005). When the slot-chartering problem is to be discussed in terms of non-
cooperative games, there are several perspectives which might lead to even more different
models.
From the perspective of capacity limitation, the slot-chartering problem could be viewed
as zero-sum game played by two agents because the reduced slots allocation of one agent
after bargaining is the added slots that the other agent would get based on the negotiation.
In this case the decision variables are related to the quantities of slots allocated to each
agent.
From the perspective of bargaining processes, the slot-chartering problem may also differ
depending on whether or not there is an effective long-term replenishment mechanism.
The mechanism design on slot-chartering price together with the respective quantity of
the slots is valuable to be observed. Regarding the replenishment existing in other areas,

THE WIN-WIN GAME IN SLOT-CHARTERING AGREEMENT AMONG THE LINER
COMPETITORS AND COLLABORATORS
3. April
2008
In Proceedings of Annual Conference of International Association of Maritime Economists
e.g. in military management, see Lennon et al. (2007). In order to design an appropriate
mechanism, the following two situations should be considered, respectively: the slot
owner has superior bargaining power over the related charterer, and the other for the
reverse situation. Furthermore, during the iterated negotiation processes, the higher the
position of any given agent the more he intends to push down the position of others.
Concerning the long-term replenishment contract based on game theoretic analysis, we
also refer to Kim and Kwak (2007).
From the perspective of profit sharing which results from a slot-chartering cooperation, it
could be viewed as non-zero-sum game since additional profits might occur when liners
provide more options to shippers. To the best of our knowledge, so far no such research
has been done in the ocean sea shipping industry. However, similar research considering
the hinterland trucks picking-up and delivering tasks had recently been developed by
Krajewska and Kopfer (2006) as well as Krajewska et al. (2007).
From the perspective of the evolution of the negotiations concerning the slot-chartering
business, the iterated sub-games also make sense and effect the repeated assignment of
the slots, see Shi and Voß (2008). There are some cases in military equipment
assignments, see Lennon et al. (2007) as well as Erdem and Ozdemirel (2008).
From the perspective of the incomplete and imperfect information among the involved
agents of the slot-chartering agreements, the true cost and individual prediction on the
market share are, without any doubt the business confidentialities of each agent. Thus, the
involved agents do not have full information about quantity options and consequently
each possible quantity of the slots depends on the probabilities that the other agents
perform different actions/behaviors.
Furthermore, some researches (Powell and Swart 2007) based on a game theoretical
framework suggest that the learning processes might result a contingence of the
equilibrium, thus, the iterated negotiations on price and quantity of the slot-chartering
agreements deserve our further research observations.
3.2 Cost Structure and Capacity Constraint
Before starting to analyze the price-and-quantity negotiation, a neat cost structure needs
to be investigated first so that a better understanding could be achieved.
3.2.1 Cost Structure
We conclude the cost structure in detail as shown in Table 4.
Item Remarks Memo
Lashing Not common Cost if included in pick rate (slot charterer to pay for its box)
Lashing( additional,extra
lashers) Common Cost if additional then to be prorated as per throughput
Extra Labour / Special
gang Common Cost
To be prorated as per throughput unless for unusual loadings
requested by a liner (breakbulk, project cargo, yachts etc.).
Overtime Common Cost To be prorated as per throughput unless Slot owner's
responsibility is engaged
Meal Hours Common Cost To be prorated as per throughput

THE WIN-WIN GAME IN SLOT-CHARTERING AGREEMENT AMONG THE LINER
COMPETITORS AND COLLABORATORS
3. April
2008
In Proceedings of Annual Conference of International Association of Maritime Economists
Detentions Common Cost To be prorated as per throughput unless Slot owner's
responsibility is engaged
Standby gangs Common Cost To be prorated as per throughput unless Slot owner's
responsibility is engaged
Unused Guarantee Time Common Cost To be prorated as per throughput
Shifting and restow (1) Not Common
Cost To be for Slot owner a/c except when incurred for specific COD's
Shifting and restow (2) Common Cost as a result of an agreed change of rotation and /or of an agreed
port omission
Opening/Closing hatch
covers, pontoons
Not Common
Cost To be for Slot owner account
Load/Discharge Gear
Boxes
Not Common
Cost To be for Slot owner account
Dockage Not Common
Cost To be for Slot owner account
Tally charges Common Cost To be prorated as per throughput
similar charges as per
local regulations Common Cost To be prorated as per throughput
Reefer mechanics Common Cost To be prorated as per reefer throughput
Standby for crane down Common Cost To be prorated as per pro rata throughput
Gangs switching vessels Common Cost To be prorated as per pro rata throughput
Table 4: The cost allocation between the involved agents based on agreement
3.2.2 Operational Costs Trends
Manning is the single largest operating cost budget element and there is going to be a
shortage on experienced seafarer once the under-booking superpost-Panamax/supra-
Panamax vessels are delivered in 2010-2012.
Insurance premiums are being dashed not just by a series of major claims but also through
a rapid increase in the number of higher cost minor claims. This can only give further
momentum to future premium increases (Drewry Quarterly Report).
Concerning repairs and maintenance, the ship repair industry has experienced rising
prices tempered by higher steel and coal costs. Other than that, stores, spares and
supplies, is the least significant element in the overall operating budget. Management and
administration fees remain surprisingly stable.
Furthermore, the liner carriers always keep in mind how the BAF (Bunker Adjustment
Factor) fluctuates as a consequence of bunker price changes. In most of the cases, the
variable components in the BAF formula consist of the following:
Bunker consumption: the amount of metric tons of bunker fuel needed to transport a 20
feet container each day of the transit. For instance, the bunker consumption of Asia-US is
0.032mt/TEU/day (calculated via BAF calculator published on www.maerskline.com).
BAF= Bunker price change×Trade specific constant
Bunker consumption×Transit time× Imbalance factor
THE WIN-WIN GAME IN SLOT-CHARTERING AGREEMENT AMONG THE LINER
COMPETITORS AND COLLABORATORS
3. April
2008
In Proceedings of Annual Conference of International Association of Maritime Economists
Transit time: the average number of days of a round trip voyage divided by two; equals
the one way transit time. The transit time of Asia-US is approximately 28 days.
Imbalance factor: is the ratio of headhaul to backhaul. This measures the inequality
between imports and exports in each trade. The US backhaul trades have performed well
but rates have not upgraded enough to make a real difference due to the worry on the
imbalance factor kept year by year. For instance, the US backhaul, i.e., Asia-US West
Bound is regarded as with 0.6 imbalance factor comparing the US headhaul, i.e., Asia-US
East Bound with 1.4 imbalance factor. This would influence dramatically the rates
differences between West Bound and East Bound. As a matter of fact, the filling ratio of
large vessels is one of the key issues always being under managers’ considerations.
Bunker price change in bunker cost, up or down, during the measurement period. The
price change is the new price less the original price because the base bunker cost has been
included in the base ocean freight rate. For instance, the bunker price is 441 in the first
quarter of 2008, and considering the bunker base element 322, we get a bunker price
change as 119 USD.
As for the tactic of the liner, he might choose some monitoring port to consist his global
bunker port basket aiming to control its bunker prices and adjusts the basket on a
quarterly base. Most probably, Algeciras, Busan, Durban, Hongkong, Los Angeles, New
York, Panama Canal, Rotterdam, Salalah, Savannah and Singapore are under
consideration.
All the above mentioned costs including fixed costs and operational costs as well as the
associated tactics of calculating and optimizing them would be directly or indirectly
represented in the liner’s profit curve and indifference curve, see Figure 1-5.
3.2.3 Chartered Slots Constraint
By applying the Leontief model (Gibbons 1992), the owner of the vessel and slots could
be regarded as the position providers and the charterers could be regarded as the labors,
respectively. Considering the liner shipping business realities, one of the capacity
constraints is that the charterer might not charter the slots beyond 50 % of the vessel’s
capacity. As for the owner, he would not let the charterer purchase so many, otherwise, it
reflects that his sales representatives do not work effectively enough to grasp the market
share. And the retail price sold by his sales representatives should be higher than the
wholesale price based on the slot-chartering agreements. From the view of the charterer,
he would not like this situation either. Otherwise, the charterer might prefer to deploy
another vessel and charter some slots out instead of purchasing over 50% capacity of his
competitor’s vessel. Under this situation, the charterer might think himself support too
much to his competitor’s revenue. Thus, there exists a realistic constraint that the ratio of
chartered capacity will not exceed 50%.
3.3 Model
Price and quantity negotiation in a slot-chartering agreement is considered as below.
Leontief (1946) presented a model of the relationship between an entity and a monopoly
union. This model could also be applied to simulate and analyze the negotiation in a slot-
chartering agreement, which could be described as follows:
• The owner and the charterer bargain over prices of the slots to be chartered

THE WIN-WIN GAME IN SLOT-CHARTERING AGREEMENT AMONG THE LINER
COMPETITORS AND COLLABORATORS
3. April
2008
In Proceedings of Annual Conference of International Association of Maritime Economists
• The charterer retains exclusive control over the quantity of slots that he would like
to charter
Here we would like to explain the similarity between the wage-labor game and the slot-
chartering agreement game. From the demand-supply point of view, the charterer desiring
slots behaves like the firm which desires labor and the owner supplying slots behaves like
the union who supplies labor. Thus, the sequence of the sub-game might be of similar
mechanism.
• The utility function of the owner is ),( qpU , where p is the price at which the
owner would like to offer and sign with the charterer, and q is the quantity.
Assume that ),( qpU increases in both p and q .
• The charterer’s profit function is qpqRqp .)(),( −=π , where )(qR is the revenue
that the charterer can earn if he charters q slots and use them to transport the
associated cargo optimally. Assume the )(qR is increasing when q goes up, i.e.,
)(qR is concave.
Suppose the sequence of the game is:
• Stage 1:the owner proposes a price p
• Stage 2:the charterer observes p and then further thinks about (and later may
accept) the quantity q
• Stage 3:payoffs of the owner and the charterer are ),( qpU and ),( qpπ ,
respectively
Below we go forward to assume specific functional forms for ),( qpU and ),( qpπ which
make it possible to solve the payoffs explicitly by applying backwards-induction.
First, we can characterize the charterer’s best response in stage 2, )(* pq , to an arbitrary
price proposed by the owner in stage 1, p . Given p , the charterer charters )(* pq slots to
optimize his profit
qpqRqpqq
⋅−=≥≥
)(max),(max00
π
The first-order condition for the above formula is 0)(' =− pqR . In order to guarantee
that the first-order condition has a solution, assume that ∞=)0('R and that 0)(' =∞R , as
suggested in Figure 1.

THE WIN-WIN GAME IN SLOT-CHARTERING AGREEMENT AMONG THE LINER
COMPETITORS AND COLLABORATORS
3. April
2008
In Proceedings of Annual Conference of International Association of Maritime Economists
Actually the )(qR is the revenue that the charterer gains when he behaves as a carrier to
the shippers (in most parts of this paper, the shipper is not involved). And qp ⋅ is the cost
because the charterer himself does neither own the slots nor operate the associated vessel,
but he pays qp ⋅ as his cost to the owners.
Figure 2 depicts )(* pq as a function of p but uses axes that ease comparison with later
figures and illustrates that )(* pq cuts each of the charterer’s isoprofit curves at its
maximum.
• Holding q fixed, the charterer does better when p is lower, in other words, the
cost is lower, thus, lower isoprofit curves represent higher profit levels
• When )(* pq cuts the charterer’s isoprofit curves at its maximum, it represents the
fact that )(* pq maximizes ),( qpπ given p . If the charterer bargains 'p other than
p , for instance, then the owner’s choice of q amounts to the choice of a point on
the horizontal line 'pp =
• The highest feasible profit level is attained by choosing q such that the isoprofit
curve through ),'( qp is tangent to the constraint 'pp =
)(* pq
0
p
q
)(*pq
0
Figure 1: The revenue of charterer versus the price
Slope=p (price)
)( qR
R
q
Figure 2: Slot charterer’s isoprofit curves

THE WIN-WIN GAME IN SLOT-CHARTERING AGREEMENT AMONG THE LINER
COMPETITORS AND COLLABORATORS
3. April
2008
In Proceedings of Annual Conference of International Association of Maritime Economists
Figure 3 depicts the owner’s indifference curves. Holding q fixed, the owner does better
when p is higher, so higher indifference curves represent higher utility levels for the
owner.
We turn next to the owner’s problem at stage 1. Since the owner can solve the charterer’s
stage 2 problem as well as the charterer can solve it, the owner should anticipate that the
owner’s reaction to the price proposal p will be to decide the quantity level )(* pq .
Thus, the owner’s problem at the stage 1 amounts to
))(,(max *
0pqpU
p≥
In terms of the indifference curves plotted in Figure 3, the owner would like to propose
the price p that yields the outcome ))(,( * pqp that is on the highest possible indifference
curve.
The solution to the owner’s problem is *p , the price proposed such that the owner’s
indifference curve through the point ))(,( *** pqp is tangent to )(* pq at the point, see Figure
4.
Thus, ))(,( *** pqp is the backwards-induction outcome of this price-and-quantity game.
It is straightforward to see that ))(,( *** pqp is inefficient: both the owner’s slots capacity
and the charterer’s profit would be increased if p and q were in the shaded region in
Figure 5.
)(* pq
*p
)( ** pq
0
p
q
Owner’s indifference curve
Figure 4: Equilibrium derived from backwards-induction
0
p
q
Figure 3: Slot owner’s indifference curves

THE WIN-WIN GAME IN SLOT-CHARTERING AGREEMENT AMONG THE LINER
COMPETITORS AND COLLABORATORS
3. April
2008
In Proceedings of Annual Conference of International Association of Maritime Economists
This inefficiency makes it puzzling that in practice the charterers seem to retain exclusive
control over quantity of the slots to be chartered without exceeding 50% capacity of the
associated vessle as mentioned in Section 3.2. Even allowing the charterer and the owner
to bargain several times over the price but leaving the charterer with exclusive control
over quantity results in a similar inefficiency.
Espinosa and Rhee (1989) propose one answer to the puzzle of inefficiency. Based on the
fact that the owner and the charterer might negotiate repeatedly over time (usually every
three years regarding the liner business reality) there may exist an equilibrium of such an
iterated game in which the owner’s choice of p and the charterer’s choice of q lie in the
shaded region of Figure 5, even though such values of p and q cannot arise as the
backwards-induction outcome of a single round game.
In the model proposed in this paper, the backwards-induction outcome is not collective
efficient. In practice, however, a charterer and an owner may discuss over the detailed
terms of a three-year-agreement, then negotiate three years later over the terms of a
second agreement, and so on. Thus, the relationship between the charterer and the owner
may be more accurately characterized as repeated games applying dynamic strategy, Shi
and Voß (2008). This problem derives conditions under which a subgame-perfect Nash
equilibrium in the infinitely repeated game is Pareto-superior to the backwards-induction
outcome of the one-shot game. Denote the owner’s utility and the charterer’s profit in the
backwards-induction outcome of the one-shot game by *U and *π , respectively. Consider
an alternative utility-profit pair ),( πU associated with an alternative price-and-quantity
pair ),( qp . Suppose that the parties/agents/players share the discount factorδ (per three-
year period).
Derive conditions on ),( qp such that
• ),( πU Pareto-dominates ),( ** πU
• ),( πU is the outcome of a subgame-perfect Nash equilibrium of the infinitely
repeated game, where ),( ** πU is played forever following a deviation.
4. MECHANISM DESIGN
4.1 Payments
)(* pq
)( ** pq
*p
Charterer’s isoprofit curve
0
p
q
Owner’s indifference curve
Figure 5: Shaded region of equilibrium

THE WIN-WIN GAME IN SLOT-CHARTERING AGREEMENT AMONG THE LINER
COMPETITORS AND COLLABORATORS
3. April
2008
In Proceedings of Annual Conference of International Association of Maritime Economists
In most cases, the slot-chartering agreements are to be signed every 3 years and to be
amended in case the operating cost of related container ships turbulent too much, e.g., the
fuel price keeps increasing.
Considering the payment method of the slots agreements, both monetary payments and
other slots are possible. For instance, the partners might pay for the slots of Asia-US East
coast in terms of providing slots of Asia-US West coast or Asia-Europe, which could be
viewed as slot-exchanging, as mentioned in Section 2.4. Without paying monetary
instruments, this provides both partners better chances to control their own cash flow as
well as decreasing the risk of fuel cost.
Considering the peak season and congestion, the slot-chartering agreements are relatively
more stable than the spot price of retailing slots. The agreements are supposed to be
discussed and signed at least three months before put into force. So even if port
congestion happens or an unexpected peak season occurs, the agreements are not easy to
be broken without advance permission of the partner.
4.2 Iterations
How do the partners of the first round game likely alter their choice of contracts in
subsequent games? Every curve can change. The charterer’s soprofit curve is built based
on the slot rate he get from the owner and the retailing price that the charterer sells to
final shippers; the owner’s indifference curve is built based on his own cost and the slot
rate the owner sells to the charterer. Those variables of cost and revenue are actually
based on the expectations of the other agent’s “good guess”. Perhaps the most important
concern of the agents is the predictability of their partner’s behavior. This might arise in
an argument: if every business behavior is predictable, then there would be, in general, no
agreement necessary at all. As some other literatures (Macaulay 1963) had discussed,
actually a detailed contract is one mechanism for making behavior predictable, and
another is trust (Gulati 1995). On one hand, the trust between partners occurs when the
business development follow the originally detailed agreements. On the other hand, the
trust then, in the other way around, might help stable and positive outcomes of the
sequent sub-games subject to the compatible mechanism or change simultaneously based
on mutual understanding. Hence iteration of sub-game may improve, no matter positively
or negatively, the negotiations among the associated liners.
Besides the reason mentioned before could result iteration, there are some other factor
make iteration happen as well. Recall the bunker price as one of the factors that make the
operation cost different. The iterations might also happen due to sudden change of the
bunker price. The liner adjusts his bunker port basket quarterly, and the iteration of slot-
chartering pricing might happen accordingly.
In case axis z is to be drawn in Figure 5, it might denote the sequence of sub-game, i.e.,
the axis of time. The farer the node along axis z, the later the associate sub-game is to be
played. And the sequential equilibrium represents best response of agents taking into
account of iteration, learning and rationality.
5. SOLUTION AND SUGGESTION
The research method and provisional model proposed in Section 4 can be applied to
analyze the negotiations on slot-chartering agreement. Since every bid of the negotiations
is business confidentiality, it is not easy to demonstrate the data of real world business.

THE WIN-WIN GAME IN SLOT-CHARTERING AGREEMENT AMONG THE LINER
COMPETITORS AND COLLABORATORS
3. April
2008
In Proceedings of Annual Conference of International Association of Maritime Economists
The simulation of the optimized price-and-quantity mechanism and sensitive analysis
would be an alternative solution in our future research.
With regard to the issues mentioned in Section 2.3, some further discussion might arise.
Considering Panama as one bottleneck close to the American East Coast, the extension of
the Panama Canal might result not only in changes of the associated short sea shipping
service but also the oversea, e.g., Far East to the American East Coast, service reshuffle.
Maybe it is even better to say that the reshuffling has already started if we take into
account the phasing out of NYK at the beginning of 2008 from the former agreement with
Maersk Line. The suggestions for agents and regulators are briefly discussed as follows.
5.1 For Agents - Difference between Slots Provision and Slots Allocation
Any difference between slot provision and slot allocation in a cycle route, either on an
occasional or long term basis, may be financially settled between the owner and the
charterer. In this respect, the owner shall compensate the charterer at the level of the
agreed cost times the number of slots not provided.
On the other hand, it could also be possible that the charterer loads in excess of his
allocation without prior notice. If extra capacity is not available from the owner, the
charterer having exceeded its agreed slot allocation will be required to reduce its
TEU/DWT down to its allocation, and if necessary discharge the containers in excess at
its own expense in the next port of call. If extra capacity is available from the owner, the
owner might agree to carry such in excess, subject to payment only to the owner of the
extra slots on an as used basis (including lost slots in case of High Cube and/or OOG).
The aforementioned difference between slot provision and slot allocation could be
demonstrated as in Figure 6.
As for the charterer who has accepted the chartering price of slots, it would be a better
choice if he tries to fulfill those expensive slots by transporting high-valued cargoes, e.g.,
containerized chemical goods. These high-valued goods do not care whether or not the
so-called FAK (Freight of All Kinds) prices posed to them turn out to be higher.
Furthermore, the shift of cargoes from bulks to containerized package is another option to
fulfill the capacities.
5.2 For Regulators - Difference between Fixed Agreement and Spot Market
The slot-chartering business draws attention from the market regulators as well as other
players, e.g., port operators, within the liner industry (Meersman et al. 1999; Rimmer
1993 1997 1998a 1998b). In other words, the existing cooperation business pushes the
Charterer loading in excess
0
Figure 6: Difference between slot provision and slot allocation
Loading
q
Agreed slot allocation
Charterer loading insufficient

THE WIN-WIN GAME IN SLOT-CHARTERING AGREEMENT AMONG THE LINER
COMPETITORS AND COLLABORATORS
3. April
2008
In Proceedings of Annual Conference of International Association of Maritime Economists
regulators both in the US and in the European Union to rethink sustainable policies to
support free competition (Gardner et al. 2002; Molenaar and Van de Voorde 1994).
Whether or not it is allowed to sell the unused slots to the spot market to the other active
retailing requirements is one of the key issues for regulators. If it is possible for the
unused slots to be sold back to the spot market by means of retailing, it might reduce the
risk of the associated charterer. However, it should be noted that nowadays based on most
of the slot-chartering agreements in the liner shipping business, the charterer shall not
assign, delegate, sub-charter or transfer the rights and duties under the agreements, which
means the charterer cannot sub-let any slots to any other third party, unless otherwise
agreed, agreement not to be unreasonably withheld.
However, there might exist another way to build-up a buffer area connecting with the spot
market. Upon negotiating the agreement, the charter might fight for being entitled to
sell/allocate slots to his wholly owned subsidiaries as from the start of this agreement,
which could to great extent amplify the charterer’s chances to finally fulfill his bought
slots. Certainly, in order to be fair to the owner, the charterer should advise in writing the
owner at least some time, e.g., two weeks, prior the first loading to avoid any
operational/booking distortions.
6. CONCLUSION AND FURTHER RESEARCH
In this paper we have investigated the detailed cost structure of the owners and charterers
involved in slot-chartering agreements. The different cost allocation of the vessel provider
and the charter party and other agents involved in vessel-sharing agreements and its
impact on their network integration belongs to our future research interest. In addition,
due to the difficulties to get the real cost structure, some segments of the total costs, e.g.,
bunker price, could be used as key factor when accomplishing sensitivity analysis to
simulate the real business.
Taking into account the similarities between the airline industry and the liner shipping
industry, the slot-chartering problem discussed in this paper, could also be of interest
when investigating airline cooperation. But it should be noted that the ‘slot’ as a term
mentioned in airport operations means differently, i.e., the time window together with the
space that could serve the incoming aircrafts. And the time factor makes more sense in
the airline business than it does in the liner shipping industry.
As a matter of fact, we can conclude in a more simple way, most of the valuable resources
of an entity could be regarded as ‘slots’. Once the resources are not so sufficient to
manufacture production or provide services, the entity might, after harsh negotiations,
choose to cooperate with its competitors at certain price by sharing certain quantities of
resources. Thus, the backward-deduction and price setting mechanism discussed in this
paper might be valuable and useful when applied, in an appropriate way, in other business
domains.
ACKNOWLEDGEMENT
As a Marie Curie fellow, the first author would like to thank the TransportNET Program
which is operated under the EU 6th
Framework for its dedicated training and support. And
the authors also benefit from the interview and conversations with colleague in FMC.
Furthermore, the reviewers and their helpful comments are highly appreciated.

THE WIN-WIN GAME IN SLOT-CHARTERING AGREEMENT AMONG THE LINER
COMPETITORS AND COLLABORATORS
3. April
2008
In Proceedings of Annual Conference of International Association of Maritime Economists
REFERENCES
Akio, I., Nishimura, E., Papadimitriou, S. and Liu, M. (2006), The Economic Viability of
Container Mega-ships, Transportation Research Part E 42: 21-41.
Baird, A.J. and Lindsay, A.J. (1996), Strategic Choice in the Global Container Shipping
Industry: A Resource-Based Approach, Proceeding of annual conference of IAME,
Vancouver.
Brooks, M.R. (1983), Determinants of Shipper’s Choice of Container Carriers: A Study
of Eastern Canadian Exporters, PhD Dissertation, Department of Maritime Studies and
International Transport, University of Wales College of Cardiff.
Brooks, M.R. (1993), International Competitiveness-Assessing and Exploring
Competitive Advantage by Ocean Container Carriers, Logistics and Transportation
Review 29 (3): 275-293.
Brooks, M.R. (2000), Sea Changes in Liner Shipping, Elsevier Science, Oxford.
Brooks, M.R., Blunder, R.G. and Bidgood, C.I. (1993), Strategic Alliances in the Global
Container Transport Industry, in Refick, R. and Culpan, R. (eds) (1993) Multinational
Strategic Alliances, International Business Press, London: 221-250.
Clarke, R.L. (1997), An Analysis of the International Ocean Shipping Conference
System, Transportation Journal 38: 17-29.
Cullinane, K.P.B., Khanna, M. and Song, D-W. (1999), How Big is Beautiful: Economies
of Scale and the Optimal Size of Containership, Proceeding of Annual Conference of
IAME, Halifax: 108-140.
Das, T.K. and Teng, B-S. (1998), Between Trust and Control: Developing Confidence in
Partner Cooperation in Alliances, Academy of Management Review 23 (3): 491-512.
Erdem, E. and Ozdemirel, N.E. (2003), An Evolutionary Approach for the Target
Allocation Problem, Journal of the Operational Research Society 54: 958-969.
Espinosa, M. and Rhee, C. (1989), Efficient Wage Bargaining as a Repeated Game,
Quarterly Journal of Economics 104: 565-588.
Evangelista, P. and Morvillo, A. (2000), Logistical Integration and Co-operative
Strategies in Liner Shipping: Some Empirical Evidence. International Journal of
Maritime Economics 2 (1): 1-16.
Fox, N. (1994), An Oligopoly Model of Ocean Liner Shipping, Review of Industrial
Organization 9 (4): 343-357.
Fusillo, M. (2003), Excess Capacity and Entry Deterrence: The Case of Ocean Liner
Shipping Markets, Maritime Economics and Logistics 5: 100-115.
Fusillo, M. (2004), Is Liner Shipping Supply Fixed? Maritime Economics and Logistics 5:
220-235.
Gardner, B., Marlow, P. and Nair, R. (2002), The Economic Regulation of Liner
Shipping: The impact of US and EU Regulation in US Trades, Chapter 15, in

THE WIN-WIN GAME IN SLOT-CHARTERING AGREEMENT AMONG THE LINER
COMPETITORS AND COLLABORATORS
3. April
2008
In Proceedings of Annual Conference of International Association of Maritime Economists
Grammenos, C.T. (ed) (2002), The Handbook of Maritime Economics and Business,
Informa.
Gibbons, R. (1992), A Primer in Game Theory, Harvester Wheatsheaf, Hertfordshire.
Gomes, E.G. and Lins, M.E. (2007), Modelling Undesirable Outputs with Zero Sum
Gains Data Envelopment Analysis Models, Journal of the Operational Research Society,
publish online first.
Gulati, R. (1995), Does Familiarity Breed Trust? The Implications of Repeated Ties for
Contractual Choice in Alliances, The Academy of Management Journal 38 (1): 85-112.
Haralambides, H.E. (2004), Determinants of Price and Price Stability in Liner Shipping,
workshop on the Industrial Organization of Shipping and Ports, National University of
Singapore, Singapore.
Haralambides, H.E. and Veenstra, A.W. (2000), Modelling Performance in Liner
Shipping, in Button, K.J. and Hensher, D.A. (eds) (2000) Handbook of Transport
Modelling, Pergamon-Elsevier Science, New York.
Harrigan, K.R. (1988), Strategic Alliances and Partner Asymmetries, in Contractor, F.J.
and Lorange, P. (eds) (1998) Cooperative Strategies in International Business-Joint
Venture and Technology Partnerships Between Firms, Lexington Books, Lexington,
Mass: 205-226.
Heaver, T.D., Meersman, H., Moglia, F. and Van de Voorde, E. (2000), Do Mergers and
Alliances Influence European Shipping and Port Competition? Maritime Policy and
Management 27: 363-373.
Heaver, T.D., Meersman, H. and Van de Voorde, E. (2001), Cooperation and Competition
in International Container Transport: Strategies for Ports, Maritime Policy and
Management 28(3): 293-305.
Hoffmann, W. H. (2005), How to Manage a Portfolio of Alliances, Long Range Planning
38: 121-143.
Kim, J.S. and Kwak, T.C. (2007), Game Theoretic Analysis of the Bargaining Process
over a Long-Term Replenishment Contract, Journal of the Operational Research Society
58: 769-778.
Krajewska, M.A., Kopfer, H. (2006), Collaborating Freight Forwarding Enterprises:
Request Allocation and Profit Sharing, OR Spectrum 28: 301-317.
Krajewska, M.A., Kopfer, H., Laporte, G., Ropke, S. and Zaccour, G. (2007), Horizontal
Cooperation among Freight Carriers: Request Allocation and Profit Sharing, Journal of
the Operational Research Society, advance online publication, doi: 10.1057/palgrave.
jors.2602489.
Lennon, C.G., McGowan J.M. and Lin K.Y. (2007), A Game-Theoretic Model for
Repeated Assignment Problem between Two Selfish Agents, Journal of the Operational
Research Society, advance online publication, doi: 10.1057/palgrave. jors.2602518.

THE WIN-WIN GAME IN SLOT-CHARTERING AGREEMENT AMONG THE LINER
COMPETITORS AND COLLABORATORS
3. April
2008
In Proceedings of Annual Conference of International Association of Maritime Economists
Lim, S-M. (1998), Economies of Scale in Container Shipping, Maritime Policy and
Management 25: 361-373.
Liu, M. and Akio, I. (2005), An Application of Modified Shapley Value to Ocean
Shipping Strategic Alliances, Journal of Japan Institute of Navigation 113: 281-286.
Liu, M. (2007), Selecting Economically Feasible Container Services with the New Trend
of Employing Mega Containerships, Proceedings of the IAME (International Association
of Maritime Economists) 2007 Annual Conference, 4-6 July, Athens.
Lorange, P. (2001), Strategic Re-thinking in Shipping Companies, Maritime Policy and
Management, Vol. 28, No. 1, pp. 31-40.
Macauley, S. (1963), Non-Contractual Relations in Business: A Preliminary Study,
American Sociological Review 28: 55-67.
Meersman, H., Moglia, F. and Van de Voorde, E. (1999), Mergers and Alliances in Liner
Shipping. What do European Port Authorities Have to Fear? In Brooks, M.R. (ed.) (1999)
Liner Shipping: What’s Next?-Proceeding of IAME Conference, Halifax: 204-220.
Molenaar, H. J. and Van de Voorde, E. (1994), Competition Policy in Liner Shipping,
Annual Conference of International Association of Maritime Economics, Antwerp.
Nash, J.F. (1949), Equilibrium Points in n-Person Games, Princeton University.
Notteboom, T. (2006), The Time Factor in Liner Shipping Services, Maritime Economics
and Logistics 8: 19-39.
Phlips, L. (1995), Competition Policy: A Game-Theoretic Perspective, Cambridge
University Press.
Powell, J.H. and Swart, J. (2007), Scaling Knowledge: How does Knowledge Accrue in
Systems? Journal of the Operational Research Society 58: 1-11.
Reinhardt, G. and Dada, M. (2005), Allocating the Gains from Resource Pooling with the
Shapley Value, Journal of the Operational Research Society 56: 997-1000.
Rimmer, P.J. (1993), Transport and Communications in the Pacific Economic Zone
during the Early 21st Century. In Yue-man Yeung (ed.) (1993) Pacific Asia in the 21
st
Century: Geographical and Developmental Perspectives Hong Kong: The Chinese
University Press.
Rimmer, P.J. (1997) Shipping Patterns in the Western Pacific: the China Factor, Maritime
Studies 94: 1-27.
Rimmer, P.J. (1998a) Impact of Global Strategic Alliances on Pacific Rim Seaports,
Maritime Studies 98: 1-29.
Rimmer, P.J. (1998b) Ocean Liner Shipping Services: Corporate Restructuring and Port
Selection/Competition, Asia Pacific Viewpoint, 39 (2): 193-208.
Shapley, L.S. (1953), A Value of n-Person Games, Annals of Mathematics Studies 28:
307-317.

THE WIN-WIN GAME IN SLOT-CHARTERING AGREEMENT AMONG THE LINER
COMPETITORS AND COLLABORATORS
3. April
2008
In Proceedings of Annual Conference of International Association of Maritime Economists
Shapley, L.S. (1971), Cores of Convex Games, International Journal of Game Theory 1:
11-26.
Shi, X. and Voß, S. (2007a), Container Terminal Operations under the Influence of
Shipping Alliances, in Khalid Bichou, Michael G.H. Bell and Andrew Evans (eds.) Risk
Management in Port Operations, Logistics and Supply Chain Security, London.
Shi, X. and Voß, S. (2007b), From Transocean Routes to Global Networks: A Theoretical
Framework for Liner Companies to Build Service Networks, Working paper, University
of Hamburg, Presented at DSTIS 2007 (Decision Support for Telecommunications and
Information Society), Warsaw, Poland.
Shi, X. and Voß, S. (2007c), The Impact of the Panama Canal Expansion on Liner Fleet
Deployment and Composition - A New Agenda, Working paper, University of Hamburg,
Presented at IFIP 2007 (International Federation for Information Processing), Cracow,
Poland.
Shi, X. and Voß, S. (2008), Iterated Cooperations and Possible Deviations among the
Liner Shipping Carriers Based on Non-Cooperative Game Theory, Proceedings of Annual
Meeting of Transportation Research Board 08-2826, Washington D.C.
Slack, B., Comtois, C. and McCalla, R.J. (2002), Strategic Alliances in the Container
Shipping Industry: A Global Perspective, Maritime Policy and Management 29: 65-75.
Song, D. W. and Panayides, M. (2002), A Conceptual Application of Cooperative Game
Theory to Liner Shipping Strategic Alliances, Maritime Policy and Management 29 (3):
285-301.
Ting, S.C. and Tzeng, G.H. (2003), Ship Scheduling and Cost Analysis for Route
Planning in Liner Shipping, Maritime Economics & Logistics 5: 378-392.
Tsang, W.K. (1998), Motives for Strategic Alliances: A Resource-Based Perspective,
Journal of Management 14 (3): 207-221.
Vernimmen, B., Dullaert, W. and Engelen, S. (2007), Schedule Unreliability in Liner
Shipping: Origins and Consequences for the Hinterland Supply Chain, Maritime
Economics & Logistics 9: 193-213.
Von Neumann, J. and Morgenstern, O. (1944), Theory of Games and Economic Behavior,
Princeton University Press: Princeton, NJ.
Wang, T.F., Panayides, P.M. and Song, D.W. (2001), Inter-organisational Relations in
Liner Shipping Alliances as a Co-operative Game, Journal of the Eastern Asia Society for
Transportation Studies 3(1), 247-262.

THE WIN-WIN GAME IN SLOT-CHARTERING AGREEMENT AMONG THE LINER
COMPETITORS AND COLLABORATORS
3. April
2008
In Proceedings of Annual Conference of International Association of Maritime Economists
APPENDICES
Appendix-1: Top 20 Liner Operators at 11 Feb 2008
Rank Operator Total
TEU
Total
Ships
Owned
TEU
Owned
Ships
Chartered
TEU
Chartered
Ships
Chartered
Ratio
Orderbook
increase
1 APM-Maersk 1,916,880 530 998,181 185 918,699 345 47.9% 21.8%
2 Mediterranean
Shg Co 1,228,021 371 710,606 214 517,415 157 42.1% 52.2%
3 CMA CGM
Group 893,860 375 268,839 88 625,021 287 69.9% 67.7%
4 Evergreen
Line 624,357 176 363,425 102 260,932 74 41.8% 17.4%
5 Hapag-Lloyd 492,058 139 247,831 60 244,227 79 49.6% 21.3%
6 CSCL 433,263 139 251,192 87 182,071 52 42.0% 56.5%
7 COSCO
Container L. 430,952 141 232,499 94 198,453 47 46.0% 90.6%
8 APL 407,775 126 139,716 38 268,059 88 65.7% 64.0%
9 NYK 385,751 118 248,580 50 137,171 68 35.6% 58.2%
10 OOCL 347,676 82 200,337 35 147,339 47 42.4% 39.9%
11 MOL 346,870 111 165,038 38 181,832 73 52.4% 53.1%
12 Hanjin /
Senator 343,297 83 115,891 22 227,406 61 66.2% 91.0%
13 K Line 308,194 93 163,736 33 144,458 60 46.9% 54.8%
14 Hamburg-Sud
Group 284,097 123 110,309 37 173,788 86 61.2% 61.0%
15 Zim 280,860 111 136,009 42 144,851 69 51.6% 103.3%
16 Yang Ming
Line 274,281 83 172,825 51 101,456 32 37.0% 68.8%
17 CSAV Group 265,064 89 21,208 4 243,856 85 92.0% 57.6%
18 Hyundai M.M. 200,719 47 50,779 11 149,940 36 74.7% 90.1%
19 PIL (Pacific
Int. Line) 170,248 110 104,436 74 65,812 36 38.7% 40.3%
20 Wan Hai
Lines 140,750 82 98,591 51 42,159 31 30.0% 41.6%

THE WIN-WIN GAME IN SLOT-CHARTERING AGREEMENT AMONG THE LINER
COMPETITORS AND COLLABORATORS
3. April
2008
In Proceedings of Annual Conference of International Association of Maritime Economists
Appendix-2: Liners and Consolidated Subsidiaries
APM-Maersk includes Maersk Line, Safmarine, APM Saigon Shipping-MCC and
Mercosul Line
CMA CGM Group includes CMA CGM, Delmas (with OTAL), ANL, US Lines, Feeder
Associate System, Cagema, MacAndrews, Cheng Lie Navigation Co and CoMaNav
Evergreen Line includes Evergreen Marine Corporation, Evergreen Marine (UK) Ltd,
Evergreen Marine (HK) Ltd and Italia Marittima
Hanjin includes Senator Linie
CSCL (China Shipping Container Lines) includes Shanghai Puhai Shipping Co
NYK includes Tokyo Senpaku Kaisha (TSK)
Zim (ZISS) includes Gold Star Line and Laurel Navigation
Hamburg-Süd Group includes Hamburg-Süd, Alianca and Costa C.L.
Authors’ own composition based on information provided on:
www.maerskline.com
www.axsmarine.com
www.brs-paris.com

Xiaoning Shi and Stefan Voß, Container Terminal Operations under the Influence
of Shipping Alliance. In Risk Management in Port Operations, Logistics and
Supply Chain Security (K. Bichou, M.G.H.Bell, and A.Evans, eds.), Informa,
London, 2007, pp. 135-164
CHAPTER 11
CONTAINER TERMINAL OPERATIONS
UNDER THE INFLUENCE OF SHIPPING
ALLIANCES
Xiaoning Shi
University of Hamburg, Institute of Information Systems, Von-Melle-Park 5,
20146 Hamburg, Germany, and Shanghai Jiao Tong University, Shanghai, China
Stefan Voß
University of Hamburg, Institute of Information Systems, Von-Melle-Park 5,
20146 Hamburg, Germany
ABSTRACT
Nowadays, there is a trend to establish new business linkages and alliances within
the shipping industry together with customers, suppliers, competitors, consultants,
and other companies. Notably these include terminal operators in major ports
worldwide. A number of studies have attempted to explain this phenomenon
occurring in the liner shipping industry using a variety of conceptual and
theoretical frameworks. We focus on liner shipping strategic alliances and their
influence on container terminal operators. Regarding alliances we briefly discuss
the motivations of short-run cooperation among several liner carriers, analyse
pros and cons of being members in liner shipping strategic alliances, and advise
ways to maintain long-run alliance stability by increasing benefits and decreasing
risks and drawbacks. Moreover, how do these alliances influence container
terminal operators, if there is an influence at all, and what are possible scenarios
for mutual advantages? Our goal is to survey possible issues regarding shipping
alliances and their influences on terminal operators.

2 X. Shi, S. Voß
1 Introduction
Even in the simplest supply chain, setting the linkage between liner shipping
companies and port operators can be regarded as demand and supply oriented
upstream and downstream partnering. Liner vessels visit ports as customers and
their desire is driven according to their schedules as well as their hinterland
shippers and the technology developments. Port operators try every effort to meet
the demands and could attract more and more ships by, e.g., good reputation,
reliability and agile responses. Thinking about logistic networks in depth, liner
shipping transportations and ports obviously act as threads and nodes (i.e. routes
or lines and ports) individually, which built up logistics and supply chain
networks. Any minor improvements of the threads or nodes, such as faster mega
vessels or newly designed handling cranes, could decrease, e.g., time oriented
measures such as total flow times or lead times within the logistics network and
increase customer satisfaction.
A more efficient logistics network would certainly be gained by avoiding
bottlenecks among the network (Brennan, 2001) and by harmonizing liner
transportation and port operation. Based on this, there are strong links among liner
shipping companies and container terminal operators, no matter whether they are
regarded as customer-supplier or thread-node. That is, port operators should take
into account those linkages independent from considering short term operations or
long term strategies. The inevitable trend of liner shipping strategic alliances
together with dynamic membership pushes port operators towards rechecking their
marketing instruments, handling schedule, service provisions, data interchange
and information system management and integration, etc.
Many researchers are discussing port operation performance, especially under the
influence of liner shipping conferences or alliances. From a global perspective it
seems beneficial to distinguish between port economics and shipping economics
though the interdependencies turn out to be of utmost importance. That is, many
issues related to the port industry cannot be investigated without taking into
account shipping companies and the shipping industry as its main customers (cf.
Cullinane, 2005). Various important trends are pushing the port and shipping
industries and those players within them towards re-thinking and re-shaping their
service networks (Notteboom, 2004). These trends include globalisation,
deregulation, logistics integration, and containerisation. Moreover, regionalization
and associated hinterland concepts need to be taken into account, too (Notteboom
and Rodrigue, 2005).

Container Terminal Operations Under the Influence of Shipping Alliances 3
Despite globalization, various areas show individual characteristics such as
European ports versus so-called Asian models. For instance, Wang et al. (2004)
address Shanghai (China) and Song (2002) discusses Hong Kong’s role as the
gateway to and from China and the ports’ competition in the Pearl River Delta.
Meanwhile, the development of Busan (Korea) is also a valuable example as an
emergence of so-called mega ship ports (Fremont and Ducruet, 2005).
A very comprehensive treatment of the economics of seaport container handling is
provided by Vanelslander (2005). Some further references can be found in
Ninnemann (2006). More general concerns are treated by Blauwens et al. (2006).
With the ever increasing containerization the number of seaport container
terminals and the competition among them has become quite remarkable. An up-
to-date survey and literature review on container terminal operations with an
operations research focus is provided by Steenken et al. (2004).
In this paper, we consider container terminal operations under the influence of
liner shipping strategic alliances. The focus of this paper is to provide a rough
overview and to discuss opportunities as well as possible risks and pitfalls. The
following sections are devoted to the description of shipping alliances, container
terminal operators as well as their linkage.
2 Liner Shipping Carriers: Behaviours and Trends
2.1 Vessel Types, Fleet Composition and Major Trade Lanes
Different types of ships are considered by shipping lines (see, e.g., Steenken et al.,
2004). While the number of container vessels has increased during the last decade
the most significant change has been the increase in vessel size (Slack et al., 2002)
with deep-sea vessels with a loading capacity of up to 8.000 container units (TEU,
Twenty-Foot Equivalent Units) and beyond. They were deployed approximately
by the end of the 1990s, and serve the main ports worldwide. Those 8.000 TEU
vessels are about 320 m long with a breadth of 43 m and a draught of 13 m; on
deck containers can be stowed 8 tiers high and 17 rows wide, in the hold 9 high
and 15 wide. Feeder vessels with a capacity of 100 to 1.200 TEU link smaller
regional ports with the oversea ports delivering containers for deep-sea vessels.
Inland barges are used to transport containers into the hinterland on rivers and
channels.

4 X. Shi, S. Voß
Generations Type of vessels TEU Speed (knots) / percentage that speed applied
1. 1960s 17000-20000 DWT 700-1500 15-19 / 58%
2. 1970s 40000-50000 DWT 1500-2500 18-21 / 70%
3. late 1970s Approximately 70000 DWT, Panamax
2500-4000 20-24/ 90%
4. late 1980s to early 1990s Panamax 4400-5000 23-25
5. 1996-1998 Post-Panamax (VLCS) 6400-7200 24-26
6. since 1999 Post-Panamax (VLCS) 8000 and beyond
24-26
7. after 2009 Suez-Max (ULCS) 12500-13000 25-26 expected
Post-Suez-Max 18000
Post-Malacca-Max
Table 1: Container ship generations
(DWT: Deadweight tonnage, VLCS/ULCS: Very/Ultra Large Container Ships)
Source: own composition from http://info.jctrans.com/wl/hy/hyzs/2006726279397.shtml,
http://www.nacks.com.cn/shiplist/5400dwt.htm,
http://www.globalsecurity.org/military/systems/ship/container-types.htm)
Over the previous decades, six generations of container vessels can be
distinguished, mainly according to their capacities but also regarding voyage
speeds; see Table 1. This also had and still has a great influence on container
terminal operations. The first generation of container ships was designed to be
operated in transatlantic and transpacific routes. The second generation of
container ships not only ensured bigger capacity but also shorter voyage time due
to increased speed. During the oil crisis in 1973 such fast vessels turned out not to
be economical any longer because of their huge consumption of fuel and
lubricating oil. The third generation of container ships appeared with increased
capacity and more economical and efficient market performance. Port operators
considerably increased handling efficiency to fit the capacities of new container
ships. From the third generation of ships to the fourth one, the number of seamen
per vessel decreased which led the port operators to improve their handling
technology and to catch up the new seamanship. The dimensional barrier of the
Panama locks had constrained the progression of ship sizes to about 4400 TEU,

Container Terminal Operations Under the Influence of Shipping Alliances 5
the so-called Panamax limit, until the middle of the 1990s (Slack et al., 2002).
Since then the so-called Post-Panamax-vessels began to challenge the depth of the
Panama Canal, lock chambers, passing bays and container berths; those were the
hardest parts for existing port operators to conquer. Actually, the depth limitations
could be regarded as one of the most important differences between terminals.
From then on, different container terminals were chosen by liner carriers as hubs
or feeder ports based on the natural advantages and prospective berth handling
technology.
Nowadays, even mega ships with well over 8000 TEU capacity, called the sixth
generation, are not “newly born babies” in the shipping industry. Liner companies
tempt to deploy more mega ships in their fleets, though there is a common sense
that merchant fleets should not be deployed by, e.g., only huge or only newly built
ships. This tendency also strongly pushes container terminal operators to catch up
the pace of bigger vessels, apply advanced technology and accomplish better
management information systems. It should be noted that some authors see a
possible risk in going beyond 8000 TEU (see, e.g., Müller and Schönknecht,
2005) although the currently planned extension of the Panama Canal might render
these calculations obsolete. Moreover, one can find the opinion that freight rates
of containerized cargo, namely Freight of All Kind (FAK), are not related to the
ship type (Shi, 2000). However, the bigger and faster the vessels are, the more
efficient they seem to be and the more likely it is to achieve economies of scale.
Regarding fleet composition liner companies build up their fleets and deploy types
of ships (e.g., with respect to size) on purpose. Due to the similarity between liner
shipping and airline service, problems and solutions of container fleet composition
refer to those of aircrafts; see, e.g., Listes and Dekker (2005) and Adrangi et al.
(1999). The problem for container terminal operators is to attract those types of
vessels in the fleets which best match their port performance and obtain higher
efficiency. In other words, one attempts to fractionise the target markets instead of
paying attention to all types of ships.
It should be noted that international shipping is an international trade and
globalization born service. Quality and price differentiation make the international
goods exchange necessary, meanwhile the trans-ocean lanes make it possible.
There are three major long distance lanes: the transpacific lane, the transatlantic
lane and the Far East-Europe lane. Those ports located along those three main
trade lanes with enough depth have a considerable competitive advantage as they
gain higher possibilities to be potential hubs. Other ports have to try every effort
to compete by cost leadership, service differentiation, etc.

6 X. Shi, S. Voß
2.2 History and Trend of the Liner Shipping Industry
The history of liner shipping conferences goes back about 130 years (see, e.g.,
Wang and Zeng, 1997) since the first conference was set up in 1875. In an attempt
to protect carriers in the conferences from the new steam ships serving trades to
India and the Far East, the traditional liner shipping companies established cartels
to control the important trades between these regions. Under the liner conferences
system, which has long been an established feature of the shipping industry, a
group of ship-owners of one or several nationalities serve a group of ports on a
given route (Branch, 1982). When there were around 150 liner shipping
conferences covering all trading routes around the world, the principle of
protecting members in the conferences from new competitors remained. Despite
opposition from the shippers exemption was granted from competition rules under
the Treaty of Rome based on which the conference system yielded the benefits for
their customers.
From the late 1980s liner shipping conferences were no longer fully responsive to
customers’ needs (Yoshida et al., 2001) (referring to, e.g., agility in supply chain
management and cost reductions) due to the following factors: barriers to trade
freedom, inflation on shipping prices, threats of shipping services and
monopolization in price fixing. The liner carriers were trying to meet customer’s
needs by designing logistics solutions. From a shipper’s point of view conferences
and the legal protection were seen as antiquated impediments to rational business
governed by market forces. Furthermore, the industry suffered from overcapacity
on many major lanes. At the beginning of the 1990s, new kinds of vessel sharing
arrangements were driven by overcapacity and customer service. It was a less
risky way of entering new lanes, increasing the number of sailings and providing
wider range of services while reducing overcapacity. At that time, freight
forwarders and ocean liner conferences were the ones most affected by vessel
sharing arrangements; the more capacity in line with demand, the less need for
conferences.
Strategic alliances in the liner shipping area have grown so dramatically in recent
years that they have received a great deal of attention from researchers. For
instance, the liner fleet planning and scheduling problem was treated by Xie et al.
(2000). A more comprehensive literature review is provided by Christiansen et al.
(2004). Ryoo and Thanopoulou (1999) suggest liner alliances in the globalization
era as an important strategic tool and Song and Panayides (2002) regard members
in alliances as game players from a game theoretic point of view. The definition of
alliances in a broader context, however, is not as uniform as it is in the area of
liner shipping. A liner shipping strategic alliance is a group of liners with a
specific agreement to share vessel space and improve service efficiency. Consortia
represent operational, technical or commercial agreements between different sea
carriers to pool some or all of their activities on particular trade routes (PC, 2004).

Container Terminal Operations Under the Influence of Shipping Alliances 7
However, “alliances represent agreements between carriers to cooperate on a
global basis” (Czerny and Mitusch, 2005). That is, the scope and extent of those
two kinds of cooperations are different.
Over time alliances between ocean carriers were nothing new by 1995. What had
accelerated in the early 1990s was an expansion of those alliances to cover almost
all major trade lanes. Although the number of such pacts was small, they involved
some of the world’s most dominant container ship operators. The goal of alliances
is to become more efficient with lower cost. On the one hand, liner carriers are
prepared to accept and implement new arrangements, which would reduce their
operational costs and provide service offerings at a small extra cost. On the other
hand, shippers welcome benefits like the increased sailing frequency.
The name of alliances Members
Grand Alliance Hapag-Lloyd, NYK Line, NOL, P&O
Global Alliance MOL, Nedlloyd, OOCL, APL(NOL), MISC
CKY COSCO, K-Line, YangMing
United Alliance Hanjin, DSR-Senetor, Cho Yang
Maersk Sealand
Evergreen
Table 2: Liner shipping alliances in 1995-1996 (Source: from www.snet.com.cn)
Table 2 shows the original position of liner shipping alliances around 1995-1996.
P&O and Nedlloyd merged in January 1997 while APL merged with NOL in
November 1997 which showed the combined membership from different alliances
(Grand Alliance and Global Alliance). That is, the membership of liner alliances
changed as well as their names. For instance, since 1998 the Global Alliance was
called ‘The New World Alliance’ (TNWA).
The name of alliances Members
Grand Alliance Hapag-Lloyd, NYK Line, P&O Nedlloyd, MISC, OOCL
TNWA MOL, APL, HMM
CKYH COSCO, K-Line, YangMing, Hanjin
United Alliance Hanjin, DSR-Senator, ChoYang
Maersk Sealand
Evergreen
Table 3: Liner shipping alliances in 1998-2001
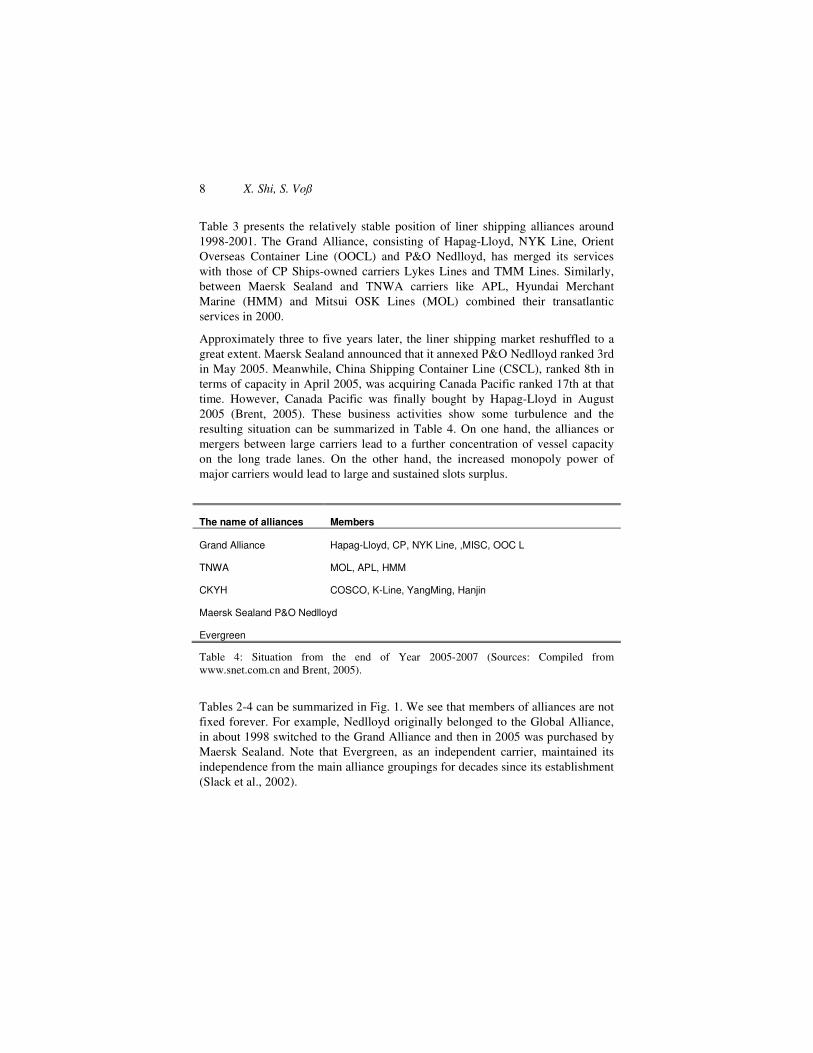
8 X. Shi, S. Voß
Table 3 presents the relatively stable position of liner shipping alliances around
1998-2001. The Grand Alliance, consisting of Hapag-Lloyd, NYK Line, Orient
Overseas Container Line (OOCL) and P&O Nedlloyd, has merged its services
with those of CP Ships-owned carriers Lykes Lines and TMM Lines. Similarly,
between Maersk Sealand and TNWA carriers like APL, Hyundai Merchant
Marine (HMM) and Mitsui OSK Lines (MOL) combined their transatlantic
services in 2000.
Approximately three to five years later, the liner shipping market reshuffled to a
great extent. Maersk Sealand announced that it annexed P&O Nedlloyd ranked 3rd
in May 2005. Meanwhile, China Shipping Container Line (CSCL), ranked 8th in
terms of capacity in April 2005, was acquiring Canada Pacific ranked 17th at that
time. However, Canada Pacific was finally bought by Hapag-Lloyd in August
2005 (Brent, 2005). These business activities show some turbulence and the
resulting situation can be summarized in Table 4. On one hand, the alliances or
mergers between large carriers lead to a further concentration of vessel capacity
on the long trade lanes. On the other hand, the increased monopoly power of
major carriers would lead to large and sustained slots surplus.
The name of alliances Members
Grand Alliance Hapag-Lloyd, CP, NYK Line, ,MISC, OOC L
TNWA MOL, APL, HMM
CKYH COSCO, K-Line, YangMing, Hanjin
Maersk Sealand P&O Nedlloyd
Evergreen
Table 4: Situation from the end of Year 2005-2007 (Sources: Compiled from
www.snet.com.cn and Brent, 2005).
Tables 2-4 can be summarized in Fig. 1. We see that members of alliances are not
fixed forever. For example, Nedlloyd originally belonged to the Global Alliance,
in about 1998 switched to the Grand Alliance and then in 2005 was purchased by
Maersk Sealand. Note that Evergreen, as an independent carrier, maintained its
independence from the main alliance groupings for decades since its establishment
(Slack et al., 2002).
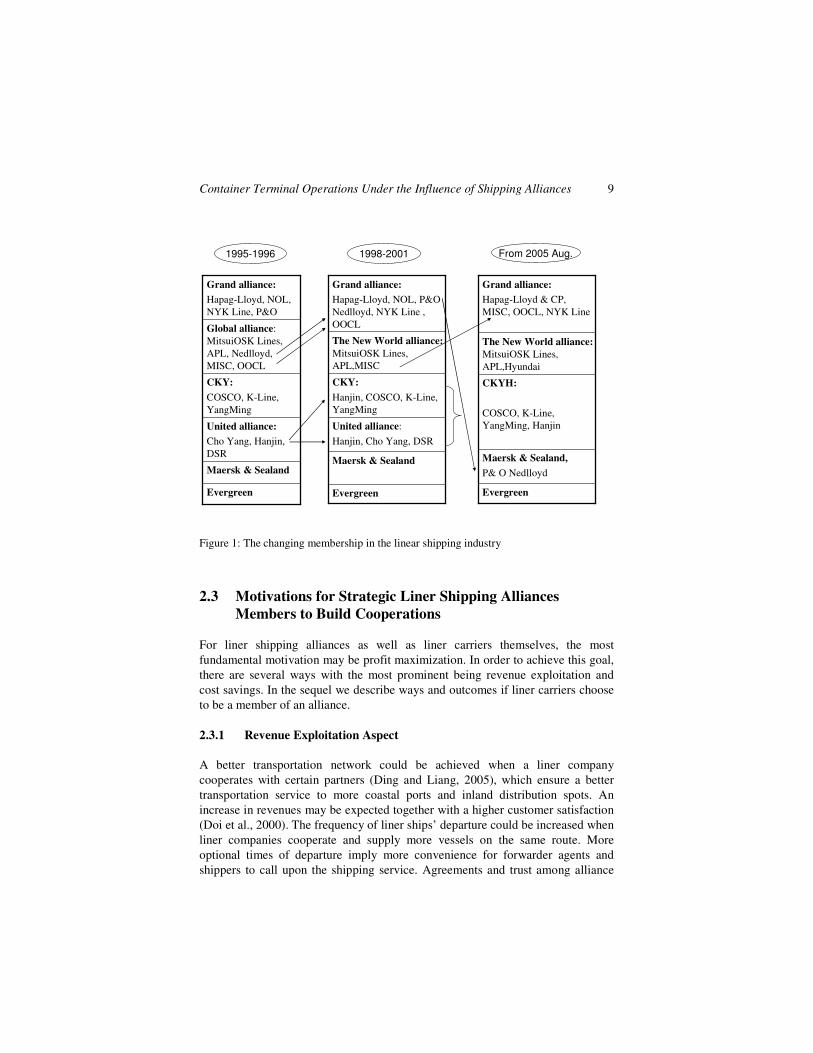
Container Terminal Operations Under the Influence of Shipping Alliances 9
Evergreen
Maersk & Sealand
United alliance:
Cho Yang, Hanjin,
DSR
CKY:
COSCO, K-Line,
YangMing
Global alliance:
MitsuiOSK Lines,
APL, Nedlloyd,
MISC, OOCL
Grand alliance:
Hapag-Lloyd, NOL,
NYK Line, P&O
Evergreen
Maersk & Sealand
United alliance:
Hanjin, Cho Yang, DSR
CKY:
Hanjin, COSCO, K-Line,
YangMing
The New World alliance:
MitsuiOSK Lines,
APL,MISC
Grand alliance:
Hapag-Lloyd, NOL, P&O
Nedlloyd, NYK Line ,
OOCL
Evergreen
Maersk & Sealand,
P& O Nedlloyd
CKYH:
COSCO, K-Line,
YangMing, Hanjin
The New World alliance:
MitsuiOSK Lines,
APL,Hyundai
Grand alliance:
Hapag-Lloyd & CP,
MISC, OOCL, NYK Line
1995-1996 1998-2001 From 2005 Aug.
Figure 1: The changing membership in the linear shipping industry
2.3 Motivations for Strategic Liner Shipping Alliances
Members to Build Cooperations
For liner shipping alliances as well as liner carriers themselves, the most
fundamental motivation may be profit maximization. In order to achieve this goal,
there are several ways with the most prominent being revenue exploitation and
cost savings. In the sequel we describe ways and outcomes if liner carriers choose
to be a member of an alliance.
2.3.1 Revenue Exploitation Aspect
A better transportation network could be achieved when a liner company
cooperates with certain partners (Ding and Liang, 2005), which ensure a better
transportation service to more coastal ports and inland distribution spots. An
increase in revenues may be expected together with a higher customer satisfaction
(Doi et al., 2000). The frequency of liner ships’ departure could be increased when
liner companies cooperate and supply more vessels on the same route. More
optional times of departure imply more convenience for forwarder agents and
shippers to call upon the shipping service. Agreements and trust among alliance

10 X. Shi, S. Voß
members make common actions such as general rate increases, seal fee collection,
etc., much more likely. Those surcharges, just to mention some, could increase
freight income.
The bargaining power of suppliers and customers greatly influence the final price
of goods or service contracts. Shippers, as the demand side, may face problems
regarding shipment, ports, inland transportation as well as ancillary problems
(Addico, 2000). Generally speaking, freight rates are negotiated by shippers (or
their agents) and carriers (Stewart et al., 2003). To avoid the above mentioned
problems, shippers should carefully pursue negotiations. A stronger liner alliance
makes it less possible for the shippers to propose varying (e.g., non-profitable
loads) and demanding desires when booking slots. Based on Porter’s Five Forces
Model (Porter 1980, 1991), shippers and forwarder agents have relatively less
bargaining power compared to liner carriers regarding negotiations, and prices of
the liner services posed by liner carriers are more accepted by shippers rather than
shippers controlling the transportation prices themselves. For a discussion of
competition policy and pricing see, e.g., Brooks et al. (2005).
2.3.2 Cost Savings Aspect
As the most important part of the total cost of ownership of liner carriers, fixed
costs could be sharply decreased if a liner company cooperates with others when
necessary. Carriers enter operational relationships to increase their service
offerings and, at the same time, to reduce their costs (Sheppard and Seidman,
2001). Liner companies would share vessels and slots with each other to meet the
sharply increasing freight desire without too large investments to build new
vessels or buy second-hand ships, or even other kinds of ships and then modify
them to carry containerized goods, as what had already happened to combined
ships (Douet, 1999). Moreover, ‘flagging out’ is also an adopted means to cut
down the total operation cost (Li and Wonham, 1999, Veenstra and Bergantino,
2000). Privatization or part privatization of state-owned carrier firms could be a
possible way, too (Roe, 1999). For a detailed and comprehensive quantitive
analysis of investments see Veenstra (1999), Goss and Marlow (1997) and Mc
Williams et al. (1995).
Electronic Data Interchange (EDI) and related information sharing of course saves
companies’ cost. There is a trend in key-organizational relationships in the
community going along with the emergence of E-Business (Martin and Thomas,
2001). EDI offers economic and strategic advances and can be regarded as an
advanced tool for modern logistics (Lee et al., 2000). Moreover, more efficient
handling and stowage could also result in the ability of handling a considerably
larger amount of freight in the same amount of time under the restriction of
limited resources (Ambrosino et al., 2004, Steenken et al., 2004). To minimize the
total time of stay at port of a vessel, an optimized container stowage planning is,
without any doubt, necessary, which calculates the suitable placement of
Container Terminal Operations Under the Influence of Shipping Alliances 11
containers in a container-ship (Wilson and Roach, 2000, Steenken et al., 2004).
Here we may consider, e.g., space restrictions at many major ports that do not
allow for considerable expansion of terminals in many ports worldwide. This may
include automatization processes with highly qualified back-office personal
instead of low cost workers for manual handling processes. Furthermore, more
and more shipping carriers are willing to share pertinent data with port operator
companies. It could save not only the shipping companies’ cost but also the
operator companies’ cost.
Besides information sharing among shipping carriers and port operators, members
in alliances sometimes share their port operation services as well. They share the
same authorities and rights of fast handling to save total waiting and handling time
when container vessels visit ports. A stronger liner alliance pushes port operators
towards re-thinking and re-judging the bargaining power of the liner carrier
companies as they are very important customers. Actually, successfully attracting
one liner company does not mean its other cooperators in the alliance would come
to visit the port as well, while loosing one liner company may lead to a worse
situation of loosing all the liner companies in this alliance as customers. This is
one of the reasons why port operators pay lots of attention to the influence of
shipping alliances.
Till now, as sketched in Fig. 2, we have discussed two main aspects which
motivate liner shipping companies to set up short-run cooperations and long-run
alliances (see also Shi and Voß (2006)), including revenue exploitation and cost
savings as mentioned above. Especially service sharing and bargaining power are
related to port operations. Liner companies (sometimes on behalf of shippers) set
forth their desires of vessel visiting, cargo handling, short-time storage and
logistics services (Steenken et al., 2004), while port operators undertake great
efforts to provide timely and agile services. It is significant for port operators to
predict trends of container transportation and analyse the influence of shipping
alliances advertently.

12 X. Shi, S. Voß
Figure 2: Motivations and linkages between liner carriers and port operators
2.4 Resistance to the Strategic Liner Shipping Alliances
Forming an alliance can definitely offer various benefits but at the same time
contain some drawbacks due to turbulence, unpredictable circumstances and
various objectives (Song and Panayides, 2002). Moreover, risk considerations are
of utmost importance (see, e.g., MacDonald, 2004).
First, overcapacity is blamed for the poor financial performance and economic
inefficiency over the long-term history of the liner shipping industry (Yoshida et
al., 2001). Some liner carriers differentiate themselves in terms of services
offered, low freight price (e.g., China Shipping and MSC) or high quality service
(e.g., Maersk Sealand). Integrating these different kinds of liners too tightly into
an alliance with the corresponding requirement for “seamlessness” may pose
problems. In alliances there is still much uncertainty and ambiguity. Sheppard and
Transportation Network
Departure Density
Common Actions
Bargaining Power
Total Cost and Fixed Cost
Data Sharing
Service Sharing
Income Exploiting Cost Saving
Liner Shipping Companies/Alliances
Port Operators
Customers
Suppliers

Container Terminal Operations Under the Influence of Shipping Alliances 13
Seidman (2001) discuss that liner carriers prefer to gain the benefits without
having to ally on or to merge with other carriers. Therefore, the real long-term
goal of large carriers is to improve their own service offerings, regardless of
whether the improvement is through an alliance or a merger. Furthermore, a series
of cross-alliance mergers and acquisitions had forced the alliances to restructure
and/or modify their partner base (see above as well as Midoro and Pitto, 2000).
Based on this one may conclude that relationships between partners are hard to
predict; today’s partners may be tomorrow’s rivals (Kleymann and Seristo, 2001).
Second, even if a liner shipping company becomes a member of an alliance, it
might not behave or share the profit as fair as it is supposed to be. There are
possible factors that make the relationship among members in an alliance “unfair,”
which later could lead to some turbulence of the membership and the alliance
itself. Podolny and Morton (1999) examine whether the social status of an entrant
owner impacts the predation behaviour of the incumbent cartels. They show that
so-called high social status entrants are significantly less likely (40%) to be preyed
upon than low social status entrants. Social status could be regarded as one of
those factors which resist the development of liner shipping alliances.
Third, the United States Government still regarded shipping lines as a “controlled-
carrier” under the Ocean Shipping Reform Act 1999 (Rimmer and Comtois,
2002). As a result, state-owned liner companies have to give their 30 days notice
of any changes in freight rates, while other private-owned liner companies also
have to provide a 24 hours notice to the American Communication
Administration. This is a means of the American government to prevent or reduce
monopoly in the shipping industry. Their aim is to build up free and fair market
structures all around the world.
Not only the USA but also some European countries claim the anti-cartel
authorities to decrease the possibility of cartels, conferences, alliances and other
kinds of monopoly. As reported by the OECD “the liner industry is no different
than other global industries and, therefore, they require no special protection or
privileges particularly in the area of setting prices” (ESC, 2004). In other words,
liner conferences are not welcome in the shipping industry if one considers
shippers’ requirements and governments’ regulations. Then, as the successors of
liner conferences, consortia and alliances are still under the threat of being
challenged by anti-cartel or anti-trust regulations, the existing liner shipping
structure would change if those kinds of regulations take effect as strongly as they
are expected.
No matter whether there are liner alliances or only independent carriers (suppose
the alliances come to an end under anti-cartel regulations) in the liner shipping
industry, port operators follow what the carriers and shippers demand. It seems
that there are no explicit links between anti-cartel regulations and port operations.
However, if we take into account the behavioural differences of liner conferences,
alliances, consortia and independent carriers, there is an indirect effect, which

14 X. Shi, S. Voß
even comes from regulations, on port operators. Usually members of liner
conferences want to earn as much revenue as possible by fixing the freight price
(ESC, 2004) together with a considerable bargaining power when negotiating with
port operators, which let port operators always try hard to cut down the handling
costs (labour and operational). If liner shipping structures would be destroyed by
anti-cartel regulations, alliances and consortia turn to be individual carriers who
should attract shippers not only by cost leadership but also service differentiations.
Then port operators switch to provide specific and agile handling services to
carriers and shippers instead of only low handling charges.
However, if anti-cartel or anti-trust regulations do not take effect, there would be
great threats and challenges to the existing port operators because liner alliances
and consortia tend to be much more powerful without barriers of the regulations.
Those top liner corporations would like to enlarge their berth investment and
maybe even build large dedicated ports all around the world, which make the
regional port operation competition much fiercer compared to the current
situation. To summarize, port operators should pay attention to those “indirect”
regulations as well.
3 Linkage Between Liner Shipping Carriers and
Container Terminal Operators
Vessel types, port handling methods and cargo characteristics are three vital
factors which affect the freight rate and market trend a lot. Those factors even
affect each other revealing that port operator company’s decision makers should
be conscious of both of the other two sides simultaneously. Fig. 3 shows the
triangle connection of carriers, operators and shippers, which could be a more
comprehensive explanation. Based on this figure, we attempt to deepen our
discussion by ordering shipper/cargo, carrier/vessel and operator/handling
processes.

Container Terminal Operations Under the Influence of Shipping Alliances 15
Figure 3: Triangle connection within the shipping industry
The shipper charges the cargo transportation fee and puts forward the
transportation desire, too. There is an explicit contract between the shipper and the
carrier, namely a service contract, which is always represented as bill of lading
(B/L). From the aspect of maritime law, the B/L should not be called service
contract itself (Si, 2005), but it is an important certificate of a liner service
contract, which notes and defines the port of origin, port of discharge, place of
delivery, vessel name, voyage number, cargo description, seal and container
number, service type (CY-CY, CFS-CFS, Door-Door, etc.), insurance, risk
allocation, payment method (prepaid or collect) and sometimes the freight rate,
too. Among those, service types and handling processes force container terminal
operators to think about an optimal utilization of their instruments and resources.
Even if there is no direct contract between the shipper and the port operators, the
shipper informs about his desire regarding a service contract, which is between
him and the carrier. Then the carrier signs the handling agreement with the port
operator, which means that there is at least an indirect linkage between shipper
and port operator. Meanwhile, the handling processes may still be affected by
cargo characteristics, such as bulk cargo, chemical cargo, liquid cargo and
liquefied gases, etc. Different cargo may require totally different transportation
needs and handling processes. For instance, the transportation and handling of oil
products are related to local and regional supply/demand imbalances, refinery
inputs, outputs and utilization rates, storage considerations, product quality
differences, price differentiation, seasonal variations, and port traffic, etc.
(Yamaguchi, 1999). Even if we focus on container terminal operations, there are
many different kinds of containers which contain a variety of goods, such as
normal dry container, hang container, flat container, high cube, open-top
container, reefer container and dangerous cargo container, etc.
Shipper/Cargo
Port Operator/
Handling Process
Carrier/Vessel Service Contract
Handling Agreement No direct contract

16 X. Shi, S. Voß
Figure 4: Cargo types
Among the cargo types mentioned in Fig. 4, dry and packed cargo, especially if it
is clean cargo, would be the most normal one transported by container carriers.
Some containerised bulk, such as rice and corn, could also be suitable to be
containerised. Furthermore, fresh cargo needs to be transported in reefer
containers, which need special locations with respective equipment. As mentioned
by Steenken et al. (2004), dangerous cargo in containers is not a frequent issue in
every port, and it is more demanding with respect to the temperature control,
pressure check-up, manifest location etc. To be an efficient berth providing
satisfactory handling and short-time storage, the terminal operator should first
choose its target customers, especially if it does not get enough investment to
develop plugs and special yard equipment. Even if it is possible to manage special
cargo handling, operational managers still need to estimate and analyse when
demanding cargo is going to visit and be handled. Briefly, the linkage between
carriers and port operators does not only rely on the carriers’ vessel, but also on
specific transportation desires promoted by shippers and cargos.
The number of ports that a fleet visits depends on the length of trade routes
together with the number of vessels in the fleet. Because of the trend of VLCS, the
price of new ships increases accordingly which pushes the liner companies to
strive towards reducing the number of vessels in a fleet if possible (Yang, 2004).
Based on that, the time period of round voyage is shortened to ensure periodical
(say, weekly) services with reduced number of vessels; the number of port callings
decreases, however, the lifts per call increase (Yang, 2004). It is certainly
desirable for a port to become one of those reduced from the alliance’s former
calling of ports, which leads, to a great extent, to revenue decrease, too. This is
seen as a major linkage between the trend of liner carriers and the future of port
operators. In other words, this is why port operators concern so much about
terminal operations under the influence of shipping alliances.
Cargo
Stowage location: In haul / On deck
Batch: Bulk / General cargo
Status: Dry cargo / Liquid cargo
Package: Bulk / Packed cargo
Characteristic: General cargo / Special cargo

Container Terminal Operations Under the Influence of Shipping Alliances 17
4 Container Terminal Operators: Behaviours and
Trends
Considering the history of port operations, different development stages can be
observed; see Table 4. Before the 1950s, ports were acting as centres of
transshipment and delivery, also including the storage of cargo. During the 1950s
up to the 1980s, ports provided more functions, such as value added service and
commodity export and import clearance, which let the shippers and carriers feel
more convenient. Since the 1980s, ports more and more act as distribution centres
in the whole logistics network while, at the same time, also serving as information
platform.
Generation 1 Before the 1950s Centre of transshipment, delivery, short time
storage
Generation 2 1950s-1980s Centre of services, value added function,
commodity area
Generation 3 After the 1980s Centre of logistics, distribution and information
Table 4: Port operations development
It should be noted that storage is always a function of utmost importance.
However, in order to increase berth efficiency, storage functionality should only
be available for short term storage. For long term storage it seems advantageous
for containers to be delivered to special container yards or container freight
stations.
The role of ports exceeds the simple function of services to ships and cargo. Apart
from their role as the traditional sea/land interface, ports are a good location for
value-added logistics, in which members of different channels can interact
(Bichou and Gray, 2004). Besides acting as centres of transshipment and services
(Generations 1 and 2 in Table 4), the ports of the third generation also act as
dynamic nodes in international production and distribution networks (Carbone and
Martino, 2003). Furthermore, the separation of responsibility for infrastructure and
services and the transfer of regulatory power from landlord ports to independent
regulatory authorities are what European and world ports face currently or will
face in the near future (Farrell, 2001). Nevertheless, how far a port can develop
not only relates to the regulations it take and the ambition of its decision maker,
but also depends on the following factors: port tradition and organization, port
accessibility, state aids, port productivity, port selection preferences of carriers
and shippers, comparative locational advantage (Fleming and Baird, 1999).
18 X. Shi, S. Voß
After analysing the existing container terminal operators’ behaviours (see Table
4), a brief summary of the cooperations is given. Vertical cooperation with liner
companies, horizontal cooperation with other top-standard port operators and
other possibilities with 3PL or 4PL are all of great importance, recently. Actually,
the liner shipping strategic alliances consist of liner shipping companies; similarly,
horizontal cooperations consist of port and terminal operators, such as, e.g.,
Hutchinson Port Holdings and PSA (Port of Singapore Authority). Then there are
similarities between those two kinds of cooperations, say, shipping alliances and
port operators’ cooperation: both of them are set up among those who provide
nearly the same services; members all have relatively large capitals to manage;
members are partners, to some extent, and competitors as well.
4.1 Vertical Cooperations
We define vertical cooperations as cooperations with other players in a supply
chain, e.g., shippers, carriers, freight forwarders, vessel maintenance, etc. In the
sequel, advantages that could be gained from vertical cooperations are listed and
explained.
Decrease the total service time and waiting time in port
When port operators cooperate with carriers with respect to the sharing of data,
e.g. through EDI, and information system integration, remarkable time and cost
saving could be expected. For a more detailed and comprehensive literature
review see Steenken et al. (2004) whose survey focuses on optimization of port
operation processes. Note that there may be arguments why mega ships should
choose longer routes and visit highly efficient ports in order to save total service
time in ports and waiting time in anchorage grounds (Xu, 1996).
Compete with carriers on bargaining power
On one hand, the more members an alliance has, or the bigger its fleet is, the
stronger oligopolistic economic power and competitive advantages it has when
negotiating with port operators (Panayides and Cullinane, 2002). Port operators
are supposed to accept and offer a lower wholesale price rather than a higher retail
handling price; port operators, as any company in general, do not only concern the
short-term profits but also long-term profits. That is, their objective is net present
value maximization (Kamien and Schwartz, 1971).
On the other hand, we could also view terminal operations as the centre of the
Five Forces Model. Certainly this could lead to another competitive structure. But
those structures should be interrelated and useful for both, the terminal operators

Container Terminal Operations Under the Influence of Shipping Alliances 19
and liner alliances. Based on the above discussion, if port operators cooperate with
liners and set up a vertical cooperation, which could be a better means to apply
common profits instead of contradictory bargaining powers, then both, liner
companies and terminal operators, could obtain a ‘win-win’ result (see Table 5).
Fixed
Costs
Direct fixed cost Operating cost
Labor cost
Repair & maintenance cost
Lubricant storage
Administration fee
Indirect fixed cost Capital cost Vessels depreciation
Lending cost loan interests
Variable
Costs Voyage cost
Fuel cost
Port service cost
others
Table 5: Cost composition of carriers
When cooperations exist between carriers and port operators, they could sign
long-term handling agreements or even port facilities investment and utilization
agreements, which benefit both sides. For example, COSCO and HIT set up a new
company COSCO-HIT, which is a typical vertical alliance as they combined the
carrier-COSCO and its terminal service supplier HIT. Vertical alliances could
largely develop international competitive advantages.
Service-oriented district allocation in port
Nowadays, carriers attempt to provide different transportation services to their
customers, shippers, booking agents, and cargo owners, including long lane
services and short lane shuttling service. Due to the differences between those two
services, their service areas should be allocated accordingly in order to reach
higher efficiency. Vertical integration between global carriers and terminal
operators is regarded as a good means to achieve better financial power and
technical capability (Midoro et al., 2005). For example, mega ships should choose
deep, long berths and big container yards. But as for the average handling rate,
those shuttling vessels are more demanding. That is, all of the berths should firstly
set the oriented target customers and set up their values, versions and missions
accordingly. Berths without sufficient depths and without sufficiently large
20 X. Shi, S. Voß
container yards should provide fast handling service to shuttle vessels (for
considerations regarding hinterland container terminals see Gronalt et al., 2003).
Considering the similarity between the airline industry and the liner shipping
industry, we could expect those short lane shuttle services as successful as some of
the so-called low-cost carriers in the airlines industry.
Investment in container building and renting
Most of the top liner shipping companies, such as Maersk Sealand, COSCO,
CSCL, are stock holders of some container building companies. Liner companies
try to reduce cost and achieve stability to defend against the turbulent market by
building containers themselves or renting containers from the companies in which
they invest. While the capability to defend against the turbulence is an advantage,
there are also some disadvantages. The investment and the complex control of
container return usually concerns managers of liner companies. Then there may be
a good chance for port operators to attract liners by improving empty container
renting and returning services. Liner shipping companies, in general, bought a
number of containers and provided them to those shippers who do not have
containers themselves. Those containers are costly, especially when they could not
be returned in time, delaying in some unknown ports due to inefficient
management information systems. To solve this problem to some extent, some of
the liner shipping companies, e.g. COSCON and CSCL, even invested in
container building factories. On the contrary, the liner shipping companies would
save lots of capital if they do not need to pay attention to and invest in the
container building industry. The limited capital should be used to build new mega
ships and enlarge fleets, which might bring larger revenues.
Port operators already have experiences to store and handle empty containers
making it more likely and much easier for them to enter the container building and
renting sub-industry. Furthermore, experienced storage and handling of full and
empty containers make it possible for shippers and carriers to accomplish timely
clearance and departure. In short, besides those traditional activities and services
(e.g. stores, water, medical aid, telephone service, bunkering, ship waste disposal)
(Yahalom, 2002, Vanelslander, 2005), investing in the container building and
renting sub-industry might also be a good way for port operators to improve
services and attract carriers.
4.2 Horizontal Cooperations
We define horizontal cooperations as those cooperations with other port operators
who should actually be competitors and partners at the same time. In other words,
two or even more port operators set up a cooperative structure or even invest in a

Container Terminal Operations Under the Influence of Shipping Alliances 21
joint company providing handling service, based on regional cooperations or
international cooperations, if any.
Regional Cooperations
When comparing the regional cooperations among world top ports and local
governments, some similarities can be found and the incentives of regional
cooperations deserve discussion as well. In the survey of Slack et al. (2002) there
appeared 470 additional ports of call in 1999 compared to 1989, which indicates
an intensification of liner service offerings during that decade. As bigger container
vessels are launched and being deployed, the constraints of berth depth,
considering cross-sections of ULCS, become an utmost factor of being regional
hubs. Those ports with enough depth, aiming at becoming regional hubs, are
conscious of the importance of distribution networks. They attempt to cooperate
with local governments and other ports to ensure fast customs clearing and
shuttling services for the feeder lanes. Meanwhile, smaller ports in the same
regions welcome this kind of cooperation; otherwise they are loosing future
throughput due to their depth limitations. This can be seen as incentive of regional
cooperation among local governments, potential hubs and feeder ports.
As an example (from the USA in 1990; Hershberg, 1995) consider the
Philadelphia Regional Port Authority (PRPA), which was created between the
State and Bucks, Delaware and Philadelphia Counties. The cooperation proved to
be a win-win situation which benefited both the city and the port. For the port
aspect, its competitive position was greatly improved by the financial support
from the city and the affiliation of PRPA and South Jersey Port Corporation under
the auspices of Delaware River Port Authority.
Regional cooperations not only exist between a port city and a port authority, but
also among a few port operators who originally compete along the same seacoast
and its hinterland. For example, in Europe, ports are confronted with a closer
integration in the maritime and shipping industry (Heaver et al., 2000). An
interesting case happens to be the so-called North Range in Europe. Despite fierce
competition between different harbours, e.g., a terminal operator may in fact
operate terminals in different ports such as Hamburg and Bremen (Germany).
Moreover, there is a controversial discussion whether shares of the HHLA
(Hamburger Hafen und Logistik AG) may be sold to regionally close
“competitors.”
Regional cooperation also happens in the Yangtze River Delta (YRD), mid-east
coast of China. Wang and Slack (2004) analyze the competition, cooperation and
governance of Shanghai and Ningbo. It is mentioned that the foundation of this
cooperation was not enough; lack of good regional port governance, caused by
structural problems in administration, was still a burden for larger throughput in
YRD.

22 X. Shi, S. Voß
Realizing the competitive advantages of Shanghai port, Hongkong and Shenzheng
port faced the challenges by decreasing throughput (Cullinane et al. 2004).
Shenzhen port cooperated with Hong Kong for experienced management skills at
the same time. These two ports, certainly with several port operators provide
handling services there, set up regional cooperation though they are, as a matter of
fact, still competitors to great extent.
Partners of regional cooperation among ports should be carefully selected. As
Thorhus and Lindstad (2006) mention, the difficulties in cooperating with other
companies are an important factor that let the cooperations finally split. A better
and effective way to keep the cooperation in a relative long duration is to choose
those potential partners with similar characteristics (Pando et al., 2005), who
admit similar business values, visions and missions.
International Cooperations
Although based on the facts of the increase of ports of call together with
intensification of visits of hubs, a very different picture of international
cooperations is presented compared to the incentive of regional cooperations. For
international cooperations, among best practice terminal operators, technology
transfer, management skill improvement, risk pooling and profit sharing seem to
be reasonable motivations.
PSA engages in mergers and acquisitions and ‘globalises’ its activities through
overseas ownership of port terminals and logistic firms (Rimmer, 1998). In 2004,
PSA and SCT (Shanghai Container Terminal Company) gave the port industry a
new way of international cooperation by holding stocks of each other instead of
cash investment, take over or merger and acquisitions. As shown in Fig. 5, the
stock exchange ensures that both partners jointly share the profits and benefits in
the recently opened Shanghai Yangshan port (cf. www.nanfangdaily.com).
From SCT’s perspective, cooperation with PSA provides a good chance to learn
advanced management skills of top standard terminal operations, and newly
invented technology. From PSA’s perspective, investing in SCT ensures better
profits in the future no matter whether Singapore or Shanghai becomes the
regional mega hub along the Asian coast.
A crucial foundation to any type of cooperation mentioned above, such as vertical
or horizontal, regional or international, are advanced management information
systems and appropriate system integration.
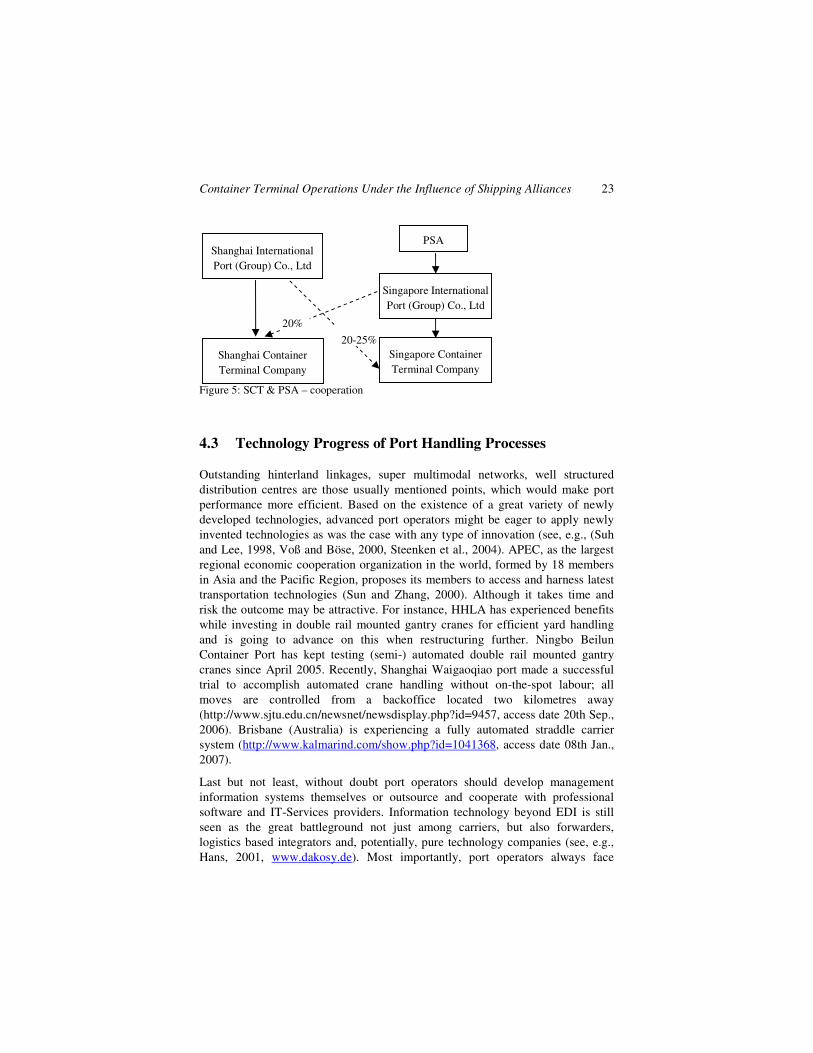
Container Terminal Operations Under the Influence of Shipping Alliances 23
Figure 5: SCT & PSA – cooperation
4.3 Technology Progress of Port Handling Processes
Outstanding hinterland linkages, super multimodal networks, well structured
distribution centres are those usually mentioned points, which would make port
performance more efficient. Based on the existence of a great variety of newly
developed technologies, advanced port operators might be eager to apply newly
invented technologies as was the case with any type of innovation (see, e.g., (Suh
and Lee, 1998, Voß and Böse, 2000, Steenken et al., 2004). APEC, as the largest
regional economic cooperation organization in the world, formed by 18 members
in Asia and the Pacific Region, proposes its members to access and harness latest
transportation technologies (Sun and Zhang, 2000). Although it takes time and
risk the outcome may be attractive. For instance, HHLA has experienced benefits
while investing in double rail mounted gantry cranes for efficient yard handling
and is going to advance on this when restructuring further. Ningbo Beilun
Container Port has kept testing (semi-) automated double rail mounted gantry
cranes since April 2005. Recently, Shanghai Waigaoqiao port made a successful
trial to accomplish automated crane handling without on-the-spot labour; all
moves are controlled from a backoffice located two kilometres away
(http://www.sjtu.edu.cn/newsnet/newsdisplay.php?id=9457, access date 20th Sep.,
2006). Brisbane (Australia) is experiencing a fully automated straddle carrier
system (http://www.kalmarind.com/show.php?id=1041368, access date 08th Jan.,
2007).
Last but not least, without doubt port operators should develop management
information systems themselves or outsource and cooperate with professional
software and IT-Services providers. Information technology beyond EDI is still
seen as the great battleground not just among carriers, but also forwarders,
logistics based integrators and, potentially, pure technology companies (see, e.g.,
Hans, 2001, www.dakosy.de). Most importantly, port operators always face
Shanghai International
Port (Group) Co., Ltd
Shanghai Container
Terminal Company
Singapore International
Port (Group) Co., Ltd
20%
20-25%
Singapore Container
Terminal Company
PSA

24 X. Shi, S. Voß
unscheduled incidents beyond any schedule, either by preventive or by reactive
strategies. In this case, advanced management information systems (see, e.g.,
O’Brian, 2002) should be useful.
Figure 6: Internet worked e-Business enterprises (IEE)
Setting an information system shared with customers (in this case, carriers,
shippers, customs, forwarders and so on) does not mean that they have the same
authorities. Networks should distinguish intranet, extranet and internet to make the
information and business efficient and secure (see Fig. 6). For instance, the carrier
could authorise his forwarder or freight agents by digital signature to issue a B/L
on behalf of the carrier himself; customs, carriers and port operators share cargo
status and container/seal numbers, etc.
4.4 Possible Restructuring of Transportation Services
A successful port operator, like a successful player in a business game, must be
well prepared to constantly both meet the existing desires and adopt the coming
new roles in order to cope with the changing market environment (Notteboom and
Winkelmans, 2001). Attention has to be paid to the competition of the port in new
environments in restructured markets (Heaver et al., 2000) including end-to-end
services, pendulum visit lanes (Notteboom, 2005), and hub-feeder/spoke networks
Suppliers IEE
E-Commerce
Websites
Related Agents
Customers Extranet
Internet
Internet
Intranet
Internet
Extranet

Container Terminal Operations Under the Influence of Shipping Alliances 25
(Hayuth and Fleming, 1994). A proper integration of any player in shipping and
port economics needs to cope with the recent challenges in globalization and
supply chain management (see, e.g., Wang and Cullinane, 2006). As mentioned by
McCalla et al. (2005), it is the growth of transshipment that drives the most
important developments in port traffic and facilitates the selection of hub ports. It
is even speculated that more and more ports could lose existing positions as hub
ports until finally only very few mega hubs survive (Payer, 1999 and De Monie,
2001, Baird, 2005).
5 Conclusions
Shippers are discovering that in today’s ever-changing liner industry, the question
is not where your cargo is but who is carrying it. Furthermore, the carriers are
paying more attention to who the port operator is together with the location of the
port. As a result, port operators should take into account those shippers and
carriers desires, improve their handling services by vertical and horizontal
cooperations to increase customers’ satisfactions and loyalties as much as possible
by means of re-structuring their service processes, management information
systems, etc. Based on related background that we have provided in this paper our
exposition may also be seen as a research outline when discussing the shipping
industry as well as port economics. One of the further research directions could be
the social status’ effect on the cooperation among the port operators. Similar to the
effects on shipping alliances this factor could affect the relationship, negotiation,
development of port cooperations as well. While this paper cannot be
comprehensive to touch all possible issues in-depth, we strongly believe that the
thoughts as well as the pointers to appropriate literatures and the references therein
can serve as helpful entry into this field of research with important real-world
implications.

26 X. Shi, S. Voß
REFERENCES
Addico, M.T., (2000). African shippers’ organizations: the Ghanaian experience. Maritime
Policy & Management 27(2), 121-132.
Adrangi, B., Chow, G. and Raffiee, K., (1999). The effects of market structure and
technology on airline fleet composition after deregulation. Review of Industrial
Organization 15, 77-88.
Ambrosino, D., Sciomachen, A. and Tanfani, E., (2004). Stowing a containership: the
master bay plan problem. Transportation Research Part A: Policy and Practice 38(2),
81-99.
Baird, A.J., (2005). Optimising the container transhipment hub location in Northern
Europe. Journal of Transport Geography xxx, article in press, accessable at
http://www.scapaflowhub.org/ContainerBaird.pdf.
Bichou, K. and Gray, R., (2004). A logistics and supply chain management approach to
port performance measurement. Maritime Policy & Management 31(4), 47-67.
Blauwens, G., De Baere, P. and Van De Voorde, E., (2006). Transport Economics. 2nd
Edition. De Boeck, Antwerp.
Branch, A.E., (1982). Economics of Shipping Practice and Management. Chapman and
Hall, London and New York.
Brennan, J., (2001). Measurement approaches: port capacity management. Paper presented
at Marine Board Seminar on Waterway and Harbor Capacity, 23 April 2001,
http://gulliver.trb.org/conferences/2001Waterway%26Harbor/Brennan.pdf.
Brent, J., (2005). TUI wins over CP ships for $2-billion.
http://www.theglobeandmail.com/servlet/Page/document/v4/sub/MarketingPage?user_
URL=http://www.theglobeandmail.com%2Fservlet%2Fstory%2FRTGAM.20050821.w
cpcpc0821%2FBNStory%2FBusiness%2F%29&ord=1125892481700&brand=theglobe
andmail&force_login=true. Accessed on 22nd August 2005.
Brooks, M.R., Button, K. and Nijkamp, P., (Editors) (2005). Maritime Transport, Edward
Elgar, Cheltenham.
Christiansen, M., Fagerholt, K. and Ronen, D., (2004). Routing and scheduling: status and
perspectives. Transportation Science 38(1), 1-18.
Cullinane, K., Wang, T.F. and Cullinane, S., (2004). Container terminal development in
mainland China and its impact on the competitiveness of the port of Hong Kong.
Transport Reviews 24(1), 33-56.
Cullinane, K., (2005). Editorial: key themes in shipping economics research. In Cullinane,
K. (Edited). Shipping Economics. 1-17. Elsevier, Amsterdam.
Czerny, A. and Mitusch, K., (2005). Cooperation and Competition in the Cargo Liner
Shipping Industry.
De Monie, G., (2001). Re-evaluating the economics of transshipment. The Terminal
Operation Conference & Exhibition.

Container Terminal Operations Under the Influence of Shipping Alliances 27
Ding, J.F. and Liang, G.S., (2005). Using fuzzy MCDM to select partners of strategic
alliances for liner shipping. Information Sciences 173(1-3), 197-225.
Doi, M., Ohta, H. and Itoh, H., (2000). A theoretical analysis of liner shipping conferences
and strategic alliances. Review of Urban and Development Studies 12(3), 228-249.
Douet, M., (1999). Combined ships: an empirical investigation about versatility. Maritime
Policy & Management 26(3), 231-248.
ESC (European Shippers’ Council), (2004). What Shippers Require from Liner Shipping in
the Future and Why.
Farrell, S. (2001). Comment-If it ain’t bust, don’t fix it: the proposed EU directive on
market access to port services, Maritime Policy & Management 28(3), 307-313.
Fleming, D.K. and Baird, A.J., (1999). Some reflections on port competition in the United
States and Western Europe. Maritime Policy & Management 26(4), 383-394.
Fremont, A. and Ducruet, C., (2005). The emergence of a mega-port-from the global to the
local, the case of Busan. Tijdschrift voor Economischen en Sociale Geografie 96(4),
421-432.
Goss, R. and Marlow, P., (1997). Investment incentives for British shipping: a comment on
recent work. Maritime Policy & Management 24(4), 389-391.
Gronalt, M., Hartl, R.F. and Reimann, M., (2003). New saving based algorithms for time
constrained pickup and delivery of full truckloads. European Journals of Operational
Research 151(13), 520-535.
Hans, J.F.P., (2001). Developments in global seatrade and container shipping markets: their
effects on the port industry and private sector involvement. International Journal of
Maritime Economics 3(1), 3-26.
Hayuth, Y. and Fleming, D., (1994). Concepts of strategic commercial location: the case of
container ports. Maritime Policy & Management 21(3), 187-193.
Heaver, T., Meersman, H., Moglia, F. and Van De Voorde, E., (2000). Do mergers and
alliances influence European shipping and port competition? Maritime Policy &
Management 27(4), 363-373.
Hershberg, T., (1995). The case for regional cooperation. The Regionalist 1(3).
Huybrechts, M., Meersman, H., Van De Voorde, E., Van Hooydonk, E., Verbeke, A., and
Winkelmans, W. (Editors), (2002). Port Competitiveness – An Economic and Legal
Analysis of the Factors Determining the Competitiveness of Seaports. De Boeck,
Antwerp.
Kamien, M.I. and Schwartz, N.L., (1971). Limit pricing and uncertain entry. Econometrica
39(3), 441-454.
Kleymann, B. and Seristo, H., (2001). Levels of airline alliance membership: balancing
risks and benefits. Journal of Air Transport Management 7, 303-310.
Lee, T.W., Park, N.K., Joint, J.F. and Kim, W.G., (2000). A new efficient EDI System for
container cargo logistics. Maritime Policy & Management 27 (2), 133-144.

28 X. Shi, S. Voß
Li, K.X. and Wonham, J., (1999). Who is safe and who is at risk: a study on 20 year record
on accident total loss in different flags. Maritime Policy & Management 26(2), 137-
144.
Listes, O. and Dekker, R., (2005). A scenario aggregation-based approach for determining a
robust airline fleet composition for dynamic capacity allocation. Transportation
Science 39(3), 367-382.
MacDonald, A., (2004) Ocean Liners: Does size really matter? World Trade Magazine,
http://www.worldtrademag.com/CDA/Articles/Ocean/75ffcf5149af7010VgnVCM1000
00f932a8c0, last call Jan 08th 2007.
Martin, J. and Thomas, B.J., (2001). The container terminal community. Maritime Policy &
Management 28(3), 279-292.
McCalla, R., Slack, B. and Comtois, C., (2005). The Caribbean Basin: adjusting to global
trends in containerization. Maritime Policy & Management 32(3), 245-261.
Mc Williams, D., Norwood, P. and Parfitt, A., (1995). Economitrics testing of investment
incentives: update of Marlow model. Maritime Policy & Management 22(3), 201-207.
Midoro, R. and Pitto, A., (2000). A critical evaluation of strategic alliances in liner
shipping. Maritime Policy & Management 27(1), 31-40.
Midoro, R., Musso, E. and Parola, F., (2005). Maritime liner shipping and the stevedoring
industry: market structure and competition strategies. Maritime Policy & Management
32(2), 89-106.
Müller, M. and Schönknecht, A., (2005). Kapitalrendite von Großcontainerschiffen.
Internationales Verkehrswesen 57, 58-60.
Ninnemann, J., (2006). Seehafenwettbewerb in Europa. Dr. Kovač, Hamburg.
Notteboom, T.E. and Winkelmans, W., (2001). Structural changes in logistics: how will
ports authorities face the challenge? Maritime Policy & Management 28(1), 71-89.
Notteboom, T.E., (2004). Container shipping and ports: an overview. Review of Network
Economics 3(2), 86-106.
Notteboom, T.E. and Rodrigue, J.-P., (2005). Port regionalization: towards a new phase in
port development. Maritime Policy and Management 32(3), 297-313.
O’Brien, J.A., Managing Information Technology in the E-Business Enterprises, 5th
Edition, 2002.
Pando, J., Araujo, A. and Maqueda, F.J., (2005). Marketing management at the world’s
major ports. Maritime Policy & Management 32(2), 67-87.
Panayides, P.M. and Cullinane, K., (2002). Competitive advantage in liner shipping: a
review and research agenda. International Journal of Maritime Economics 4(3), 189-
209.
Payer, H.G., (1999). Feasibility and practical implications of container ships of 8000,
10,000 or even 15,000TEU. The Terminal Operation Conference & Exhibition.

Container Terminal Operations Under the Influence of Shipping Alliances 29
Podolny, J.M. and Morton, F.M.S., (1999). Social status, entry and predation: the case of
British shipping cartels 1879-1929. Journal of Industrial Economics 47(1), 41-67.
Porter, M.E., (1980). Competitive Strategy: techniques for analyzing industries and
competitors. Free Press, New York.
Porter, M.E., (1991). Towards a dynamic theory of strategy. Strategic Management Journal
12, 95-117.
PC (Productivity Commission), (2004). Review of Part X of the Trade Practices Act 1974:
International Cargo Liner Shipping. Draft Report.
Roe, M.S., (1999). The commercialization of East European liner shipping: the experience
of Poland. Maritime Policy & Management 26(1), 69-79.
Rimmer, P.J., (1998). Ocean liner shipping services: corporate restructuring and port
selection/competition. Asia Pacific Viewpoint 39(2), 193-208.
Rimmer, P.J. and Comtois, C., (2002). China’s transport and communications firms:
transforming national champions into global players. Asia Pacific Viewpoint 43(1), 93-
114.
Ryoo, D.K. and Thanopoulou, H.A., (1999). Liner alliances in the globalization era: a
strategic tool for Asian container carriers. Maritime Policy and Management 26(4),
349-367.
Sheppard, E.J. and Seidman, D., (2001). Ocean shipping alliances: the wave of the future?
International Journal of Maritime Economics 3(4), 351-367.
Shi, X., (2000). The study on the compilation of the China container freight index.
Maritime Policy & Management 27(3), 303-308.
Shi, X. and Voß, S., (2006). Non-cooperative Games in Liner Shipping Strategic Alliances.
Paper presented at EURO XXI (21st European Conference on Operational Research),
Reykjavik, Iceland.
Si, Y.Z., (2005). Maritime Law (in Chinese). Law Publishing House in China.
Slack, B., Comtois, C. and McCalla, R., (2002). Strategic alliances in the container
shipping industry: a global perspective. Maritime Policy & Management 29(1), 65-76.
Song, D.W., (2002). Regional container port competition and cooperation: the case of Hong
Kong and South China. Journal of Transport Geography 10, 99-110.
Song, D.W. and Panayides, M., (2002). A conceptual application of cooperative game
theory to liner shipping strategic alliances. Maritime Policy and Management 29(3),
285-301.
Steenken, D., Voß, S. and Stahlbock, R., (2004). Container terminal operation and
operations research - a classification and literature review. OR Spectrum 26, 3-49.
Stewart, H.G. and Inaba, F.S., (2003). Ocean liner shipping: organizational and contractual
response by agribusiness shippers to regulatory change. Agribusiness 19(4), 459-472.

30 X. Shi, S. Voß
Suh, M.S. and Lee, Y.J., (1998). A hierarchical expert system for integrated scheduling of
ship berthing, discharging and material transport. Expert Systems 15(4), 247-255.
Sun, G.Q. and Zhang, S.P., (2000). The APEC future maritime policy and its evaluation.
Maritime Policy & Management 27(2), 209-213.
Thorhus, R.H. and Lindstad, H., (2006). An Evaluation of a Joint Seaborne Transport
System Based on a Strategic Alliance. Accessable at
http://www.idefondet.ntnu.no/vedlegg/Thorhus_paper_Nofoma.pdf, accessed date 3,
Nov. 2006.
Veenstra, A.W., (1999). Quantitative Analysis of Shipping Markets, PhD thesis. Delft
University Press, Delft, The Netherlands.
Veenstra, A.W. and Bergantino, A.S., (2000). Changing ownership structures in the Dutch
fleet. Maritime Policy & Management 27(2), 175-189.
Vanelslander, T., (2005). The Economics Behind Cooperation and Competition in Sea-Port
Container Handling, PhD thesis. Faculty of Applied Economics, University of
Antwerp.
Voß, S. and Böse, J., (2000) Innovationsentscheidungen bei logistischen Dienstleistern -
Praktische Erfahrungen in der Seeverkehrswirtschaft. In: Dangelmaier, W. and Felser,
W. (Edited) Das reagible Unternehmen, HNI, Paderborn, 253-282.
Wang, J.J. and Slack, B., (2004). Regional governance of port development in China: a
case study of Shanghai international shipping center. Maritime Policy & Management
31(4), 357-373.
Wang, J.J., Ng, A.K.-Y. and Olivier, D., (2004). Port Governance in China: A Review of
Policies in an Era of Internationalizing Port Management Practices, Transport Policy.
University of Oxford, Elsevier.
Wang, T.F. and Cullinane, K., (2006). The efficiency of European container terminals and
implications for supply chain management. Maritime Economics & Logistics 8, 82-99.
Wang, Y.Y. and Zeng, K., (1997). Ocean transportation operation (in Chinese).
Transportation Publishing House of People’s Republic of China, Beijing.
Wilson, I.D. and Roach, P.A., (2000). Container stowage planning: a methodology for
generating computerised solutions. Journal of the Operational Research Society 51(11),
1248-1255.
Xie, X.L., Wang, T.F. and Chen, D.S., (2000). A dynamic model and algorithm for fleet
planning. Maritime Policy and Management 27(1), 53-63.
Xu, T.F., (1996). Management and Operation of Shipping Company (in Chinese),
Publishing house of Dalian Maritime University.
Yahalom, S., (2002). Intermodal Productivity and Goods Movement-Land Access to Port
and Terminal Gate Operations. University Transportation Research Center.
Yamaguchi, N.D., (1999). Asian product trade. Maritime Policy & Management 26(4),
327-336.

Container Terminal Operations Under the Influence of Shipping Alliances 31
Yang, C.H., (2004). The Impact of Bigger Vessels on Shipping & Ports. Accessable by
http://www.kmi.re.kr/english/data/publication/k2004_02.pdf, access date 27th Oct.
2006.
Yoshida, S., Yang, J.H. and Kim, K.H., (2001). The network economy of the alliance in the
liner shipping. In: Proceeding of International Associate of Maritime Economics
Conference 2001, 333-343.
http://www.dakosy.de/en/#. Access date 6th Oct, 2006.
http://events.simplywebcast.com/maersk/may_2005/index.html. Access date 12th May,
2005.
http://www.globalsecurity.org/military/systems/ship/container-types.htm. Access date 6th
Nov, 2006.
http://info.jctrans.com/wl/hy/hyzs/2006726279397.shtml. Access date 12th Sep, 2006.
http://www.sjtu.edu.cn/newsnet/newsdisplay.php?id=9457. Access date 20th Sep, 2006.
http://www.smg.cn/news/content.aspx?NewsId=110888. Access date 20th Sep, 2006.

THE IMPACT OF THE PANAMA CANAL EXPANSION ON LINER FLEET DEPLOYMENT AND OPERATION—A NEW AGENDA Name Xiaoning Shi* Affiliations: Department of International Shipping and Logistics Shanghai Jiao Tong University, Dongchuan Road 800, 200240, Shanghai, China [email protected] Institute of Information Systems, University of Hamburg [email protected] Stefan Voß Affiliation: Institute of Information Systems, University of Hamburg stefan.voss@ uni-hamburg.de Words in texts: 5,937 words Number of figures: 2 Number of tables: 4 Total equivalent word count: 7,437 words ** Corresponding Author

TRB-12-4176
2
ABSTRACT From the first utilization of the Panama Canal in the late 1910s, it plays a significant role not only in world trade but also in the shipping industry and its progress regarding containerization. With the technical innovation and development of ship building, larger and larger ships are built and deployed in the shipping markets, also resulting in fierce competition and demanding requirements. The decision to expand the Panama Canal would, to great extent, re-shuffle the situation and enhance the competition of the shipping industry. Decision makers of any liner fleets need to survey and evaluate the re-structuring of fleet composition by booking different types of ships step by step with ship building companies, organizing capital and chartering or buying second-hand ships, re-setting the liner fleet deployment, negotiating with authority on ship operations so on and so forth. Based on the existing literatures we attempt to focus on the impact of the expansion of the Panama Canal on global container fleets taking into account the turbulent circumstance. Furthermore, container vessels deployment and liner fleets operations deserve worldwide attention from aspects of both academic researchers and business practitioners. The theoretical framework as well as the empirical outcome of this paper provides advice to decision makers of liner fleets and be of usage and interest to others who are involved in the shipping industry as well. Keywords: the Panama Canal, Fleet, Liner, Containerization
2

TRB-12-4176
3
1. INTRODUCTION The boom in globalization raises up the international shipping, while the international shipping, in turn, helps to accomplish the trade activities. Therefore, the liner fleets are becoming more and more important since they transport the sharply increased inbound and outbound trades. Furthermore, regarding the policy and regulations of multi-lateral trade and transportation, e.g., cabotage limitation, each fleet competes and cooperates with other fleets all around the world in the same way as all the other top liners do. Based on this, decision makers of any liner fleets need to survey and evaluate the re-structuring of the fleet composition by booking different types of ships step by step with ship building companies, organizing capital and chartering or buying second-hand ships, re-setting the service networks, negotiating with port operators, etc. This paper considers the impacts of the Panama Canal expansion, which is an effective means to conquer congestion experienced by those vessels passing through there. In particular, shortening transiting time and quickening planning process of the Panama Canal would be appreciated by the liner carriers taking into account factors like vessels deployment as well as fleet composition and competition among rivals. In the late 1990s, the original expansion program regarding the Panama Canal was slated for completion in 18 to 20 years (1). Later in an invited speech of IAME2002, Vasquez mentioned that a major shift to the frontier should be the result of a major expansion in plant and channel capacity of the Panama Canal (2). Furthermore, it has recently been promoted to shorten completion by around 2010. Once the expansion of the Panama Canal is accomplished, the cargo-handling operation might undergo revolutionary changes in the near future due to the deployment of bigger vessels and the liner’s desire of speedy loading/discharging during their stay in the ports of call. The through capacity of the Panama Canal is mostly occupied by the increasing commodity trade between Asia and America, with China playing a pivotal role as goods manufactured in China are delivered to America as well as to other parts of the world increasingly (3). Since the trade between China and America would keep increasing in the near future, the expansion of the Panama Canal will greatly affect the sea borne transportation by means of enlarging quantity per shipment, saving unit cost, shortening transit time, etc., and later affect the trade value of cargos accordingly. As for the main liner carriers of this route, including Asian liners and American liners who compete and cooperate at the same time, to some extent, should pay attention to the trend and make decisions both for the short run and for the long run. It should be noted that, besides the liner shipping that we mainly discuss in this paper, the expansion of the Panama Canal could have a dramatic impact on dry bulk trade carried by Capesize and Panamax bulk vessels as well (4) though the tramp shipping is not yet included in this paper. Some other relevant issues such as the administration reforms and operation management of the Panama Canal (5), despite of great importance as well, are not main points of this paper either. Once the expansion of the Panama Canal is accomplished, the cargo-handling operation might undergo revolutionary changes in the near future due to deployment of bigger vessels and desire of speedy
3

TRB-12-4176
4
loading and discharging. In late 1990s, the original expansion program was slated for completion in 18 to 20 years (1), but has recently been reduced for completion by 2015. As mentioned in a speech of IAME2002, a major shift to the frontier should be the result of a major expansion in plant and channel capacity of Panama Canal (2). As for main liner carriers who compete and cooperate at the same time, to some extent, should pay attention to the trend and make decisions both for the short run and for the long run. Other issues such as the administration reforms and operation management of the Panama Canal (5), though of great importance as well, are not main points of this paper. 2. BACKGROUND 2.1 History of the Panama Canal In this section we briefly introduce the history of the Panama Canal and the capacity limitation of it, and the new issues arising from the Panama Canal expansion are illustrated. Before using the Panama Canal, more than two months were required to sail from California to New York by way of Cape Horn. Completion of a canal would reduce that voyage by 8,000 miles (6). At the moment that the Panama Canal was designed and built, there was a clear military aim kept in mind. That mission was reflected in the design of the Panama Canal, with planners in the early 1900s designing the locks of the Panama Canal with a length and width specifically to accommodate those potential battleships. That meant a canal much larger than required at the moment for commercial vessels, which in turn meant that the life of the Panama Canal was greatly extended, as it could handle ships considerably larger than any of the commercial vessels which existed during its construction (6). As a result, the Panama Canal appeared set to retain its value for almost 85 years long. The present Panama Canal, providing an important connection between the world’s two largest oceans (7), built between 1904 and 1914, is a ‘Lock-type’ waterway with both economical value and geopolitical significance, where ships are raised by a series of locks to the Canal, 85 ft above the sea-level rather than navigating a sea-level passage from ocean to ocean (8). The ‘Lock-type’ design turns to be one of the reasons that make the ships wait too long time once attempt to transit it. Since the opening of the Panama Canal, attention has been given to steamship conferences, freight rates of that route, traffic volume, and related regulations (9). Later on, since the 1970s the commercial value of the Panama Canal was stressed again. The handover of the Panama Canal took place in 1999, which promoted free trade agreement with the US and the countries concerned. Thus, the shifts of Asian cargoes from west coast to east coast port via the Panama Canal and the Suez Canal routings underscore the problems of inadequate transport capacity. At that moment, the Panama Canal was running at 95% capacity, in other words, it was running almost close to full capacity (10). Concerning the capacity limitation, as we mentioned before, the main constraint is the size of locks, which limits the size of ships that can transit the Panama Canal (4). Thus, the Panama Canal cannot handle the new mega-ships with a beam of 100ft and an overall length of 1,000ft, not even to say the bigger ones. The above mentioned limitation of Panama’s throughput could be viewed as an emblematic bottleneck of the globally integrated logistical chain corresponding to the main trade route from East Asia to the East coast of America. In order to boost the trade flows
4

TRB-12-4176
5
running through the global supply chain and transportation network more efficiently, it is quite necessary to conquer the size limitation of the Panama Canal by means of expansion, which is advocated to be accomplished by 2010, together with further modernisation and its preparation of a master plan to provide the company a road map for the next 20-25 years (2). Nowadays, the water pilots have complete control of all ships passing through the Panama Canal. They determine which ships get through and when they get through, which makes the advantage and disadvantage coexist. On one hand, the pilot and the authority could control and arrange the schedule from the perspective of safety; however, on the other hand, it also implies the long waiting time where those liner carriers always complain. 2.2 Limitation of the Panama Canal It should be noted that international shipping is an international trade and globalization borne service. Quality and price differentiation make the international goods exchange necessary, meanwhile the trans-ocean lanes make it possible. There are three major long distance lanes: the transpacific lane, the transatlantic lane and the Far East-Europe lane. With the technical innovation and development of ship building, larger and larger ships are built and deployed in above mentioned shipping lanes, also resulting in fierce competition and demanding requirements. Over the previous decades, different types of ships are considered by shipping lines (see, 11, 12). While the number of container vessels has increased during the last decade the most significant change has been the increase in vessel size. The following Figure 1 illustrates the trend of ship size during the last four decades.
Figure 1: The ship size trend in the last four decades Source: Shipping World & Shipbuilder, David Tozer, Lloyds Register, available online (13) Table 1: Generations/classifications of container ships (TEU: Twenty-foot Equivalent Unit)
5
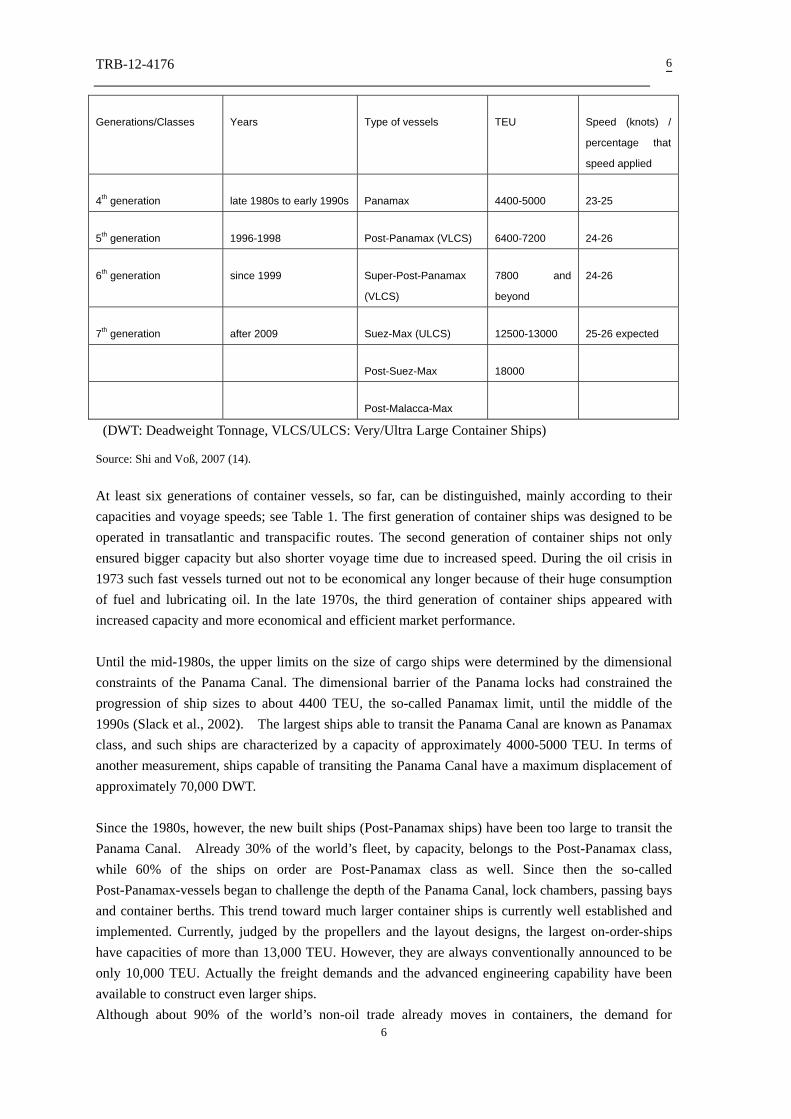
TRB-12-4176
6
Generations/Classes Years Type of vessels TEU Speed (knots) /
percentage that
speed applied
4th generation late 1980s to early 1990s Panamax 4400-5000 23-25
5th generation 1996-1998 Post-Panamax (VLCS) 6400-7200 24-26
6th generation since 1999 Super-Post-Panamax
(VLCS)
7800 and
beyond
24-26
7th generation after 2009 Suez-Max (ULCS) 12500-13000 25-26 expected
Post-Suez-Max 18000
Post-Malacca-Max
(DWT: Deadweight Tonnage, VLCS/ULCS: Very/Ultra Large Container Ships)
Source: Shi and Voß, 2007 (14).
At least six generations of container vessels, so far, can be distinguished, mainly according to their capacities and voyage speeds; see Table 1. The first generation of container ships was designed to be operated in transatlantic and transpacific routes. The second generation of container ships not only ensured bigger capacity but also shorter voyage time due to increased speed. During the oil crisis in 1973 such fast vessels turned out not to be economical any longer because of their huge consumption of fuel and lubricating oil. In the late 1970s, the third generation of container ships appeared with increased capacity and more economical and efficient market performance. Until the mid-1980s, the upper limits on the size of cargo ships were determined by the dimensional constraints of the Panama Canal. The dimensional barrier of the Panama locks had constrained the progression of ship sizes to about 4400 TEU, the so-called Panamax limit, until the middle of the 1990s (Slack et al., 2002). The largest ships able to transit the Panama Canal are known as Panamax class, and such ships are characterized by a capacity of approximately 4000-5000 TEU. In terms of another measurement, ships capable of transiting the Panama Canal have a maximum displacement of approximately 70,000 DWT. Since the 1980s, however, the new built ships (Post-Panamax ships) have been too large to transit the Panama Canal. Already 30% of the world’s fleet, by capacity, belongs to the Post-Panamax class, while 60% of the ships on order are Post-Panamax class as well. Since then the so-called Post-Panamax-vessels began to challenge the depth of the Panama Canal, lock chambers, passing bays and container berths. This trend toward much larger container ships is currently well established and implemented. Currently, judged by the propellers and the layout designs, the largest on-order-ships have capacities of more than 13,000 TEU. However, they are always conventionally announced to be only 10,000 TEU. Actually the freight demands and the advanced engineering capability have been available to construct even larger ships. Although about 90% of the world’s non-oil trade already moves in containers, the demand for
6

TRB-12-4176
7
containerization continues to grow, which is derived from two aspects: the containerisation of the remaining 10% and the newly increased freight requirements. Shipping lines have responded by expanding the global container fleet by about 10% per year. The Panama Canal is able to accommodate only a minority of the new ships because most of the new tonnage involves ships with a capacity of 6,000 to 8,000 TEU and beyond. However, the currently planned expansion of the Panama Canal might render the old calculations on liners’ unit cost obsolete by means of letting the so-called Post-Panamax vessels go through the canal to reach better economies of scale. Moreover, one can find the opinion that freight rates of containerized cargo, namely Freight of All Kind (FAK), are not related to the ship type. However, the bigger and faster the vessels are, the more efficient they seem to be and the more likely it is to achieve economies of scale. At the end of October 2006, about 80% of Panamanians appeared and voted, which later approved a 5 billion US Dollar plan to widen the Panama Canal. The extension is expected to accommodate a new generation of cargo ships, many originating in China, seeking a quick route between the Atlantic and Pacific Ocean (www.cnn.com). Regarding fleet composition liner companies build up their fleets and deploy types of ships (e.g., with respect to size) on purpose. For more technical details of the different generation of container vessels, readers may refer to (14). It is notable that since the late 1980s, the name of the container vessel generations applies ‘Panama’ to indicate how big and how different they are from each other, for instance, Panamax, Post-Panamax, etc. Later on, other canals or channels like Suez and Malacca are applied in names too. In short, Panamax could be regarded as the fourth generation, Post-Panamax as the fifth and sixth generation, and Suez-Max/Post-Suez-Max as the seventh generation; meanwhile, Post-Malacca-Max is under design and model testing process which might be regarded as the eighth generation both by practitioners and by researchers in the future. Regarding generations of the container vessels, it is obviously defined and constrained by the traversing capacity of the canals and channels. Actually those narrow lanes play a positive role of ‘short-cut’ connections as well as negative role of geographical ‘bottle necks’. However, as the Panama government decided to extent the Panama Canal, which shed light on the ship building design from the aspect of technology and would definitely lead to reshuffling of the liner shipping industry from aspect of commerce. Four of the world’s greatest ocean routes that directly affected by the Panama Canal (9) are: the Magellan or Cape Horn route, the South African or Cape Town route, and the Suez Canal route. In addition, the five primary routing factors which operate in favor of the Panama route are: the distance or length of the voyage; the length of time required to reach destination; fuel cost; the relative ease of obtaining profitable cargoes; the absence or presence of transshipment costs (9). Therefore, new issues will arise along the related routes based on routing factors, which are discussed in detail in Section 3. 3. NEW ISSUES ARISING FROM THE PANAMA CANAL EXPANSION
7

TRB-12-4176
8
3.1 From the Perspective of the Panama Canal Authority At the beginning of 2007, the Panama Canal Authority announced a rate increase for passages across by more than 12% per annum until 2010 (14). By 2025, the passage toll could eventually be doubled. The increasing passage tolls might not surprise the players in the shipping industry because they all took into account the following fact: the money is urgently needed to fund the Panama Canal’s large-scale capacity expansion scheme. However, based on the mentioned fact, these players could choose how to response and further behave. The new tolls follow a tapering scale: the highest rate is applied to first 10,000 gross tonnes; the next 10,000 tonnes are less costly and so on. This could be interpreted as a way to decrease transit intension of smaller vessels. Therefore, the transit capacity for bigger vessels could be, to some extent, assured. If the increasing passage toll does not matter too much the shipping lines’ operation costs, the shipping lines might not change the existing routes. However, if the increasing passage toll does make great difference regarding operation costs, then the shipping lines might give up the Panama Canal as a connection between two oceans. An alternative could be linking Asia and the US east coast via the Suez Canal and then the Atlantic Ocean. Based on the literature review mentioned in previous section, the liner fleets of those main players who provide transportation services would definitely obtain bigger container vessels that accommodate the Panama Canal after its expansion. Several main issues then arise, which are worth of researching. • ways to obtain bigger container vessels or capacities, i.e., build new ships, purchase second-hand
vessels or share slots with other carriers • identifying fixed cost and operational cost once those expected vessels are to be deployed • Competitive behaviours of other liners as rivals who are facing similar circumstance Based on classical economics, only the freight transport desires of the player himself are to be calculated and predicted, and the action of next stage would be taken subject to the fleet capacity constraints together with time window constraints on ports. However, regarding the interrelationship among these top liners, the freight transport requirements from competitors’ customers would also been predicted comparing with the competitors’ fleet constraints: that actually reflects the beauty of game theory. Once the player realizes that his competitors’ fleet amplifying plan is much faster than their booking requirements, the following should be thought about: 1) whether the player himself predicts the market in a too conservative way; 2) whether the competitors are too optimistic on the market so that their idol capacity, sometime later, could even be applied by the player by means of slot sharing agreements. As for the player himself, two advantages arise from this tactical method-slot sharing agreements. On one hand, it saves investments on new-built vessels, instead, renting capacity from the other liners. One the other hand, more flexibility and freedom is obtained when the market deteriorates. As for the negotiation and decision making process of slot sharing agreements, refer to the authors’ parallel working paper under this topic. Regarding the uncertainties and unenclosed information of fixed and operational cost of new vessels,
8

TRB-12-4176
9
the behaviours of those involved players could be regarded as game under incomplete information circumstance. Comparing to what they faced before, even if the costs of former fleets were definitely kept as the business confidentialities as always, however, their competitors could to great extent define thin intervals of the expected cost of fleets, especially those who compete in the same route, by operating relative long time and checking the released freight rates in non-peak seasons. The lowest freight rates among non-peak seasons, which are quite transparent in the market, could be viewed as approximated amount of fixed cost because that is lowest bound that they would like to still provide services. As we assumed, they could only be viewed as approximated amount of fixed cost of the competitors, hence, they are the ‘common knowledge’. 3.2 From the Perspective of Transportation Demand Naturally increased transportation demand is depending on the cargo flow between trading zones. Ships transit the Panama Canal to move between the Atlantic and Pacific Oceans. The volume of ship traffic at the Panama Canal is determined largely by world economic conditions and global trade routes between Thus, planned expansion and pricing of the Panama Canal must be considered. If the unit transportation cost is decreasing for the cargo, it might amplify the total cost difference between trading zones, therefore, further motivates more cargo flows. Luo and Grigalunas (2003) (16) investigates and concludes that cargo value as 10,000 $/TEU is a threshold; cargo with lower value than 10,000 $/TEU would use as much water transportation as possible by going through the Panama Canal and using a Gulf Coast port directly, however, cargo with higher value than 10,000 $/TEU has more option to use North Pacific Coast for import and export together with using multi-modal facilities to and from the port. In addition, new technologies are expected to add more value to goods, and the according high-value-added cargo may bear higher transportation cost. Therefore, together with technology innovations, naturally increased transportation demand is promising. Trade in both goods and services increased at a global scale with China playing a pivotal role as goods manufactured in China are delivered to other parts of the world increasingly (17, 18). Especially the trade between China and America would keep increasing in the near future, which means that the expansion of Panama Canal will greatly affect the sea borne transportation by means of enlarging batch, saving unit cost, shortening transit time, etc., and later affect the trade value of cargos accordingly Attracting cargo flows originally transported by other modes is depending on the pricing of the Panama Canal as well. For instance, goods from Europe destined for the West Coast, or goods from West Asia being shipped to the US East Coast can use the all-water route through the Panama Canal or be transported by train using the mini-land bridge across the US. The unit cost a certain TEU beard is assumed to be decreased when deploying Super-Post-Panamax containership after the expansion, however, the price of using the Panama Canal is going to be more expansive as announced by the Panama Canal Authority. The route chosen depends upon the total transportation cost charged to a certain container of using all-water route compared with the multi-modal route. 3.3 From the Perspective of Transportation Supply There are many factors that motivate the shipping lines to amplify their containership fleets. Besides those factors, the expansion of the Panama Canal enables the deployment of mega-containership,
9

TRB-12-4176
10
which in return further accelerates the shipping lines’ booking on mega-containership. Table 2: Deliveries from 2006 to 2010 Year TEU Start
2006
No. ships
Capacity
(TEU)
Deliveries
No. ships
Capacity
(TEU)
End of
year No.
ships
Capacity
(TEU)
Increase
7800+ 63 520320 65 564200 128 1084520 108.4% 2006
total 4194 8695837 343 1325741 4513 9990578 14.9%
7800+ 128 1084520 52 452400 180 1536920 41.7% 2007
total 4513 9990578 472 1454433 4947 11400011 14.1%
7800+ 180 1536920 51 463785 231 2000705 30.2% 2008
total 4947 11400011 353 1440620 5261 12785631 12.2%
7800+ 231 2000705 47 441800 278 2442505 22.1% 2009
total 5261 12785631 256 1153900 5517 13939531 9.0%
7800+ N/A N/A N/A N/A N/A N/A N/A 2010
total N/A N/A N/A N/A N/A N/A 8.7%
Source: authors’ own composition based on Containership Annual Review 2006-2007 and Alphaliner Furthermore, the decision makers of the liners are concerned about the perturbation even if it actually not often happens, especially when it relates to huge amount of investment, for instance, once the Panama Canal expansion occurs or even since the intension was announced, many related transactions of new built ships and contracts of time charter agreements are to be signed. The supply aspects including ship building yards and sellers of second-hand ships as well as the demand aspects including fleet owners and operators reshuffle the market and price of mega-vessels, e.g. the Post-Panamax container ships, which might make the former assumptions and estimations of fixed costs of competitors inaccurate. Based on that, those former assumptions and estimations are not ‘common knowledge’ any longer. Then the key point of this situation is that how to transform unclear, incomplete knowledge and information as well as figure out optimized response not only to the perturbation but also to other players’ actions. Taking into account the differentiations of investment strategies, the purchase prices of new ships might differs a lot. Thus, accurate or approximate expectations of fixed costs of competitors may not ‘common knowledge’ any longer. Below is our knowledge on the indicative fixed cost of deploying mega-container ships, as far as what we are concerned. As indicated in the above Table 2, the total number of Super-Post-Panamax (7800+ TEU) containership has been 180 at the beginning of 2008. And the fright rate of Asia-Europe route, where most of the Super-Post-Panamax containerships are deployed, decreases sharply to 400-500 US Dollar per TEU. Taking into account the booking order, at the beginning of 2009, the total amount of Super-Post-Panamax will be increasing as 231, which may result in a cut-throat competition. An urgent problem arises: how to improve the load factor of such mega ships. 3.4 From the Perspective of Cost if Using the Panama Canal
10

TRB-12-4176
11
The total cost of a mega-container vessel consists of fixed cost and operational cost. The fixed cost mainly relates to the new-built price, while the operational cost mainly related to the length of the voyage and the Canal Toll, to be discussed in detail, respectively. 3.4.1 Fixed cost of the vessel The below Table 3 shows the estimated cost of using the Panama Canal Categories Value References Ship speed 20 mile per hour Martin Stopford Maritime Economics (1997) Shipping cost 0.09 $ /TEUmile Cullinane and Khanna (2000) Rail cost 0.02 $ /TEUmile USDOT, BTS (1999,2000) Rail speed 64 mile per hour Luo and Grigalunas (2003) Panama Canal speed 1.667 mile per hour interview Panama Canal fix cost 10 $ / TEU Luo and Grigalunas (2003) Source: Authors’ composition based on various references and mainly () Table 4: Indicative New-built Prices Price Price/TEU 500 TEU USD 15 M 30.000 1000 TEU USD 22 M 22.000 1600 TEU USD 32 M 20.000 2500 TEU USD 44 M 17.600 3400 TEU USD 50 M 14.700 4300 TEU USD 66 M 15.350 5100 TEU USD 77 M 15.100 6700 TEU USD 100 M 14.925 8100 TEU USD 120 M 14.800 * Prices are for gearless vessel with standard design and 5x20% payments Source: Howe Robinson (2007) Getting Super-Post-Panamax containerships can be facilitated by following three manners: new building, Time chartering, and second-hand purchasing (which is not expected in the short run). However, in this paper, we only extract new building as an example for predicting fixed cost. Try to decrease fuel price and ship price could be options to take advantage of lower-cost. Fuel price could be cleverly controlled by being supplied either in cheaper port among all ports of call, or in those efficient ports if the total operating time in the port is regarded as ‘price’ too. Port visit price, from the operational level, includes the handling charge for both loaded and empty containers based on the negotiated handling agreements. Note that at the tactical level, the new-built vessel’ price and the second-hand-vessel’ price interdependent on each other, and most of the time the former is upper-limitation of the latter one. Sometimes exception might also happen if the second-hand vessel is too popular when market boom up quickly. And for the strategic level the total or average unit costs are business confidentialities, which need to be evaluate follow what we discussed in Section X. Meanwhile, the hub location selection and infrastructure investment are, without any doubt, sensitive signals to the
11

TRB-12-4176
12
market. 3.4.2 Operational cost of the vessel Panama Canal tolls are assessed on the Panama Canal Universal Measurement System (PC/UMS) Net Tonnage, which is based on the internal volume of the vessel and also hether the vessels is laden or in ballast as determined by the Admeasurer, but the Panama Canal charges small craft by standard fees based on their length overall. In order to pay tolls, directly, one must present the proper Admeasurement clearance and Handline Inspection form. The total deposit fee includes the transit fixed fee and the buffer. The buffer is to be used in case additional charges are incurred during transit. This buffer is refunded if it is not used. The total deposit fee is based on length overall. Compared with data provided by (19, 20), i.e., total deposit fee for ship with length between 80 and 100 m costs 1950$, and that for ship with length longer than 100 m costs 2450 $. We can find that the deposit fee does not increase too much while the vessels turns bigger. Other related charges are also listed here. Whenever owners or representatives of handling vessels that would normally transit with transit advisors request the assignment of a regular pilot instead, that assignment will be charged at the rate of $2,250.00, if sufficient notification has been provided, as specified on Tariff 1060.0040, or otherwise at the rate of $4,500.00, as specified on Tariff 1060.0045. Whenever handling vessels present some deficiency or condition that prevent the completion of their transit as scheduled, they will be assessed the tariff for transit delay of $440.00 and other related charges, such as launch and moorage. Whenever owners or representatives of handling vessels request to stop in the Canal interrupting their transit, they will be assessed the tariff for transit delay of $440 and other related charges, such as launch and moorage. However, if a transit is interrupted due to Canal scheduling considerations, these charges will not be applied.
The efficiency of canal operation is measured two ways: ship transits per day and the average Canal Water Time (CWT) of a vessel, which is a time measurement of a vessel from the moment it is ready to transit the canal until it exits canal waters. The canal waters include those areas beyond the canal locks on the Atlantic and Pacific Oceans and include the breakwater or anchorage areas. Once a vessel enters the first set of locks on either side of the Panama Canal, the transit time reaches 9 hours on average. The time waiting to enter the first set of locks increases the CWT (20).
The maximum allowable capacity of the canal is 37 to 42 ship transits per day. Daily ship transits indicate the effectiveness of ship lockage and vessel speed through the canal waters. The benchmark is a 24-hour CWT. A lower CWT gains efficiency, while an increase is a loss in efficiency.
The CWT can fluctuate with increased traffic volumes, larger ships transiting the canal, and mechanical delays operating the locks. But as transit traffic increases, the CWT will most likely continue to increase - pressuring the Panama Canal Authority to expand the canal while maintaining its present system. In order to finance future canal expansion, the Panama Canal Authority may increase tolls or obtain financing through capital loans. In the past, the PCC financed capital improvement projects through toll-generated revenues.
12
TRB-12-4176
13
The transit capacity of the canal, under normal operating conditions, is a function of vessel sizes, lock outages, and direction of transits. Panamax vessels increase CWT because they are limited to daylight transits and one-way passage through the Gaillard Cut and take longer to traverse a set of locks. During daylight hours, the number of ship transits ranges from 10 to 15 per day, depending upon ship sizes. Daylight transits make up less than half of the canal's maximum daily capacity. Lock outages and interruptions in the canal also increase CWT.
By 2005, a major capital improvement program to increase capacity, costing nearly $1 billion, was completed, and the sustainable operating capacity increased 20 percent. The program included widening the Gaillard Cut, augmenting the tugboat fleet, adding locomotives, modernizing the vessel traffic management system, converting the miter gates and rising stem valves to hydraulics, and automating the machinery controls.
As traffic at the canal reaches capacity and transit time increases, ship operators and owners consider alternate maritime routes. To keep the canal competitive with other routes, the PCC conducted several studies to expand the canal's capacity beyond just widening the Gaillard Cut. Once the widening is complete, Panamax vessels were able to pass each other throughout the canal waters, although ships of any size and type still will have to wait through the longer lockage times of Panamax vessels.
4. SHIP OPERTAIONS AFTER THE PANAMA CANAL EXPANSION 4.1 Transit Procedures of the Panama Canal Regarding the expected admeasurements and clearances conducted at the Panama Canal, they can be summarized as follows.
Assuming there is a ship which tends to transit from the Atlantic Ocean and it enters the Panama Canal waters of Limon Bay from the breakwater at Cristobal. Upon arrival in Panama Canal waters, if a vessel is not scheduled to transit that day, it has to drop anchor and wait for its scheduled transit time. Otherwise, the vessel will sail toward the first lock. The vessel steams 10.4 km under tug assist to the Gatun Locks, the first set of locks. Three "steps" at Gatun Locks, individual chambers into which ships are maneuvered, raise the vessel 26 m to Gatun Lake. Each chamber is 34 m wide and 305 m long. This first set of locks is about 2 km long.
The vessel moves into the first chamber under help of the locomotives and tugs and under its own power, where miter gates close behind the vessel's stern to lock it into the chamber. Water from the second chamber flows into the first chamber and lifts the vessel to the water level of the second chamber. Once the vessel has stopped rising, the miter gates at the vessel's bow open, and the vessel moves forward into the second chamber with assistance from the locomotives and under its own power. The process repeats for the second chamber. In the last chamber, the vessel is lifted to the level of Gatun Lake. In each chamber lockage, raising a vessel requires about 15 minutes, and each lock transit will last from 45 minutes to more than an hour. Transit time, however, will vary with daily vessel traffic.
Once the miter gates of the last chamber open and the vessel has cleared the gates, the cables from each locomotive are released, and the vessel steams through the tropical waters of Gatun Lake under its own power 37.8 km from the Gatun locks to the Gaillard Cut.
The Gaillard Cut traverses 12.6 km through the Continental Divide of Panama at the highest point of the isthmus. Before construction of the canal, the cut was more than 123 m above sea level and 91 m wide.
13

TRB-12-4176
14
One portion was widened to 152 m during the 1930's and 1940's, and the remaining portions were completed by 1971. Starting in the 1990s the cut was widened to 192 m in the straight sections and 223 m at the curves to allow double passage of Panamax vessels. Once past the Gaillard Cut, the vessels encounter the first of two locks that will lower the vessel to the level of the Pacific Ocean. The first lock, Pedro Miguel, has one chamber, 11/3 km long, which will lower the vessel 9 m. From Pedro Miguel, the vessel sails into Lake Miraflores and proceeds about 2 km to the Miraflores Locks, whose two chambers lower the vessel to sea level. From the Miraflores Locks, the vessel moves toward the Pacific Ocean under the Bridge of the Americas, where the pilot returns the vessel to the captain and boards the launch boat. A complete transit takes 9-12 hours after entering the first set of locks, although a vessel may anchor in the canal waters, waiting to transit the canal, from a few hours to a few days (19).
4.2 Bounds for Accepted Price of the Auctioned Service
Since June 1999, double passage of Panamax vessels began. The widening of the cut was finished by 2002 and increased transit capacity by about 20 percent. Even based on this fact, congestions occur now and then at the entrance of the Panama Canal. The Panama Canal Authority then adopts auction mechanism to sell the transit service as well as time windows. Otherwise, the ship operator has to figure out alternative routes.
The additional total costs in case the container vessel is planned to take alternative routes would be the upper bound of the auction price that one vessel is will to pay. Otherwise, the vessel might simply deviate from the Panama Canal and take the alternative routes if time allows. There are basically two alternative routes, i.e., Horn route and the land-bridge route. 1) The canal is a preferred alternative for ship operators if the average daily revenue of a vessel's
transit through the canal is more than an extra 10-day routing. Although the vessel avoids paying the canal toll by sailing around the Cape of Horn, it requires 15 percent more bunkers and revenue distributed over an additional 10 days.
2) Mega ships that transport containers to the United States call on two or three ports for unloading
and loading containers. The larger ships carrying containers from an Asian country to the US East Coast would be too large for the Panama Canal. The ships would call on a US West Coast port, where the containers are unloaded and then transferred onto rail cars for an intermodal delivery across the United States to final markets. This service, called the "land-bridge," eliminates an all-water delivery of a container and avoids use of the Panama Canal. Containers land-bridged across the United States from the US West Coast to New York, for instance, save about 7 days.
Furthermore, expansion of the third lane is planned to be accomplished by 2015, which allows Post-Panamax container ships to transit with a 270 - 280 m length, and a 40 - 45 m width. Consequently, it will open the Panama route to new markets that, due to the present size of Canal locks, have not been able to develop.
The proposal consists of adding a third lane, through the construction of two lock facilities, one at each end of the Canal. Each of the new lock facilities will have three consecutive chambers, designed to move vessels from sea level to the level of Gatun Lake and back down again. The new lock's chambers will be
14
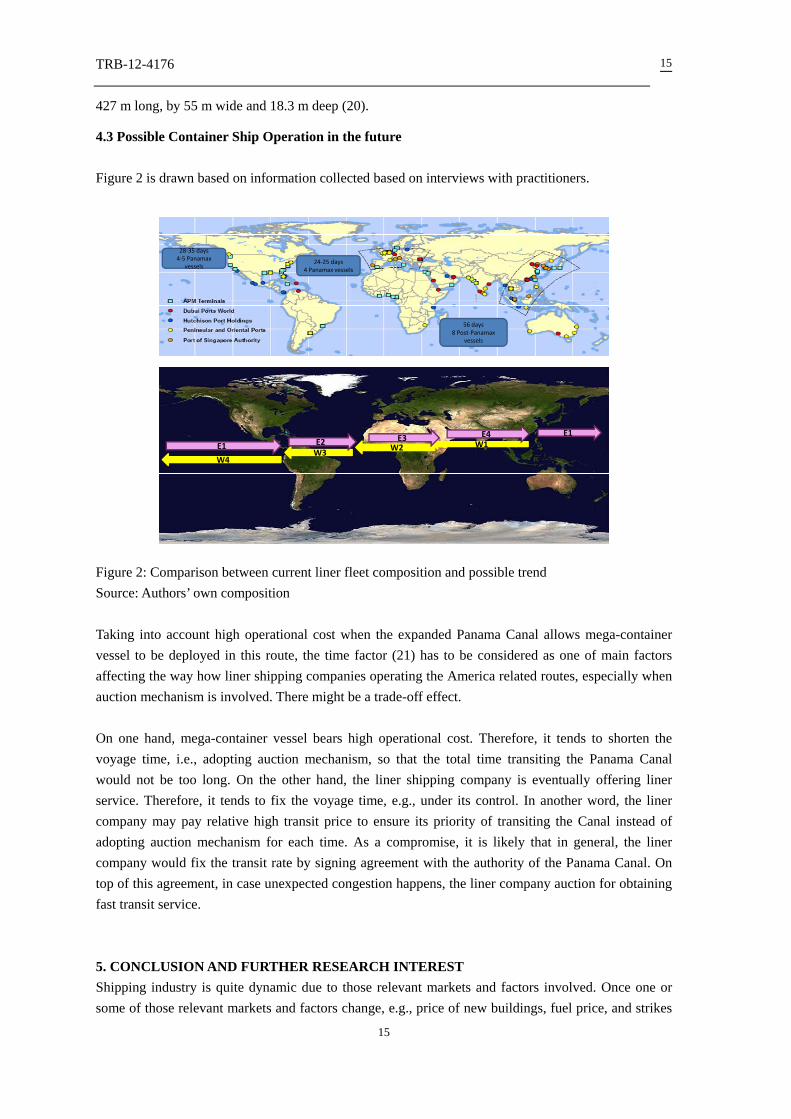
TRB-12-4176
15
427 m long, by 55 m wide and 18.3 m deep (20).
4.3 Possible Container Ship Operation in the future Figure 2 is drawn based on information collected based on interviews with practitioners.
W1E1
W3 W2W4
E1 E2 E3 E4
28‐35 days4‐5 Panamax
vessels
56 days8 Post‐Panamax
vessels
24‐25 days4 Panamax vessels
Figure 2: Comparison between current liner fleet composition and possible trend Source: Authors’ own composition Taking into account high operational cost when the expanded Panama Canal allows mega-container vessel to be deployed in this route, the time factor (21) has to be considered as one of main factors affecting the way how liner shipping companies operating the America related routes, especially when auction mechanism is involved. There might be a trade-off effect. On one hand, mega-container vessel bears high operational cost. Therefore, it tends to shorten the voyage time, i.e., adopting auction mechanism, so that the total time transiting the Panama Canal would not be too long. On the other hand, the liner shipping company is eventually offering liner service. Therefore, it tends to fix the voyage time, e.g., under its control. In another word, the liner company may pay relative high transit price to ensure its priority of transiting the Canal instead of adopting auction mechanism for each time. As a compromise, it is likely that in general, the liner company would fix the transit rate by signing agreement with the authority of the Panama Canal. On top of this agreement, in case unexpected congestion happens, the liner company auction for obtaining fast transit service. 5. CONCLUSION AND FURTHER RESEARCH INTEREST Shipping industry is quite dynamic due to those relevant markets and factors involved. Once one or some of those relevant markets and factors change, e.g., price of new buildings, fuel price, and strikes
15

TRB-12-4176
16
at some port-of-calls, change of economic or geographic environments, etc., then liner shipping industry could not keep stable any longer. As a result, the expansion of the Panama Canal, as one of the above mentioned factors, would definitely push liner carriers to think about optimizing strategies in order to survive in the turbulent market by means of multimodal networks, agility of fleets, diversity of service offerings and so on. In this paper, we describe a potential liner fleet deployment based on integration operation of fixed service price and auction. However, we have not discussed what might be better off in case one waiting container vessel ask for ‘borrowing’ priority of transiting the Canal from its commercial partners, taking into account the fact that there are liner shipping strategic alliances existing in this market for decades. Such assumption and further commercial operations would amply complexity of this problem, however, which might be one of the further research interests in this field. Furthermore, if we restructure this decision making processes subject to incomplete information released by the Panama Canal Authority, a new food for thought might occur. If other factors and perturbations besides expansion of the Panama Canal change or occur, the same theoretical application stated in this paper can be valid as well when analysing the rivalry within the liner shipping industry. In summary, container vessels deployment and liner fleets composition deserve worldwide attention from aspects of both academic researchers and business practitioners.
16
TRB-12-4176
17
REFERENCES 1. Chiappetta, R.F., Treleaven, T., Nixon, E and Smith, J (1998): “History and Expansion of the Panama Canal,” Fragblast, 2(3): 313-340. 2. Vasquez, R. (2003): “Economic Forces in the Decision-making Process of the Panama Canal,” 2003(5): 219-223. 3. O’Brien, T. (2005): “Lessons Learned From the 2004 Peak Season Crisis: Causes, Impacts, Solutions,” 7th Annual CITT State of the Trade and Transportation Industry Town Hall Meeting. 4. Poole, A. (2005): “Increased Lock Capacity Planned for Panama Canal,” Metal Bulletin, 2005(Apr.): 20. 5. Fuller, S.W., Fellin, L. and Eriksen, Ken (2000): “Panama Canal: How Critical to U.S. Grain Exports?” Agribusiness, 16(4): 435-455. 6. Schandlbauer, A. (2004): “The Declining Strategic Relevance of the Panama Canal,” Defence paper of Inter-American Defense College, Washington D.C., available on line via : http://library.jid.org/en/mono43/Schandlbauer.doc Huebner, G. G. (1915): “Economic Aspects of the Panama Canal,” The American Economic Review, 5(4): 816-829. 7. Mencher, M. (1999): “The Panama Canal: Danger Ahead,” The Journal of Environment & Development, 8(4): 407-415. 8. Frenkel, S. (1998): “A Hot Idea? Planning a Nuclear Canal in Panama,” Cultural Geographies, 5(3): 303-309. 9. Henry, A.K. (1929): The Panama Canal and the Intercoastal Trade, Phd thesis, University of Michgan 10. Leach, P. (2004): “Full-speed Ahead,” Journal of Commerce, 2004(Dec): 18-20. 11. Brooks, M. R. International Competitiveness—Assessing and Exploring Competitive Advantage by Ocean Container Carriers. Logistics and Transportation Review, Vol. 29, No. 3, 1993, pp. 275–293. 12. Shi, X. and Voß, S. (2008a): Iterated Cooperation and Possible Deviations among Liner Shipping Carriers Based on Non-cooperative Game Theory (in English), forthcoming in TRR (Journal of Transportation Research Board) 2008, earlier version of this paper is included TRB Annual Conference CD as TRB-08-2826, Washington D.C.
17

TRB-12-4176
18
18
13. http://www.lr.org/news/articles/shipping_world_&_shpbdlr_oct03_2.htm, accessed date: 2008 February 14. Shi, X. and Voß, S. (2007): Container Terminal Operations under the Influence of Shipping Alliances, Risk Management in Port Operations, Logistics and Supply Chain Security in Khalid Bichou, Michael G.H. Bell and Andrew Evans (eds.). 15. http://containerinfo.co.ohost.de/newsletter_2007_08.pdf, accessed date: 6 August 2008. 16. Luo , M.; Grigalunas T.A. (2003): A Spatial-Economic Multimodal Transportation Simulation Model for US Coastal Container Ports, Maritime Economics and Logistics, Vol. 5 (21), pp. 158-178. 17. Brooks, M.R (2005): North American Freight Transportation: The Road to Security and Prosperity. Cheltenham: Edward Elgar. 18. Ruiz, G.M.; Lorda, J.; Arnwine, A.; Lion, K. (2006): Shipping patterns associated with the Panama Canal: Effects on biotic exchange? in: Gollasch, S. et al. (Ed.) (2006). Bridging divides: Maritime canals as invasion corridors. Monographiae Biologicae, 83: pp. 113-126 19. http://www.shelterbaymarina.com/cat/about-shelter-bay-marina/panama-canal-transit-procedure/2/38, accessed date: 30 July 2011. 20. http://www.globalsecurity.org/military/facility/panama-canal-ops.htm, accessed date: 30 July 2011
21. Notteboom, T. (2006), The Time Factor in Liner Shipping Services, Maritime Economics and
Logistics, Vol. 8, pp. 19-39.