
The complex network analysis of liner shipping networks ...
19
HAL Id: halshs-02955149 https://halshs.archives-ouvertes.fr/halshs-02955149 Submitted on 6 Dec 2020 HAL is a multi-disciplinary open access archive for the deposit and dissemination of sci- entific research documents, whether they are pub- lished or not. The documents may come from teaching and research institutions in France or abroad, or from public or private research centers. L’archive ouverte pluridisciplinaire HAL, est destinée au dépôt et à la diffusion de documents scientifiques de niveau recherche, publiés ou non, émanant des établissements d’enseignement et de recherche français ou étrangers, des laboratoires publics ou privés. The complex network analysis of liner shipping networks: Lessons from the merger between COSCO and CSCL Liehui Wang, Nanyi Zhang, Fei Ye, Yui-yip Lau, César Ducruet To cite this version: Liehui Wang, Nanyi Zhang, Fei Ye, Yui-yip Lau, César Ducruet. The complex network analysis of liner shipping networks: Lessons from the merger between COSCO and CSCL. Growth and Change, Wiley, 2020, 10.1111/grow.12428. halshs-02955149
Transcript of The complex network analysis of liner shipping networks ...

HAL Id: halshs-02955149https://halshs.archives-ouvertes.fr/halshs-02955149
Submitted on 6 Dec 2020
HAL is a multi-disciplinary open accessarchive for the deposit and dissemination of sci-entific research documents, whether they are pub-lished or not. The documents may come fromteaching and research institutions in France orabroad, or from public or private research centers.
L’archive ouverte pluridisciplinaire HAL, estdestinée au dépôt et à la diffusion de documentsscientifiques de niveau recherche, publiés ou non,émanant des établissements d’enseignement et derecherche français ou étrangers, des laboratoirespublics ou privés.
The complex network analysis of liner shippingnetworks: Lessons from the merger between COSCO
and CSCLLiehui Wang, Nanyi Zhang, Fei Ye, Yui-yip Lau, César Ducruet
To cite this version:Liehui Wang, Nanyi Zhang, Fei Ye, Yui-yip Lau, César Ducruet. The complex network analysis ofliner shipping networks: Lessons from the merger between COSCO and CSCL. Growth and Change,Wiley, 2020, �10.1111/grow.12428�. �halshs-02955149�

The complex network analysis of liner shipping networks: Lessons
from the merger between COSCO and CSCL
Liehui Wang, Nanyi Zhang, Fei Ye, Yui‐yip Lau, César Ducruet
Pre-final version of the article published in Growth and Change, 51(4): 1877-1893.
Abstract: COSCO and China Shipping Container Lines (CSCL) are leading enterprises in China’s
shipping industry. They merged and reorganized as COSCO Shipping Lines in 2016. Through using
a complex network methodology, we analyze the spatial patterns of their shipping networks before
and after the merger. We evaluate the integration effects based on two main dimensions: network
and hub economies. While complementarities are found between COSCO and CSCL networks
before the merger, COSCO Shipping Lines increased the total number of service nodes and shipping
routes significantly. The merger also had the effect of strengthening the hub capacity of 7 of the top
15 hub ports in the main markets covered by the new company. Results underline that this strategy
of overseas pivotal ports promoted the development of hub economy and regional market expansion.
Keywords: corporate merger, shipping network patterns, complex networks, COSCO Shipping
Lines
1 Introduction
In the liner shipping business, the performances of shipping firms rely on their conduct of
taking such decisions as capacity and pricing level. From the mid-1990s onwards, a tendency
towards mergers and acquisitions has spread quickly across shipping firms (Yip et al., 2012). After
the global financial crisis in 2008, the shipping market was generally oversupplied. Against the
backdrop of performance losses and financial constraints faced by most shipping companies in 2016,
the industry underwent a consolidation and reorganization. The ultimate objective was to solidify
their competitive position against competitors (Yip et al., 2012). Typical examples of such mergers
and reorganizations include the French company CMA-CGM merged among Neptune Orient Lines,
the Norwegian Solstad Offshore, and REM Offshore; NYK (Nippon Yusen Kabushiki Kaisha) and
MOL (Mitsui O.S.K. Lines) integrated with Kawasaki steam ship and its consignment business,
STX marine shipbuilding’s self-rescue reorganization plan; and Hapan-Lloyd, integrated with
UASC (United Arab Shipping Company) and Maersk Line consolidated with Hamburg Süd Group.
Following this trend, China merged and reorganized its major shipping giants, namely COSCO
and CSCL, renamed as COSCO Shipping Lines. COSCO and CSCL were China’s largest shipping
companies in 2015 while ranked sixth and seventh in the world, respectively. From the 1st March,
2016, COSCO Shipping Lines entered a transition process through the integration of shipping routes
and the leasing of container ships formerly operated by CSCL. It also began to integrate the assets
within the CSCL networks gradually according to its restructuring plan. COSCO Shipping Lines
had formed a new shipping network structure by December 2016.

Recently, merger and reorganization activity among shipping enterprises has surged. Some
research studies (e.g., Drahokoupil, 2017; Yeong and Jung, 2017; Onwuegbuchunam et al., 2018)
have put forward different views on the merger of COSCO and CSCL. But, there have been few
studies to review and analyze the development and formation of shipping networks (Lau, 2018).
Some scholars have begun to study the impact of shipping alliances and restructuring activities on
shipping structures. However, this has been limited to the qualitative explanation of the changes in
global shipping capacity patterns in the context of corporate restructuring. Scholars have also
explored the development of specific shipping companies in the context of mergers. The focus has
been on the use of long-term stock and financial data to examine the economic benefits, whereas,
changes in market capacity patterns have only been examined in brief overviews of the restructuring
of the enterprise. The merger and acquisition dynamics in the shipping sector are classic topics, but
lost ground from the 1960s to the 2010s due to the emergence of complementary approaches (Lau
et al. 2018). Thus, even in the case studies of the globalization of the shipping networks of a single
shipping enterprise, there is still a lack of a specific characterization and quantitative analysis of the
key changes in shipping networks structure. Furthermore, the spatial patterns of Chinese companies’
shipping networks have been under-researched.
This study employs a complex network approach to analyze the effects of company integration
on the spatial patterns of shipping networks in the case of China’s shipping industry. In doing so,
we investigate port connectivity and explore the development of hub ports in affected regions. In
addition, we discuss the underlying operational factors used by actors to design and develop their
shipping networks, in terms of firm performance, capacity, network configuration, transit time,
geographical coverage, and transportation time (see Jiang et al., 2015; Tu et al., 2018)
The rest of the paper is organized as follows. Section 2 includes a literature review. Section 3
presents our data and methodology. Section 4 provides a comprehensive analysis results about the
shipping network structures of COSCSO and CSCL in 2015 and COSCO shipping lines in 2016.
After Section 4, discussion and conclusion delivers in Section 5.
2 Literature review
2.1 Industry changes
There are three main approaches in which shipping companies can expand their markets,
namely: alliances, mergers and acquisitions (M&A) and internal growth. The research on mergers
and reorganizations of shipping companies and their alliance strategy has mainly focused on the
motivation and impact factors (Rodriguez-Pose and Zadermach, 2003; Frémont, 2009; Fusilo, 2009;
Das, 2011; Andreou, Louca, and Panayides, 2012; Wang, 2012; Choi and Yoshida, 2013;
Alexandrou, Gounopoulos, and Thomas, 2014). Frémont (2009) explored the actual development
of vertical integration of shipping companies and found that, in practice, shipping companies
participated in intermodal transport in order to develop their core container shipping business. Based
on the study of the motivation and purpose of M&A in shipping companies, Fusilo (2009)
quantitatively verified the determining factors (i.e., technical, regulatory environment, and industry
demand) of US shipping companies’ M&A based on the neoclassical model. Rodriguez-Pose and
Zademach (2003) adopted econometric models to examine the impact of geographic dimensions on
corporate M&A activity. Das (2011) concluded that alliances can expand market coverage while
M&A can achieve a higher synergistic economy. Andreou et al. (2012) suggested that companies

pursue economies of scale while striving towards economies of scope.
Utility analysts have paid more attention to the economic benefits of M&A after the
reorganization of the enterprises. Alexandrou et al. (2014) systematically explored the benefits of
M&A on the basis of the valuation benefits of the financial indicators of shipping companies
involved in them. Choi and Yoshida (2013) examined through the M&A process of Japanese
shipping companies and evaluated the effects of M&A through changes in a series of financial data.
The merger of corporate induces a change in the market capacity pattern and an increase in the
profitability of enterprises by improving asset utilization. The achievement of synergy is the main
driving force for M&A and the evaluation criteria for the success of enterprise integration.
2.2 Shipping networks from an industry perspective
Research on shipping networks has focused on global, regional, and national scales and
identified key factors determining the allocation of liner services under regional differences.
Geographers in particular have been particularly keen in studying the globalization of liner shipping
networks from an industry perspective. Slack and Frémont (2009) studied the container shipping
development focusing on the evolution of major shipping companies in the past 50 years. Frémont
(2009) analyzed the differences and characteristics of horizontal and vertical integration among
types of shipping enterprise integration. Also, the study explored the main process of vertical
integration by using a large scale of survey and in-depth interviews with various employees in
shipping industry.
In addition, Frémont (2007) selected a single shipping company as a research target to explore
the evolution of the enterprise shipping networks pattern, acquisition, route planning, and new liner
operational mode. He particularly underlined how the hub port strategy played an important role in
the formation of the shipping companies, with a focus on Maersk Line and CMA-CGM’s global
networks structure (see also Frémont, 2015). In addition, Parola and Veenstra (2008) sorted through
the global landscape of major liner companies and terminal operators. Overall, these studies on
shipping companies inclined towards the development of shipping companies by using simple
statistical analysis or the evolution of global markets for shipping companies through the case study
approach like Maersk Line and CMA-CGM.
Other geographers discussed changes in the port networks of specific companies such as
COSCON and Evergreen in a comparative perspective along the Europe-Asia route (Comtois and
Wang, 2003) and in relation to China (Rimmer and Comtois, 2005). Interestingly, only one study
looked at the effect of alliances on shipping network structure, through a comparison between the
Caribbean and Mediterranean basins (McCalla et al., 2004), concluding that the Caribbean network
is more vulnerable due to its higher reliance upon such alliances. Last but not least, Metge and
Ducruet (2017) analysed the port networks of major shipping lines across the whole African
continent using cartography and correlation analysis, pointing to overlaps and differences in terms
of main hub ports and outlying firms.
2.3 Graph theory and complex networks
Increasing computational power as well as newly available data (e.g. vessel movements,
shipping schedules) allowed for more quantitative analyses of shipping networks and to shift from
case studies at the local level to global-level studies mixing all major companies. Tools from graph
theory, a branch of mathematics, and from complex networks, a branch of physics and computer
science, served to measure the centrality of port nodes and the structure of such composite networks.
In doing so, research on the spatial patterns of shipping networks and global shipping networks in
specific regions has become an emerging trend. Wang (2008), Kaluza et al. (2010), Ducruet and
Notteboom (2012), and Xu et al. (2015) described the pattern of global shipping networks through
a number of indicators such as degree of distribution, clustering coefficient, primacy ratio, and other
indicators of centrality. Ducruet and Notteboom (2012) also pointed out the fact that East Asia is
developing rapidly. Wilmsmeier and Notteboom (2011) compared the regional differentiation of
liner shipping networks in South America and North Europe. The research study further discussed
the liner shipping allocation factors from the different perspectives of port environment, contact
with the hinterland, market operator strategy, and government policy.
Based on complex network theory, Chen and Hu (2016) analyzed the complex network
characteristics of the Southeast Asia shipping networks along Maritime Silk Road. They highlighted
that Singapore, Port Klang, and Tanjung Pelepas were all significant in the regional network (see
also Wang et al., 2018). Based on the schedule of ships, Wang and Hong (2016) selected complex
network indicators to describe the spatial structural change of the container port system on both
sides of the Straits. According to the complex network method, Du et al. (2016) studied the spatial
pattern of China’s container shipping networks through a comprehensive analysis of overall network
indicator degree, degree of distribution, and port centrality. Ducruet and Wang (2018) proposed an
analysis of China’s overseas connectivity based on various methods including single linkage
analysis, over the periods 1890-2008 for all ships and 1977-2016 for containerships, shedding new
light on the external hub ports concentrating flows such as Hong Kong, Busan, Kaohsiung, and
Yokohama.
Based on shipping company schedules, this study combines complex network indicators,
VOSviewer and Arcgis visual analysis to describe the spatial patterns of shipping networks
accurately and explore the shipping routes of COSCO Shipping Lines, which reached the fourth
rank in the world after the reorganization of the two former companies.
3 Data and methodology
3.1 Background and data
Shipping routes are a very important resource for a shipping company as they affect income
and cost as well as business model feasibility. The shipping network’s space pattern directly reflects
the service scope and market coverage of the enterprise and is the intuitive response of the enterprise
in pursuing economies of scope and scale. Based on the volume of shipping and the length of routes,
global container shipping networks encompass two levels of organization: main routes and regional
feeder routes. Main routes generally refer to East-West trunk lines of the northern hemisphere
connecting Far East, North America, and Europe with each other, while regional feeder networks
are mainly composed of North-South services connecting the northern hemisphere with Africa,
South America, Australia, but also South-South routes (Wang, 2012). Accordingly, we define the
main shipping markets of COSCO and CSCL as: East Asia, Southeast Asia, South Asia, the Middle
East, the Mediterranean, Northwest Europe, North America East Coast, and North America West
Coast as well as the secondary markets as: Australia, New Zealand, East Africa, West Africa, South
America East Coast, and South America West Coast.
We collected the shipping schedules from COSCO and CSCL in October 2015 as well as

COSCO Shipping Lines in December 2016. In 2015, statistics show that CSCL had 151 ports and
691 routes and COSCO had 142 ports and 670 routes. After the merger in 2016, COSCO Shipping
Lines had 200 ports and 1,316 routes. We merged the data for terminals at the same port and then
used the port as the node in the network. The edge of the network between the two nodes is
established if there is a route between the two nodes. The number of routes is the weight of the edge.
By using Gephi 8.0.2 software, we constructed the directed and weighted networks of the two
shipping companies in 2015 and COSCO Shipping Lines in 2016. The shipping network was created
based on ports of call and the moving tracks of container ships. The moving tracks of container
ships generated the links of port-to-port according to the successive ports of call (namely from port
A to port B and from port B to port C). With the utilization of quantitative analysis, we explored the
spatial structures of the shipping networks of the two companies from the perspective of the
transportation network economy.
3.2 Methodology
Based on the transportation characteristics and the scale-free characteristics of complex
networks, a few hub ports play leading roles in the overall network in the context of economies of
scale and scope (Rong, 2001). Under complex network methodology, economies of size and
capacity are the key elements of studying shipping networks. This study mainly concentrates on the
changes in the ports and the routes connections of shipping networks. These changes represent the
market coverage of the shipping networks and capture the size of the shipping networks. The
economy of capacity identifies the phenomenon where the average cost gradually declines when the
port increases its capacity in the networks to handle and transfer passengers and cargo, to compile
trains, to load vehicles, to take off and land, and to dock ships. The two factors considered in this
paper are the number of ports connected to a certain port and the frequency of routes passing through
the port. The route frequency refers to the number of ships passing through the shipping route over
a particular period. We can explore the changes in hub capacity during the port route integration
process through the port strength variation index Ki.
Where: 𝐾𝑖=𝐾𝑖1+𝐾𝑖2,𝐾𝑖1= (2016𝐷𝑖-2015𝐷𝑖max)/2015𝐷𝑖min,
𝐾𝑖2= (2016𝑆𝑖-2015𝑆𝑖max)/2015𝑆𝑖min.
(1)
When the port only has one company calling in 2015:
𝐾𝑖=2016𝐷𝑖/2015𝐷𝑖 +2016𝑆𝑖/2015𝑆𝑖 .;
Where: 𝐷𝑖 of node 𝑖 is defined as the number of other nodes connected to that node. 𝑆𝑖 is
the sum of the number of edges that connect node 𝑖 to all other nodes in the network. The
calculation step is shown in Equation 2.
As can be seen in Table 1, based on the size of the index 𝐾𝑖, the port route changes are divided
into five main categories: reduction, high intensive growth, low intensive growth, fully integrated
growth, and expansion growth. The port change index is the amount of change in port connectivity
in the shipping network. The categories of port change index reflect whether the port connectivity
has increased and the levels of growth after the change of shipping network. Based on the positive
and negative level of change, the connectivity of the port is classified as the reduction and growth.
Taking the multiple of increments as the classification criterion, the growth of the port's connectivity

is classified as an intensive, a fully integrated, or an expansion.
Table 1. Evaluation of Port Change Index
Ki Categories Explanations
𝐾𝑖≤0 Reduction In 2016, the port route was weaker than/equal to the maximum
strength of the port route for the two enterprises in 2015.
0<𝐾𝑖≤1 High intensive growth In 2016, the port route was more than the largest anchor
strength of the two companies in 2015 and the integration of
the two companies was high.
1<𝐾𝑖<2 Low intensive growth In 2016, the port route was more than the largest anchor
strength of the two companies in 2015and the integration of the
two companies was low.
𝐾𝑖=2 Fully integrated growth The strength of the port route in 2016 was equal to the overall
level of full integration of the two companies' routes in 2015.
𝐾𝑖>2 Expansion growth In 2016, the port route intensity was stronger than the overall
level of full integration of the two companies' routes in 2015.
Complex network indicators include degree, weighted degree, and betweenness centrality. The
Degree is an important indicator to describe complex network nodes. The degree Di of node I is
defined as the number of other nodes connected to that node. The greater the degree of the node, the
closer the node is to the other nodes in the network and the more likely it is to act as a hub towards
its immediate neighbors. In container shipping networks, the degree of the port is captured by the
number of connecting ports. It indicates the contact range of the port. In the regional container
networks, there is often more than one route connecting two ports. Additionally, the connection
between ports has a weighted relationship among the number of routes. The node degree value can
represent the significance of the nodes in the unprivileged network, reflecting the close relationship
between a port and the rest of the ports within a port system. Importantly, the node weighted degree
more accurately expresses the strength of the node connection in the weighted network to consider
the frequency of the port-to-port relationship. Therefore, in this study, the weighted degree of the
port definition is (Fusilo, 2009):
𝑆𝑖 = ∑ 𝑊𝑖𝑗
𝑗∈𝑁
(2)
Wij represents the weight of the connection between node I and other nodes j in the network.
The strength of the node association Si is also named in the weighted degree in Gephi software. It
indicates the sum of the number of edges that connect node I to all other nodes in the network.
Betweenness centrality mainly highlights the influence of the nodes in the whole network. It
is an important parameter of network centrality and is used to indicate the strength of indirect
connections between nodes. In general, hubs are nodes with a large betweenness centrality. The
betweenness centrality of node I refer to the proportion of the number of nodes i in the shortest paths
in the network. The number of nodes I is mathematically expressed as follows (Fusilo, 2009):

𝐶𝐵𝑖 = ∑∑ 𝛿𝑙
𝑖𝑙∈𝑆𝑘𝑗
|𝑆𝑘𝑗|𝑘,𝑗
(3)
Where in 𝑆𝑘𝑖 ,k, i is a combination of the shortest paths; ∑ 𝛿𝑙𝑖
𝑙∈𝑆𝑘𝑗 is the sum of the shortest
paths through node i. In shipping networks, the greater in the betweenness centrality of a port infers
the stronger in the accessibility between that port and other ports, and the stronger its global hub
function.
4 Main results: shipping network structure before and after the merger
4.1 Difference in network structure of COSCO and CSCL in 2015
Table 2 compares the regional coverage of COSCO and CSCL in terms of ports of call. The
two shipping firms had a high degree of commonality in North West Europe and Australia where
the proportion of the same ports owned by COSCO and CSCL were 0.91 and 0.78, respectively. For
West Africa, East Asia, North America, and South Asia, the overlap is noticeable, with a proportion
ranging between 0.6 and 0.67. Their differences are mainly demonstrated in the following. CSCL
had the advantage of port coverage in the Mediterranean, the Middle East, South America East, and
North America East. COSCO’s network is more developed in Southeast Asia, while the proportion
of the same ports owned ranged from 0.36 to 0.46. The difference in port selection was the largest
in the West Coast of South America where the overlap was only 0.29.
Table 2. COSCO and CSCL covered Ports in 2015
Navigation Area No. COSCO
ports
No. CSCL
Ports
No. call the
same port
Total no.
ports
Share of the same port
calls (%)
Northwestern
Europe 11 10 10 11 0.91
Australia/New
Zealand 8 8 7 9 0.78
West Africa 4 6 4 6 0.67
East Asia 31 32 25 38 0.66
North America West 10 11 8 13 0.62
South Asia 4 4 3 5 0.6
The Mediterranean 14 21 11 24 0.46
Southeast Asia 22 9 9 22 0.41
East Africa 4 3 2 5 0.4
Middle East 13 19 9 23 0.39
South America East 7 11 5 13 0.38
North America East 8 11 5 14 0.36
South America West 4 5 2 7 0.29
Notes: The share of calls on the same port is the ratio of the two shipping companies' port calls (i.e. the same port)
in the total number of the two shipping enterprises' ports.

The distribution between the two companies of the ports with important connections (weighted
degree greater than 10) shows remarkable spatial differences. According to Figures 1 and 2, the two
shipping firms formed critical port connections in China’s coastal areas and Southeast Asia. CSCL
had relative advantages in the Mediterranean, the Middle East, and Northwest Europe. COSCO had
relative advantages in North America and Australia. However, neither company formed an
important port network in South America or Africa. The important port connections (weighted
degree greater than 10) are mainly related to the east-west shipping markets such as East Asia-North
America West Coast, East Asia- Southeast Asia, Southeast Asia-the Mediterranean, and the
Mediterranean-South American East Coast. The CSCL network in China-Australia-Southeast Asia
and North America West-North America East shows relatively frequent contact.
Figure 1. Shipping network of COSCO in 2015 based on weighted degree
Figure 2.Shipping network of CSCL in 2015 based on weighted degree
In summary, the two shipping firms called the ports independently on the edges of the shipping
networks. The shipping networks of the two shipping firms mainly focused on the main market.
Although COSCO and CSCL showed commonalities in the main market, they still had different
advantages in specific ports and areas. Moreover, the differences between the two shipping firms
stood out clearly in the secondary markets from the north to the south.
4.2 Port increase and route expansion for COSCO Shipping Lines in 2016
We analyzed the economies of size of shipping networks based on the increase and decrease

in the number of port calls. During the restructuring of the COSCO Shipping Lines’ networks, the
increasing number of port calls showed an expansion of size. But, an expansion in secondary
markets was not obvious and new port connections remained low. As shown in Figure 3, the
additional 39 ports of COSCO in 2016 mainly concentrated on main markets compared with 2015:
North West Europe (10 ports), the Mediterranean (9 ports), North America (4 ports), Australia (3
ports), South America East (3 ports), South Asia (2 ports), and Southeast Asia (3 ports). One new
port was added to East Asia, the Middle East, North America West, and West Africa respectively.
In addition, only one or two routes passed most of the ports. There were 22 ports where the numbers
of ports of call were cancelled. It mainly occurred in North and South Asia, followed by two ports
in Southeast Asia, the Mediterranean, the Middle East, and East Africa respectively. Also, one port
was dropped in South America East, North America East, and South America West respectively.
Among them, Pasir Gudang port in Malaysia, and Port of Sohar in Oman, Rio de Janeiro in South
America were among the dropped significant ports. The changes in ports of call in the shipping
networks are the basic reflection of market expansion. The expansion of shipping networks has
shown that the integration of the two shipping firms achieved a considerable expansion.
Figure 3. Changes in ports covered from 2015 to 2016
Notes:Red indicates an additional port, blue indicates reduced ports, and symbol size is the relative size of
port degree value, indicating the corresponding connectivity of the port in the network.
In 2016, COSCO Shipping Lines had the widest coverage in the Mediterranean and East Asian
navigation areas, followed by Southeast Asia, North West Europe, and the Middle East. North
America, Australia, New Zealand, and South America East coast networks also exhibit wide
coverage. COSCO Shipping Lines maintained its dominant position in the main market while
expanding its coverage towards several additional ports in secondary markets.
We analyzed the changes in the size of the shipping networks from the sum of the frequency
of any two ports. In 2016, COSCO Shipping Lines significantly enlarged its route links and the
overall network gained economy of size. The frequencies of COSCO’s and CSCL’s shipping routes
in 2015 were 670 and 691, respectively. After integration, the COSCO Shipping Lines networks
dramatically increased to 1316 in 2016. Based on our analysis, only the links of port-to-port were
considered. In 2015, the number of ports by COSCO and CSCL was 142 and 151 respectively. In
2016, the number of the ports with COSCO Shipping Lines was 200. From the perspective of the
direct connections of various shipping networks in 2016, the COSCO Shipping Lines route interval
contact among Southeast Asia, Australia, New Zealand and other navigation zones did not change.

Surprisingly, the other navigation zones expanded their scopes. According to Figures 4 to 6, the
expansion of Mediterranean connections was the most evident. New direct links were established
with four regions including West Africa, South America, and South Asia. As a result, shipping
networks attained a wider range of route connections. Closer connections were observed in the
shipping patterns of COSCO Shipping Lines. In 2016, Southeast Asia-East Asia and East Asia-North
America West were closely associated, followed by the Middle East-Southeast Asia, Southeast Asia-
South Asia, the Middle East-the Mediterranean, and North-West Europe- the Mediterranean.
Figure 4. Links between different COSCO navigation areas in 2015
Figure 5. Links between different CSCL navigation areas in 2015
Figure 6. Links between different COSCO Shipping Lines navigation areas in 2016
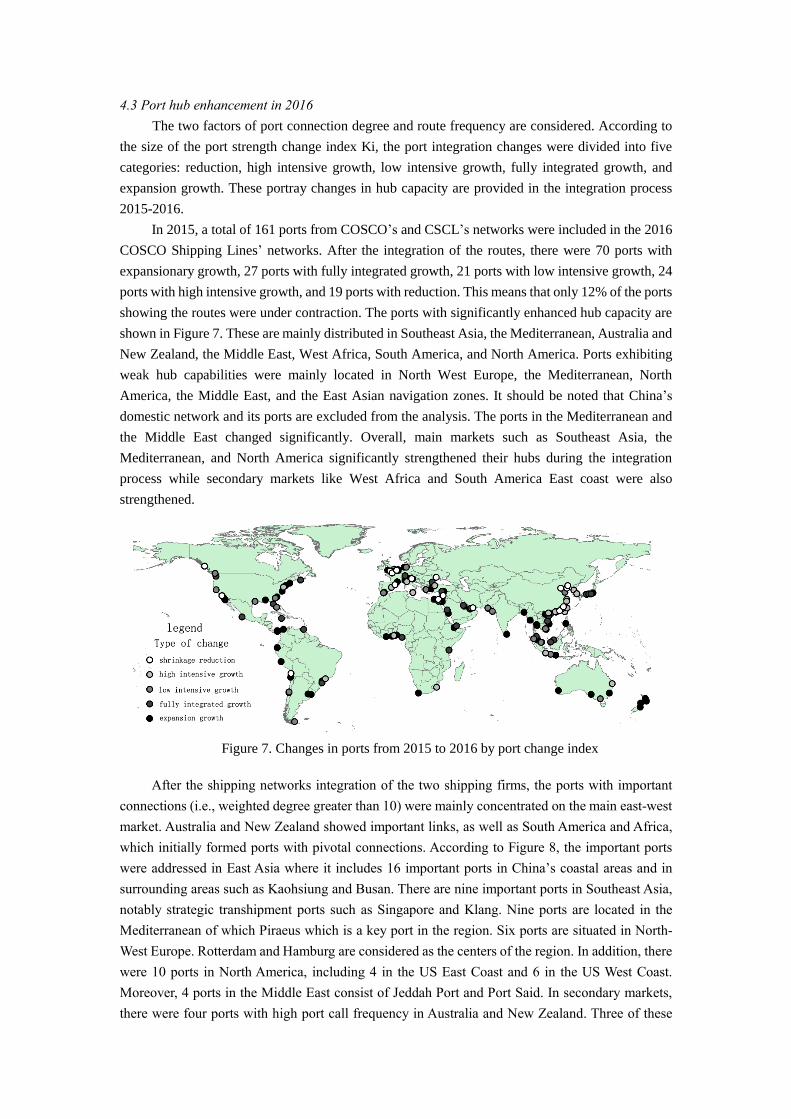
4.3 Port hub enhancement in 2016
The two factors of port connection degree and route frequency are considered. According to
the size of the port strength change index Ki, the port integration changes were divided into five
categories: reduction, high intensive growth, low intensive growth, fully integrated growth, and
expansion growth. These portray changes in hub capacity are provided in the integration process
2015-2016.
In 2015, a total of 161 ports from COSCO’s and CSCL’s networks were included in the 2016
COSCO Shipping Lines’ networks. After the integration of the routes, there were 70 ports with
expansionary growth, 27 ports with fully integrated growth, 21 ports with low intensive growth, 24
ports with high intensive growth, and 19 ports with reduction. This means that only 12% of the ports
showing the routes were under contraction. The ports with significantly enhanced hub capacity are
shown in Figure 7. These are mainly distributed in Southeast Asia, the Mediterranean, Australia and
New Zealand, the Middle East, West Africa, South America, and North America. Ports exhibiting
weak hub capabilities were mainly located in North West Europe, the Mediterranean, North
America, the Middle East, and the East Asian navigation zones. It should be noted that China’s
domestic network and its ports are excluded from the analysis. The ports in the Mediterranean and
the Middle East changed significantly. Overall, main markets such as Southeast Asia, the
Mediterranean, and North America significantly strengthened their hubs during the integration
process while secondary markets like West Africa and South America East coast were also
strengthened.
Figure 7. Changes in ports from 2015 to 2016 by port change index
After the shipping networks integration of the two shipping firms, the ports with important
connections (i.e., weighted degree greater than 10) were mainly concentrated on the main east-west
market. Australia and New Zealand showed important links, as well as South America and Africa,
which initially formed ports with pivotal connections. According to Figure 8, the important ports
were addressed in East Asia where it includes 16 important ports in China’s coastal areas and in
surrounding areas such as Kaohsiung and Busan. There are nine important ports in Southeast Asia,
notably strategic transhipment ports such as Singapore and Klang. Nine ports are located in the
Mediterranean of which Piraeus which is a key port in the region. Six ports are situated in North-
West Europe. Rotterdam and Hamburg are considered as the centers of the region. In addition, there
were 10 ports in North America, including 4 in the US East Coast and 6 in the US West Coast.
Moreover, 4 ports in the Middle East consist of Jeddah Port and Port Said. In secondary markets,
there were four ports with high port call frequency in Australia and New Zealand. Three of these
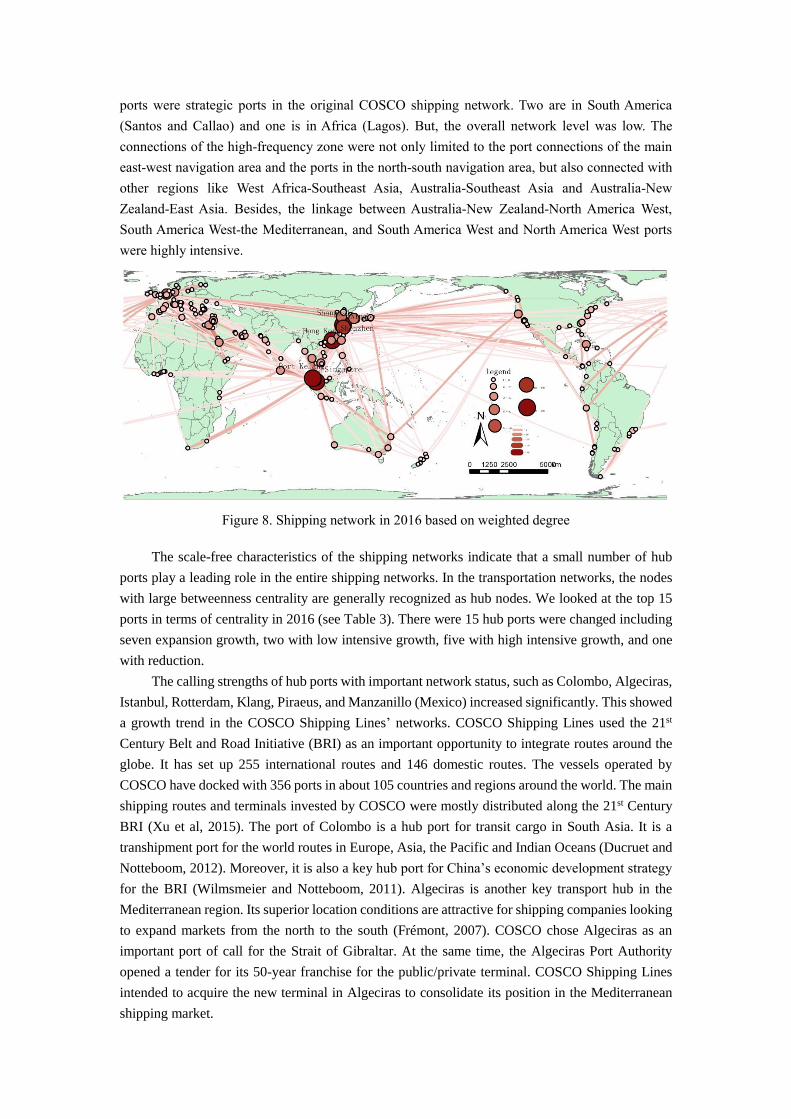
ports were strategic ports in the original COSCO shipping network. Two are in South America
(Santos and Callao) and one is in Africa (Lagos). But, the overall network level was low. The
connections of the high-frequency zone were not only limited to the port connections of the main
east-west navigation area and the ports in the north-south navigation area, but also connected with
other regions like West Africa-Southeast Asia, Australia-Southeast Asia and Australia-New
Zealand-East Asia. Besides, the linkage between Australia-New Zealand-North America West,
South America West-the Mediterranean, and South America West and North America West ports
were highly intensive.
Figure 8. Shipping network in 2016 based on weighted degree
The scale-free characteristics of the shipping networks indicate that a small number of hub
ports play a leading role in the entire shipping networks. In the transportation networks, the nodes
with large betweenness centrality are generally recognized as hub nodes. We looked at the top 15
ports in terms of centrality in 2016 (see Table 3). There were 15 hub ports were changed including
seven expansion growth, two with low intensive growth, five with high intensive growth, and one
with reduction.
The calling strengths of hub ports with important network status, such as Colombo, Algeciras,
Istanbul, Rotterdam, Klang, Piraeus, and Manzanillo (Mexico) increased significantly. This showed
a growth trend in the COSCO Shipping Lines’ networks. COSCO Shipping Lines used the 21st
Century Belt and Road Initiative (BRI) as an important opportunity to integrate routes around the
globe. It has set up 255 international routes and 146 domestic routes. The vessels operated by
COSCO have docked with 356 ports in about 105 countries and regions around the world. The main
shipping routes and terminals invested by COSCO were mostly distributed along the 21st Century
BRI (Xu et al, 2015). The port of Colombo is a hub port for transit cargo in South Asia. It is a
transhipment port for the world routes in Europe, Asia, the Pacific and Indian Oceans (Ducruet and
Notteboom, 2012). Moreover, it is also a key hub port for China’s economic development strategy
for the BRI (Wilmsmeier and Notteboom, 2011). Algeciras is another key transport hub in the
Mediterranean region. Its superior location conditions are attractive for shipping companies looking
to expand markets from the north to the south (Frémont, 2007). COSCO chose Algeciras as an
important port of call for the Strait of Gibraltar. At the same time, the Algeciras Port Authority
opened a tender for its 50-year franchise for the public/private terminal. COSCO Shipping Lines
intended to acquire the new terminal in Algeciras to consolidate its position in the Mediterranean
shipping market.

Table 3. The top 15 ports by betweenness centrality port change index
Categories Ports Median Centrality 𝐾𝑖1 𝐾𝑖2 𝐾𝑖
Expansion Growth Colombo 0.061 1.500 9.000 10.500
Algeciras 0.060 2.500 2.500 5.000
Istanbul 0.068 2.400 2.000 4.400
Rotterdam 0.103 1.364 1.900 3.264
Klang 0.212 0.724 1.615 2.340
Piraeus 0.199 1.300 0.786 2.086
Manzanillo 0.094 1.000 1.000 2.000
Low intensive growth Busan 0.117 0.714 0.703 1.417
Singapore 0.435 0.267 0.968 1.234
High intensive growth Hong Kong 0.052 0.318 0.656 0.974
Shanghai 0.083 0.231 0.723 0.954
Said 0.052 0.095 0.800 0.895
Shenzhen 0.126 0.259 0.575 0.834
Santos 0.069 0.286 0.500 0.786
Reduction Ningbo 0.052 -0.750 0.000 -0.750
The port of Istanbul is located on the southwestern coast of the Strait of Istanbul. It controls
the passage from the Mediterranean Sea to the Black Sea via the Marmara Sea. In 2015, COSCO
acquired a 65% controlling stake in the container terminal in Istanbul, Turkey. Rotterdam is a
strategic regional hub port in the North-West Europe region. It is considered as an important
connection throughout Northwestern Europe to expand in the Nordic market. COSCO Shipping
Lines acquired a 35% stake in Rotterdam Euromaxterminal in May 2016. The expansion of the
European branch line further utilized Rotterdam’s trans-shipment function. Klang is located at the
Straits of Malacca connecting between the Indian and Pacific Oceans. It is a hub that competes with
Singapore. In 2015, CSCL was mainly affiliated with Klang and Singapore in the Straits of Malacca.
COSCO was mainly affiliated with Singapore. The two firms had the same routes in Port Klang. As
the matter of fact, the low loading and unloading fees for Klang attracted the liner shipping routes
(Frémont, 2007). Thus, the network status of Port Klang has increased during the integration process.
Controlled by COSCO Shipping Lines and the construction of a sea-rail intermodal transport,
Piraeus became a pivot port of the Mediterranean Sea near the Suez Canal (Frémont 2015). It relies
on the Central European Land and Sea Express railway. This is significantly important for high-
value commodities that are shipped in large volumes (Van der Putten, 2014). The objective is to
connect among the Mediterranean Sea, the Black Sea, North America, West Asia, and Central and
Eastern European countries is a highlight of the 21st Century BRI. It can enrich the port’s value as
a consolidation base for hub port (Van der Putten, 2014). Panama established diplomatic relations
with China on June 13, 2017. Therefore, COSCO and CSCL had a few important transit ports in the
Panama Canal and the Manzanillo port (Mexico) with relative call advantages in Latin America. In
2015, COSCO and CSCL had low commonalities but strong complementarily in Manzanillo. Thus,
its port status has increased after the integration.
The philosophy of COSCO Shipping Lines for route design and port selection mainly included
port cargo volume, loading and unloading costs, port conditions, and alliance factors (Parola and
Veenstra, 2008). In order to gain the economy of scales and synergies, COSCO Shipping Lines

restructured the companies’ common routes during the route integration process. Singapore, Busan,
and Hong Kong were important hub ports in the networks and held strategic terminals for COSCO
investment. Due to the high commonalities of routes, the combination of redundant routes during
the integration process made port increased overall hub capacity significantly. Shanghai, Ningbo
and Shenzhen were the main hub ports in China’s coastal area. But, their status in the network
analysis was relatively weak for the following reasons. On the one hand, this study excludes China’s
domestic trade routes 2016 for COSCO Shipping Lines. On the other hand, there were high
commonalities in terms of route setting between COSCO and CSCL. Santos Port is the leading
container port in South America but its terminal equipment is outdated, its infrastructure is
insufficient, and its loading and unloading tools are antiquated. Therefore, its port throughput is low
(Chen and Hu, 2016). At the same time, COSCO and CSCL showed commonalities in the Santos
route. In 2016, COSCO Shipping Lines significantly increased ports of calls to other ports and hence,
Santos Port’s first position has decreased. Located in the Mediterranean at the northern end of the
Suez Canal, Port Said is one of the world’s largest trans-shipment ports. It was an important port of
call for both COSCO and CSCL in the Suez Canal. However, the strategic position of the adjacent
port Piraeus rose sharply while the shipping status of Said declined relatively.
5 Conclusions and discussion
In the context of COSCO and CSCL shipping firms’ restructuration, the reorganization of the
shipping networks was a key part of the integration of firm assets. Based on a complex network
measurement, we draw the following conclusions by examining the shipping networks pattern and
the network effects after integration.
⚫ Our findings indicated that there was no high level of homogeneity between the shipping
networks of COSCO and CSCL. Clearly, there were differences in firm marketing tactics.
The main objective of a firm is to maximize the firm’s profitability. It requires the firms
to take a proactive attitude in response to different customer needs and market changes.
Shipping companies align key resources to avoid a decline in firm performance (Nagya et
al., 2017). However, COSCO and CSCL had both overlaps and differences. While the two
shipping firms were similar in the main shipping market, they had different comparative
advantages in specific ports and segments. Both COSCO and CSCL are now using
customer focus strategies to increase their understanding of the specific customers’
preferences and predict how it is likely to change in the forthcoming years. To this end,
shipping firms are able to make use of required resources and skills to fulfil customer needs
(Kaliszewski et al., 2020; Bhattacharya et al., 2018). Moreover, the differentiation between
the two firms in secondary markets from the north to the south was obvious. The difference
in the alignment of different navigation areas provided support for the reorganization and
expansion of their original shipping patterns. The similarities in the main market routes
identified that excess capacity appeared in the shipping market. The resources of the two
firms in some routes were redundant. As a result, the reconfiguration structure could be
optimized to improve the efficiency of route utilization.
⚫ During the restructuring of the COSCO networks, the increasing number of port calls leads
to expand the existing size of the network. The newly added ports were mainly
concentrated on the crucial market areas containing North West Europe, the Mediterranean

Sea, and North America East. Regarding to the secondary markets, they were mainly
concentrated in South America. In the meantime, the total number of shipping routes, the
links of port-to-port and navigation links expanded significantly. Indeed, ports in different
shipping zones also achieved a direct contact.
⚫ In 2015, COSCO and CSCL followed the same market tendencies in their selection of
ports in various shipping areas. This included a large proportion in the main market and a
small proportion in secondary markets. Hence, their combination resulted in expanded port
coverage, strengthened routes, and achieved economies of scale. In terms of port route, the
ports with high similarity route were used to rationalize the network during the integration
process in order to address redundant resources and integrate capacity allocation. In this
process, secondary markets were strengthened to varying degrees, especially for South
America and West Africa.
In the study of the globalization process of shipping firms, the hub port strategy played a vital
role in the globalization of a shipping network based on internal growth strategies of firms such as
the merging of CMA CGM and Delmas, as well as of Maersk Sealand and P&O Nedlloyd in 2005
(Frémont, 2015). The cultivation and selection of overseas hub ports were not only reflected in the
overall increase in the network economy in the company optimization approach, but also generated
the important strategy of exploring secondary markets under the effect of globalization. During the
integration of COSCO and CSCL’s routes, Piraeus and Rotterdam are important transhipment ports
in the Mediterranean navigation area and the northwest European region respectively. The Algeciras
and Manzanillo (Mexico) had transit impacts on improved connections between north and south
markets. In the process of consolidating overseas markets and expanding secondary markets,
COSCO Shipping Lines strengthened its overseas hub port strategy and selected ports with certain
geographical advantages. A typical example is Algeciras, which participated in terminal operations
and project cooperation.
In terms of study limitations, we analyzed shipping schedules but excluding other shipping
factors such as ship capacity and sailing time. From the perspective of the route networks pattern,
the overall operation of the shipping enterprise after reorganization could not be fully investigated.
The actual overall pattern of the shipping industry globalization was limited due to the two firms
involved in the restructuring of COSCO Shipping Lines that lacked a more comprehensive
comparison. In future studies, we will consider other elements such as ship capacity and terminal
operations to examine the overall pattern of the global shipping industry. The future M&A strategy
means that shipping companies will open up new organic growth paths, markets and customers
through acquisition. Its purpose is to boost up the economic growth and sustainable development of
shipping enterprises in the complicated operating environment in the future. Therefore, M&A
strategies will be continuously promoted. In addition to economies of scope and scale, operations
management is also an important indicator that we can use to assess the impact of mergers and
acquisitions on enterprises. After the merger, it is necessary to consider whether the information
exchange and practices of shipping companies can fully solve various problems in the linkage and
the overall operating efficiency.

Acknowledgments:
This work was supported by the Research Grant of the National Natural Science Foundation
of China under Grant [41971155], Major program of National Social Science Fund of China under
Grant [16ZAD016], the MOE Project of Key Research Institute of Humanities and Social Sciences
at Universities under Grant [17JJD790007].
Declaration of interest statement:
There are no conflicts of interest.
References
Alexandrou, G., D. Gounopoulos, and H.M. Thomas. (2014) ‘Mergers and acquisitions in shipping’,
Transportation Research Part E: Logistics and Transportation Review, Vol. 61, No. 1, pp.212-
234.
Andreou, P.C., C. Louca, and P.M. Panayides. (2012) ‘Valuation effects of mergers and acquisitions
in freight transportation’, Transportation Research Part E: Logistics and Transportation Review,
Vol. 48, Nol. 6, pp.1221-1234.
Bhattacharya, A., S. Misra, and H. Sardashti, (2019), ‘Strategic orientation and firm risk’,
International Journal of Research in Marketing, Vol. 36, No. 4, p. 509-527.
Choi, N.Y.H., and S. Yoshida. (2013) ‘Evaluation of M&A effects in Japanese shipping companies:
case study of NYK & Showa line and OSK & Navix line’, The Asia Journal of Shipping and
Logistics, Vol. 29, No. 1, pp.23-43.
Chen, F., and Z. Hu. (2016) ‘Analysis of shipping network of Southeast-Asian route along maritime
Silk Road based on complex networks’, Journal of Shanghai University (natural science), Vol.
22, No. 6, pp.804-812.
Comtois, C. and J.J. Wang (2003) ‘Géopolitique et transports: nouvelles perspectives stratégiques
dans le détroit de Taiwan’, Etudes Internationales, Vol. 34, No., 2, pp.213-227.
Das, S. (2011) ‘To partner or to acquire? A longitudinal study of alliances in the shipping industry’,
Maritime Policy & Management, Vol. 38, No. 2, pp.111-128.
Drahokoupil, J. (2017) ‘Chinese investment in Europe: corporate strategies and labour relations’,
ETUI: Brussel.
Du, C., J., Wang, and H.-H. Mo. (2016) ‘Spatial pattern analysis of China container shipping
network on complex theory’, Resources and Environment in the Yangtze Basin, Vol. 25, No. 2,
pp.190-198.
Ducruet, C, and T. Notteboom. (2012) ‘The worldwide maritime network of container shipping:
spatial structure and regional dynamics’, Global Networks, Vol. 12, No. 2, pp.395-423.
Ducruet, C., Wang, L. (2018) ‘China’s global shipping connectivity: internal and external dynamics
in the contemporary era (1890–2016)’, Chinese Geographical Science, Vol. 28, No. 2, pp.202-
216.
Frémont, A. (2007) ‘Global maritime networks: the case of Maersk’, Journal of Transport
Geography, Vol. 15, No. 6, pp.431-442.
Frémont, A. (2009) ‘Empirical evidence for integration and disintegration of maritime shipping:
port and logistics activities’, OECD-ITF Discussion Paper, No. 2009-1.
Frémont A. (2015) ‘A geo-history of maritime networks since 1945. The case of the Compagnie

Générale Transatlantique’s transformation into CMA-CGM’, In: Ducruet C. (Ed.), Maritime
Networks: Spatial Structures and Time Dynamics, London and New York: Routledge, pp. 37-49.
Fusilo, M. (2009) ‘Structural factors underlying mergers and acquisitions in liner shipping’,
Maritime Economics & Logistics, No. 11, 209–226.
Jiang, J., Lee, L.H., Chew, E.K.P. and Gan, C.C. (2015) ‘Port connectivity study: an analysis
framework form a global container liner shipping network perspective’, Transportation Research
Part E, Vol. 73, No. 1, pp.47-64.
Kaluza, P., A. Kölzsch, M. T. Gastner, and B. Blasius, (2010) ‘The complex network of global cargo
ship movements’, Journal of the Royal Society Interface, Vol. 7, No. 48, pp.1093-1103.
Lau, Y.Y. (2018), ‘An empirical study of shipping networks’, Lambert Academic Publishing:
Saarbrücken, Germany.
McCalla, R.J., Slack, B., and Comtois, C. (2004) ‘The geographical hierarchy of container shipping
networks in the Caribbean basin and Mediterranean sea’, Paper presented at the 10th World
Conference on Transport Research (WCTR), Istanbul, July 4-8.
Metge, M., Ducruet, C. (2017) ‘L’Afrique dans la logistique mondiale: une approche par les réseaux
d’armateurs de lignes maritimes conteneurisées’, Cahiers Scientifiques du Transport, No. 72,
pp.17-41.
Nagy, G., C. M. Megehee, A. G. Woodside, T. Laukkanen, S. Hirvonen, and H. Reijonen, (2017)
‘Achieving requisite variety in modeling firms' strategy heterogeneities: Explaining paradoxical
firm-market performances’, Industrial Marketing Management, Vol. 65, p. 100-128.
Kaliszewski, A., A. Kozłowski, J. Dąbrowski, and H. Klimek, (2020) ‘Key factors of container port
competitiveness: A global shipping lines perspective’, Marine Policy, p. 103896.
Onwuegbuchunam, D.E., Okeke, K.O., Igboanusi, C. and Ugboma, O. (2018) ‘Structural changes
in the global transport chain: implications for ports’, Journal of Sustainable Development of
Transport and Logistics, Vol. 3, No. 1, pp.22-28.
Parola, F. and A.W. Veenstra. (2008) ‘The spatial coverage of shipping lines and container terminal
operators’, Journal of Transport Geography, Vol. 73, No1, pp.292-299.
Rimmer, P.J. and C. Comtois (2005) ‘China's extra- and intra-Asian liner shipping connections,
1990-2000’, Journal of International Logistics and Trade, No. 3, pp.75-97.
Rodriguez-Pose, A. and H. Zademach. (2003) ‘Rising metropoli: the geography of mergers and
acquisitions in Germany’, Urban Studies, Vol. 40, No. 10, pp.1895-1923.
Rong, C. (2001) ‘On the economies of scale and scope in transport network’, ChinaRailway Science,
Vol. 22, No. 4, pp.100-107.
Slack, B. and A. Frémont. (2009) ‘Fifty years of organisational change in container shipping:
regional shift and the role of family firms’, GeoJournal, Vol. 74, No. 1, pp.23-34.
Tu, N., Adiputranto, D., Fu, X. and Li, Z.C. (2018) ‘Shipping network design in a growth market:
the case of Indonesia’, Transportation Research Part E, Vol. 117, No. 1, pp.108-125.
Wang, C. (2008) ‘International reorganization of shipping liners and its effect on world network
structure’ World Regional Studies, No. 1, pp.94-104+118.
Wang, C. (2012) ‘The evolution mechanism of container port network’, Science Press: Beijing,
China.
Wang L., and Y. Hong. (2016) ‘Spatial structure of container port systems across the Taiwan Straits
under the direct shipping policy: a complex network system approach’, ActaGeographica Sinica,
Vol. 71, No. 4, pp.605-620.

Wang, L., Zhu, Y., Ducruet, C., Bunel, M., Lau, Y.Y. (2018) ‘From hierarchy to networking: The
evolution of the ’21st century Maritime Silk Road’ container shipping system’, Transport
Reviews, Vol. 38, No. 4, pp.416-435.
Wilmsmeier, G., and T. Notteboom (2011) ‘Determinants of liner shipping network configuration:
a two-region comparison’, GeoJournal Vol. 76, No. 1, pp.213-228.
Van der Putten, F.P. (2014) ‘Chinese investment in the port of Piraeus, Greece: the relevance for
the EU and the Netherlands’, Clingendael Report: Netherlands Institute of International
Relations Clingendael, The Netherland.
Xu, M., Z. Li, Y. Shi, X. Zhang, and S. Jiang. (2015) ‘Evolution of regional inequality in the global
shipping network’, Journal of Transport Geography. Vol. 44, No. 1, pp.1-12.
Yeong, S.H. and Jung, S.S. (2017) ‘An analysis of the competitiveness of major liner shipping
companies’, The Asian Journal of Shipping and Logistics, Vol. 33, No. 2, pp. 53-60.
Yip, T.L., Lun, Y.H.V. and Lau, Y.Y. (2012), ‘Scale diseconomies and efficiencies of liner shipping,
Maritime Policy & Management’, Vol. 39, No. 7, pp.673-683.