CONTACT FATIGUE MECHANISMS AS A FUNCTION...
88
CONTACT FATIGUE MECHANISMS AS A FUNCTION OF CRYSTAL ASPECT RATIO IN BARIA-SILICATE GLASS-CERAMICS By KALLAYA SUPUTTAMONGKOL A DISSERTATION PRESENTED TO THE GRADUATE SCHOOL OF THE UNIVERSITY OF FLORIDA IN PARTIAL FULFILLMENT OF THE REQUIREMENTS FOR THE DEGREE OF DOCTOR OF PHILOSOPHY UNIVERSITY OF FLORIDA 2003
-
Upload
vuongxuyen -
Category
Documents
-
view
215 -
download
0
Transcript of CONTACT FATIGUE MECHANISMS AS A FUNCTION...

CONTACT FATIGUE MECHANISMS
AS A FUNCTION OF CRYSTAL ASPECT RATIO IN BARIA-SILICATE GLASS-CERAMICS
By
KALLAYA SUPUTTAMONGKOL
A DISSERTATION PRESENTED TO THE GRADUATE SCHOOL OF THE UNIVERSITY OF FLORIDA IN PARTIAL FULFILLMENT
OF THE REQUIREMENTS FOR THE DEGREE OF DOCTOR OF PHILOSOPHY
UNIVERSITY OF FLORIDA
2003

Copyright 2003
by
Kallaya Suputtamongkol

ACKNOWLEDGMENTS
I would like to thank my advisors, Dr. K.J. Anusavice and Dr. J.J. Mecholsky Jr. I
greatly appreciate the support and guidance they have provided for during my studies
here at UF. They have also taught me valuable lessons of good research. I have had an
excellent learning experience, which I can use to develop my career skills as a teacher.
Special thanks go to Ben Lee who has always been there to help. Without Ben, I could
not have gone home as soon as is now possible. Very special thanks go to my mother
who has always encouraged me. I also would like to thank all my friends for their
support and friendship. They have made my life here a lot easier and more pleasant.
iii
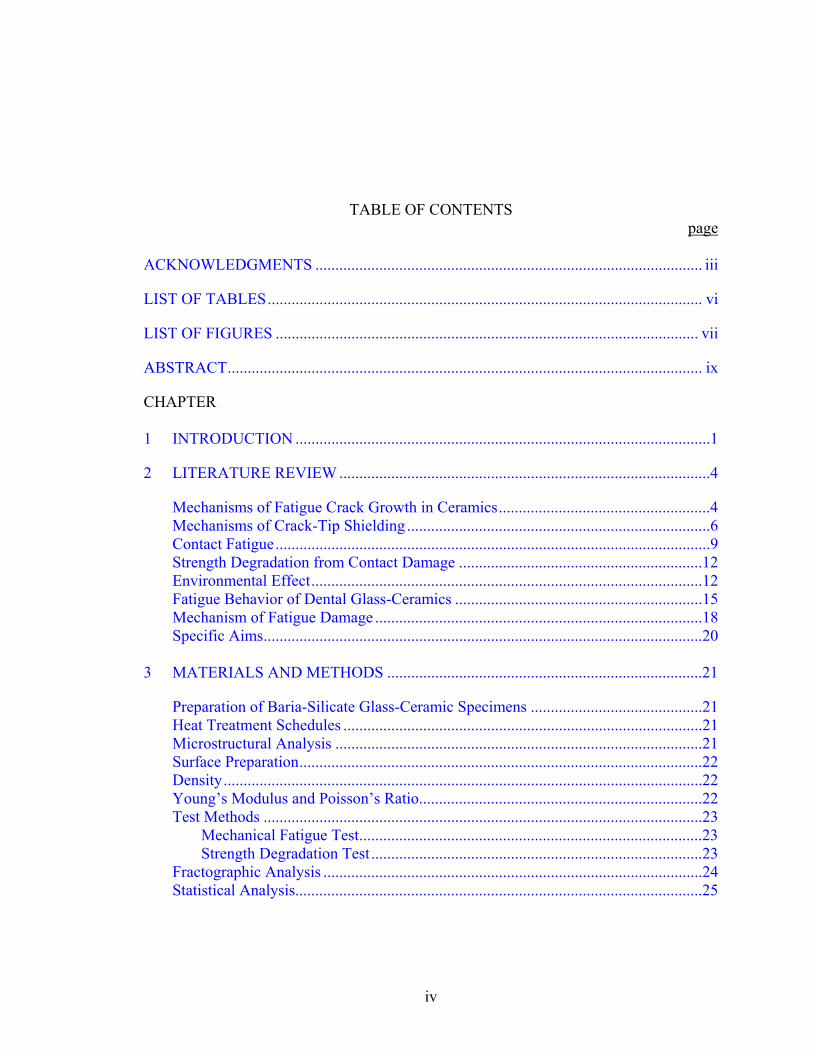
TABLE OF CONTENTS page ACKNOWLEDGMENTS ................................................................................................. iii
LIST OF TABLES............................................................................................................. vi
LIST OF FIGURES .......................................................................................................... vii
ABSTRACT....................................................................................................................... ix
CHAPTER 1 INTRODUCTION ........................................................................................................1
2 LITERATURE REVIEW .............................................................................................4
Mechanisms of Fatigue Crack Growth in Ceramics.....................................................4 Mechanisms of Crack-Tip Shielding ............................................................................6 Contact Fatigue.............................................................................................................9 Strength Degradation from Contact Damage .............................................................12 Environmental Effect..................................................................................................12 Fatigue Behavior of Dental Glass-Ceramics ..............................................................15 Mechanism of Fatigue Damage ..................................................................................18 Specific Aims..............................................................................................................20
3 MATERIALS AND METHODS ...............................................................................21
Preparation of Baria-Silicate Glass-Ceramic Specimens ...........................................21 Heat Treatment Schedules ..........................................................................................21 Microstructural Analysis ............................................................................................21 Surface Preparation.....................................................................................................22 Density........................................................................................................................22 Young’s Modulus and Poisson’s Ratio.......................................................................22 Test Methods ..............................................................................................................23
Mechanical Fatigue Test......................................................................................23 Strength Degradation Test ...................................................................................23
Fractographic Analysis ...............................................................................................24 Statistical Analysis......................................................................................................25
iv

4 RESULTS AND DISCUSSION.................................................................................26
Strength Degradation ..................................................................................................29 Fractographic Analysis ...............................................................................................30
Baria-Silicate Glass .............................................................................................30 Strength Degradation Associated with a Cone-Crack .........................................35 Baria-Silicate Glass-Ceramics.............................................................................45
Fatigue Failure Mechanisms.......................................................................................55 5 CONCLUSIONS ........................................................................................................71
REFERENCES ..................................................................................................................73
BIOGRAPHICAL SKETCH .............................................................................................78
v
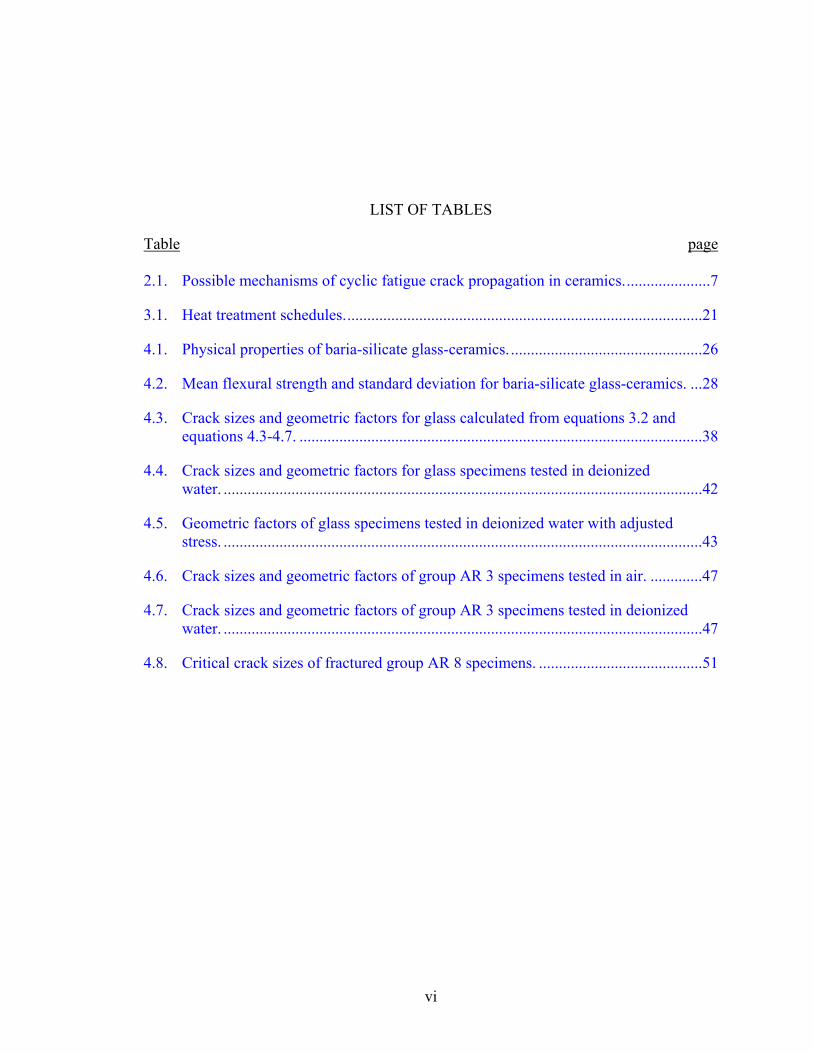
LIST OF TABLES
Table page 2.1. Possible mechanisms of cyclic fatigue crack propagation in ceramics......................7
3.1. Heat treatment schedules..........................................................................................21
4.1. Physical properties of baria-silicate glass-ceramics.................................................26
4.2. Mean flexural strength and standard deviation for baria-silicate glass-ceramics. ...28
4.3. Crack sizes and geometric factors for glass calculated from equations 3.2 and equations 4.3-4.7. .....................................................................................................38
4.4. Crack sizes and geometric factors for glass specimens tested in deionized water. ........................................................................................................................42
4.5. Geometric factors of glass specimens tested in deionized water with adjusted stress. ........................................................................................................................43
4.6. Crack sizes and geometric factors of group AR 3 specimens tested in air. .............47
4.7. Crack sizes and geometric factors of group AR 3 specimens tested in deionized water. ........................................................................................................................47
4.8. Critical crack sizes of fractured group AR 8 specimens. .........................................51
vi

LIST OF FIGURES
Figure page 2.1. Schematic illustration of the fatigue crack propagation stages. .................................6
2.2. Hertzian contact loading...........................................................................................10
2.3. Cone crack parameters. ............................................................................................13
2.4 Schematic illustration of the reaction of water and a strained Si-O-Si bond at the crack tip. .............................................................................................................14
2.5. Schematic illustration of crack propagation in the presence of a chemical wedge. ......................................................................................................................16
3.1. Schematic illustration of cyclic fatigue fixture. .......................................................24
3.2. Schematic representation of fracture surface features: ai and bi are original crack depth and width; and acr and bcr are critical crack depth and width. .............25
4.1. SEM images of baria-silicate glass-ceramic microstructures with aspect ratios of 3/1 (a) and 8/1 (b) after etching with 1% HF for 10 s (4000X)...........................27
4.2. Mean strength of baria-silicate glass-ceramics as a function of number of loading cycles. ..........................................................................................................29
4.3. Schematic illustrations of selected failure origins from cone cracks in glass and glass-ceramic specimens (Top view). ......................................................................31
4.4. SEM images of a cone crack formed in deionized water after 104 loading cycles. Fracture typically originated from either point B........................................32
4.5. SEM images of a triangular crack in a glass specimen caused by cyclic loading in air for 105 cycles. Fracture initiated from points A-A.........................................33
4.6. SEM images of a semi-elliptical surface crack in a glass specimen caused by cyclic loading in deionized water for 105 cycles......................................................34
4.7. SEM images of a typical semi-elliptical crack in a glass specimen caused by polishing. ..................................................................................................................34
4.8. Schematic illustration of a cone crack induced by a Hertzian contact load. ............36
vii
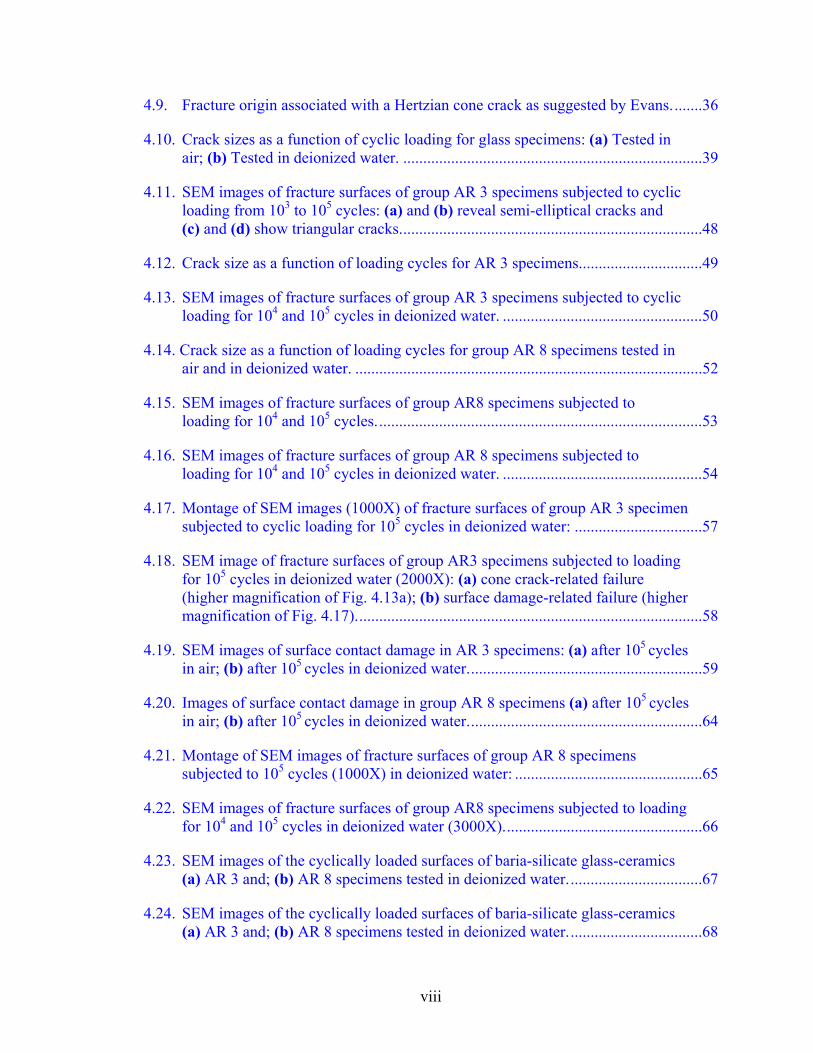
4.9. Fracture origin associated with a Hertzian cone crack as suggested by Evans........36
4.10. Crack sizes as a function of cyclic loading for glass specimens: (a) Tested in air; (b) Tested in deionized water. ...........................................................................39
4.11. SEM images of fracture surfaces of group AR 3 specimens subjected to cyclic loading from 103 to 105 cycles: (a) and (b) reveal semi-elliptical cracks and (c) and (d) show triangular cracks............................................................................48
4.12. Crack size as a function of loading cycles for AR 3 specimens...............................49
4.13. SEM images of fracture surfaces of group AR 3 specimens subjected to cyclic loading for 104 and 105 cycles in deionized water. ..................................................50
4.14. Crack size as a function of loading cycles for group AR 8 specimens tested in air and in deionized water. .......................................................................................52
4.15. SEM images of fracture surfaces of group AR8 specimens subjected to loading for 104 and 105 cycles..................................................................................53
4.16. SEM images of fracture surfaces of group AR 8 specimens subjected to loading for 104 and 105 cycles in deionized water. ..................................................54
4.17. Montage of SEM images (1000X) of fracture surfaces of group AR 3 specimen subjected to cyclic loading for 105 cycles in deionized water: ................................57
4.18. SEM image of fracture surfaces of group AR3 specimens subjected to loading for 105 cycles in deionized water (2000X): (a) cone crack-related failure (higher magnification of Fig. 4.13a); (b) surface damage-related failure (higher magnification of Fig. 4.17).......................................................................................58
4.19. SEM images of surface contact damage in AR 3 specimens: (a) after 105 cycles in air; (b) after 105 cycles in deionized water...........................................................59
4.20. Images of surface contact damage in group AR 8 specimens (a) after 105 cycles in air; (b) after 105 cycles in deionized water...........................................................64
4.21. Montage of SEM images of fracture surfaces of group AR 8 specimens subjected to 105 cycles (1000X) in deionized water: ...............................................65
4.22. SEM images of fracture surfaces of group AR8 specimens subjected to loading for 104 and 105 cycles in deionized water (3000X)..................................................66
4.23. SEM images of the cyclically loaded surfaces of baria-silicate glass-ceramics (a) AR 3 and; (b) AR 8 specimens tested in deionized water..................................67
4.24. SEM images of the cyclically loaded surfaces of baria-silicate glass-ceramics (a) AR 3 and; (b) AR 8 specimens tested in deionized water..................................68
viii
Abstract of Dissertation Presented to the Graduate School of the University of Florida in Partial Fulfillment of the Requirements for the Degree of Doctor of Philosophy
CONTACT FATIGUE MECHANISMS AS A FUNCTION OF CRYSTAL ASPECT RATIO
IN BARIA-SILICATE GLASS-CERAMICS
By
Kallaya Suputtamongkol
May 2003
Chair: Kenneth J. Anusavice Cochair: John J. Mecholsky Jr. Major Department: Materials Science and Engineering Ceramic materials are potentially useful for dental applications because of their
esthetic potential and biocompatibility. However, the existence of fatigue damage in
ceramics raises considerable concern regarding its effect on the life prediction of dental
prostheses. During normal mastication, dental restorations are subjected to repeated
loading more than a thousand times per day and relatively high clinical failure rates for
ceramic prostheses have been reported. To simulate the intraoral loads, Hertzian
indentation loading was used in this study to characterize the fatigue failure mechanisms
of ceramic materials using clinically relevant parameters. The baria-silicate system was
chosen because of the nearly identical composition between the crystal and the glass
matrix. Little or no residual stress is expected from the elastic modulus and thermal
expansion mismatches between the two phases. Crystallites with different aspect ratios
can also be produced by controlled heat treatment schedules. The objective of this study
ix

was to characterize the effect of crystal morphology on the fatigue mechanisms of baria-
silicate glass-ceramics under clinically relevant conditions.
The results show that the failure of materials with a low toughness such as baria-
silicate glass (0.7 MPa•m1/2) and glass-ceramic with an aspect ratio of 3/1 (1.3 MPa•m1/2)
initiated from a cone crack developed during cyclic loading for 103 to 105 cycles. The
mean strength values of baria-silicate glass and glass-ceramic with an aspect ratio of 3/1
decreased significantly as a result of the presence of a cone crack. Failure of baria-
silicate glass-ceramics with an aspect ratio of 8/1 (Kc = 2.1 MPa•m1/2) was initiated from
surface flaws caused by either polishing or cyclic loading. The gradual decrease of
fracture stress was observed in specimens with an aspect ratio of 8/1 after loading in air
for 103 to 105 cycles. A reduction of approximately 50% in fracture stress levels was
found for specimens with an aspect ratio of 8/1 after loading for 105 cycles in deionized
water. The mechanisms for cyclic fatigue crack propagation in baria-silicate glass-
ceramics are similar to those observed under quasi-static loading conditions. An
intergranular fracture path was observed in glass-ceramics with an aspect ratio of 3/1.
For an aspect ratio of 8/1, a transgranular fracture mode was dominant.
x

CHAPTER 1 INTRODUCTION
Ceramic materials are potentially useful for a wide variety of medical and dental
applications. They have several advantages over metals including their esthetic potential,
chemical inertness, low thermal conductivity, low thermal diffusivity, excellent
biocompatibility and their ability to be shaped using a variety of forming techniques.
However, their major drawback is their low fracture resistance. For dental prostheses,
relatively high clinical failure rates have been reported for several dental ceramics (1-3)
and this failure potential limits their use for dental applications. During mastication,
dental restorations are subjected to repeated loading, and crack initiation can occur after a
significant number of stress cycles that can lead to fatigue failure. In an attempt to gain a
better understanding of the failure mechanisms, previous investigators have focused on
the characterization of fatigue damage in several dental ceramics (4-10).
Hertzian indentation loading has been used in several studies to characterize the
mechanical properties of ceramic materials (9-12). Contact indentation loading is a
simple method for inducing surface damage and straightforward analytic relations can be
derived for the critical loads in terms of basic material properties (i.e., elastic modulus,
hardness, and fracture toughness) and contact radius (13). Clinically relevant parameters
can be controlled by the use of a repeated indentation loading test to simulate occlusal
intra-oral loads. However, the validity of the results for dental ceramics from the
Hertzian indentation test may be questionable when the loading conditions for the test do
not adequately reflect the loading characteristics that occur under situations in which
1

2
clinical prostheses have failed. Based on previous studies, fracture initiation occurred at
different sites depending upon the Hertzian loading conditions. The results of two
clinical studies indicated that crack initiation of clinically failed fixed prostheses occurred
either at the cement/ceramic interface or at the interface between the core and veneering
ceramics (14, 15). In contrast, failure of specimens from a blunt indentation test occurs
as a ring/cone crack or as a result of contact damage. The magnitude of load to failure
values determined from the blunt indentation tests appear to be too high compared with
normal occlusal forces. However, with a well-controlled testing protocol, valuable
information about fatigue failure parameters and mechanisms can be obtained from this
type of loading relative to potential dental applications.
Cyclic fatigue tests on baria-silicate glass and glass-ceramics using a spherical
indenter were selected to demonstrate the effect of crystal morphology on the mechanical
response to contact fatigue damage. The baria-silicate glass-ceramic system was chosen
for this study because (1) the system has a negligible difference in thermal expansion
between the glass phase and crystal phase, thereby sustaining little residual stress upon
cooling (16); (2) the baria-silicate glass phase and crystal phase have a nearly identical
composition; (3) the baria-silicate system can be nucleated homogeneously without the
addition of a nucleating agent; and (4) in higher crystal volume fractions, microstructures
with different aspect ratios can be produced (17).
The objectives of this study were to (1) test the hypothesis that after a specific
number of cycles, the mean strength of baria-silicate glass-ceramics subjected to cyclic
loading decreases because of critical flaw propagation; (2) test the hypothesis that the
crack growth rate of baria-silicate glass-ceramics under cyclic loading and low stress

3
conditions is strongly dependent on the number of stress cycles; (3) characterize the
influence of crystal morphology on fracture behavior as a function of number of loading
cycles; and (4) test the hypothesis that the crack growth rate of baria-silicate glass-
ceramics subjected to cyclic fatigue can be accelerated by environmental effects.

CHAPTER 2 LITERATURE REVIEW
Recent studies (9-12) have demonstrated clearly that fatigue damage occurs under
cyclic loading conditions in some commercial ceramics, and the strength of ceramics can
be compromised by slow crack growth of a critical flaw during repeated loading. When
the crack grows, the crack length increases over time until it reaches the critical value that
can cause a catastrophic fracture. Therefore, stress values well below the levels that
cause fast fracture can produce premature fracture of the ceramic structure. When the
crack grows under cyclic loading conditions, the crack growth rate can be approximated
using a simple power law equation that is dependent on the stress intensity ranges (18).
To select ceramics for specific structural applications, one should be aware of the crack
growth rates and cyclic fatigue behavior of ceramic materials during their clinical uses.
Damage induced by cyclic loading in brittle solids can lead to much higher crack growth
rates than those associated with environmental cracking under sustained loading
conditions (6). As a consequence, the service lifetime of brittle solid structures can be
reduced under repeated loading conditions.
Mechanisms of Fatigue Crack Growth in Ceramics
The crack growth behavior in ceramics is different than that in ductile materials.
Dislocation slip, which is a prominent crack propagation mechanism in metals, generally
does not occur in brittle solids at room temperature because of their covalent or ionic
bonds (19-21). Subcritical crack growth in brittle solids under cyclic loading involves
complex phenomena. In many brittle ceramics, there are no known differences between
4

5
the mechanisms of static and cyclic crack growth at low temperatures. There are some
general effects of cyclic loading on the growth of cracks, especially in ceramic materials
containing long cracks, i.e., compared with their microstructures. The pronounced
increase in crack growth rate caused by cyclic loading, compared with static test
conditions, is primarily caused by the breakdown of the bridging zone in the wake of the
crack tip. Residual stress produced by a thermal expansion mismatch between two
phases and elastic anisotropy between the crystals can promote the formation of
microcracks during the heating process and subsequent mechanical loading (18). The
crack growth rate can be related to the stress intensity factor using a power law
relationship:
m)C(dNda
∆Κ= (2.1)
)]m[log(ClogdN
∆Κ+=dalog (2.1a)
where da/dN is the crack growth rate per cycle, ∆K is the stress intensity factor range
(Kmax-Kmin), and C and m are experimentally determined constants (18).
The typical crack growth rate behavior of materials is represented by a sigmoidal
curve on a logarithmic graph of da/dN versus ∆K, and this curve can be divided into three
distinct regions as shown in Fig. 2.1. The graph is linear in region II, which is consistent
with equation 2.1.
In previous studies, several crack growth mechanisms have been identified in
ceramics that relate to intrinsic microstructural damage and extrinsic crack-tip shielding
mechanisms (19-21). In metals, intrinsic mechanisms such as dislocation movement and
crack-tip plasticity are dominant, and they involve blunting and resharpening of the

6
crack. Conversely, extrinsic mechanisms result from formation of an inelastic zone
surrounding the crack wake, or from physical contact with the crack surfaces.
Region I Region II Region III
m)C(dNda
∆Κ=
KIC
Log ∆K
10-2
10-4
dNda
10-6
Figure 2.1. Schematic illustration of the fatigue crack propagation stages.
Mechanisms of Crack-Tip Shielding
Although shielding under monotonic loading results in a reduction in the local
driving force, the effect under cyclic loading may be different because the magnitude of
the principal driving force for fatigue crack progression is the difference between the
applied maximum and minimum stress intensity factors, ∆K. The difference in stress
intensity factor can be increased or decreased by changing Kmax and Kmin. While several
mechanisms of cyclic fatigue crack growth in ceramics have been proposed, Ritchie et al.
(20, 21) described the nature of ceramic fatigue according to two classes, intrinsic and

7
extrinsic mechanisms. Summarized in Table 2.1 are the possible mechanisms for crack
propagation under cyclic fatigue conditions in ceramics.
Table 2.1. Possible mechanisms of cyclic fatigue crack propagation in ceramics. Mechanisms of cyclic fatigue crack growth in ceramics
(1) Extrinsic mechanisms
1.1 Degradation of transformation
toughening
1.2 Damage of bridging zone
- Friction and wear of
unbroken
ligaments or whisker/fiber
reinforcements
- Crushing of asperities and
interlocking zones
1.3 Fatigue of ductile reinforcing
phases
(2) Intrinsic mechanisms
2.1 Accumulated localized
microplasticity/microcracking
2.2 Mode II and III crack propagation
on unloading
2.3 Crack tip blunting/resharpening
2.4 Relaxation of residual stress
Source (20)
The shielding mechanisms involve crack deflection, zone shielding, contact
shielding, and a combination of zone and contact shielding. These mechanisms are the
principal means of increasing crack resistance in ceramics by reducing the local stress
intensity range, ∆K, which is a driving force for fatigue. Intrinsic mechanisms involve the
creation of a fatigue-damaged microstructure ahead of the crack tip, while the extrinsic
pathways involve a reduction of stress intensity via crack-tip shielding. Lathabi et al.
(22) and Dauskardt (23) indicated that the frictional wear mechanism accounts for cyclic
fatigue degradation in polycrystalline ceramics that exhibit grain bridging as a

8
toughening mechanism. This model is based on the sliding wear degradation of frictional
grain bridges, which reduces the toughening capacity from bridging under cyclic loading.
The accumulation of debris from wear processes was observed at the frictional sliding
sites during fatigue loading (24). It is suggested that this mechanism may be widespread
in polycrystalline ceramics with a crack-bridging toughening mechanism.
Brittle materials are known to fracture in monotonic compressive loading in two
different patterns, extrinsic and intrinsic modes (25). In an extrinsic mode, cracks extend
across planes of local maximum tension and propagate along a direction parallel to the
maximum plane of compression. The intrinsic mode occurs by a microscopic process
caused from an accumulation of pre-existing microcracks or weak interfaces and results
in a shear fault when the critical loading conditions are met. Ewart and Suresh (26)
confirmed the existence of crack growth in ceramics under cyclic compressive loading.
They used single edge-notched polycrystalline alumina specimens subjected to a
compressive cyclic load (26). Compressive stresses did not induce any crack growth,
since only tensile stress can cause crack propagation. They found that the formation of
particle debris within the crack was a characteristic feature of crack advance under cyclic
compression. The particles were generated by fracture along the grain boundaries and
their presence leads to crack closure effects. The authors reported that the crack growth
rate increased in alumina specimens when they periodically cleaned the debris particles
from between the crack faces. Therefore, their experimental results appear to be in
conflict with previous data (19-21), which suggested that the formation of debris particles
between the crack interfaces usually leads to a crack-tip opening condition or a wedging
effect. However, the cleaning process may be responsible to an increase in crack growth

9
rate by enhancing the stress corrosion at the crack tip. As a result, the increase in crack
growth rate in this study can be accelerated by either a wedging effect or stress corrosion.
The primary mechanism of cyclic fracture in alumina involves intergranular fracture,
unlike quasi-static fracture in which a transgranular fracture mode is prevalent. Grain
boundary microcracks nucleated during the compressive loading cycle within the process
zone at the notch tip lead to a reduction in the elastic modulus of the material in that
zone. The difference in the compliance of the material within the process zone and that
of the surrounding area can induce residual tensile stress during unloading of the
maximum compressive stress over a distance comparable to the size of the process zone.
Ewart and Suresh (26) hypothesized that residual tensile stress contributes to the growth
of fatigue cracks associated with grain boundary failure (18).
Contact Fatigue
For Hertzian contact of a sphere indenting a planar surface (18), one can calculate
the contact radius (a) and the pressure (p) within the contact area following these
assumptions: (1) the contact between the surfaces is nonconforming and frictionless; and
(2) the dimensions of the two bodies in contact are significantly larger than the contact
area.
3/1
*4E3PRa
= (2.2)
2/12
2
2 )aR1(
a23P
−p =π
(2.3)
2
22
1
21
Eν1
Eν1
*E1 −
+−
= (2.4)

10
where E1 and E2 are the elastic moduli, ν1 and ν2 are the Poisson’s ratio values of two
bodies, and E* is the effective elastic modulus.
The following general results are obtained from a Hertzian analysis (18, 27):
(1) The maximum normal tensile stress occurs on the surface at the contact perimeter,
and 0m p)21(21 ν−=σ , where p0 = P/πa2
(2) The maximum shear stress (τm) exists beneath the surface along the contact axis at a depth of 0.48a,
τm = 0.48p0
(3) These results imply that failure should initiate near the contact perimeter at the surface, while plastic yielding, crushing or microcracking is likely to occur beneath the surface.
P
r
Figure 2.2. Hertzian contact loadi
Theoretically, when a hard sph
elastic specimen, it produces a classi
greater than the critical value. The c
the path that is normal to the tensile s
relation between the applied load P a
2R
ng.
erical indenter is loaded normally on a flat, thick
cal Hertzian cone crack when the applied stress is
one crack grows steadily with increasing load along
tresses. Roesler (28) established the following
nd cone base radius R:

11
constantR
P3/2 = (2.4)
The distinctive characteristic of a blunt indenter is an elastic contact zone during
the time when the contact pressure increases monotonically with an expanding contact
circle. The contact becomes inelastic only if the contact pressure exceeds some critical
level for irreversible deformation prior to development of the cone-crack fracture (29).
The microstructure of a material significantly affects the damage response. Elastic-to-
plastic deformation occurs by microstructural coarsening of the crystal phase (9-12). A
zone of residual stress can also be generated once permanent strain is induced during
unloading (18). Residual stress can play a significant role in influencing the fatigue
responses as well as failure processes.
Fatigue can be considered either in terms of the accumulation of distributed damage
or as the propagation of a single crack. Lawn et al (24) identified the damage model
based on microcrack extension from the closed shear faults in the constraining
compressive fields. These faults account for a quasi-plastic deformation at the site of
loading that can lead to damage accumulation, material removal and wear, and strength
degradation in ceramic materials. The onset of quasi-plastic deformation can be
determined by the deviation from the nonlinear stress-strain curve (11, 12). Bonded-
interface specimens were used to determine the severity of subsurface damage caused
from a single indentation and contact fatigue. At the microstructural level, Lawn et al
(27) identified the character of shear faults as (a) cracking at the weak interfaces between
the glass phase and the second phase, (b) transgranular twinning, or (c) block slip in
monolithic structures. The general feature of these faults is the discreteness, localized by
the grain structure. The secondary microcracks are initiated at the ends of these faults.
12
Strength Degradation from Contact Damage
When blunt indentation produces the dominant flaws, the specimens will fail from
the indentation sites. Examination of fractographic features from previous studies (27,
30) confirmed that failure of fine grain and medium grain ceramics originated from the
cone base, and from within the subsurface damage zone in coarse-grain material. For
brittle materials, the presence of a cone crack will cause a rapid reduction in critical stress
for fast fracture of ceramic specimens. Strength degradation can be determined from the
classical Irwin-Griffith equation by using crack size calculated from the radius of a ring
crack, and a cone base angle. The critical stress intensity factor for the cone crack system
is identified as (29)
3/2C cχP
=Κ (2.5)
where c is the cone crack length, and χ is a dimensionless constant that depends only on
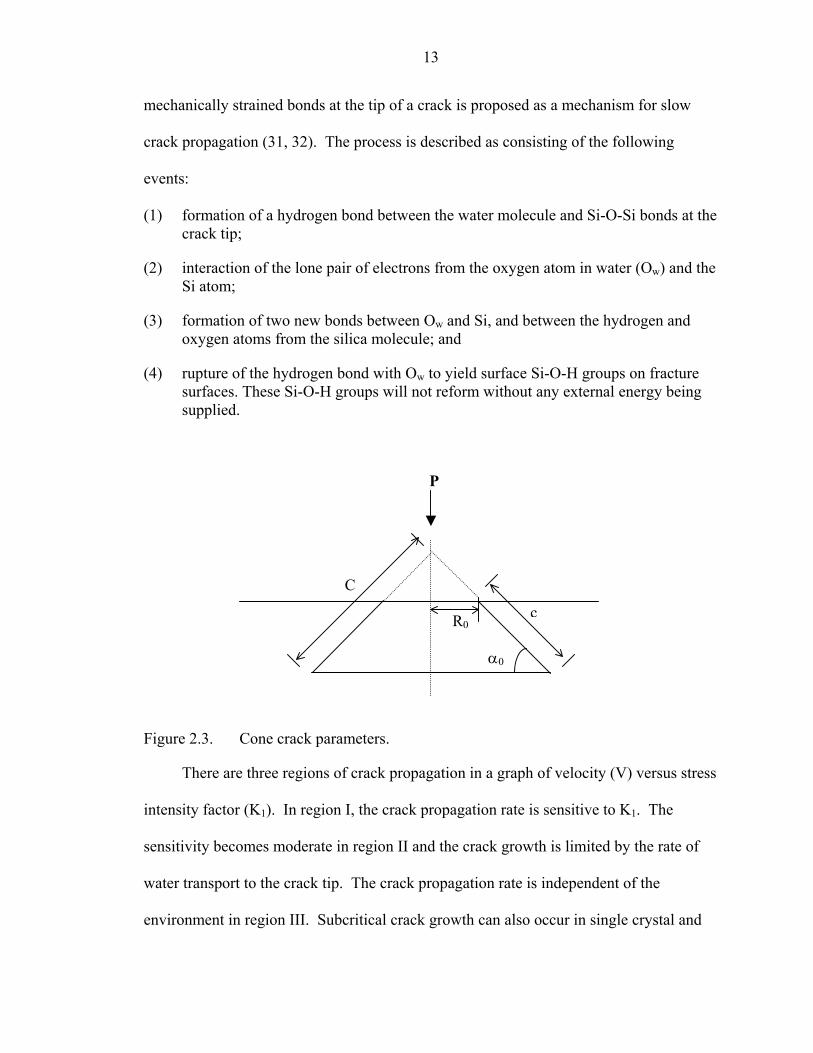
Poisson’s ratio (29). The cone crack parameters are shown in Fig. 2.3. Although
equation 2.4 has the same form as that for sharp indentation, the significance of the
coefficient χ is different. For the sharp indentation, there is a residual stress field to
accommodate the impression volume by expansion of the deformation zone against the
constraining elastic matrix. Therefore, χ for sharp indentation is dependent on the nature
of the deformation, elastic modulus, hardness of the material, and indenter half-angle.
Environmental Effect
The fracture resistance of glasses and crystalline ceramics can decrease over time
under static loading and an active corrosive environment. The reduction in strength is
associated with the slow crack growth of pre-existing flaws caused by a stress corrosion
process. In silica, a chemical model for the interaction of the environment with
13
mechanically strained bonds at the tip of a crack is proposed as a mechanism for slow
crack propagation (31, 32). The process is described as consisting of the following
events:
(1) formation of a hydrogen bond between the water molecule and Si-O-Si bonds at the crack tip;
(2) interaction of the lone pair of electrons from the oxygen atom in water (Ow) and the Si atom;
(3) formation of two new bonds between Ow and Si, and between the hydrogen and oxygen atoms from the silica molecule; and
(4) rupture of the hydrogen bond with Ow to yield surface Si-O-H groups on fracture surfaces. These Si-O-H groups will not reform without any external energy being supplied.
P
c
C
R0
α0
Figure 2.3. Cone crack parameters.
There are three regions of crack propagation in a graph of velocity (V) versus stress
intensity factor (K1). In region I, the crack propagation rate is sensitive to K1. The
sensitivity becomes moderate in region II and the crack growth is limited by the rate of
water transport to the crack tip. The crack propagation rate is independent of the
environment in region III. Subcritical crack growth can also occur in single crystal and

14
polycrystalline ceramics (33-36). In alumina and zirconia, slow crack growth caused by
water molecules has also been suggested (33-35). However, results from some studies
suggest another approach to explain how the active environment affects the crack
propagation rate (37-38).
Si
o
Si
Si
o
Si
H
oH
Ho
H
Si
o
Si
o
HH
Figure 2.4 Schematic illustration of the reaction of water and a strained Si-O-Si bond
at the crack tip (32).
Because of the atomic sharpness of the crack tip, an environmental molecule cannot
penetrate to the crack tip and directly reacts with the chemical bond. Instead, a chemical
wedge forms when chemisorbing molecules enter the opening of a crack (39). A crack
propagating through a solid under the action of a chemical wedge is shown in Fig. 2.5.
Besides static fatigue, failure that occurs by the simultaneous action of a cyclic
stress and chemical attack is termed “stress corrosion fatigue.” In metals, mechanisms of
environmental-assisted cracking are well documented (18, 40). Under cyclic loading, the
embrittling environment can accelerate the propagation of a flaw to a certain critical size,
and the crack propagation rate is enhanced as a result of exposure to a corrosive
15
environment. The mechanisms of fatigue crack initiation and propagation involve
accumulation of dislocations and electrochemical attack at the defective area.
For ceramic materials, the detrimental effect of cyclic loading in a wet
environment is well known (31-35). These results suggest that stress corrosion has a role
in controlling overall crack propagation because of the faster growth rates in water than
in air. The cyclic fatigue lifetime was shorter for alumina specimens tested in air
compared with those tested in vacuum (41). This result indicates that corrosion fatigue
can accelerate degradation associated with mechanical fatigue. In contrast, the results for
Si3N4 showed that the crack propagation mechanism under cyclic loading was
independent of any stress corrosion mechanism (42). However, the results from another
study indicated that the fatigue crack growth rate in Si3N4 can be enhanced by a corrosive
environment (43).
Fatigue Behavior of Dental Glass-Ceramics
Ceramics are routinely used for dental prostheses because of their superior esthetic
qualities and biocompatibility. Because of the relatively low tensile and shear strength of
dental porcelains, they are usually bonded to metal substructures made to fit prepared
teeth to minimize the risk of fracturing the core or veneering ceramics. However,
porcelain failures still occur and this represents a significant clinical problem for dental
practices when ceramic restorations are needed (1, 2). Chipping or cracking of porcelain
veneers has been reported to occur within 5 years after insertion (1, 2). Fracture is also a
major drawback of ceramic systems that have been developed to improve the optical
properties of ceramic prostheses. Relatively high clinical failure rates have been reported,
ranging from 35% after three years to 64% after four years for tetrasilicic-fluormica-
based glass-ceramic crowns cemented to molar teeth (3).

16
CRACK PROPAGATION
E D C B A
Region A: Elastically distorted bonds
Region B: Inelastic strain at the crack tip
Region C: Ruptured bonds with secondary bonds
Region D: Ruptured bonds without secondary bonds
Region E: Bonds in equilibrium with the environment
Figure 2.5. Schematic illustration of crack propagation in the presence of a chemical wedge (38).
During normal mastication, dental prostheses are subjected to repeated loading
more than a thousand times per day. At stress levels typically well below the ultimate
stress of dental ceramics, unexpected fracture can occur after a significant number of
cycles sufficient to cause fatigue failure of the restorations. Because of the brittle
behavior of ceramic materials, they have little or no capacity to deform plastically under
high loads. In the past, fatigue behavior was not expected to be an important factor in the

17
control of failures. Recently, studies have demonstrated that dental ceramics can be
gradually degraded under cyclic loading conditions (4-7). By using a sharp indenter,
White (4) studied crack growth in feldspathic dental porcelain during repeated
mechanical loading. He reported that fatigue behavior of this porcelain was consistent
with the Paris model for cyclic mechanically induced crack growth (44). However, he
suggested that this might not be an appropriate model for dental situations because of the
high stress levels, which represents extreme conditions that occur rarely in vivo.
Several studies used a blunt indentation technique to investigate the cyclic fatigue
behavior of ceramics (5-7, 9). White et al. (5) used this technique in their study and they
determined the critical stresses necessary to produce elastic-plastic deformation and crack
initiation in feldspathic dental porcelain. They also confirmed the existence of fatigue
damage by performing a cyclic loading test (5, 6). They concluded that cyclic
mechanical fatigue caused irreversible damage to feldspathic porcelain. The severity of
accumulated damage was quantified with respect to the gradual strength degradation after
cyclic testing.
It is well known that the presence of water will cause strength degradation of
ceramic materials (8). White et al. (6) also investigated the effect of water on mechanical
fatigue in feldspathic dental porcelain and reported results for ambient, wet, and dry
environments. They reported that both static and cyclic mechanical fatigue significantly
reduced specimen strength, but these two test conditions did not affect each other.
Considerably greater damage and reduction in strength were noted for specimens tested
in water.

18
Besides feldspathic porcelain, other dental ceramic systems have also been
investigated (7). Three ceramics, glass-infiltrated alumina (In-Ceram), a leucite-based
glass-ceramic (Optimal Pressable Ceramic), and a leucite-based glass-ceramic (IPS
Empress), were subjected to cyclic loading and then fractured in wet and dry
environments. The decrease in fracture stress caused by cyclic loading was in agreement
with the results of a previous study (6). This effect was more pronounced for specimens
exposed to an aqueous environment.
Mechanism of Fatigue Damage
The existence of fatigue damage in ceramics raises considerable concern regarding
the life prediction of brittle materials. It has been shown that subcritical crack growth
occurs under cyclic loading conditions with stress levels well below the critical value for
catastrophic fracture. The nature of crack propagation and crack growth resistance of
these brittle materials has been widely investigated. The results of these studies suggest
that several factors and mechanisms are involved in the fatigue behavior of different
types of ceramic materials (45, 46).
For dental ceramics, Peterson et al. used bonded-interface specimens to evaluate
the role of microstructure and related failure mechanisms of specimens subjected to
repeated loading (9, 10). A series of micaceous glass-ceramics were prepared by
controlled heat treatment with mica crystal diameters between 1 and 10 µm and aspect
ratios between 3/1 and 9/1. The polished surfaces of two ceramic block specimens were
bonded together with cyanoacrylate adhesive. After cyclic loading, two damage modes
were observed, tensile-induced cone cracking in a fine-grain material and quasi-plastic
deformation in a coarser grain glass-ceramic. They concluded that microstructure is a

19
controlling factor in determining the nature and degree of damage accumulation in dental
ceramics. They also used other dental glass-ceramics in their study, such as Vita In-
Ceram, a glass-infiltrated alumina, Vita Mark II, a modified feldspathic porcelain, and
yttria-stabilized tetragonal zirconia. They found that a quasi-plastic response was
observed in zirconia and glass-infiltrated alumina. The most brittle response (cone crack
formation) was observed in modified feldspathic porcelain.
The bonded-interface technique has been used in earlier studies (11, 12) in which
the damage beneath a Hertzian contact field was examined in commercial mica-
containing glass-ceramics compared with the glass specimens. For the glass samples,
fatigue failure was caused by slow growth of cone cracks. On the other hand, the fatigue
process in glass-ceramics was enhanced by formation of microcracks developed from
shear stress along the weak interfaces between the mica platelets and the glass matrix.
The effect of environment on the fracture behavior of dental ceramics has also
been studied (47-50). Specimens made from aluminous and feldspathic porcelain were
tested under three-point loading (49). The authors found that specimens that were tested
under dry conditions were approximately 27% stronger than those that were tested in
distilled water.
Previous studies showed that dental ceramics could be weakened by fatigue
damage (4-7). The investigators attempted, with little success, to identify the
mechanisms responsible for the degradation of the materials during cyclic fatigue. They
also used a tungsten carbide indenter to produce contact damage within the specimens.
Tungsten carbide has a remarkably higher elastic modulus than most other materials that
are used to restore missing tooth structure. Thus, the use of a tungsten carbide indenter

20
can be considered as an extreme condition and the experimental results might not be
representative of the oral environment.
Several previous investigators analyzed the fracture failure of dental ceramics in a
brittle mode because they thought that ceramic materials could not deform plastically.
Therefore, only a limited number of investigators have analyzed the fatigue damage
caused from repeated loading conditions. The lack of information in this area is obvious.
In addition, all previous data has been obtained on materials that have thermal expansion
anisotropy, which leads to development of a residual stress upon cooling. The residual
stress may affect the damage modes observed. Thus, a study that can minimize
extraneous effects from microstructural property is preferred.
Specific Aims
The specific aims of this study were to
(1) test the hypothesis that, at a specific number of cycles, the mean flexural strength of baria-silicate glass-ceramics subjected to cyclic loading is rapidly decreased because of critical flaw propagation;
(2) identify the controlling mechanism of crack propagation in baria-silicate glass-ceramics based on two crystal aspect ratios;
(3) test the hypothesis that the crack growth rate of baria-silicate glass-ceramics under cyclic loading and low stress conditions is strongly dependent on the number of stress cycles;
(4) characterize the influence of crystal morphology on fatigue failure as a function of number of loading cycles; and
(5) test the hypothesis that the crack growth rate of baria-silicate glass-ceramics subjected to cyclic fatigue can be accelerated by environmental effects.

CHAPTER 3 MATERIALS AND METHODS
Preparation of Baria-Silicate Glass-Ceramic Specimens
Baria-silicate glass plates containing 39.5 wt% BaO and 60.5 wt% SiO2 were
obtained from Corning Inc. (Corning, NY). Bars, approximately 25 mm long, 5.1 mm
wide, and 2.5 mm thick, were cut from these plates using a diamond cutting saw
(Isomet, Buehler, IL).
Heat Treatment Schedules
The glass bars were heat-treated to produce glass-ceramic specimens with desired
microstructures. One hundred and forty bars were nucleated and crystallized to produce
two different microstructures. The treatment times and temperatures are listed in Table
3.1. Seventy glass specimens that were not heat treated were used as control specimens.
Table 3.1. Heat treatment schedules.
Nucleation Crystallization
Temp (°C) Time (h) Temp (°C) Time (h) Aspect ratio
700 0.75 825 1.5 3.6
700 1.0 825/1050 24/24 8.1
Microstructural Analysis
The percent crystallization of baria-silicate glass-ceramics was determined using
the point-counting technique. Specimens were etched in 1% HF for 10 s, rinsed in
deionized water, dried and coated with Au-Pd for scanning electron microscopy. Sixteen
21

22
images for each aspect ratio group were recorded [4 specimens x 2 cuts (90° and 45°) x 2
surface areas]. The aspect ratios were determined from the major and minor dimension
of discernible crystals in SEM micrographs. All micrographs were produced at 4000X.
Surface Preparation
Bar-shaped specimens, 25 mm long, 5 mm wide, and 2 mm thick, were prepared
from baria-silicate glass-ceramics. The glass and glass-ceramics bars were ground and
polished through 600-grit silicon carbide abrasive using a hand lapper (South Bay
Technologies, San Clemente, CA). The surfaces to be subjected to cyclic fatigue loading
were polished through 1200-grit silicon carbide and 1 µm alumina paste. The specimen
edges were rounded using 1200-grit silicon carbide to reduce the risk of premature failure
at stress concentration sites. All specimens were annealed at 600° C for 2 h after
polishing, and ultrasonically cleaned in ethanol for 5 min before testing.
Density
The density of each material was determined from the mass to volume ratio. Each
specimen was dried in furnace and its dry weight was measured on a precision balance
(Mettler H31, Mettler-Toledo Inc., NJ). Three volumetric readings were made for each
specimen to determine the average volume using a pycnometer (Model 1330,
Micrometrics, Norcross, GA). The density of each specimen was then calculated.
Young’s Modulus and Poisson’s Ratio
Groups of four specimens each were prepared for each aspect ratio and used to
determine elastic modulus and Poisson’s ratio values using an ultrasonic device (Nuson
Inc., Boalsburg, PA). The transducers were attached to the specimens to generate the

23
longitudinal and shear waves. Elastic modulus and Poisson’s ratio were calculated from
the shear and longitudinal velocity values.
Test Methods
Mechanical Fatigue Test
A cyclic load was applied to baria-silicate glass-ceramic specimens using a servo-
hydraulic testing machine (Model 1350, Instron Corp., Canton, MA). A schematic
illustration of the cyclic fatigue fixture is shown in Fig. 3.1. In an attempt to simulate test
conditions that approximate oral conditions, a low loading frequency (≈3 Hz) and a low
load level (≤ 200 N) were used. A blunt Type 302 stainless steel indenter was used to
apply the load on the specimen surface. The diameter of the indenter used in this study
was 4.76 mm, which is approximately equal to the cuspal radii of molar and premolar
teeth. Ten bar specimens were subjected to one of the following numbers of loading
cycles: 0, 103, 104, and 105 cycles. After cyclic loading, specimens were observed for
surface damage using an optical microscope, and then they were subjected to four-point
bending and observed for subsurface damage.
Strength Degradation Test
A four-point bending test was used to quantify the severity of the strength reduction
caused by the repeated loading test. Glass-ceramic specimens were fractured using a
universal testing machine (Instron Model 1125) at a crosshead speed of 2.5 mm/min. A
four-point flexure apparatus with an upper span of 6.67 mm and a lower span of 20 mm
was used. The load to failure, P, was used to calculate the fracture stress, σf, using the
following equation:
2f bt3Pa
=σ (3.1)

24
where P is the failure load, a is the horizontal distance between support and loading
points, b is the bar width, and t is the bar thickness.
P: 0-200 N
Loading cylinder
Steel ball
Specimen bar Steel support
Figure 3.1. Schematic illustration of cyclic fatigue fixture.
The environments used for the cyclic fatigue test were ambient room temperature
(25°C) and deionized water at 37°C.
Fractographic Analysis
The critical flaw size was measured using an optical microscope. The fracture
toughness of each material was determined from specimens in the control group (0 cycle)
using the Griffith-Irwin equation (51):
(3.2) 1/2c (c)YΚ σ=
where Y is a geometric constant, σ is the calculated fracture stress, and c is the measured
crack size within the fracture surfaces. The crack depth was calculated as the square root
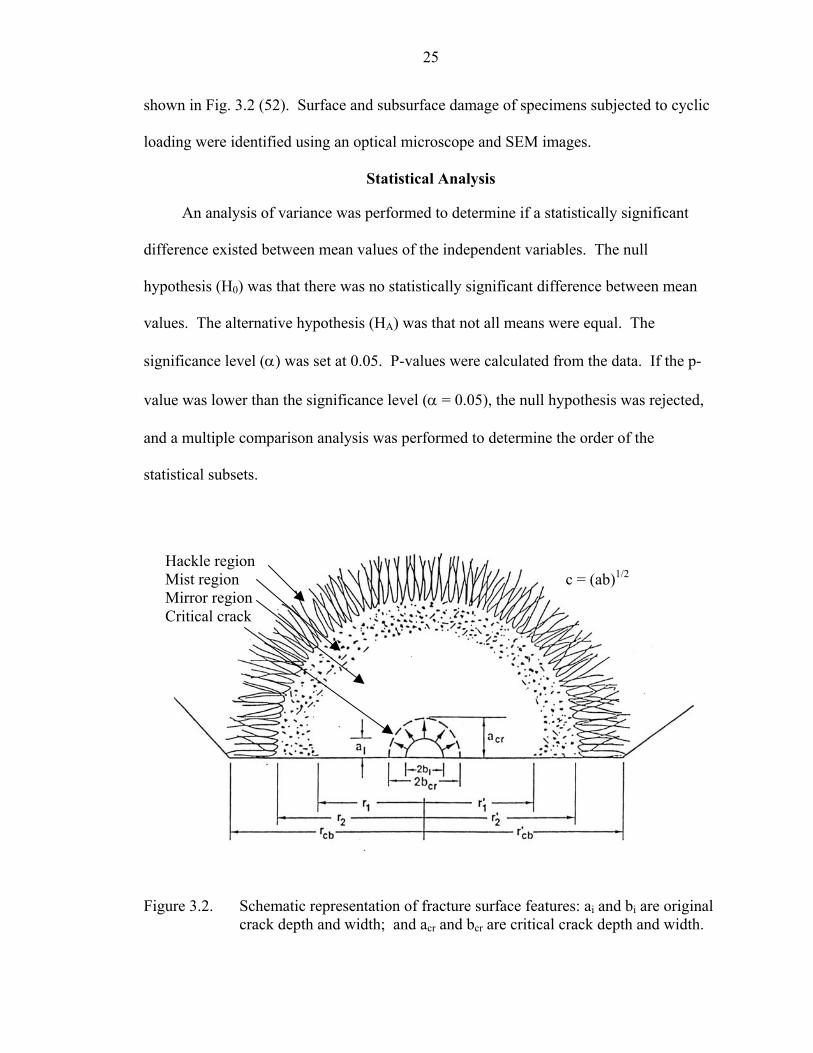
of the depth times the half width. A schematic illustration of fractographic features is
25
shown in Fig. 3.2 (52). Surface and subsurface damage of specimens subjected to cyclic
loading were identified using an optical microscope and SEM images.
Statistical Analysis
An analysis of variance was performed to determine if a statistically significant
difference existed between mean values of the independent variables. The null
hypothesis (H0) was that there was no statistically significant difference between mean
values. The alternative hypothesis (HA) was that not all means were equal. The
significance level (α) was set at 0.05. P-values were calculated from the data. If the p-
value was lower than the significance level (α = 0.05), the null hypothesis was rejected,
and a multiple comparison analysis was performed to determine the order of the
statistical subsets.
Hackle region Mist region Mirror region Critical crack
c = (ab)1/2
Figure 3.2. Schematic representation of fracture surface features: ai and bi are original crack depth and width; and acr and bcr are critical crack depth and width.

CHAPTER 4 RESULTS AND DISCUSSION
Physical properties of baria-silicate glass and glass-ceramics are summarized in
Table 4.1. Young’s modulus increased from 64.8 GPa for the glass to 80.5 GPa for the
glass-ceramic with a high aspect ratio. These values are in good agreement with those
reported by Freiman et al. (17).
Table 4.1. Physical properties of baria-silicate glass-ceramics.
Materials Aspect
Ratio
Density
(g/cm3)
Young’s
Modulus (GPa)
Poisson’s
Ratio
Crystal
Volume Fraction
Glass - 3.99 ± 0.01 64.8 0.29 0%
Glass-ceramic
(AR 3) 3.6 3.93 ± 0.02 75.3 0.28 75%
Glass-ceramic
(AR 8) 8.1 4.02 ± 0.01 80.5 0.27 73%
The highly crystalline (> 70 vol%) glass-ceramics were produced with two aspect
ratios (AR) using heat treatments specified in Table 3.1. For glass-ceramic materials, the
crystal diameter ranged from 1.5 to 11 µm for the AR3 group, and from 0.5 to 15 µm for
the AR 8 group. The microstructures of the two glass-ceramics are shown in Fig. 4.1.
The crystals in AR 3 group specimens appear spherulitic with an aspect ratio of 3.6:1.
Crystals in the AR 8 group specimens are elongated with an approximate length to width
aspect ratio of 8:1.
26

27
(a) AR 3
(b) AR 8
Figure 4.1. SEM images of baria-silicate glass-ceramic microstructures with aspect ratios of 3/1 (a) and 8/1 (b) after etching with 1% HF for 10 s (4000X).

28
Table 4.2. Mean flexural strength and standard deviation for baria-silicate glass-ceramics.
Number of cycles
Environment Glass
(MPa)
AR 3
(MPa)
AR 8
(MPa)
0 Air 96 ± 14 (A) 150 ± 20 (A') 230 ± 14 (A")
103 Air 61 ± 20 (B) 138 ± 20 (A') 225 ± 12 (A")
104 Air 63 ± 19 (B) 108 ± 33 (B') 208 ± 20 (B")
105 Air 51 ± 14 (B) 80 ± 18 (C') 209 ± 17 (B")
0 Deionized water 98 ± 17 (a) 150 ± 20 (a') 185 ± 7 (a")
103 Deionized water 53 ± 13 (b) 118 ± 24 (b') 201 ± 19 (a")
104 Deionized water 45 ± 11 (b) 100 ± 14 (c') 171 ± 24 (b")
105 Deionized water 50 ± 9 (b) 82 ± 15 (d') 110 ± 15 (c")
( ) The mean values in a column with the same letter are not significantly different

29
0
50
100
150
200
250
300
Flex
ure
stre
ngth
(MPa
)
Figure 4.2. Mean streloading cy
The mean flexural
ceramic specimens that w
deionized water are summ
number of loading cycles
Based on Duncan’s
an aspect ratio of 8/1 (AR
groups at each number of
AR 3 was also significan
cycles in air (p ≤ 0.05). T
significantly after 103 cy
AR 8
AR 8 - W
AR 3
AR 3 - WGlass
0 1000 10000 100000
Loading cycles
ngth of baria-silicate glass-ceramics as a function of number of cles ( Tested in air; Tested in water).
Glass - W
Strength Degradation
strength and standard deviation for baria-silicate glass and glass-
ere cyclically loaded at ambient room temperature and in
arized in Table 4.2. The strength variation as a function of
is shown in Fig. 4.2.
multiple comparison tests, the mean strength of the group with
8) was significantly greater than that of each of the other
cycles in air (p ≤ 0.05). The mean flexural strength of group
tly greater than the mean of the glass group at each number of
he mean flexural strength of glass specimens decreased
cles (p ≤ 0.05). For glass-ceramic specimens with the lower

30
aspect ratio (AR 3), the mean strength decreased after loading for 104 cycles (p ≤ 0.05).
A reduction in mean strength of group AR 8 specimens was observed after 104 and 105
cycles.
The decrease in strength of baria-silicate glass and AR3 specimens that were
cyclically loaded in deionized water shows a similar trend compared with those exhibited
by the specimens tested at room temperature, but the decrease in strength occurred at
fewer cycles. For the glass and AR 3 groups, the strength decreased after loading for 103
cycles. The decrease in mean strength of specimens with an aspect ratio 8/1 was observed
at 103 cycles. The mean strength of group AR 8 specimens tested in air did not decrease
as much as the mean strength of glass and group AR 3 specimens. However, in deionized
water, the decrease in strength of group AR 8 was significant. After 105 cycles, a
decrease of approximately 50% in mean strength was observed for AR 8 group
specimens.
Fractographic Analysis
Baria-Silicate Glass
Fractographic analysis can be used as a characterization tool to detect the type of
strength-limiting cracks formed by cyclic loading. Based on fracture surface analysis of
cyclically loaded baria-silicate glass specimens, four crack configurations were observed
and a schematic illustration of two of these failure origins is shown in Fig. 4.3. The first
type (I) was a concentric ring and cone crack type (Fig. 4.4), which initiated from the
base of the cone crack and propagated approximately perpendicular to the principal
direction of tensile stress (point B in Fig. 4.3). The second type (II) was a triangular-
shaped crack that formed during four-point flexure at the base of the cone crack (point A-
A in Fig. 4.3) and subsequently propagated along the plane of a cone that developed

31
during cyclic loading (Fig. 4.5). The third type (III) was a semi-elliptical surface crack
caused by cyclic loading damage at the site of loading (Fig. 4.6). The fourth crack
configuration (IV) was a semi-elliptical crack caused by polishing (Fig. 4.7). The first
two types were observed in the glass and AR 3 specimens subjected to cyclic loads
ranging from 103 to 105 cycles. The third crack type was observed in group AR 3, AR 8
and glass specimens tested in deionized water for 104 and 105 cycles. The fourth crack
type was observed in specimens in the control group (0 cycle) and in specimens in which
the damage from cyclic loading was not as severe as the surface finishes.
σa σa
σa
(1)
E E D
A' A A
σa B B (2) (2)
Ring crack C ⊗ ⊗ C
Cone crack
(1) Triangular crack originated from point A-A and propagated to point A' on a A′ABED plane to form a critical crack leading to fast failure
(2) Failure started at either of the two point B sites
Figure 4.3. Schematic illustrations of selected failure origins from cone cracks in glass and glass-ceramic specimens (Top view).

32
(a) 25X
(b) 80X
Figure 4.4. SEM images of a cone crack formed in deionized water after 104 loading cycles. Fracture typically originated from either point B.

33
(a) Loading and fracture surface images (100X)
Fracture surface Fracture surface
Triangular crack
A’ A A
(b) Fracture surface images (30X and 100X)
Figure 4.5. SEM images of a triangular crack in a glass specimen caused by cyclic loading in air for 105 cycles. Fracture initiated from points A-A.

34
Critical flaw
(a) 25X (b) 100X Figure 4.6. SEM images of a semi-elliptical surface crack in a glass specimen caused
by cyclic loading in deionized water for 105 cycles. The dashed line in (b) outlines the region of the critical crack.
Critical flaw
Fracture surface
(a) 75X
w
(b) 200X
Figure 4.7. SEM images of a typical sby polishing.
Critical fla
emi-elliptical crack in a glass specimen caused

35
Strength Degradation Associated with a Cone-Crack
Few studies have been reported on the analysis of strength degradation caused by a
Hertzian indentation crack (53,54). For well-developed cone cracks (Fig. 4.8),
dimensional analysis (29) indicates that:
( ) c3/2K ,
RP βνα= (4.1)
where P is the indentation load, R is the radius of the cone base, and α (ν, β) is a
dimensionless constant dependent on Poisson’s ratio (ν) and the cone-crack angle (β). Kc
is the toughness of the material in term of the critical stress intensity factor.
Lawn et al. described the strength degradation (σf) from cyclic loading related to
the cone base radius (Fig. 4.8) as (53):
( ) 2/1fC RπΩ=Κ σ (4.2)
2f
2C
)(π)K(
R)β(σ
=Ω (4.3)
where Ω(β) is a dimensionless constant dependent on β.
Evans (54) assessed the effect of conical cracks on the strength of ceramic
components (Fig. 4.9). He analyzed the stress necessary to extend a Hertzian crack,
which should be inversely proportional to the square root of the crack depth, L.
)L(ZY'K 2/1
fC σ= (4.4)
)KL(Y'Z
C2/1
fσ= (4.5)
where L = G sin α, Y' = π1/2 , and Z is a flaw morphology parameter.

36
P
2R β
2a
Figure 4.8. Schematic illustration of a cone crack induced by a Hertzian contact load.
σa σa
A
L G
Figure 4.9. Fracture origin associated with a Hertzian cone crack as suggested by
Evans (54). Failure initiates at point A.
37
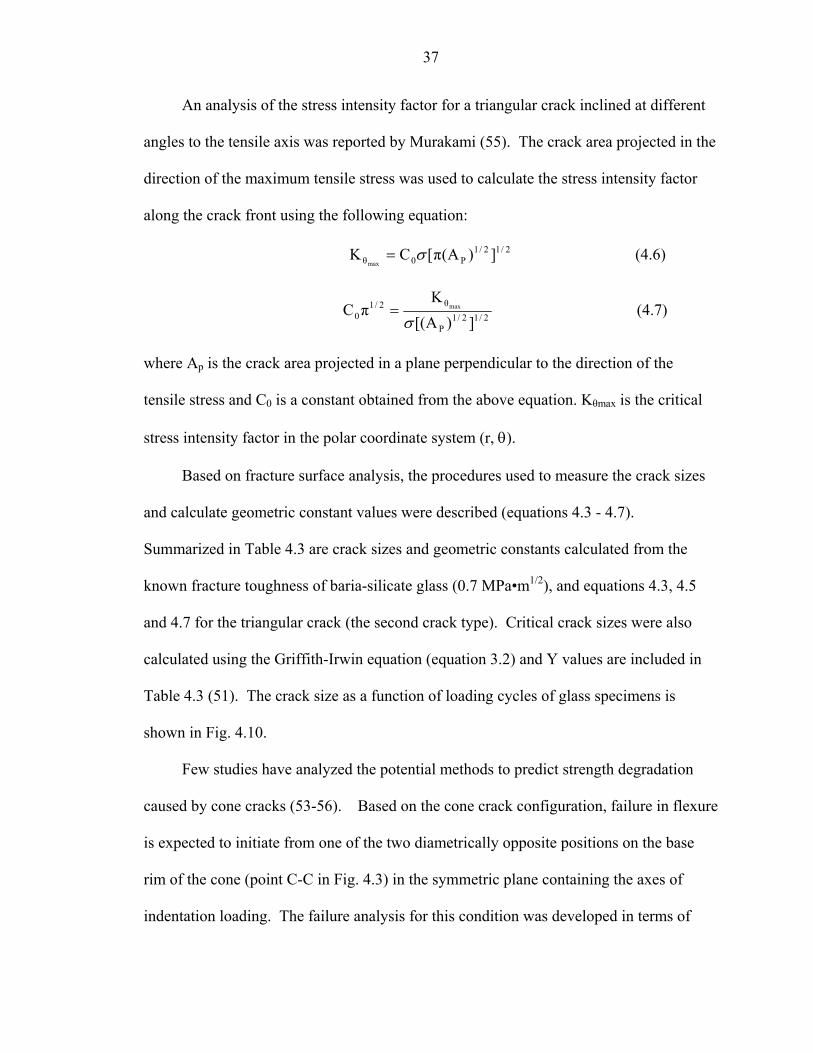
An analysis of the stress intensity factor for a triangular crack inclined at different
angles to the tensile axis was reported by Murakami (55). The crack area projected in the
direction of the maximum tensile stress was used to calculate the stress intensity factor
along the crack front using the following equation:
K (4.6) 2/12/1P0θ ])A(π[C
maxσ=
2/12/1P
θ2/10 ])A[(
Kπ max
σ=C (4.7)
where Ap is the crack area projected in a plane perpendicular to the direction of the
tensile stress and C0 is a constant obtained from the above equation. Kθmax is the critical
stress intensity factor in the polar coordinate system (r, θ).
Based on fracture surface analysis, the procedures used to measure the crack sizes
and calculate geometric constant values were described (equations 4.3 - 4.7).
Summarized in Table 4.3 are crack sizes and geometric constants calculated from the
known fracture toughness of baria-silicate glass (0.7 MPa•m1/2), and equations 4.3, 4.5
and 4.7 for the triangular crack (the second crack type). Critical crack sizes were also
calculated using the Griffith-Irwin equation (equation 3.2) and Y values are included in
Table 4.3 (51). The crack size as a function of loading cycles of glass specimens is
shown in Fig. 4.10.
Few studies have analyzed the potential methods to predict strength degradation
caused by cone cracks (53-56). Based on the cone crack configuration, failure in flexure
is expected to initiate from one of the two diametrically opposite positions on the base
rim of the cone (point C-C in Fig. 4.3) in the symmetric plane containing the axes of
indentation loading. The failure analysis for this condition was developed in terms of

38
fracture mechanics principles, which assume that the Hertzian cone crack parameter,
RΩ(α), is the critical flaw size (53). The approximation of strength degradation by the
cone crack as described in another study was also considered (54). Although the author
(54) agreed that the fracture should originate from a position at the base exposed to the
maximum stress intensity (point A in Fig. 4.9), the decreased strength values were
actually determined by using the depth of the cone as the critical crack size. Based on the
fracture surface analysis in the present study, we observed two crack configurations that
could not be clearly characterized by the methods described previously (53-54). For
example, the observed triangular crack that was likely formed during four-point flexure.
From the fracture surface markings, we observed two symmetric points on the cone base
as failure origins. Cracks propagated from these two points to join each other and form a
critical crack for catastrophic failure. Thus, failure of specimens in this study did not
start from the site (point C-C in Fig. 4.3) described in previous studies (53-54) and
resulted in formation of a different crack configuration.
Table 4.3. Crack sizes and geometric factors for glass calculated from equations 3.2 and equations 4.3-4.7.
No. of
cycles
ΩR (µm)
(Eq. 4.3)
L (µm)
(Eq. 4.5)
Ap
(µm) (Eq. 4.7)
(ab)1/2 (µm)
(Eq. 3.2)
Y'/Z
(Eq. 4.5)
C0π1/2
(Eq. 4.7)
Y
(Eq. 3.2)
103
(9) 54 ± 12
120 ± 5
109 ± 10
113 ± 7
1.18 ± 0.16
1.24 ± 0.10
1.22 ± 0.12
104
(8) 56 ± 11
130 ± 16
118 ± 15
128 ± 8
1.15 ± 0.10
1.17 ± 0.07
1.17 ± 0.11
105
(9) 64 ± 36
149 ± 17
153 ± 13
144 ± 22
1.13 ± 0.27
1.11 ± 0.28
1.15 ± 0.26
The mean critical crack size for the control group (0 cycle) is 35 ± 14 µm. ( ) Number of specimens in each group

39
(a) Air
0
50
100
150
200
250
0 1000 10000 100000
Loading cycles
Cra
ck si
ze ( µ
m)
ΩRLAp(ab)1/2
(b) Deionized water
0
50
100
150
200
250
0 1000 10000 100000
Loading cycles
Cra
ck si
ze ( µ
m)
ΩRLAp(ab)1/2
ΩR: Crack size for equation 4.3; L: Crack size for equation 4.5 Ap: Crack size for equation 4.7; (ab)1/2: Crack size for equation 3.2
Figure 4.10. Crack sizes as a function of cyclic loading for glass specimens: (a) Tested
in air; (b) Tested in deionized water. The legends in the graphs refer to the parameters used in Eqs. 3.2, 4.3, 4.5, 4.7 and in Table 4.3.

40
As a result, it is unrealistic to use the methods described in those studies to
characterize the triangular crack. Therefore, comparisons between crack size and the
geometric constant values determined from each method have been made to determine
the optimal technique for describing this crack system.
From Table 4.3, the mean crack sizes calculated from equations 3.2, and 4.7
[(ab)1/2, Ap] were comparable and not significantly different (p > 0.05). Y and C0π1/2
values were also comparable. The crack size calculated from Equation 4.3 was
significantly smaller than that calculated from the other equations. Lawn et al. (53)
estimated that Ω(β) values range from 0.25 to 0.30 for soda-lime silica glass. The Ω(β)
values of 0.11 for soda-lime glass and 0.34 for alumina were obtained from another study
(56). Because of different Ω(β) values reported for different materials, they suggested
that Ω(β) is a material constant (56). In our study, the Ω(β) value was similar to that
reported by Lawn, but with a larger standard deviation (SD). The reason for the large SD
is most likely associated with the failure of glass specimens that does not initiate from
one of the two diametrically opposite positions (either point C in Fig. 4.3) on the base rim
of the cone coincident with the symmetry plane containing the axes of initial contact
loading (53). The second possible reason is that the curvature of the cone base must be
considered when the cone crack is large.
The Y'/Z values calculated from equation 4.5 are comparable to Y and C0π1/2
values. Evans reported that the Z value ranged from 1.3 to 1.5 for glass, alumina and
silicon carbide (54). He also suggested that the values obtained in his study were similar
to that for a surface crack of similar depth with a length to depth ratio of ≈ 3/1. For a

41
length to depth ratio of 3/1, the value of flaw parameter (Q) is 1.75 (with a/b = 0.3). The
Q value can be related to the critical stress intensity factor (40):
QaYσcΚ = (4.8)
The Z value in equation 4.5 is reported to be a dimensionless constant that depends
on the configuration of the crack (54), i.e., a correction factor for a semi-elliptical crack.
However, the approach using this Z value and the depth of the critical crack seems to be
inappropriate because only one dimension of a cone crack is considered. For critical
crack size determination, width and depth are usually included to obtain an accurate crack
size value. The location of the point at which fracture initiates is also critical in
determining the crack size and a geometric constant value and should be identified during
failure analysis processes.
Summarized in Table 4.4 are the mean crack sizes and standard deviations
determined from equation 3.2 and equations 4.3-4.7 of baria-silicate glass specimens that
were cyclically loaded in deionized water. We observed the same crack patterns in the
groups subjected to 103 and 104 loading cycles. However, contact damage within the
surfaces of four specimens in the 104 cycle group and eight specimens in the 105 cycle
group was clearly evident and different from that observed in specimens tested in air.
Failure of these specimens tested in deionized water initiated from a semi-elliptical crack
(type III) caused by contact surface damage (Fig.4.6). The mean critical crack sizes of
these groups (104 cycle and 105 cycle group) were 194 ± 55 and 135 ± 32 µm,
respectively.
From Table 4.4, the values of Y, Y'/Z, and C0π1/2 tend to decrease gradually with an
increase in the number of cycles from 104 cycles to 105 cycles. We hypothesize that the

42
depth of the crack tip is responsible for reduction in these three constant values, i.e., there
is a decrease in tensile stress, as the cracks grow deeper into the structure. The cone
crack in specimens tested in deionized water propagated to a greater depth beneath the
contact surface than that in specimens tested in air because of the stress corrosion effect.
Therefore, critical crack sizes of specimens tested in deionized water were larger and
resulted in a decrease in constant values. We recalculated the stress values according to
the depth of the critical cracks, σcal, using the following equation:
)b
2x1(fcal −= σσ (4.9)
where σf is the stress at fracture, b is the thickness of a specimen, and x is the depth of
the critical crack.
Table 4.4. Crack sizes and geometric factors for glass specimens tested in deionized water.
No. of
cycles
ΩR (µm)
(Eq. 4.3)
L (µm)
(Eq. 4.5)
Ap
(µm) (Eq. 4.7)
(ab)1/2 (µm)
(Eq. 3.2)
Y/Z
(Eq.4.5)
C0π1/2
(Eq.4.7)
Y
(Eq.3.2)
103
(9) 54 ± 17
138 ± 39
105 ± 9
104 ± 10
1.12 ± 0.17
1.27 ± 0.21
1.27 ± 0.21
104
(4) 71 ± 29
163 ± 8
149 ± 11
147 ± 14
1.14 ± 0.25
1.21 ± 31
1.21 ± 0.31
105 (2)
52 ± 12
169 ± 24
166 ± 14
168 ± 0.6
0.98 ± 0.18
0.98 ± 0.11
0.98 ± 0.11
The mean critical crack size for the control group (0 cycle in deionized water) is 31 ± 12 µm. ( ) Number of specimens in each group

43
By applying equation 4.9 to equation 4.3 - 4.7, and 3.2, we obtain corrected values
for Y, Y'/ Z, and C0π1/2. In Table 4.5, Y increases from 0.98 ± 0.1 to 1.1 ± 0.1 and C0π1/2
increases from 0.98 ± 0.1 to 1.1 ± 0.2 for specimens loaded for 105 cycles when σcal is
substituted into equation 4.7 and 3.2. Although the “constant” values increase after
applying the corrected σcal into equation 4.3-4.8, the increase is still not significant. The
possible reason for the decrease of the geometric constants in this group of specimens
that contain the largest and deepest critical flaw size may be the transition from a surface
flaw to an internal flaw condition. For example, the Y value decreases from 1.26 for
surface flaws to 1.12 for internal flaws. The decrease in the Y value in this study
suggests the dominance of internal flaws. However, there were only two specimens in
this group that failed in this manner. Therefore, no conclusive explanation can be made
to accept or reject the proposed hypothesis that the depth of the crack is responsible for
reduction in the constant values.
Table 4.5. Geometric factors of glass specimens tested in deionized water with adjusted stress.
No. of
cycles
Ω (Eq.4.3)
Y'/Z (Eq.4.5)
C0π1/2 (Eq.4.7)
Y (Eq.3.2)
Ωcorr (Eq.4.3)
Y'/Zcorr
(Eq.4.5) C0π1/2
(Eq.4.7)
Ycorr
(Eq.3.2)
103
(9) 0.24 ± 0.09
1.12 ± 0.17
1.27 ± 0.21
1.27 ± 0.21
0.26 ± 0.09
1.17 ± 0.18
1.32 ± 0.22
1.33 ± 0.22
104
(4) 0.19 ± 0.12
1.14 ± 0.25
1.21 ± 0.31
1.21 ± 0.31
0.26 ± 0.15
1.23 ± 0.33
1.29 ± 0.34
1.30 ± 0.32
105 (2)
0.15 ± 0.04
0.98 ± 0.18
0.98 ± 0.11
0.98 ± 0.11
0.18 ± 0.04
1.07 ± 0.19
1.08 ± 0.17
1.07 ± 0.12

44
Based on data in Tables 4.3 and 4.4, the constant values Ω (0.19 - 0.24) and Z (1.51
- 1.66) appear to be in the range reported in previous studies (53, 54) with higher SD
values. However, the previous investigators did not clearly identify the failure origins of
the specimens and the strength degradation analyses were based only on the cone crack
geometry that can be determined from fracture mechanics equations. The shape of
critical cracks and failure origin sites were not identified. It is important to identify the
failure origins; otherwise, one cannot determine the correction factors for crack geometry
and free surfaces. Therefore, we can obtain only minimal information from the constant
values Ω and Z. In contrast, the constant values C0π1/2 and Y were determined from the
surface area of critical cracks. An assumption was made for the shape of the critical
flaws to simplify the calculation methods. For a constant value of C0π1/2, a triangular
crack shape was assumed to calculate the real surface area of the critical crack that
propagated from point A-A to A' on a plane of a cone crack. The projected area in the
direction of the maximum tensile stress was used to determine the geometric constant
value for Mode I crack propagation. For the Y value, we measured the size of a
triangular crack and calculated the crack area directly from the fracture surface. The
constant values C0π1/2 and Y are in good agreement for glass specimens. The surface
area approach is more rational because the actual size and shape of critical flaws are
included in the calculation procedures. These constant values also represent the flaw
characteristics, compared with the regular semi-elliptical or semi-circular flaws.
However, as discussed earlier regarding the depth of critical cracks, we should consider
the surface-to-internal flaw characteristics as the cone crack propagates to a greater depth
beneath the contact surface either because of stress corrosion or high load conditions.

45
Baria-Silicate Glass-Ceramics
For baria-silicate glass-ceramics with an aspect ratio of 3/1, we observed the same
four patterns of crack configurations (Fig. 4.11 and 4.13) as those observed in glass
specimens, i.e., cone-cracks and surface damage cracks. Summarized in Table 4.6 are the
crack sizes and geometric factors calculated from equations 4.3-4.8 for group AR3
specimens tested in air. Crack sizes as a function of loading cycles for group AR 3
specimens tested in air and in deionized water are shown in Fig. 4.12. In this group, cone
cracks were observed in specimens subjected to cyclic loading in air for 104 and 105
cycles. No cone crack or contact-induced surface damage was observed in specimens
subjected to loading for 103 cycles. For specimens subjected to loading at 103 cycles, the
mean crack size was 57 ± 19 µm, which is not statistically significantly different ( p >
0.05 ) from that of the control group. For specimens subjected to cyclic loading at 104
and 105 cycles in air that failed from a cone crack, Y, Y'/Z, and C0π1/2 values are greater
than those calculated for the glass specimens tested in air and the crack sizes are smaller.
One possible reason for the greater constant values is that the cone cracks, which
developed in the AR 3 group, were not as deep as those found in the glass group and act
as surface cracks. If we consider the shape of the fracture-initiating flaw as a surface
crack, then recalculation of a new crack size results in a larger crack dimension. As a
result, the Y factor calculated from this new crack size using equation 4.8 is ≈ 1.26, and
represents the fracture mechanics correction factor for free surfaces (57). Another
possible reason is the influence of the local residual stress that develops during cyclic
fatigue testing, which one must take into account to calculate the Y value.

46
For group AR 3 specimens, the fracture toughness calculated from the control
group using fractographic analysis is 1.26 ± 0.05 MPa•m1/2. The increase in fracture
toughness from 0.7 MPa•m1/2 in the base glass to 1.26 MPa•m1/2 in the AR 3 group is
responsible for the increase in the numbers of cycles needed to initiate the cone-crack
(from 103 cycles to 104 cycles). The fracture surfaces of group AR 3 specimens subjected
to cyclic loading between 103 to 105 cycles are shown in Fig. 4.11.
For group AR 3 specimens tested in deionized water, cone cracks first appeared in
specimens after 103 loading cycles, i.e., fewer cycles than required for specimens tested
in air. The geometric constant values are similar to those of specimens tested in air.
However, the mean critical crack sizes of specimens loaded for 104 and 105 cycles in
deionized water were significantly larger than those in specimens tested in air for the
same number of loading cycles. The geometric constant values decrease as a result of
increasing crack sizes at a constant stress level.
Representative SEM images of fracture surfaces of group AR3 specimens loaded in
deionized water are shown in Fig. 4.13. The contact-induced surface damage can be seen
on the loaded surfaces of specimens subjected to 104 cycles. The contact damage was
more severe in specimens subjected to 105 cycles. As shown in Fig. 4.13b, a surface
impression is noticeable, and the zone of contact damage beneath the loading site is
confined within the cone crack. The failure of this specimen did not start from the cone
crack, but instead initiated from within the surface contact damage area. More details
about the failure initiation process are discussed in the section on fatigue failure
mechanisms.

47
Table 4.6. Crack sizes and geometric factors of group AR 3 specimens tested in air.
No. of
cycles
ΩR (µm)
(Eq. 4.3)
L (µm) (Eq.4.5)
Ap (µm) (Eq. 4.7)
(ab)1/2 (µm)
(Eq. 3.2)
Y'/Z
(Eq. 4.5)
C0π1/2
(Eq. 4.7)
Y
(Eq. 3.2)
104
(6) 63 ± 23
89 ± 29
96 ± 25
81 ± 21
1.50 ± 0.14
1.34 ± 0.06
1.54 ± 0.11
105 (8)
90 ± 53
112 ± 20
123 ± 17
96 ± 10
1.53 ± 0.31
1.28 ± 0.11
1.53 ± 0.11
The mean critical crack size for the control group (0 cycles) is 53 ± 11 µm. ( ) Number of specimens in each group
Table 4.7. Crack sizes and geometric factors of group AR 3 specimens tested in deionized water.
No. of
cycles
ΩR (µm)
(Eq. 4.3)
L (µm)
(Eq. 4.5)
Ap
(µm) (Eq. 4.7)
(ab)1/2 (µm)
(Eq. 3.2)
Y'/Z
(Eq. 4.5)
C0π1/2
(Eq. 4.7)
Y
(Eq. 3.2)
103
(4) 53 ± 14
77 ± 19
80 ± 17
63 ± 17
1.48 ± 0.20
1.44 ± 0.04
1.63 ± 0.05
104
(6) 62 ± 12
109 ± 22
118 ± 6
96 ± 5
1.34 ± 0.07
1.23 ± 0.07
1.36 ± 0.07
105 (3)
69 ± 9
139 ± 24
140 ± 11
113 ± 6
1.25 ± 0.11
1.22 ± 0.07
1.36 ± 0.09
The mean critical crack size for the control group (0 cycles) is 53 ± 11 µm. ( ) Number of specimens in each group

48
(a) 0 cycles (150X) (b) 103cycles (150X)
(c) 104cycles (230X) (d) 105cycles (200X)
Figure 4.11. SEM images of fracture surfaces of group AR 3 specimens subjected to
cyclic loading from 103 to 105 cycles: (a) and (b) reveal semi-elliptical cracks and (c) and (d) show triangular cracks.

49
(a) Air
0
20
40
60
80
100
120
140
160
0 10000 100000
Loading cycles
Cra
ck si
ze ( µ
m)
ΩR
L
Ap
(ab)1/2
(b) Deionized water
0
20
4060
80
100120
140
160180
0 1000 10000 100000
Loading cycles
Cra
ck si
ze ( µ
m)
ΩRLAp(ab)1/2
Figure 4.12. Crack size as a function of loading cycles for AR 3 specimens. The
legends in the graphs refer to the parameters used in Eqs. 3.2, 4.3, 4.5, 4.7 and in Table 4.6 and 4.7.

50
(a) 104cycles (100X)
(b) 105cycles (75X) Figure 4.13. SEM images of fracture surfaces of group AR 3 specimens subjected to
cyclic loading for 104 and 105 cycles in deionized water.

51
For the AR 8 group, the critical crack sizes are summarized in Table 4.8. Crack
sizes as a function of loading cycles for group AR 8 specimens both tested in air and in
deionized water are shown in Fig. 4.14. Failure of all specimens initiated from surface
damage caused by either polishing or cyclic loading. The mean crack sizes of specimens
subjected to cyclic loading in ambient room temperature show no increase after 104 to 105
cycles, and no contact surface damage, i.e., ring or cone crack was observed in most of
the specimens. On the other hand, the strength of these bars tested in deionized water
decreased rapidly after 103 cycles, corresponding to a considerable increase in critical
crack size. In specimens subjected to loading for 104 to105 cycles in deionized water, a
surface impression and subsurface damage zone can be clearly seen. The fracture
surfaces of group AR 8 specimens subjected to cyclic loading for 103 to 105 cycles in air
and in deionized water are shown in Figs. 4.15 and 4.16.
Table 4.8. Critical crack sizes of fractured group AR 8 specimens.
AR 8 0 cycles 103 cycles 104 cycles 105 cycles
Air (µm) 56 ± 12 56 ± 7 69 ± 13 71 ± 8
Deionized water (µm) 92 ± 7 76 ± 16 108 ± 26 265 ± 81
.

52
0
50
100
150
200
250
300
350
400
0 1000 10000 100000
Loading cycles
Cra
ck si
ze ( µ
m)
Air
Deionized water
Figure 4.14. Crack size as a function of loading cycles for group AR 8 specimens tested
in air and in deionized water.

53
(a) 104 cycles (65X)
(b) 105 cycles (100X) Figure 4.15. SEM images of fracture surfaces of group AR8 specimens subjected to
loading for 104 and 105 cycles.

54
(a) 104 cycles (200X)
(b) 105 cycles 120X Figure 4.16. SEM images of fracture surfaces of group AR 8 specimens subjected to
loading for 104 and 105 cycles in deionized water.
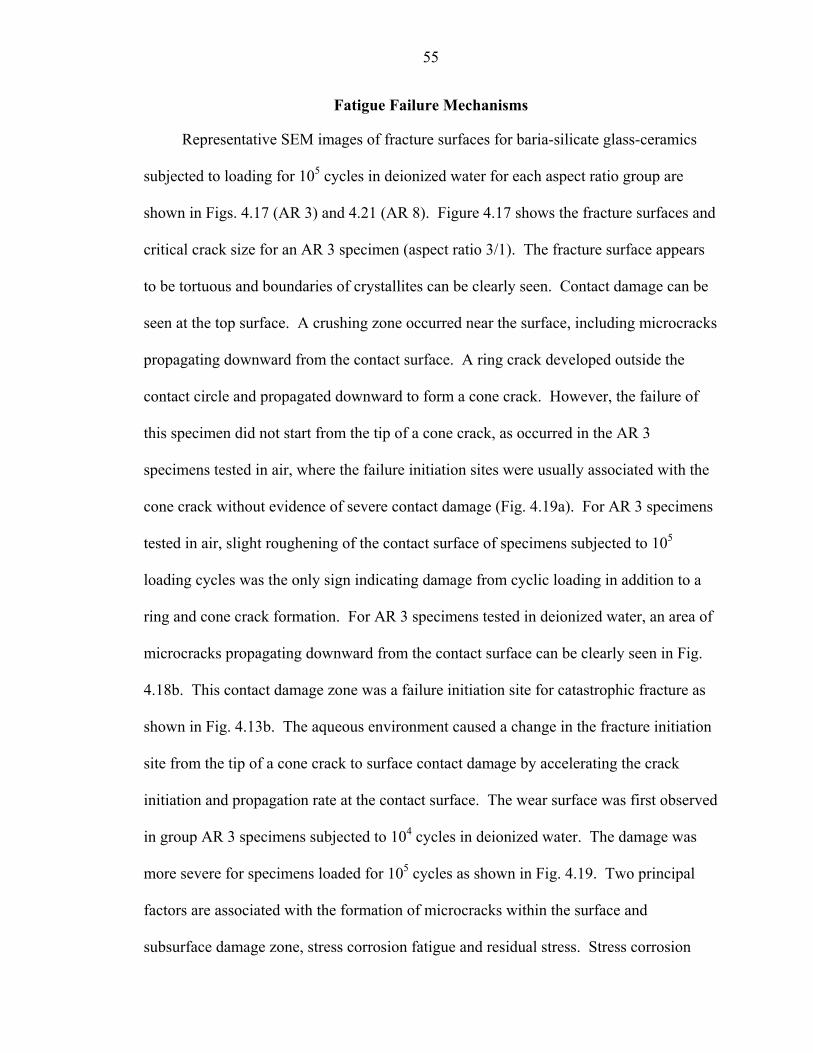
55
Fatigue Failure Mechanisms
Representative SEM images of fracture surfaces for baria-silicate glass-ceramics
subjected to loading for 105 cycles in deionized water for each aspect ratio group are
shown in Figs. 4.17 (AR 3) and 4.21 (AR 8). Figure 4.17 shows the fracture surfaces and
critical crack size for an AR 3 specimen (aspect ratio 3/1). The fracture surface appears
to be tortuous and boundaries of crystallites can be clearly seen. Contact damage can be
seen at the top surface. A crushing zone occurred near the surface, including microcracks
propagating downward from the contact surface. A ring crack developed outside the
contact circle and propagated downward to form a cone crack. However, the failure of
this specimen did not start from the tip of a cone crack, as occurred in the AR 3
specimens tested in air, where the failure initiation sites were usually associated with the
cone crack without evidence of severe contact damage (Fig. 4.19a). For AR 3 specimens
tested in air, slight roughening of the contact surface of specimens subjected to 105
loading cycles was the only sign indicating damage from cyclic loading in addition to a
ring and cone crack formation. For AR 3 specimens tested in deionized water, an area of
microcracks propagating downward from the contact surface can be clearly seen in Fig.
4.18b. This contact damage zone was a failure initiation site for catastrophic fracture as
shown in Fig. 4.13b. The aqueous environment caused a change in the fracture initiation
site from the tip of a cone crack to surface contact damage by accelerating the crack
initiation and propagation rate at the contact surface. The wear surface was first observed
in group AR 3 specimens subjected to 104 cycles in deionized water. The damage was
more severe for specimens loaded for 105 cycles as shown in Fig. 4.19. Two principal
factors are associated with the formation of microcracks within the surface and
subsurface damage zone, stress corrosion fatigue and residual stress. Stress corrosion

56
fatigue can easily occur at the surface damage area during cyclic loading because there is
much material exposed to the environment and this process enhances the propagation of
the microcracks. The formation of these microcracks also increases the compliance of
the material in the damage zone. As a result, the residual stress develops from a
mismatch between the elastic modulus of the damage zone and the surrounding area.
This residual stress also enhances the formation of microcracks within the contact
damage area. The strain mismatch between the glass and crystal phases associated with
cyclic loading can also cause residual tensile stress during the unloading half-cycle (18).
Hill (58) observed the fracture path of group AR 3 specimens propagating through
the glass matrix. He suggested that crack deflection is a toughening mechanism for this
material. Failure of specimens used in a previous study (58) occurred during a quasi-
static four-point loading test. Therefore, failure origins of those specimens were caused
by flaws produced during grinding and polishing. In the present study the critical crack
propagated from a cone crack that developed during blunt indentation loading, or that
originated from the damage zone beneath the contact surface. The propagation path for
the cone crack appeared to progress straight downward and likely through the crystal
phase (Fig.4.18a), following the path perpendicular to the direction of the maximum
tensile stress. Therefore, a transgranular fracture mode was observed after cyclic loading
in group AR 3 specimens. Analytical results from previous studies suggest that failure
from a cone crack should initiate from one of the two opposite points on the base rim of
the cone (53-54). However, we found that only a few specimens failed from the tip of the
cone crack. Instead, most of the AR 3 specimens failed from a triangular crack
developed during fast fracture.
57
Crit
ical
cra
ck
Figu
re 4
.17.
M
onta
ge o
f SEM
imag
es (1
000X
) of f
ract
ure
surf
aces
of
grou
p A
R 3
spec
imen
subj
ecte
d to
cyc
lic
load
ing
for 1
05 cyc
les i
n de
ioni
zed
wat
er: U
pper
left
100
X; U
pper
rig
ht a
nd B
otto
m 1
000X
.

58
Figure 4.21 illustrates the fracture surfaces of the AR 8 group (aspect ratio 8/1).
The surfaces appear to be more tortuous, but with sharp deflection angles instead of the
smoother curves seen in the fracture path for the AR 3 group (Fig. 4.22a). Hill (58)
suggested that the crack path of this group was transgranular through the baria-silicate
crystals indicating that the fracture propagated along a new path of least resistance rather
than around the crystals as seen in the AR 3 group. He also suggested crack bridging as
an additional toughening mechanism in addition to crack deflection for this group.
Cone crack
Microcracks
(a) (b) Figure 4.18. SEM image of fracture surfaces of group AR3 specimens subjected to
loading for 105 cycles in deionized water (2000X): (a) cone crack-related failure (higher magnification of Fig. 4.13a); (b) surface damage-related failure (higher magnification of Fig. 4.17).

59
Ring crack
(a)
e
(b)
Figure 4.19. SEM images of surface contact damage in AR 3 spe
cycles in air; (b) after 105 cycles in deionized water.
Contact damag
cimens: (a) after 105
60
In the present study, transgranular fracture occurred through the crystal phase in the
crushing zone beneath the contact surface and other areas (Fig.4.21), suggesting the same
fracture path and the toughening mechanism as that which occurred in the quasi-static
loading failure. We did not observe failure originating from a cone crack in AR 8
specimens. Based on the fracture surface analysis of group AR 8 specimens tested in air,
the mean crack size increased slightly in proportion to the increase in numbers of loading
cycles. However, no subsurface damage was detected in those specimens except for the
slight rough surface observed after 105 cycles (Fig.4.20a). In contrast, group AR 8
specimens tested in deionized water showed a significant effect of stress corrosion fatigue
(Fig. 4.20b). The mean strength values of these bars tested in deionized water decreased
rapidly after 103 cycles, corresponding to a significant increase in critical crack sizes. In
specimens subjected to loading for 104 to105 cycles (Fig. 4.21) in deionized water, a
surface impression and subsurface damage zone can be clearly seen. Areas of
microcracks propagating downward from the contact surface were observed and are
shown in Fig. 4.22. The dominant fracture path is transgranular (Fig. 4.22a), which is
similar to that observed after quasi-static loading failure (58).
The mechanisms of microcrack formation in group AR 8 specimens were similar to
those described earlier for group AR 3 specimens. However, the effect of an aqueous
environment was significant for group AR 8 specimens. Because of its high fracture
toughness (2.11 ± 0.16 MPa•m1/2), group AR 8 specimens are more resistant to crack
propagation compared with the glass and AR 3 groups, which we can verify for the
specimens tested in air. However, the aqueous environment accelerated the crack
propagation rate at the surface contact area in both AR 3 and AR 8 groups. Thus, we

61
observed severe surface damage in specimens tested in deionized water. This resulted in
a significant decrease in the mean strength for group AR 8 specimens because the failure
initiation site for group AR 8 specimens was at the contact surface. For group AR 3
specimens, even though we observed severe surface damage, the failure initiation sites of
specimens tested in air were different from those observed in specimens tested in
deionized water. Because of the change of failure initiation sites from a cone-crack
related flaw to contact surface damage, we did not observe a significant decrease in
strength for group AR 3 specimens tested in air and in deionized water after 105 cycles.
In this study, the contact fatigue damage patterns of glass-ceramic specimens are
similar to the wear process of silicon nitride observed in a previous study (43). The wear
mechanisms of silicon nitride with a fine surface finish can be divided into three stages.
In stage I, roughening of the contact surface occurs because of the damage to the grain
boundaries. In stage II, ring and cone cracks form and propagate. In stage III, a
significant amount of material is lost from the region outside the contact area. If the
surface finish is poor, stage II can occur before stage I (43).
Stage I occurs because of the viscoelastic behavior of the glass phase that is
distributed along the grain boundaries of silicon nitride during the sintering process. The
delayed response of the glass phase allows tensile stress to develop during unloading
because of the strain mismatch between the two phases. Eventually, the cyclic tensile
stress in the glass phase causes grain boundary fracture. The delayed response of the
glass phase as well as the large loads also causes shear stress to develop just outside the
contact region. This distribution of shear stress can enhance crack initiation near the
contact circle. In this study, roughening of the contact surface was observed on

62
specimens subjected to cyclic loading in group AR 3 and group AR 8 specimens tested in
deionized water (Fig.4.23). The glass matrix in baria-silicate glass-ceramics behaves as a
site for the residual tensile stress to occur. The protruding crystals and sites associated
with lost crystals are clearly seen in Fig. 4.23.
Stage II occurs because of the high tensile stress at the edge of the contact region in
the Hertzian stress field and the existence of the surface cracks. In this study, a ring and
cone crack were observed in most of the AR 3 specimens subjected to a sufficient
number of loading cycles (Fig. 4.19). For group AR 8 specimens, no ring or cone crack
was observed because of the dissipation of the contact stress that can decrease the
intensity of the Hertzian stress fields (Fig. 4.20).
Stage III involves the removal of material from the surface and may resemble the
spallation caused by subsurface cracks that propagate to the surface (59). For stage III
wear, cracks start at the contact surface and propagate downward a certain distance and
then progress upwards toward the surface (43, 59). The reason for the change in the
direction of the propagating cracks may be the change in stress fields when there is the
presence of cracks in the material structure. High tensile stress fields are observed close
to the crack tip (59). A high tensile stress field at the surface and at the crack tip can
cause the cracks to propagate toward the surface. The upward-curving cracks eventually
result in a loss of material from the region outside the contact region. In the present
study, no stage III wear was observed in the groups AR 3 and AR 8 tested in air. In
contrast, severe surface damage caused from material loss was observed in group AR 3
and AR 8 specimens tested in deionized water (Fig.4.24). Thus, stress corrosion has a
significant effect at this stage, by increasing the rate of the crack initiation and

63
propagation in baria-silicate glass-ceramics. This process results in the creation of
strength-limiting flaws that cause significant decreases in the strength of glass-ceramic
materials.
In summary, cyclic loading creates strength-limiting flaws that can affect the
fracture susceptibility of ceramic materials. For materials with low toughness (glass and
AR 3), a ring and cone crack were the dominant flaws that caused the decrease in the
mean strength of these materials. For the material with a higher toughness (AR 8),
surface flaws created during contact fatigue were strength limiting. Stress corrosion
enhanced the crack propagation rate and caused a significant decrease in strength of the
AR 8 group. The contact fatigue damage patterns observed in this study were similar to
the wear process reported in a previous study (43), including three stages of progressive
surface and subsurface damage.
In this study, the glass-ceramics were produced with two aspect ratios using
controlled heat treatment regimens to study the effect of microstructure on fatigue failure
mechanisms. We selected a baria-silicate composition because there should be little
residual stress caused by elastic mismatch or a thermal expansion mismatch during the
cooling process. Therefore, we minimized the effect of the residual stress caused from
these mismatches and we observed the actual cyclic behavior of baria-silicate glass-
ceramics.
Previous studies showed that the microstructure of a micaceous glass-ceramic
system was a major factor in controlling the damage modes under Hertzian contact
loading (9, 10). By heat-treating glass specimens, the investigations yielded a series of
glass-ceramics with microstructures that contained fine (0.3 µm x 1 µm) and coarse

64
platelets (1.2 µm x 8 µm). Contact damage patterns from blunt indentation of bonded-
interface specimens can be classified into two damage modes: (1) ring and cone cracks
that are dominant in fine microstructures, and (2) subsurface deformation or quasi-
plasticity that occurred in coarse microstructures. The authors concluded that
microstructural coarsening of micaceous glass-ceramics produced a brittle-plastic
transition.
(a)
Contact damage
(b)
Contact damage
Figure 4.20. Images of surface contact damage in group AR 8 specimens (a) after 105
cycles in air; (b) after 105 cycles in deionized water.

65
Crit
ical
cra
ck
Figu
re 4
.21.
M
onta
ge o
f SEM
imag
es o
f fra
ctur
e su
rfac
es o
f gr
oup
AR
8 sp
ecim
ens s
ubje
cted
to 1
05 cy
cles
(100
0X) i
n de
ioni
zed
wat
er: U
pper
left
100
X; U
pper
rig
ht a
nd B
otto
m 1
000X
.

66
Transgranular fracture
(a) 104 cycles
Transgranular fracture
CCrruusshhiinngg zzoonnee
(b) 105 cycles
Figure 4.22. SEM images of fracture surfaces of group AR8 specimens subjected to
loading for 104 and 105 cycles in deionized water (3000X).

67
Protruding crystals
(a)
Protruding crystals
(b)
Figure 4.23. SEM images of the cyclically loaded surfaces of baria-silicate glass-ceramics (a) AR 3 and; (b) AR 8 specimens tested in deionized water.

68
(a)
(b)
Figure 4.24. SEM images of the cyclically loaded surfaces of baria-silicate glass-ceramics (a) AR 3 and; (b) AR 8 specimens tested in deionized water.

69
In the present study, we observed the same fracture patterns as reported earlier, but
some additional explanation is necessary. Relative to the critical crack configurations,
we observed that the fracture paths progressed through the contact damage in specimens
with a high aspect ratio (AR 8), or near the ring crack in glass specimens in a similar
manner as was reported in other studies (9, 10). Previous investigators (9, 10) did not
identify whether the failure origins occurred from the cone cracks or from contact
damage. Based on fractographic analysis of our specimens, we found three different
crack configurations that cannot be clearly described by a simple cone-crack model (53).
The second point is that the authors (12, 13, 60) also suggested that the Hertzian test
simulates oral loading conditions by using contact loads that are similar to intra-oral
occlusal loads, and an indenter radius that is comparable to the cuspal radii of teeth.
Indentation loads of up to 3000 N were used, which were very high compared to normal
occlusal loads (89-890 N) (61). Furthermore, for indented specimens, the tungsten
carbide indenters that they used have a much higher elastic modulus than that of tooth
enamel. As a result, the authors suggested that a quasi-plastic zone beneath the contact
area was a failure initiation site for alumina and silicon carbide materials (27). This
quasi-plastic zone developed in a compressive stress field caused from Hertzian contact
loading. In the present study, the cyclic contact load of 200 N was low compared with
that used in the previous studies. The damage zone was confined near the surface. It is
evident that microcracks formed in that damage zone originated and propagated
downward from the contact surface, not from the compressive zone beneath the contact
area.

70
Clinical failure mechanisms are currently a topic of a major concern. Although
some investigators prefer a blunt indentation test since it can characterize materials
properties under clinically relevant conditions, others argue that indentation damage is
typically not associated with clinical failures of dental prostheses (9-12, 62, 63). From a
fractographic perspective, failure initiation sites of failed ceramic prostheses appear to
occur at the cementation surface or the interface between core and veneer (14, 15), not
within occlusal surface. In spite of this difference, there is little doubt that contact
damage can occur during mastication, because wear of the occlusal surfaces can be
generally observed in ceramic prostheses. Even though this damage may not lead to
immediate failure, a decrease in the critical stress for failure can be expected. A partial
loss of ceramic prosthesis structure (chipping) caused by contact damage is also possible
as a treatment failure because of compromised esthetics and function. To obtain useful in
vitro information that is relevant to clinical failure conditions, well-designed experiments
under variable loading parameters and simulated clinical conditions are recommended for
future studies of the failure behavior of dental ceramics.

CHAPTER 5 CONCLUSIONS
The conclusions of this study are as follows:
(1) Cyclic loading decreases the strength of baria-silicate glass and glass-ceramics.
(2) Four different crack geometries were identified and associated with failure
mechanisms. For glass specimens, the decrease in fracture stress after 103 cycles was
associated with cone crack formation. No significant additional reduction was found
after loading for 103 cycles and 105 cycles of specimens tested both in air and in
deionized water.
(3) For the glass-ceramic groups with a crystal aspect ratio of 3/1 tested in air, the
decrease in fracture stress occurred initially after 104 cycles and was associated with the
formation of cone cracks. The decrease in fracture stress observed after 103 cycles for
specimens tested in deionized water, suggests an acceleration of crack propagation
because of stress corrosion.
(4) For the glass-ceramic groups with a crystal aspect ratio of 8/1, we did not
observe failure originating from a cone crack in any specimens. We observed a gradual
decrease in fracture stress in specimens subjected to loading in air for 103 to 105 cycles.
A statistically significant decrease was found in specimens cyclically tested in deionized
water as compared to those tested in air. A reduction of approximately 50% in fracture
stress was found for specimens subjected to loading for 105 cycles in deionized water.
(5) Comparisons between methods used to determine the possible crack sizes were
made. The geometric constants obtained from the surface area analyses (Equations 3.2
71

72
and 4.7) are more rational than those obtained from the cone-crack analysis models
(Equations 4.3 and 4.5). However, an error is associated with the methods that are used
to determine the surface area of critical cracks in this study because the curvature of a
cone crack was disregarded to simplify the calculation.
(6) Control of microstructure by heat treatment can greatly affect the strength and
failure mechanisms of glass-ceramics during cyclic fatigue testing in air. The failure
initiation mechanisms change from one occurring at the base of the cone-crack in baria-
silicate glass and glass-ceramics with a crystal aspect ratio of 3/1 (AP 3) to that resulting
from surface contact damage in glass-ceramics with an crystal aspect ratio of 8/1 (AR 8).
(7) An intergranular fracture path was observed in glass-ceramics with an aspect
ratio of 3/1, suggesting that the crack deflection is a major toughening mechanism. For
an aspect ratio of 8/1, a transgranular fracture mode was dominant and crack bridging and
crack deflection contributed to toughening.
(8) Stress corrosion fatigue accelerated the crack propagation rate in baria-silicate
glass-ceramic specimens, especially in specimens with an aspect ratio of 8/1. The mean
crack sizes were significantly larger in AR 8 specimens subjected to cyclic loading in
deionized water, compared with those subjected to the same numbers of cycles in air.

REFERENCES
1. Walton JN, Gardner FM, Agar JR (1986). A survey of crown and fixed partial denture failures: Length of service and reasons for replacement. J Prosthet Dent 56:416-21.
2. Foster LV (1990). Failed conventional bridge work from general dental practice: Clinical aspects and treatment needs 142 cases. Br Dent J 168:199-201.
3. Moffa JP, Lugassy AA, Ellison JA (1988). Clinical evaluation of a castable ceramic material (abstract). J Dent Res 67:118.
4. White SN (1993). Mechanical fatigue of a feldspathic dental porcelain. Dent Mater 9:260-4.
5. White SN, Zhao XU, Yu Z, Li ZC (1995). Cyclic mechanical fatigue of a feldspathic dental porcelain. Int J Prosthodent 8:1-8.
6. White SN, Li ZC, Yu Z, Kipnis V (1997). Relationship between static chemical and cyclic mechanical fatigue in a feldspathic porcelain. Dent Mater 13:103-10.
7. Sobrinho LC, Cattell MJ, Glover RH, Knowles JC (1998). Investigation of the dry and wet fatigue properties of three all-ceramic crown systems. Int J Prosthodont 11:255-62.
8. Morena R, Beaudreau GM, Lockwood PE, Evans AL, Fairhurst CW (1986). Fatigue of dental ceramics in a simulated oral environment. J Dent Res 65:993-7.
9. Peterson IM, Wuttiphan S, Lawn BR, Chyung K (1998). Role of microstructure on contact damage and strength degradation of micaceous glass-ceramics. Dent Mater 14:80-9.
10. Peterson IM, Parjares A, Lawn BR, Thompson VP, Rekow ED (1998). Mechanical characterization of dental ceramics by Hertzian contacts. J Dent Res 77:589-602.
11. Cai H, Kalceff MS, Lawn BR (1994). Deformation and fracture of mica-containing glass-ceramics in Hertzian contacts. J Mater Res 9:762-70.
12. Cai H, Kalceff MS, Hooks BM, Lawn BR (1994). Cyclic fatigue of a mica-containing glass-ceramics at Hertzian contacts. J Mater Res 9:2654-61.
73

74
13. Lawn BR, Deng Y, Thompson VP (2001). Use of contact testing in the characterization and design of all-ceramic crownlike layer structures: a review. J Prosthet Dent 86:495-510.
14. Kelly JR, Giordano R, Pober R, Cima MJ (1990). Fracture surface analysis of dental ceramics: clinically failed restorations. Int J Prosthodont 3:430-40.
15. Thompson JY, Anusavice KJ, Naman A, Morris HF (1994). Fracture surface characterization of clinically failed all-ceramic crowns. J Dent Res 73:1824-32.
16. MacDowell JF (1965). Nucleation and crystallization of barium silicate glasses. Proc Brit Ceram Soc 3:229-40.
17. Freiman SW, Onoda GY, Pincus AG (1974). Mechanical properties of 3BaO-5SiO2 glass. J Am Ceram Soc 57:8-12.
18. Suresh S (1998). Fatigue of materials. Cambridge University Press, Cambridge, U.K.
19. Ritchie RO (1988). Mechanisms of fatigue crack propagation in metals, ceramics and composites: role of crack tip shielding. Mater Sci Eng A103:15-28
20. Ritchie RO, Dauskardt RH, Yu W (1990). Cyclic fatigue-crack propagation, stress-corrosion, and fracture-toughness behavior in pyrolytic carbon-coated graphite for prosthetic heart valve applications. J Biomed Mater Res 24:189-206.
21. Ritchie RO, Gilbert CJ, McNaney JM (2000). Mechanics and mechanisms of fatigue damage and crack growth in advanced materials. Int J Solids Struc 37:311-29.
22. Lathabai S, Rodel J, Lawn BR (1991). Cyclic fatigue from frictional degradation at bridging grains in alumina. J Am Ceram Soc 74:1340-8.
23. Dauskardt RH (1993). A frictional wear mechanism for fatigue-crack growth in grain bridging ceramics. Acta Metal Mater 41:2765-81.
24. Lawn BR, Padture NP, Guiberteau F, Cai H (1994). A model for microcrack initiation and propagation beneath Hertzian contacts in polycrystalline ceramics. Acta Metal Mater 42:1683-93.
25. Argon AS (1982). Fracture in compression of brittle solids. National Materials Advisory Board Report NMAB-404, National Academy Press, Washington, DC.
26. Ewart R, Suresh S (1987). Crack propagation in ceramics under cyclic loads. J Mater Sci 22:1173-92.
27. Lawn BR (1998). Indentation of ceramics with spheres: a century after Hertz. J Am Ceram Soc 81:1977-94.

75
28. Roesler FC (1956). Brittle fractures near equilibrium. Proc Phys Soc London B69:981-92.
29. Lawn B (1993). Fracture of brittle solids. Cambridge University Press, Cambridge, U.K.
30. Lee SK, Lawn BR (1998). Role of microstructure in Hertzian contact damage in silicon nitride: strength degradation. J Am Ceram Soc 81:997-1003.
31. Wiederhorn SM, Bolz LH (1970). Stress corrosion and static fatigue of glass. J Am Ceram Soc 53:543-8.
32. Michalske TA, Freiman SW (1982). A molecular interpretation of stress corrosion in silica. Nature 295:511-2.
33. Ebrahimi ME, Chevalier J, Fantozzi G (1999). Slow crack-growth behavior of alumina ceramics. J Mater Res 15:142-7.
34. Chevalier J, Olagnon C, Fantozzi G (1999). Subcritical crack propagation in 3Y-TZP ceramics: static and cyclic fatigue. J Am Ceram Soc 82:3129-38.
35. Ebrahimi ME, Chevalier J, Fantozzi G (2000). Environmental effects on crack propagation of alumina ceramics. Ceram Eng Sci Proc 21:385-96.
36. Asoo B, McNaney JM, Mitamura Y, Ritchie RO (2000). Cyclic fatigue-crack propagation in sapphire in air and simulated physiological environments. J Biomed Mater Res 52:488-91.
37. Tanaka H, Bando Y (1990). Atomic crack tips in silicon carbide and silicon crystals. J Am Ceram Soc 73:761-3.
38. Cook RH (1986). Crack propagation thresholds: a measure of surface energy. J Mater Res 1:852-60.
39. Thomson R (1990). The molecular wedge in a brittle crack: a simulation of mica/water. J Mater Res 5:524-34.
40. Hertzberg RW (1995). Deformation and fracture mechanics of engineering materials. John Wiley & Sons, Inc., New York, U.S.A.
41. Choi G, Horibe S (1995). The environmental effect on cyclic fatigue behavior in ceramic materials. J Mater Sci 30:1565-9.
42. Jacobs DS, Chen IW (1995). Cyclic fatigue in ceramics: a balance between crack shielding accumulation and degradation. J Am Ceram Soc 78:513-20.
43. Chen Z, Cuneo JC, Mecholsky JJ, Hu S (1996). Damage processes in Si3N4 bearing material under contact loading. Wear 198:197-207.

76
44. Paris PC, Gomez MP, Anderson WP (1961). A rational analytic trend of fatigue. Trend in Engineering 13:9-14.
45. Sylva LA, Suresh S (1989). Crack growth in transforming ceramics under cyclic tensile loads. J Mater Sci 24:1729-38.
46. Dauskardt RH, Marshall DB, Ritchie RO (1990). Cyclic fatigue-crack propagation in magnesia-partially-stabilized zirconia ceramics. J Am Ceram Soc 73:893-903.
47. Jones DW, Sutow EJ (1987). Stress corrosion failure of dental porcelain. Br Ceram Trans J 86:40-3.
48. Adam R, McMillan PW (1977). Static fatigue in glasses. J Mat Sci 12:643-57.
49. Sherrill CA, O’Brien WJ (1974). Transverse strength of aluminous and feldspathic porcelain. J Dent Res 53:683-90.
50. Southan DE, Jorgensen KD (1974). The endurance limit of dental porcelain. Aust Dent J 19:7-11.
51. Irwin GR (1962). Crack-extension force for a part-through crack in a plate. J Appli Mech 29:651.
52. Mecholsky JJ, Passoja DE, Feinberg-Ringel KS (1989). Quantitative analysis of brittle fracture surfaces using fractal geometry. J Am Ceram Soc 72:460-5.
53. Lawn BR, Wiederhorn SM, Johnson HH (1975). Strength degradation of brittle surfaces: blunt indenters. J Am Ceram Soc 58:428-32.
54. Evans AG (1973). Strength degradation by projectile impacts. J Am Ceram Soc 56:405-9.
55. Murakami Y (1985). Analysis of stress intensity factors of mode I, II and III for inclined surface cracks of arbitrary shape. Eng Frac Mech 22:101-14.
56. Widjaja S, Ritter JE, Jakus K (1996). Influence of R-curve behavior on strength degradation due to Hertzian indentation. J Mater Sci 31: 2379-84.
57. Brown WF, Strawley JE (1967). Plane strain crack toughness testing of high strength metallic materials. ASTM Special technical publication No. 410: 89-129.
58. Hill TJ, Mecholsky JJ, Anusavice KJ (1995). Fracture toughness versus crystallization in baria-silicate glass-ceramics. Am Assoc Dent Res Abstract 1657.
59. Chao L, Shetty DK, Adair JH, Mecholsky JJ (1996). Development of silicon nitride for rolling-contact bearing applications – a review. J Mater Edu 17:245.
60. Jung YG, Peterson IM, Kim DK, Lawn BR (2000). Lifetime-limiting strength degradation from contact fatigue in dental ceramics. J Dent Res 79:722-31.

77
61. Anusavice KJ (1996). Philllip’s science of dental materials, 10th edition. W.B. Saunders Company, Philadelphia, USA.
62. Kelly JR, Tesk JA, Sorensen JA (1995). Failure of all-ceramic fixed partial dentures in vitro and in vivo: analysis and modeling. J Dent Res 74:1253-8.
63. Kelly JR (1999). Clinically relevant approach to failure testing of all-ceramic restorations. J Prosthet Dent 81:652-61.

BIOGRAPHICAL SKETCH
Kallaya Suputtamongkol was born in Bangkok, Thailand, on December 15, 1968.
After graduation from a local high school in 1984, she entered Mahidol University and
earned a Doctor of Dental Surgery degree in 1990. She continued her graduate study at
Mahidol University and obtained a Master of Science degree in prosthodontics in 1997.
After graduation, she has started working at the Faculty of Dentistry, Mahidol University,
as an instructor in the Prosthodontics Department. She has continued her education by
entering the Ph.D program at the University of Florida, College of Engineering, in 1998.
78


![ON TURNING HUNDRED - Banu Mandal D Banaji Shenaz K Banaji Arnaz A Bankwalla [NR] USA Navaz R Bankwalla [NR] USA Cyra F Baria Roozebeh Baria Roshan M Baria Dinar D Behrana Nargis A](https://static.fdocuments.in/doc/165x107/5b353b627f8b9a330e8cf9b2/on-turning-hundred-banu-d-banaji-shenaz-k-banaji-arnaz-a-bankwalla-nr-usa-navaz.jpg)