Consumer price inflation, UK: July 2021
39
Page 1 of 20 Next release: 15 September 2021 Release date: 18 August 2021 Contact: Philip Gooding [email protected] Consumer price inflation enquiries: +44 1633 456900. Consumer price inflation recorded message (available after 8:00 on release day): +44 800 011 3703 Statistical bulletin Consumer price inflation, UK: July 2021 Price indices, percentage changes, and weights for the different measures of consumer price inflation. Table of contents 1. Main points 2. Annual CPIH inflation rate 3. Contributions to the annual CPIH inflation rate 4. Contributions to change in the annual CPIH inflation rate 5. Owner occupiers’ housing costs 6. Consumer price inflation data 7. Glossary 8. Measuring the data 9. Strengths and limitations 10. Related links
Transcript of Consumer price inflation, UK: July 2021

Page 1 of 20
Next release: 15 September 2021
Release date: 18 August 2021
Contact: Philip Gooding [email protected] Consumer price inflation enquiries: +44 1633 456900. Consumer price inflation recorded message (available after 8:00 on release day): +44 800 011 3703
Statistical bulletin
Consumer price inflation, UK: July 2021Price indices, percentage changes, and weights for the different measures of consumer price inflation.
Table of contents
1. Main points
2. Annual CPIH inflation rate
3. Contributions to the annual CPIH inflation rate
4. Contributions to change in the annual CPIH inflation rate
5. Owner occupiers’ housing costs
6. Consumer price inflation data
7. Glossary
8. Measuring the data
9. Strengths and limitations
10. Related links

Page 2 of 20
1 . Main points
The Consumer Prices Index including owner occupiers’ housing costs (CPIH) rose by 2.1% in the 12 months to July 2021, down from 2.4% in the 12 months to June.
The largest upward contribution to the CPIH 12-month inflation rate came from transport (0.85 percentage points).
CPIH was unchanged on the month in July 2021, compared with a rise of 0.4% in July 2020.
Clothing and footwear, and a variety of recreational goods and services made the largest downward contributions to the change in the CPIH 12-month inflation rate between June and July 2021.
Price rises for second-hand cars, compared with falls a year ago, resulted in the largest, partially offsetting, upward contribution to change.
The Consumer Prices Index (CPI) rose by 2.0% in the 12 months to July 2021, down from 2.5% to June; on a monthly basis, CPI was unchanged in July 2021, compared with a rise of 0.4% in July 2020.
The number of CPIH items identified as unavailable in July 2021 fell to one, accounting for 0.04% of the basket by weight; we collected a weighted total of 87.2% of the comparable coverage collected before the first lockdown in 2020 (excluding unavailable items).
Around 0.2 percentage points of the easing in the CPIH rate between June and July 2021 came from base effects, specifically from items that became available again in July 2020 at the end of the first coronavirus (COVID-19) lockdown.

Page 3 of 20
2 . Annual CPIH inflation rate
Table 1: CPIH, OOH component and CPI index values, and 12-month and 1-month rates UK, July 2020 to July 2021
CPIH Index (UK, 2015 = 100)
CPIH 12-month rate
CPIH 1-month rate
CPI Index(UK, 2015 =100)
CPI 12- month rate
CPI 1- month rate
OOH Index(UK, 2015=100)
OOH 12-month rate
2020 Jul 109.2 1.1 0.4 109.1 1.0 0.4 108.0 1.1
Aug 108.8 0.5 -0.3 108.6 0.2 -0.4 108.1 1.1
Sep 109.2 0.7 0.4 109.1 0.5 0.4 108.3 1.2
Oct 109.2 0.9 0.0 109.1 0.7 0.0 108.4 1.2
Nov 109.1 0.6 -0.1 108.9 0.3 -0.1 108.6 1.2
Dec 109.4 0.8 0.2 109.2 0.6 0.3 108.8 1.3
2021 Jan 109.3 0.9 -0.1 109.0 0.7 -0.2 109.0 1.3
Feb 109.4 0.7 0.1 109.1 0.4 0.1 109.1 1.4
Mar 109.7 1.0 0.2 109.4 0.7 0.3 109.1 1.3
Apr 110.4 1.6 0.7 110.1 1.5 0.6 109.2 1.4
May 111.0 2.1 0.5 110.8 2.1 0.6 109.4 1.5
Jun 111.4 2.4 0.4 111.3 2.5 0.5 109.6 1.6
Jul 111.4 2.1 0.0 111.3 2.0 0.0 109.8 1.6
Source: Office for National Statistics - Consumer price inflation

Page 4 of 20
Figure 1: Annual CPIH inflation eased to 2.1% in July 2021
CPIH, OOH component and CPI 12-month inflation rates for the last 10 years, UK, July 2011 to July 2021
Source: Office for National Statistics – Consumer price inflation
The Consumer Prices Index including owner occupiers’ housing costs (CPIH) rose by 2.1% in the 12 months to July 2021, down from 2.4% to June. Inflation rates at this time are influenced by the effects of the coronavirus (COVID-19) lockdown in spring 2020. The Office for National Statistics’ (ONS) blog Beware Base Effectsdescribes how relatively low prices for some items during and after that period influence current inflation rates.

Page 5 of 20
Around 0.2 percentage points of the easing in the CPIH 12-month rate between June and July 2021 came from base effects, specifically from items that became available again in July 2020 at the end of the first coronavirus lockdown. There were 55 items that became available at that time. The June 2020 indices for these items were imputed in line with such that they had no impact on the all items index. The collected published methodologyprices in July 2020 had an upward effect on the index between June and July 2020, and consequently a downward effect on the change in the 12-month rate between June and July 2021.
The Consumer Prices Index (CPI) rose by 2.0% in the 12 months to July 2021, down from 2.5% to June.
On a monthly basis, both CPIH and CPI were unchanged in July 2021, compared with rises of 0.4% in July 2020. In 2021, price rises in transport were largely offset by price falls for clothing and footwear, and a variety of recreational goods. In 2020, the main upward contributions to the monthly rate came from transport, recreation and culture, and restaurants and hotels. More information on contributions to change is provided in .Section 4
Given that the owner occupiers’ housing costs (OOH) component accounts for around 19% of the CPIH, it is the main driver for differences between the CPIH and CPI inflation rates.
More about economy, business and jobs
All ONS analysis, summarised in our .economy, business and jobs roundupExplore the latest trends in employment, prices and trade in our .economic dashboardView .all economic data

Page 6 of 20
1.
2.
3 . Contributions to the annual CPIH inflation rate
Figure 2: Contribution from transport last higher in November 2011
Contributions to the CPIH 12-month inflation rate, UK, July 2019 to July 2021
Source: Office for National Statistics – Consumer price inflation
Notes:
Individual contributions may not sum to the total because of rounding.
More information on the contents of each group can be found in Table 3 in the accompanying Consumer .price inflation dataset
Figure 2 shows the extent to which the different categories of goods and services have contributed to the overall Consumer Prices Index including owner occupiers’ housing costs (CPIH) 12-month inflation rate over the last two years.
Transport
The contribution from transport has shown more variation than any other group over the last two years. It has ranged from a downward contribution of 0.20 percentage points in May 2020 during the first coronavirus (COVID-19) lockdown to an upward contribution of 0.85 percentage points in July 2021. This is the largest upward contribution from any division this month and the largest from transport since November 2011.

Page 7 of 20
Within transport, the movements have been caused mainly by changes in the price of motor fuels. Motor fuels made a downward contribution to the 12-month rate between March 2020 and February 2021, before the contribution turned positive in March 2021 and subsequently increased to 0.41 percentage points in June 2021. It has eased in July to 0.36 percentage points.
Average petrol prices stood at 132.6 pence per litre in July 2021, compared with 111.4 pence per litre a year earlier. The July 2021 price is the highest recorded since September 2013. In comparison, the UK was coming out of the first national lockdown at this point last year and petrol prices were starting to recover after a period of reduced demand.
The contribution from second-hand cars has also changed significantly since the beginning of 2020, rising from a downward effect of 0.07 percentage points in January 2020 to an upward pull of 0.15 percentage points in October. With the onset of the coronavirus pandemic, there were reports of increased demand as people sought alternatives to public transport. From October 2020, the contribution to the 12-month rate gradually fell back to 0.01 percentage points in April 2021 before rising again to 0.18 percentage points in July 2021, the largest contribution from second-hand cars since May 2010.
These latest movements come amidst reports of increased demand as dealers opened following the latest national lockdown, together with a global semiconductor shortage affecting the production of new cars and resulting in consumers turning to the used car market. Additionally, there are reportedly concerns in the trade about the supply of second-hand cars because of a variety of factors. These include fewer one-year-old cars coming to the market now because of a fall in new car registrations last year, and the extensions of lease contracts and fewer part exchanges caused again by delays in new-car supply. The latest Prices Economic Analysis compares the growth in second-hand car prices in the UK with the euro area and United States.
Housing and household services
The contribution from housing and household services was unchanged between June and July 2021, and the contributions in both months were significantly above those from April 2020 to March 2021. Reductions to household utility prices in April 2020 saw the group’s contribution to the CPIH headline rate fall to 0.16 percentage points but this fall was reversed in April 2021 with rises in gas and electricity prices.
Recreation and culture
During the period from April 2020 to January 2021, the largest contribution to the 12-month rate came from recreation and culture, reaching 0.35 percentage points in August 2020 then again in December 2020 and January 2021. The contribution has since eased back to 0.09 percentage points in July 2021. Contributions from this category are subject to short-term fluctuations as a result of price movements for items such as computer games and they have also been influenced by the imputation of price indices for some items that have been unavailable because of the coronavirus pandemic; examples include package holidays and various recreational and cultural services.
Clothing and footwear
For most months since March 2020, the contribution from clothing and footwear has been negative. It has turned positive from May 2021 in part because of the low prices experienced during the first coronavirus lockdown in 2020.
During 2020, clothing and footwear prices showed a different seasonal pattern compared with previous years, and they were clearly influenced by coronavirus restrictions. Then, in 2021, prices unusually fell between January and February, again potentially caused by coronavirus lockdown, before rising in subsequent months to June. In July, prices fell as usual during the summer sales season, albeit the incidence of sales in the datasets for both June and July was less than in recent years.

Page 8 of 20
Figure 3: Clothing and footwear prices fall during the summer sales season
Clothing and footwear price indices (January of each year = 100), UK, January 2016 to July 2021
Source: Office for National Statistics - Consumer price inflation
Figure 3 shows the seasonal price movements for clothing and footwear over the latest six years, setting January equal to 100 in each year. The fall in price into July 2021 is similar to that seen in most recent years and contrasts with the relatively flat picture in 2020. The indices in the latest two months are above those experienced in recent years in part because they are referenced on January 2021 when prices were relatively low, influenced again by the coronavirus lockdown.

Page 9 of 20
Food and non-alcoholic beverages
Food and non-alcoholic beverages is the only division with a downward contribution (of 0.04 percentage points) in July 2021. This division has had a downward pull on the headline rate since November 2020, with the majority of the more detailed food categories contributing to the downward pull each month.

Page 10 of 20
1.
2.
4 . Contributions to change in the annual CPIH inflation rate
Figure 4: Downward contributions from recreation and culture, and clothing and footwear reduce the headline inflation rate
Contributions to change in the CPIH 12-month inflation rate, UK, between June and July 2021
Source: Office for National Statistics – Consumer price inflation
Notes:
Individual contributions may not sum to the total because of rounding.
More information on the contents of each group can be found in Table 3 in the accompanying Consumer .price inflation dataset
Figure 4 shows how each of the main groups of goods and services contributed to the change in the Consumer Prices Index including owner occupiers’ housing costs (CPIH) 12-month inflation rate between June and July 2021. The corresponding figures for the Consumer Prices Index (CPI) can be found in Column F of Table 26 in the .Consumer price inflation dataset
Page 11 of 20
Around 0.2 percentage points of the easing in the CPIH 12-month rate between June and July 2021 came from base effects, specifically from items that became available again in July 2020 at the end of the first coronavirus (COVID-19) lockdown. There were 55 items that became available at that time. The June 2020 indices for these items were imputed in line with such that they had no impact on the all items index. The published methodologycollected prices in July 2020 had an upward effect on the index between June and July 2020, and consequently a downward effect on the change in the 12-month rate between June and July 2021.
There were downward contributions to the change in the CPIH 12-month inflation rate from 9 of the 12 divisions, partially offset by an upward contribution from transport.
Recreation and culture
The largest downward contribution (of 0.19 percentage points) to the change in the CPIH 12-month inflation rate came from recreation and culture, particularly data processing equipment; recording media; games, toys and hobbies; and package holidays.
With data processing equipment, the effect came from computer peripherals (such as routers and web cams) and software. The effects from recording media and games, toys and hobbies came from CDs and computer games respectively. Prices for these products could have been influenced by the coronavirus restrictions changing the timing of demand, though it is equally likely to be the result of the CDs and games in the bestseller charts used when collecting price quotes.
Prices for package holidays are estimated to have fallen slightly this year, compared with a rise, overall, a year ago. The index for package holidays was imputed in June 2020 because the component items were not available during the coronavirus lockdown whereas the July 2020 index was mostly based on collected prices. Both monthly indices were imputed in 2021. As a result, in both 2020 and 2021, the monthly price movements between June and July for package holidays have been estimated because the component items have not been available for both months. This means that the current contribution to change has to be interpreted with a degree of caution. The methodology used to estimate price movements for unavailable items is described in Coronavirus
.and the effects on UK prices
Clothing and footwear
There was also a large downward contribution (of 0.09 percentage points) from clothing and footwear. Prices, overall, fell by 2.0% between June and July this year, compared with a smaller fall of 0.7% between the same two months a year ago. Normally, prices fall between June and July because of the summer sales season – see Figure 3 – but the seasonal patterns have been influenced by the timing of lockdowns since the onset of the coronavirus pandemic. In 2020 in particular, the fall was smaller than normally seen at this time of year.
The amounts of discounting recorded in the clothing and footwear datasets in both June and July 2021 were below the levels usually seen in these months. In comparison, in June and July 2020, the proportions of discounting were relatively high during and just after the first coronavirus lockdown when demand may have been reduced as a result of less browsing in stores, people spending more time at home where they might have been less interested in clothing, and a shift in spending patterns towards other necessities such as food and cleaning products. The downward effect this year came from a broad range of women’s and children’s clothing.
Restaurants and hotels
The downward contribution from restaurants and hotels arises from prices rising in 2021 by less than in 2020 for restaurant and café meals and drinks. A year ago, many of these items became available for consumers to purchase in July after being unavailable in June when the indices were estimated based on the movement in the index for all available CPI items. This means that the monthly movement between June and July 2020, and hence the current contribution to change in the headline rate, has to be interpreted with a degree of caution.

Page 12 of 20
Elsewhere within the restaurants and hotels division, there was a small upward contribution from accommodation services, where prices, overall, rose between June and July this year, compared with a fall a year ago.
Other downward contributors
Smaller downward contributions came from alcoholic beverages and tobacco; furniture, household equipment and maintenance; communication; miscellaneous goods and services; and health. The effects came from a variety of more detailed goods and services within each group, for example, off-sales of spirits, telephone equipment and services, hairdressing, jewellery and childcare services. Prices rose for each of these goods and services between June and July 2020, compared with a mix of price falls and smaller price rises in 2021. Some of the rises in 2020, for example, for hairdressing, may partially relate to covering the costs for personal protective equipment (PPE). These additional costs have been collected in line with international guidance.
Transport
The largest, partially offsetting, upward contribution (of 0.05 percentage points) to the change in the CPIH 12-month rate came from transport, where prices rose by 1.8% between June and July 2021, compared with a smaller rise of 1.3% between the same two months of 2020. The effect was principally from second-hand cars and, to a lesser extent, maintenance and repairs.
Second-hand car prices rose between June and July this year whereas in recent years, they have tended to fall between these months. There are reports of prices rising as a result of increasing demand following the end of the latest national lockdown and some buyers are reported to have turned to the used car market as a result of delays in the supply of new cars caused by the shortage of semiconductor chips used in their production. Additionally, there are reportedly concerns in the trade about the supply of second-hand cars because of fewer trade-ins.
Charges for the maintenance and repair of motor vehicles have risen in 2021, compared with a fall in 2020. The effect came principally from changes in roadside recovery membership fees but also labour costs for car repairs and wheel alignment.
Within transport, there was a partially offsetting downward contribution from motor fuels and lubricants. The price of petrol rose by 2.9 pence per litre between June and July this year, compared with a larger rise of 4.9 pence per litre a year ago when prices were recovering from a four-year low of 106.2 pence per litre in May 2020. Similarly, diesel prices rose by 2.1 pence per litre this year, compared with a rise of 4.0 pence per litre a year ago. The movements reflect changes in oil prices as demand was affected last year by the coronavirus pandemic.
Unavailable items
For items that were unavailable in line with government guidelines in the early part of 2021, there were no January base prices. As these items become available again, base prices have been imputed in line with the procedures described in .Coronavirus (COVID-19) and Consumer Price Inflation weights and prices: 2021
For the first month in which they become available again, item indices are imputed using either the monthly movement in the all-available-items index or, for a smaller number of seasonal items, the annual movement in the all-available-items index. The aim is that the indices for returning items have a negligible impact on the all-items inflation rate in the first month of return, reflecting the fact that these services are available only as price levels and do not have price growth associated with them (relative to the January base). Collected prices then start to influence the index in the following month.

Page 13 of 20
As restrictions have eased from 12 April 2021, the number of items across the CPIH basket of goods and services that are unavailable to consumers has reduced to one in July, accounting for 0.04% of the CPIH basket by weight. The changes to the list from previous months, are shown in Table 58 in the Consumer price inflation
.dataset
The remaining unavailable item is football admission prices. This made a negligible contribution to the change in the CPIH 12-month inflation rate between June and July 2021.
In addition to the one unavailable item and the 13 items returning to the CPIH basket in July, we identified two other items where, although available in theory, price collection had proved largely impossible, so we imputed the price movement. The categories where the number of price quotes used in constructing the indices is less than half the number used in February 2020 have been identified in relevant tables in the , for accompanying datasetexample, in Table 3.
Overall, the number of price quotes that are usually collected in store and that are used in constructing the July 2021 indices was 95.2% of the number of price quotes collected in February 2020 (excluding unavailable items). Once all locally and centrally collected price quotes have been weighted together, the overall coverage for goods and services available in July 2021 was 87.2% of the comparable coverage collected before the March 2020 lockdown (excluding unavailable items).

Page 14 of 20
1.
5 . Owner occupiers’ housing costs
Figure 5: Housing components’ overall contribution to the CPIH 12-month inflation rate little changed at 0.63 percentage points
Contributions of housing components to the CPIH 12-month inflation rate, UK, January 2015 to July 2021
Source: Office for National Statistics – Consumer price inflation
Notes:
Individual contributions may not sum to the total because of rounding.
Figure 5 shows the contribution of owner occupiers’ housing costs (OOH) and Council Tax to the Consumer Prices Index including owner occupiers’ housing costs (CPIH) 12-month inflation rate in the context of wider housing-related costs. In July 2021, the contribution of housing components to the CPIH 12-month inflation rate was 0.63 percentage points, little changed from June 2021.
There have been only relatively small changes to the contributions from individual components between June and July 2021, from housing rents and owner occupiers’ housing costs. This follows larger changes to gas and electricity prices in April when the Office of Gas and Electricity Markets’ (Ofgem’s) price cap, introduced on 1 April 2021, saw prices of these utilities rise by over 9%. The cost of water supply and sewerage collection also rose by 2.5% and 1.0% respectively between March and April 2021. These price rises in total resulted in all groups within the housing and household services division having a positive contribution to the CPIH 12-month inflation rate from April 2021.

Page 15 of 20
6 . Consumer price inflation data
Consumer price inflation tables Dataset | Released 18 August 2021 Measures of monthly UK inflation data including the Consumer Prices Index including owner occupiers’ housing costs (CPIH), Consumer Prices Index (CPI) and Retail Prices Index (RPI). These tables complement the consumer price inflation time series dataset.
Consumer price inflation time series Dataset | Dataset ID: MM23 | Released 18 August 2021 Comprehensive database of time series covering measures of inflation data for the UK including the CPIH, CPI and RPI.
Consumer price inflation detailed briefing note Dataset | Released 18 August 2021 Background briefing to the statistical bulletin.
7 . Glossary
Consumer price inflation
Consumer price inflation is the rate at which the prices of goods and services bought by households rise or fall. It is estimated by using price indices. gives an overview of the indices and Consumer price indices, a brief guidetheir uses.
12-month inflation rate
The most common approach to measuring inflation is the 12-month or annual inflation rate, which compares prices for the latest month with the same month a year ago. In any given month, the 12-month rate is determined by the balance between upward and downward price movements of the range of goods and services included in the index.
Consumer Prices Index including owner occupiers’ housing costs (CPIH)
The Consumer Prices Index including owner occupiers’ housing costs (CPIH) is the most comprehensive measure of inflation. It extends the Consumer Prices Index (CPI) to include a measure of the costs associated with owning, maintaining and living in one’s own home, known as owner occupiers’ housing costs (OOH), along with Council Tax. Both are significant expenses for many households and are not included in the CPI.
Consumer Prices Index (CPI)
The CPI is a measure of consumer price inflation produced to international standards and in line with European regulations. The CPI is the inflation measure used in the government’s target for inflation.
The CPI is produced at the same level of detail as the CPIH in the and .accompanying dataset data time series

Page 16 of 20
Retail Prices Index (RPI)
The Retail Prices Index (RPI) does not meet the required standard for designation as a . In National Statisticrecognition that it continues to be widely used in contracts, we continue to publish the RPI, its subcomponents and RPI excluding mortgage interest payments (RPIX). To view the all-items RPI and 12-month inflation rate, please see the section of the inflation and price indices area of our website.data time series
The UK Statistics Authority and HM Treasury launched a consultation in 2020 on the Authority’s proposal to address the shortcomings of the RPI. From 2030 (at the earliest), as outlined in the , response to the consultationthe CPIH methods and data sources will be introduced into the RPI, and the supplementary and lower-level indices of the RPI will be discontinued.
8 . Measuring the data
Coronavirus
Since the start of the coronavirus (COVID-19) pandemic, there have been challenges around our collection activities, as approximately 80% of the price quotes (45% by weight) for the Consumer Prices Index including owner occupiers’ housing costs (CPIH) basket are usually physically collected in stores across 141 locations in the UK. In April 2021, for example, we were unable to collect prices in store. However, we resumed in-store collections from May 2021 following the approach detailed in Consumer price statistics: resuming a field-based
. For July 2021, our price collectors were able to complete full collections in 79 of the locations price collectionwith partial collections in the other 62, supplementing the latter by continuing to collect prices over the internet, by phone and by email.
The approach for resuming in-store collections was consistent with Eurostat advice, published in their Guidance note on Harmonised Index of Consumer Prices (HICP) issues emerging from the lifting of lockdown measures
.(PDF, 388KB)
Coronavirus and the effects on UK prices describes the approach taken for imputing price movements for items that are unavailable for consumers to purchase.
Coronavirus supplementary analysis
In March 2021, we published Effect of reweighting the consumer prices basket during the coronavirus (COVID-, which contains for both CPIH and the 19) pandemic: October to December 2020 Experimental statistics
Consumer Prices Index (CPI). By linking the price changes between the latest month and the previous one on to the old series – a process called ”chain-linking” – we are able to change our expenditure weights each month to remove any unavailable items and adjust the weight of remaining items according to our best available evidence of consumption patterns.
Methodology information
The consumer price indices are normally based on prices collected from outlets around the country, supplemented by information collected centrally over the internet and by phone. As a result of the coronavirus pandemic, we collected all prices centrally in April 2021, but our price collectors have resumed in-store collections from May 2021.
The figures in this publication use data collected on or around 13 July 2021.
Page 17 of 20
Consumer price indices, a brief guide gives an overview of consumer price statistics, while the Consumer Prices covers the concepts and methodologies underpinning the indices in more detail.Indices Technical Manual
The provides a comprehensive source of information on the CPIH, focusing on the approach CPIH Compendiumto measuring owner occupiers’ housing costs (OOH).
Users and uses of consumer price inflation statistics includes information on the users and uses of these statistics, and the characteristics of the different measures of inflation in relation to potential use.
9 . Strengths and limitations
We have illustrated our future approach to measuring changing prices and costs faced by consumers and using three “use cases”, along with how they relate to the measures currently published and those households
under development. We have also published proposed updates in Measuring changing prices and costs for .consumers and households, proposed updates: March 2020
The three cases refer to the Consumer Prices Index including owner occupiers’ housing costs (CPIH) as our lead measure of inflation based on economic principles, the Household Costs Indices (HCIs) as a set of measures to reflect the change in costs as experienced by households, and the Retail Prices Index (RPI) as a legacy measure that is required to meet existing user needs. describes the Shortcomings of the RPI as a measure of inflationissues with the RPI.

Page 18 of 20
10 . Related links

Page 19 of 20
International comparisons of consumer prices: August 2021 Article| Released 18 August 2021 Additional economic analysis of the latest Consumer Prices Index including owner occupiers’ housing costs (CPIH), Producer Prices Index (PPI), and long-term trends. The August 2021 article compares inflation in the UK with the euro area and United States.
Producer price inflation, UK Bulletin | Released 18 August 2021 Changes in the prices of goods bought and sold by UK manufacturers including price indices of materials and fuels purchased (input prices) and factory gate prices (output prices).
UK House Price Index Bulletin | Released 18 August 2021 Monthly house price inflation in the UK, calculated using data from HM Land Registry, Registers of Scotland, and Land and Property Services Northern Ireland.
Index of Private Housing Rental Prices, UK Bulletin | Released 18 August 2021 An experimental price index tracking the prices paid for renting property from private landlords in the UK. Also includes measures of owner occupiers’ housing costs.
Consumer price inflation item indices and price quotes Dataset | Released 18 August 2021 The individual price quotes (for locally collected items only) and item indices that underpin the consumer price inflation statistics.
Harmonised Index of Consumer Prices Dataset | Released 18 August 2021 The Harmonised Index of Consumer Prices (HICP) provides a comparable measure of inflation for each member state of the EU. The UK Consumer Prices Index (CPI) is produced on a consistent basis to the HICP. Further information is available on the .Eurostat website
Contributions to the 12-month rate of CPIH and CPI by import intensity Dataset | Released 18 August 2021 The CPIH and CPI 12-month rates broken down by the import intensity of household purchases.
Research and developments in the transformation of UK consumer price statistics: April 2021 Article | Released 6 April 2021 The second in a series of biannual articles to update users on our research to modernise the measurement of consumer price inflation in the UK.
Consumer price inflation, updating weights: 2021 Article | Released 15 March 2021 The latest update of the relative weights of items in the consumer price inflation basket to ensure they remain representative of current consumer spending patterns.
Consumer price inflation basket of goods and services: 2021 Article | Released 15 March 2021 The review process for the items making up the inflation basket used to calculate the UK consumer price inflation indices and the changes in the latest year.
Coronavirus (COVID-19) and Consumer Price Inflation weights and prices: 2021 Article | Released 11 February 2021 This article describes our approach to calculating weights and collecting reference prices for 2021 in the context of the coronavirus (COVID-19) pandemic.
Advisory Panels for Consumer Price Statistics Reports, papers and minutes | 2015 to 2021 Reports, papers and minutes of the two independent advisory panels on consumer price statistics: a technical panel to advise the National Statistician on technical aspects of the statistics and a stakeholder panel to provide advice on the uses and applications of price indices.

Page 20 of 20
1 status RPIIN publication CPNE Thu Aug 12 08:59:52 2021
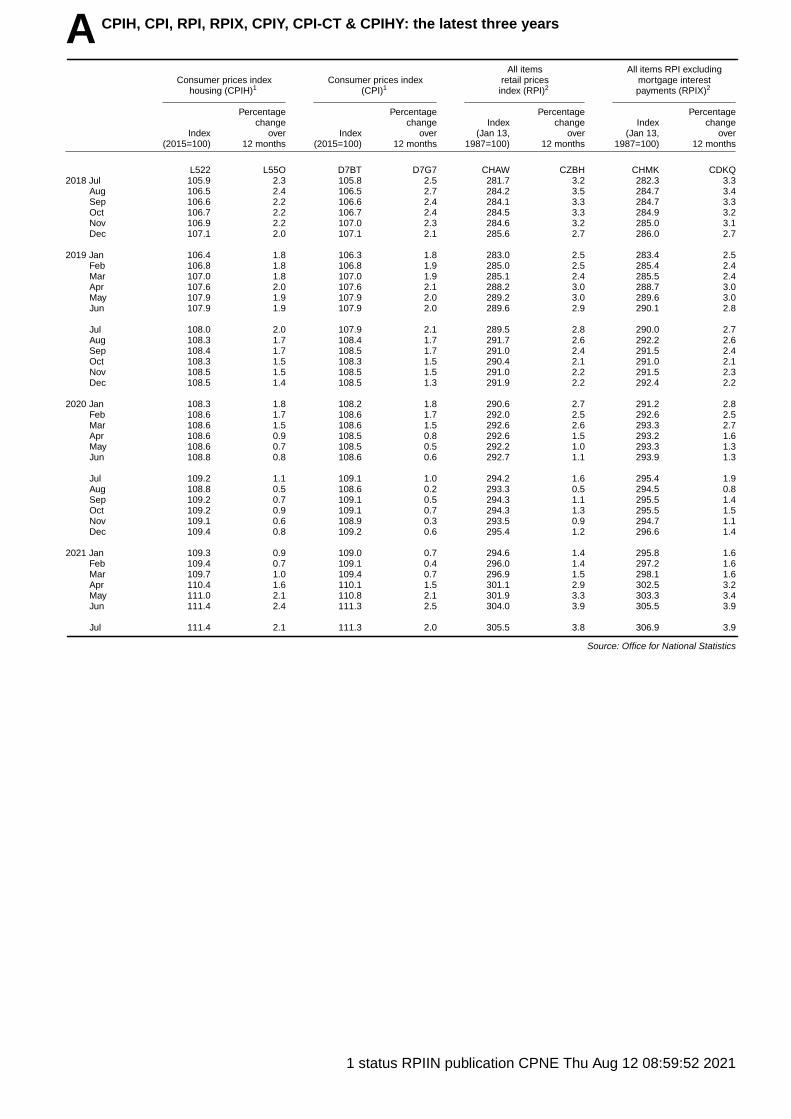
A CPIH, CPI, RPI, RPIX, CPIY, CPI-CT & CPIHY: the latest three years
All items All items RPI excludingConsumer prices index Consumer prices index retail prices mortgage interest
housing (CPIH)1 (CPI)1 index (RPI)2 payments (RPIX)2
Percentage Percentage Percentage Percentagechange change Index change Index change
Index over Index over (Jan 13, over (Jan 13, over(2015=100) 12 months (2015=100) 12 months 1987=100) 12 months 1987=100) 12 months
L522 L55O D7BT D7G7 CHAW CZBH CHMK CDKQ2018 Jul 105.9 2.3 105.8 2.5 281.7 3.2 282.3 3.3
Aug 106.5 2.4 106.5 2.7 284.2 3.5 284.7 3.4Sep 106.6 2.2 106.6 2.4 284.1 3.3 284.7 3.3Oct 106.7 2.2 106.7 2.4 284.5 3.3 284.9 3.2Nov 106.9 2.2 107.0 2.3 284.6 3.2 285.0 3.1Dec 107.1 2.0 107.1 2.1 285.6 2.7 286.0 2.7
2019 Jan 106.4 1.8 106.3 1.8 283.0 2.5 283.4 2.5Feb 106.8 1.8 106.8 1.9 285.0 2.5 285.4 2.4Mar 107.0 1.8 107.0 1.9 285.1 2.4 285.5 2.4Apr 107.6 2.0 107.6 2.1 288.2 3.0 288.7 3.0May 107.9 1.9 107.9 2.0 289.2 3.0 289.6 3.0Jun 107.9 1.9 107.9 2.0 289.6 2.9 290.1 2.8
Jul 108.0 2.0 107.9 2.1 289.5 2.8 290.0 2.7Aug 108.3 1.7 108.4 1.7 291.7 2.6 292.2 2.6Sep 108.4 1.7 108.5 1.7 291.0 2.4 291.5 2.4Oct 108.3 1.5 108.3 1.5 290.4 2.1 291.0 2.1Nov 108.5 1.5 108.5 1.5 291.0 2.2 291.5 2.3Dec 108.5 1.4 108.5 1.3 291.9 2.2 292.4 2.2
2020 Jan 108.3 1.8 108.2 1.8 290.6 2.7 291.2 2.8Feb 108.6 1.7 108.6 1.7 292.0 2.5 292.6 2.5Mar 108.6 1.5 108.6 1.5 292.6 2.6 293.3 2.7Apr 108.6 0.9 108.5 0.8 292.6 1.5 293.2 1.6May 108.6 0.7 108.5 0.5 292.2 1.0 293.3 1.3Jun 108.8 0.8 108.6 0.6 292.7 1.1 293.9 1.3
Jul 109.2 1.1 109.1 1.0 294.2 1.6 295.4 1.9Aug 108.8 0.5 108.6 0.2 293.3 0.5 294.5 0.8Sep 109.2 0.7 109.1 0.5 294.3 1.1 295.5 1.4Oct 109.2 0.9 109.1 0.7 294.3 1.3 295.5 1.5Nov 109.1 0.6 108.9 0.3 293.5 0.9 294.7 1.1Dec 109.4 0.8 109.2 0.6 295.4 1.2 296.6 1.4
2021 Jan 109.3 0.9 109.0 0.7 294.6 1.4 295.8 1.6Feb 109.4 0.7 109.1 0.4 296.0 1.4 297.2 1.6Mar 109.7 1.0 109.4 0.7 296.9 1.5 298.1 1.6Apr 110.4 1.6 110.1 1.5 301.1 2.9 302.5 3.2May 111.0 2.1 110.8 2.1 301.9 3.3 303.3 3.4Jun 111.4 2.4 111.3 2.5 304.0 3.9 305.5 3.9
Jul 111.4 2.1 111.3 2.0 305.5 3.8 306.9 3.9
Source: Office for National Statistics

2 status RPIIN publication CPNE Thu Aug 12 08:59:53 2021
A CPIH, CPI, RPI, RPIX, CPIY, CPI-CT & CPIHY: the latest three years
continued
All items excluding indirect taxes Constant taxes CPIH excluding indirect taxes(CPIY) (CPI-CT)3 (CPIHY)
Percentage Percentage Percentagechange change change
Index over Index over Index over(2015=100) 12 months (2015=100) 12 months (2015=100) 12 months
EL2Q EL2S EAC7 EAD6 L5IU L5IV2018 Jul 105.5 2.5 105.3 2.4 105.5 2.2
Aug 106.3 2.7 106.1 2.6 106.2 2.3Sep 106.3 2.4 106.2 2.3 106.3 2.1Oct 106.4 2.4 106.3 2.3 106.4 2.1Nov 106.6 2.2 106.5 2.1 106.5 2.0Dec 106.8 2.1 106.7 2.0 106.7 1.8
2019 Jan 105.9 1.8 105.8 1.7 106.0 1.6Feb 106.4 1.8 106.3 1.7 106.4 1.6Mar 106.6 1.8 106.5 1.8 106.6 1.7Apr 107.3 2.2 107.1 2.0 107.2 1.9May 107.6 2.0 107.4 1.9 107.4 1.9Jun 107.6 2.0 107.4 1.9 107.5 1.8
Jul 107.7 2.1 107.4 2.0 107.5 1.9Aug 108.1 1.7 107.9 1.6 107.9 1.6Sep 108.2 1.7 108.0 1.6 108.0 1.6Oct 108.0 1.4 107.8 1.4 107.8 1.4Nov 108.2 1.5 108.0 1.4 108.1 1.4Dec 108.2 1.3 108.0 1.3 108.1 1.3
2020 Jan 107.9 1.8 107.7 1.7 107.8 1.7Feb 108.3 1.8 108.1 1.7 108.2 1.7Mar 108.3 1.5 108.1 1.4 108.2 1.5Apr 108.1 0.7 107.8 0.7 108.0 0.8May 108.1 0.4 107.8 0.4 108.0 0.5Jun 108.2 0.5 108.0 0.5 108.2 0.7
Jul 108.7 1.0 108.5 1.0 108.6 1.0Aug 110.1 1.8 109.8 1.8 109.7 1.7Sep 110.5 2.2 110.3 2.2 110.1 2.0Oct 110.5 2.3 110.3 2.4 110.1 2.1Nov 110.3 1.9 110.2 2.0 110.0 1.8Dec 110.6 2.2 110.4 2.2 110.3 2.0
2021 Jan 110.3 2.3 110.2 2.3 110.1 2.1Feb 110.5 2.0 110.3 2.0 110.3 1.9Mar 110.8 2.3 110.6 2.4 110.6 2.2Apr 111.5 3.2 111.3 3.2 111.2 2.9May 112.2 3.8 112.0 3.8 111.7 3.4Jun 112.8 4.2 112.5 4.2 112.2 3.8
Jul 112.8 3.7 112.5 3.8 112.3 3.4
Ke y: - zero or negligible1 From the release of Januar y consumer price inflation data on 16 Febr uary
2016, CPIH and CPI indices have been re-referenced and published with2015=100. Full historic series for each of the re-referenced indices areavailable for users to view or download. Regular re-referencing of indices ismethodological good practice as it avoids rounding issues that can arisefrom small index values. Please note that re-referencing does not impacton published inflation rates, although when using the indices to calculate in-flation rates, it is impor tant to use indices that are referenced on the sameyear. Re-referencing does not impact on RPI. For more infor mation,please contact [email protected].
2 The Retail Prices Index and its derivatives do not meet the required standardsfor designation as National Statistics. A full report can be found athttp://www.statisticsauthor ity.gov.uk/.

3 status RPIIN publication CPNE Thu Aug 12 08:59:53 2021
B CPI: Detailed figures for 13 July 2021 1
Percentage Percentagechange over change over
Index Index(2015 1 12 (2015 1 12=100) mth mths =100) mth mths
CPI (overall index) 111.3 − 2.0
01 Food and non-alcoholic beverages 103.3 −0.3 −0.6 06.2 Out-patient services 117.0 0.4 1.102 Alcoholic beverages and tobacco 119.3 −0.5 1.5 06.2.1/3 Medical services & paramedical services 112.0 0.3 2.003 Clothing and footwear 100.6 −2.0 1.7 06.2.2 Dental services 123.3 0.4 −0.804 Housing, water, electr icity, gas and other fuels 108.1 0.2 1.705 Furniture, household equipment and maintenance 108.0 −0.8 2.9 06.3 Hospital services 129.6 0.9 6.006 Health 114.9 0.3 0.807 Transpor t 121.3 1.8 7.7 07.1 Purchase of vehicles 116.1 2.9 7.808 Communication 116.3 −0.6 1.4 07.1.1A New cars 118.9 0.2 2.509 Recreation and culture 111.4 −0.3 0.7 07.1.1B Second-hand cars 109.0 7.0 14.410 Education 120.0 − 2.1 07.1.2/3 Motorcycles and bicycles 120.9 1.5 11.211 Restaurants and hotels 116.6 0.5 2.212 Miscellaneous goods and services 105.8 −0.2 0.9 07.2 Operation of personal transport equipment 119.8 1.3 9.4
07.2.1 Spare parts and accessories 117.7 1.4 5.9All goods 107.6 −0.3 2.5 07.2.2 Fuels and lubricants 119.1 2.0 17.7All services 115.3 0.3 1.6 07.2.3 Maintenance and repairs 116.0 1.2 4.1
07.2.4 Other services 129.1 0.3 5.101.1 Food 102.9 −0.4 −0.5
01.1.1 Bread and cereals 105.6 −0.1 −0.2 07.3 Transpor t ser vices 129.6 1.4 2.801.1.2 Meat 99.1 −0.2 −1.0 07.3.1 Passenger transpor t by railway 115.7 −1.4 2.901.1.3 Fish 109.0 −2.9 −4.6 07.3.2 Passenger transpor t by road 134.4 0.7 7.301.1.4 Milk, cheese and eggs 100.3 −0.9 −0.3 07.3.3 Passenger transpor t by air 124.3 9.2 2.201.1.5 Oils and fats 118.1 0.9 −2.4 07.3.4 Passenger transpor t by sea and inland waterway 145.5 7.9 2.201.1.6 Fruit 108.1 −0.8 1.201.1.7 Vegetables including potatoes and tubers 101.1 −0.2 −0.8 08.1 Postal services 123.6 − 5.801.1.8 Sugar, jam, syrups, chocolate and confectioner y 102.7 −0.3 −01.1.9 Food products (nec) 102.5 1.5 0.6 08.2/3 Telephone and telefax equipment and services 116.0 −0.7 1.3
01.2 Non-alcoholic beverages 105.9 0.1 −1.7 09.1 Audio-visual equipment and related products 93.3 −2.6 1.501.2.1 Coffee, tea and cocoa 102.9 1.7 −6.4 09.1.1 Reception and reproduction of sound and pictures 89.3 1.2 6.101.2.2 Mineral waters, soft drinks and juices 107.0 −0.6 − 09.1.2 Photographic, cinematographic and optical equipment 81.6 −1.9 −3.6
09.1.3 Data processing equipment 85.7 −3.0 −1.202.1 Alcoholic beverages 102.8 −1.3 −0.2 09.1.4 Recording media 116.4 −6.0 2.6
02.1.1 Spirits 99.9 −2.4 −1.5 09.1.5 Repair of audio-visual equipment & related products 106.5 0.2 0.702.1.2 Wine 103.0 −0.7 2.002.1.3 Beer 106.5 −1.0 −2.3 09.2 Oth. major durables for recreation & culture 118.3 0.2 2.9
09.2.1/2 Major durables for in/outdoor recreation 118.3 0.2 2.902.2 Tobacco 133.7 0.3 3.1
09.3 Other recreational items, gardens and pets 105.5 0.3 0.503.1 Clothing 101.8 −2.2 2.0 09.3.1 Games, toys and hobbies 101.8 −0.1 −2.9
03.1.2 Garments 101.8 −2.3 2.4 09.3.2 Equipment for sport and open-air recreation 108.6 1.3 5.203.1.3 Other clothing and clothing accessories 99.3 −1.9 −2.0 09.3.3 Gardens, plants and flowers 110.0 1.2 6.303.1.4 Cleaning, repair and hire of clothing 115.5 0.5 2.4 09.3.4/5 Pets, related products and services 111.2 0.1 2.6
03.2 Footwear including repairs 94.4 −1.0 −0.3 09.4 Recreational and cultural services 117.8 0.8 1.309.4.1 Recreational and sporting services 121.7 0.6 2.7
04.1 Actual rentals for housing 107.2 0.2 1.4 09.4.2 Cultural services 116.3 0.9 0.7
04.3 Regular maintenance and repair of the dwelling 105.4 0.7 3.1 09.5 Books, newspapers and stationery 123.5 − 3.704.3.1 Materials for maintenance and repair 109.9 1.7 8.4 09.5.1 Books 117.4 0.1 4.604.3.2 Services for maintenance and repair 104.6 0.2 0.5 09.5.2 Newspapers and periodicals 138.8 − 6.4
09.5.3/4 Misc. printed matter, stationer y, drawing materials 116.0 − 1.304.4 Water supply and misc. services for the dwelling 107.2 − 1.7
04.4.1 Water supply 107.8 − 2.5 09.6 Package holidays 117.4 −0.3 −04.4.3 Sewerage collection 106.9 − 1.0
10.0 Education 120.0 − 2.104.5 Electricity, gas and other fuels 110.5 0.1 2.6
04.5.1 Electricity 132.5 0.1 5.8 11.1 Catering services 116.4 0.4 1.404.5.2 Gas 84.9 − −4.0 11.1.1 Restaurants & cafes 117.0 0.4 1.804.5.3 Liquid fuels 120.2 0.5 37.4 11.1.2 Canteens 108.7 −0.5 −3.004.5.4 Solid fuels 115.1 − 2.9
11.2 Accommodation services 118.5 1.0 5.705.1 Furniture, furnishings and carpets 114.3 −1.3 7.0
05.1.1 Furniture and furnishings 113.5 −1.7 6.7 12.1 Personal care 104.7 − 1.405.1.2 Carpets and other floor coverings 117.8 0.2 8.0 12.1.1 Hairdressing and personal grooming establishments 119.5 0.2 4.0
12.1.2/3 Appliances and products for personal care 100.1 − 0.605.2 Household textiles 100.8 −1.5 0.5
12.3 Personal effects (nec) 104.0 −1.1 1.205.3 Household appliances, fitting and repairs 113.1 0.2 4.9 12.3.1 Jeweller y, clocks and watches 108.9 −1.5 0.2
05.3.1/2 Major appliances and small electric goods 113.5 0.1 5.1 12.3.2 Other personal effects 97.6 −0.4 2.305.3.3 Repair of household appliances 110.4 0.6 3.0
12.4 Social protection 121.9 0.2 3.105.4 Glassware , tableware and household utensils 98.1 −0.5 −1.8
12.5 Insurance 115.3 0.2 −3.405.5 Tools and equipment for house and garden 103.6 − −0.7 12.5.2 House contents insurance 102.9 0.5 −5.1
12.5.3 Health insurance 135.2 0.7 4.805.6 Goods and services for routine maintenance 105.8 −0.5 0.2 12.5.4 Transpor t insurance 110.0 −0.3 −7.6
05.6.1 Non-durable household goods 90.8 −1.2 −2.305.6.2 Domestic services and household services 115.3 − 1.2 12.6 Financial services (nec) 86.9 −0.7 −0.9
12.6.2 Other financial services (nec) 86.9 −0.7 −0.906.1 Medical products, appliances and equipment 108.3 0.2 −0.4
06.1.1 Pharmaceutical products 112.7 0.1 −0.8 12.7 Other services (nec) 101.2 −0.3 0.106.1.2/3 Other medical and therapeutic equipment 101.7 0.2 0.7
1 As a direct result of the reduced availability of products due to the coron-avir us (COVID-19) pandemic, some series are based on less than half ofthe number of quotes used in Febr uary 2020 (the most recent ’normal’ col-lection). To identify which series are affected please consult
the latest Consumer price inflation tables found here:https://www.ons.gov.uk/economy/inflationandpr iceindices/datasets/consumerpr iceinflation , which includes notation to reflect the reduced coverage
Source: Office for National Statistics

4 status RPIIN publication CPNE Thu Aug 12 08:59:55 2021
B1 CPIH: Detailed figures for 13 July 2021 1
Percentage Percentagechange over change over
Index Index(2015 1 12 (2015 1 12=100) mth mths =100) mth mths
CPIH (overall index) 111.4 − 2.1 06.1.1 Phar maceutical products 112.7 0.1 −0.806.1.2/3 Other medical and therapeutic equipment 101.7 0.2 0.7
01 Food and non-alcoholic beverages 103.4 −0.3 −0.602 Alcoholic beverages and tobacco 119.3 −0.5 1.603 Clothing and footwear 100.8 −2.0 1.6 06.2 Out-patient services 116.5 0.4 1.304 Housing, water, electr icity, gas and other fuels (including OOH)110.7 0.1 1.9 06.2.1/3 Medical services & paramedical services 112.0 0.3 2.005 Furniture, household equipment and maintenance 108.1 −0.8 3.0 06.2.2 Dental services 123.3 0.4 −0.806 Health 115.0 0.3 0.907 Transpor t 121.2 1.8 7.9 06.3 Hospital services 129.6 0.9 6.008 Communication 116.5 −0.6 1.509 Recreation and culture 111.4 −0.4 0.6 07.1 Purchase of vehicles 115.9 2.8 7.610 Education 120.0 − 2.1 07.1.1A New cars 118.9 0.2 2.511 Restaurants and hotels 116.6 0.5 2.2 07.1.1B Second-hand cars 109.0 7.0 14.412 Miscellaneous goods and services 106.0 −0.2 1.0 07.1.2/3 Motorcycles and bicycles 120.9 1.5 11.2
All goods 107.7 −0.3 2.5 07.2 Operation of personal transport equipment 119.5 1.3 9.3All services 114.2 0.2 1.8 07.2.1 Spare parts and accessories 117.7 1.4 5.9
07.2.2 Fuels and lubricants 119.1 2.0 17.701.1 Food 103.1 −0.4 −0.5 07.2.3 Maintenance and repairs 116.0 1.2 4.1
01.1.1 Bread and cereals 105.6 −0.1 −0.2 07.2.4 Other services 129.1 0.3 5.101.1.2 Meat 99.1 −0.2 −1.001.1.3 Fish 109.0 −2.9 −4.6 07.3 Transpor t ser vices 130.4 1.9 4.201.1.4 Milk, cheese and eggs 100.3 −0.9 −0.3 07.3.1 Passenger transpor t by railway 115.7 −1.4 2.901.1.5 Oils and fats 118.1 0.9 −2.4 07.3.2 Passenger transpor t by road 134.4 0.7 7.301.1.6 Fruit 108.1 −0.8 1.2 07.3.3 Passenger transpor t by air 124.3 9.2 2.201.1.7 Vegetables including potatoes and tubers 101.1 −0.2 −0.8 07.3.4 Passenger transpor t by sea and inland waterway 145.5 7.9 2.201.1.8 Sugar, jam, syrups, chocolate and confectioner y 102.7 −0.3 −01.1.9 Food products (nec) 102.5 1.5 0.6 08.1 Postal services 123.6 − 5.8
01.2 Non-alcoholic beverages 105.8 0.1 −1.6 08.2/3 Telephone and telefax equipment and services 116.0 −0.7 1.301.2.1 Coffee, tea and cocoa 102.9 1.7 −6.401.2.2 Mineral waters, soft drinks and juices 107.0 −0.6 − 09.1 Audio-visual equipment and related products 93.5 −2.8 1.7
09.1.1 Reception and reproduction of sound and pictures 89.3 1.2 6.102.1 Alcoholic beverages 102.8 −1.2 −0.2 09.1.2 Photographic, cinematographic and optical equipment 81.6 −1.9 −3.6
02.1.1 Spirits 99.9 −2.4 −1.5 09.1.3 Data processing equipment 85.7 −3.0 −1.202.1.2 Wine 103.0 −0.7 2.0 09.1.4 Recording media 116.4 −6.0 2.602.1.3 Beer 106.5 −1.0 −2.3 09.1.5 Repair of audio-visual equipment & related products 106.5 0.2 0.7
02.2 Tobacco 133.7 0.3 3.1 09.2 Oth. major durables for recreation & culture 118.3 0.2 2.909.2.1/2 Major durables for in/outdoor recreation 118.3 0.2 2.9
03.1 Clothing 102.0 −2.2 2.003.1.2 Garments 101.8 −2.3 2.4 09.3 Other recreational items, gardens and pets 105.5 0.3 0.503.1.3 Other clothing and clothing accessories 99.3 −1.9 −2.0 09.3.1 Games, toys and hobbies 101.8 −0.1 −2.903.1.4 Cleaning, repair and hire of clothing 115.5 0.5 2.4 09.3.2 Equipment for sport and open-air recreation 108.6 1.3 5.2
09.3.3 Gardens, plants and flowers 110.0 1.2 6.303.2 Footwear including repairs 94.4 −1.0 −0.3 09.3.4/5 Pets, related products and services 111.2 0.1 2.6
04.1 Actual rentals for housing 107.2 0.2 1.4 09.4 Recreational and cultural services 117.8 0.8 1.309.4.1 Recreational and sporting services 121.7 0.6 2.7
04.2 Owner occupiers’ housing costs 109.8 0.1 1.6 09.4.2 Cultural services 116.3 0.9 0.7
04.3 Regular maintenance and repair of the dwelling 107.3 1.0 4.4 09.5 Books, newspapers and stationery 122.8 − 3.204.3.1 Materials for maintenance and repair 109.9 1.7 8.4 09.5.1 Books 117.4 0.1 4.604.3.2 Services for maintenance and repair 104.6 0.2 0.5 09.5.2 Newspapers and periodicals 138.8 − 6.4
09.5.3/4 Misc. printed matter, stationer y, drawing materials 116.0 − 1.304.4 Water supply and misc. services for the dwelling 107.2 − 1.7
04.4.1 Water supply 107.8 − 2.5 09.6 Package holidays 117.4 −0.3 −04.4.3 Sewerage collection 106.9 − 1.0
10.0 Education 120.0 − 2.104.5 Electricity, gas and other fuels 110.9 0.1 3.0
04.5.1 Electricity 132.5 0.1 5.8 11.1 Catering services 116.3 0.4 1.404.5.2 Gas 84.9 − −4.0 11.1.1 Restaurants & cafes 117.0 0.4 1.804.5.3 Liquid fuels 120.2 0.5 37.4 11.1.2 Canteens 108.7 −0.5 −3.004.5.4 Solid fuels 115.1 − 2.9
11.2 Accommodation services 118.5 1.0 5.704.9 Council tax and rates 127.0 − 4.0
12.1 Personal care 104.6 − 1.405.1 Furniture, furnishings and carpets 114.0 −1.4 6.9 12.1.1 Hairdressing and personal grooming establishments 119.5 0.2 4.0
05.1.1 Furniture and furnishings 113.5 −1.7 6.7 12.1.2/3 Appliances and products for personal care 100.1 − 0.605.1.2 Carpets and other floor coverings 117.8 0.2 8.0
12.3 Personal effects (nec) 104.3 −1.1 1.005.2 Household textiles 100.8 −1.5 0.5 12.3.1 Jeweller y, clocks and watches 108.9 −1.5 0.2
12.3.2 Other personal effects 97.6 −0.4 2.305.3 Household appliances, fitting and repairs 113.0 0.2 4.9
05.3.1/2 Major appliances and small electric goods 113.5 0.1 5.1 12.4 Social protection 121.9 0.2 3.105.3.3 Repair of household appliances 110.4 0.6 3.0
12.5 Insurance 118.3 0.3 −2.205.4 Glassware , tableware and household utensils 98.1 −0.5 −1.8 12.5.2 House contents insurance 102.9 0.5 −5.1
12.5.3 Health insurance 135.2 0.7 4.805.5 Tools and equipment for house and garden 103.6 − −0.7 12.5.4 Tr anspor t insurance 110.0 −0.3 −7.6
05.6 Goods and services for routine maintenance 105.6 −0.5 − 12.6 Financial services (nec) 86.9 −0.7 −0.905.6.1 Non-durable household goods 90.8 −1.2 −2.3 12.6.2 Other financial services (nec) 86.9 −0.7 −0.905.6.2 Domestic services and household services 115.3 − 1.2
12.7 Other services (nec) 101.2 −0.3 0.106.1 Medical products, appliances and equipment 108.3 0.2 −0.4
1 As a direct result of the reduced availability of products due to the coron-avir us (COVID-19) pandemic, some series are based on less than half ofthe number of price quotes used in Febr uary 2020
(the most recent ’normal’ collection).To identify which series are affected,con-sult the latest Consumer price inflation tables found here:https://www.ons.gov.uk/economy/inflationandpr iceindices/datasets/ consumer-pr iceinflation, which includes notation to reflect the reduced coverage
Source: Office for National Statistics

5 status RPIIN publication CPNE Thu Aug 12 08:59:57 2021
C CPI: Detailed figures by divisions, groups and classes 1
Percentage change Percentage changeWeights Index (2015=100) over 1 month over 12 months
2021 2020 2021 2020 2021 2020 2020 2021 2021 20212021 2021 2021 2021Jul Jul Jul Jul Nov Dec Jan Feb Mar Apr May Jun Jul
CPI (Overall Index) 1 000 109.1 111.3 0.4 − 0.3 0.6 0.7 0.4 0.7 1.5 2.1 2.5 2.0
01 Food and non-alcoholic beverages 114 103.9 103.3 −0.3 −0.3 −0.6 −1.4 −0.7 −0.6 −1.4 −0.4 −1.3 −0.6 −0.602 Alcoholic beverages and tobacco 45 117.5 119.3 0.4 −0.5 2.0 3.6 3.2 2.8 2.3 2.2 1.7 2.4 1.503 Clothing and footwear 74 99.0 100.6 −0.8 −2.0 −3.6 −1.8 −3.4 −5.7 −3.9 0.1 2.1 3.0 1.704 Housing, water, electr icity, gas and other fuels 141 106.2 108.1 0.3 0.2 −1.4 −1.3 −1.2 −1.1 −0.9 1.7 1.8 1.8 1.705 Furniture, household equipment and maintenance 62 104.9 108.0 −0.4 −0.8 −0.3 −0.7 1.0 0.8 1.5 2.7 2.8 3.3 2.906 Health 25 114.0 114.9 1.1 0.3 1.7 1.1 1.1 0.3 0.2 1.5 2.7 1.6 0.807 Transpor t 136 112.6 121.3 1.3 1.8 1.0 1.9 2.1 2.4 3.7 4.8 6.3 7.2 7.708 Communication 25 114.7 116.3 0.4 −0.6 3.5 2.6 2.2 1.9 1.6 2.8 2.2 2.4 1.409 Recreation and culture 146 110.6 111.4 1.1 −0.3 1.9 2.6 2.6 2.2 2.3 0.7 2.0 2.1 0.710 Education 37 117.5 120.0 − − 2.1 2.1 2.1 2.1 2.1 2.1 2.1 2.1 2.111 Restaurants and hotels 87 114.2 116.6 0.8 0.5 0.4 0.1 1.1 0.9 1.0 1.0 1.8 2.5 2.212 Miscellaneous goods and services 108 104.9 105.8 −0.1 −0.2 0.4 0.5 0.3 − 0.1 0.5 0.9 1.1 0.9
All goods 566 105.0 107.6 0.1 −0.3 −0.8 −0.3 −0.2 −0.5 − 1.5 2.3 2.8 2.5All services 434 113.5 115.3 0.8 0.3 1.4 1.5 1.7 1.5 1.5 1.6 1.9 2.1 1.6All items CPI excluding Energy, food, alcoholic beverages 781 109.7 111.7 0.4 − 1.1 1.4 1.4 0.9 1.1 1.3 2.0 2.3 1.8and tobacco
01.1 Food 101 103.4 102.9 −0.3 −0.4 −0.6 −1.6 −0.8 −0.5 −1.4 −0.5 −1.2 −0.4 −0.501.1.1 Bread and cereals 19 105.8 105.6 1.3 −0.1 1.3 0.7 1.3 2.5 −2.0 1.0 −1.6 1.3 −0.201.1.2 Meat 21 100.1 99.1 −0.8 −0.2 0.2 −1.4 −1.0 −1.6 −1.2 −1.8 −2.7 −1.6 −1.001.1.3 Fish 4 114.2 109.0 −1.6 −2.9 −0.5 −3.2 −1.1 −1.3 −1.7 −6.2 −4.7 −3.3 −4.601.1.4 Milk, cheese and eggs 11 100.6 100.3 −0.8 −0.9 −1.0 −1.6 −1.6 −0.5 −2.2 0.6 1.1 −0.2 −0.301.1.5 Oils and fats 2 121.1 118.1 4.4 0.9 −3.8 −6.1 2.8 5.0 −2.3 −4.4 −4.1 0.9 −2.401.1.6 Fruit 12 106.8 108.1 −2.0 −0.8 − −0.5 −1.4 −1.5 1.5 1.0 1.4 −0.1 1.201.1.7 Vegetables including potatoes and tubers 15 101.9 101.1 −0.5 −0.2 −1.7 −4.1 −2.4 −1.1 −0.5 −0.7 −1.9 −1.1 −0.801.1.8 Sugar, jam, syrups, chocolate and confectioner y 14 102.7 102.7 0.2 −0.3 −2.1 −1.3 −0.9 −1.9 −3.4 − − 0.5 −01.1.9 Food products (nec) 3 101.9 102.5 −0.7 1.5 1.0 −1.2 −1.6 0.3 −2.0 −1.3 −2.0 −1.7 0.6
01.2 Non-alcoholic beverages 13 107.8 105.9 −0.1 0.1 −0.6 −0.1 0.3 −1.8 −1.2 − −1.7 −2.0 −1.701.2.1 Coffee, tea and cocoa 4 109.9 102.9 4.2 1.7 −5.2 −1.6 −5.3 −4.0 −4.1 −2.9 −5.3 −4.1 −6.401.2.2 Mineral waters, soft drinks and juices 9 107.0 107.0 −1.7 −0.6 1.0 0.4 2.6 −0.7 −0.1 1.1 −0.4 −1.1 −
02.1 Alcoholic beverages 23 103.1 102.8 0.3 −1.3 0.2 1.2 0.3 −0.2 0.8 0.8 0.2 1.4 −0.202.1.1 Spirits 7 101.4 99.9 0.6 −2.4 1.4 3.6 1.4 0.5 1.2 0.4 −0.6 1.5 −1.502.1.2 Wine 10 101.0 103.0 −0.4 −0.7 0.9 − 0.5 −0.2 1.2 1.7 1.3 2.3 2.002.1.3 Beer 6 109.0 106.5 1.2 −1.0 −2.4 1.1 −1.3 −0.8 −0.2 − −0.4 −0.2 −2.3
02.2 Tobacco 22 129.7 133.7 0.5 0.3 3.6 5.8 5.9 5.7 3.6 3.3 2.9 3.3 3.1
03.1 Clothing 62 99.8 101.8 −1.0 −2.2 −3.7 −1.8 −3.1 −5.4 −3.5 0.5 2.6 3.3 2.003.1.2 Garments 55 99.4 101.8 −1.0 −2.3 −4.2 −2.3 −3.6 −6.4 −4.3 0.7 3.0 3.8 2.403.1.3 Other clothing and clothing accessories 6 101.2 99.3 −1.0 −1.9 1.3 3.2 1.7 4.7 4.5 −2.3 −2.4 −1.0 −2.003.1.4 Cleaning, repair and hire of clothing 1 112.8 115.5 0.8 0.5 2.1 2.1 1.4 1.2 1.3 1.2 3.4 2.7 2.4
03.2 Footwear including repairs 12 94.7 94.4 0.4 −1.0 −3.1 −2.0 −4.9 −7.3 −6.2 −2.2 −0.3 1.2 −0.3
04.1 Actual rentals for housing 94 105.8 107.2 0.4 0.2 1.7 1.7 1.8 1.8 1.8 1.5 1.5 1.6 1.4
04.3 Regular maintenance and repair of the dwelling 3 102.2 105.4 −0.2 0.7 0.5 0.9 0.7 0.7 0.6 1.3 1.0 2.1 3.104.3.1 Materials for maintenance and repair 1 101.4 109.9 −0.6 1.7 1.0 1.9 1.4 1.8 1.6 2.8 2.6 5.9 8.404.3.2 Services for maintenance and repair 2 104.1 104.6 − 0.2 0.3 0.4 0.3 0.2 0.1 0.5 0.2 0.3 0.5
04.4 Water supply and misc. services for the dwelling 11 105.4 107.2 − − −3.3 −3.3 −3.3 −3.3 −3.3 1.7 1.7 1.7 1.704.4.1 Water supply 5 105.1 107.8 − − −1.7 −1.7 −1.7 −1.7 −1.7 2.5 2.5 2.5 2.504.4.3 Sewerage collection 6 105.8 106.9 − − −4.6 −4.6 −4.6 −4.6 −4.6 1.0 1.0 1.0 1.0
04.5 Electricity, gas and other fuels 33 107.7 110.5 − 0.1 −8.8 −8.5 −8.4 −7.9 −7.3 2.4 2.6 2.5 2.604.5.1 Electricity 19 125.3 132.5 −0.1 0.1 −3.1 −3.1 −3.1 −3.1 −3.1 5.5 5.5 5.5 5.804.5.2 Gas 12 88.4 84.9 − − −15.4 −15.4 −15.4 −15.4 −15.4 −4.1 −4.1 −4.1 −4.004.5.3 Liquid fuels 1 87.4 120.2 0.8 0.5 −38.8 −27.9 −25.0 −9.2 13.6 39.7 56.3 37.9 37.404.5.4 Solid fuels 1 111.8 115.1 0.4 − 3.9 3.0 4.0 2.7 2.8 3.0 2.9 3.3 2.9
05.1 Furniture, furnishings and carpets 21 106.8 114.3 −1.7 −1.3 0.6 1.6 4.4 3.7 4.5 5.8 6.8 6.6 7.005.1.1 Furniture and furnishings 17 106.4 113.5 −1.8 −1.7 1.1 1.3 4.5 3.3 4.1 5.6 6.4 6.5 6.705.1.2 Carpets and other floor coverings 4 109.0 117.8 −0.9 0.2 0.9 2.9 3.0 5.2 5.9 6.5 8.3 6.9 8.0
05.2 Household textiles 8 100.3 100.8 0.8 −1.5 −0.6 −2.3 0.5 −0.7 −0.1 4.4 1.8 2.8 0.5
05.3 Household appliances, fitting and repairs 11 107.8 113.1 0.8 0.2 1.8 0.2 1.9 2.5 3.5 2.5 3.5 5.6 4.905.3.1/2 Major appliances and small electric goods 10 107.9 113.5 0.6 0.1 1.6 −0.2 1.7 2.3 3.4 2.3 3.3 5.7 5.105.3.3 Repair of household appliances 1 107.2 110.4 1.9 0.6 2.9 3.0 4.1 4.2 4.2 4.6 4.5 4.4 3.0
05.4 Glassware , tableware and household utensils 8 99.9 98.1 0.4 −0.5 −2.3 −3.9 −2.8 −3.1 −1.6 0.5 −0.6 −1.0 −1.8
05.5 Tools and equipment for house and garden 5 104.3 103.6 −0.6 − −5.3 −4.7 −4.5 −3.0 −3.1 −2.8 −2.1 −1.3 −0.7
05.6 Goods and services for routine maintenance 9 105.6 105.8 −0.2 −0.5 0.5 0.1 0.1 −0.4 −0.2 0.4 − 0.5 0.205.6.1 Non-durable household goods 4 93.0 90.8 −0.7 −1.2 −1.4 −2.6 −2.7 −3.6 −3.0 −1.9 −3.0 −1.8 −2.305.6.2 Domestic services and household services 5 113.9 115.3 0.1 − 1.4 1.4 1.4 1.0 1.0 1.3 1.3 1.3 1.2
06.1 Medical products, appliances and equipment 17 108.7 108.3 −0.2 0.2 1.2 0.1 −0.2 −1.4 −1.7 −0.6 1.6 −0.7 −0.406.1.1 Pharmaceutical products 10 113.6 112.7 − 0.1 2.3 1.2 0.7 −0.9 −1.1 −0.7 0.5 −0.9 −0.806.1.2/3 Other medical and therapeutic equipment 7 101.0 101.7 −0.5 0.2 −1.2 −1.7 −1.7 −2.2 −2.5 − 4.0 − 0.7
Key:- zero or negligible .. not available (nec) not elsewhere covered

6 status RPIIN publication CPNE Thu Aug 12 08:59:59 2021
C CPI: Detailed figures by divisions, groups and classes 1
continued
Percentage change Percentage changeWeights Index (2015=100) over 1 month over 12 months
2021 2020 2021 2020 2021 20202020 2021 2021 2021 2021 2021 20212021Jul Jul Jul Jul Nov Dec Jan Feb Mar Apr May Jun Jul
06.2 Out-patient services 4 115.6 117.0 3.1 0.4 2.5 2.5 2.6 2.5 2.2 3.6 3.8 3.8 1.106.2.1/3 Medical services & paramedical services 2 109.8 112.0 1.9 0.3 2.5 2.4 2.7 2.7 2.5 3.0 3.3 3.5 2.006.2.2 Dental services 2 124.2 123.3 5.1 0.4 2.6 2.5 2.3 2.1 1.6 3.8 4.0 3.8 −0.8
06.3 Hospital services 4 122.3 129.6 1.8 0.9 1.9 1.9 4.0 4.1 4.1 6.2 6.6 6.9 6.0
07.1 Purchase of vehicles 41 107.7 116.1 − 2.9 5.4 5.5 5.7 4.1 3.3 2.7 2.8 4.7 7.807.1.1A New cars 22 116.0 118.9 0.9 0.2 3.1 3.8 4.1 4.1 4.2 3.7 3.4 3.2 2.507.1.1B Second-hand cars 16 95.3 109.0 −1.2 7.0 8.5 7.7 7.8 3.5 1.2 0.2 0.9 5.6 14.407.1.2/3 Motorcycles and bicycles 3 108.8 120.9 0.6 1.5 5.4 6.2 6.2 6.8 8.7 9.8 9.7 10.2 11.2
07.2 Operation of personal transport equipment 74 109.6 119.8 1.2 1.3 −2.5 −2.1 −2.0 − 2.4 5.9 8.3 9.2 9.407.2.1 Spare parts and accessories 5 111.2 117.7 0.3 1.4 3.4 3.2 3.2 2.7 2.7 2.0 3.6 4.8 5.907.2.2 Fuels and lubricants 27 101.1 119.1 4.2 2.0 −10.0 −8.3 −8.2 −3.5 3.5 13.6 17.9 20.3 17.707.2.3 Maintenance and repairs 28 111.4 116.0 −1.1 1.2 1.7 0.8 1.1 1.4 0.5 −0.2 1.6 1.8 4.107.2.4 Other services 14 122.9 129.1 0.4 0.3 3.7 3.7 3.8 4.0 4.1 4.8 5.2 5.3 5.1
07.3 Transpor t ser vices 21 126.1 129.6 3.3 1.4 3.4 7.2 6.7 5.5 6.7 5.0 5.5 4.8 2.807.3.1 Passenger transpor t by railway 7 112.4 115.7 −1.1 −1.4 2.3 2.4 0.2 0.7 2.9 3.5 2.9 3.2 2.907.3.2 Passenger transpor t by road 11 125.2 134.4 3.3 0.7 8.0 10.6 11.8 10.1 11.4 11.1 10.5 10.0 7.307.3.3 Passenger transpor t by air 2 121.6 124.3 9.4 9.2 0.2 6.4 0.4 0.2 0.5 1.4 2.0 2.4 2.207.3.4 Passenger transpor t by sea and inland waterway 1 142.4 145.5 8.1 7.9 0.2 17.0 0.4 0.2 0.5 1.4 2.0 2.4 2.2
08.1 Postal services 2 116.8 123.6 − − 5.6 5.6 11.5 11.5 11.5 5.8 5.8 5.8 5.8
08.2/3 Telephone and telefax equipment and services 23 114.6 116.0 0.4 −0.7 3.4 2.5 1.7 1.5 1.2 2.8 2.1 2.3 1.3
09.1 Audio-visual equipment and related products 29 91.8 93.3 −0.2 −2.6 2.0 5.8 4.6 4.0 3.9 −0.4 2.5 4.0 1.509.1.1 Reception and reproduction of sound and pictures 7 84.2 89.3 −0.5 1.2 −3.1 −2.0 −0.1 0.9 0.5 1.4 3.6 4.4 6.109.1.2 Photographic, cinematographic and optical equipment 4 84.6 81.6 0.7 −1.9 −2.1 −1.1 1.8 3.8 1.9 2.7 −0.8 −1.0 −3.609.1.3 Data processing equipment 9 86.8 85.7 1.9 −3.0 4.1 11.9 7.1 8.5 5.9 0.2 1.1 3.8 −1.209.1.4 Recording media 8 113.5 116.4 −3.7 −6.0 3.6 5.3 5.1 −0.4 3.4 −5.1 3.4 5.1 2.609.1.5 Repair of audio-visual equipment & related products 1 105.8 106.5 − 0.2 0.5 0.5 0.5 0.6 0.1 0.1 0.1 0.6 0.7
09.2 Oth. major durables for recreation & culture 18 114.9 118.3 0.7 0.2 2.1 2.2 3.3 3.2 3.1 3.5 3.5 3.4 2.909.2.1/2 Major durables for in/outdoor recreation 18 114.9 118.3 0.7 0.2 2.1 2.2 3.3 3.2 3.1 3.5 3.5 3.4 2.9
09.3 Other recreational items, gardens and pets 51 105.0 105.5 0.7 0.3 2.9 3.8 4.8 4.4 4.6 0.4 2.5 1.0 0.509.3.1 Games, toys and hobbies 27 104.8 101.8 2.0 −0.1 5.4 6.3 8.4 7.4 7.7 −0.6 2.7 −0.9 −2.909.3.2 Equipment for sport and open-air recreation 5 103.2 108.6 1.1 1.3 0.6 3.4 1.4 3.6 2.1 3.2 5.8 5.0 5.209.3.3 Gardens, plants and flowers 6 103.5 110.0 −2.2 1.2 −0.5 1.3 1.7 2.8 3.7 3.2 2.3 2.8 6.309.3.4/5 Pets, related products and services 13 108.3 111.2 −0.1 0.1 1.1 0.8 0.9 0.4 0.6 0.3 1.2 2.5 2.6
09.4 Recreational and cultural services 23 116.2 117.8 0.7 0.8 0.6 1.5 1.1 0.3 0.2 1.0 1.1 1.2 1.309.4.1 Recreational and sporting services 8 118.5 121.7 0.5 0.6 1.2 1.9 1.5 1.5 1.6 3.7 2.6 2.6 2.709.4.2 Cultural services 15 115.4 116.3 0.8 0.9 0.4 1.4 0.9 −0.2 −0.4 −0.1 0.4 0.6 0.7
09.5 Books, newspapers and stationery 13 119.1 123.5 1.6 − 0.4 0.3 −0.8 −0.6 −0.3 2.4 2.9 5.4 3.709.5.1 Books 3 112.3 117.4 3.4 0.1 −7.7 −8.2−12.1−11.0−10.0 4.3 6.1 8.0 4.609.5.2 Newspapers and periodicals 4 130.5 138.8 0.8 − 5.8 5.6 6.2 4.9 4.6 6.0 5.8 7.2 6.409.5.3/4 Misc. printed matter, stationer y, drawing materials 6 114.5 116.0 1.3 − 1.1 1.2 0.6 1.5 1.6 −1.1 −0.8 2.6 1.3
09.6 Package holidays 12 117.4 117.4 2.4 −0.3 1.8 1.3 0.7 0.4 0.9 1.8 2.3 2.7 −
10.0 Education 37 117.5 120.0 − − 2.1 2.1 2.1 2.1 2.1 2.1 2.1 2.1 2.1
11.1 Catering services 72 114.7 116.4 1.1 0.4 0.3 1.1 0.8 0.6 0.8 0.6 1.4 2.2 1.411.1.1 Restaurants & cafes 69 115.0 117.0 1.2 0.4 0.8 1.3 1.1 0.9 1.0 0.8 1.7 2.5 1.811.1.2 Canteens 3 112.1 108.7 0.8 −0.5 −5.0 −1.6 −2.0 −2.0 −1.8 −2.6 −2.4 −1.7 −3.0
11.2 Accommodation services 15 112.1 118.5 −0.9 1.0 1.1 −4.7 2.1 1.9 2.1 2.9 3.4 3.8 5.7
12.1 Personal care 31 103.2 104.7 0.1 − 2.2 1.3 1.5 1.4 1.5 1.1 1.2 1.5 1.412.1.1 Hairdressing and personal grooming establishments 6 114.9 119.5 4.0 0.2 5.8 5.7 6.3 6.1 6.2 7.2 7.9 8.0 4.012.1.2/3 Appliances and products for personal care 25 99.5 100.1 −1.3 − 1.0 −0.3 −0.3 −0.4 −0.3 −1.1 −1.2 −0.7 0.6
12.3 Personal effects (nec) 14 102.8 104.0 −0.3 −1.1 −2.5 −0.1 −2.6 −3.1 −1.7 0.2 3.0 1.9 1.212.3.1 Jeweller y, clocks and watches 9 108.7 108.9 1.3 −1.5 0.7 1.3 0.2 −0.2 0.3 1.7 4.6 3.0 0.212.3.2 Other personal effects 5 95.4 97.6 −2.5 −0.4 −6.9 −1.9 −6.8 −7.3 −4.5 −1.9 0.5 0.1 2.3
12.4 Social protection 24 118.3 121.9 1.1 0.2 2.4 2.5 2.7 2.7 2.8 3.8 3.5 4.0 3.1
12.5 Insurance 7 119.3 115.3 −1.2 0.2 −2.5 −3.5 −4.1 −5.5 −6.5 −6.2 −5.4 −4.8 −3.412.5.2 House contents insurance 2 108.4 102.9 − 0.5 −1.6 −4.0 −3.1 −3.0 −3.0 −5.0 −5.0 −5.6 −5.112.5.3 Health insurance 2 129.0 135.2 0.3 0.7 3.0 3.0 4.0 4.0 4.0 4.4 4.4 4.4 4.812.5.4 Transpor t insurance 3 119.0 110.0 −3.0 −0.3 −6.7 −7.4−10.0−13.1−15.2−13.7−11.9−10.1 −7.6
12.6 Financial services (nec) 10 87.7 86.9 −1.4 −0.7 −5.1 −4.9 −3.8 −4.9 −5.0 −2.7 −2.1 −1.6 −0.912.6.2 Other financial services (nec) 10 87.7 86.9 −1.4 −0.7 −5.1 −4.9 −3.8 −4.9 −5.0 −2.7 −2.1 −1.6 −0.9
12.7 Other services (nec) 22 101.1 101.2 −0.2 −0.3 1.9 2.1 1.8 1.8 1.6 0.1 0.2 0.1 0.1
1 As a direct result of the reduced availibilty of products due to the coron-avir us (COVID-19) pandemic, some series are based on less than half ofthe number of quotes used in Febr uary 2020 (the most recent ’normal’ col-lection). To identify which series are affected please consult
the lastest Consumer price inflation tables which can be located here:https://www.ons.gov.uk/economy/inflationandpr iceindices/datasets/consumerpr iceinflation, which includes notation to reflect the reduced coverage.
Source: Office for National Statistics

7 status RPIIN publication CPNE Thu Aug 12 09:00:02 2021
C1 CPIH: Detailed figures by divisions, groups and classes1
Percentage change Percentage changeWeights Index (2015=100) over 1 month over 12 months
2021 2020 2021 2020 2021 2020 2020 2021 2021 20212021 2021 2021 2021Jul Jul Jul Jul Nov Dec Jan Feb Mar Apr May Jun Jul
CPIH (overall index) 1 000 109.2 111.4 0.4 − 0.6 0.8 0.9 0.7 1.0 1.6 2.1 2.4 2.1
01 Food and non-alcoholic beverages 89 104.1 103.4 −0.3 −0.3 −0.5 −1.4 −0.7 −0.6 −1.4 −0.5 −1.3 −0.6 −0.602 Alcoholic beverages and tobacco 35 117.5 119.3 0.4 −0.5 2.0 3.5 3.2 2.9 2.4 2.2 1.7 2.5 1.603 Clothing and footwear 59 99.2 100.8 −0.7 −2.0 −3.6 −1.7 −3.3 −5.6 −3.8 − 2.1 2.9 1.604 Housing, water, electr icity, gas and other fuels 328 108.6 110.7 0.1 0.1 0.5 0.6 0.6 0.8 0.8 1.8 1.9 1.9 1.905 Furniture, household equipment and maintenance 49 105.0 108.1 −0.4 −0.8 −0.2 −0.6 1.0 0.8 1.5 2.7 2.8 3.3 3.006 Health 20 113.9 115.0 1.0 0.3 1.8 1.1 1.2 0.4 0.3 1.5 2.8 1.6 0.907 Transpor t 107 112.3 121.2 1.3 1.8 1.0 1.9 2.3 2.6 3.9 5.0 6.5 7.3 7.908 Communication 19 114.8 116.5 0.4 −0.6 3.5 2.6 2.3 2.0 1.7 2.9 2.3 2.5 1.509 Recreation and culture 112 110.7 111.4 1.1 −0.4 1.7 2.5 2.5 2.1 2.2 0.7 1.9 2.1 0.610 Education 30 117.5 120.0 − − 2.1 2.1 2.1 2.1 2.1 2.1 2.1 2.1 2.111 Restaurants and hotels 69 114.1 116.6 0.8 0.5 0.4 0.1 1.1 0.9 1.0 1.0 1.8 2.5 2.212 Miscellaneous goods and services 83 105.0 106.0 − −0.2 0.5 0.6 0.4 0.1 0.2 0.6 1.1 1.2 1.0
04.2 Owner occupiers housing costs 185 108.0 109.8 0.1 0.1 1.2 1.3 1.3 1.4 1.3 1.4 1.5 1.6 1.6
All goods 443 105.0 107.7 0.1 −0.3 −0.7 −0.2 −0.2 −0.5 0.1 1.6 2.3 2.9 2.5All services 557 112.2 114.2 0.6 0.2 1.5 1.6 1.7 1.6 1.6 1.7 1.9 2.1 1.8CPIH excluding Energy, food, alcoholic beverages & tobacco 829 109.7 111.8 0.4 − 1.2 1.5 1.5 1.1 1.3 1.5 2.0 2.3 1.9
01.1 Food 79 103.6 103.1 −0.3 −0.4 −0.5 −1.5 −0.8 −0.5 −1.4 −0.5 −1.2 −0.4 −0.501.1.1 Bread and cereals 15 105.8 105.6 1.3 −0.1 1.3 0.7 1.3 2.5 −2.0 1.0 −1.6 1.3 −0.201.1.2 Meat 16 100.1 99.1 −0.8 −0.2 0.2 −1.4 −1.0 −1.6 −1.2 −1.8 −2.7 −1.6 −1.001.1.3 Fish 3 114.2 109.0 −1.6 −2.9 −0.5 −3.2 −1.1 −1.3 −1.7 −6.2 −4.7 −3.3 −4.601.1.4 Milk, cheese and eggs 9 100.6 100.3 −0.8 −0.9 −1.0 −1.6 −1.6 −0.5 −2.2 0.6 1.1 −0.2 −0.301.1.5 Oils and fats 2 121.1 118.1 4.4 0.9 −3.8 −6.1 2.8 5.0 −2.3 −4.4 −4.1 0.9 −2.401.1.6 Fruit 9 106.8 108.1 −2.0 −0.8 − −0.5 −1.4 −1.5 1.5 1.0 1.4 −0.1 1.201.1.7 Vegetables including potatoes and tubers 12 101.9 101.1 −0.5 −0.2 −1.7 −4.1 −2.4 −1.1 −0.5 −0.7 −1.9 −1.1 −0.801.1.8 Sugar, jam, syrups, chocolate and confectioner y 11 102.7 102.7 0.2 −0.3 −2.1 −1.3 −0.9 −1.9 −3.4 − − 0.5 −01.1.9 Food products (nec) 2 101.9 102.5 −0.7 1.5 1.0 −1.2 −1.6 0.3 −2.0 −1.3 −2.0 −1.7 0.6
01.2 Non-alcoholic beverages 10 107.5 105.8 −0.3 0.1 −0.6 −0.1 0.4 −1.8 −1.1 − −1.6 −1.9 −1.601.2.1 Coffee, tea and cocoa 3 109.9 102.9 4.2 1.7 −5.2 −1.6 −5.3 −4.0 −4.1 −2.9 −5.3 −4.1 −6.401.2.2 Mineral waters, soft drinks and juices 7 107.0 107.0 −1.7 −0.6 1.0 0.4 2.6 −0.7 −0.1 1.1 −0.4 −1.1 −
02.1 Alcoholic beverages 18 103.0 102.8 0.3 −1.2 0.2 1.2 0.3 −0.2 0.9 0.8 0.2 1.3 −0.202.1.1 Spirits 5 101.4 99.9 0.6 −2.4 1.4 3.6 1.4 0.5 1.2 0.4 −0.6 1.5 −1.502.1.2 Wine 8 101.0 103.0 −0.4 −0.7 0.9 − 0.5 −0.2 1.2 1.7 1.3 2.3 2.002.1.3 Beer 5 109.0 106.5 1.2 −1.0 −2.4 1.1 −1.3 −0.8 −0.2 − −0.4 −0.2 −2.3
02.2 Tobacco 17 129.7 133.7 0.5 0.3 3.6 5.8 5.9 5.7 3.6 3.3 2.9 3.3 3.1
03.1 Clothing 49 100.0 102.0 −1.0 −2.2 −3.6 −1.7 −3.0 −5.3 −3.3 0.4 2.5 3.3 2.003.1.2 Garments 43 99.4 101.8 −1.0 −2.3 −4.2 −2.3 −3.6 −6.4 −4.3 0.7 3.0 3.8 2.403.1.3 Other clothing and clothing accessories 5 101.2 99.3 −1.0 −1.9 1.3 3.2 1.7 4.7 4.5 −2.3 −2.4 −1.0 −2.003.1.4 Cleaning, repair and hire of clothing 1 112.8 115.5 0.8 0.5 2.1 2.1 1.4 1.2 1.3 1.2 3.4 2.7 2.4
03.2 Footwear including repairs 10 94.7 94.4 0.4 −1.0 −3.1 −2.0 −4.9 −7.3 −6.2 −2.2 −0.3 1.2 −0.3
04.1 Actual rentals for housing 74 105.8 107.2 0.4 0.2 1.7 1.7 1.8 1.8 1.8 1.5 1.5 1.6 1.4
04.2 Owner occupiers housing costs 185 108.0 109.8 0.1 0.1 1.2 1.3 1.3 1.4 1.3 1.4 1.5 1.6 1.6
04.3 Regular maintenance and repair of the dwelling 2 102.7 107.3 −0.3 1.0 0.7 1.1 0.9 1.0 0.8 1.7 1.4 3.1 4.404.3.1 Materials for maintenance and repair 1 101.4 109.9 −0.6 1.7 1.0 1.9 1.4 1.8 1.6 2.8 2.6 5.9 8.404.3.2 Services for maintenance and repair 1 104.1 104.6 − 0.2 0.3 0.4 0.3 0.2 0.1 0.5 0.2 0.3 0.5
04.4 Water supply and misc. services for the dwelling 9 105.4 107.2 − − −3.3 −3.3 −3.3 −3.3 −3.3 1.7 1.7 1.7 1.704.4.1 Water supply 4 105.1 107.8 − − −1.7 −1.7 −1.7 −1.7 −1.7 2.5 2.5 2.5 2.504.4.3 Sewerage collection 5 105.8 106.9 − − −4.6 −4.6 −4.6 −4.6 −4.6 1.0 1.0 1.0 1.0
04.5 Electricity, gas and other fuels 26 107.7 110.9 − 0.1 −8.7 −8.3 −8.2 −7.6 −6.9 2.7 3.0 2.8 3.004.5.1 Electricity 15 125.3 132.5 −0.1 0.1 −3.1 −3.1 −3.1 −3.1 −3.1 5.5 5.5 5.5 5.804.5.2 Gas 9 88.4 84.9 − − −15.4−15.4−15.4−15.4−15.4 −4.1 −4.1 −4.1 −4.004.5.3 Liquid fuels 1 87.4 120.2 0.8 0.5 −38.8−27.9−25.0 −9.2 13.6 39.7 56.3 37.9 37.404.5.4 Solid fuels 1 111.8 115.1 0.4 − 3.9 3.0 4.0 2.7 2.8 3.0 2.9 3.3 2.9
04.9 Council tax and rates 32 122.1 127.0 − − 3.9 3.9 3.9 3.9 3.9 4.0 4.0 4.0 4.0
05.1 Furniture, furnishings and carpets 17 106.6 114.0 −1.7 −1.4 0.7 1.6 4.3 3.7 4.4 5.7 6.8 6.6 6.905.1.1 Furniture and furnishings 14 106.4 113.5 −1.8 −1.7 1.1 1.3 4.5 3.3 4.1 5.6 6.4 6.5 6.705.1.2 Carpets and other floor coverings 3 109.0 117.8 −0.9 0.2 0.9 2.9 3.0 5.2 5.9 6.5 8.3 6.9 8.0
05.2 Household textiles 6 100.3 100.8 0.8 −1.5 −0.6 −2.3 0.5 −0.7 −0.1 4.4 1.8 2.8 0.5
05.3 Household appliances, fitting and repairs 9 107.7 113.0 0.8 0.2 1.8 0.2 2.0 2.6 3.6 2.6 3.5 5.6 4.905.3.1/2 Major appliances and small electric goods 8 107.9 113.5 0.6 0.1 1.6 −0.2 1.7 2.3 3.4 2.3 3.3 5.7 5.105.3.3 Repair of household appliances 1 107.2 110.4 1.9 0.6 2.9 3.0 4.1 4.2 4.2 4.6 4.5 4.4 3.0
05.4 Glassware , tableware and household utensils 6 99.9 98.1 0.4 −0.5 −2.3 −3.9 −2.8 −3.1 −1.6 0.5 −0.6 −1.0 −1.8
05.5 Tools and equipment for house and garden 4 104.3 103.6 −0.6 − −5.3 −4.7 −4.5 −3.0 −3.1 −2.8 −2.1 −1.3 −0.7
05.6 Goods and services for routine maintenance 7 105.7 105.6 −0.2 −0.5 0.4 −0.1 −0.1 −0.6 −0.4 0.2 −0.2 0.3 −05.6.1 Non-durable household goods 3 93.0 90.8 −0.7 −1.2 −1.4 −2.6 −2.7 −3.6 −3.0 −1.9 −3.0 −1.8 −2.305.6.2 Domestic services and household services 4 113.9 115.3 0.1 − 1.4 1.4 1.4 1.0 1.0 1.3 1.3 1.3 1.2
Key:- zero or negligible .. not available (nec) not elsewhere covered

8 status RPIIN publication CPNE Thu Aug 12 09:00:05 2021
C1 CPIH: Detailed figures by divisions, groups and classes1
continued
Percentage change Percentage changeWeights Index (2015=100) over 1 month over 12 months
2021 2020 2021 2020 2021 20202020 2021 2021 2021 2021 2021 20212021Jul Jul Jul Jul Nov Dec Jan Feb Mar Apr May Jun Jul
06.1 Medical products, appliances and equipment 13 108.7 108.3 −0.2 0.2 1.3 0.2 −0.1 −1.4 −1.6 −0.6 1.6 −0.7 −0.406.1.1 Pharmaceutical products 8 113.6 112.7 − 0.1 2.3 1.2 0.7 −0.9 −1.1 −0.7 0.5 −0.9 −0.806.1.2/3 Other medical and therapeutic equipment 5 101.0 101.7 −0.5 0.2 −1.2 −1.7 −1.7 −2.2 −2.5 − 4.0 − 0.7
06.2 Out-patient services 4 115.0 116.5 2.9 0.4 2.5 2.5 2.6 2.6 2.2 3.6 3.9 3.9 1.306.2.1/3 Medical services & paramedical services 2 109.8 112.0 1.9 0.3 2.5 2.4 2.7 2.7 2.5 3.0 3.3 3.5 2.006.2.2 Dental services 2 124.2 123.3 5.1 0.4 2.6 2.5 2.3 2.1 1.6 3.8 4.0 3.8 −0.8
06.3 Hospital services 3 122.3 129.6 1.8 0.9 1.9 1.9 4.0 4.1 4.1 6.2 6.6 6.9 6.0
07.1 Purchase of vehicles 33 107.6 115.9 − 2.8 5.4 5.5 5.7 4.2 3.5 2.9 3.0 4.7 7.607.1.1A New cars 18 116.0 118.9 0.9 0.2 3.1 3.8 4.1 4.1 4.2 3.7 3.4 3.2 2.507.1.1B Second-hand cars 12 95.3 109.0 −1.2 7.0 8.5 7.7 7.8 3.5 1.2 0.2 0.9 5.6 14.407.1.2/3 Motorcycles and bicycles 3 108.8 120.9 0.6 1.5 5.4 6.2 6.2 6.8 8.7 9.8 9.7 10.2 11.2
07.2 Operation of personal transport equipment 58 109.3 119.5 1.2 1.3 −2.5 −2.1 −2.0 − 2.4 5.9 8.3 9.2 9.307.2.1 Spare parts and accessories 4 111.2 117.7 0.3 1.4 3.4 3.2 3.2 2.7 2.7 2.0 3.6 4.8 5.907.2.2 Fuels and lubricants 21 101.1 119.1 4.2 2.0 −10.0 −8.3 −8.2 −3.5 3.5 13.6 17.9 20.3 17.707.2.3 Maintenance and repairs 22 111.4 116.0 −1.1 1.2 1.7 0.8 1.1 1.4 0.5 −0.2 1.6 1.8 4.107.2.4 Other services 11 122.9 129.1 0.4 0.3 3.7 3.7 3.8 4.0 4.1 4.8 5.2 5.3 5.1
07.3 Transpor t ser vices 16 125.2 130.4 3.4 1.9 3.5 7.3 6.8 5.7 7.0 5.9 6.3 5.7 4.207.3.1 Passenger transpor t by railway 5 112.4 115.7 −1.1 −1.4 2.3 2.4 0.2 0.7 2.9 3.5 2.9 3.2 2.907.3.2 Passenger transpor t by road 8 125.2 134.4 3.3 0.7 8.0 10.6 11.8 10.1 11.4 11.1 10.5 10.0 7.307.3.3 Passenger transpor t by air 2 121.6 124.3 9.4 9.2 0.2 6.4 0.4 0.2 0.5 1.4 2.0 2.4 2.207.3.4 Passenger transpor t by sea and inland waterway 1 142.4 145.5 8.1 7.9 0.2 17.0 0.4 0.2 0.5 1.4 2.0 2.4 2.2
08.1 Postal services 1 116.8 123.6 − − 5.6 5.6 11.5 11.5 11.5 5.8 5.8 5.8 5.8
08.2/3 Telephone and telefax equipment and services 18 114.6 116.0 0.4 −0.7 3.4 2.5 1.7 1.5 1.2 2.8 2.1 2.3 1.3
09.1 Audio-visual equipment and related products 23 91.9 93.5 −0.3 −2.8 1.7 5.9 4.8 4.2 4.1 −0.3 2.7 4.3 1.709.1.1 Reception and reproduction of sound and pictures 5 84.2 89.3 −0.5 1.2 −3.1 −2.0 −0.1 0.9 0.5 1.4 3.6 4.4 6.109.1.2 Photographic, cinematographic and optical equipment 3 84.6 81.6 0.7 −1.9 −2.1 −1.1 1.8 3.8 1.9 2.7 −0.8 −1.0 −3.609.1.3 Data processing equipment 7 86.8 85.7 1.9 −3.0 4.1 11.9 7.1 8.5 5.9 0.2 1.1 3.8 −1.209.1.4 Recording media 7 113.5 116.4 −3.7 −6.0 3.6 5.3 5.1 −0.4 3.4 −5.1 3.4 5.1 2.609.1.5 Repair of audio-visual equipment & related products 1 105.8 106.5 − 0.2 0.5 0.5 0.5 0.6 0.1 0.1 0.1 0.6 0.7
09.2 Oth. major durables for recreation & culture 14 114.9 118.3 0.7 0.2 2.1 2.2 3.3 3.2 3.1 3.5 3.5 3.4 2.909.2.1/2 Major durables for in/outdoor recreation 14 114.9 118.3 0.7 0.2 2.1 2.2 3.3 3.2 3.1 3.5 3.5 3.4 2.9
09.3 Other recreational items, gardens and pets 40 104.9 105.5 0.7 0.3 2.8 3.8 4.7 4.3 4.6 0.4 2.4 1.0 0.509.3.1 Games, toys and hobbies 21 104.8 101.8 2.0 −0.1 5.4 6.3 8.4 7.4 7.7 −0.6 2.7 −0.9 −2.909.3.2 Equipment for sport and open-air recreation 4 103.2 108.6 1.1 1.3 0.6 3.4 1.4 3.6 2.1 3.2 5.8 5.0 5.209.3.3 Gardens, plants and flowers 5 103.5 110.0 −2.2 1.2 −0.5 1.3 1.7 2.8 3.7 3.2 2.3 2.8 6.309.3.4/5 Pets, related products and services 10 108.3 111.2 −0.1 0.1 1.1 0.8 0.9 0.4 0.6 0.3 1.2 2.5 2.6
09.4 Recreational and cultural services 17 116.3 117.8 0.7 0.8 0.6 1.5 1.1 0.3 0.2 1.0 1.0 1.2 1.309.4.1 Recreational and sporting services 6 118.5 121.7 0.5 0.6 1.2 1.9 1.5 1.5 1.6 3.7 2.6 2.6 2.709.4.2 Cultural services 11 115.4 116.3 0.8 0.9 0.4 1.4 0.9 −0.2 −0.4 −0.1 0.4 0.6 0.7
09.5 Books, newspapers and stationery 9 119.0 122.8 1.8 − −0.2 −0.5 −1.9 −1.7 −1.6 2.6 3.0 5.0 3.209.5.1 Books 2 112.3 117.4 3.4 0.1 −7.7 −8.2−12.1−11.0−10.0 4.3 6.1 8.0 4.609.5.2 Newspapers and periodicals 3 130.5 138.8 0.8 − 5.8 5.6 6.2 4.9 4.6 6.0 5.8 7.2 6.409.5.3/4 Misc. printed matter, stationer y, drawing materials 4 114.5 116.0 1.3 − 1.1 1.2 0.6 1.5 1.6 −1.1 −0.8 2.6 1.3
09.6 Package holidays 9 117.4 117.4 2.4 −0.3 1.8 1.3 0.7 0.4 0.9 1.8 2.3 2.7 −
10.0 Education 30 117.5 120.0 − − 2.1 2.1 2.1 2.1 2.1 2.1 2.1 2.1 2.1
11.1 Catering services 57 114.7 116.3 1.1 0.4 0.4 1.1 0.9 0.7 0.8 0.6 1.4 2.2 1.411.1.1 Restaurants & cafes 54 115.0 117.0 1.2 0.4 0.8 1.3 1.1 0.9 1.0 0.8 1.7 2.5 1.811.1.2 Canteens 3 112.1 108.7 0.8 −0.5 −5.0 −1.6 −2.0 −2.0 −1.8 −2.6 −2.4 −1.7 −3.0
11.2 Accommodation services 12 112.1 118.5 −0.9 1.0 1.1 −4.7 2.1 1.9 2.1 2.9 3.4 3.8 5.7
12.1 Personal care 23 103.2 104.6 0.1 − 2.2 1.3 1.5 1.4 1.5 1.0 1.1 1.5 1.412.1.1 Hairdressing and personal grooming establishments 4 114.9 119.5 4.0 0.2 5.8 5.7 6.3 6.1 6.2 7.2 7.9 8.0 4.012.1.2/3 Appliances and products for personal care 19 99.5 100.1 −1.3 − 1.0 −0.3 −0.3 −0.4 −0.3 −1.1 −1.2 −0.7 0.6
12.3 Personal effects (nec) 11 103.3 104.3 −0.1 −1.1 −2.0 0.2 −2.4 −2.8 −1.4 0.4 3.1 2.0 1.012.3.1 Jeweller y, clocks and watches 7 108.7 108.9 1.3 −1.5 0.7 1.3 0.2 −0.2 0.3 1.7 4.6 3.0 0.212.3.2 Other personal effects 4 95.4 97.6 −2.5 −0.4 −6.9 −1.9 −6.8 −7.3 −4.5 −1.9 0.5 0.1 2.3
12.4 Social protection 19 118.3 121.9 1.1 0.2 2.4 2.5 2.7 2.7 2.8 3.8 3.5 4.0 3.1
12.5 Insurance 5 121.0 118.3 −1.1 0.3 −1.8 −2.6 −3.1 −4.4 −5.4 −4.9 −4.2 −3.5 −2.212.5.2 House contents insurance 1 108.4 102.9 − 0.5 −1.6 −4.0 −3.1 −3.0 −3.0 −5.0 −5.0 −5.6 −5.112.5.3 Health insurance 2 129.0 135.2 0.3 0.7 3.0 3.0 4.0 4.0 4.0 4.4 4.4 4.4 4.812.5.4 Transpor t insurance 2 119.0 110.0 −3.0 −0.3 −6.7 −7.4−10.0−13.1−15.2−13.7−11.9−10.1 −7.6
12.6 Financial services (nec) 8 87.7 86.9 −1.4 −0.7 −5.1 −4.9 −3.8 −4.9 −5.0 −2.7 −2.1 −1.6 −0.912.6.2 Other financial services (nec) 8 87.7 86.9 −1.4 −0.7 −5.1 −4.9 −3.8 −4.9 −5.0 −2.7 −2.1 −1.6 −0.9
12.7 Other services (nec) 17 101.1 101.2 −0.2 −0.3 1.9 2.1 1.8 1.8 1.6 0.1 0.2 0.1 0.1
1 As a direct result of the reduced availibilty of products due to the coron-avir us (COVID-19) pandemic, some series are based on less than half ofthe number of quotes used in Febr uary 2020 (the most recent ’normal’
collection). To identify which series are affected, please consult the latest Con-sumer price inflation tables which can be located here:https://www.ons.gov.uk/economy/inflationandpr iceindices/datasets/ consumer-pr iceinflation, which includes notation to reflect the reduced coverage.
Source: Office for National Statistics
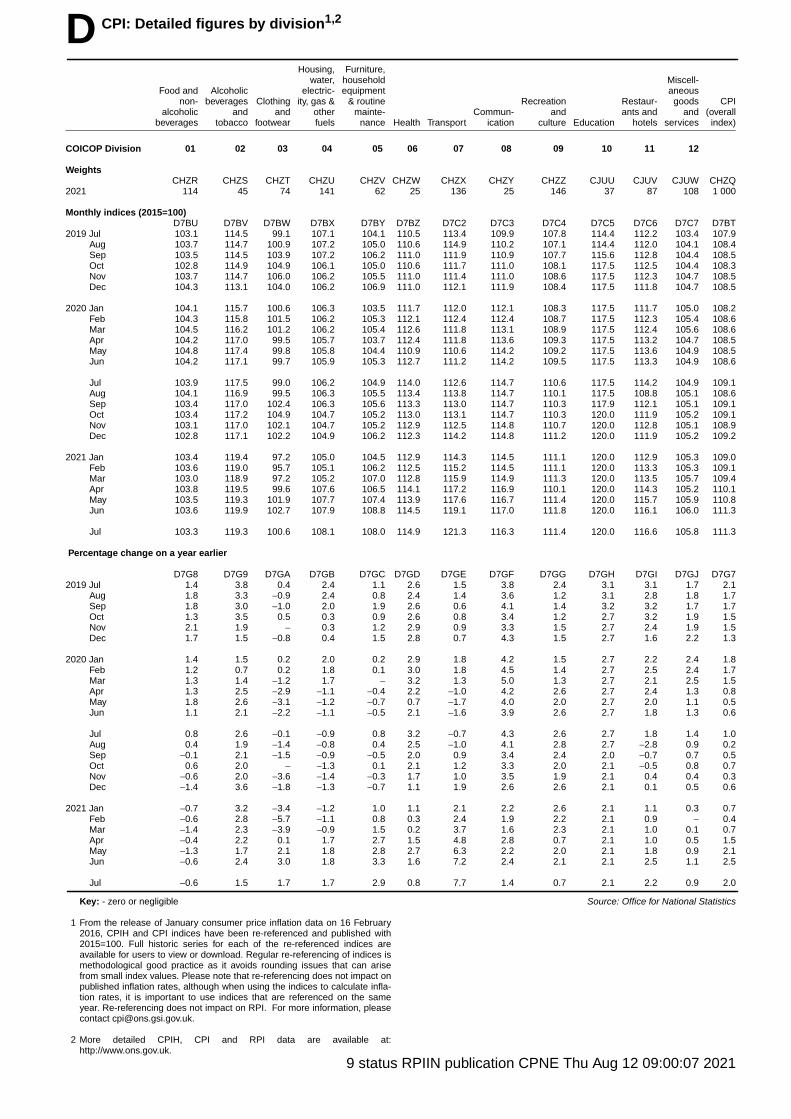
9 status RPIIN publication CPNE Thu Aug 12 09:00:07 2021
D CPI: Detailed figures by division1,2
Housing, Furniture,water, household Miscell-
Food and Alcoholic electric- equipment aneousnon- beverages Clothing ity, gas & & routine Recreation Restaur- goods CPI
alcoholic and and other mainte- Commun- and ants and and (overallbeverages tobacco footwear fuels nance Health Tr anspor t ication culture Education hotels ser vices index)
COICOP Division 01 02 03 04 05 06 07 08 09 10 11 12
WeightsCHZR CHZS CHZT CHZU CHZV CHZW CHZX CHZY CHZZ CJUU CJUV CJUW CHZQ
2021 114 45 74 141 62 25 136 25 146 37 87 108 1 000
Monthly indices (2015=100)D7BU D7BV D7BW D7BX D7BY D7BZ D7C2 D7C3 D7C4 D7C5 D7C6 D7C7 D7BT
2019 Jul 103.1 114.5 99.1 107.1 104.1 110.5 113.4 109.9 107.8 114.4 112.2 103.4 107.9Aug 103.7 114.7 100.9 107.2 105.0 110.6 114.9 110.2 107.1 114.4 112.0 104.1 108.4Sep 103.5 114.5 103.9 107.2 106.2 111.0 111.9 110.9 107.7 115.6 112.8 104.4 108.5Oct 102.8 114.9 104.9 106.1 105.0 110.6 111.7 111.0 108.1 117.5 112.5 104.4 108.3Nov 103.7 114.7 106.0 106.2 105.5 111.0 111.4 111.0 108.6 117.5 112.3 104.7 108.5Dec 104.3 113.1 104.0 106.2 106.9 111.0 112.1 111.9 108.4 117.5 111.8 104.7 108.5
2020 Jan 104.1 115.7 100.6 106.3 103.5 111.7 112.0 112.1 108.3 117.5 111.7 105.0 108.2Feb 104.3 115.8 101.5 106.2 105.3 112.1 112.4 112.4 108.7 117.5 112.3 105.4 108.6Mar 104.5 116.2 101.2 106.2 105.4 112.6 111.8 113.1 108.9 117.5 112.4 105.6 108.6Apr 104.2 117.0 99.5 105.7 103.7 112.4 111.8 113.6 109.3 117.5 113.2 104.7 108.5May 104.8 117.4 99.8 105.8 104.4 110.9 110.6 114.2 109.2 117.5 113.6 104.9 108.5Jun 104.2 117.1 99.7 105.9 105.3 112.7 111.2 114.2 109.5 117.5 113.3 104.9 108.6
Jul 103.9 117.5 99.0 106.2 104.9 114.0 112.6 114.7 110.6 117.5 114.2 104.9 109.1Aug 104.1 116.9 99.5 106.3 105.5 113.4 113.8 114.7 110.1 117.5 108.8 105.1 108.6Sep 103.4 117.0 102.4 106.3 105.6 113.3 113.0 114.7 110.3 117.9 112.1 105.1 109.1Oct 103.4 117.2 104.9 104.7 105.2 113.0 113.1 114.7 110.3 120.0 111.9 105.2 109.1Nov 103.1 117.0 102.1 104.7 105.2 112.9 112.5 114.8 110.7 120.0 112.8 105.1 108.9Dec 102.8 117.1 102.2 104.9 106.2 112.3 114.2 114.8 111.2 120.0 111.9 105.2 109.2
2021 Jan 103.4 119.4 97.2 105.0 104.5 112.9 114.3 114.5 111.1 120.0 112.9 105.3 109.0Feb 103.6 119.0 95.7 105.1 106.2 112.5 115.2 114.5 111.1 120.0 113.3 105.3 109.1Mar 103.0 118.9 97.2 105.2 107.0 112.8 115.9 114.9 111.3 120.0 113.5 105.7 109.4Apr 103.8 119.5 99.6 107.6 106.5 114.1 117.2 116.9 110.1 120.0 114.3 105.2 110.1May 103.5 119.3 101.9 107.7 107.4 113.9 117.6 116.7 111.4 120.0 115.7 105.9 110.8Jun 103.6 119.9 102.7 107.9 108.8 114.5 119.1 117.0 111.8 120.0 116.1 106.0 111.3
Jul 103.3 119.3 100.6 108.1 108.0 114.9 121.3 116.3 111.4 120.0 116.6 105.8 111.3
Percentage chang e on a year earlier
D7G8 D7G9 D7GA D7GB D7GC D7GD D7GE D7GF D7GG D7GH D7GI D7GJ D7G72019 Jul 1.4 3.8 0.4 2.4 1.1 2.6 1.5 3.8 2.4 3.1 3.1 1.7 2.1
Aug 1.8 3.3 −0.9 2.4 0.8 2.4 1.4 3.6 1.2 3.1 2.8 1.8 1.7Sep 1.8 3.0 −1.0 2.0 1.9 2.6 0.6 4.1 1.4 3.2 3.2 1.7 1.7Oct 1.3 3.5 0.5 0.3 0.9 2.6 0.8 3.4 1.2 2.7 3.2 1.9 1.5Nov 2.1 1.9 − 0.3 1.2 2.9 0.9 3.3 1.5 2.7 2.4 1.9 1.5Dec 1.7 1.5 −0.8 0.4 1.5 2.8 0.7 4.3 1.5 2.7 1.6 2.2 1.3
2020 Jan 1.4 1.5 0.2 2.0 0.2 2.9 1.8 4.2 1.5 2.7 2.2 2.4 1.8Feb 1.2 0.7 0.2 1.8 0.1 3.0 1.8 4.5 1.4 2.7 2.5 2.4 1.7Mar 1.3 1.4 −1.2 1.7 − 3.2 1.3 5.0 1.3 2.7 2.1 2.5 1.5Apr 1.3 2.5 −2.9 −1.1 −0.4 2.2 −1.0 4.2 2.6 2.7 2.4 1.3 0.8May 1.8 2.6 −3.1 −1.2 −0.7 0.7 −1.7 4.0 2.0 2.7 2.0 1.1 0.5Jun 1.1 2.1 −2.2 −1.1 −0.5 2.1 −1.6 3.9 2.6 2.7 1.8 1.3 0.6
Jul 0.8 2.6 −0.1 −0.9 0.8 3.2 −0.7 4.3 2.6 2.7 1.8 1.4 1.0Aug 0.4 1.9 −1.4 −0.8 0.4 2.5 −1.0 4.1 2.8 2.7 −2.8 0.9 0.2Sep −0.1 2.1 −1.5 −0.9 −0.5 2.0 0.9 3.4 2.4 2.0 −0.7 0.7 0.5Oct 0.6 2.0 − −1.3 0.1 2.1 1.2 3.3 2.0 2.1 −0.5 0.8 0.7Nov −0.6 2.0 −3.6 −1.4 −0.3 1.7 1.0 3.5 1.9 2.1 0.4 0.4 0.3Dec −1.4 3.6 −1.8 −1.3 −0.7 1.1 1.9 2.6 2.6 2.1 0.1 0.5 0.6
2021 Jan −0.7 3.2 −3.4 −1.2 1.0 1.1 2.1 2.2 2.6 2.1 1.1 0.3 0.7Feb −0.6 2.8 −5.7 −1.1 0.8 0.3 2.4 1.9 2.2 2.1 0.9 − 0.4Mar −1.4 2.3 −3.9 −0.9 1.5 0.2 3.7 1.6 2.3 2.1 1.0 0.1 0.7Apr −0.4 2.2 0.1 1.7 2.7 1.5 4.8 2.8 0.7 2.1 1.0 0.5 1.5May −1.3 1.7 2.1 1.8 2.8 2.7 6.3 2.2 2.0 2.1 1.8 0.9 2.1Jun −0.6 2.4 3.0 1.8 3.3 1.6 7.2 2.4 2.1 2.1 2.5 1.1 2.5
Jul −0.6 1.5 1.7 1.7 2.9 0.8 7.7 1.4 0.7 2.1 2.2 0.9 2.0
Key: - zero or negligible
1 From the release of Januar y consumer price inflation data on 16 Febr uary2016, CPIH and CPI indices have been re-referenced and published with2015=100. Full historic series for each of the re-referenced indices areavailable for users to view or download. Regular re-referencing of indices ismethodological good practice as it avoids rounding issues that can arisefrom small index values. Please note that re-referencing does not impact onpublished inflation rates, although when using the indices to calculate infla-tion rates, it is impor tant to use indices that are referenced on the sameyear. Re-referencing does not impact on RPI. For more infor mation, pleasecontact [email protected].
2 More detailed CPIH, CPI and RPI data are available at:http://www.ons.gov.uk.
Source: Office for National Statistics

10 status RPIIN publication CPNE Thu Aug 12 09:00:07 2021
D1 CPIH: Detailed figures by division1, 2
Housing, Furniture,water, household Miscell-
Food and Alcoholic electric- equipment aneousnon- beverages Clothing ity, gas & & routine Recreation Restaur- goods CPIH
alcoholic and and other mainte- Commun- and ants and and (overallbeverages tobacco footwear fuels nance Health Transpor t ication culture Education hotels ser vices index)
COICOP Division 1 2 3 4 5 6 7 8 9 10 11 12
WeightsL5CZ L5D2 L5D3 L5D4 L5D5 L5D6 L5D7 L5D8 L5D9 L5DA L5DB L5DC L5CY
2021 89 35 59 328 49 20 107 19 112 30 69 83 1 000
Monthly indices (2015=100)L523 L524 L525 L5PG L527 L528 L529 L52A L52B L52C L52D L52E L522
2019 Jul 103.2 114.4 99.1 107.9 104.0 110.4 112.9 110.0 108.0 114.4 112.2 103.4 108.0Aug 103.8 114.6 101.0 108.0 105.0 110.5 114.4 110.2 107.3 114.4 111.9 104.1 108.3Sep 103.5 114.5 103.9 108.1 106.2 110.9 111.5 111.0 107.9 115.6 112.8 104.4 108.4Oct 102.9 114.9 105.0 107.7 105.0 110.6 111.3 111.0 108.3 117.5 112.5 104.4 108.3Nov 103.8 114.6 106.0 107.8 105.5 110.9 111.0 111.0 108.8 117.5 112.3 104.7 108.5Dec 104.3 113.0 104.1 107.9 106.9 110.9 111.7 112.0 108.5 117.5 111.8 104.6 108.5
2020 Jan 104.2 115.7 100.7 108.0 103.6 111.6 111.5 112.1 108.4 117.5 111.7 105.0 108.3Feb 104.4 115.7 101.6 108.0 105.4 112.1 112.0 112.4 108.8 117.5 112.3 105.3 108.6Mar 104.6 116.2 101.2 108.0 105.4 112.5 111.4 113.1 108.9 117.5 112.4 105.6 108.6Apr 104.4 117.0 99.8 108.2 103.8 112.4 111.4 113.7 109.4 117.5 113.1 104.8 108.6May 105.0 117.3 100.0 108.3 104.5 110.9 110.3 114.3 109.2 117.5 113.6 104.9 108.6Jun 104.4 117.0 99.9 108.4 105.4 112.8 110.8 114.3 109.5 117.5 113.2 105.0 108.8
Jul 104.1 117.5 99.2 108.6 105.0 113.9 112.3 114.8 110.7 117.5 114.1 105.0 109.2Aug 104.2 116.8 99.6 108.7 105.5 113.3 113.5 114.8 110.2 117.5 108.8 105.1 108.8Sep 103.5 116.9 102.5 108.8 105.7 113.3 112.7 114.7 110.4 117.9 112.0 105.2 109.2Oct 103.5 117.2 105.0 108.3 105.3 113.0 112.7 114.8 110.4 120.0 111.9 105.3 109.2Nov 103.3 116.9 102.2 108.4 105.3 112.8 112.1 114.9 110.7 120.0 112.8 105.2 109.1Dec 102.9 117.0 102.3 108.6 106.3 112.2 113.8 114.9 111.2 120.0 111.9 105.3 109.4
2021 Jan 103.5 119.4 97.4 108.7 104.6 113.0 114.0 114.7 111.1 120.0 112.9 105.5 109.3Feb 103.8 119.1 95.9 108.8 106.2 112.6 114.9 114.7 111.1 120.0 113.3 105.5 109.4Mar 103.1 119.0 97.4 108.9 107.0 112.8 115.7 115.0 111.3 120.0 113.5 105.8 109.7Apr 103.9 119.5 99.8 110.1 106.6 114.2 117.0 117.1 110.1 120.0 114.3 105.4 110.4May 103.6 119.4 102.1 110.3 107.4 114.0 117.4 116.9 111.4 120.0 115.7 106.0 111.0Jun 103.8 119.9 102.8 110.5 108.9 114.6 119.0 117.2 111.8 120.0 116.1 106.2 111.4
Jul 103.4 119.3 100.8 110.7 108.1 115.0 121.2 116.5 111.4 120.0 116.6 106.0 111.4
Percentage chang e on a year earlier
L55P L55Q L55R L55S L55T L55U L55V L55W L55X L55Y L55Z L562 L55O2019 Jul 1.5 3.8 0.4 1.9 1.0 2.7 1.3 3.8 2.4 3.1 3.1 1.7 2.0
Aug 1.8 3.3 −0.8 1.9 0.8 2.4 1.3 3.6 1.2 3.1 2.8 1.8 1.7Sep 1.7 3.0 −0.9 1.7 1.9 2.6 0.5 4.1 1.4 3.2 3.2 1.7 1.7Oct 1.4 3.5 0.5 1.1 0.9 2.6 0.7 3.4 1.1 2.7 3.2 1.8 1.5Nov 2.1 1.9 − 1.2 1.2 2.9 0.8 3.3 1.5 2.7 2.4 1.9 1.5Dec 1.7 1.5 −0.8 1.2 1.5 2.8 0.7 4.3 1.4 2.7 1.6 2.1 1.4
2020 Jan 1.4 1.5 0.3 1.9 0.4 2.8 1.8 4.2 1.4 2.7 2.2 2.4 1.8Feb 1.3 0.7 0.2 1.8 0.2 3.0 1.9 4.5 1.4 2.7 2.5 2.4 1.7Mar 1.3 1.4 −1.2 1.7 0.1 3.2 1.3 5.0 1.2 2.7 2.1 2.4 1.5Apr 1.4 2.6 −2.8 0.5 −0.2 2.3 −0.9 4.2 2.4 2.7 2.4 1.3 0.9May 1.9 2.6 −3.0 0.5 −0.6 0.7 −1.6 4.0 1.8 2.7 2.0 1.2 0.7Jun 1.2 2.1 −2.1 0.6 −0.4 2.2 −1.5 3.9 2.5 2.7 1.8 1.4 0.8
Jul 0.8 2.6 0.1 0.6 0.9 3.2 −0.6 4.4 2.4 2.7 1.8 1.5 1.1Aug 0.4 1.9 −1.3 0.7 0.5 2.6 −0.8 4.1 2.7 2.7 −2.8 1.0 0.5Sep − 2.1 −1.4 0.7 −0.4 2.1 1.0 3.4 2.3 2.0 −0.7 0.8 0.7Oct 0.6 2.0 − 0.5 0.3 2.2 1.3 3.4 1.9 2.1 −0.5 0.9 0.9Nov −0.5 2.0 −3.6 0.5 −0.2 1.8 1.0 3.5 1.7 2.1 0.4 0.5 0.6Dec −1.4 3.5 −1.7 0.6 −0.6 1.1 1.9 2.6 2.5 2.1 0.1 0.6 0.8
2021 Jan −0.7 3.2 −3.3 0.6 1.0 1.2 2.3 2.3 2.5 2.1 1.1 0.4 0.9Feb −0.6 2.9 −5.6 0.8 0.8 0.4 2.6 2.0 2.1 2.1 0.9 0.1 0.7Mar −1.4 2.4 −3.8 0.8 1.5 0.3 3.9 1.7 2.2 2.1 1.0 0.2 1.0Apr −0.5 2.2 − 1.8 2.7 1.5 5.0 2.9 0.7 2.1 1.0 0.6 1.6May −1.3 1.7 2.1 1.9 2.8 2.8 6.5 2.3 1.9 2.1 1.8 1.1 2.1Jun −0.6 2.5 2.9 1.9 3.3 1.6 7.3 2.5 2.1 2.1 2.5 1.2 2.4
Jul −0.6 1.6 1.6 1.9 3.0 0.9 7.9 1.5 0.6 2.1 2.2 1.0 2.1
Key: - zero or negligible
1 From the release of Januar y consumer price inflation data on 16 Febr uary2016, CPIH & CPI indices have been re-referenced and published with2015=100. Full historic series for each of the re-referenced indices areavailable for users to view or download. Regular re-referencing of indices ismethodological good practice as it avoids rounding issues that can arisefrom small index values. Please note that re-referencing does not impact onpublished inflation rates, although when using the indices to calculate infla-tion rates, it is impor tant to use indices that are referenced on the sameyear. Re-referencing does not impact on RPI. For more infor mation, pleasecontact [email protected].
2 More detailed CPIH, CPI and RPI data are available at:http://www.ons.gsi.gov.uk.
Source: Office for National Statistics

11 status RPIIN publication CPNE Thu Aug 12 09:00:08 2021
E CPI: Detailed goods and services breakdown1
Percentagechange over
Weights Index (2015=100) Percentage change over 12 months 1 month
2021 2021 2021 2021 2021 2021 2021 2021 2021 2021 2021 2021 2021 2021Feb Mar Apr May Jun Jul Feb Mar Apr May Jun Jul Jul
CPI (overall index) 1 000 109.1 109.4 110.1 110.8 111.3 111.3 0.4 0.7 1.5 2.1 2.5 2.0 −
All goods 566 105.3 105.7 106.4 107.2 107.9 107.6 −0.5 0.0 1.5 2.3 2.8 2.5 −0.3Food, alcoholic beverages & tobacco 159 107.9 107.4 108.1 107.8 108.1 107.7 0.4 −0.3 0.3 −0.4 0.3 0.0 −0.4Processed food & non-alcoholic beverages 62 103.9 103.3 104.5 104.0 104.2 104.0 0.0 −2.2 0.1 −1.0 −0.1 −0.6 −0.1Non-processed food 52 103.3 102.7 102.8 102.8 102.9 102.4 −1.4 −0.4 −1.1 −1.6 −1.1 −0.6 −0.6
Seasonal food 31 106.9 105.9 106.2 106.7 105.9 105.1 −1.2 0.2 −0.6 −0.9 −0.8 −0.4 −0.8Meat 21 98.7 98.7 98.6 97.9 99.3 99.1 −1.6 −1.2 −1.8 −2.7 −1.6 −1.0 −0.2
Alcoholic beverages & tobacco 45 119.0 118.9 119.5 119.3 119.9 119.3 2.8 2.3 2.2 1.7 2.4 1.5 −0.5
Industrial goods 407 104.3 105.1 105.7 107.0 107.9 107.6 −0.9 0.1 2.0 3.3 3.8 3.4 −0.2Energy 60 105.0 106.5 111.9 112.7 113.7 114.8 −5.9 −2.5 7.5 9.4 10.3 9.3 0.9
Electr icity, gas & miscellaneous energy 32 100.5 100.5 109.5 109.5 109.5 109.6 −7.9 −7.9 1.7 1.7 1.7 1.8 0.1Liquid fuels, vehicle fuels & lubricants 28 109.0 112.1 113.3 114.9 117.2 119.5 −3.5 3.8 14.2 18.8 20.8 18.3 1.9
Non-energy industrial goods 347 104.2 104.8 104.7 106.0 106.9 106.4 0.2 0.7 1.1 2.3 2.7 2.4 −0.4Clothing & footwear goods 73 95.5 97.0 99.4 101.7 102.5 100.4 −5.8 −4.0 0.1 2.1 3.0 1.7 −2.1Housing goods 62 104.9 105.7 105.5 106.3 107.8 107.0 0.5 1.2 2.8 2.9 3.4 3.1 −0.7
Household goods 56 104.9 105.8 105.3 106.2 107.8 106.9 0.7 1.5 2.9 2.9 3.5 3.1 −0.9Water supply; materials for maintenance & repair 6 105.0 105.1 107.3 107.6 107.9 108.2 −1.1 −1.1 2.6 2.5 3.1 3.5 0.3
Medical products, appliances & equipment 17 106.3 106.7 107.7 107.3 108.1 108.3 −1.4 −1.7 −0.6 1.6 −0.7 −0.4 0.2Vehicles, spare parts & accessories 46 110.4 110.3 110.5 111.3 113.1 116.3 4.0 3.3 2.6 2.9 4.7 7.6 2.8Recreational goods 110 107.7 107.9 105.8 107.3 107.7 107.1 3.4 3.5 0.9 2.7 2.7 1.5 −0.6
Audio-visual goods 28 94.0 92.1 91.3 92.8 95.2 92.6 4.1 4.1 −0.4 2.6 4.2 1.6 −2.7Other recreational goods 82 111.9 113.0 110.4 111.9 111.4 111.7 3.2 3.4 1.4 2.7 2.2 1.5 0.2
Miscellaneous goods 39 100.9 101.7 100.9 102.1 102.0 101.5 −1.3 −0.7 −0.4 0.6 0.4 0.9 −0.4
All services 434 113.4 113.6 114.3 114.6 115.0 115.3 1.5 1.5 1.6 1.9 2.1 1.6 0.3Housing services 110 107.1 107.1 107.3 107.5 107.6 107.8 1.3 1.3 1.4 1.4 1.4 1.2 0.2Actual rentals for housing 94 106.4 106.4 106.7 106.8 107.0 107.2 1.8 1.8 1.5 1.5 1.6 1.4 0.2Pr imary housing services 10 105.7 105.7 105.8 105.7 105.7 105.8 −3.3 −3.3 −0.3 −0.4 −0.5 −0.3 0.1Other housing services 6 114.5 114.5 114.6 114.7 114.8 114.9 1.5 1.5 1.8 1.8 1.8 1.5 0.1
Travel & transport ser vices 66 120.5 120.9 122.7 122.4 123.3 124.6 3.2 3.2 2.2 3.5 3.2 3.3 1.0Ser vices for personal transpor t equipment 42 117.8 118.0 118.3 119.3 119.6 120.6 2.4 1.9 1.6 2.9 3.0 4.5 0.9Tr anspor t ser vices 21 123.2 123.9 128.8 125.7 127.9 129.6 5.5 6.7 5.0 5.5 4.8 2.8 1.4Tr anspor t insurance 3 107.0 107.8 107.2 108.4 110.3 110.0 −13.1 −15.2 −13.7 −11.9 −10.1 −7.6 −0.3
Communication 25 114.5 114.9 116.9 116.7 117.0 116.3 1.9 1.6 2.8 2.2 2.4 1.4 −0.6
Recreational & personal services 130 114.1 114.3 115.3 116.5 116.9 117.4 1.0 1.1 1.5 2.2 2.7 1.9 0.5Package holidays & accommodation 27 116.1 116.2 117.8 120.1 119.8 120.3 2.6 2.8 4.1 5.2 5.3 4.4 0.4Other recreational & personal services 103 113.7 114.0 114.8 115.7 116.2 116.8 0.9 1.0 1.1 1.7 2.3 1.6 0.5
Cater ing ser vices 72 113.5 113.8 114.3 115.2 115.9 116.4 0.6 0.8 0.6 1.4 2.2 1.4 0.4Non-cater ing recreational & personal services 31 114.2 114.4 116.1 116.7 117.0 117.8 1.4 1.4 2.1 2.3 2.4 1.8 0.7
Miscellaneous & other services 103 112.4 112.5 112.5 112.6 112.9 112.9 1.5 1.4 1.8 1.8 2.0 1.5 −Miscellaneous services 58 106.5 106.7 106.4 106.6 106.9 106.8 0.9 0.8 1.2 1.3 1.5 1.3 −0.1Medical services 8 119.6 119.6 121.4 121.7 122.0 122.8 3.3 3.1 4.9 5.2 5.3 3.4 0.7Education 37 120.0 120.0 120.0 120.0 120.0 120.0 2.1 2.1 2.1 2.1 2.1 2.1 −
Special aggregatesDurables 119 108.3 108.4 107.9 109.0 110.5 111.1 3.8 3.5 3.1 3.8 4.7 5.1 0.5Semi-durables 147 100.0 101.2 101.1 103.3 103.8 102.3 −2.7 −1.3 −0.2 2.0 2.0 0.8 −1.4Non-durables 81 105.6 106.0 106.1 106.4 106.7 106.8 0.0 0.1 0.2 0.7 1.0 1.6 0.1Seasonal food 31 106.9 105.9 106.2 106.7 105.9 105.1 −1.2 0.2 −0.6 −0.9 −0.8 −0.4 −0.8Non-seasonal food 70 101.9 101.1 102.2 101.6 102.3 102.1 −0.1 −2.1 −0.4 −1.4 −0.2 −0.5 −0.2Energy, food, alcoholic beverages & tobacco 219 107.0 107.1 109.2 109.2 109.7 109.7 −1.6 −1.1 2.3 2.3 3.0 2.5 −Energy & unprocessed food 112 104.4 104.8 107.8 108.2 108.9 109.2 −4.1 −1.7 3.5 4.3 5.0 4.7 0.3Energy & seasonal food 91 105.7 106.3 110.1 110.7 111.2 111.6 −4.5 −1.8 4.7 5.9 6.5 6.0 0.4Tobacco 22 133.5 133.4 133.5 132.9 133.3 133.7 5.7 3.6 3.3 2.9 3.3 3.1 0.3Housing, water, electr icity, gas & other fuels 141 105.1 105.2 107.6 107.7 107.9 108.1 −1.1 −0.9 1.7 1.8 1.8 1.7 0.2Education, health & social protection2 86 117.2 117.3 117.9 117.9 118.3 118.4 1.6 1.6 2.3 2.6 2.3 1.8 0.2
All items excludingEnergy3 940 109.4 109.6 110.0 110.6 111.1 111.1 0.8 0.9 1.1 1.6 2.0 1.6 −0.1Energy, food, alcoholic beverages & tobacco 781 109.6 110.0 110.3 111.1 111.7 111.7 0.9 1.1 1.3 2.0 2.3 1.8 −Energy & unprocessed food 888 109.7 110.0 110.4 111.0 111.6 111.5 0.9 1.0 1.2 1.8 2.2 1.7 −0.1Seasonal food 969 109.1 109.5 110.2 110.9 111.5 111.5 0.4 0.7 1.6 2.2 2.6 2.1 −Energy & seasonal food 909 109.4 109.7 110.1 110.7 111.3 111.2 0.9 0.9 1.2 1.7 2.1 1.6 −0.1Tobacco 978 108.6 108.9 109.6 110.3 110.9 110.8 0.3 0.7 1.5 2.1 2.5 2.0 −Alcoholic beverages & tobacco 955 108.7 109.0 109.7 110.4 111.0 111.0 0.3 0.6 1.5 2.1 2.5 2.1 −Liquid fuels, vehicle fuels & lubricants 972 109.1 109.3 110.0 110.6 111.1 111.0 0.5 0.6 1.2 1.7 2.0 1.6 −0.1Housing, water, electr icity, gas & other fuels 859 109.7 110.0 110.4 111.2 111.8 111.7 0.6 1.0 1.5 2.1 2.6 2.1 −Education, health & social protection 914 108.5 108.8 109.6 110.3 110.8 110.8 0.3 0.6 1.5 2.1 2.5 2.1 −
Key: - zero or negligible1 For further infor mation on the composition of the indices shown,
see ’The Consumer Prices Index: Goods and Services Indices and SpecialAggregates’, which can be downloaded from:http://webarchive.nation-alarchives.gov.uk/20160105160709/http://ons.gov.uk/
2 The coverage of this special aggregate has changed extensively since Januar y2000, when Social protection was first included and extentions to the Educa-tion and Health divisions also took effect. Health was further extended with ef-fect from Januar y 2001.
3 Energy includes electricity, gas and other fuels, and fuels and lubricants.Source: Office for National Statistics

12 status RPIIN publication CPNE Thu Aug 12 09:00:09 2021
E1 CPIH: Detailed goods and services breakdown1
Percentagechange over
Weights Index (2015=100) Percentage change over 12 months 1 month
2021 2021 2021 2021 2021 2021 2021 2021 2021 2021 2021 2021 2021 2021Feb Mar Apr May Jun Jul Feb Mar Apr May Jun Jul Jul
CPIH (overall index) 1 000 109.4 109.7 110.4 111.0 111.4 111.4 0.7 1.0 1.6 2.1 2.4 2.1 −
All goods 443 105.3 105.7 106.4 107.3 108.0 107.7 −0.5 0.1 1.6 2.3 2.9 2.5 −0.3Food, alcoholic beverages & tobacco 124 108.0 107.5 108.2 108.0 108.2 107.8 0.4 −0.3 0.3 −0.4 0.3 0.0 −0.4Processed food & non-alcoholic beverages 49 104.4 103.7 105.0 104.5 104.7 104.5 0.1 −2.2 0.1 −1.0 0.0 −0.6 −0.2Non-processed food 40 103.0 102.4 102.6 102.6 102.7 102.1 −1.4 −0.4 −1.2 −1.7 −1.2 −0.7 −0.6
Seasonal food 24 106.5 105.5 105.8 106.3 105.5 104.7 −1.3 0.1 −0.8 −1.0 −1.0 −0.5 −0.8Meat 16 98.7 98.7 98.6 97.9 99.3 99.1 −1.6 −1.2 −1.8 −2.7 −1.6 −1.0 −0.2
Alcoholic beverages & tobacco 35 119.1 119.0 119.5 119.4 119.9 119.3 2.9 2.4 2.2 1.7 2.5 1.6 −0.5
Industrial goods 319 104.3 105.1 105.8 107.0 107.9 107.6 −0.8 0.2 2.0 3.4 3.9 3.5 −0.2Energy 47 105.1 106.5 112.0 112.7 113.8 114.9 −5.7 −2.3 7.6 9.6 10.5 9.5 0.9
Electr icity, gas & miscellaneous energy 25 100.7 100.7 109.6 109.6 109.6 109.7 −7.6 −7.6 1.9 1.8 1.9 2.0 0.1Liquid fuels, vehicle fuels & lubricants 22 109.2 112.3 113.4 115.1 117.4 119.6 −3.5 3.9 14.4 19.0 20.9 18.4 1.9
Non-energy industrial goods 272 104.2 104.8 104.7 106.1 106.9 106.4 0.2 0.7 1.1 2.3 2.7 2.4 −0.5Clothing & footwear goods 58 95.6 97.1 99.5 101.9 102.6 100.5 −5.7 −3.9 0.0 2.0 2.9 1.6 −2.0Housing goods 49 105.0 105.8 105.6 106.4 107.9 107.1 0.5 1.3 2.8 2.9 3.4 3.2 −0.7
Household goods 44 105.0 105.8 105.4 106.3 107.9 106.9 0.7 1.5 2.8 2.9 3.5 3.1 −0.9Water supply; materials for maintenance & repair 5 105.1 105.2 107.3 107.7 108.0 108.4 −1.0 −1.0 2.6 2.5 3.2 3.7 0.4
Medical products, appliances & equipment 13 106.3 106.7 107.7 107.3 108.1 108.3 −1.4 −1.6 −0.6 1.6 −0.7 −0.4 0.2Vehicles, spare parts & accessories 37 110.4 110.4 110.6 111.3 113.1 116.1 4.0 3.4 2.8 3.0 4.7 7.5 2.6Recreational goods 85 107.7 107.9 105.8 107.3 107.7 107.0 3.3 3.4 0.9 2.7 2.7 1.5 −0.6
Audio-visual goods 22 94.2 92.2 91.4 92.9 95.5 92.7 4.4 4.4 −0.3 2.9 4.5 1.8 −2.9Other recreational goods 63 111.8 112.9 110.3 111.8 111.3 111.5 2.9 3.1 1.3 2.6 2.0 1.4 0.2
Miscellaneous goods 30 101.1 101.8 101.0 102.3 102.1 101.7 −1.2 −0.6 −0.4 0.6 0.5 0.9 −0.4
All services 557 112.5 112.6 113.3 113.6 113.9 114.2 1.6 1.6 1.7 1.9 2.1 1.8 0.2Housing services 303 109.7 109.8 110.3 110.5 110.7 110.8 1.6 1.6 1.7 1.7 1.8 1.8 0.1Actual rentals for housing 74 106.4 106.4 106.7 106.8 107.0 107.2 1.8 1.8 1.5 1.5 1.6 1.4 0.2Owner occupiers’ housing 185 109.1 109.1 109.2 109.4 109.6 109.8 1.4 1.3 1.4 1.5 1.6 1.6 0.1Pr imary housing services 39 118.3 118.3 122.3 122.3 122.3 122.3 2.3 2.3 3.3 3.3 3.3 3.3 −Other housing services 5 114.3 114.3 114.4 114.5 114.6 114.7 1.6 1.5 1.9 1.9 1.8 1.6 0.1
Travel & transport ser vices 51 120.2 120.6 122.6 122.3 123.3 124.7 3.4 3.5 2.6 3.9 3.7 3.8 1.1Ser vices for personal transpor t equipment 33 117.7 117.9 118.3 119.3 119.6 120.6 2.4 1.9 1.6 2.9 3.0 4.5 0.9Tr anspor t ser vices 16 122.5 123.0 128.9 125.6 128.1 130.4 5.7 7.0 5.9 6.3 5.7 4.2 1.9Tr anspor t insurance 2 107.0 107.8 107.2 108.4 110.3 110.0 −13.1 −15.2 −13.7 −11.9 −10.1 −7.6 −0.3
Communication 19 114.7 115.0 117.1 116.9 117.2 116.5 2.0 1.7 2.9 2.3 2.5 1.5 −0.6
Recreational & personal services 101 114.1 114.4 115.3 116.5 116.9 117.4 1.0 1.1 1.5 2.2 2.7 1.9 0.5Package holidays & accommodation 21 116.2 116.2 117.8 120.2 119.9 120.5 2.7 2.9 4.2 5.4 5.5 4.6 0.4Other recreational & personal services 80 113.8 114.0 114.8 115.7 116.2 116.8 0.9 1.0 1.0 1.7 2.2 1.5 0.5
Cater ing ser vices 57 113.6 113.8 114.3 115.2 115.9 116.3 0.7 0.8 0.6 1.4 2.2 1.4 0.4Non-cater ing recreational & personal services 23 114.1 114.3 116.0 116.6 116.8 117.6 1.3 1.3 2.0 2.2 2.3 1.7 0.7
Miscellaneous & other services 83 112.5 112.6 112.6 112.7 113.0 113.0 1.5 1.5 1.9 1.9 2.0 1.6 −Miscellaneous services 46 106.6 106.7 106.5 106.6 107.0 106.9 0.9 0.9 1.3 1.3 1.6 1.3 −0.1Medical services 7 119.5 119.5 121.2 121.5 121.8 122.6 3.3 3.1 4.8 5.1 5.2 3.3 0.6Education 30 120.0 120.0 120.0 120.0 120.0 120.0 2.1 2.1 2.1 2.1 2.1 2.1 −
Special aggregatesDurables 94 108.3 108.4 108.0 109.1 110.6 111.1 3.9 3.6 3.2 3.9 4.7 5.1 0.4Semi-durables 116 100.1 101.3 101.3 103.4 104.0 102.4 −2.6 −1.3 −0.2 2.0 2.1 0.8 −1.5Non-durables 62 105.6 106.0 106.1 106.4 106.7 106.8 0.0 0.1 0.2 0.7 1.0 1.6 0.1Seasonal food 24 106.5 105.5 105.8 106.3 105.5 104.7 −1.3 0.1 −0.8 −1.0 −1.0 −0.5 −0.8Non-seasonal food 55 102.3 101.5 102.6 102.0 102.8 102.6 0.0 −2.1 −0.4 −1.3 −0.1 −0.5 −0.2Energy, food, alcoholic beverages & tobacco 171 107.1 107.1 109.2 109.2 109.7 109.7 −1.6 −1.0 2.3 2.3 3.1 2.6 −Energy & unprocessed food 87 104.3 104.8 107.8 108.1 108.8 109.1 −4.0 −1.6 3.6 4.4 5.1 4.8 0.3Energy & seasonal food 71 105.7 106.3 110.0 110.7 111.1 111.5 −4.4 −1.6 4.8 6.0 6.6 6.1 0.4Tobacco 17 133.5 133.4 133.5 132.9 133.3 133.7 5.7 3.6 3.3 2.9 3.3 3.1 0.3Housing, water, electr icity, gas & other fuels 328 108.8 108.9 110.1 110.3 110.5 110.7 0.8 0.8 1.8 1.9 1.9 1.9 0.1Education, health & social protection 69 117.2 117.4 117.9 117.9 118.3 118.5 1.7 1.6 2.3 2.7 2.3 1.8 0.2
All items excludingEnergy2 953 109.7 109.9 110.3 110.9 111.3 111.3 1.1 1.1 1.3 1.8 2.1 1.7 −Energy, food, alcoholic beverages & tobacco 829 109.9 110.2 110.6 111.3 111.8 111.8 1.1 1.3 1.5 2.0 2.3 1.9 −Energy & unprocessed food 913 109.9 110.2 110.7 111.2 111.7 111.7 1.2 1.2 1.4 1.9 2.2 1.8 −Seasonal food 976 109.5 109.8 110.5 111.1 111.6 111.6 0.8 1.0 1.7 2.2 2.5 2.1 −Energy & seasonal food 929 109.7 110.0 110.5 111.0 111.5 111.5 1.1 1.2 1.4 1.8 2.1 1.8 −Tobacco 983 109.0 109.3 110.0 110.6 111.1 111.1 0.6 0.9 1.6 2.1 2.4 2.1 −Alcoholic beverages & tobacco 965 109.1 109.4 110.1 110.7 111.1 111.2 0.7 0.9 1.6 2.1 2.4 2.1 −Liquid fuels, vehicle fuels & lubricants 978 109.4 109.6 110.3 110.9 111.3 111.3 0.8 0.9 1.4 1.8 2.1 1.7 −Housing, water, electr icity, gas & other fuels 672 109.6 110.0 110.5 111.2 111.8 111.8 0.7 1.0 1.5 2.2 2.7 2.1 −Owner occupiers’ housing costs 815 109.5 109.8 110.7 111.3 111.8 111.8 0.6 0.9 1.7 2.3 2.7 2.2 −Council tax and rates 783 109.1 109.4 110.0 110.5 111.0 111.0 0.6 0.9 1.5 2.1 2.4 2.0 −Owner occupiers’ housing costs and council tax and rates 968 109.1 109.4 110.1 110.8 111.4 111.3 0.5 0.8 1.6 2.2 2.6 2.1 −Education, health & social protection 931 109.0 109.2 110.0 110.6 111.1 111.1 0.7 0.9 1.6 2.1 2.5 2.1 −
Key: - zero or negligible1 For further infor mation on the composition of the indices shown,
see ’The Consumer Prices Index: Goods and Services Indices and SpecialAggregates’, which can be downloaded from:http://webarchive.nation-alarchives.gov.uk/20160105160709/http://ons.gov.uk/
2 Energy includes electricity, gas and other fuels, and fuels and lubricants.
Source: Office for National Statistics

13 status RPIIN publication CPNE Thu Aug 12 09:00:11 2021
F CPI goods and services: the latest three yearsPercentage chang e over 12 months
Goods components Ser vices components
Food & non- Alcoholic Non-energy Tr avel & Recreational Miscellaneo-alcoholic beverages & industr ial All Housing transpor t & personal Commun- us & other All
beverages tobacco Energy1 goods2 goods ser vices3 ser vices3 ser vices3 ication services3 ser vices
WeightsCHZR CHZS A9F3 A9ER ICVH A9FG A9FJ A9FL CHZY A9FQ ICVI
2021 114 45 60 347 566 110 66 130 25 103 434
MonthlyD7G8 D7G9 DKL5 DKK3 D7NM DKN2 DKN5 DKN7 D7GF DKO4 D7NN
2018 Jul 2.3 3.5 9.3 1.2 2.6 0.9 4.0 3.1 1.6 0.8 2.3Aug 2.5 4.1 8.9 1.4 2.8 0.9 5.0 3.4 0.3 0.8 2.5Sep 1.5 4.1 9.3 1.2 2.5 1.0 3.9 3.2 0.9 0.9 2.3Oct 0.9 4.0 10.4 0.9 2.3 1.0 3.4 3.3 1.9 1.5 2.5Nov 0.5 5.8 8.7 0.9 2.1 1.0 3.5 3.2 1.6 1.7 2.5Dec 0.7 4.1 5.9 1.0 1.8 1.0 2.5 3.4 2.9 1.6 2.4
2019 Jan 0.9 4.2 1.1 1.0 1.3 0.9 3.3 3.2 3.1 1.7 2.5Feb 1.1 5.1 1.2 0.9 1.3 0.9 3.2 3.2 3.6 1.8 2.5Mar 0.8 5.2 2.2 0.8 1.3 0.9 3.3 3.1 3.7 2.0 2.5Apr 0.7 3.9 7.5 0.1 1.4 1.0 6.0 2.8 4.6 2.1 2.9May 1.0 3.3 7.0 0.3 1.5 1.1 3.2 3.0 4.9 2.2 2.6Jun 1.6 3.7 4.5 0.7 1.5 1.1 3.9 2.6 4.3 2.2 2.5
Jul 1.4 3.8 3.5 1.2 1.7 1.0 1.8 3.2 3.8 2.9 2.5Aug 1.8 3.3 3.3 0.5 1.3 1.0 2.1 2.5 3.6 2.9 2.2Sep 1.8 3.0 1.5 0.4 1.0 1.0 2.0 3.1 4.1 3.0 2.5Oct 1.3 3.5 −2.5 0.5 0.5 1.0 2.8 3.0 3.4 2.8 2.6Nov 2.1 1.9 −2.3 0.5 0.6 1.1 3.0 2.7 3.3 2.9 2.5Dec 1.7 1.5 −0.4 0.3 0.6 1.1 1.4 2.3 4.3 2.8 2.1
2020 Jan 1.4 1.5 4.8 0.5 1.3 1.1 2.3 2.5 4.2 2.6 2.3Feb 1.2 0.7 3.7 0.4 1.0 1.1 2.6 2.9 4.5 2.6 2.5Mar 1.3 1.4 0.9 0.2 0.6 1.1 3.5 2.6 5.0 2.5 2.5Apr 1.3 2.5 −9.3 0.5 −0.4 1.1 1.9 2.5 4.2 1.6 2.0May 1.8 2.6 −11.6 0.1 −0.9 1.0 2.0 2.4 4.0 1.5 1.9Jun 1.1 2.1 −11.2 0.9 −0.5 1.0 1.8 2.2 3.9 1.4 1.8
Jul 0.8 2.6 −9.1 1.3 − 1.3 1.6 2.8 4.3 1.6 2.1Aug 0.4 1.9 −8.9 1.2 −0.2 1.4 0.3 −0.2 4.1 1.3 0.6Sep −0.1 2.1 −8.5 1.0 −0.3 1.3 2.9 0.9 3.4 1.2 1.4Oct 0.6 2.0 −9.5 1.6 − 1.4 2.9 0.7 3.3 1.4 1.4Nov −0.6 2.0 −9.4 0.6 −0.8 1.2 2.6 0.9 3.5 1.4 1.4Dec −1.4 3.6 −8.4 1.2 −0.3 1.2 3.6 0.8 2.6 1.5 1.5
2021 Jan −0.7 3.2 −8.3 1.2 −0.2 1.3 3.8 1.3 2.2 1.6 1.7Feb −0.6 2.8 −5.9 0.2 −0.5 1.3 3.2 1.0 1.9 1.5 1.5Mar −1.4 2.3 −2.5 0.7 − 1.3 3.2 1.1 1.6 1.4 1.5Apr −0.4 2.2 7.5 1.1 1.5 1.4 2.2 1.5 2.8 1.8 1.6May −1.3 1.7 9.4 2.3 2.3 1.4 3.5 2.2 2.2 1.8 1.9Jun −0.6 2.4 10.3 2.7 2.8 1.4 3.2 2.7 2.4 2.0 2.1
Jul −0.6 1.5 9.3 2.4 2.5 1.2 3.3 1.9 1.4 1.5 1.6
Key: - zero or negligible1 Compr ises ’Electr icity, gas and other fuels’ (group 04.5) and ’Fuels and
lubr icants’ (class 07.2.2).
2 Compr ises all other goods elements of the CPI.
3 For further infor mation on all of these services components, see ’TheConsumer Prices Index: Goods and Services Indices and Special Aggregates’,which can be downloaded from: http://webarchive.nation-alarchives.gov.uk/20160105160709/http://ons.gov.uk/
Source: Office for National Statistics

14 status RPIIN publication CPNE Thu Aug 12 09:00:11 2021
F1 CPIH goods and services: the latest three yearsPercentage chang e over 12 months
Goods components Ser vices components
Food & non- Alcoholic Non-energy Tr avel & Recreational Miscellaneo-alcoholic beverages & industr ial All Housing transpor t & personal Commun- us & other All
beverages tobacco Energy1 goods2 goods ser vices3 ser vices3 ser vices3 ication services3 ser vices
WeightsL5CZ L5D2 L5NU L5NX L5DD L5O8 L5OC L5OE L5D8 L5P4 L5DE
2021 89 35 47 272 443 303 51 101 19 83 557
MonthlyL55P L55Q L5KY L5L3 L563 L5LC L5LG L5LI L55W L5M9 L564
2018 Jul 2.3 3.5 9.4 1.2 2.6 1.4 3.8 3.1 1.6 0.7 2.0Aug 2.4 4.0 9.0 1.4 2.7 1.3 4.6 3.4 0.3 0.7 2.2Sep 1.5 4.0 9.4 1.2 2.5 1.4 3.6 3.2 0.9 0.8 2.0Oct 0.9 3.9 10.5 0.9 2.3 1.4 3.1 3.3 1.9 1.5 2.1Nov 0.5 5.7 8.7 0.9 2.1 1.4 3.2 3.2 1.6 1.7 2.2Dec 0.7 4.1 5.8 1.0 1.8 1.5 2.2 3.4 2.8 1.6 2.1
2019 Jan 0.9 4.2 1.1 0.9 1.2 1.4 3.2 3.2 3.1 1.7 2.2Feb 1.2 5.1 1.1 0.9 1.3 1.4 3.0 3.2 3.6 1.8 2.2Mar 0.8 5.2 2.1 0.8 1.3 1.4 3.2 3.1 3.7 2.0 2.2Apr 0.7 3.9 7.4 0.1 1.4 1.5 5.8 2.9 4.6 2.1 2.5May 1.1 3.3 6.9 0.3 1.5 1.5 3.1 3.0 4.9 2.2 2.3Jun 1.7 3.7 4.3 0.6 1.5 1.5 3.7 2.7 4.3 2.2 2.2
Jul 1.5 3.8 3.4 1.2 1.7 1.5 1.6 3.2 3.8 2.9 2.2Aug 1.8 3.3 3.2 0.4 1.2 1.4 1.9 2.5 3.6 3.0 2.0Sep 1.7 3.0 1.4 0.4 0.9 1.4 1.9 3.1 4.1 3.0 2.2Oct 1.4 3.5 −2.6 0.4 0.4 1.5 2.7 3.0 3.4 2.8 2.2Nov 2.1 1.9 −2.3 0.4 0.5 1.5 2.9 2.8 3.3 2.9 2.2Dec 1.7 1.5 −0.4 0.2 0.6 1.5 1.3 2.3 4.3 2.8 1.9
2020 Jan 1.4 1.5 4.8 0.5 1.3 1.6 2.3 2.5 4.2 2.6 2.1Feb 1.3 0.7 3.6 0.4 1.0 1.5 2.7 2.9 4.5 2.6 2.2Mar 1.3 1.4 0.8 0.2 0.6 1.5 3.4 2.6 5.0 2.5 2.2Apr 1.4 2.6 −9.4 0.5 −0.4 1.4 2.1 2.5 4.2 1.7 1.9May 1.9 2.6 −11.7 − −0.9 1.4 2.1 2.4 4.0 1.5 1.8Jun 1.2 2.1 −11.3 0.9 −0.5 1.4 2.0 2.1 3.9 1.4 1.7
Jul 0.8 2.6 −9.2 1.3 − 1.5 1.9 2.7 4.4 1.6 2.0Aug 0.4 1.9 −8.9 1.2 −0.2 1.5 0.7 −0.2 4.1 1.4 1.0Sep − 2.1 −8.6 1.0 −0.3 1.5 3.0 0.9 3.4 1.3 1.5Oct 0.6 2.0 −9.4 1.6 0.1 1.5 2.9 0.7 3.4 1.4 1.5Nov −0.5 2.0 −9.3 0.6 −0.7 1.5 2.6 0.9 3.5 1.4 1.5Dec −1.4 3.5 −8.3 1.3 −0.2 1.5 3.7 0.8 2.6 1.5 1.6
2021 Jan −0.7 3.2 −8.2 1.2 −0.2 1.6 4.1 1.3 2.3 1.7 1.7Feb −0.6 2.9 −5.7 0.2 −0.5 1.6 3.4 1.0 2.0 1.5 1.6Mar −1.4 2.4 −2.3 0.7 0.1 1.6 3.5 1.1 1.7 1.5 1.6Apr −0.5 2.2 7.6 1.1 1.6 1.7 2.6 1.5 2.9 1.9 1.7May −1.3 1.7 9.6 2.3 2.3 1.7 3.9 2.2 2.3 1.9 1.9Jun −0.6 2.5 10.5 2.7 2.9 1.8 3.7 2.7 2.5 2.0 2.1
Jul −0.6 1.6 9.5 2.4 2.5 1.8 3.8 1.9 1.5 1.6 1.8
Key: - zero or negligible1 Compr ises ’Electr icity, gas and other fuels’ (group 04.5) and ’Fuels and
lubr icants’ (class 07.2.2).
2 Compr ises all other goods elements of the CPI.
3 For further infor mation on all of these services components, see ’TheConsumer Prices Index: Goods and Services Indices and Special Aggregates’,which can be downloaded from: http://webarchive.nation-alarchives.gov.uk/20160105160709/http://ons.gov.uk/
Source: Office for National Statistics

15 status RPIIN publication CPNE Thu Aug 12 09:00:11 2021
G HICP1 - International comparisons: EU countries5
Percentage chang e over 12 months
CzechAustr ia Belgium Bulgaria Cyprus Republic Denmark Estonia Finland France Germany Greece Hungary Ireland Italy Latvia
D7SK D7SL GHY8 D7RO D7RP D7SM D7RQ D7SN D7SO D7SP D7SQ D7RR D7SS D7ST D7RS2011 3.6 3.4 3.4 3.5 2.2 2.7 5.1 3.3 2.3 2.5 3.1 3.9 1.2 2.9 4.22012 2.6 2.6 2.4 3.1 3.5 2.4 4.2 3.2 2.2 2.2 1.0 5.7 1.9 3.3 2.32013 2.1 1.2 0.4 0.4 1.4 0.5 3.2 2.2 1.0 1.6 −0.9 1.7 0.5 1.2 −2014 1.5 0.5 −1.6 −0.3 0.4 0.4 0.5 1.2 0.6 0.8 −1.4 − 0.3 0.2 0.72015 0.8 0.6 −1.1 −1.5 0.3 0.2 0.1 −0.2 0.1 0.7 −1.1 0.1 − 0.1 0.2
2016 1.0 1.8 −1.3 −1.2 0.6 − 0.8 0.4 0.3 0.4 − 0.4 −0.2 −0.1 0.12017 2.2 2.2 1.2 0.7 2.4 1.1 3.7 0.8 1.2 1.7 1.1 2.4 0.3 1.3 2.92018 2.1 2.3 2.6 0.8 2.0 0.7 3.4 1.2 2.1 1.9 0.8 2.9 0.7 1.2 2.62019 1.5 1.2 2.5 0.5 2.6 0.7 2.3 1.1 1.3 1.4 0.5 3.4 0.9 0.6 2.72020 .. .. .. .. .. .. .. .. .. .. .. .. .. .. ..
2019 Feb 1.4 2.0 2.4 0.8 2.4 1.1 1.9 1.3 1.6 1.7 0.8 3.2 0.7 1.1 2.8Mar 1.7 2.2 2.8 1.1 2.6 1.2 2.2 1.1 1.3 1.4 1.0 3.8 1.1 1.1 2.7Apr 1.7 2.0 3.1 1.2 2.4 0.9 3.2 1.5 1.5 2.1 1.1 3.9 1.7 1.1 3.3May 1.7 1.7 2.9 0.2 2.6 0.7 3.1 1.3 1.1 1.3 0.6 4.0 1.0 0.9 3.5Jun 1.6 1.3 2.3 0.3 2.4 0.5 2.6 1.1 1.4 1.5 0.2 3.4 1.1 0.8 3.1
Jul 1.4 1.2 2.6 0.1 2.6 0.4 2.0 1.0 1.3 1.1 0.4 3.3 0.5 0.3 3.0Aug 1.5 0.9 2.5 0.6 2.6 0.5 2.1 1.2 1.3 1.0 0.1 3.2 0.6 0.5 3.1Sep 1.2 0.6 1.6 −0.5 2.6 0.4 2.2 1.0 1.1 0.9 0.2 2.9 0.6 0.2 2.3Oct 1.0 0.2 1.6 −0.5 2.6 0.6 1.4 0.9 0.9 0.9 −0.3 3.0 0.6 0.2 2.2Nov 1.2 0.4 2.2 0.5 3.0 0.6 1.8 0.8 1.2 1.2 0.5 3.4 0.8 0.2 2.0Dec 1.8 0.9 3.1 0.7 3.2 0.8 1.8 1.1 1.6 1.5 1.1 4.1 1.1 0.5 2.1
2020 Jan 2.2 1.4 3.4 0.7 3.8 0.8 1.6 1.2 1.7 1.6 1.1 4.7 1.1 0.4 2.2Feb 2.2 1.0 3.1 1.0 3.7 0.7 2.0 1.1 1.6 1.7 0.4 4.4 0.9 0.2 2.3Mar 1.6 0.4 2.4 0.1 3.6 0.3 1.0 0.9 0.8 1.3 0.2 3.9 0.5 0.1 1.4Apr 1.5 − 1.3 −1.2 3.3 −0.1 −0.9 −0.3 0.4 0.8 −0.9 2.5 −0.3 0.1 −0.1May 0.6 −0.2 1.0 −1.4 3.1 −0.2 −1.8 −0.1 0.4 0.5 −0.7 2.2 −0.8 −0.3 −0.9Jun 1.1 0.2 0.9 −2.2 3.4 0.2 −1.6 0.1 0.2 0.8 −1.9 2.9 −0.6 −0.4 −1.1
Jul 1.8 1.7 0.4 −2.0 3.6 0.4 −1.3 0.7 0.9 − −2.1 3.9 −0.6 0.8 0.1Aug 1.4 −0.9 0.6 −2.9 3.5 0.4 −1.3 0.3 0.2 −0.1 −2.3 4.0 −1.1 −0.5 −0.5Sep 1.2 0.5 0.6 −1.9 3.3 0.5 −1.3 0.3 − −0.4 −2.3 3.4 −1.2 −1.0 −0.4Oct 1.1 0.4 0.6 −1.4 2.9 0.3 −1.7 0.2 0.1 −0.5 −2.0 3.0 −1.5 −0.6 −0.7Nov 1.1 0.2 0.3 −1.1 2.8 0.4 −1.2 0.2 0.2 −0.7 −2.1 2.8 −1.0 −0.3 −0.7Dec .. 0.4 .. −0.8 .. .. −0.9 0.2 − −0.7 −2.4 .. −1.0 −0.3 −0.5

16 status RPIIN publication CPNE Thu Aug 12 09:00:12 2021
G HICP1 - International comparisons: EU countries5
Percentage chang e over 12 monthscontinued
Luxem- Nether- United EU 27 EU 28 MUICPLithuania bourg Malta lands Poland Por tugal Romania Slovakia Slovenia Spain Sweden Kingdom1 average2 average3 average4
D7RT D7SU D7RU D7SV D7RV D7SX GHY7 D7RW D7RX D7SY D7SZ D7G7 FSL3 GJ2E D7SR2011 4.1 3.7 2.5 2.5 3.9 3.6 5.8 4.1 2.1 3.0 1.4 4.5 2.9 3.1 2.72012 3.2 2.9 3.2 2.8 3.7 2.8 3.4 3.7 2.8 2.4 0.9 2.8 2.6 2.6 2.52013 1.2 1.7 1.0 2.6 0.8 0.4 3.2 1.5 1.9 1.5 0.4 2.6 1.3 1.5 1.42014 0.2 0.7 0.8 0.3 0.1 −0.2 1.4 −0.1 0.4 −0.2 0.2 1.5 0.4 0.6 0.42015 −0.7 0.1 1.2 0.2 −0.7 0.5 −0.4 −0.3 −0.8 −0.6 0.7 − 0.1 0.1 0.2
2016 0.7 − 0.9 0.1 −0.2 0.6 −1.1 −0.5 −0.2 −0.3 1.1 0.7 0.2 0.2 0.22017 3.7 2.1 1.3 1.3 1.6 1.6 1.1 1.4 1.6 2.0 1.9 2.7 1.6 1.7 1.52018 2.5 2.0 1.7 1.6 1.2 1.2 4.1 2.5 1.9 1.7 2.0 2.5 1.8 1.9 1.82019 2.2 1.6 1.5 2.7 2.1 0.3 3.9 2.8 1.7 0.8 1.7 1.8 1.4 1.5 1.22020 .. .. .. .. .. .. .. .. .. .. .. 0.9 .. .. ..
2019 Feb 2.0 2.1 1.3 2.6 1.3 0.9 4.0 2.3 1.3 1.1 1.9 1.9 1.6 1.6 1.5Mar 2.6 2.4 1.3 2.9 1.7 0.8 4.2 2.7 1.6 1.3 1.8 1.9 1.6 1.6 1.4Apr 2.7 2.2 1.7 3.0 2.1 0.9 4.4 2.4 1.8 1.6 2.1 2.1 1.9 1.9 1.7May 2.5 2.2 1.7 2.3 2.2 0.3 4.4 2.7 1.6 0.9 2.1 2.0 1.5 1.6 1.2Jun 2.4 1.5 1.8 2.7 2.3 0.7 3.9 2.7 1.9 0.6 1.6 2.0 1.5 1.6 1.3
Jul 2.5 1.6 1.8 2.6 2.5 −0.7 4.1 3.0 2.0 0.6 1.5 2.1 1.3 1.4 1.0Aug 2.5 1.4 1.9 3.1 2.6 −0.1 4.1 3.0 2.4 0.4 1.3 1.7 1.3 1.4 1.0Sep 2.0 1.1 1.6 2.7 2.4 −0.3 3.5 3.0 1.7 0.2 1.3 1.7 1.1 1.2 0.8Oct 1.5 0.8 1.4 2.8 2.3 −0.1 3.2 2.9 1.5 0.2 1.6 1.5 1.0 1.1 0.7Nov 1.7 1.0 1.3 2.6 2.4 0.2 3.8 3.2 1.4 0.5 1.8 1.5 1.3 1.3 1.0Dec 2.7 1.8 1.3 2.8 3.0 0.4 4.0 3.2 2.0 0.8 1.7 1.3 1.6 1.6 1.3
2020 Jan 3.0 2.5 1.4 1.7 3.8 0.8 3.9 3.2 2.3 1.1 1.5 1.8 1.7 1.7 1.4Feb 2.8 1.8 1.1 1.3 4.1 0.5 2.9 3.1 2.0 0.9 1.3 1.7 1.6 .. 1.2Mar 1.7 0.3 1.2 1.1 3.9 0.1 2.7 2.4 0.7 0.1 0.8 1.5 1.1 .. 0.7Apr 0.9 −0.8 1.1 1.0 2.9 −0.1 2.3 2.1 −1.3 −0.7 −0.2 0.8 0.6 .. 0.3May 0.2 −1.6 0.9 1.1 3.4 −0.6 1.8 2.1 −1.4 −0.9 0.1 0.5 0.5 .. 0.1Jun 0.9 −0.4 1.0 1.7 3.8 0.2 2.2 1.8 −0.8 −0.3 0.9 0.6 0.7 .. 0.3
Jul 0.9 0.1 0.7 1.6 3.7 −0.1 2.5 1.8 −0.3 −0.7 0.7 1.0 0.8 .. 0.4Aug 1.2 −0.2 0.7 0.3 3.7 −0.2 2.5 1.4 −0.7 −0.6 1.0 0.2 0.4 .. −0.2Sep 0.6 −0.3 0.5 1.0 3.8 −0.8 2.1 1.4 −0.7 −0.6 0.6 0.5 0.2 .. −0.3Oct 0.5 −0.4 0.6 1.2 3.8 −0.6 1.8 1.6 −0.5 −0.9 0.4 0.7 0.2 .. −0.3Nov 0.4 −0.7 0.2 0.7 3.7 −0.4 1.7 1.6 −1.1 −0.8 0.2 0.3 0.2 .. −0.3Dec −0.1 −0.3 0.2 0.9 .. −0.3 .. 1.6 −1.2 −0.6 .. 0.6 .. .. −0.3
Key: - zero or negligible .. Not available1 Published as the CPI in the UK.2 Aggregate for European Union with 27 Member States.
Following user requests, on 10 Apr il 2018 Eurostat began to publish in itsdatabase an aggregate for the EU with 27 Member States for around 50most in-demand indicators, such as population, GDP growth rate and un-employment.
3 Data for the for mer EU28 aggregate.For reference periods Febr uary 2020 or later, Eurostat no longer calculatesor publishes the for mer EU 28 aggregate. This means that the final time pe-riods for which the EU28 aggregate is published are Januar y 2020, four thquar ter 2019 or the year 2019 depending on the frequency of the dataset.Eurostat will maintain historic data for EU28 in the database and will updateas revisions are received.
4 The coverage of the Monetary Union Indices of Consumer Prices (MUICP) wasextended to include Greece with effect from Jan 2001 and Slovakia from Jan2009.
5 Following the end of the transition period, we have ceased to publish the Har-monised Index of Consumer Prices (HICP) international comparisons for EUcountr ies in this table. The international comparisons will continue to be avail-able on the Eurostat website. https://ec.europa.eu/eurostat/web/main/da-ta/database
Sources: Office for National Statistics;Eurostat

17 status RPIIN publication CPNE Thu Aug 12 09:00:12 2021
H RPI: Detailed figures for various groups, sub-groups and sections1,2,3
Percentagechange over
Weights6 Index (Januar y 1987=100) Percentage change over 12 months 1 month
2021 2021 2021 2021 2021 2021 2021 2021 2021 2021 2021 2021 2021 2021Feb Mar Apr May Jun Jul Feb Mar Apr May Jun Jul Jul
and depreciationALL ITEMS 1 000 296.0 296.9 301.1 301.9 304.0 305.5 1.4 1.5 2.9 3.3 3.9 3.8 0.5
Food and catering 157 257.3 256.1 258.5 258.1 259.0 258.5 0.2 −0.7 0.1 −0.4 0.3 0.2 −0.2Alcohol and tobacco 75 421.4 421.6 424.9 425.0 426.6 426.4 1.7 1.4 2.1 2.0 2.5 1.5 −Housing and household expenditure 440 334.3 334.9 340.3 340.7 342.7 343.6 1.8 2.0 3.5 3.7 4.1 4.2 0.3Personal expenditure 72 224.3 227.9 232.4 236.8 237.5 235.9 1.1 2.3 5.4 6.9 6.7 5.7 −0.7Tr avel and leisure 256 264.6 266.3 270.2 271.1 274.9 279.5 1.3 1.6 3.2 4.2 5.2 5.4 1.7
Consumer durables 94 145.8 148.0 149.3 152.7 154.4 152.6 3.2 4.2 6.2 7.9 7.8 7.2 −1.2
Seasonal food 20 203.3 201.2 202.8 202.9 202.2 201.2 −2.6 −2.2 −1.9 −1.8 −2.0 −1.1 −0.5Food excluding seasonal 94 227.8 226.4 228.8 227.9 228.6 228.1 0.0 −1.5 0.1 −1.0 −0.3 −0.4 −0.2All items excluding seasonal food 980 298.2 299.2 303.5 304.3 306.6 308.1 1.4 1.5 3.0 3.4 4.0 3.9 0.5All items excluding food 886 307.9 309.3 313.8 314.8 317.3 319.1 1.6 1.8 3.3 3.8 4.4 4.3 0.6All goods 446 222.1 222.9 224.3 225.9 227.9 228.5 1.0 1.2 3.0 3.6 4.3 4.3 0.3All services 395 405.3 406.7 415.3 415.3 417.9 419.5 0.7 0.6 2.1 2.2 2.7 2.2 0.4
Other indicesAll items excluding:
mor tgage interest payments (RPIX) 976 297.2 298.1 302.5 303.3 305.5 306.9 1.6 1.6 3.2 3.4 3.9 3.9 0.5housing 723 275.6 276.7 280.8 281.9 284.3 285.2 0.8 0.9 2.7 3.1 3.7 3.5 0.3mor tgage interest payments
and council tax 931 293.6 294.6 298.5 299.3 301.7 303.1 1.5 1.6 3.1 3.3 4.0 3.9 0.5mor tgage interest payments
and depreciation2 886 286.3 287.3 291.5 292.5 294.6 295.6 1.0 1.1 2.6 3.0 3.5 3.3 0.3
Food 114 224.3 222.7 224.9 224.2 224.6 224.0 −0.4 −1.6 −0.3 −1.1 −0.6 −0.6 −0.3Bread 4 224.5 225.3 224.7 222.5 224.7 225.7 1.5 0.9 1.0 0.9 2.6 3.3 0.4Cereals 4 209.4 208.0 209.8 207.7 207.9 208.7 0.4 −4.0 −3.6 −2.6 −4.4 −4.1 0.4Biscuits and cakes 7 288.1 280.7 285.7 282.5 291.6 288.9 6.2 0.0 3.1 −0.8 5.9 2.2 −0.9Beef 4 202.5 204.0 202.2 204.5 205.1 206.1 −2.6 −2.7 −3.1 −1.1 −4.1 −2.2 0.5Lamb 1 327.6 321.9 331.5 336.1 339.3 334.0 2.1 −2.6 2.8 2.7 4.4 4.9 −1.6
of which home-killed lamb 1 359.0 352.9 363.4 368.4 371.9 366.1 2.0 −2.6 2.8 2.7 4.4 4.9 −1.6Pork 1 227.8 227.0 227.8 226.6 228.0 230.8 3.1 2.7 0.3 −0.3 −0.8 0.3 1.2Bacon 1 201.6 201.2 201.6 200.3 201.6 200.1 −4.2 −4.5 −4.4 −4.4 −4.0 −4.5 −0.7Poultr y 4 116.3 116.5 116.1 116.3 117.3 117.8 −1.9 −2.3 −3.0 −3.0 −2.2 −1.8 0.4Other meat 6 191.2 191.2 191.2 186.9 191.4 191.3 −2.0 −0.4 −1.7 −4.1 −1.4 −1.2 −0.1Fish 4 270.7 265.4 264.9 266.0 267.8 263.4 −1.3 −3.3 −2.9 −4.5 −3.9 −4.3 −1.6
of which fresh fish 2 262.4 253.4 264.1 254.4 256.5 260.6 −3.9 −8.3 −4.4 −6.9 −5.9 −3.6 1.6processed fish 2 274.9 273.3 261.9 273.4 275.1 262.4 1.1 1.6 −1.3 −2.1 −1.8 −5.0 −4.6
Butter 1 369.0 378.3 364.6 376.2 374.7 372.0 1.5 0.8 −4.0 1.1 2.2 −1.2 −0.7Oils and fats 2 212.0 199.1 208.8 207.9 216.4 218.8 7.1 −4.3 −4.1 −4.6 2.5 −2.7 1.1Cheese 4 236.2 232.8 232.6 235.7 232.5 226.3 −2.4 −3.7 −2.2 −1.7 −4.3 −5.2 −2.7Eggs 1 199.9 200.0 200.0 201.5 204.1 203.5 0.3 −0.8 0.3 −1.3 −0.4 −1.0 −0.3Milk, fresh 3 240.4 238.0 239.3 240.6 240.0 240.1 2.0 0.0 0.3 0.9 1.3 1.7 −Milk products 4 198.7 192.3 198.4 198.9 199.3 196.3 −0.3 −3.3 3.5 4.5 3.1 2.2 −1.5Tea 1 224.2 222.0 220.2 223.1 220.6 215.5 1.8 −3.0 −6.8 −5.7 −3.6 −8.9 −2.3Coffee and other hot drinks 2 166.4 179.5 174.1 177.0 170.7 179.9 −7.5 −3.8 −2.0 −4.3 −5.6 −5.3 5.4Soft drinks 9 279.4 278.0 280.4 277.2 276.5 274.4 −0.7 −0.5 0.9 −0.7 −1.7 −0.8 −0.8Sugar and preserves 1 182.4 183.8 187.8 187.2 188.9 185.8 −6.2 −6.9 −2.5 −6.8 −6.0 −6.7 −1.6Sweets and chocolates 14 294.7 296.3 303.2 301.6 299.9 298.9 −2.4 −2.0 0.4 −0.1 1.2 1.0 −0.3Potatoes 4 233.6 230.8 233.8 232.9 228.3 227.9 −0.6 1.4 0.2 −3.3 −0.3 −0.7 −0.2
of which unprocessed potatoes 1 180.5 181.4 181.0 181.4 181.3 178.8 −17.8 −14.5 −18.4 −17.0 −13.6 −13.8 −1.4potato products 3 238.1 233.9 238.1 236.7 230.6 231.1 5.5 7.0 7.0 1.4 4.2 3.8 0.2
Vegetables other than potatoes 9 175.0 174.7 176.1 176.9 176.4 176.0 −3.4 −2.4 −3.8 −3.5 −3.2 −2.8 −0.2of which fresh vegetables 7 153.1 152.1 153.0 153.6 152.8 152.3 −3.0 −2.5 −3.3 −3.2 −3.0 −2.7 −0.3
processed vegetables 2 249.4 252.9 256.5 258.7 259.9 260.6 −4.4 −2.0 −5.0 −4.3 −3.5 −2.3 0.3Fr uit 10 231.0 228.2 228.8 229.7 228.3 227.1 −0.7 1.1 1.3 1.5 0.3 2.1 −0.5
of which fresh fruit 8 220.2 217.8 218.0 218.8 216.9 215.2 −0.9 1.3 1.5 2.1 0.5 2.2 −0.8processed fruit 2 289.4 283.8 287.4 288.5 290.0 291.3 −0.3 0.3 0.7 −0.6 0.0 1.8 0.4
Other foods 13 197.8 194.8 199.4 196.6 196.9 197.8 1.7 −4.0 1.3 −0.7 −1.7 −0.5 0.5
Catering 43 369.3 370.0 372.9 374.1 376.8 376.6 1.4 1.5 0.9 1.2 2.4 2.1 −0.1Restaurant meals 24 358.0 359.0 363.2 365.4 369.4 368.7 0.4 0.7 0.8 1.2 3.6 3.1 −0.2Canteen meals 2 397.2 397.6 397.9 399.5 402.9 400.9 −1.4 −1.4 −2.3 −2.1 −1.4 −2.5 −0.5Take-aways and snacks 17 368.2 368.7 369.6 369.2 370.2 370.6 3.4 3.3 1.7 1.8 1.5 1.4 0.1
Alcoholic drink 54 308.7 308.9 312.1 312.8 314.0 313.5 0.4 0.7 1.7 1.7 2.2 0.8 −0.2Beer 21 334.5 334.8 338.0 338.0 337.4 336.6 1.1 1.2 2.5 2.5 2.2 0.5 −0.2
on sales 14 380.5 381.5 386.0 386.2 386.2 386.1 1.8 2.0 3.5 3.6 3.5 1.8 −off sales 7 172.0 171.7 172.5 172.2 171.3 170.1 −1.1 −0.9 0.2 −0.4 −0.9 −2.4 −0.7
Wines and spirits 33 274.4 274.5 277.6 278.5 280.7 280.3 0.0 0.4 1.2 1.2 2.2 1.0 −0.1on sales 15 375.7 376.7 381.2 382.2 383.2 389.5 0.0 0.0 1.5 1.8 1.9 1.9 1.6off sales 18 203.7 203.5 205.6 206.4 208.9 205.5 0.2 1.4 1.3 0.8 2.8 0.9 −1.6
Key: - zero or negligible Index date for July: 13 July 2021 Source: Office for National Statistics

18 status RPIIN publication CPNE Thu Aug 12 09:00:13 2021
H RPI: Detailed figures for various groups, sub-groups and sections1,2,3
continued
Percentagechange over
Weights4 Index (Januar y 1987=100) Percentage change over 12 months 1 month
2021 2021 2021 2021 2021 2021 2021 2021 2021 2021 2021 2021 2021 2021Feb Mar Apr May Jun Jul Feb Mar Apr May Jun Jul Jul
Tobacco 21 832.4 832.0 832.8 829.1 831.4 834.1 5.5 3.4 3.2 3.0 3.4 3.2 0.3Cigarettes 17 857.5 856.9 857.9 853.7 855.7 858.7 5.9 3.8 3.2 2.5 2.7 2.7 0.4Other tobacco 4 622.9 623.4 623.2 621.5 624.6 625.9 3.8 2.0 3.2 4.9 6.6 5.9 0.2
Housing 277 403.5 403.7 409.0 408.3 410.1 413.3 3.0 3.0 3.6 3.8 4.3 4.7 0.8Rent 79 383.8 384.1 385.1 385.6 386.2 387.2 2.2 2.2 1.8 1.8 1.9 1.7 0.3Mor tgage interest payments 24 220.4 221.2 221.4 221.0 221.5 222.4 −7.0 −7.0 −6.5 −1.2 0.5 0.5 0.4Depreciation (Jan 1995 = 100) 90 431.3 431.1 437.2 434.2 438.2 446.6 7.8 7.8 8.8 7.8 8.6 9.9 1.9Council tax and rates 45 399.1 399.1 415.2 415.2 415.2 415.2 3.9 3.9 4.0 4.0 4.0 4.0 −Water and other charges 13 522.9 522.9 532.0 532.0 532.0 532.0 −3.2 −3.2 1.7 1.7 1.7 1.7 −Repairs and maintenance charges 9 385.5 385.5 385.7 385.8 386.4 387.3 0.3 0.2 0.6 0.3 0.4 0.6 0.2Do-it-yourself materials 10 247.6 248.8 249.4 252.9 256.3 259.4 1.1 1.1 1.8 2.2 4.5 5.7 1.2Dwelling insurance and ground rent 7 462.5 462.2 464.5 461.8 464.2 465.7 1.7 1.5 2.3 1.9 2.8 3.0 0.3
Fuel and light 35 336.6 336.9 366.1 366.5 366.8 367.1 −8.2 −7.3 3.1 3.4 3.0 3.1 0.1Coal and solid fuels 1 368.6 369.1 369.6 369.2 370.3 370.3 2.7 2.8 3.0 2.9 3.3 2.9 −Electr icity 19 366.3 366.3 399.7 399.7 399.7 400.2 −3.1 −3.1 5.5 5.5 5.5 5.8 0.1Gas 14 291.3 291.3 319.0 319.0 319.0 319.0 −15.7 −15.7 −4.3 −4.3 −4.3 −4.3 −Oil and other fuels 1 399.3 409.0 400.3 415.3 425.3 428.0 −6.5 10.2 28.8 39.3 28.5 28.6 0.6
Household goods 73 226.8 228.3 228.0 231.0 234.2 232.0 2.7 3.1 3.7 4.5 4.7 4.8 −0.9Fur niture 29 299.8 302.9 303.4 308.3 315.3 309.6 5.2 5.9 7.3 8.4 7.8 7.9 −1.8Fur nishings 8 270.1 271.4 268.9 271.4 275.3 274.1 5.8 6.0 7.1 7.1 7.1 7.1 −0.4Electr ical appliances 7 81.1 82.0 80.8 83.0 83.4 83.4 4.0 4.9 3.6 6.4 7.2 6.1 −Other household equipment 5 210.9 213.7 213.3 215.2 218.1 218.4 −0.8 0.4 2.7 2.1 2.2 1.4 0.1Household consumables 13 209.4 208.4 208.7 209.7 212.3 209.3 −2.5 −2.7 −3.3 −3.3 −1.6 −1.6 −1.4Pet care 11 253.3 254.8 255.0 257.9 256.8 258.1 0.0 0.4 −0.2 0.9 1.7 2.4 0.5
Household services 55 308.3 309.4 312.9 312.1 314.4 312.6 2.1 1.9 3.1 2.6 3.2 2.2 −0.6Postage 1 488.8 488.8 488.8 488.8 488.8 488.8 11.5 11.5 5.8 5.8 5.8 5.8 −Telephones, telemessages, etc 24 118.3 119.0 121.8 120.8 122.2 120.1 1.7 1.2 4.0 2.4 3.1 0.9 −1.7Domestic services 11 446.2 446.9 449.1 450.5 453.1 454.1 2.6 2.5 3.2 3.3 3.7 3.3 0.2Fees and subscriptions 19 517.1 517.7 518.0 519.0 520.6 522.9 1.7 1.8 1.6 2.3 2.9 3.2 0.4
Clothing and footwear 33 186.8 192.7 199.9 206.3 207.7 204.3 0.4 3.0 8.3 10.7 10.9 9.7 −1.6Men’s outerwear 6 198.8 201.3 208.8 212.5 215.6 214.8 2.1 3.4 9.8 12.6 10.8 10.4 −0.4Women’s outerwear 12 157.1 165.6 175.6 184.8 186.4 181.3 −1.1 3.2 11.6 14.2 15.3 14.7 −2.7Children’s outerwear 4 197.7 197.6 202.5 209.6 209.1 205.2 3.3 5.0 8.3 12.3 12.0 9.0 −1.9Other clothing 5 243.9 249.0 249.6 252.1 252.0 248.9 4.3 6.2 4.7 4.5 4.0 2.7 −1.2Footwear 6 154.5 160.1 164.7 167.6 168.9 168.0 −2.3 −0.4 4.4 6.1 7.5 5.9 −0.5
Personal goods and services 39 300.4 301.4 302.6 305.0 304.5 305.2 1.7 1.9 2.9 3.7 3.2 2.3 0.2Personal articles 10 210.2 212.4 212.6 216.2 217.5 215.8 −0.7 0.6 3.7 5.5 4.1 3.3 −0.8Chemists goods 16 230.0 230.1 229.5 231.1 229.2 230.8 0.0 −0.3 −0.3 0.3 0.0 1.0 0.7Personal services 13 579.4 579.9 588.5 589.2 589.8 592.4 4.8 4.7 5.8 5.9 5.9 3.2 0.4
Motoring expenditure 122 262.3 264.1 265.2 267.6 273.0 279.6 −0.8 −0.3 2.6 4.4 6.3 8.4 2.4Purchase of motor vehicles 56 99.9 99.6 99.7 100.3 102.7 106.7 3.7 2.6 1.7 1.9 4.5 8.9 3.9Maintenance of motor vehicles 15 472.9 473.9 473.6 479.4 480.8 486.7 2.3 1.7 1.3 2.9 3.3 5.2 1.2Petrol and oil 28 354.7 364.2 368.1 371.4 379.7 387.4 −2.6 3.0 13.8 18.5 20.1 17.6 2.0Vehicle tax and insurance 23 855.8 864.3 870.1 882.5 900.1 900.7 −5.5 −7.6 −6.3 −4.9 −3.1 −0.8 0.1
Fares and other travel costs 25 415.3 426.1 462.5 446.5 459.3 478.2 4.6 5.7 6.2 6.1 6.3 5.4 4.1Rail fares 6 441.2 446.7 459.5 443.9 452.5 446.0 0.5 2.8 3.4 2.7 3.1 2.9 −1.4Bus and coach fares 3 595.7 596.2 603.1 584.2 577.4 582.3 17.4 20.8 21.3 17.5 16.1 8.9 0.8Other travel costs 16 349.3 361.7 404.8 390.5 405.3 431.4 3.8 4.0 4.2 4.7 5.0 4.5 6.4
Leisure goods 29 99.3 99.6 98.4 99.8 100.1 100.0 4.6 3.9 3.3 4.7 4.6 3.8 −0.1Audio-visual equipment 6 6.9 6.8 6.7 6.9 6.9 6.9 6.2 3.0 1.5 3.0 3.0 3.0 −CDs and tapes 1 129.6 124.8 126.5 129.1 134.8 128.2 −1.1 2.5 −5.3 1.3 3.9 0.7 −4.9To ys, photographic and sports goods 10 98.9 99.8 97.7 99.6 98.4 98.5 6.7 5.8 2.2 4.5 3.4 2.1 0.1Books and newspapers 5 492.7 490.8 492.6 499.0 512.5 508.0 0.9 −1.4 6.9 7.8 9.3 6.8 −0.9Gardening products 7 201.8 204.9 202.4 202.8 202.0 204.5 4.8 5.6 5.3 5.2 4.4 6.5 1.2
Leisure services 80 445.0 445.7 452.8 454.8 456.7 458.0 1.9 2.1 3.3 3.5 3.8 2.4 0.3Television licences and rentals 14 230.3 230.3 234.9 234.9 234.9 234.9 3.0 3.0 2.0 2.0 2.0 2.0 −Enter tainment and other recreation 14 605.2 606.1 619.6 621.4 623.6 627.9 0.5 0.5 2.2 1.7 1.6 1.8 0.7Foreign holidays (Jan 1993 = 100) 42 291.0 291.7 295.2 296.2 298.1 299.2 1.9 2.2 3.7 4.1 4.6 2.3 0.4UK holidays (Jan 1994 = 100) 10 271.6 271.5 276.3 281.1 281.8 280.8 2.6 2.8 4.3 5.0 5.7 4.0 −0.4
Key: - zero or negligible1 An error was identified in the dataset underpinning the 2019 RPI weights
covering the period Febr uary to June 2019. In line with the consumer priceinflation statistics revision policy RPI was not revised. The correctedweights have been used for the July 2019 RPI onwards. Users should notethere is a discontinuity between June’s and July’s index lev els, which havebeen calculated using differ ing weights.
2 The Retail Prices Index and its derivatives do not meet the required stan-dards for designation as National Statistics. A full report can be found athttp://www.statisticsauthor ity.gov.uk.
3 As a direct result of the reduced availibilty of products due to the coronavir us(COVID-19) pandemic, some series are based on less than half of the numberof price quotes used in Febr urar y 2020 (the most recent ’normal’ collection). Toidentify which series are affected, please the latest Consumer price inflation ta-bles which can be found here: https://www.ons.gov.uk/economy/inflationandpr i-ceindices/datasets/consumer pr iceinflation, which includes notation to reflectthe reduced coverage.
Source: Office for National Statistics

19 status RPIIN publication CPNE Thu Aug 12 09:00:15 2021
I RPI goods and services1,7: the latest three yearsPercentage chang e over 12 months
Goods components Ser vices components
Alcohol & Other All "Shop" "Non-shop" AllFood tobacco Petrol & oil2 goods3 goods Rent Utilities4 ser vices5 ser vices6 ser vices
Weights8
CZGZ CBVW DOHB DOHC DOHD CZXD DOHE DOHF DOHG DOHH2021 114 75 29 228 446 79 77 119 120 395
MonthlyCCYY CZBK DOGQ DOGI DOGD CZCQ DOGF DOGG DOGH DOGE
2018 Jul 2.3 3.2 13.4 2.7 3.6 0.8 3.9 2.8 3.7 2.9Aug 2.4 3.5 12.5 2.9 3.7 0.8 3.6 3.1 4.1 3.1Sep 1.4 3.4 11.6 2.5 3.2 0.9 4.7 2.9 4.4 3.3Oct 0.5 3.2 12.7 2.6 3.1 1.0 5.1 3.0 4.2 3.4Nov 0.4 4.3 10.2 2.6 3.1 1.0 5.1 2.9 3.3 3.1Dec 0.6 3.5 4.2 2.6 2.5 1.1 5.5 2.8 2.2 2.8
2019 Jan 0.9 3.4 1.9 2.6 2.3 1.0 2.7 2.8 3.4 2.7Feb 1.6 3.8 0.3 2.4 2.3 1.0 2.9 2.7 3.6 2.7Mar 1.2 3.9 3.0 2.2 2.3 1.1 2.8 2.7 3.6 2.7Apr 0.8 3.2 3.6 1.7 1.9 1.2 7.7 2.9 6.3 4.5May 1.1 2.8 3.8 1.8 2.0 1.3 7.6 2.9 5.3 4.2Jun 1.5 2.9 0.7 2.0 2.0 1.3 6.6 2.9 5.0 4.0
Jul 1.3 3.1 −0.1 2.5 2.2 1.1 5.1 3.0 4.4 3.5Aug 1.9 2.9 −0.1 2.0 2.0 1.1 5.0 2.7 5.2 3.7Sep 1.5 2.8 −1.9 2.1 1.8 1.1 4.4 3.0 3.9 3.2Oct 1.5 3.1 −2.8 1.8 1.6 1.1 1.1 2.9 4.7 2.8Nov 2.1 2.2 −3.5 2.1 1.6 1.2 1.0 3.0 5.5 3.1Dec 1.6 1.7 0.4 2.1 1.7 1.2 1.5 3.0 4.1 2.7
2020 Jan 1.4 1.9 4.3 2.0 2.0 1.2 4.2 3.1 5.2 3.6Feb 0.7 1.5 1.5 1.9 1.4 1.2 4.3 3.3 5.2 3.7Mar 1.2 1.9 −3.0 2.1 1.3 1.2 4.5 3.3 6.4 4.1Apr 1.2 1.9 −13.2 2.1 0.4 1.7 −2.0 3.2 4.5 2.3May 1.6 1.8 −18.7 2.0 − 1.7 −2.1 3.2 4.1 2.2Jun 1.2 1.5 −17.7 2.7 0.1 1.7 −2.1 2.8 3.8 2.0
Jul 0.8 2.5 −12.7 3.3 1.0 2.1 −1.8 3.1 4.1 2.2Aug 0.4 2.0 −12.6 2.9 0.6 2.2 −1.8 −1.0 1.2 −Sep − 1.9 −12.2 3.0 0.6 2.2 −2.1 1.9 3.0 1.5Oct 0.6 1.7 −11.9 3.9 1.1 2.2 −3.0 2.1 2.3 1.2Nov −0.6 1.5 −11.6 2.3 0.1 2.1 −2.8 1.6 2.2 1.1Dec −1.2 2.2 −9.6 2.9 0.6 2.1 −3.1 2.1 2.3 1.1
2021 Jan −0.6 2.0 −9.6 3.5 1.1 2.2 −3.5 2.1 1.7 0.9Feb −0.4 1.7 −2.9 2.2 1.0 2.2 −3.6 2.0 1.1 0.7Mar −1.6 1.4 3.4 2.4 1.2 2.2 −3.5 1.9 0.9 0.6Apr −0.3 2.1 14.7 3.3 3.0 1.8 2.5 2.0 2.1 2.1May −1.1 2.0 19.6 4.4 3.6 1.8 2.0 2.2 2.5 2.2Jun −0.6 2.5 20.6 5.0 4.3 1.9 2.3 2.8 3.3 2.7
Jul −0.6 1.5 18.3 5.9 4.3 1.7 1.7 2.5 2.6 2.2
Key: - zero or negligible
1 All components of the RPI are included in the above breakdown with theexception of mortgage interest payments, council tax and depreciation.
2 Including fuel oil.
3 The ’other goods’ category compr ises DIY materials, coal & solid fuels,household goods, clothing & footwear, personal articles, chemists goods,purchase of motor vehicles and leisure goods.
4 The ’utilities’ category compr ises water, electr icity, gas, postage, telephonecharges and rail fares.
5 The ’shop services’ category compr ises cater ing, repairs & maintenancecharges, domestic services, personal services, maintenance of motor vehi-cles, TV licence & rentals and entertainment & recreation charges.
6 The ’non-shop services’ category compr ises dwelling insurance & groundrent, fees and subscriptions, vehicle tax and insurance, bus & coach fares,other travel costs, foreign holidays and UK holidays.
7 The Retail Prices Index and its derivatives do not meet the required stan-dards for designation as National Statistics. A full report can be found at:http//www.statisticsauthor ity.gov.uk/.
8 An error was identified in the dataset underpinning the 2019 RPI weights cov-er ing the period Febr uary to June 2019. In line with the consumer price infla-tion statistics revision policy RPI was not revised. The corrected weights havebeen used for the July 2019 RPI onwards. Users should note there is a dis-continuity between June’s and July’s index lev els, which have been calculatedusing differ ing weights.
Source: Office for National Statistics