Consumer price inflation, UK: December 2016
23
Page 1 of 17 Next release: 14 February 2017 Release date: 17 January 2017 Contact: James Tucker [email protected] Consumer Price Inflation Enquiries: +44 (0)1633 456900 Consumer Price Inflation recorded message (available after 9.45am on release day): Telephone: + 44 (0)800 0113703 Statistical bulletin Consumer price inflation, UK: December 2016 Price indices, percentage changes and weights for the different measures of consumer price inflation. Table of contents 1. Main points 2. Introduction of an inflation “theme day” 3. A brief description of consumer price inflation 4. Consumer Prices Index (CPI) 5. CPIH 6. Retail Prices Index (RPI) and RPIJ 7. Guide to data 8. Quality and methodology 9. Background notes
Transcript of Consumer price inflation, UK: December 2016

Page 1 of 17
Next release: 14 February 2017
Release date: 17 January 2017
Contact: James Tucker [email protected] Consumer Price Inflation Enquiries: +44 (0)1633 456900 Consumer Price Inflation recorded message (available after 9.45am on release day): Telephone: + 44 (0)800 0113703
Statistical bulletin
Consumer price inflation, UK: December 2016
Price indices, percentage changes and weights for the different measures of consumer price inflation.
Table of contents
1. Main points
2. Introduction of an inflation “theme day”
3. A brief description of consumer price inflation
4. Consumer Prices Index (CPI)
5. CPIH
6. Retail Prices Index (RPI) and RPIJ
7. Guide to data
8. Quality and methodology
9. Background notes
Page 2 of 17
1 . Main points
The Consumer Prices Index (CPI) rose by 1.6% in the year to December 2016, compared with a 1.2% rise in the year to November.
The rate in December was the highest since July 2014, when it was also 1.6%.
Price movements for the majority of the broad groups of goods and services acted to increase the rate between November 2016 and December 2016.
The main contributors to the increase in the rate were rises in air fares and the price of food, along with prices for motor fuels, which fell by less than they did a year ago.
CPIH (not a National Statistic) rose by 1.7% in the year to December 2016, up from 1.4% in November.
2 . Introduction of an inflation “theme day”
We are improving the way we publish economic statistics, with related data grouped together under new “theme days”. This increases the coherence of our data releases and results in some minor changes to publication
. Today is the first inflation theme day and we have introduced a of the schedules monthly economic analysislatest inflation statistics and long-term trends.
3 . A brief description of consumer price inflation
Consumer price inflation is the rate at which the prices of goods and services bought by households rise or fall. It is estimated by using price indices. A way to understand this is to think of a very large shopping basket containing all the goods and services bought by households. Movements in price indices represent the changing cost of this basket. An explains how consumer price inflation is calculated, and infographic Consumer price indices – a brief
gives an overview of the indices and their uses. Consumer price indices are published monthly.guide
A price index can be used to measure inflation in a number of ways. The most common is to look at how the index has changed over a year. This is calculated by comparing the price index for the latest month with the same month a year ago. This is known as the 12-month inflation rate. This bulletin measures inflation to December 2016, so the 12-month rate measures changes in prices between December 2015 and December 2016.
A range of measures of consumer price and other price inflation are published. A tale of many price indicessummarises information on the different measures.
4 . Consumer Prices Index (CPI)
What is the CPI?
The CPI is a measure of consumer price inflation produced to international standards and in line with European regulations. First published in 1997 as the Harmonised Index of Consumer Prices (HICP), the CPI is the inflation measure used in the government’s target for inflation.
Page 3 of 17
The CPI is also used for purposes such as uprating pensions, wages and benefits and can aid in the understanding of inflation on family budgets. For more information see Users and uses of consumer price inflation
.statistics
Latest figure and long-term trend
The CPI 12-month rate (the amount prices change over a year) between December 2015 and December 2016 stood at 1.6%. This means that a basket of goods and services that cost £100.00 in December 2015 would have cost £101.60 in December 2016.
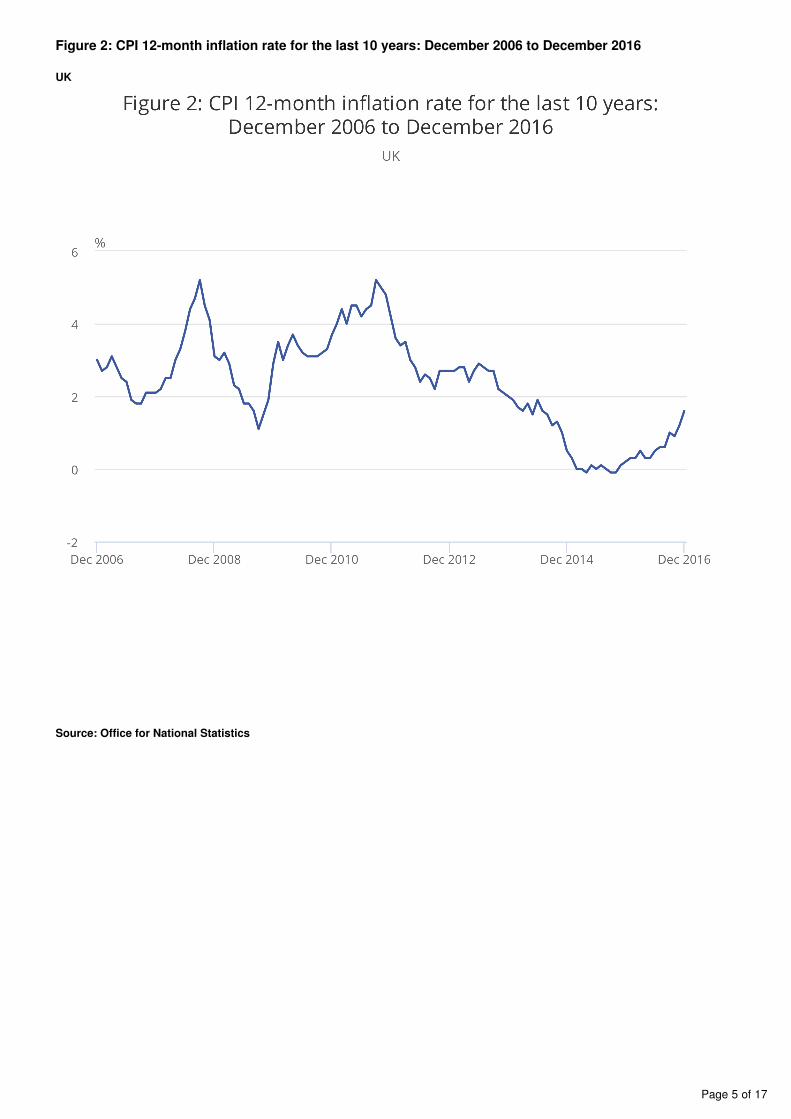
The December rate of 1.6% is an increase on the November figure and is the highest since July 2014 when it was also 1.6%. At that time, the rate began to fall, subsequently remaining at or around zero for much of 2015 before gradually picking up from the end of the year and throughout 2016.
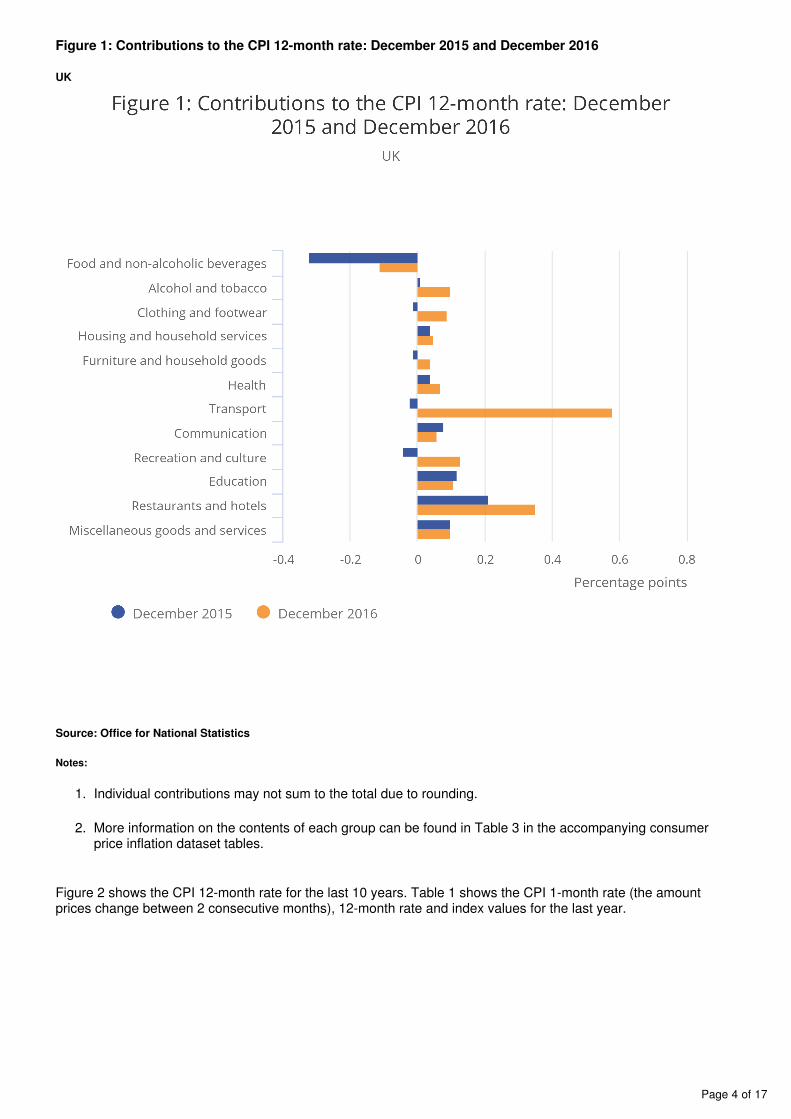
The largest downward pull on inflation in December 2016 and for 2016 to date comes from prices for food and non-alcoholic beverages, although this has lessened in recent months. November 2016 was the first time since mid-2014 that all non-food categories had an upward effect on inflation and this has continued in December 2016. Transport prices created a downward pressure during 2015 and early 2016 but have since become the largest upward pressure.
Prices economic commentary: Jan 2017 also published today, presents further analysis of the latest CPI, PPI, HPI and IPHRP results and emerging trends.
Figure 1 shows the contributions to the CPI 12-month rate in December 2016 compared with the contributions to the 12-month rate a year earlier.
Page 4 of 17
1.
2.
Figure 1: Contributions to the CPI 12-month rate: December 2015 and December 2016
UK
Source: Office for National Statistics
Notes:
Individual contributions may not sum to the total due to rounding.
More information on the contents of each group can be found in Table 3 in the accompanying consumer price inflation dataset tables.
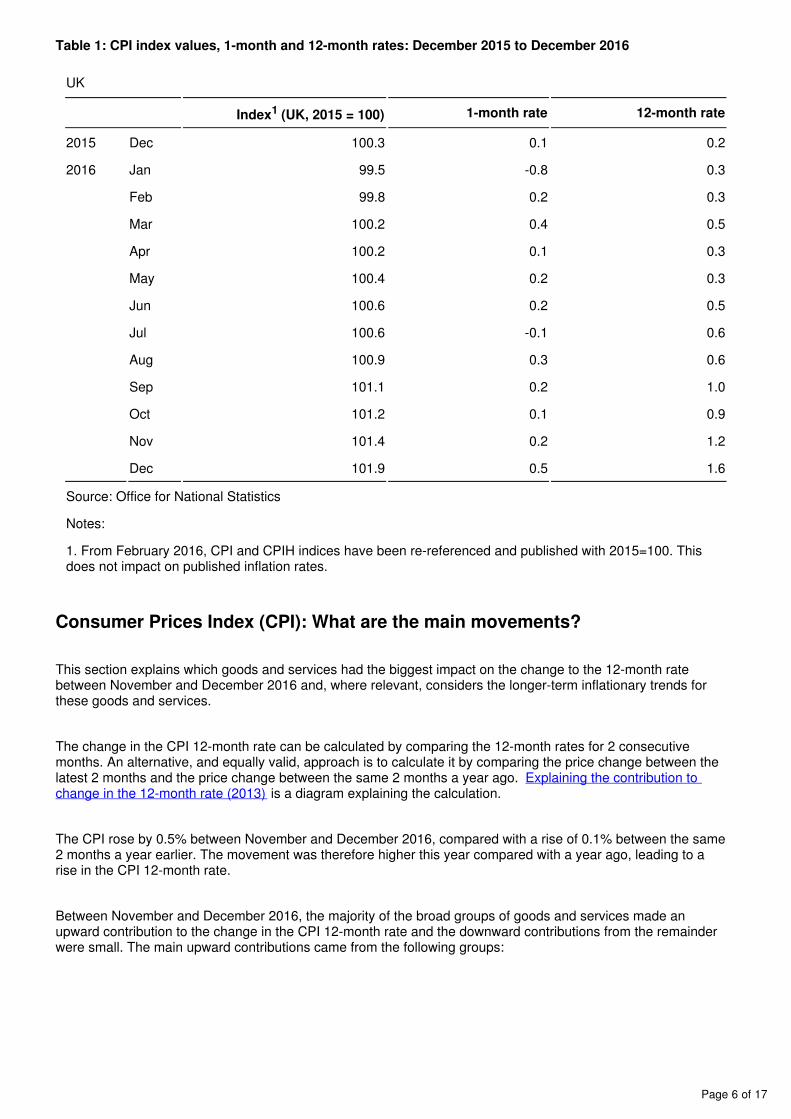
Figure 2 shows the CPI 12-month rate for the last 10 years. Table 1 shows the CPI 1-month rate (the amount prices change between 2 consecutive months), 12-month rate and index values for the last year.
Page 5 of 17
Figure 2: CPI 12-month inflation rate for the last 10 years: December 2006 to December 2016
UK
Source: Office for National Statistics
Page 6 of 17
Table 1: CPI index values, 1-month and 12-month rates: December 2015 to December 2016
UK
Index (UK, 2015 = 100)1 1-month rate 12-month rate
2015 Dec 100.3 0.1 0.2
2016 Jan 99.5 -0.8 0.3
Feb 99.8 0.2 0.3
Mar 100.2 0.4 0.5
Apr 100.2 0.1 0.3
May 100.4 0.2 0.3
Jun 100.6 0.2 0.5
Jul 100.6 -0.1 0.6
Aug 100.9 0.3 0.6
Sep 101.1 0.2 1.0
Oct 101.2 0.1 0.9
Nov 101.4 0.2 1.2
Dec 101.9 0.5 1.6
Source: Office for National Statistics
Notes:
1. From February 2016, CPI and CPIH indices have been re-referenced and published with 2015=100. This does not impact on published inflation rates.
Consumer Prices Index (CPI): What are the main movements?
This section explains which goods and services had the biggest impact on the change to the 12-month rate between November and December 2016 and, where relevant, considers the longer-term inflationary trends for these goods and services.
The change in the CPI 12-month rate can be calculated by comparing the 12-month rates for 2 consecutive months. An alternative, and equally valid, approach is to calculate it by comparing the price change between the latest 2 months and the price change between the same 2 months a year ago. Explaining the contribution to
is a diagram explaining the calculation.change in the 12-month rate (2013)
The CPI rose by 0.5% between November and December 2016, compared with a rise of 0.1% between the same 2 months a year earlier. The movement was therefore higher this year compared with a year ago, leading to a rise in the CPI 12-month rate.
Between November and December 2016, the majority of the broad groups of goods and services made an upward contribution to the change in the CPI 12-month rate and the downward contributions from the remainder were small. The main upward contributions came from the following groups:
Page 7 of 17
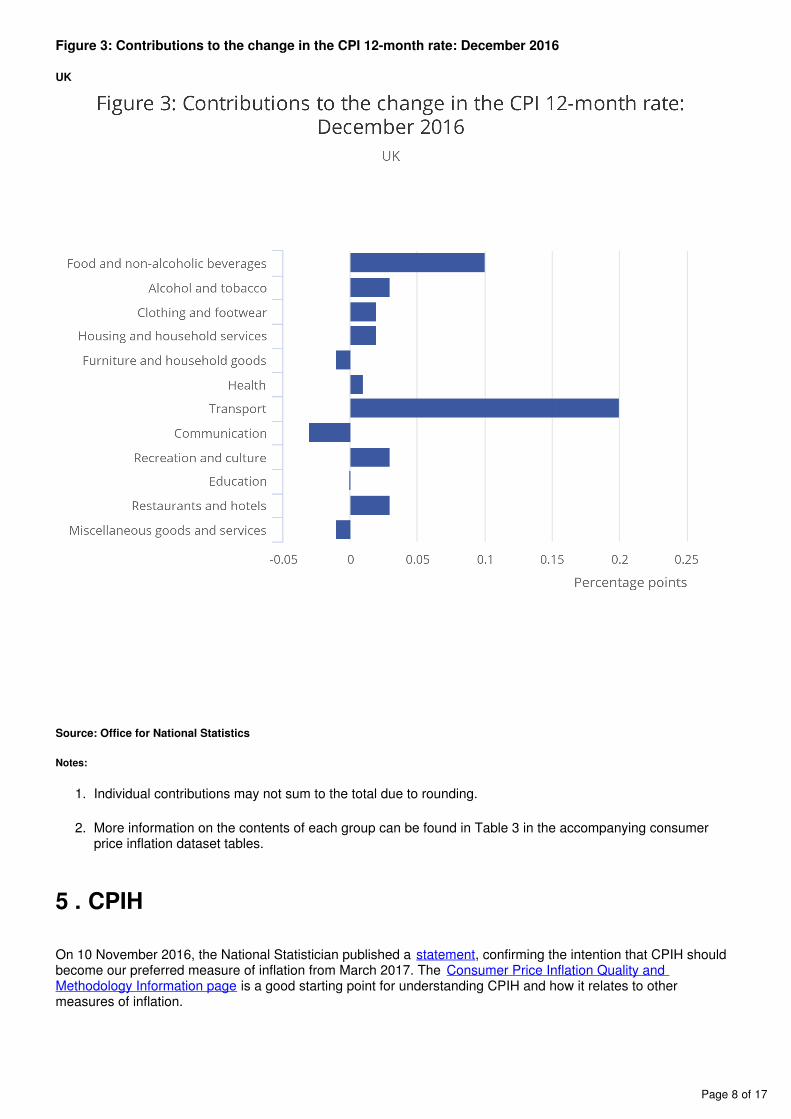
Transport: prices, overall, rose by 2.9% between November and December 2016, compared with a rise of 1.8% a year ago. Within transport, the largest upward effect came from air fares, with prices rising by 49% between November and December 2016, compared with a smaller rise of 46% a year earlier. Although this year’s December rise was similar to that seen in 2015, the fact that air fares have a higher weight in the index in 2016 amplified the contribution to the change in the overall rate. Prices for motor fuels also had a large upward effect. This continues the pattern seen in recent months, reflecting movements in oil prices, which have increased overall during 2016. Although fuel prices fell slightly (by 0.4%) between November and December 2016, they fell by more (2.8%) between the same 2 months a year ago. presents Prices economic commentary: Jan 2017further analysis.
Food and non-alcoholic beverages: prices, overall, increased by 0.8% between November and December 2016, having fallen by 0.2% last year. The upward effect came mainly from food (in particular vegetables), with prices increasing by 0.8%, having been unchanged a year ago. It is important to note that last year’s result was unusual; prior to this food prices had increased in every December since 2002. The increase in December 2016 is more typical of the movement generally seen at this time of year. We have seen consistent deflation of food prices for some time, with the 12-month rate having been negative since mid-2014 and often being lower than negative 3.0%. Although it is still negative, the rate is at its highest since July 2014 and has increased for 3 consecutive months. presents further analysis, including the relationship with the Prices economic commentary: Jan 2017prices of goods bought and sold by manufacturers.
Figure 3 shows the contributions to change from each part of the CPI basket of goods and services.
Page 8 of 17
1.
2.
Figure 3: Contributions to the change in the CPI 12-month rate: December 2016
UK
Source: Office for National Statistics
Notes:
Individual contributions may not sum to the total due to rounding.
More information on the contents of each group can be found in Table 3 in the accompanying consumer price inflation dataset tables.
5 . CPIH
On 10 November 2016, the National Statistician published a , confirming the intention that CPIH should statementbecome our preferred measure of inflation from March 2017. The Consumer Price Inflation Quality and
is a good starting point for understanding CPIH and how it relates to other Methodology Information pagemeasures of inflation.
Page 9 of 17
CPIH has been re-assessed to evaluate the extent to which it meets the professional standards set out in the Code of Practice for Official Statistics and the published on 3 March 2016. The report includes assessment reporta number of requirements that need to be implemented for CPIH to regain its status as a National Statistic. The actions taken to address these requirements were reported to the UK Statistics Authority at the end of September 2016, and a range of articles were published on 28 October 2016.
CPIH is a measure of UK consumer price inflation that includes owner occupiers’ housing costs (OOH). These are the costs of housing services associated with owning, maintaining and living in one’s own home. OOH does not include costs such as utility bills, minor repairs and maintenance, which are already included in the index. The
provides further information, including the rationale for the choice of methodology for CPIH compendiummeasuring OOH, which is still extensively debated. We also publish data for alternative measures of OOH on a quarterly basis alongside the article Understanding the different approaches of measuring owner occupiers'
.housing costs
CPIH uses an approach called rental equivalence to measure OOH. Rental equivalence uses the rent paid for an equivalent house as a proxy for the costs faced by an owner occupier. In other words, this answers the question “how much would I have to pay in rent to live in a home like mine?” for an owner occupier. OOH does not seek to capture increases in house prices. Although this may be inconsistent with some users’ expectations of measures of OOH, the inclusion of an asset price and therefore capital gains would make the index less suitable as a measure of consumption. OOH currently accounts for 16.5% of the expenditure weight of CPIH. This compares with a weight of 19.5% in 2005.
Currently, the method of calculation, the population coverage, the basket of goods and services and the method of deriving the weights are the same as for the Consumer Prices Index (CPI), with the exception of OOH. A full description of how CPIH is compiled is given in the and the Consumer Price Indices Technical Manual CPIH
.compendium
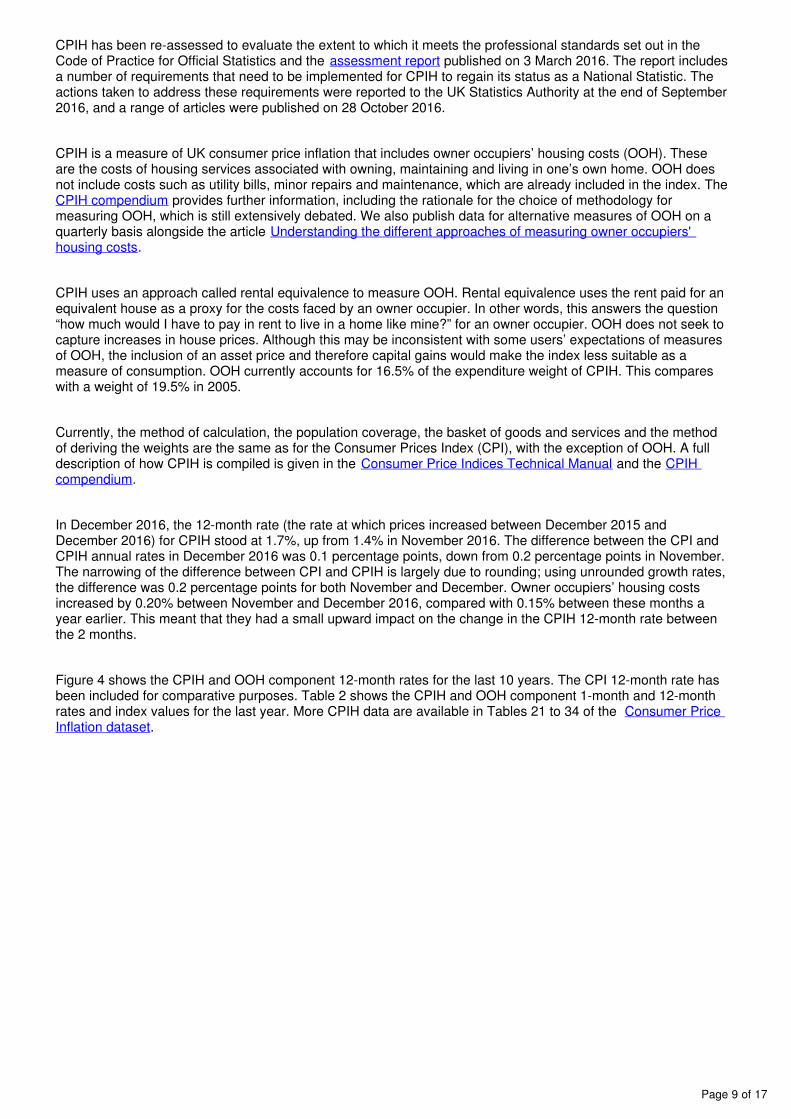
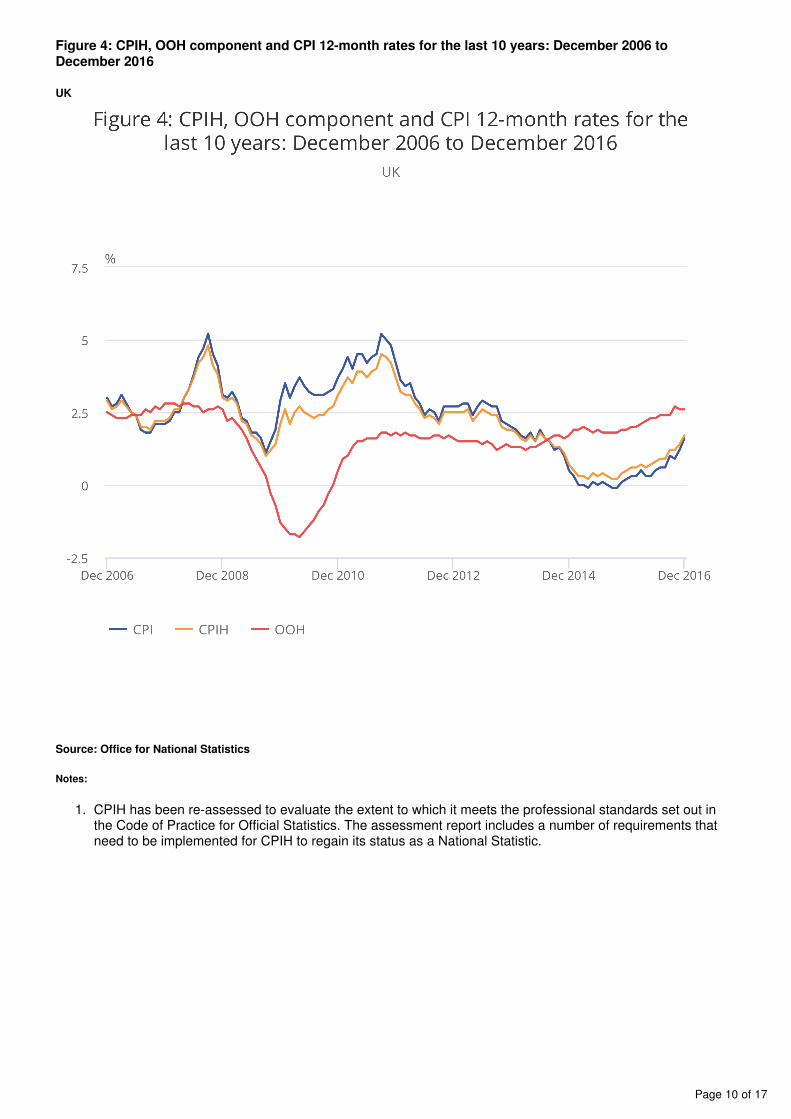
In December 2016, the 12-month rate (the rate at which prices increased between December 2015 and December 2016) for CPIH stood at 1.7%, up from 1.4% in November 2016. The difference between the CPI and CPIH annual rates in December 2016 was 0.1 percentage points, down from 0.2 percentage points in November. The narrowing of the difference between CPI and CPIH is largely due to rounding; using unrounded growth rates, the difference was 0.2 percentage points for both November and December. Owner occupiers’ housing costs increased by 0.20% between November and December 2016, compared with 0.15% between these months a year earlier. This meant that they had a small upward impact on the change in the CPIH 12-month rate between the 2 months.
Figure 4 shows the CPIH and OOH component 12-month rates for the last 10 years. The CPI 12-month rate has been included for comparative purposes. Table 2 shows the CPIH and OOH component 1-month and 12-month rates and index values for the last year. More CPIH data are available in Tables 21 to 34 of the Consumer Price
.Inflation dataset
Page 10 of 17
1.
Figure 4: CPIH, OOH component and CPI 12-month rates for the last 10 years: December 2006 to December 2016
UK
Source: Office for National Statistics
Notes:
CPIH has been re-assessed to evaluate the extent to which it meets the professional standards set out in the Code of Practice for Official Statistics. The assessment report includes a number of requirements that need to be implemented for CPIH to regain its status as a National Statistic.
Page 11 of 17
Table 2: CPIH and OOH component index values, 1-month and 12-month rates: December 2015 to December 2016
UK
CPIH Index1,2
(UK, 2015 = 100)
OOH Index1,2
(UK, 2015 = 100)
CPIH 1-
month rate2
OOH 1-
month rate2
CPIH 12-month
rate2
OOH 12-month
rate2
2015 Dec 100.4 100.9 0.1 0.2 0.5 1.9
2016 Jan 99.8 101.2 -0.6 0.3 0.6 2.0
Feb 100.1 101.3 0.2 0.1 0.6 2.0
Mar 100.4 101.5 0.3 0.2 0.7 2.1
Apr 100.5 101.8 0.1 0.3 0.6 2.2
May 100.7 102.1 0.2 0.3 0.7 2.3
Jun 100.9 102.2 0.2 0.1 0.8 2.3
Jul 100.9 102.4 0.0 0.2 0.9 2.4
Aug 101.2 102.7 0.3 0.2 0.9 2.4
Sep 101.4 102.8 0.2 0.1 1.2 2.4
Oct 101.5 103.2 0.1 0.4 1.2 2.7
Nov 101.7 103.4 0.2 0.2 1.4 2.6
Dec 102.2 103.6 0.4 0.2 1.7 2.6
Source: Office for National Statistics
Notes:
1. From February 2016, CPI and CPIH indices have been re-referenced and published with 2015=100. This does not impact on published inflation rates.
2. CPIH has been re-assessed to evaluate the extent to which it meets the professional standards set out in the Code of Practice for Official Statistics. The assessment report includes a number of requirements that need to be implemented for CPIH to regain its status as a National Statistic.
6 . Retail Prices Index (RPI) and RPIJ
In accordance with the Statistics and Registration Service Act 2007, the Retail Prices Index (RPI) and its derivatives have been assessed against the Code of Practice for Official Statistics and found not to meet the required standard for designation as National Statistics. The can be found on the UK full assessment reportStatistics Authority website.
The RPI is a long-standing measure of UK inflation that has historically been used for a wide range of purposes such as the indexation of pensions, rents and index-linked gilts. For further information see Users and uses of
.consumer price inflation statistics
Page 12 of 17
RPIJ is a variant of the RPI and is calculated using formulae that meet international standards. The rationale for creating RPIJ was to give users a better alternative to the RPI if their needs were for a measure of inflation based on the same population, classifications, weights, etc as the RPI. Currently, RPIJ also acts as an analytical series in that it allows users to see the impact of using the Jevons (which meets international standards) in place of the Carli formula (which does not meet international standards) in the RPI. The use of the different formulae at the elementary aggregate level is currently the only difference between these indices. Detailed goods and services indices are not produced for RPIJ.
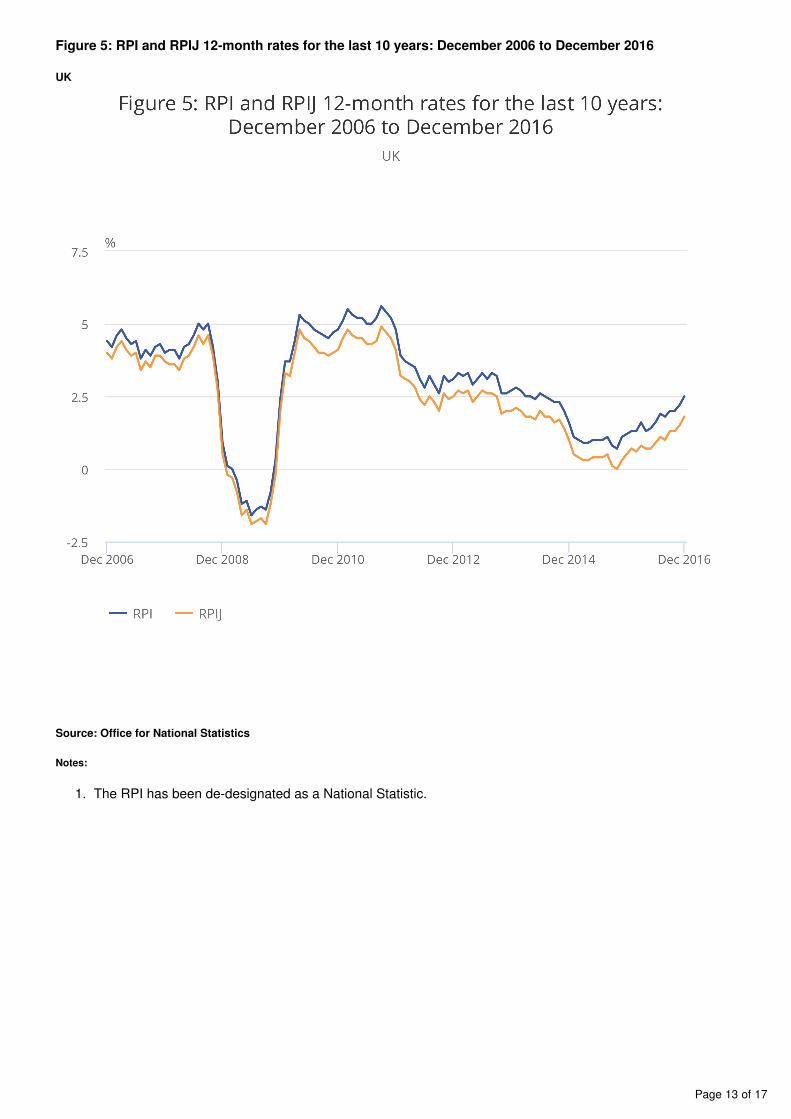
In December 2016, the 12-month rate for RPIJ stood at 1.8%, up from 1.5% in November.
The RPI 12-month rate for December 2016 stood at 2.5%, meaning that it was 0.7 percentage points higher than it would have been had it used formulae that meet international standards.
Figure 5 shows the RPI and RPIJ 12-month rates for the last 10 years. Over this period the RPIJ 12-month rate has been, on average, 0.6 percentage points lower than the RPI.
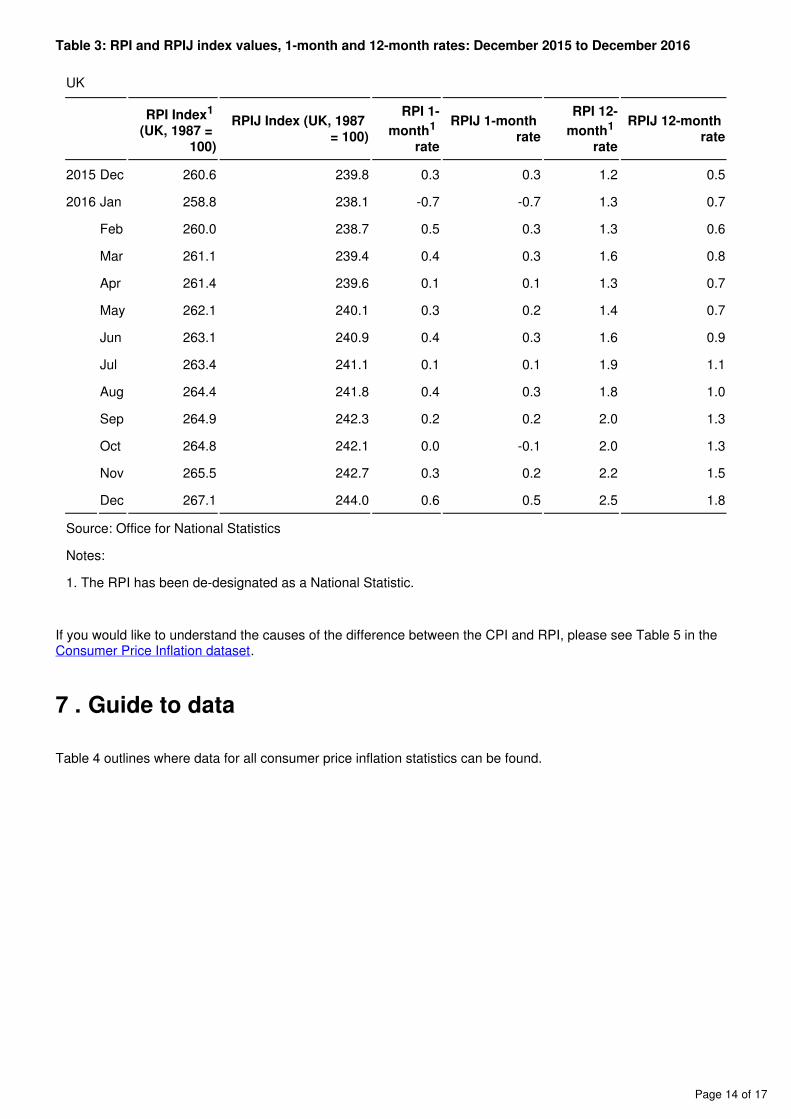
Table 3 shows the RPI and RPIJ 1-month and 12-month rates and index values for the last year.
Page 13 of 17
1.
Figure 5: RPI and RPIJ 12-month rates for the last 10 years: December 2006 to December 2016
UK
Source: Office for National Statistics
Notes:
The RPI has been de-designated as a National Statistic.
Page 14 of 17
Table 3: RPI and RPIJ index values, 1-month and 12-month rates: December 2015 to December 2016
UK
RPI Index1
(UK, 1987 = 100)
RPIJ Index (UK, 1987 = 100)
RPI 1-
month 1
rate
RPIJ 1-month rate
RPI 12-
month 1
rate
RPIJ 12-month rate
2015 Dec 260.6 239.8 0.3 0.3 1.2 0.5
2016 Jan 258.8 238.1 -0.7 -0.7 1.3 0.7
Feb 260.0 238.7 0.5 0.3 1.3 0.6
Mar 261.1 239.4 0.4 0.3 1.6 0.8
Apr 261.4 239.6 0.1 0.1 1.3 0.7
May 262.1 240.1 0.3 0.2 1.4 0.7
Jun 263.1 240.9 0.4 0.3 1.6 0.9
Jul 263.4 241.1 0.1 0.1 1.9 1.1
Aug 264.4 241.8 0.4 0.3 1.8 1.0
Sep 264.9 242.3 0.2 0.2 2.0 1.3
Oct 264.8 242.1 0.0 -0.1 2.0 1.3
Nov 265.5 242.7 0.3 0.2 2.2 1.5
Dec 267.1 244.0 0.6 0.5 2.5 1.8
Source: Office for National Statistics
Notes:
1. The RPI has been de-designated as a National Statistic.
If you would like to understand the causes of the difference between the CPI and RPI, please see Table 5 in the .Consumer Price Inflation dataset
7 . Guide to data
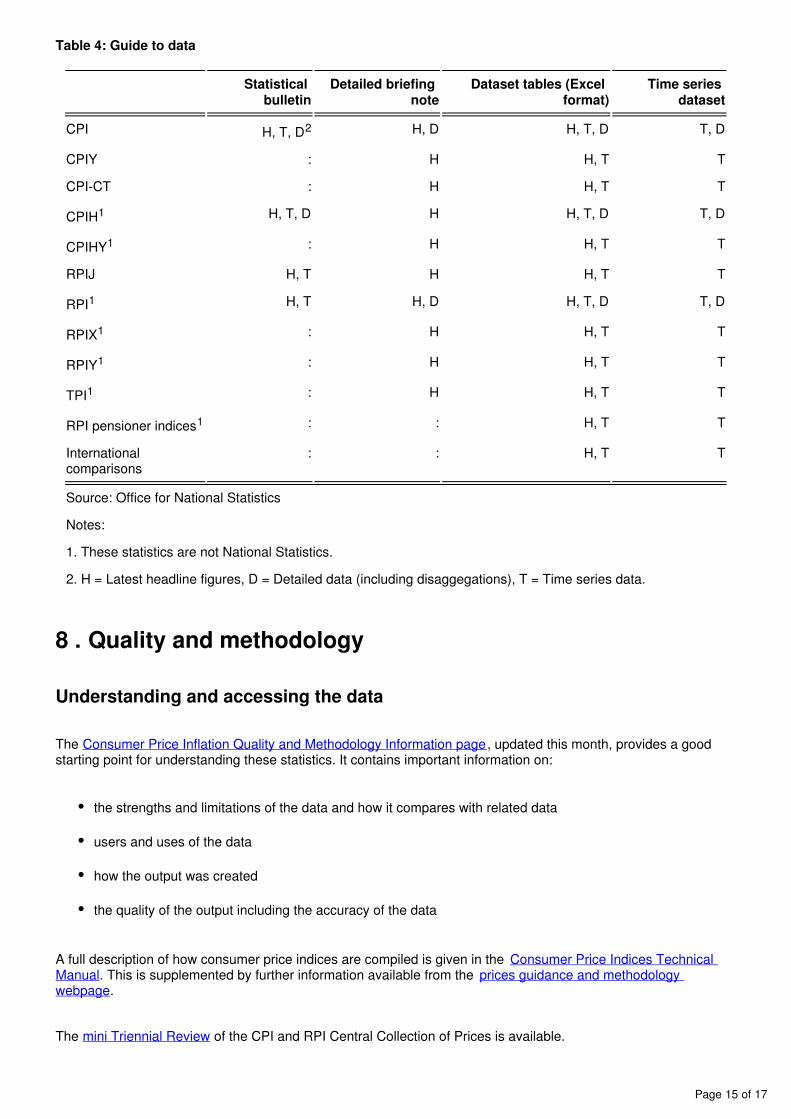
Table 4 outlines where data for all consumer price inflation statistics can be found.
Page 15 of 17
Table 4: Guide to data
Statistical bulletin
Detailed briefing note
Dataset tables (Excel format)
Time series dataset
CPI H, T, D2 H, D H, T, D T, D
CPIY : H H, T T
CPI-CT : H H, T T
CPIH1 H, T, D H H, T, D T, D
CPIHY1 : H H, T T
RPIJ H, T H H, T T
RPI1 H, T H, D H, T, D T, D
RPIX1 : H H, T T
RPIY1 : H H, T T
TPI1 : H H, T T
RPI pensioner indices1 : : H, T T
International comparisons
: : H, T T
Source: Office for National Statistics
Notes:
1. These statistics are not National Statistics.
2. H = Latest headline figures, D = Detailed data (including disaggegations), T = Time series data.
8 . Quality and methodology
Understanding and accessing the data
The , updated this month, provides a good Consumer Price Inflation Quality and Methodology Information pagestarting point for understanding these statistics. It contains important information on:
the strengths and limitations of the data and how it compares with related data
users and uses of the data
how the output was created
the quality of the output including the accuracy of the data
A full description of how consumer price indices are compiled is given in the Consumer Price Indices Technical . This is supplemented by further information available from the Manual prices guidance and methodology
.webpage
The of the CPI and RPI Central Collection of Prices is available.mini Triennial Review
Page 16 of 17
1.
All consumer price inflation data (including Excel dataset, time series data and explorable datasets) can be found on the .dataset page
To help you further, very detailed data are available, including the individual price quotes (for locally collected that underpin the consumer price inflation statistics. The item indices behind the items only) and item indices
measurement of owner occupiers’ housing costs were included for the first time in the first quarter 2016 data. Please note the data that are published are at a level which means that no individual retailer or service provider will be able to be identified. These data have previously been released once a quarter with around a 2-month lag after the latest CPI publication. The frequency of publication has now changed, with data for October to December having been published today. From now onwards, data will be updated monthly at the same time as the headline information. For example, January 2017 information will be released on 14 February 2017.
Internationally, the CPI is known as the Harmonised Index of Consumer Prices (HICP). HICPs are calculated in each member state of the European Union (EU) according to rules specified in a series of European regulations developed by the European Commission (Eurostat) in conjunction with the EU member states. Eurostat releases figures for the Harmonised Index of Consumer Prices (HICP) for the month of December 2016 for EU member states, together with an EU average, on 18 January 2017. A summary of the latest European data is available from . Further information on HICP for the EU, Euro area and other EU member states Eurostat’s database tablesis available from .Eurostat's HICP web page
Methods – CPI and other measures of inflation
The CPI, CPIH, RPIJ and RPI are compiled using the same underlying price data, based on a large and representative selection of around 700 individual goods and services for which price movements are measured in around 140 randomly selected areas throughout the UK. Around 180,000 separate price quotations are used every month to compile the indices. The outlets in which the prices are collected are selected randomly. Expenditure weights are held constant for 1 year at a time.
The selection of goods and services that are priced to compile these indices is reviewed annually. The contents of the 2016 basket are described in an article . Consumer Price Inflation: The 2016 Basket of Goods and ServicesThe expenditure weights used to compile the indices are also updated each year. Additional details of the updated weights for 2016 are available in an article published on 22 March 2016 entitled Consumer Price
.Inflation: 2016 Weights
Rates of change for the CPI and CPIH are calculated from unrounded index levels, rather than from the published indices which are rounded to 1 decimal place. The use of unrounded indices increases the accuracy of the calculation. The unrounded index levels for the CPI and CPIH are available from Tables 63 and 64 of the
. By contrast, rates of change for the RPI and RPIJ are calculated from the Consumer Price Inflation datasetpublished rounded indices.
Further information on the methods used to construct the CPI, CPIH, RPI and RPIJ, including differences in the methods used for each index, can be found in the . Consumer Price Indices Technical Manual Users and uses of
provides further details of how consumer price statistics are used more consumer price inflation statisticsgenerally.
9. Background notes
News
Approaches to measuring owner occupiers’ housing costs
On 10 January 2017 we published an analysis of the impact of using different approaches to capturing . A by Deputy owner occupiers' housing costs (OOH) in an aggregate measure of inflation blog post
National Statistician, Jonathan Athow, explains why we have decided to use the rental equivalence approach to measure owner occupiers’ housing costs.
Page 17 of 17
2.
3.
4.
5.
Update to article on inclusion of Council Tax and revising imputed rents in CPIH
Impact of inclusion of Council Tax and revised imputed rents on CPIH , was published on 13 December 2016. An to this was subsequently published on 6 January 2017, which includes weights and updateanalysis of the impact of these weights on CPIH for 2016.
Frequency of publishing microdata
The that underpin the consumer individual price quotes (for locally collected items only) and item indicesprice inflation statistics have previously been released once a quarter with around a 2-month lag after the latest CPI publication. The frequency of publication has now changed, with data for October to December having been published today. From now onwards, data will be updated monthly at the same time as the headline information. For example, January 2017 information will be released on 14 February 2017. Please note, the data that are published are at a level which means that no individual retailer or service provider will be able to be identified.
Cessation of publication of the internal purchasing power of the pound
In November 2016, a by the National Statistician and an detailed the statement accompanying article RPI . The RPI has also historically been used to derivatives that would be discontinued from March 2017
provide additional analysis on the purchasing power of the pound, updated annually in January. In keeping with the scaling back of RPI-related data to that which is essential for user needs to be met, the analysis has been discontinued as of this month.
Quality and Methodology Information
The for consumer price inflation was updated today. The previous Quality and Methodology Informationupdate was on 24 October 2013.
Developing an Index of Household Payments
A to our paper was published on summary of the responses Developing an index of household payments19 December 2016.
Revisions policy
On 15 October 2013, a was published for the suite of consumer price inflation statistics. revisions policyThe policy reaffirms the existing practices for CPI and RPI and sets out the policies for the new CPIH and RPIJ measures.
In summary, CPI, CPIH and RPIJ are revisable in theory though revisions only occur under exceptional circumstances. The RPI is never revised once published.
Publication policy
This bulletin includes the December 2016 data, collected on and around 13 December 2016. Future for this statistical bulletin are available to January 2019 (the publication of the December publication dates
2018 inflation figures). Publication dates from February 2018 onwards are provisional. Consumer price inflation for January 2016 to January 2017 will be published on 14 February 2017.
Recorded message
Consumer price inflation recorded message (available after 9.45am on release day):
Telephone: + 44 (0) 800 0113703
Code of Practice
National Statistics are produced to high professional standards set out in the Code of Practice for Official . They undergo regular quality assurance reviews to ensure that they meet customer needs. They Statistics
are produced free from any political interference and released according to the arrangements approved by the .UK Statistics Authority
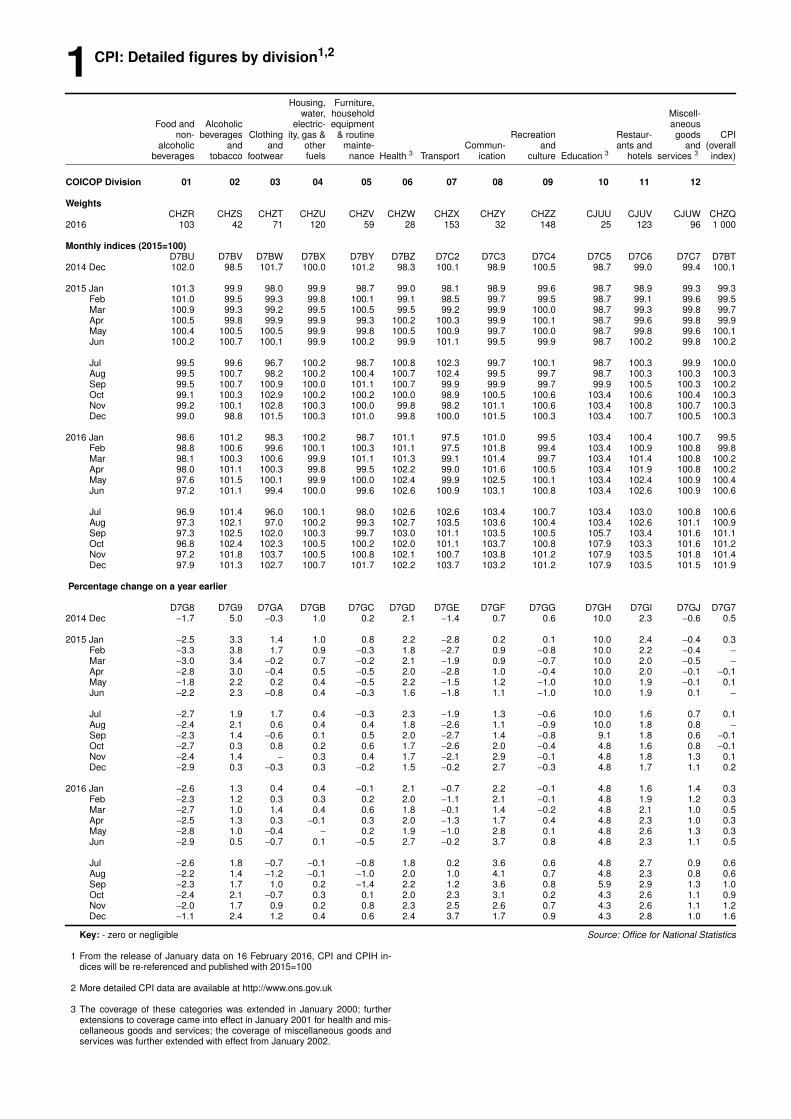
1 CPI: Detailed figures by division1,2
Housing, Furniture,water, household Miscell-
Food and Alcoholic electric- equipment aneousnon- beverages Clothing ity, gas & & routine Recreation Restaur- goods CPI
alcoholic and and other mainte- Commun- and ants and and (overallbeverages tobacco footwear fuels nance Health 3 Tr anspor t ication culture Education 3 hotels services 3 index)
COICOP Division 01 02 03 04 05 06 07 08 09 10 11 12
WeightsCHZR CHZS CHZT CHZU CHZV CHZW CHZX CHZY CHZZ CJUU CJUV CJUW CHZQ
2016 103 42 71 120 59 28 153 32 148 25 123 96 1 000
Monthly indices (2015=100)D7BU D7BV D7BW D7BX D7BY D7BZ D7C2 D7C3 D7C4 D7C5 D7C6 D7C7 D7BT
2014 Dec 102.0 98.5 101.7 100.0 101.2 98.3 100.1 98.9 100.5 98.7 99.0 99.4 100.1
2015 Jan 101.3 99.9 98.0 99.9 98.7 99.0 98.1 98.9 99.6 98.7 98.9 99.3 99.3Feb 101.0 99.5 99.3 99.8 100.1 99.1 98.5 99.7 99.5 98.7 99.1 99.6 99.5Mar 100.9 99.3 99.2 99.5 100.5 99.5 99.2 99.9 100.0 98.7 99.3 99.8 99.7Apr 100.5 99.8 99.9 99.9 99.3 100.2 100.3 99.9 100.1 98.7 99.6 99.8 99.9May 100.4 100.5 100.5 99.9 99.8 100.5 100.9 99.7 100.0 98.7 99.8 99.6 100.1Jun 100.2 100.7 100.1 99.9 100.2 99.9 101.1 99.5 99.9 98.7 100.2 99.8 100.2
Jul 99.5 99.6 96.7 100.2 98.7 100.8 102.3 99.7 100.1 98.7 100.3 99.9 100.0Aug 99.5 100.7 98.2 100.2 100.4 100.7 102.4 99.5 99.7 98.7 100.3 100.3 100.3Sep 99.5 100.7 100.9 100.0 101.1 100.7 99.9 99.9 99.7 99.9 100.5 100.3 100.2Oct 99.1 100.3 102.9 100.2 100.2 100.0 98.9 100.5 100.6 103.4 100.6 100.4 100.3Nov 99.2 100.1 102.8 100.3 100.0 99.8 98.2 101.1 100.6 103.4 100.8 100.7 100.3Dec 99.0 98.8 101.5 100.3 101.0 99.8 100.0 101.5 100.3 103.4 100.7 100.5 100.3
2016 Jan 98.6 101.2 98.3 100.2 98.7 101.1 97.5 101.0 99.5 103.4 100.4 100.7 99.5Feb 98.8 100.6 99.6 100.1 100.3 101.1 97.5 101.8 99.4 103.4 100.9 100.8 99.8Mar 98.1 100.3 100.6 99.9 101.1 101.3 99.1 101.4 99.7 103.4 101.4 100.8 100.2Apr 98.0 101.1 100.3 99.8 99.5 102.2 99.0 101.6 100.5 103.4 101.9 100.8 100.2May 97.6 101.5 100.1 99.9 100.0 102.4 99.9 102.5 100.1 103.4 102.4 100.9 100.4Jun 97.2 101.1 99.4 100.0 99.6 102.6 100.9 103.1 100.8 103.4 102.6 100.9 100.6
Jul 96.9 101.4 96.0 100.1 98.0 102.6 102.6 103.4 100.7 103.4 103.0 100.8 100.6Aug 97.3 102.1 97.0 100.2 99.3 102.7 103.5 103.6 100.4 103.4 102.6 101.1 100.9Sep 97.3 102.5 102.0 100.3 99.7 103.0 101.1 103.5 100.5 105.7 103.4 101.6 101.1Oct 96.8 102.4 102.3 100.5 100.2 102.0 101.1 103.7 100.8 107.9 103.3 101.6 101.2Nov 97.2 101.8 103.7 100.5 100.8 102.1 100.7 103.8 101.2 107.9 103.5 101.8 101.4Dec 97.9 101.3 102.7 100.7 101.7 102.2 103.7 103.2 101.2 107.9 103.5 101.5 101.9
Percentage chang e on a year earlier
D7G8 D7G9 D7GA D7GB D7GC D7GD D7GE D7GF D7GG D7GH D7GI D7GJ D7G72014 Dec −1.7 5.0 −0.3 1.0 0.2 2.1 −1.4 0.7 0.6 10.0 2.3 −0.6 0.5
2015 Jan −2.5 3.3 1.4 1.0 0.8 2.2 −2.8 0.2 0.1 10.0 2.4 −0.4 0.3Feb −3.3 3.8 1.7 0.9 −0.3 1.8 −2.7 0.9 −0.8 10.0 2.2 −0.4 −
Mar −3.0 3.4 −0.2 0.7 −0.2 2.1 −1.9 0.9 −0.7 10.0 2.0 −0.5 −
Apr −2.8 3.0 −0.4 0.5 −0.5 2.0 −2.8 1.0 −0.4 10.0 2.0 −0.1 −0.1May −1.8 2.2 0.2 0.4 −0.5 2.2 −1.5 1.2 −1.0 10.0 1.9 −0.1 0.1Jun −2.2 2.3 −0.8 0.4 −0.3 1.6 −1.8 1.1 −1.0 10.0 1.9 0.1 −
Jul −2.7 1.9 1.7 0.4 −0.3 2.3 −1.9 1.3 −0.6 10.0 1.6 0.7 0.1Aug −2.4 2.1 0.6 0.4 0.4 1.8 −2.6 1.1 −0.9 10.0 1.8 0.8 −
Sep −2.3 1.4 −0.6 0.1 0.5 2.0 −2.7 1.4 −0.8 9.1 1.8 0.6 −0.1Oct −2.7 0.3 0.8 0.2 0.6 1.7 −2.6 2.0 −0.4 4.8 1.6 0.8 −0.1Nov −2.4 1.4 − 0.3 0.4 1.7 −2.1 2.9 −0.1 4.8 1.8 1.3 0.1Dec −2.9 0.3 −0.3 0.3 −0.2 1.5 −0.2 2.7 −0.3 4.8 1.7 1.1 0.2
2016 Jan −2.6 1.3 0.4 0.4 −0.1 2.1 −0.7 2.2 −0.1 4.8 1.6 1.4 0.3Feb −2.3 1.2 0.3 0.3 0.2 2.0 −1.1 2.1 −0.1 4.8 1.9 1.2 0.3Mar −2.7 1.0 1.4 0.4 0.6 1.8 −0.1 1.4 −0.2 4.8 2.1 1.0 0.5Apr −2.5 1.3 0.3 −0.1 0.3 2.0 −1.3 1.7 0.4 4.8 2.3 1.0 0.3May −2.8 1.0 −0.4 − 0.2 1.9 −1.0 2.8 0.1 4.8 2.6 1.3 0.3Jun −2.9 0.5 −0.7 0.1 −0.5 2.7 −0.2 3.7 0.8 4.8 2.3 1.1 0.5
Jul −2.6 1.8 −0.7 −0.1 −0.8 1.8 0.2 3.6 0.6 4.8 2.7 0.9 0.6Aug −2.2 1.4 −1.2 −0.1 −1.0 2.0 1.0 4.1 0.7 4.8 2.3 0.8 0.6Sep −2.3 1.7 1.0 0.2 −1.4 2.2 1.2 3.6 0.8 5.9 2.9 1.3 1.0Oct −2.4 2.1 −0.7 0.3 0.1 2.0 2.3 3.1 0.2 4.3 2.6 1.1 0.9Nov −2.0 1.7 0.9 0.2 0.8 2.3 2.5 2.6 0.7 4.3 2.6 1.1 1.2Dec −1.1 2.4 1.2 0.4 0.6 2.4 3.7 1.7 0.9 4.3 2.8 1.0 1.6
Key: - zero or negligible
1 From the release of Januar y data on 16 Febr uary 2016, CPI and CPIH in-dices will be re-referenced and published with 2015=100
2 More detailed CPI data are available at http://www.ons.gov.uk
3 The coverage of these categories was extended in Januar y 2000; furtherextensions to coverage came into effect in Januar y 2001 for health and mis-cellaneous goods and services; the coverage of miscellaneous goods andser vices was fur ther extended with effect from Januar y 2002.
Source: Office for National Statistics
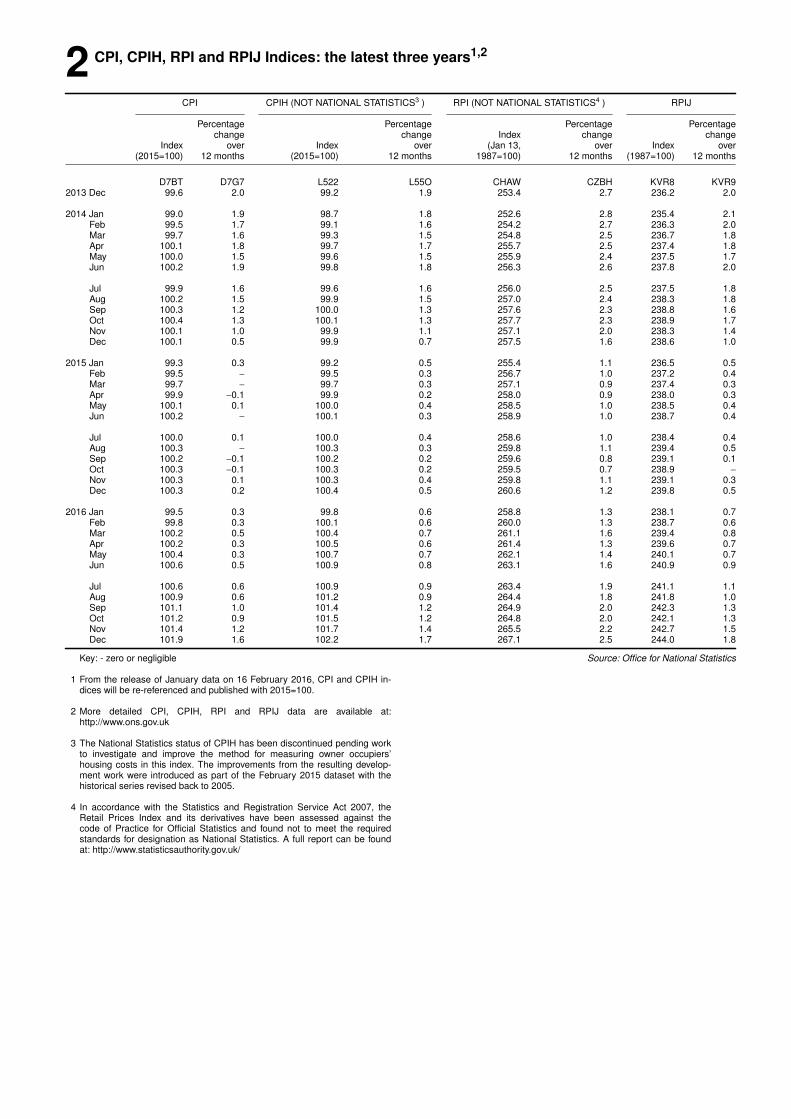
2 CPI, CPIH, RPI and RPIJ Indices: the latest three years1,2
CPI CPIH (NOT NATIONAL STATISTICS3 ) RPI (NOT NATIONAL STATISTICS4 ) RPIJ
Percentage Percentage Percentage Percentagechange change Index change change
Index over Index over (Jan 13, over Index over(2015=100) 12 months (2015=100) 12 months 1987=100) 12 months (1987=100) 12 months
D7BT D7G7 L522 L55O CHAW CZBH KVR8 KVR92013 Dec 99.6 2.0 99.2 1.9 253.4 2.7 236.2 2.0
2014 Jan 99.0 1.9 98.7 1.8 252.6 2.8 235.4 2.1Feb 99.5 1.7 99.1 1.6 254.2 2.7 236.3 2.0Mar 99.7 1.6 99.3 1.5 254.8 2.5 236.7 1.8Apr 100.1 1.8 99.7 1.7 255.7 2.5 237.4 1.8May 100.0 1.5 99.6 1.5 255.9 2.4 237.5 1.7Jun 100.2 1.9 99.8 1.8 256.3 2.6 237.8 2.0
Jul 99.9 1.6 99.6 1.6 256.0 2.5 237.5 1.8Aug 100.2 1.5 99.9 1.5 257.0 2.4 238.3 1.8Sep 100.3 1.2 100.0 1.3 257.6 2.3 238.8 1.6Oct 100.4 1.3 100.1 1.3 257.7 2.3 238.9 1.7Nov 100.1 1.0 99.9 1.1 257.1 2.0 238.3 1.4Dec 100.1 0.5 99.9 0.7 257.5 1.6 238.6 1.0
2015 Jan 99.3 0.3 99.2 0.5 255.4 1.1 236.5 0.5Feb 99.5 − 99.5 0.3 256.7 1.0 237.2 0.4Mar 99.7 − 99.7 0.3 257.1 0.9 237.4 0.3Apr 99.9 −0.1 99.9 0.2 258.0 0.9 238.0 0.3May 100.1 0.1 100.0 0.4 258.5 1.0 238.5 0.4Jun 100.2 − 100.1 0.3 258.9 1.0 238.7 0.4
Jul 100.0 0.1 100.0 0.4 258.6 1.0 238.4 0.4Aug 100.3 − 100.3 0.3 259.8 1.1 239.4 0.5Sep 100.2 −0.1 100.2 0.2 259.6 0.8 239.1 0.1Oct 100.3 −0.1 100.3 0.2 259.5 0.7 238.9 −
Nov 100.3 0.1 100.3 0.4 259.8 1.1 239.1 0.3Dec 100.3 0.2 100.4 0.5 260.6 1.2 239.8 0.5
2016 Jan 99.5 0.3 99.8 0.6 258.8 1.3 238.1 0.7Feb 99.8 0.3 100.1 0.6 260.0 1.3 238.7 0.6Mar 100.2 0.5 100.4 0.7 261.1 1.6 239.4 0.8Apr 100.2 0.3 100.5 0.6 261.4 1.3 239.6 0.7May 100.4 0.3 100.7 0.7 262.1 1.4 240.1 0.7Jun 100.6 0.5 100.9 0.8 263.1 1.6 240.9 0.9
Jul 100.6 0.6 100.9 0.9 263.4 1.9 241.1 1.1Aug 100.9 0.6 101.2 0.9 264.4 1.8 241.8 1.0Sep 101.1 1.0 101.4 1.2 264.9 2.0 242.3 1.3Oct 101.2 0.9 101.5 1.2 264.8 2.0 242.1 1.3Nov 101.4 1.2 101.7 1.4 265.5 2.2 242.7 1.5Dec 101.9 1.6 102.2 1.7 267.1 2.5 244.0 1.8
Ke y: - zero or negligible
1 From the release of Januar y data on 16 Febr uary 2016, CPI and CPIH in-dices will be re-referenced and published with 2015=100.
2 More detailed CPI, CPIH, RPI and RPIJ data are available at:http://www.ons.gov.uk
3 The National Statistics status of CPIH has been discontinued pending wor kto investigate and improve the method for measuring owner occupiers’housing costs in this index. The improvements from the resulting develop-ment wor k were introduced as part of the Febr uary 2015 dataset with thehistor ical ser ies revised back to 2005.
4 In accordance with the Statistics and Registration Service Act 2007, theRetail Prices Index and its derivatives have been assessed against thecode of Practice for Official Statistics and found not to meet the requiredstandards for designation as National Statistics. A full report can be foundat: http://www.statisticsauthor ity.gov.uk/
Source: Office for National Statistics
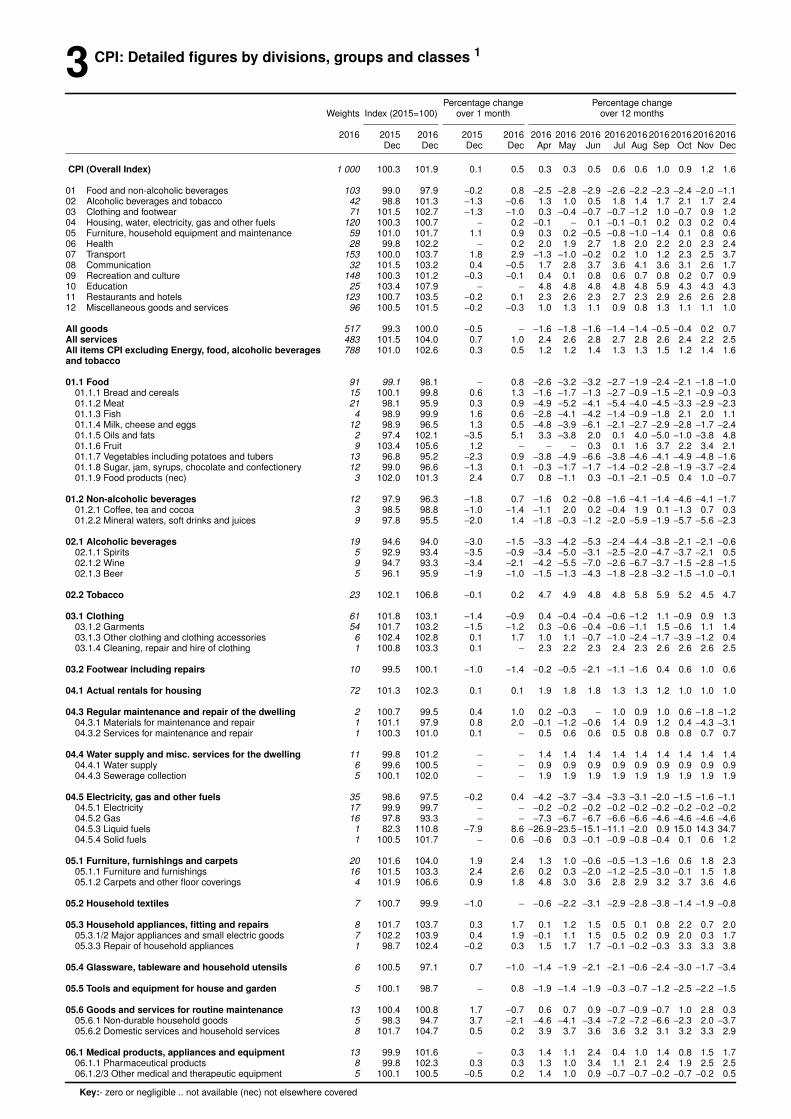
3 CPI: Detailed figures by divisions, groups and classes 1
Percentage change Percentage changeWeights Index (2015=100) over 1 month over 12 months
2016 2015 2016 2015 2016 2016 2016 2016 2016 2016 2016 2016 2016 2016Dec Dec Dec Dec Apr May Jun Jul Aug Sep Oct Nov Dec
CPI (Overall Index) 1 000 100.3 101.9 0.1 0.5 0.3 0.3 0.5 0.6 0.6 1.0 0.9 1.2 1.6
01 Food and non-alcoholic beverages 103 99.0 97.9 −0.2 0.8 −2.5 −2.8 −2.9 −2.6 −2.2 −2.3 −2.4 −2.0 −1.102 Alcoholic beverages and tobacco 42 98.8 101.3 −1.3 −0.6 1.3 1.0 0.5 1.8 1.4 1.7 2.1 1.7 2.403 Clothing and footwear 71 101.5 102.7 −1.3 −1.0 0.3 −0.4 −0.7 −0.7 −1.2 1.0 −0.7 0.9 1.204 Housing, water, electr icity, gas and other fuels 120 100.3 100.7 − 0.2 −0.1 − 0.1 −0.1 −0.1 0.2 0.3 0.2 0.405 Furniture, household equipment and maintenance 59 101.0 101.7 1.1 0.9 0.3 0.2 −0.5 −0.8 −1.0 −1.4 0.1 0.8 0.606 Health 28 99.8 102.2 − 0.2 2.0 1.9 2.7 1.8 2.0 2.2 2.0 2.3 2.407 Transpor t 153 100.0 103.7 1.8 2.9 −1.3 −1.0 −0.2 0.2 1.0 1.2 2.3 2.5 3.708 Communication 32 101.5 103.2 0.4 −0.5 1.7 2.8 3.7 3.6 4.1 3.6 3.1 2.6 1.709 Recreation and culture 148 100.3 101.2 −0.3 −0.1 0.4 0.1 0.8 0.6 0.7 0.8 0.2 0.7 0.910 Education 25 103.4 107.9 − − 4.8 4.8 4.8 4.8 4.8 5.9 4.3 4.3 4.311 Restaurants and hotels 123 100.7 103.5 −0.2 0.1 2.3 2.6 2.3 2.7 2.3 2.9 2.6 2.6 2.812 Miscellaneous goods and services 96 100.5 101.5 −0.2 −0.3 1.0 1.3 1.1 0.9 0.8 1.3 1.1 1.1 1.0
All goods 517 99.3 100.0 −0.5 − −1.6 −1.8 −1.6 −1.4 −1.4 −0.5 −0.4 0.2 0.7All services 483 101.5 104.0 0.7 1.0 2.4 2.6 2.8 2.7 2.8 2.6 2.4 2.2 2.5All items CPI excluding Energy, food, alcoholic beverages 788 101.0 102.6 0.3 0.5 1.2 1.2 1.4 1.3 1.3 1.5 1.2 1.4 1.6and tobacco
01.1 Food 91 99.1 98.1 − 0.8 −2.6 −3.2 −3.2 −2.7 −1.9 −2.4 −2.1 −1.8 −1.001.1.1 Bread and cereals 15 100.1 99.8 0.6 1.3 −1.6 −1.7 −1.3 −2.7 −0.9 −1.5 −2.1 −0.9 −0.301.1.2 Meat 21 98.1 95.9 0.3 0.9 −4.9 −5.2 −4.1 −5.4 −4.0 −4.5 −3.3 −2.9 −2.301.1.3 Fish 4 98.9 99.9 1.6 0.6 −2.8 −4.1 −4.2 −1.4 −0.9 −1.8 2.1 2.0 1.101.1.4 Milk, cheese and eggs 12 98.9 96.5 1.3 0.5 −4.8 −3.9 −6.1 −2.1 −2.7 −2.9 −2.8 −1.7 −2.401.1.5 Oils and fats 2 97.4 102.1 −3.5 5.1 3.3 −3.8 2.0 0.1 4.0 −5.0 −1.0 −3.8 4.801.1.6 Fruit 9 103.4 105.6 1.2 − − − 0.3 0.1 1.6 3.7 2.2 3.4 2.101.1.7 Vegetables including potatoes and tubers 13 96.8 95.2 −2.3 0.9 −3.8 −4.9 −6.6 −3.8 −4.6 −4.1 −4.9 −4.8 −1.601.1.8 Sugar, jam, syrups, chocolate and confectioner y 12 99.0 96.6 −1.3 0.1 −0.3 −1.7 −1.7 −1.4 −0.2 −2.8 −1.9 −3.7 −2.401.1.9 Food products (nec) 3 102.0 101.3 2.4 0.7 0.8 −1.1 0.3 −0.1 −2.1 −0.5 0.4 1.0 −0.7
01.2 Non-alcoholic beverages 12 97.9 96.3 −1.8 0.7 −1.6 0.2 −0.8 −1.6 −4.1 −1.4 −4.6 −4.1 −1.701.2.1 Coffee, tea and cocoa 3 98.5 98.8 −1.0 −1.4 −1.1 2.0 0.2 −0.4 1.9 0.1 −1.3 0.7 0.301.2.2 Mineral waters, soft drinks and juices 9 97.8 95.5 −2.0 1.4 −1.8 −0.3 −1.2 −2.0 −5.9 −1.9 −5.7 −5.6 −2.3
02.1 Alcoholic beverages 19 94.6 94.0 −3.0 −1.5 −3.3 −4.2 −5.3 −2.4 −4.4 −3.8 −2.1 −2.1 −0.602.1.1 Spirits 5 92.9 93.4 −3.5 −0.9 −3.4 −5.0 −3.1 −2.5 −2.0 −4.7 −3.7 −2.1 0.502.1.2 Wine 9 94.7 93.3 −3.4 −2.1 −4.2 −5.5 −7.0 −2.6 −6.7 −3.7 −1.5 −2.8 −1.502.1.3 Beer 5 96.1 95.9 −1.9 −1.0 −1.5 −1.3 −4.3 −1.8 −2.8 −3.2 −1.5 −1.0 −0.1
02.2 Tobacco 23 102.1 106.8 −0.1 0.2 4.7 4.9 4.8 4.8 5.8 5.9 5.2 4.5 4.7
03.1 Clothing 61 101.8 103.1 −1.4 −0.9 0.4 −0.4 −0.4 −0.6 −1.2 1.1 −0.9 0.9 1.303.1.2 Garments 54 101.7 103.2 −1.5 −1.2 0.3 −0.6 −0.4 −0.6 −1.1 1.5 −0.6 1.1 1.403.1.3 Other clothing and clothing accessories 6 102.4 102.8 0.1 1.7 1.0 1.1 −0.7 −1.0 −2.4 −1.7 −3.9 −1.2 0.403.1.4 Cleaning, repair and hire of clothing 1 100.8 103.3 0.1 − 2.3 2.2 2.3 2.4 2.3 2.6 2.6 2.6 2.5
03.2 Footwear including repairs 10 99.5 100.1 −1.0 −1.4 −0.2 −0.5 −2.1 −1.1 −1.6 0.4 0.6 1.0 0.6
04.1 Actual rentals for housing 72 101.3 102.3 0.1 0.1 1.9 1.8 1.8 1.3 1.3 1.2 1.0 1.0 1.0
04.3 Regular maintenance and repair of the dwelling 2 100.7 99.5 0.4 1.0 0.2 −0.3 − 1.0 0.9 1.0 0.6 −1.8 −1.204.3.1 Materials for maintenance and repair 1 101.1 97.9 0.8 2.0 −0.1 −1.2 −0.6 1.4 0.9 1.2 0.4 −4.3 −3.104.3.2 Services for maintenance and repair 1 100.3 101.0 0.1 − 0.5 0.6 0.6 0.5 0.8 0.8 0.8 0.7 0.7
04.4 Water supply and misc. services for the dwelling 11 99.8 101.2 − − 1.4 1.4 1.4 1.4 1.4 1.4 1.4 1.4 1.404.4.1 Water supply 6 99.6 100.5 − − 0.9 0.9 0.9 0.9 0.9 0.9 0.9 0.9 0.904.4.3 Sewerage collection 5 100.1 102.0 − − 1.9 1.9 1.9 1.9 1.9 1.9 1.9 1.9 1.9
04.5 Electricity, gas and other fuels 35 98.6 97.5 −0.2 0.4 −4.2 −3.7 −3.4 −3.3 −3.1 −2.0 −1.5 −1.6 −1.104.5.1 Electricity 17 99.9 99.7 − − −0.2 −0.2 −0.2 −0.2 −0.2 −0.2 −0.2 −0.2 −0.204.5.2 Gas 16 97.8 93.3 − − −7.3 −6.7 −6.7 −6.6 −6.6 −4.6 −4.6 −4.6 −4.604.5.3 Liquid fuels 1 82.3 110.8 −7.9 8.6 −26.9 −23.5 −15.1 −11.1 −2.0 0.9 15.0 14.3 34.704.5.4 Solid fuels 1 100.5 101.7 − 0.6 −0.6 0.3 −0.1 −0.9 −0.8 −0.4 0.1 0.6 1.2
05.1 Furniture, furnishings and carpets 20 101.6 104.0 1.9 2.4 1.3 1.0 −0.6 −0.5 −1.3 −1.6 0.6 1.8 2.305.1.1 Furniture and furnishings 16 101.5 103.3 2.4 2.6 0.2 0.3 −2.0 −1.2 −2.5 −3.0 −0.1 1.5 1.805.1.2 Carpets and other floor coverings 4 101.9 106.6 0.9 1.8 4.8 3.0 3.6 2.8 2.9 3.2 3.7 3.6 4.6
05.2 Household textiles 7 100.7 99.9 −1.0 − −0.6 −2.2 −3.1 −2.9 −2.8 −3.8 −1.4 −1.9 −0.8
05.3 Household appliances, fitting and repairs 8 101.7 103.7 0.3 1.7 0.1 1.2 1.5 0.5 0.1 0.8 2.2 0.7 2.005.3.1/2 Major appliances and small electric goods 7 102.2 103.9 0.4 1.9 −0.1 1.1 1.5 0.5 0.2 0.9 2.0 0.3 1.705.3.3 Repair of household appliances 1 98.7 102.4 −0.2 0.3 1.5 1.7 1.7 −0.1 −0.2 −0.3 3.3 3.3 3.8
05.4 Glassware , tableware and household utensils 6 100.5 97.1 0.7 −1.0 −1.4 −1.9 −2.1 −2.1 −0.6 −2.4 −3.0 −1.7 −3.4
05.5 Tools and equipment for house and garden 5 100.1 98.7 − 0.8 −1.9 −1.4 −1.9 −0.3 −0.7 −1.2 −2.5 −2.2 −1.5
05.6 Goods and services for routine maintenance 13 100.4 100.8 1.7 −0.7 0.6 0.7 0.9 −0.7 −0.9 −0.7 1.0 2.8 0.305.6.1 Non-durable household goods 5 98.3 94.7 3.7 −2.1 −4.6 −4.1 −3.4 −7.2 −7.2 −6.6 −2.3 2.0 −3.705.6.2 Domestic services and household services 8 101.7 104.7 0.5 0.2 3.9 3.7 3.6 3.6 3.2 3.1 3.2 3.3 2.9
06.1 Medical products, appliances and equipment 13 99.9 101.6 − 0.3 1.4 1.1 2.4 0.4 1.0 1.4 0.8 1.5 1.706.1.1 Pharmaceutical products 8 99.8 102.3 0.3 0.3 1.3 1.0 3.4 1.1 2.1 2.4 1.9 2.5 2.506.1.2/3 Other medical and therapeutic equipment 5 100.1 100.5 −0.5 0.2 1.4 1.0 0.9 −0.7 −0.7 −0.2 −0.7 −0.2 0.5
Key:- zero or negligible .. not available (nec) not elsewhere covered
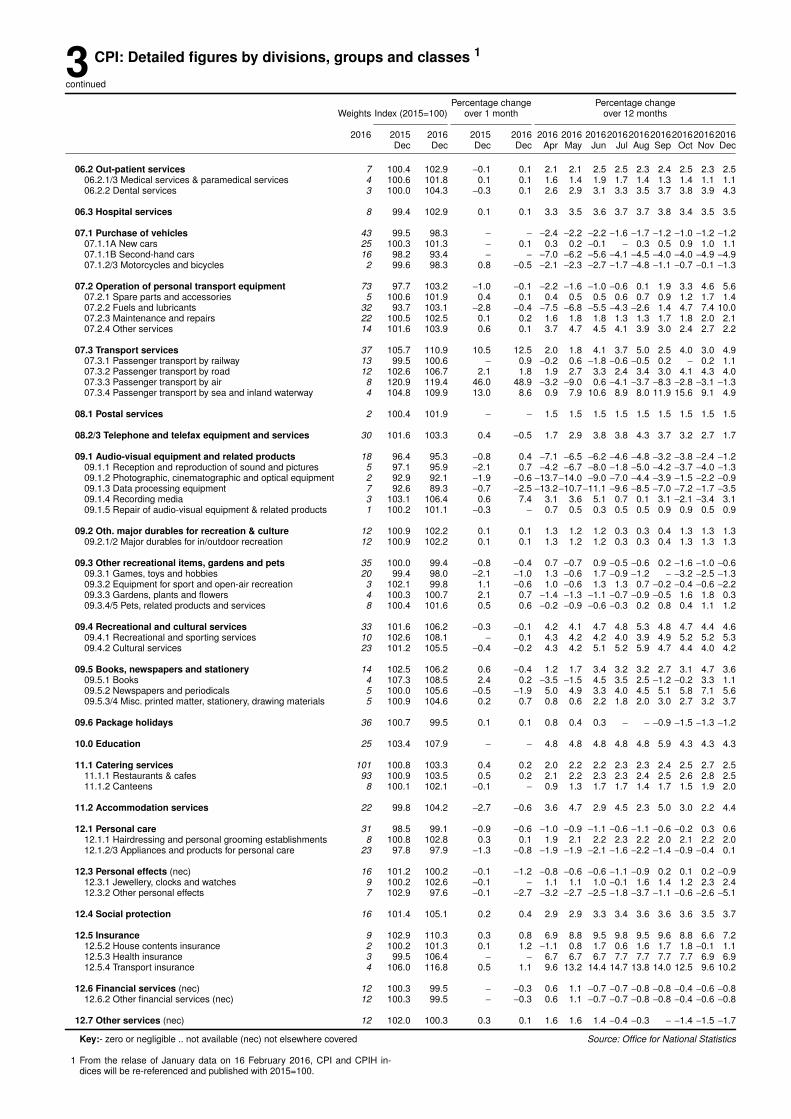
3 CPI: Detailed figures by divisions, groups and classes 1
continued
Percentage change Percentage changeWeights Index (2015=100) over 1 month over 12 months
2016 2015 2016 2015 2016 2016 2016 20162016 2016 2016 2016 2016 2016Dec Dec Dec Dec Apr May Jun Jul Aug Sep Oct Nov Dec
06.2 Out-patient services 7 100.4 102.9 −0.1 0.1 2.1 2.1 2.5 2.5 2.3 2.4 2.5 2.3 2.506.2.1/3 Medical services & paramedical services 4 100.6 101.8 0.1 0.1 1.6 1.4 1.9 1.7 1.4 1.3 1.4 1.1 1.106.2.2 Dental services 3 100.0 104.3 −0.3 0.1 2.6 2.9 3.1 3.3 3.5 3.7 3.8 3.9 4.3
06.3 Hospital services 8 99.4 102.9 0.1 0.1 3.3 3.5 3.6 3.7 3.7 3.8 3.4 3.5 3.5
07.1 Purchase of vehicles 43 99.5 98.3 − − −2.4 −2.2 −2.2 −1.6 −1.7 −1.2 −1.0 −1.2 −1.207.1.1A New cars 25 100.3 101.3 − 0.1 0.3 0.2 −0.1 − 0.3 0.5 0.9 1.0 1.107.1.1B Second-hand cars 16 98.2 93.4 − − −7.0 −6.2 −5.6 −4.1 −4.5 −4.0 −4.0 −4.9 −4.907.1.2/3 Motorcycles and bicycles 2 99.6 98.3 0.8 −0.5 −2.1 −2.3 −2.7 −1.7 −4.8 −1.1 −0.7 −0.1 −1.3
07.2 Operation of personal transport equipment 73 97.7 103.2 −1.0 −0.1 −2.2 −1.6 −1.0 −0.6 0.1 1.9 3.3 4.6 5.607.2.1 Spare parts and accessories 5 100.6 101.9 0.4 0.1 0.4 0.5 0.5 0.6 0.7 0.9 1.2 1.7 1.407.2.2 Fuels and lubricants 32 93.7 103.1 −2.8 −0.4 −7.5 −6.8 −5.5 −4.3 −2.6 1.4 4.7 7.4 10.007.2.3 Maintenance and repairs 22 100.5 102.5 0.1 0.2 1.6 1.8 1.8 1.3 1.3 1.7 1.8 2.0 2.107.2.4 Other services 14 101.6 103.9 0.6 0.1 3.7 4.7 4.5 4.1 3.9 3.0 2.4 2.7 2.2
07.3 Transpor t ser vices 37 105.7 110.9 10.5 12.5 2.0 1.8 4.1 3.7 5.0 2.5 4.0 3.0 4.907.3.1 Passenger transpor t by railway 13 99.5 100.6 − 0.9 −0.2 0.6 −1.8 −0.6 −0.5 0.2 − 0.2 1.107.3.2 Passenger transpor t by road 12 102.6 106.7 2.1 1.8 1.9 2.7 3.3 2.4 3.4 3.0 4.1 4.3 4.007.3.3 Passenger transpor t by air 8 120.9 119.4 46.0 48.9 −3.2 −9.0 0.6 −4.1 −3.7 −8.3 −2.8 −3.1 −1.307.3.4 Passenger transpor t by sea and inland waterway 4 104.8 109.9 13.0 8.6 0.9 7.9 10.6 8.9 8.0 11.9 15.6 9.1 4.9
08.1 Postal services 2 100.4 101.9 − − 1.5 1.5 1.5 1.5 1.5 1.5 1.5 1.5 1.5
08.2/3 Telephone and telefax equipment and services 30 101.6 103.3 0.4 −0.5 1.7 2.9 3.8 3.8 4.3 3.7 3.2 2.7 1.7
09.1 Audio-visual equipment and related products 18 96.4 95.3 −0.8 0.4 −7.1 −6.5 −6.2 −4.6 −4.8 −3.2 −3.8 −2.4 −1.209.1.1 Reception and reproduction of sound and pictures 5 97.1 95.9 −2.1 0.7 −4.2 −6.7 −8.0 −1.8 −5.0 −4.2 −3.7 −4.0 −1.309.1.2 Photographic, cinematographic and optical equipment 2 92.9 92.1 −1.9 −0.6 −13.7−14.0 −9.0 −7.0 −4.4 −3.9 −1.5 −2.2 −0.909.1.3 Data processing equipment 7 92.6 89.3 −0.7 −2.5 −13.2−10.7−11.1 −9.6 −8.5 −7.0 −7.2 −1.7 −3.509.1.4 Recording media 3 103.1 106.4 0.6 7.4 3.1 3.6 5.1 0.7 0.1 3.1 −2.1 −3.4 3.109.1.5 Repair of audio-visual equipment & related products 1 100.2 101.1 −0.3 − 0.7 0.5 0.3 0.5 0.5 0.9 0.9 0.5 0.9
09.2 Oth. major durables for recreation & culture 12 100.9 102.2 0.1 0.1 1.3 1.2 1.2 0.3 0.3 0.4 1.3 1.3 1.309.2.1/2 Major durables for in/outdoor recreation 12 100.9 102.2 0.1 0.1 1.3 1.2 1.2 0.3 0.3 0.4 1.3 1.3 1.3
09.3 Other recreational items, gardens and pets 35 100.0 99.4 −0.8 −0.4 0.7 −0.7 0.9 −0.5 −0.6 0.2 −1.6 −1.0 −0.609.3.1 Games, toys and hobbies 20 99.4 98.0 −2.1 −1.0 1.3 −0.6 1.7 −0.9 −1.2 − −3.2 −2.5 −1.309.3.2 Equipment for sport and open-air recreation 3 102.1 99.8 1.1 −0.6 1.0 −0.6 1.3 1.3 0.7 −0.2 −0.4 −0.6 −2.209.3.3 Gardens, plants and flowers 4 100.3 100.7 2.1 0.7 −1.4 −1.3 −1.1 −0.7 −0.9 −0.5 1.6 1.8 0.309.3.4/5 Pets, related products and services 8 100.4 101.6 0.5 0.6 −0.2 −0.9 −0.6 −0.3 0.2 0.8 0.4 1.1 1.2
09.4 Recreational and cultural services 33 101.6 106.2 −0.3 −0.1 4.2 4.1 4.7 4.8 5.3 4.8 4.7 4.4 4.609.4.1 Recreational and sporting services 10 102.6 108.1 − 0.1 4.3 4.2 4.2 4.0 3.9 4.9 5.2 5.2 5.309.4.2 Cultural services 23 101.2 105.5 −0.4 −0.2 4.3 4.2 5.1 5.2 5.9 4.7 4.4 4.0 4.2
09.5 Books, newspapers and stationery 14 102.5 106.2 0.6 −0.4 1.2 1.7 3.4 3.2 3.2 2.7 3.1 4.7 3.609.5.1 Books 4 107.3 108.5 2.4 0.2 −3.5 −1.5 4.5 3.5 2.5 −1.2 −0.2 3.3 1.109.5.2 Newspapers and periodicals 5 100.0 105.6 −0.5 −1.9 5.0 4.9 3.3 4.0 4.5 5.1 5.8 7.1 5.609.5.3/4 Misc. printed matter, stationer y, drawing materials 5 100.9 104.6 0.2 0.7 0.8 0.6 2.2 1.8 2.0 3.0 2.7 3.2 3.7
09.6 Package holidays 36 100.7 99.5 0.1 0.1 0.8 0.4 0.3 − − −0.9 −1.5 −1.3 −1.2
10.0 Education 25 103.4 107.9 − − 4.8 4.8 4.8 4.8 4.8 5.9 4.3 4.3 4.3
11.1 Catering services 101 100.8 103.3 0.4 0.2 2.0 2.2 2.2 2.3 2.3 2.4 2.5 2.7 2.511.1.1 Restaurants & cafes 93 100.9 103.5 0.5 0.2 2.1 2.2 2.3 2.3 2.4 2.5 2.6 2.8 2.511.1.2 Canteens 8 100.1 102.1 −0.1 − 0.9 1.3 1.7 1.7 1.4 1.7 1.5 1.9 2.0
11.2 Accommodation services 22 99.8 104.2 −2.7 −0.6 3.6 4.7 2.9 4.5 2.3 5.0 3.0 2.2 4.4
12.1 Personal care 31 98.5 99.1 −0.9 −0.6 −1.0 −0.9 −1.1 −0.6 −1.1 −0.6 −0.2 0.3 0.612.1.1 Hairdressing and personal grooming establishments 8 100.8 102.8 0.3 0.1 1.9 2.1 2.2 2.3 2.2 2.0 2.1 2.2 2.012.1.2/3 Appliances and products for personal care 23 97.8 97.9 −1.3 −0.8 −1.9 −1.9 −2.1 −1.6 −2.2 −1.4 −0.9 −0.4 0.1
12.3 Personal effects (nec) 16 101.2 100.2 −0.1 −1.2 −0.8 −0.6 −0.6 −1.1 −0.9 0.2 0.1 0.2 −0.912.3.1 Jeweller y, clocks and watches 9 100.2 102.6 −0.1 − 1.1 1.1 1.0 −0.1 1.6 1.4 1.2 2.3 2.412.3.2 Other personal effects 7 102.9 97.6 −0.1 −2.7 −3.2 −2.7 −2.5 −1.8 −3.7 −1.1 −0.6 −2.6 −5.1
12.4 Social protection 16 101.4 105.1 0.2 0.4 2.9 2.9 3.3 3.4 3.6 3.6 3.6 3.5 3.7
12.5 Insurance 9 102.9 110.3 0.3 0.8 6.9 8.8 9.5 9.8 9.5 9.6 8.8 6.6 7.212.5.2 House contents insurance 2 100.2 101.3 0.1 1.2 −1.1 0.8 1.7 0.6 1.6 1.7 1.8 −0.1 1.112.5.3 Health insurance 3 99.5 106.4 − − 6.7 6.7 6.7 7.7 7.7 7.7 7.7 6.9 6.912.5.4 Transpor t insurance 4 106.0 116.8 0.5 1.1 9.6 13.2 14.4 14.7 13.8 14.0 12.5 9.6 10.2
12.6 Financial services (nec) 12 100.3 99.5 − −0.3 0.6 1.1 −0.7 −0.7 −0.8 −0.8 −0.4 −0.6 −0.812.6.2 Other financial services (nec) 12 100.3 99.5 − −0.3 0.6 1.1 −0.7 −0.7 −0.8 −0.8 −0.4 −0.6 −0.8
12.7 Other services (nec) 12 102.0 100.3 0.3 0.1 1.6 1.6 1.4 −0.4 −0.3 − −1.4 −1.5 −1.7
Key:- zero or negligible .. not available (nec) not elsewhere covered
1 From the relase of Januar y data on 16 Febr uary 2016, CPI and CPIH in-dices will be re-referenced and published with 2015=100.
Source: Office for National Statistics
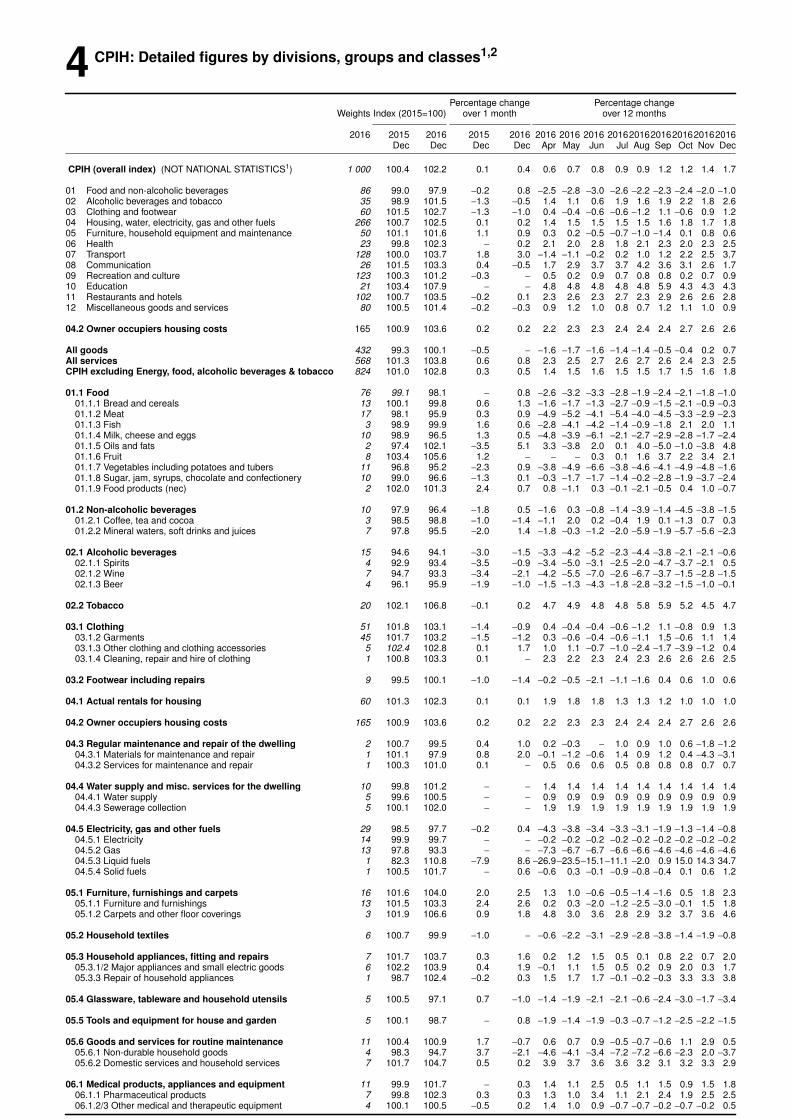
4 CPIH: Detailed figures by divisions, groups and classes1,2
Percentage change Percentage changeWeights Index (2015=100) over 1 month over 12 months
2016 2015 2016 2015 2016 2016 2016 2016 20162016 2016 2016 2016 2016Dec Dec Dec Dec Apr May Jun Jul Aug Sep Oct Nov Dec
CPIH (overall index) (NOT NATIONAL STATISTICS1) 1 000 100.4 102.2 0.1 0.4 0.6 0.7 0.8 0.9 0.9 1.2 1.2 1.4 1.7
01 Food and non-alcoholic beverages 86 99.0 97.9 −0.2 0.8 −2.5 −2.8 −3.0 −2.6 −2.2 −2.3 −2.4 −2.0 −1.002 Alcoholic beverages and tobacco 35 98.9 101.5 −1.3 −0.5 1.4 1.1 0.6 1.9 1.6 1.9 2.2 1.8 2.603 Clothing and footwear 60 101.5 102.7 −1.3 −1.0 0.4 −0.4 −0.6 −0.6 −1.2 1.1 −0.6 0.9 1.204 Housing, water, electr icity, gas and other fuels 266 100.7 102.5 0.1 0.2 1.4 1.5 1.5 1.5 1.5 1.6 1.8 1.7 1.805 Furniture, household equipment and maintenance 50 101.1 101.6 1.1 0.9 0.3 0.2 −0.5 −0.7 −1.0 −1.4 0.1 0.8 0.606 Health 23 99.8 102.3 − 0.2 2.1 2.0 2.8 1.8 2.1 2.3 2.0 2.3 2.507 Transpor t 128 100.0 103.7 1.8 3.0 −1.4 −1.1 −0.2 0.2 1.0 1.2 2.2 2.5 3.708 Communication 26 101.5 103.3 0.4 −0.5 1.7 2.9 3.7 3.7 4.2 3.6 3.1 2.6 1.709 Recreation and culture 123 100.3 101.2 −0.3 − 0.5 0.2 0.9 0.7 0.8 0.8 0.2 0.7 0.910 Education 21 103.4 107.9 − − 4.8 4.8 4.8 4.8 4.8 5.9 4.3 4.3 4.311 Restaurants and hotels 102 100.7 103.5 −0.2 0.1 2.3 2.6 2.3 2.7 2.3 2.9 2.6 2.6 2.812 Miscellaneous goods and services 80 100.5 101.4 −0.2 −0.3 0.9 1.2 1.0 0.8 0.7 1.2 1.1 1.0 0.9
04.2 Owner occupiers housing costs 165 100.9 103.6 0.2 0.2 2.2 2.3 2.3 2.4 2.4 2.4 2.7 2.6 2.6
All goods 432 99.3 100.1 −0.5 − −1.6 −1.7 −1.6 −1.4 −1.4 −0.5 −0.4 0.2 0.7All services 568 101.3 103.8 0.6 0.8 2.3 2.5 2.7 2.6 2.7 2.6 2.4 2.3 2.5CPIH excluding Energy, food, alcoholic beverages & tobacco 824 101.0 102.8 0.3 0.5 1.4 1.5 1.6 1.5 1.5 1.7 1.5 1.6 1.8
01.1 Food 76 99.1 98.1 − 0.8 −2.6 −3.2 −3.3 −2.8 −1.9 −2.4 −2.1 −1.8 −1.001.1.1 Bread and cereals 13 100.1 99.8 0.6 1.3 −1.6 −1.7 −1.3 −2.7 −0.9 −1.5 −2.1 −0.9 −0.301.1.2 Meat 17 98.1 95.9 0.3 0.9 −4.9 −5.2 −4.1 −5.4 −4.0 −4.5 −3.3 −2.9 −2.301.1.3 Fish 3 98.9 99.9 1.6 0.6 −2.8 −4.1 −4.2 −1.4 −0.9 −1.8 2.1 2.0 1.101.1.4 Milk, cheese and eggs 10 98.9 96.5 1.3 0.5 −4.8 −3.9 −6.1 −2.1 −2.7 −2.9 −2.8 −1.7 −2.401.1.5 Oils and fats 2 97.4 102.1 −3.5 5.1 3.3 −3.8 2.0 0.1 4.0 −5.0 −1.0 −3.8 4.801.1.6 Fruit 8 103.4 105.6 1.2 − − − 0.3 0.1 1.6 3.7 2.2 3.4 2.101.1.7 Vegetables including potatoes and tubers 11 96.8 95.2 −2.3 0.9 −3.8 −4.9 −6.6 −3.8 −4.6 −4.1 −4.9 −4.8 −1.601.1.8 Sugar, jam, syrups, chocolate and confectioner y 10 99.0 96.6 −1.3 0.1 −0.3 −1.7 −1.7 −1.4 −0.2 −2.8 −1.9 −3.7 −2.401.1.9 Food products (nec) 2 102.0 101.3 2.4 0.7 0.8 −1.1 0.3 −0.1 −2.1 −0.5 0.4 1.0 −0.7
01.2 Non-alcoholic beverages 10 97.9 96.4 −1.8 0.5 −1.6 0.3 −0.8 −1.4 −3.9 −1.4 −4.5 −3.8 −1.501.2.1 Coffee, tea and cocoa 3 98.5 98.8 −1.0 −1.4 −1.1 2.0 0.2 −0.4 1.9 0.1 −1.3 0.7 0.301.2.2 Mineral waters, soft drinks and juices 7 97.8 95.5 −2.0 1.4 −1.8 −0.3 −1.2 −2.0 −5.9 −1.9 −5.7 −5.6 −2.3
02.1 Alcoholic beverages 15 94.6 94.1 −3.0 −1.5 −3.3 −4.2 −5.2 −2.3 −4.4 −3.8 −2.1 −2.1 −0.602.1.1 Spirits 4 92.9 93.4 −3.5 −0.9 −3.4 −5.0 −3.1 −2.5 −2.0 −4.7 −3.7 −2.1 0.502.1.2 Wine 7 94.7 93.3 −3.4 −2.1 −4.2 −5.5 −7.0 −2.6 −6.7 −3.7 −1.5 −2.8 −1.502.1.3 Beer 4 96.1 95.9 −1.9 −1.0 −1.5 −1.3 −4.3 −1.8 −2.8 −3.2 −1.5 −1.0 −0.1
02.2 Tobacco 20 102.1 106.8 −0.1 0.2 4.7 4.9 4.8 4.8 5.8 5.9 5.2 4.5 4.7
03.1 Clothing 51 101.8 103.1 −1.4 −0.9 0.4 −0.4 −0.4 −0.6 −1.2 1.1 −0.8 0.9 1.303.1.2 Garments 45 101.7 103.2 −1.5 −1.2 0.3 −0.6 −0.4 −0.6 −1.1 1.5 −0.6 1.1 1.403.1.3 Other clothing and clothing accessories 5 102.4 102.8 0.1 1.7 1.0 1.1 −0.7 −1.0 −2.4 −1.7 −3.9 −1.2 0.403.1.4 Cleaning, repair and hire of clothing 1 100.8 103.3 0.1 − 2.3 2.2 2.3 2.4 2.3 2.6 2.6 2.6 2.5
03.2 Footwear including repairs 9 99.5 100.1 −1.0 −1.4 −0.2 −0.5 −2.1 −1.1 −1.6 0.4 0.6 1.0 0.6
04.1 Actual rentals for housing 60 101.3 102.3 0.1 0.1 1.9 1.8 1.8 1.3 1.3 1.2 1.0 1.0 1.0
04.2 Owner occupiers housing costs 165 100.9 103.6 0.2 0.2 2.2 2.3 2.3 2.4 2.4 2.4 2.7 2.6 2.6
04.3 Regular maintenance and repair of the dwelling 2 100.7 99.5 0.4 1.0 0.2 −0.3 − 1.0 0.9 1.0 0.6 −1.8 −1.204.3.1 Materials for maintenance and repair 1 101.1 97.9 0.8 2.0 −0.1 −1.2 −0.6 1.4 0.9 1.2 0.4 −4.3 −3.104.3.2 Services for maintenance and repair 1 100.3 101.0 0.1 − 0.5 0.6 0.6 0.5 0.8 0.8 0.8 0.7 0.7
04.4 Water supply and misc. services for the dwelling 10 99.8 101.2 − − 1.4 1.4 1.4 1.4 1.4 1.4 1.4 1.4 1.404.4.1 Water supply 5 99.6 100.5 − − 0.9 0.9 0.9 0.9 0.9 0.9 0.9 0.9 0.904.4.3 Sewerage collection 5 100.1 102.0 − − 1.9 1.9 1.9 1.9 1.9 1.9 1.9 1.9 1.9
04.5 Electricity, gas and other fuels 29 98.5 97.7 −0.2 0.4 −4.3 −3.8 −3.4 −3.3 −3.1 −1.9 −1.3 −1.4 −0.804.5.1 Electricity 14 99.9 99.7 − − −0.2 −0.2 −0.2 −0.2 −0.2 −0.2 −0.2 −0.2 −0.204.5.2 Gas 13 97.8 93.3 − − −7.3 −6.7 −6.7 −6.6 −6.6 −4.6 −4.6 −4.6 −4.604.5.3 Liquid fuels 1 82.3 110.8 −7.9 8.6 −26.9−23.5−15.1−11.1 −2.0 0.9 15.0 14.3 34.704.5.4 Solid fuels 1 100.5 101.7 − 0.6 −0.6 0.3 −0.1 −0.9 −0.8 −0.4 0.1 0.6 1.2
05.1 Furniture, furnishings and carpets 16 101.6 104.0 2.0 2.5 1.3 1.0 −0.6 −0.5 −1.4 −1.6 0.5 1.8 2.305.1.1 Furniture and furnishings 13 101.5 103.3 2.4 2.6 0.2 0.3 −2.0 −1.2 −2.5 −3.0 −0.1 1.5 1.805.1.2 Carpets and other floor coverings 3 101.9 106.6 0.9 1.8 4.8 3.0 3.6 2.8 2.9 3.2 3.7 3.6 4.6
05.2 Household textiles 6 100.7 99.9 −1.0 − −0.6 −2.2 −3.1 −2.9 −2.8 −3.8 −1.4 −1.9 −0.8
05.3 Household appliances, fitting and repairs 7 101.7 103.7 0.3 1.6 0.2 1.2 1.5 0.5 0.1 0.8 2.2 0.7 2.005.3.1/2 Major appliances and small electric goods 6 102.2 103.9 0.4 1.9 −0.1 1.1 1.5 0.5 0.2 0.9 2.0 0.3 1.705.3.3 Repair of household appliances 1 98.7 102.4 −0.2 0.3 1.5 1.7 1.7 −0.1 −0.2 −0.3 3.3 3.3 3.8
05.4 Glassware , tableware and household utensils 5 100.5 97.1 0.7 −1.0 −1.4 −1.9 −2.1 −2.1 −0.6 −2.4 −3.0 −1.7 −3.4
05.5 Tools and equipment for house and garden 5 100.1 98.7 − 0.8 −1.9 −1.4 −1.9 −0.3 −0.7 −1.2 −2.5 −2.2 −1.5
05.6 Goods and services for routine maintenance 11 100.4 100.9 1.7 −0.7 0.6 0.7 0.9 −0.5 −0.7 −0.6 1.1 2.9 0.505.6.1 Non-durable household goods 4 98.3 94.7 3.7 −2.1 −4.6 −4.1 −3.4 −7.2 −7.2 −6.6 −2.3 2.0 −3.705.6.2 Domestic services and household services 7 101.7 104.7 0.5 0.2 3.9 3.7 3.6 3.6 3.2 3.1 3.2 3.3 2.9
06.1 Medical products, appliances and equipment 11 99.9 101.7 − 0.3 1.4 1.1 2.5 0.5 1.1 1.5 0.9 1.5 1.806.1.1 Pharmaceutical products 7 99.8 102.3 0.3 0.3 1.3 1.0 3.4 1.1 2.1 2.4 1.9 2.5 2.506.1.2/3 Other medical and therapeutic equipment 4 100.1 100.5 −0.5 0.2 1.4 1.0 0.9 −0.7 −0.7 −0.2 −0.7 −0.2 0.5
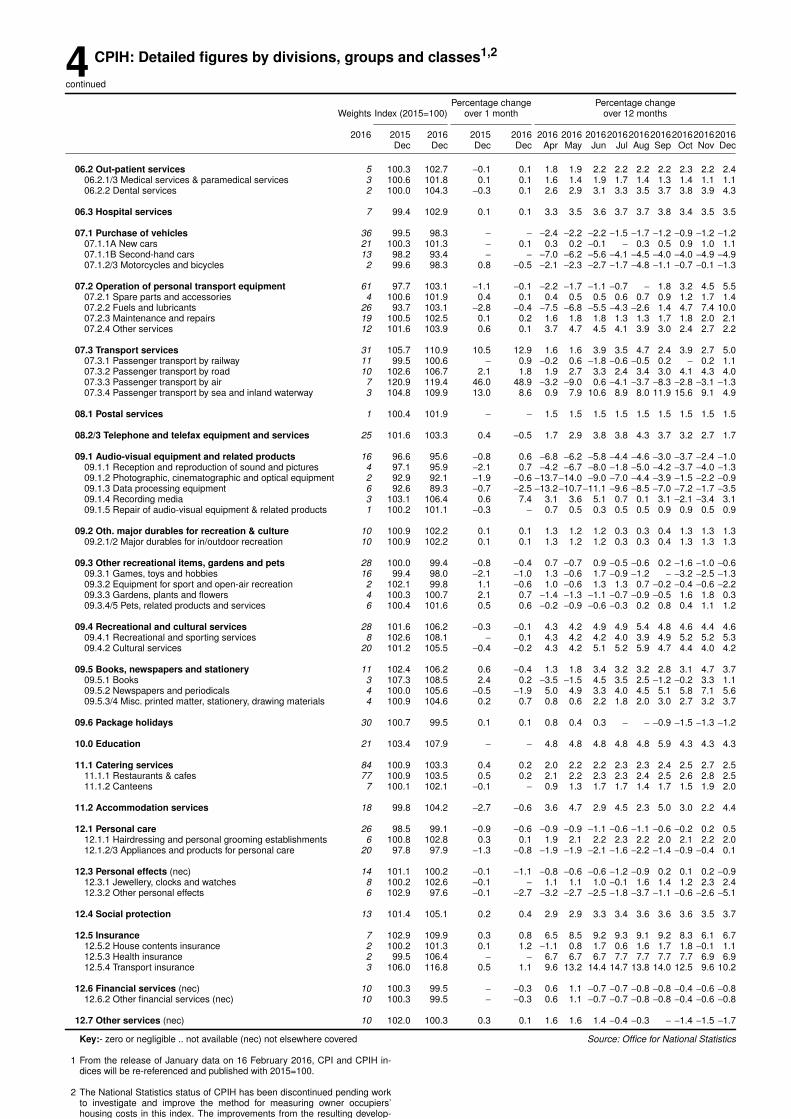
4 CPIH: Detailed figures by divisions, groups and classes1,2
continued
Percentage change Percentage changeWeights Index (2015=100) over 1 month over 12 months
2016 2015 2016 2015 2016 2016 2016 20162016 2016 2016 2016 2016 2016Dec Dec Dec Dec Apr May Jun Jul Aug Sep Oct Nov Dec
06.2 Out-patient services 5 100.3 102.7 −0.1 0.1 1.8 1.9 2.2 2.2 2.2 2.2 2.3 2.2 2.406.2.1/3 Medical services & paramedical services 3 100.6 101.8 0.1 0.1 1.6 1.4 1.9 1.7 1.4 1.3 1.4 1.1 1.106.2.2 Dental services 2 100.0 104.3 −0.3 0.1 2.6 2.9 3.1 3.3 3.5 3.7 3.8 3.9 4.3
06.3 Hospital services 7 99.4 102.9 0.1 0.1 3.3 3.5 3.6 3.7 3.7 3.8 3.4 3.5 3.5
07.1 Purchase of vehicles 36 99.5 98.3 − − −2.4 −2.2 −2.2 −1.5 −1.7 −1.2 −0.9 −1.2 −1.207.1.1A New cars 21 100.3 101.3 − 0.1 0.3 0.2 −0.1 − 0.3 0.5 0.9 1.0 1.107.1.1B Second-hand cars 13 98.2 93.4 − − −7.0 −6.2 −5.6 −4.1 −4.5 −4.0 −4.0 −4.9 −4.907.1.2/3 Motorcycles and bicycles 2 99.6 98.3 0.8 −0.5 −2.1 −2.3 −2.7 −1.7 −4.8 −1.1 −0.7 −0.1 −1.3
07.2 Operation of personal transport equipment 61 97.7 103.1 −1.1 −0.1 −2.2 −1.7 −1.1 −0.7 − 1.8 3.2 4.5 5.507.2.1 Spare parts and accessories 4 100.6 101.9 0.4 0.1 0.4 0.5 0.5 0.6 0.7 0.9 1.2 1.7 1.407.2.2 Fuels and lubricants 26 93.7 103.1 −2.8 −0.4 −7.5 −6.8 −5.5 −4.3 −2.6 1.4 4.7 7.4 10.007.2.3 Maintenance and repairs 19 100.5 102.5 0.1 0.2 1.6 1.8 1.8 1.3 1.3 1.7 1.8 2.0 2.107.2.4 Other services 12 101.6 103.9 0.6 0.1 3.7 4.7 4.5 4.1 3.9 3.0 2.4 2.7 2.2
07.3 Transpor t ser vices 31 105.7 110.9 10.5 12.9 1.6 1.6 3.9 3.5 4.7 2.4 3.9 2.7 5.007.3.1 Passenger transpor t by railway 11 99.5 100.6 − 0.9 −0.2 0.6 −1.8 −0.6 −0.5 0.2 − 0.2 1.107.3.2 Passenger transpor t by road 10 102.6 106.7 2.1 1.8 1.9 2.7 3.3 2.4 3.4 3.0 4.1 4.3 4.007.3.3 Passenger transpor t by air 7 120.9 119.4 46.0 48.9 −3.2 −9.0 0.6 −4.1 −3.7 −8.3 −2.8 −3.1 −1.307.3.4 Passenger transpor t by sea and inland waterway 3 104.8 109.9 13.0 8.6 0.9 7.9 10.6 8.9 8.0 11.9 15.6 9.1 4.9
08.1 Postal services 1 100.4 101.9 − − 1.5 1.5 1.5 1.5 1.5 1.5 1.5 1.5 1.5
08.2/3 Telephone and telefax equipment and services 25 101.6 103.3 0.4 −0.5 1.7 2.9 3.8 3.8 4.3 3.7 3.2 2.7 1.7
09.1 Audio-visual equipment and related products 16 96.6 95.6 −0.8 0.6 −6.8 −6.2 −5.8 −4.4 −4.6 −3.0 −3.7 −2.4 −1.009.1.1 Reception and reproduction of sound and pictures 4 97.1 95.9 −2.1 0.7 −4.2 −6.7 −8.0 −1.8 −5.0 −4.2 −3.7 −4.0 −1.309.1.2 Photographic, cinematographic and optical equipment 2 92.9 92.1 −1.9 −0.6 −13.7−14.0 −9.0 −7.0 −4.4 −3.9 −1.5 −2.2 −0.909.1.3 Data processing equipment 6 92.6 89.3 −0.7 −2.5 −13.2−10.7−11.1 −9.6 −8.5 −7.0 −7.2 −1.7 −3.509.1.4 Recording media 3 103.1 106.4 0.6 7.4 3.1 3.6 5.1 0.7 0.1 3.1 −2.1 −3.4 3.109.1.5 Repair of audio-visual equipment & related products 1 100.2 101.1 −0.3 − 0.7 0.5 0.3 0.5 0.5 0.9 0.9 0.5 0.9
09.2 Oth. major durables for recreation & culture 10 100.9 102.2 0.1 0.1 1.3 1.2 1.2 0.3 0.3 0.4 1.3 1.3 1.309.2.1/2 Major durables for in/outdoor recreation 10 100.9 102.2 0.1 0.1 1.3 1.2 1.2 0.3 0.3 0.4 1.3 1.3 1.3
09.3 Other recreational items, gardens and pets 28 100.0 99.4 −0.8 −0.4 0.7 −0.7 0.9 −0.5 −0.6 0.2 −1.6 −1.0 −0.609.3.1 Games, toys and hobbies 16 99.4 98.0 −2.1 −1.0 1.3 −0.6 1.7 −0.9 −1.2 − −3.2 −2.5 −1.309.3.2 Equipment for sport and open-air recreation 2 102.1 99.8 1.1 −0.6 1.0 −0.6 1.3 1.3 0.7 −0.2 −0.4 −0.6 −2.209.3.3 Gardens, plants and flowers 4 100.3 100.7 2.1 0.7 −1.4 −1.3 −1.1 −0.7 −0.9 −0.5 1.6 1.8 0.309.3.4/5 Pets, related products and services 6 100.4 101.6 0.5 0.6 −0.2 −0.9 −0.6 −0.3 0.2 0.8 0.4 1.1 1.2
09.4 Recreational and cultural services 28 101.6 106.2 −0.3 −0.1 4.3 4.2 4.9 4.9 5.4 4.8 4.6 4.4 4.609.4.1 Recreational and sporting services 8 102.6 108.1 − 0.1 4.3 4.2 4.2 4.0 3.9 4.9 5.2 5.2 5.309.4.2 Cultural services 20 101.2 105.5 −0.4 −0.2 4.3 4.2 5.1 5.2 5.9 4.7 4.4 4.0 4.2
09.5 Books, newspapers and stationery 11 102.4 106.2 0.6 −0.4 1.3 1.8 3.4 3.2 3.2 2.8 3.1 4.7 3.709.5.1 Books 3 107.3 108.5 2.4 0.2 −3.5 −1.5 4.5 3.5 2.5 −1.2 −0.2 3.3 1.109.5.2 Newspapers and periodicals 4 100.0 105.6 −0.5 −1.9 5.0 4.9 3.3 4.0 4.5 5.1 5.8 7.1 5.609.5.3/4 Misc. printed matter, stationer y, drawing materials 4 100.9 104.6 0.2 0.7 0.8 0.6 2.2 1.8 2.0 3.0 2.7 3.2 3.7
09.6 Package holidays 30 100.7 99.5 0.1 0.1 0.8 0.4 0.3 − − −0.9 −1.5 −1.3 −1.2
10.0 Education 21 103.4 107.9 − − 4.8 4.8 4.8 4.8 4.8 5.9 4.3 4.3 4.3
11.1 Catering services 84 100.9 103.3 0.4 0.2 2.0 2.2 2.2 2.3 2.3 2.4 2.5 2.7 2.511.1.1 Restaurants & cafes 77 100.9 103.5 0.5 0.2 2.1 2.2 2.3 2.3 2.4 2.5 2.6 2.8 2.511.1.2 Canteens 7 100.1 102.1 −0.1 − 0.9 1.3 1.7 1.7 1.4 1.7 1.5 1.9 2.0
11.2 Accommodation services 18 99.8 104.2 −2.7 −0.6 3.6 4.7 2.9 4.5 2.3 5.0 3.0 2.2 4.4
12.1 Personal care 26 98.5 99.1 −0.9 −0.6 −0.9 −0.9 −1.1 −0.6 −1.1 −0.6 −0.2 0.2 0.512.1.1 Hairdressing and personal grooming establishments 6 100.8 102.8 0.3 0.1 1.9 2.1 2.2 2.3 2.2 2.0 2.1 2.2 2.012.1.2/3 Appliances and products for personal care 20 97.8 97.9 −1.3 −0.8 −1.9 −1.9 −2.1 −1.6 −2.2 −1.4 −0.9 −0.4 0.1
12.3 Personal effects (nec) 14 101.1 100.2 −0.1 −1.1 −0.8 −0.6 −0.6 −1.2 −0.9 0.2 0.1 0.2 −0.912.3.1 Jeweller y, clocks and watches 8 100.2 102.6 −0.1 − 1.1 1.1 1.0 −0.1 1.6 1.4 1.2 2.3 2.412.3.2 Other personal effects 6 102.9 97.6 −0.1 −2.7 −3.2 −2.7 −2.5 −1.8 −3.7 −1.1 −0.6 −2.6 −5.1
12.4 Social protection 13 101.4 105.1 0.2 0.4 2.9 2.9 3.3 3.4 3.6 3.6 3.6 3.5 3.7
12.5 Insurance 7 102.9 109.9 0.3 0.8 6.5 8.5 9.2 9.3 9.1 9.2 8.3 6.1 6.712.5.2 House contents insurance 2 100.2 101.3 0.1 1.2 −1.1 0.8 1.7 0.6 1.6 1.7 1.8 −0.1 1.112.5.3 Health insurance 2 99.5 106.4 − − 6.7 6.7 6.7 7.7 7.7 7.7 7.7 6.9 6.912.5.4 Transpor t insurance 3 106.0 116.8 0.5 1.1 9.6 13.2 14.4 14.7 13.8 14.0 12.5 9.6 10.2
12.6 Financial services (nec) 10 100.3 99.5 − −0.3 0.6 1.1 −0.7 −0.7 −0.8 −0.8 −0.4 −0.6 −0.812.6.2 Other financial services (nec) 10 100.3 99.5 − −0.3 0.6 1.1 −0.7 −0.7 −0.8 −0.8 −0.4 −0.6 −0.8
12.7 Other services (nec) 10 102.0 100.3 0.3 0.1 1.6 1.6 1.4 −0.4 −0.3 − −1.4 −1.5 −1.7
Key:- zero or negligible .. not available (nec) not elsewhere covered
1 From the release of Januar y data on 16 Febr uary 2016, CPI and CPIH in-dices will be re-referenced and published with 2015=100.
2 The National Statistics status of CPIH has been discontinued pending wor kto investigate and improve the method for measuring owner occupiers’housing costs in this index. The improvements from the resulting develop-
Source: Office for National Statistics