Consumer Preferences of Wine in Italy Applying Best:Worst...
21
4 th International Conference of the Academy of Wine Business Research, Siena, 17-19 July 2008 Refereed Paper 1 Consumer Preferences of Wine in Italy Applying Best:Worst Scaling * Prof. Leonardo Casini University of Florence Piazzale delle Cascine 18, 50144 Florence, Italy Telephone: +390553288243 Fax: +39055361771 e-mail: [email protected] Mr. Armando Maria Corsi University of Florence Piazzale delle Cascine 18, 50144 Florence, Italy Telephone: +61883029169 Fax: +61883020442 e-mail: [email protected] Prof. Larry Lockshin University of South Australia 70 North Terrace, Adelaide, SA 5001, Australia Telephone: +61883020261 Fax: +61883020442 e-mail: [email protected] Dr. Eli Cohen Ben Gurion University of the Negev P.O.B. 653, Beer-Sheva 84105, Israel Telephone: +97286472776 Fax: +97286472920 e-mail: [email protected] University of South Australia 70 North Terrace, Adelaide, SA 5001, Australia e-mail: [email protected] Dr. Steve Goodman University of Adelaide 233 North Terrace, Adelaide SA 5000, Australia Telephone: +61883037044 Fax: +61882234782 e-mail: [email protected] * The paper is the result of the common efforts of the five authors. In particular A. M. Corsi is author of paragraphs 2 and 5. The other paragraphs have been written jointly.
Transcript of Consumer Preferences of Wine in Italy Applying Best:Worst...
4th International Conference of the Academy of Wine Business Research, Siena, 17-19 July 2008Refereed Paper
1
Consumer Preferences of Wine in Italy Applying Best:Worst Scaling*
Prof. Leonardo CasiniUniversity of Florence
Piazzale delle Cascine 18, 50144 Florence, ItalyTelephone: +390553288243
Fax: +39055361771e-mail: [email protected]
Mr. Armando Maria CorsiUniversity of Florence
Piazzale delle Cascine 18, 50144 Florence, ItalyTelephone: +61883029169
Fax: +61883020442e-mail: [email protected]
Prof. Larry LockshinUniversity of South Australia
70 North Terrace, Adelaide, SA 5001, AustraliaTelephone: +61883020261
Fax: +61883020442e-mail: [email protected]
Dr. Eli CohenBen Gurion University of the NegevP.O.B. 653, Beer-Sheva 84105, Israel
Telephone: +97286472776Fax: +97286472920
e-mail: [email protected]
University of South Australia70 North Terrace, Adelaide, SA 5001, Australia
e-mail: [email protected]
Dr. Steve GoodmanUniversity of Adelaide
233 North Terrace, Adelaide SA 5000, AustraliaTelephone: +61883037044
Fax: +61882234782e-mail: [email protected]
*The paper is the result of the common efforts of the five authors. In particular A. M. Corsi is author ofparagraphs 2 and 5. The other paragraphs have been written jointly.
4th International Conference of the Academy of Wine Business Research, Siena, 17-19 July 2008Refereed Paper
1
Abstract
This work focuses on measuring the importance of the attributes which influence thewine choice of Italian consumers when they buy wine either in a retail or on-premise setting.Our goal is try to identify significant behavioural differences across geo-demographicsubgroups of the sample, in order to give marketers an instrument to develop more efficientmarketing strategies. We applied the BW method together with an ordinal logistic regressionto compare subgroups. The main advantages of this methodology are (a) a higherdiscriminating power for the measure of the degree of importance given by respondents toattributes, (b) the avoidance of rating bias problems, and (c) the use of ordinal logisticregression to compare potential market segments. A general analysis of BW scores shows thatdirect, personal and sensorial experiences are the most importance attributes when choosingwine. The ordinal logistic regression model showed only a few differences among socio-demographic segments in the sample. However, some important differences were found. Inparticular the analysis showed that while choosing wine in retail stores the level ofinvolvement respondents have toward wine, the frequency of consumption and thegeographical province of the respondents showed the greatest differences in attributeimportance. Respondents in the on-premise sector were more similar across the socio-demographic groups compared to the retail respondents, with differences in the age ofinterviewees having the greatest compared to other variables.
Key words: best-worst scaling, choice criteria for wine, Italy, on-premise, retail, wine choice
4th International Conference of the Academy of Wine Business Research, Siena, 17-19 July 2008Refereed Paper
1
1. IntroductionThis work aims at understanding what the attributes able to influence more the choice of
consumers are when they buy wine either in the retail or the on-premise setting. Our goal istry to identify significant behavioural differences between segments of the population, so as togive marketers a powerful instrument to develop efficient marketing strategies.
In a holistic marketing perspective a marketer has to find the way to understand theneeds, the wants and the demands of customers. Moreover, he has to choose which markets totarget, so as to get, keep and grow customers through creating, delivering and communicatingsuperior customer value (Kotler and Keller, 2007). These tasks become very difficult toachieve in the wine market due to two major issues. On one side, consumers are faced withmore than 100,000 wine brands in the global market, several dozen main grape varieties andcountries of origin (Goodman et al., 2005). Other elements influence the choice of consumers,e.g. the vintage year, the design of the label and the information on back labels, the shape ofthe bottle, the brand name, alcohol content, etc. Thus, consumers are presented with anenormous amount of information, which impacts on their perceived risk of making a wrongdecision while buying a bottle of wine. Redundant and ambiguous information may lead to alack of trust in wine retailers and producers (Casini et al., 2008). On the other side, the highlevel of fragmentation of the Italian wine industry does not allow the majority of the firms totarget all the possible segments of the population. It is instead necessary that each firm,according to the means at its disposal, focuses on specific market segments, so as to developefficient marketing strategies. Therefore, understanding what attributes are able to influencethe choice of different segments of the population represents the first and fundamental stepevery marketer should undertake.
This study is also important as the analysis of product attributes and population segmentsis not usually possible through consumer panel data, but through stated preference data (BenAkiva and Lerman, 1985). The latter allow researchers to get more insights on whatconsumers’ actual preferences are, instead of evaluating them through panel data, which onlyregister what was purchased and not necessarily what consumers really wanted (Goodman etal., 2005).
Thirdly, this study utilises a recent methodology, which already proved to be verysuccessful for the study of consumer preferences, especially when cross cultural comparisonsare needed: the Best:Worst (BW) method (Cohen and Neira, 2003; Goodman et al., 2005;Flynn et al. 2007; Lee et al., 2007) This paper represents one part of a major project usingBW measures of consumer preferences for wine in Italy. The same questionnaire has beenused in 12 other countries, so the results are comparable across nations, allowing wine firmsto have an international database of consumer preferences around the world at their disposal.This can give them powerful insights not only on their domestic market, but also on foreigncountries, which purchase a 27% of the production of New World (NW) countries and a 10%of the European ones (Istituto di Servizi per il Mercato Agricolo Alimentare – ISMEA,2007a).
To the best of our knowledge, this research is the first using the BW method togetherwith an ordinal logistic regression model, with the objective to show the differences inresponse behaviour across geo-demographic subgroups of two distinct regions of the samecountry. The remainder of the paper is structured in the following way. After this briefintroduction, a literature review, the methodology of the work and data collection techniquesare presented. This is followed by a discussion of the results and conclusions with somesuggestions for further research to end the paper.
4th International Conference of the Academy of Wine Business Research, Siena, 17-19 July 2008Refereed Paper
2
2. Literature reviewLiterature on consumer behaviour toward wine preferences presents a plethora of works
that aim to explain what attributes intervene in the choice process and how demographicfactors may influence these choices. There is not, in fact, a unique answer to this question aswine, compared to other food products, (a) has many more labels to choose between(Goodman et al., 2005) and (b) can be judged only through “search” and “credence”attributes, as its taste may vary from vintage to vintage, although brand and other extrinsicattributes remain identical (Lockshin et al., 2006). The difficulty in processing so muchproduct information may generate a confused state of mind in the pre-purchase phase, whichnegatively affects consumers’ information processing and decision-making abilities and canlead consumers to make suboptimal choices (Walsh, 1999).
Consumers try to reduce confusion by a variety of means. Researchers found theelements able to most influence the choice of consumers are the attractiveness of the frontlabel, the variety of the grapes, the brand and the region of origin. However, all theseattributes impact differently on consumers according to demographic variables, e.g. age(Gluckman, 1990; Bruwer et al., 2002; Barber et al., 2006; Seghieri et al., 2007), incomelevels (Felzensztein et al., 2004; Barber et al., 2006), involvement (Lockshin et al., 2001;2006; Rodriguez Santos et al., 2006) and frequency of consumption (Perrouty et al., 2006;Martinez-Carrasco Martinez et al., 2006; Atkin et al., 2007).
Goodman et al. (2005) found that Australian consumers tend to be more influenced bypremium wines, grape varieties and wines from premium regions, while consumers in Israelrely more on the suggestions of a friend, the brand name and the variety of the grape. In asimilar study Goodman et al. (2006) found that the Cabernet, Shiraz and the quality reputationof a region are the three most influencing choice attributes, but their rank changes dependingon gender, frequency of consumption, age and involvement.
In relation to the importance of front labels, consumers shop with their eyes (Rocchi andStefani, 2005), with women rating higher than men items like colours, images, pictures andlogos (Thomas and Pickering; 2003; Atkin et al., 2007). Barber et al. (2006) got to the sameconclusion, but they also added that females find back labels significantly more confusing,hard to read and have too much information. However, back labels represent an underutilizedarea for providing information to consumers, who find it a primary source for increasingproduct knowledge and for making a product choice (Charters et al., 2000). Closures too enterin the choice process especially for women who consider wax seals an indication of freshnessand foil coverings and indication of quality (Barber et al., 2006). Seghieri et al. (2007)suggest that as consumers tend to evaluate labels in different ways, labels should be designedaccording to the targeted market segment, e.g. a basic label for the usual buyer, a detailed onefor interested consumers and a creative label for rational ones.
The variety of the grape is another important decision factor (Thomas and Pickering,2003; Felzensztein et al., 2004; Balestrini and Gamble, 2006) that varies in relation to thegrape under consideration (Ling and Lockshin, 2003). Its effect becomes even stronger for thechoice of New World wines (Lockshin and Hall, 2003) and when consumers select wines inspecialist off-licence shops (Felzensztein and Dinnie, 2005). Jarvis et al. (2003; 2007) foundin Australia that both white and red varieties are the second most important attribute toinfluence loyalty levels of consumers. In particular they found that Chardonnay, Riesling(white) and Shiraz and Cabernet (red) show excess behavioural loyalty, with other grapevarieties chosen mainly to try something different.
Perrouty et al. (2006) found that novice consumers give value to the region of originindependently of the type of brand and the price level. Conversely, experts find that the brandis a perfect moderator of the region-of-origin equity. Moreover, these researchers showed that
4th International Conference of the Academy of Wine Business Research, Siena, 17-19 July 2008Refereed Paper
3
as consumer’s expertise increases, people tend to give greater importance to a combination ofproduct attributes, instead of evaluating them alone. Orth et al. (2005) showed that wineregion equity originates from the evaluation of six consumer motivational factors: price,quality of the wine, social acceptance, emotional, environmental and human values. Schamel(2006) discovered that the region-of-origin becomes an important factor only for regions thatmainly sell red wines. Linked to this, Yue et al. (2006) stated that brand and region-of-originare both important items for the promotion of a wine. Balestrini and Gamble (2006) extendthe concept of the geographical importance from region to country level, finding that forChinese consumers the country-of-origin is the element that influences choice at most.
Balestrini and Gamble (2006) also found that consumers rely highly on peerrecommendations, as also stated by Spawton (1991) and Wansinsk et al. (2006). The formerfound that in order to reduce the risk of making a bad decision consumer tend to (a) choosebrands that express quality, (b) rely on peer recommendations and (c) rely on retail assistance.The latter found that in a restaurant setting there could be three ways to reduce the financialand social risk associated with the order of a wine: (a) waiter recommendations, (b) food-winepairing suggestions or (c) small wine tasting portions. Apart from making consumers morecomfortable with the choice, good wine suggestions will lead to an increase in wine sales forthe restaurant. In the same setting Manske and Cordua (2005) found that the role of thesommelier is of strategic importance, as it may lead to an increase of wine sales of 10-15% to25%. Moreover, a sommelier may arrange all the intrinsic and extrinsic attributes of a wineand present them in way that helps consumers in making a right choice. Other attributes ableto influence consumer choice are the alcoholic content of the wine (Lockshin and Rhodus,1993) and reading about wine at home (Unwin, 1999), an activity, which seems to bepreferred more by men than women. Conversely, the latter tend to rely more on theinformation they find on the shelf (Atkin et al., 2007). These studies show there is a widerange of factors influencing consumer choice for wine, but no definitive conclusion.
It is important to highlight that the vast majority of these studies focus on a generalpurchase behaviour, while only few take into consideration the place where consumers buythe wine (Martinez-Carrasco Martinez et al., 2006). Nevertheless, substantial differences inpurchase behavior between these two distribution channels exist, as proved by the commercialdata. In Italy, for example, while the off-trade sector accounts for a 60% of the total winesales in volume, the on-trade sector represents a 62% of the total value (EuromonitorInternational, 2007).
3. MethodologyWhen conducting quantitative research on the analysis of consumer preferences one
could develop the analysis through (Bednarz, 2006): rating based models; ranking tasks; constant sum tasks; Method of paired comparisons.
These methods have been trialled in various consumer contexts, which has resulted inmainly rating based scales to be used. However, rating scales present several negative aspects,which stimulated researchers to find alternative and innovative instruments to analyseconsumer preferences. First of all cultural differences influence the way people give ratings toitems (Dolnicar and Grün, 2007; Diamantopoulos et al., 2006; Usunier and Lee, 2005; vanHerk et al., 2004). Hence, when one wants to compare data collected in different culturalsettings, as in our case, one risks to have a biased analysis of respondents behaviour.Moreover, some countries like Italy or the United States use the extremes in the scale more,compared to Japanese, Australian or French people (Lee et al., 2007; Usunier and Lee, 2005).

4th International Conference of the Academy of Wine Business Research, Siena, 17-19 July 2008Refereed Paper
4
As a consequence, in some countries we risk to have higher rating means than in others,although the importance people place to the same item is identical. Given this, the order ofimportance of values, which can be obtained through the BW, is the only elements to becompared across countries and cultures (Lee at al., 2007). In addition Cunningham et al.(2006) highlighted the importance of cross cultural lexical equivalence, as this may bring tobiased rating scales, maybe only partially due to real cultural differences. Then, the spatialposition of the “strongly agree” Likert scale rate influences choice (Bednarz, 2006). Friedmanet al. (1994) demonstrated that people express higher agreement when this rate is located inthe left-hand side of the questionnaire. Finally, how could we affirm that the distance (andconsequently the difference in importance) between a score of 1 to 2 is equal to the distancebetween 3 to 4? This is rarely true (Cohen, 2003). BW also offers advantages compared totraditional Discrete Choice Experiments (DCE). Flynn et al. (2007) stated that with BW it ispossible to estimate the impact of all but one attribute, where the impact of an attribute is theaverage across all its levels. Traditional “pick one” DCEs cannot do it.
A solution to these problems has been given by Finn and Louviere (1992) through the socalled Best:Worst (BW) method, which proved to be empirically successful, but it was notuntil 2005 that Marley and Louviere gave a rigorous methodological explanation for it(Marley and Louviere 2005). BW scaling can be considered an extension of the pairedcomparison method, offering similar benefits, but a more efficient questioning structure(Cohen and Orme, 2004). Respondents are asked to tick the item they consider the mostpreferred (BEST) and the item they consider the least preferred (WORST) from a set of threeor more items (Cohen and Markowitz, 2002) for each of the choice sets presented to them –generally not more than 20 (Cohen, 2003). Choice sets are created through different kind ofdesigns. Some examples include Full Factorial design, Fractional Factorial design, LatinSquare design and Balanced Incomplete Block design (Louviere, 2006). The benefits of BWare many. First of all, it provides a more discriminating way to measure the degree ofimportance respondents give to each item. As interviewees can only choose one mostpreferred and one least preferred item in each choice set, they are necessarily required tomake tradeoffs between benefits (Cohen, 2003). Secondly, BW avoids problems of ratingbias, as there is only one way to choose the most and the least preferred item, independentlyfrom the cultural background of the respondent (Goodman et al., 2005). This is interesting, asit allows the BW method to be a powerful way to conduct cross-national studies on consumerbehaviour (Auger et al., 2007; Goodman et al., 2005, Cohen and Neira, 2003). Moreover, asthe BW rating is obtained through a standardization of the raw scores, it overcomes thesystematic tendency of rating based scales of producing distort ratings (Lee et al., 2007).Finally, the BW generates an ordinal ranking of the items for each respondent (Goodman etal., 2005), hence an ordinal logistic regression model can be applied to the data, to obtain adeeper understanding of the differences among the groups analysed. The ordinal logisticregression, in fact, has fewer assumptions about the distribution of the data and is thereforemore reliable in estimating those differences. In addition, a preliminary analysis of data iseasy to conduct and understand (Goodman et al., 2005), making it a useful instrument also formanagers Finally, the outcomes of the BW method proved to be about 95% as accurate aswhen using a multinomial logit, which models the same data (Auger et al., 2004). The fewweaknesses of the BW method are only related to a lack of published articles and a lack ofmethodology documentation (Bednarz, 2006).
An international group of experts in the sector of wine marketing identified the 13 mostinfluential attributes for the choice of a wine in both settings, analysing a large database ofstudies in the area of consumer behaviour for wine, part of which have been indicated in theliterature review. In the present study the design follows the criteria of the BalancedIncomplete Block design, adopted by Auger et al. (2004). This kind of design ensures that
4th International Conference of the Academy of Wine Business Research, Siena, 17-19 July 2008Refereed Paper
5
each attribute appears 4 times across all choice sets and, within each set, each pair ofattributes appears only once. The level of importance of each attribute, also called BW score(Cohen, 2003, Goodman et al., 2005) is obtained by subtracting the number of times anattribute is chosen as the least important (WORST) to the number of times the attribute hasbeen chosen as the most important (BEST). In order to standardize the result, this number isdivided by the number of respondents and by the frequency each attribute appears in thechoice sets. The standardisation allows different groups of respondents to be comparable.
This score has been used on one side to define the general level of importance peoplefrom these two geographic regions give to the attributes able to influence the choice of thewine. On the other side, researchers registered the number of times each individual ranked anattribute as BEST minus the number of times he/she ranked it as WORST.
As explained before, BW rating scales create an ordinal ranking of items, hence it ispossible to analyse it through an ordinal regression model. This model has been largelyapplied in literature (Spais and Vasileiou, 2006; Fu et al., 2006; Rutheford et al., 2007) whenthe choice object presents several modal outcomes or where the choice object can be betterrepresented as a set of points on a scale of inclination (Davies and Hodge, 2006), with theresult that a binary choice model becomes too restrictive to represent reality (Wynn et al.,2001). When respondents are asked to give a score based on a Likert scale (Halkos andSalamouris, 2003; Kondoh and Jussaume, 2006; Norris et al., 2006), they express a level ofagreement regarding a question giving a score ranging from 1 to, generally, 5 or 7. Similarly,it is possible to record BW scores as the difference in the number of times an item is chosenas the most preferred and the number of times it is chosen as the least preferred. In otherwords, it has to be understood if the distribution of BW scores among the individualsclassified in respect to the variables is statistically significant.
4. Data collectionData were collected in two distinct Italian regions: Veneto and Le Marches, located in
Northern and Central Italy, respectively. Although these two regions belong to the samecountry, they present significant socio-demographic differences, which can likely lead todifferent behaviours in how wines are chosen.
First of all the average GDP per capita is higher in Veneto than in Le Marches – €28,286and €24,277, respectively. However, while the GDP at constant prices increased by 4% in LeMarches from 2000 to 2004, in Veneto it only increased by 1.7%. Veneto has four times thenumber of inhabitants than Le Marches and the three main economic sectors – primary sector,industry and service sector are different in importance. In Veneto they account for a 3.7%, a38.8% and a 57.5% of the total workforce (Sistema Statistico Regionale – SISTAR – Veneto,2007), while in Le Marches the three sectors represent a 4.4%, a 28.2% and a 67.4% of thetotal workforce (SISTAR Le Marches, 2007). In terms of wine making activity, Veneto has ha72,460 of vineyards, while Le Marches only 19,187. This leads to a production of hl7,208,000 of wine and must in Veneto in 2006, while in Le Marches is 7 times lower.Narrowing the analysis to quality wines, these two regions produced hl 2,281,000 and hl380,000 of DOC-DOCG wines. It is not by chance that Le Marches and Veneto hold 16 and37 GI-DOC-DOCG denominations, respectively (ISMEA, 2007b). However, it should benoted that ISMEA (2007b), analysing the ratio of volume/value of the production, classifiedLe Marches as a “niching quality” region, while Veneto was considered a “quantity first”region. ISTAT (2008) revealed that the percentages of inhabitants in Veneto who consumed atleast one alcoholic beverage (wine, beer, etc.) in the past 12 months is higher than in LeMarches (74.9% vs. 73.4%), but in the latter region there are more people who daily drinkalcoholic beverages (32.1% vs. 38.7%). This tendency is either valid in respect to sex andunits of alcohol drunk daily. Only females from Veneto who drink more than 3 units of
4th International Conference of the Academy of Wine Business Research, Siena, 17-19 July 2008Refereed Paper
6
alcohol per day are more than the respective category in Le Marches (2.1% vs. 1.7%). Venetohas a higher number of people who tend to consume alcohol outside meals (12.0% vs. 6.3%)and also more people who drank more than 6 units of alcohol in one occasion at least once inthe past 12 years (10.8% vs. 7.7%). It is interesting in this context that while Veneto tend tohave a higher percentage of people who drink beer and other alcoholic beverages than LeMarches, the latter proportionally have more people who drink wine (62.7% vs. 60.0%). Inparticular, Le Marches have more people who consume 1-2 glasses of wine per day thanVeneto and also more people who have a daily intake of wine above 0.5litre.
The data collection took place at two cycles of cultural meetings organised in these tworegions by an entertainment agency. People who came to these events belong to a medium tohigh income level groups, interested in cultural events regarding music, art, books, etc. butwho also like the opportunity to share a nice glass of wine in a refined environment.Questionnaires were collected in Le Marches in July 2007 for a total of 192 valid responses,100 for the retail and 92 for the on-premise sector. In Veneto more than 400 questionnaireswere gathered from July to September 2007, 214 for the retail sector 216 for the on-premisesector. Respondents received a complete questionnaire and a pen. Each interviewee wasinformed about the technique and asked to complete the questionnaire and return it beforeleaving the meeting. Those who completed the questionnaire properly could take part in adrawing of a selection of bottles of wines offered by the University of Florence and the“Verdicchio di Matelica” Consortium. In order to take part to the drawing, respondents hadsimply to complete the last part of the questionnaire with their names, telephone numberand/or e-mail address, and post it in a box located at the entrance of the meeting place. In thisway researchers have been able to guarantee the anonymity of the responses given byinterviewees, while the latter had an incentive to participate to data collection.
The need to present two questionnaires – one for the retail and the other for the on-premise sector – lies in the fact that consumers tend to behave differently when they have tochoose a wine in these two choice settings (Martinez-Carrasco Martinez et al., 2006). After apreliminary part where respondents gave some information about their habits toward the wineworld, respondents were asked to evaluate the 13 attributes through 13 different choice setsand the respondents were asked to choose the attribute, which influences MOST him/her andthe attribute, which influences LEAST him/her while choosing wine in a restaurant for a mealwith his/her friends (for the on-premise format), or for a dinner at home with his/her friends(retail format).
The final part of the questionnaire asked information about gender, age, income, numberof people in the household and few clues on the last bottle of wine bought. The sample hasbeen segmented in different groups based on the geographic area (Veneto and Le Marches),the income level, age, involvement and frequency of drinking. In particular 3 age groups (18-40; 41-55, 55+ years old) have been created. Then, 3 income levels have been definedaccording to the per capita income taken from the National Institute of Statistics of Italy(ISTAT). The current average GDP per capita of Italy was € 24,502 in 2005. As aconsequence we classified in the “below average” group respondents who declared to have anincome of less than €22,000, in the “about average” group those with an income between €22,000 and €32,000, and in the last group people with an annual income of more than €32,000. In order to specify the concept of involvement, researchers recorded the score givento three questions regarding the interest people devote to wines based on a Likert scaleranging from 1 to 5 (Lockshin et al., 2006). The sample was divided into 3 categories (about1/3 of the sample in each category) based on the sum of the three questions. People withscores ≤10 points were classified as “low involved” consumers, from 11 to 13 “mediuminvolved” and above 13 points as highly involved in wine. The three questions were summedto create a single attribute. A factor analysis with varimax rotation was run for the three
4th International Conference of the Academy of Wine Business Research, Siena, 17-19 July 2008Refereed Paper
7
questions and one factor explains more than 76% of the variance. Moreover, the internalreliability was very high (Cronbach’s alpha=0.84). In respect to the frequency of consumptionrespondents who drink wine more than once a week have been considered frequent drinkers.Those who consume wine less often have been grouped in the low frequency group.
The BW score (dependent variable) was compared across the different geo-demographicgroups (independent variables) using an ordinal regression model. Differently from thestandard application of this model, scores in this work go from -4 to +4, rather than from 1 ton, n= 5, 7, 9, depending on the scale used. This occurs because the frequency of appearance ofeach attribute is 4, hence each respondent may tick it as the least (most) important attributefour times or each combination of most/least in the middle. In some cases we observed thatscores were limited to -3. This happens when no respondent rated the attribute four times asthe worst. For each variable where there were statistically significant results, a new BWanalysis was conducted on the responses given by each geo-demographic segment, in order tosee how different sub-groups of the population rated the attributes. This second analysisfocused on the attributes able to influence the choice of consumers, i.e. those that received apositive score (Goodman et al., 2005).
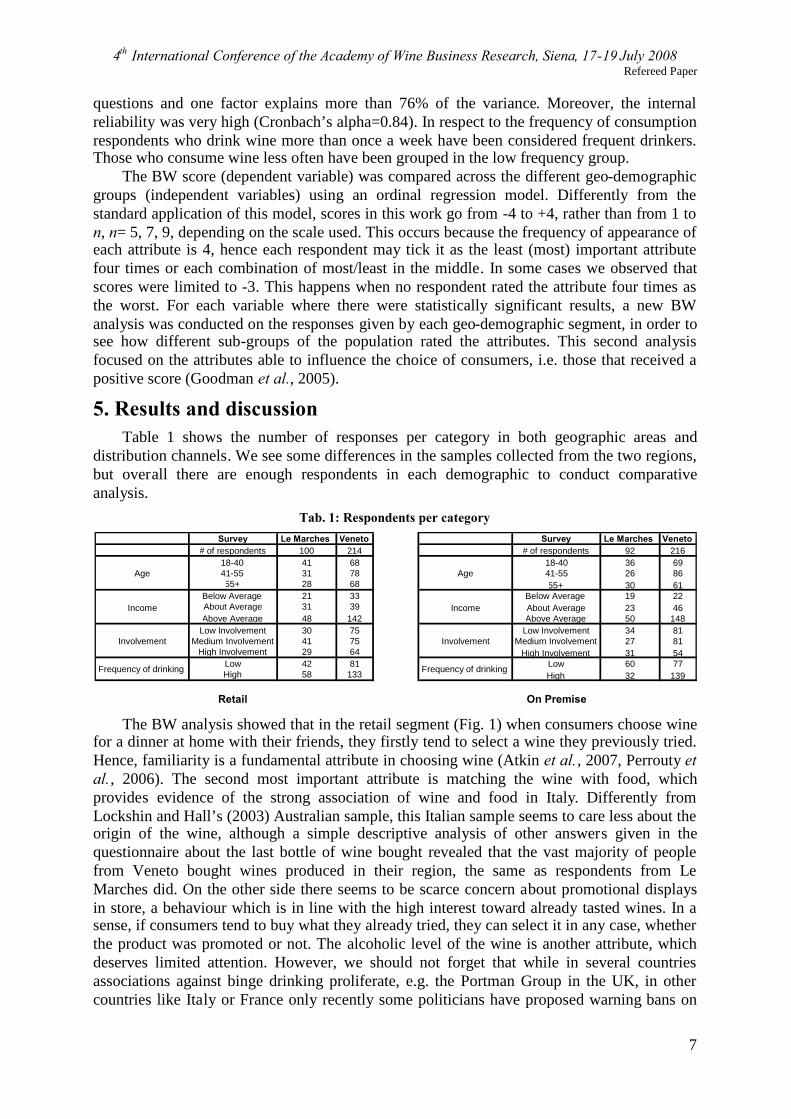
5. Results and discussionTable 1 shows the number of responses per category in both geographic areas and
distribution channels. We see some differences in the samples collected from the two regions,but overall there are enough respondents in each demographic to conduct comparativeanalysis.
Tab. 1: Respondents per categorySurvey Le Marches Veneto Survey Le Marches Veneto
# of respondents 100 214 # of respondents 92 21618-40 41 68 18-40 36 6941-55 31 78 41-55 26 8655+ 28 68 55+ 30 61
Below Average 21 33 Below Average 19 22About Average 31 39 About Average 23 46Above Average 48 142 Above Average 50 148
Low Involvement 30 75 Low Involvement 34 81Medium Involvement 41 75 Medium Involvement 27 81
High Involvement 29 64 High Involvement 31 54Low 42 81 Low 60 77High 58 133 High 32 139
Retail On Premise
Age
Income
Involvement
Frequency of drinking
Age
Income
Involvement
Frequency of drinking
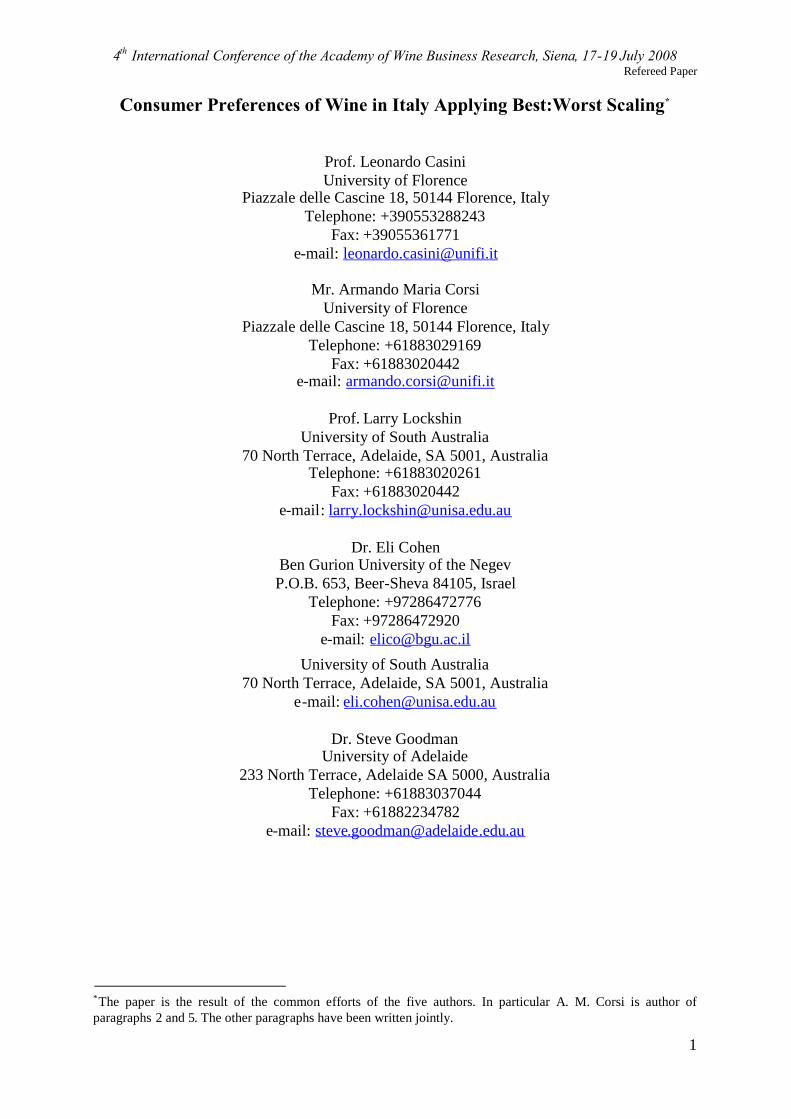
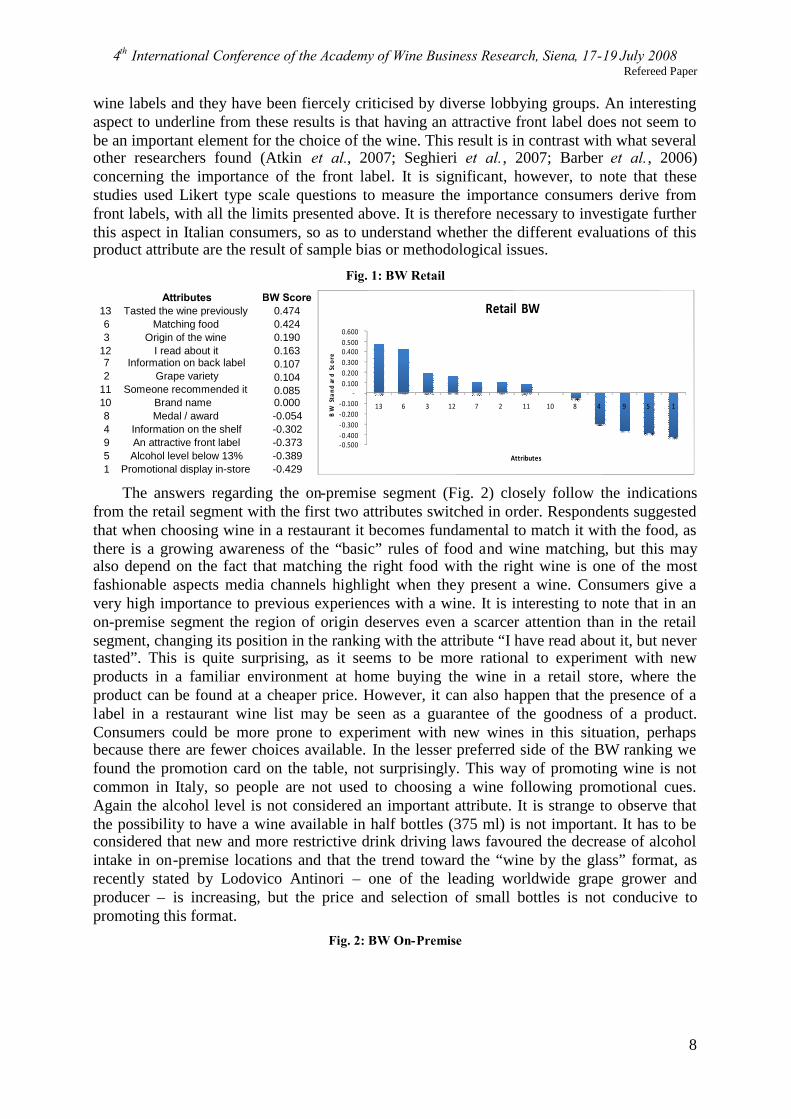
The BW analysis showed that in the retail segment (Fig. 1) when consumers choose winefor a dinner at home with their friends, they firstly tend to select a wine they previously tried.Hence, familiarity is a fundamental attribute in choosing wine (Atkin et al., 2007, Perrouty etal., 2006). The second most important attribute is matching the wine with food, whichprovides evidence of the strong association of wine and food in Italy. Differently fromLockshin and Hall’s (2003) Australian sample, this Italian sample seems to care less about theorigin of the wine, although a simple descriptive analysis of other answers given in thequestionnaire about the last bottle of wine bought revealed that the vast majority of peoplefrom Veneto bought wines produced in their region, the same as respondents from LeMarches did. On the other side there seems to be scarce concern about promotional displaysin store, a behaviour which is in line with the high interest toward already tasted wines. In asense, if consumers tend to buy what they already tried, they can select it in any case, whetherthe product was promoted or not. The alcoholic level of the wine is another attribute, whichdeserves limited attention. However, we should not forget that while in several countriesassociations against binge drinking proliferate, e.g. the Portman Group in the UK, in othercountries like Italy or France only recently some politicians have proposed warning bans on
4th International Conference of the Academy of Wine Business Research, Siena, 17-19 July 2008Refereed Paper
8
wine labels and they have been fiercely criticised by diverse lobbying groups. An interestingaspect to underline from these results is that having an attractive front label does not seem tobe an important element for the choice of the wine. This result is in contrast with what severalother researchers found (Atkin et al., 2007; Seghieri et al., 2007; Barber et al., 2006)concerning the importance of the front label. It is significant, however, to note that thesestudies used Likert type scale questions to measure the importance consumers derive fromfront labels, with all the limits presented above. It is therefore necessary to investigate furtherthis aspect in Italian consumers, so as to understand whether the different evaluations of thisproduct attribute are the result of sample bias or methodological issues.
Fig. 1: BW Retail
Attributes BW Score13 Tasted the wine previously 0.4746 Matching food 0.4243 Origin of the wine 0.190
12 I read about it 0.1637 Information on back label 0.1072 Grape variety 0.104
11 Someone recommended it 0.08510 Brand name 0.0008 Medal / award -0.0544 Information on the shelf -0.3029 An attractive front label -0.3735 Alcohol level below 13% -0.3891 Promotional display in-store -0.429
-0.500-0.400-0.300-0.200-0.100
-0.1000.2000.3000.4000.5000.600
13 6 3 12 7 2 11 10 8 4 9 5 1
BW
Stan
dar
dSc
ore
Attributes
Retail BW
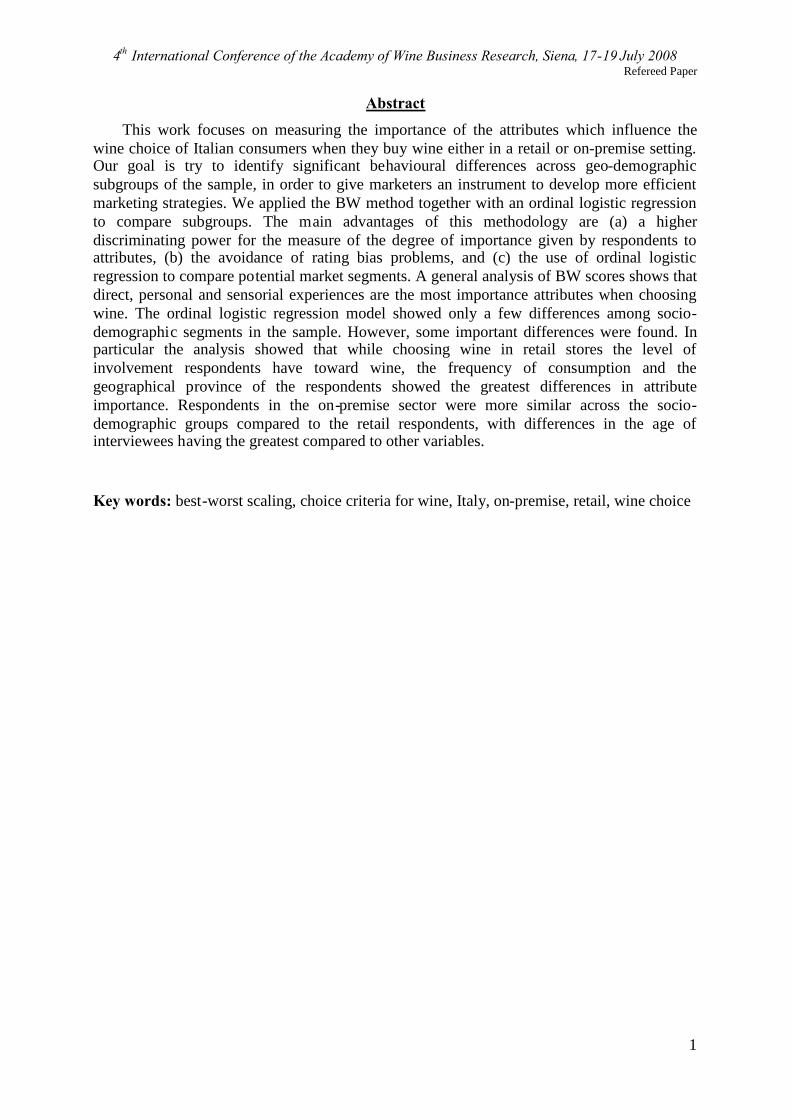
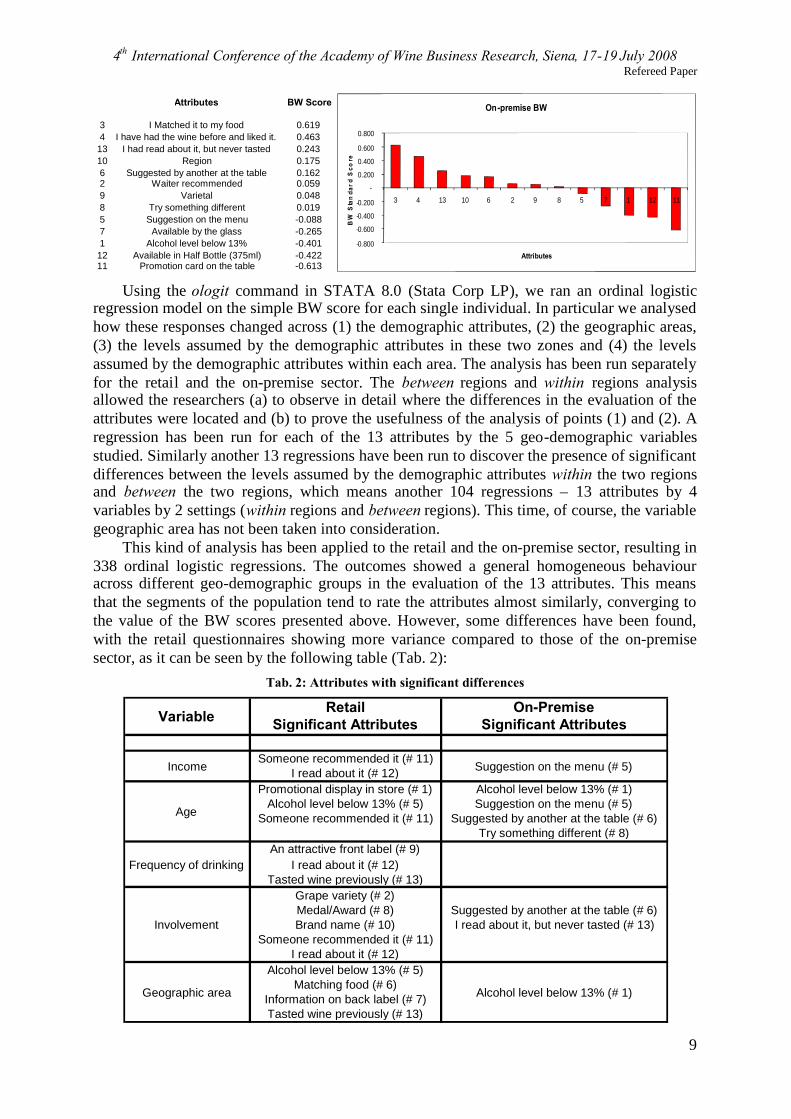
The answers regarding the on-premise segment (Fig. 2) closely follow the indicationsfrom the retail segment with the first two attributes switched in order. Respondents suggestedthat when choosing wine in a restaurant it becomes fundamental to match it with the food, asthere is a growing awareness of the “basic” rules of food and wine matching, but this mayalso depend on the fact that matching the right food with the right wine is one of the mostfashionable aspects media channels highlight when they present a wine. Consumers give avery high importance to previous experiences with a wine. It is interesting to note that in anon-premise segment the region of origin deserves even a scarcer attention than in the retailsegment, changing its position in the ranking with the attribute “I have read about it, but nevertasted”. This is quite surprising, as it seems to be more rational to experiment with newproducts in a familiar environment at home buying the wine in a retail store, where theproduct can be found at a cheaper price. However, it can also happen that the presence of alabel in a restaurant wine list may be seen as a guarantee of the goodness of a product.Consumers could be more prone to experiment with new wines in this situation, perhapsbecause there are fewer choices available. In the lesser preferred side of the BW ranking wefound the promotion card on the table, not surprisingly. This way of promoting wine is notcommon in Italy, so people are not used to choosing a wine following promotional cues.Again the alcohol level is not considered an important attribute. It is strange to observe thatthe possibility to have a wine available in half bottles (375 ml) is not important. It has to beconsidered that new and more restrictive drink driving laws favoured the decrease of alcoholintake in on-premise locations and that the trend toward the “wine by the glass” format, asrecently stated by Lodovico Antinori – one of the leading worldwide grape grower andproducer – is increasing, but the price and selection of small bottles is not conducive topromoting this format.
Fig. 2: BW On-Premise
4th International Conference of the Academy of Wine Business Research, Siena, 17-19 July 2008Refereed Paper
9
Attributes BW Score
3 I Matched it to my food 0.6194 I have had the wine before and liked it. 0.463
13 I had read about it, but never tasted 0.24310 Region 0.1756 Suggested by another at the table 0.1622 Waiter recommended 0.0599 Varietal 0.0488 Try something different 0.0195 Suggestion on the menu -0.0887 Available by the glass -0.2651 Alcohol level below 13% -0.401
12 Available in Half Bottle (375ml) -0.42211 Promotion card on the table -0.613
-0.800
-0.600
-0.400
-0.200
-
0.200
0.400
0.600
0.800
3 4 13 10 6 2 9 8 5 7 1 12 11
BW
Sta
nda
rdS
core
Attributes
On-premise BW
Using the ologit command in STATA 8.0 (Stata Corp LP), we ran an ordinal logisticregression model on the simple BW score for each single individual. In particular we analysedhow these responses changed across (1) the demographic attributes, (2) the geographic areas,(3) the levels assumed by the demographic attributes in these two zones and (4) the levelsassumed by the demographic attributes within each area. The analysis has been run separatelyfor the retail and the on-premise sector. The between regions and within regions analysisallowed the researchers (a) to observe in detail where the differences in the evaluation of theattributes were located and (b) to prove the usefulness of the analysis of points (1) and (2). Aregression has been run for each of the 13 attributes by the 5 geo-demographic variablesstudied. Similarly another 13 regressions have been run to discover the presence of significantdifferences between the levels assumed by the demographic attributes within the two regionsand between the two regions, which means another 104 regressions – 13 attributes by 4variables by 2 settings (within regions and between regions). This time, of course, the variablegeographic area has not been taken into consideration.
This kind of analysis has been applied to the retail and the on-premise sector, resulting in338 ordinal logistic regressions. The outcomes showed a general homogeneous behaviouracross different geo-demographic groups in the evaluation of the 13 attributes. This meansthat the segments of the population tend to rate the attributes almost similarly, converging tothe value of the BW scores presented above. However, some differences have been found,with the retail questionnaires showing more variance compared to those of the on-premisesector, as it can be seen by the following table (Tab. 2):
Tab. 2: Attributes with significant differences
Retail On-PremiseSignificant Attributes Significant Attributes
Someone recommended it (# 11)I read about it (# 12)
Promotional display in store (# 1) Alcohol level below 13% (# 1)Alcohol level below 13% (# 5) Suggestion on the menu (# 5)
Someone recommended it (# 11) Suggested by another at the table (# 6)Try something different (# 8)
An attractive front label (# 9)I read about it (# 12)
Tasted wine previously (# 13)Grape variety (# 2)Medal/Award (# 8) Suggested by another at the table (# 6)Brand name (# 10) I read about it, but never tasted (# 13)
Someone recommended it (# 11)I read about it (# 12)
Alcohol level below 13% (# 5)Matching food (# 6)
Information on back label (# 7)Tasted wine previously (# 13)
Alcohol level below 13% (# 1)
Suggestion on the menu (# 5)
Geographic area
Involvement
Frequency of drinking
Age
Income
Variable
4th International Conference of the Academy of Wine Business Research, Siena, 17-19 July 2008Refereed Paper
10
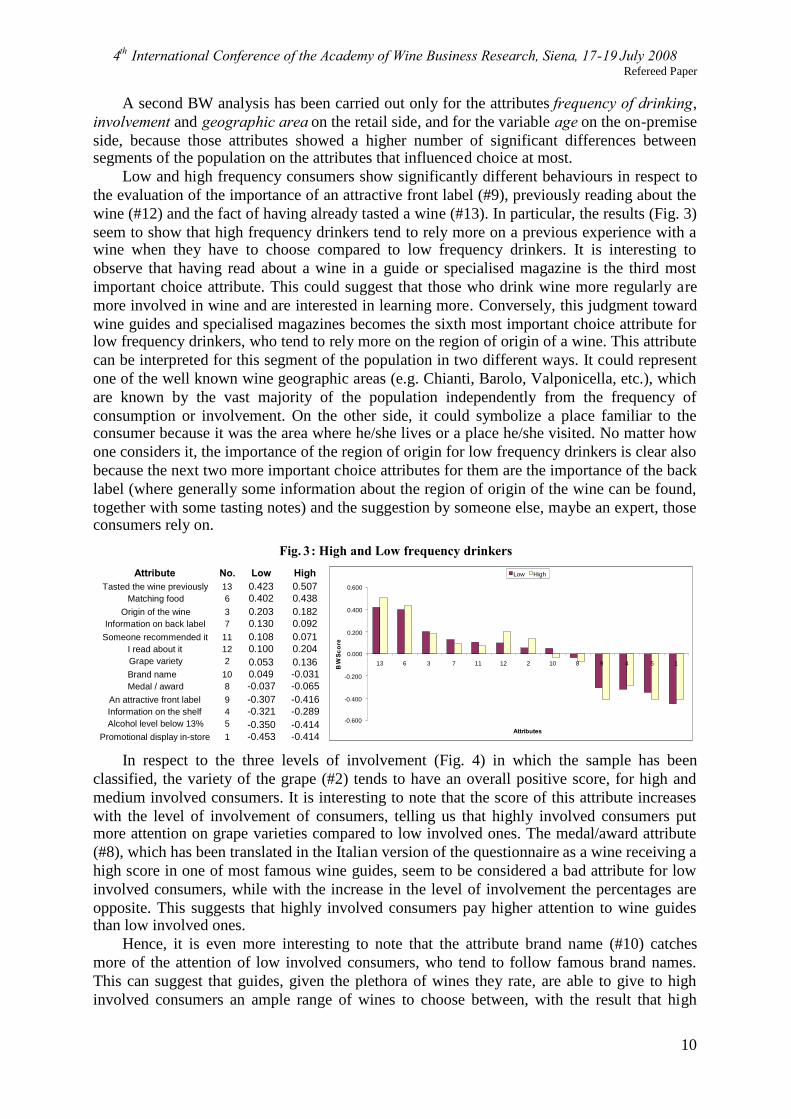
A second BW analysis has been carried out only for the attributes frequency of drinking,involvement and geographic area on the retail side, and for the variable age on the on-premiseside, because those attributes showed a higher number of significant differences betweensegments of the population on the attributes that influenced choice at most.
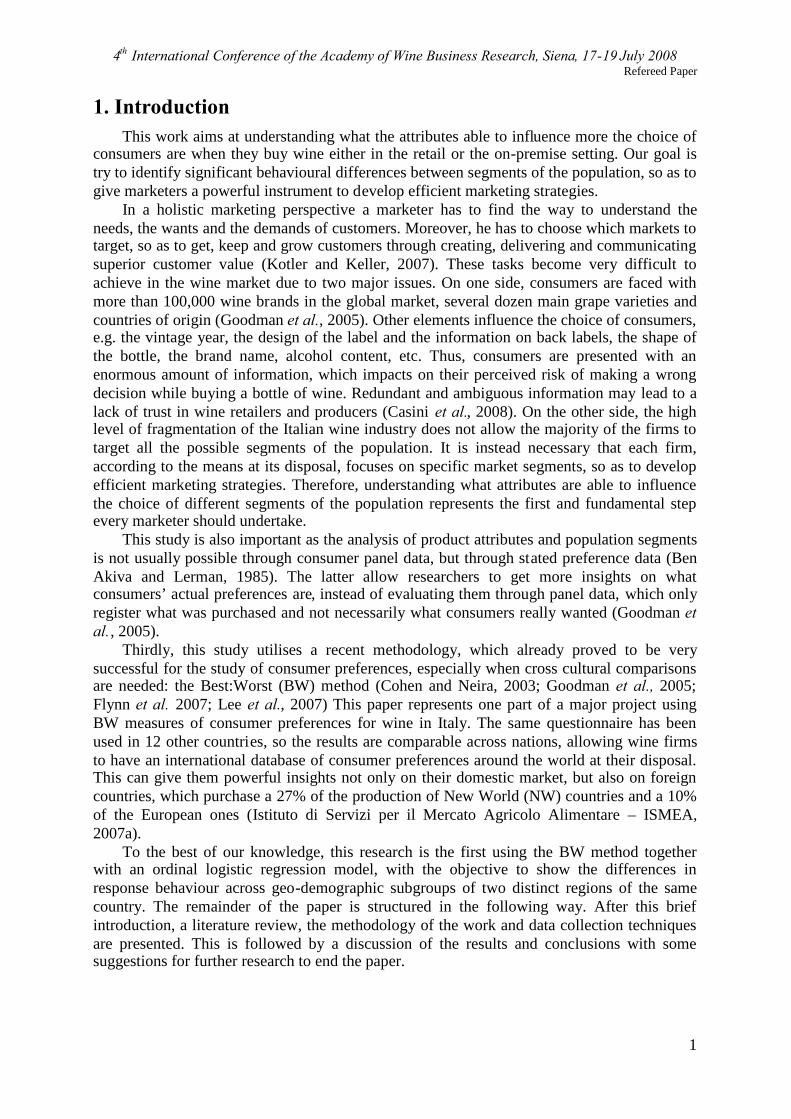
Low and high frequency consumers show significantly different behaviours in respect tothe evaluation of the importance of an attractive front label (#9), previously reading about thewine (#12) and the fact of having already tasted a wine (#13). In particular, the results (Fig. 3)seem to show that high frequency drinkers tend to rely more on a previous experience with awine when they have to choose compared to low frequency drinkers. It is interesting toobserve that having read about a wine in a guide or specialised magazine is the third mostimportant choice attribute. This could suggest that those who drink wine more regularly aremore involved in wine and are interested in learning more. Conversely, this judgment towardwine guides and specialised magazines becomes the sixth most important choice attribute forlow frequency drinkers, who tend to rely more on the region of origin of a wine. This attributecan be interpreted for this segment of the population in two different ways. It could representone of the well known wine geographic areas (e.g. Chianti, Barolo, Valponicella, etc.), whichare known by the vast majority of the population independently from the frequency ofconsumption or involvement. On the other side, it could symbolize a place familiar to theconsumer because it was the area where he/she lives or a place he/she visited. No matter howone considers it, the importance of the region of origin for low frequency drinkers is clear alsobecause the next two more important choice attributes for them are the importance of the backlabel (where generally some information about the region of origin of the wine can be found,together with some tasting notes) and the suggestion by someone else, maybe an expert, thoseconsumers rely on.
Fig. 3: High and Low frequency drinkers
Attribute No. Low HighTasted the wine previously 13 0.423 0.507
Matching food 6 0.402 0.438Origin of the wine 3 0.203 0.182
Information on back label 7 0.130 0.092Someone recommended it 11 0.108 0.071
I read about it 12 0.100 0.204Grape variety 2 0.053 0.136Brand name 10 0.049 -0.031Medal / award 8 -0.037 -0.065
An attractive front label 9 -0.307 -0.416Information on the shelf 4 -0.321 -0.289Alcohol level below 13% 5 -0.350 -0.414
Promotional display in-store 1 -0.453 -0.414
-0.600
-0.400
-0.200
0.000
0.200
0.400
0.600
13 6 3 7 11 12 2 10 8 9 4 5 1
Attributes
BW
Sc
ore
Low High
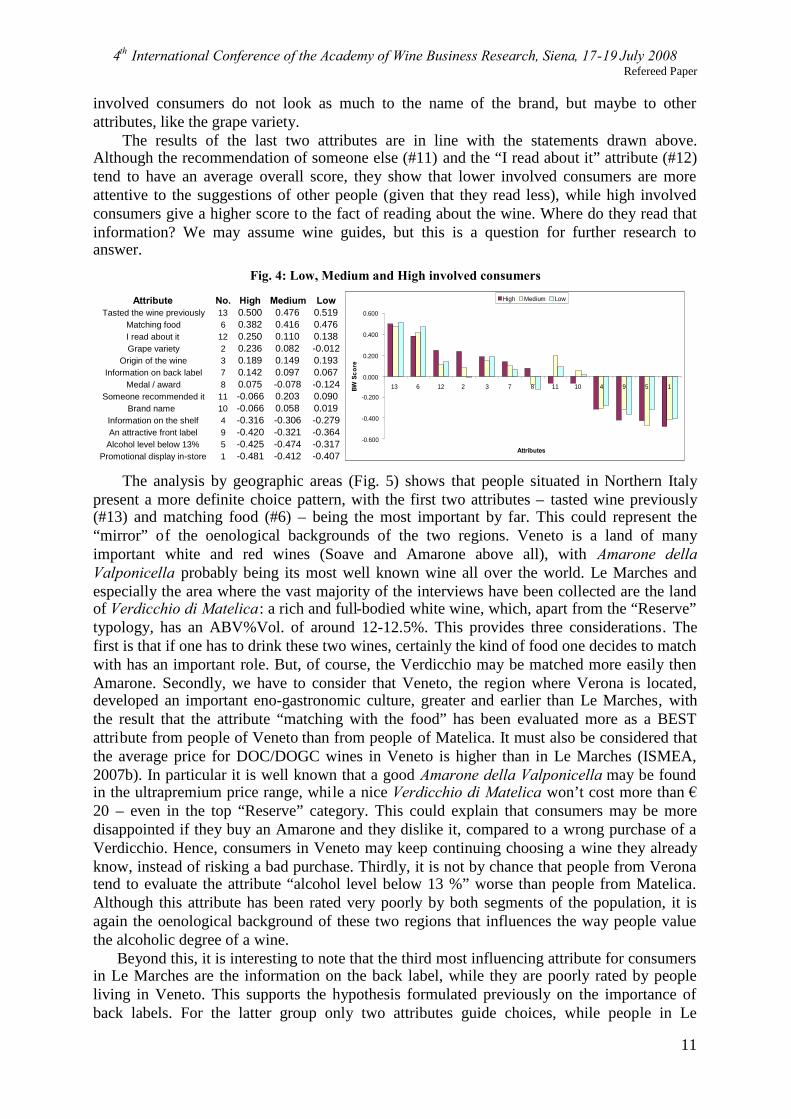
In respect to the three levels of involvement (Fig. 4) in which the sample has beenclassified, the variety of the grape (#2) tends to have an overall positive score, for high andmedium involved consumers. It is interesting to note that the score of this attribute increaseswith the level of involvement of consumers, telling us that highly involved consumers putmore attention on grape varieties compared to low involved ones. The medal/award attribute(#8), which has been translated in the Italian version of the questionnaire as a wine receiving ahigh score in one of most famous wine guides, seem to be considered a bad attribute for lowinvolved consumers, while with the increase in the level of involvement the percentages areopposite. This suggests that highly involved consumers pay higher attention to wine guidesthan low involved ones.
Hence, it is even more interesting to note that the attribute brand name (#10) catchesmore of the attention of low involved consumers, who tend to follow famous brand names.This can suggest that guides, given the plethora of wines they rate, are able to give to highinvolved consumers an ample range of wines to choose between, with the result that high
4th International Conference of the Academy of Wine Business Research, Siena, 17-19 July 2008Refereed Paper
11
involved consumers do not look as much to the name of the brand, but maybe to otherattributes, like the grape variety.
The results of the last two attributes are in line with the statements drawn above.Although the recommendation of someone else (#11) and the “I read about it” attribute (#12)tend to have an average overall score, they show that lower involved consumers are moreattentive to the suggestions of other people (given that they read less), while high involvedconsumers give a higher score to the fact of reading about the wine. Where do they read thatinformation? We may assume wine guides, but this is a question for further research toanswer.
Fig. 4: Low, Medium and High involved consumers
Attribute No. High Medium LowTasted the wine previously 13 0.500 0.476 0.519
Matching food 6 0.382 0.416 0.476I read about it 12 0.250 0.110 0.138Grape variety 2 0.236 0.082 -0.012
Origin of the wine 3 0.189 0.149 0.193Information on back label 7 0.142 0.097 0.067
Medal / award 8 0.075 -0.078 -0.124Someone recommended it 11 -0.066 0.203 0.090
Brand name 10 -0.066 0.058 0.019Information on the shelf 4 -0.316 -0.306 -0.279An attractive front label 9 -0.420 -0.321 -0.364
Alcohol level below 13% 5 -0.425 -0.474 -0.317Promotional display in-store 1 -0.481 -0.412 -0.407
-0.600
-0.400
-0.200
0.000
0.200
0.400
0.600
13 6 12 2 3 7 8 11 10 4 9 5 1
Attributes
BW
Sc
ore
High Medium Low
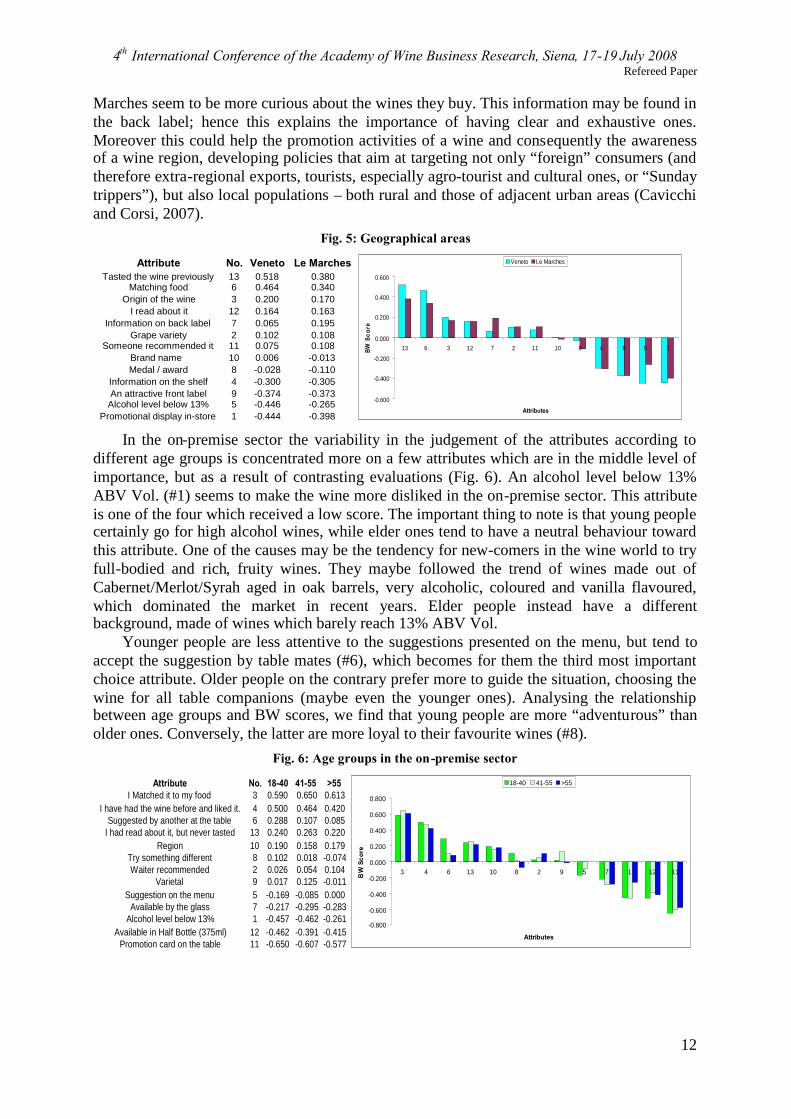
The analysis by geographic areas (Fig. 5) shows that people situated in Northern Italypresent a more definite choice pattern, with the first two attributes – tasted wine previously(#13) and matching food (#6) – being the most important by far. This could represent the“mirror” of the oenological backgrounds of the two regions. Veneto is a land of manyimportant white and red wines (Soave and Amarone above all), with Amarone dellaValponicella probably being its most well known wine all over the world. Le Marches andespecially the area where the vast majority of the interviews have been collected are the landof Verdicchio di Matelica: a rich and full-bodied white wine, which, apart from the “Reserve”typology, has an ABV%Vol. of around 12-12.5%. This provides three considerations. Thefirst is that if one has to drink these two wines, certainly the kind of food one decides to matchwith has an important role. But, of course, the Verdicchio may be matched more easily thenAmarone. Secondly, we have to consider that Veneto, the region where Verona is located,developed an important eno-gastronomic culture, greater and earlier than Le Marches, withthe result that the attribute “matching with the food” has been evaluated more as a BESTattribute from people of Veneto than from people of Matelica. It must also be considered thatthe average price for DOC/DOGC wines in Veneto is higher than in Le Marches (ISMEA,2007b). In particular it is well known that a good Amarone della Valponicella may be foundin the ultrapremium price range, while a nice Verdicchio di Matelica won’t cost more than €20 – even in the top “Reserve” category. This could explain that consumers may be moredisappointed if they buy an Amarone and they dislike it, compared to a wrong purchase of aVerdicchio. Hence, consumers in Veneto may keep continuing choosing a wine they alreadyknow, instead of risking a bad purchase. Thirdly, it is not by chance that people from Veronatend to evaluate the attribute “alcohol level below 13 %” worse than people from Matelica.Although this attribute has been rated very poorly by both segments of the population, it isagain the oenological background of these two regions that influences the way people valuethe alcoholic degree of a wine.
Beyond this, it is interesting to note that the third most influencing attribute for consumersin Le Marches are the information on the back label, while they are poorly rated by peopleliving in Veneto. This supports the hypothesis formulated previously on the importance ofback labels. For the latter group only two attributes guide choices, while people in Le
4th International Conference of the Academy of Wine Business Research, Siena, 17-19 July 2008Refereed Paper
12
Marches seem to be more curious about the wines they buy. This information may be found inthe back label; hence this explains the importance of having clear and exhaustive ones.Moreover this could help the promotion activities of a wine and consequently the awarenessof a wine region, developing policies that aim at targeting not only “foreign” consumers (andtherefore extra-regional exports, tourists, especially agro-tourist and cultural ones, or “Sundaytrippers”), but also local populations – both rural and those of adjacent urban areas (Cavicchiand Corsi, 2007).
Fig. 5: Geographical areas
Attribute No. Veneto Le MarchesTasted the wine previously 13 0.518 0.380
Matching food 6 0.464 0.340Origin of the wine 3 0.200 0.170
I read about it 12 0.164 0.163Information on back label 7 0.065 0.195
Grape variety 2 0.102 0.108Someone recommended it 11 0.075 0.108
Brand name 10 0.006 -0.013Medal / award 8 -0.028 -0.110
Information on the shelf 4 -0.300 -0.305An attractive front label 9 -0.374 -0.373
Alcohol level below 13% 5 -0.446 -0.265Promotional display in-store 1 -0.444 -0.398
-0.600
-0.400
-0.200
0.000
0.200
0.400
0.600
13 6 3 12 7 2 11 10 8 4 9 5 1
Attributes
BW
Sc
ore
Veneto Le Marches
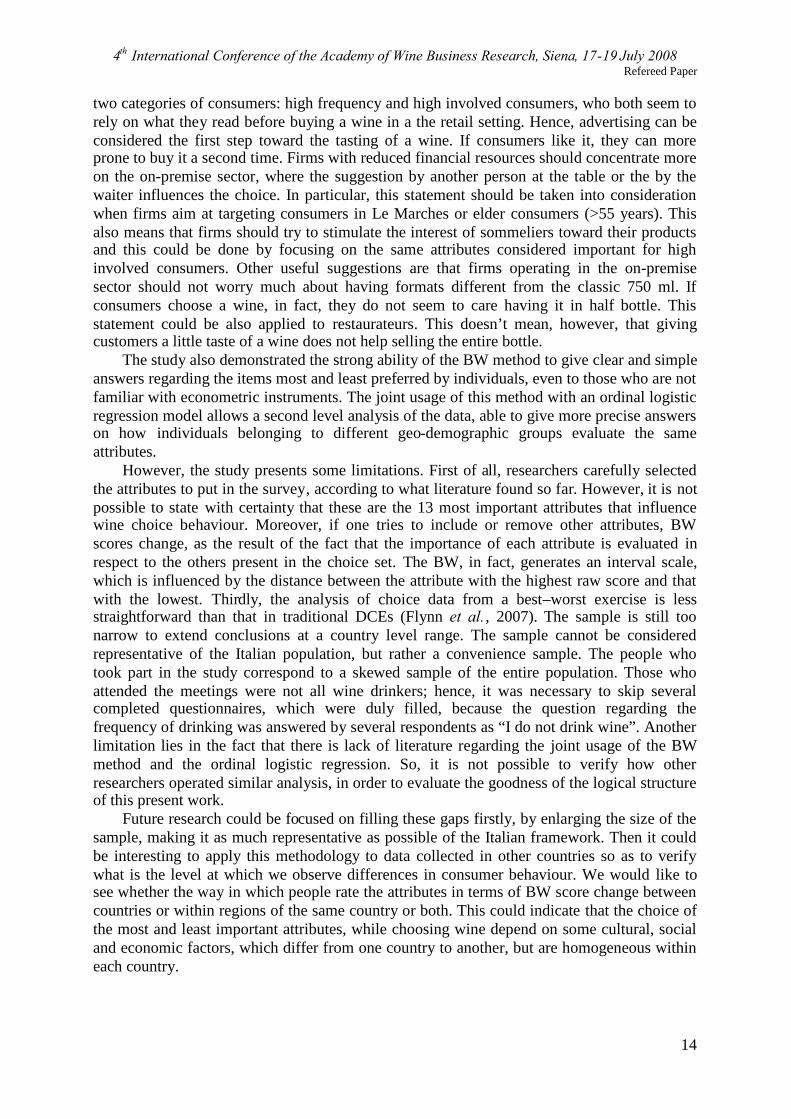
In the on-premise sector the variability in the judgement of the attributes according todifferent age groups is concentrated more on a few attributes which are in the middle level ofimportance, but as a result of contrasting evaluations (Fig. 6). An alcohol level below 13%ABV Vol. (#1) seems to make the wine more disliked in the on-premise sector. This attributeis one of the four which received a low score. The important thing to note is that young peoplecertainly go for high alcohol wines, while elder ones tend to have a neutral behaviour towardthis attribute. One of the causes may be the tendency for new-comers in the wine world to tryfull-bodied and rich, fruity wines. They maybe followed the trend of wines made out ofCabernet/Merlot/Syrah aged in oak barrels, very alcoholic, coloured and vanilla flavoured,which dominated the market in recent years. Elder people instead have a differentbackground, made of wines which barely reach 13% ABV Vol.
Younger people are less attentive to the suggestions presented on the menu, but tend toaccept the suggestion by table mates (#6), which becomes for them the third most importantchoice attribute. Older people on the contrary prefer more to guide the situation, choosing thewine for all table companions (maybe even the younger ones). Analysing the relationshipbetween age groups and BW scores, we find that young people are more “adventurous” thanolder ones. Conversely, the latter are more loyal to their favourite wines (#8).
Fig. 6: Age groups in the on-premise sector
Attribute No. 18-40 41-55 >55I Matched it to my food 3 0.590 0.650 0.613
I have had the wine before and liked it. 4 0.500 0.464 0.420Suggested by another at the table 6 0.288 0.107 0.085
I had read about it, but never tasted 13 0.240 0.263 0.220Region 10 0.190 0.158 0.179
Try something different 8 0.102 0.018 -0.074Waiter recommended 2 0.026 0.054 0.104
Varietal 9 0.017 0.125 -0.011Suggestion on the menu 5 -0.169 -0.085 0.000
Available by the glass 7 -0.217 -0.295 -0.283Alcohol level below 13% 1 -0.457 -0.462 -0.261
Available in Half Bottle (375ml) 12 -0.462 -0.391 -0.415Promotion card on the table 11 -0.650 -0.607 -0.577
-0.800
-0.600
-0.400
-0.200
0.000
0.200
0.400
0.600
0.800
3 4 6 13 10 8 2 9 5 7 1 12 11
Attributes
BW
Scor
e
18-40 41-55 >55
4th International Conference of the Academy of Wine Business Research, Siena, 17-19 July 2008Refereed Paper
13
6. Conclusions and future researchThis research applied the BW method together with an ordinal logistic regression to
investigate the degree of importance individuals give to 13 attributes related to choosing wine,and in particular the behavioural differences across geo-demographic subgroups of thepopulation sample. The main advantage of this methodology compared to others widely usedfor the analysis of consumer behavior is a higher discriminating power for the measure of thedegree of importance given by respondents to attributes. Secondly, it avoids problems ofrating bias, favouring cross national or even cross regional comparison of the way diversepopulations judge similar attributes. Thirdly, giving that the BW method generates ordinaloutcomes, it allows the utilisation of an ordinal logistic regression method for a bettersegmentation of the market.
A general analysis of BW scores shows that interviewees weight more the direct,personal and sensorial experience they had with a wine than other attributes. If respondentsalready have drunk a wine or if a wine matches best with the food they are going to eat eitherat home with their friends or in restaurant, there is a higher probability that this wine will bechosen. Conversely, our research found scant attention toward the alcoholic content of thewine and promotional activities carried out by both sectors in order to stimulate winepurchases. It has been surprising to note that in the retail sector an impressive front label isnot sufficient to influence the choice of consumers, while in the on-premise situation, thepossibility to buy a wine in a 375 ml format is not seen as a key incentive.
The analysis developed through the ordinal logistic regression model in respect to thegeo-demographic variables showed an overall similarity in the behaviour of the segments ofthe population. However, some differences are present; hence they justify the need to deepenthe analysis of the way people judged the 13 attributes. The model is not only a validmethodological instrument for data classification, but it also represents a way to give businessmanagers a greater insight on how different sub-groups of the population evaluate choiceattributes. It is then possible to develop more efficient marketing strategies, aiming attargeting diverse consumer segments. In particular the analysis showed that while choosingwine in retail stores the level of involvement respondents have toward wine is the factorwhich discriminates most the preferences expressed by consumers. Differences in terms ofincome, on the other side, don’t seem to segment the market strongly. In the on-premisesector respondents demonstrate a more homogeneous behaviour compared to the retailrespondents, with differences in the age of interviewees having greater influence than othervariables. Such homogeneity is so evident that respect to the frequency of consumption, noteven one attribute could discriminate between frequent and infrequent consumers.
According to these results producers should try to create a wine that matches at best withthe food people choose at a restaurant or for a dinner with their friends. The task is not easy asconsumers do not put a lot of attention to the front label, which then cannot be used as a wayto communicate the characteristics of the product. However, firms operating in Le Marchescould focus more on the information on the back label, as consumers in this region seem todevote more attention to it. Back labels should clearly expose information on (a) foodpairings, (b) region of origin and (c) grape variety, as consumers rated the importance theygive to these attributes in this categorical order. Indication about the alcoholic degree of awine should be limited to the legal requirements, as this is not considered a fundamentalchoice item. Hence, a well-written back label will help smaller firms compensate for thelower capacity to generate awareness about a wine through advertising on wine guides and/orspecialised magazines, which have been evaluated as an important factor in the choice processespecially for people living in Veneto. Firms with good financial power should try toadvertise themselves in guides and magazines, as they will benefit from this especially from
4th International Conference of the Academy of Wine Business Research, Siena, 17-19 July 2008Refereed Paper
14
two categories of consumers: high frequency and high involved consumers, who both seem torely on what they read before buying a wine in a the retail setting. Hence, advertising can beconsidered the first step toward the tasting of a wine. If consumers like it, they can moreprone to buy it a second time. Firms with reduced financial resources should concentrate moreon the on-premise sector, where the suggestion by another person at the table or the by thewaiter influences the choice. In particular, this statement should be taken into considerationwhen firms aim at targeting consumers in Le Marches or elder consumers (>55 years). Thisalso means that firms should try to stimulate the interest of sommeliers toward their productsand this could be done by focusing on the same attributes considered important for highinvolved consumers. Other useful suggestions are that firms operating in the on-premisesector should not worry much about having formats different from the classic 750 ml. Ifconsumers choose a wine, in fact, they do not seem to care having it in half bottle. Thisstatement could be also applied to restaurateurs. This doesn’t mean, however, that givingcustomers a little taste of a wine does not help selling the entire bottle.
The study also demonstrated the strong ability of the BW method to give clear and simpleanswers regarding the items most and least preferred by individuals, even to those who are notfamiliar with econometric instruments. The joint usage of this method with an ordinal logisticregression model allows a second level analysis of the data, able to give more precise answerson how individuals belonging to different geo-demographic groups evaluate the sameattributes.
However, the study presents some limitations. First of all, researchers carefully selectedthe attributes to put in the survey, according to what literature found so far. However, it is notpossible to state with certainty that these are the 13 most important attributes that influencewine choice behaviour. Moreover, if one tries to include or remove other attributes, BWscores change, as the result of the fact that the importance of each attribute is evaluated inrespect to the others present in the choice set. The BW, in fact, generates an interval scale,which is influenced by the distance between the attribute with the highest raw score and thatwith the lowest. Thirdly, the analysis of choice data from a best–worst exercise is lessstraightforward than that in traditional DCEs (Flynn et al., 2007). The sample is still toonarrow to extend conclusions at a country level range. The sample cannot be consideredrepresentative of the Italian population, but rather a convenience sample. The people whotook part in the study correspond to a skewed sample of the entire population. Those whoattended the meetings were not all wine drinkers; hence, it was necessary to skip severalcompleted questionnaires, which were duly filled, because the question regarding thefrequency of drinking was answered by several respondents as “I do not drink wine”. Anotherlimitation lies in the fact that there is lack of literature regarding the joint usage of the BWmethod and the ordinal logistic regression. So, it is not possible to verify how otherresearchers operated similar analysis, in order to evaluate the goodness of the logical structureof this present work.
Future research could be focused on filling these gaps firstly, by enlarging the size of thesample, making it as much representative as possible of the Italian framework. Then it couldbe interesting to apply this methodology to data collected in other countries so as to verifywhat is the level at which we observe differences in consumer behaviour. We would like tosee whether the way in which people rate the attributes in terms of BW score change betweencountries or within regions of the same country or both. This could indicate that the choice ofthe most and least important attributes, while choosing wine depend on some cultural, socialand economic factors, which differ from one country to another, but are homogeneous withineach country.
4th International Conference of the Academy of Wine Business Research, Siena, 17-19 July 2008Refereed Paper
15
7. ReferencesAtkin, T, Nowak, L., & Garcia, R. (2007). Women wine consumers: information search andretailing implications. International Journal of Wine Business Research, 19(4), 327-339.
Auger, P., Devinney, T. M., & Louviere, J. J. (2004). Consumer Social Beliefs: AnInternational Investigation using Best-Worst Scaling Methodology. Working Paper,Melbourne Business School. Melbourne, Australia: University of Melbourne.
Auger, P., Devinney, T. M., & Louviere, J. J. (2007). Using Best–Worst Scaling Methodologyto Investigate Consumer Ethical Beliefs Across Countries. Journal of Business Ethics, 70,299-326.
Balestrini, P., & Gamble, P. (2006). Country-of-origin effects on Chinese wine consumers.British Food Journal, 108(6), 396-412.
Barber, N., Almanza, B. A., & Donovan, J. R. (2006). Motivational factors of gender, incomeand age on selecting a bottle of wine. International Journal of Wine Marketing, 18(3), 218-232.
Bednarz, A. (2006). Best-Worst Scaling and its Relationship with Multinomial Logit.(Bachelor Dissertation, University of South Australia, 2006).
Ben-Akiva, M., & Lerman, S. R. (Eds.) (1985). Discrete Choice Analysis: Theory andApplication to Travel Demand. London, UK: The MIT Press.
Bruwer, J., Li, E., & Reid, M. (2002). Segmentation of the Australian Wine Market Using aWine-Related Lifestyle Approach. Journal of Wine Research, 13(3), 217-242.
Casini, L., Cavicchi, A., & Corsi, A. M. (2008). Trends in the British Wine Market andConsumer Confusion. British Food Journal, In press.
Cavicchi, A., & Corsi, A. M. (2007). Consumers’ values and the choice of an Italian specialtyfood: a qualitative analysis. Poster prepared for presentation at the I MediterraneanConference of Agro-Food Social Scientists. 103rd EAAE Seminar “Adding Value to the Agro-Food Supply Chain in the Future Euromediterranean Space”, Barcelona, Spain, April 23rd-25th.
Charters, S., Lockshin, L., & Unwin, T. (2000). Consumer responses to wine bottle backlabels. The Australian and New Zealand Wine Industry Journal of Oenology, Viticulture,Finance and Marketing, 15(3), 94-101.
Cohen, S. H. (2003). Maximum Difference Scaling: Improved Measures of Importance andPreference for Segmentation. Sawtooth Software Conference 2003 Proceedings. San Antonio,USA.
Cohen, S. H., & Markowitz, P. (2002). Renewing Market Segmentation: Some New Tools toCorrect Old Problems. ESOMAR – September.
Cohen, S. H., & Neira, L. (2003). Measuring Preferences for Product Benefits acrossCountries: Overcoming Scale Usage Bias with Maximum Difference Scaling. ESOMAR 2003Latin America Conference Proceedings. Amsterdam, NL.
Cohen, S. H., & Orme, B. (2004). What’s Your Preference? Marketing Research, 16, 32-37.
Cunningham, L. F., Young, C. E., Lee, M., & Ulaga, W. (2006). Customer perceptions ofservice dimensions: cross-cultural analysis and perspective. International Marketing Review,23(2), 192-210.
4th International Conference of the Academy of Wine Business Research, Siena, 17-19 July 2008Refereed Paper
16
Davies, B. B., & Hodge, I. D. (2006). Farmers’ Preferences for New Environmental PolicyInstruments: Determining the Acceptability of Cross Compliance for Biodiversity Benefits.Journal of Agricultural Economics, 57(3), 393-414.
Diamantopoulos, A., Reynolds, N. L., & Simintiras, A. C. (2006). The impact of responsestyles on the stability of cross-national comparisons. Journal of Business Research, 59, 925-935.
Dolnicar, S., & Grün, B. (2007) Cross-Cultural Differences in Survey Response Patterns.International Marketing Review, 24(2), 127-143.
Euromonitor International (2007). Wine – Country Sector Briefing. Retrieved 28/01/2008 fromhttp://www.portal.euromonitor.com/portal/server.pt?control=SetCommunity&CommunityID=206&PageID=719&cached=false&space=CommunityPage
Felzensztein, C., & Dinnie, K. (2005). The Effects of Country of Origin on UK Consumers’Perceptions of Imported Wines. Journal of Food Products Marketing, 11(4), 109-117.
Felzensztein, C., Hibbert, S., & Vong, G. (2004). Is the Country of Origin the Fifth Elementin the Marketing Mix of Imported Wine? A Critical Review of the Literature. Journal of FoodProducts Marketing, 10(4), 73-84.
Finn, A., & Louviere, J. J. (1992). Determining the Appropriate Response to Evidence ofPublic Concern: The Case of Food Safety. Journal of Public Policy and Marketing, 11(1), 12-25.
Flynn, T. N., Louviere, J. J., Peters, T. J., & Coast, J. (2007). Best–worst scaling: What it cando for health care research and how to do it. Journal of Health Economics, 26, 171-189.
Friedman, H., Herskovitz, P., & Pollack, S. (Eds.) (1994). Biasing Effects of Scale-checkingStyle in Response to a Likert Scale. Proceedings of the American Statistical AssociationAnnual Conference: Survey Research Methods.
Fu, B. J., Hu, C. X., Chen, L. D., Honnay, O., & Gulinck, H. (2006). Evaluating change inagricultural landscape pattern between 1980 and 2000 in the Loess hilly region of AnsaiCounty, China. Agriculture, Ecosystems and Environment, 114, 387-396.
Gluckman, R. L. (1990). A consumer approach to branded wines. International Journal ofWine Marketing, 2(1), 27-46.
Goodman, S., Lockshin, L., & Cohen, E. (2005). Best-Worst Scaling: A Simple Method toDetermine Drinks and Wine Style Preferences, Paper presented at the 2nd International WineMarketing Symposium, Sonoma State University. Sonoma, California.
Goodman, S., Lockshin, L., & Cohen, E. (2006). Using the Best-Worst method to examinemarket segments and identify different influences of consumer choice. In F. d’Hauteville(Ed.), Proceedings of the 3rd International Wine Business and Marketing Conference,Montpellier, 6-8 July 2006 (CD-ROM).
Halkos, G., & Salamouris, D. (2003). Socio-economic integration of ethnic Greeks from theformer USSR: obstacles to entry into the Greek labour market. Journal of Ethnic andMigration Studies, 29(3), 519-534.
ISTAT (2008). L’uso e l’abuso di alcol in Italia – Anno 2007. Rome, Italy: ISTAT. Retrieved28/04/08 from http://www.istat.it/salastampa/comunicati/non_calendario/20080417_00/testointegrale20080417.pdf
Istituto di Servizi per il Mercato Agricolo Alimentare – ISMEA (2007a). Outlookdell’Agroalimentare Italiano – Annual Report, Vol. 1 & 2. Rome, Italy: ISMEA.
4th International Conference of the Academy of Wine Business Research, Siena, 17-19 July 2008Refereed Paper
17
Istituto di Servizi per il Mercato Agricolo Alimentare – ISMEA (2007b). I vini DOC eDOCG. Una mappatura della viticoltura regionale a denominazione di origine. Rome, Italy:ISMEA.
Jarvis, W., Rungie, C., & Lockshin, L. (2003). Analysing Wine Behavioural Loyalty. Paperpresented at the 1st International Wine Marketing Colloquium, University of South Australia(UniSA). Adelaide, Australia: UniSA.
Jarvis, W., Rungie, C., & Lockshin, L. (2007). Revealed Preference Analysis of Red WineAttributes using Polarization. International Journal of Wine Business Research, 19(2): 127-138.
Kondoh, K., & Jussaume, R. A. J. (2006). Contextualizing farmers’ attitudes towardsgenetically modified crops. Agriculture and Human Values, 23, 341-352.
Kotler, P., & Keller, K. L. (Eds.) (2007). A framework for marketing management, 3rd
Edition. Upper Saddle River, NJ: Pearson International Edition.
Lee, J. A., Soutar, G. N., & Louviere, J. (2007). Measuring Values Using Best-Worst Scaling:The LOV Example. Psychology & Marketing, 24(12), 1043–1058.
Ling, B., & Lockshin, L. (2003). Components of Wine Prices for Australian Wine: HowWinery Reputation, Wine Quality, Region, Vintage, and Winery Size Contribute to the Priceof Varietal Wines. Australasian Marketing Journal, 11(3), 19-32.
Lockshin, L. & Hall, J. (2003). Consumer Purchasing Behaviour for Wine: What We Knowand Where We are Going. Paper presented at the 1st International Wine MarketingColloquium, University of South Australia, Adelaide (AU).
Lockshin, L., & Rhodus, W. T. (1993). The effect of price and oak flavour on perceived winequality. International Journal of Wine Marketing, 5(2-3), 13-25.
Lockshin, L., Jarvis, W., d’Hauteville, F., & Perrouty, J. P. (2006). Using simulations fromdiscrete choice experiments to measure consumer sensitivity to brand, region, price andawards in wine choice. Food Quality and Preference, 17, 166-178.
Lockshin, L., Quester, P & Spawton, T. (2001). Segmentation by involvement or nationalityfor global retailing. A cross national comparative study of wine shopping behaviours. Journalof Wine Research, 12(3), 223-236.
Louviere, J. J. (2006). Best-Worst Scaling: Workshop on Theory and Example Applications.Seminar presented at the Ehrenberg-Bass Institute for Marketing Science, University of SouthAustralia (UniSA). Adelaide, Australia: UniSA.
Manske, M., & Cordua, G. (2005). Understanding the sommelier effect. International Journalof Contemporary Hospitality Management, 17(7), 569-576.
Marley, A. A. J., & Louviere, J. J. (2005). Some Probabilistic Models of Best, Worst andBest-Worst Choices. Journal of Mathematical Psychology, 49(6), 464-480.
Martinez-Carrasco Martinez, L., Brugarolas Mollà-Bauzà, Del Campo Gomis, F. J., &Martinez Povera, A. (2006). Influence of purchase place and consumption frequency overquality wine preferences. Food Quality and Preference, 17, 315-327.
Norris, C. M., Ghali, W. A., Saunders, L. D., Brant, R., Galbraith, D., Faris, P. & Knudtson,M. L. (2006). Ordinal regression model and the linear regression model were superior to thelogistic regression models. Journal of Clinical Epidemiology, 59, 448–456.
4th International Conference of the Academy of Wine Business Research, Siena, 17-19 July 2008Refereed Paper
18
Orth, U. R., Wolf-McGarry, M., & Dodd, T. H. (2005). Dimensions of wine region equity andtheir impact on consumer preferences. Journal of Product & Brand Management, 14(2), 88-97.
Perrouty, J. P., d’Hauteville, F., & Lockshin, L. (2006). The Influence of Wine Attributes onRegion of Origin Equity: An Analysis of the Moderating Effect of Consumer’s PerceivedExpertise. Agribusiness, 22(3), 323-341.
Rocchi, B., & Stefani, G. (2005). Consumers’ perception of wine packaging: a case study.International Journal of Wine Marketing, 18(1), 33-44.
Rodriguez Santos, C., Cervantes Blanco, M., & Gonzalez Fernandez, A. (2006). Segmentingwine consumers according to their involvement with appellations of origin. BrandManagement, 13(4-5), 300-312.
Rutheford, G. N., Guisan, A., & Zimmerman, S. E. (2007). Evaluating sampling strategiesand logistic regression methods for modelling complex land cover changes. Journal ofApplied Ecology, 44, 414-424.
Schamel, G. (2006). Geography Versus Brands in a Global Wine Market. Agribusiness, 22(3),363-374.
Seghieri, C., Casini, L., & Torrisi, F. (2007). The wine consumer’s behaviour in selectedstores of Italian major retailing chains. International Journal of Wine Business Research,19(2), 139-151.
Sistema Statistico Regionale – SISTAR – Le Marches (2007). Il lavoro nelle Marche.Retrieved 27/01/2008 fromhttp://www.sistar.marche.it/html/statistiche/Pubblicazioni/Reports/Report%20Lavoro_luglio%202007.pdf
Sistema Statistico Regionale – SISTAR – Veneto (2007). I numeri del Veneto. La Statistica inTasca. Retrieved 27/01/2008 from http://statistica.regione.veneto.it/pubblicazioni_elenco.jsp
Spais, G. S., & Vasileiou, K. Z. (2006). An ordinal regression analysis for the explanation ofconsumer overall satisfaction in the food marketing context: The managerial implications toconsumer strategy management at a store level. Database Marketing & Customer StrategyManagement, 14(1), 51-73.
Spawton, T. (1991). Why winemakers should know who consumes their wine and devise theirmarketing accordingly. The Australian Grape Grower & Winemaker – Journal of the Grapeand Wine Industry, 334, 33-37.
STATA. Version 8.0 [Computer Software]. College Station, TX: Stata Corp LP.
Thomas, A., & Pickering, G. (2003). The importance of wine label information. InternationalJournal of Wine Marketing, 15(2), 58-75.
Unwin, T. (1999). Hedonic price index and the qualities of wine. Journal of Wine Research,10(2), 95-104.
Usunier, J. C., & Lee, J. A. (2005). Marketing across cultures. Essex, UK: Pearson Education,
van Herk, H., Poortinga, Y.H., & Verhallen, T. M. M. (2004). Response styles in rating scales–evidence of method bias in data from six EU countries. Journal of Cross-CulturalPsychology, 35(3), 346-360.
Walsh, K. (1999). Marketing and public sector management. European Journal of Marketing,28(3), 63–71.

4th International Conference of the Academy of Wine Business Research, Siena, 17-19 July 2008Refereed Paper
19
Wansinsk, B., Cordua, G., Blair, E., Payne, C., & Geiger, S. (2006). Wine Promotions inRestaurants. Do Beverage Sales Contribute or Cannibalize? Cornell Hotel and RestaurantAdministration Quarterly, 47, 327-336.
Wynn, G., Crabtree, B., & Potts, J. (2001). Modelling farmer entry into the EnvironmentallySensitive Areas schemes in Scotland. Journal of Agricultural Economics, 52, 65-82.
Yue, C., Marette, S. & Beghin, J. C. (2006). How to Promote Quality Perception in WineMarkets: Brand Advertising or Geographical Indication? Working paper, Center forAgricultural and Rural Development, IOWA State University. Ames, IOWA: IOWA StateUniversity.