Construction 2006
183
European Commission ICT and e-Business in the Construction Industry ICT adoption and e-business activity in 2006 ICT and e-Business in the Construction Industry ICT adoption and e-business activity in 2006 Sect or Repo rt No. 7 / 2006
-
Upload
nayanahari -
Category
Documents
-
view
217 -
download
0
Transcript of Construction 2006

7/28/2019 Construction 2006
http://slidepdf.com/reader/full/construction-2006 1/182
EuropeanCommission
ICT and e-Business in the
ConstructionIndustry
ICT adoption and e-business activity in 2006
ICT and e-Business in the
ConstructionIndustry
ICT adoption and e-business activity in 2006
Sector Report No. 7/2006

7/28/2019 Construction 2006
http://slidepdf.com/reader/full/construction-2006 2/182
Construction
2
About e -Bus i n ess W@tc h and this report
The European Commission, Enterprise & Industry Directorate General, launched the e-Business
W@tch to monitor the growing maturity of electronic business across different sectors of theeconomy in the enlarged European Union, EEA and Accession countries. Since January 2002, the
e-Business W@tch has analysed e-business developments and impacts in manufacturing,construction, financial and service sectors. All results are available on the internet and can beaccessed or ordered via the Europa server or directly at the e-Business W@tch website(http://ec.europa.eu/comm/enterprise/ict/policy/watch/index.htm, www.ebusiness-watch.org).
This document is a sector study by e-Business W@tch, focusing on the construction industry (CI).Its objective is to describe how companies in this industry use ICT for conducting business, toassess the impact of this development for firms and for the industry as a whole, and to indicatepossible implications for policy. Analysis is based on literature, interviews, case studies and asurvey among decision-makers in European enterprises from the CI about the ICT use of their enterprise.
Disclaimer
Neither the European Commission nor any person acting on behalf of the Commission is
responsible for the use which might be made of the following information. The views expressed inthis report are those of the authors and do not necessarily reflect those of the EuropeanCommission. Nothing in this report implies or expresses a warranty of any kind. Results from thisreport should only be used as guidelines as part of an overall strategy. For detailed advice oncorporate planning, business processes and management, technology integration and legal or taxissues, the services of a professional should be obtained.
Acknowledgements
This report was prepared by Rambøll Management on behalf of the European Commission,Enterprise & Industry Directorate General. It is part of a deliverable in the context of e-Business
W@tch, which is implemented by a team consisting of empirica GmbH (co-ordinating partner),Berlecon Research, Databank Consulting, DIW Berlin, Lios Geal Consultants, RambøllManagement and Salzburg Research, based on a service contract with the European Commission.
e-Business W@tch would like to thank the following members of the Advisory Board 2006 for providing comments and supporting the work on this study: Mr Arturas Kaklauskas , Vilnius CivilEngineering Institute; Mr Ulrich Paetzold, FIEC – European Construction Industry Federation; Mr John Sarborg Pederson, ITEK – Confederation of Danish Industries; and Mr Alfredo Soeiro ,University of Porto.
Contact
For further information about this Sector Study or the e-Business W@tch, please contact:
Rambøll Management A/S
Nørregade 7ADK-1165 Copenhagen KDenmark
Fax: (45) 3397 [email protected]
e-Business W@tch
c/o empirica GmbHOxfordstr. 2, 53111 Bonn,Germany
Fax: (49-228) [email protected]
European Commission
Enterprise & Industry Directorate-GeneralTechnology for innovation, ICTindustries and e-business
Fax: (32-2) [email protected]
Rights Restrictions
Any reproduction or republication of this report as a whole or in parts without prior authorisation isstrictly prohibited.
Copenhagen / Brussels, 2006

7/28/2019 Construction 2006
http://slidepdf.com/reader/full/construction-2006 3/182
Construction
3
Table of Contents
Executive Summary................................................................................................... 5
1 Introduction......................................................................................................... 9
1.1 About e-Business W@tch ................................................................................................ 9
1.2 "e-Business" – the conceptual framework................................................................... 13
2 Context and Background................................................................................... 19
2.1 Sector definit ion – scope of the study.......................................................................... 19
2.2 Industry background ...................................................................................................... 20
2.3 Review of earlier sector studies.................................................................................... 23
3 Adoption of ICT and e-Business in 2006 ........................................................... 25
3.1 Use of ICT Networks ....................................................................................................... 26
3.2 ICT Skil ls , Outsourcing and ICT Budgets..................................................................... 30
3.2.1 Demand for ICT skills and skills development ..................................................... 30
3.2.2 Outsourcing of ICT services and ICT investments............................................... 32
3.3 Standards, Interoperabil ity and ICT Securi ty Issues .................................................. 36
3.3.1 Types of e-standards used................................................................................... 36
3.3.2 Use of Open Source Software ............................................................................. 37
3.3.3 Interoperability challenges ................................................................................... 39
3.3.4 ICT security measures ......................................................................................... 41
3.4 Internal and External e-Integration of Processes ........................................................ 43
3.4.1 Use of software systems for internal process integration .................................... 43
3.4.2 Use of ICT for cooperative and collaborative business processes...................... 45
3.4.3 Deployment of e-invoicing.................................................................................... 46
3.5 Supply Chain Management ............................................................................................ 48
3.5.1 SCM, financial e-processes and ICT links with suppliers .................................... 48
3.6 e-Market ing and Sales .................................................................................................... 50
3.6.1 Enterprises receiving orders from customers online............................................ 50
3.6.2 e-Integration of marketing processes: CRM and ICT links with customers......... 54
3.7 ICT and Innovation .......................................................................................................... 55
3.8 Drivers and Inhibitors for the Uptake of e-Bus iness................................................... 57
3.9 Summary.......................................................................................................................... 61
4 Current e-Business Trends and Implications.................................................... 64
4.1 e-Procurement ................................................................................................................. 67

7/28/2019 Construction 2006
http://slidepdf.com/reader/full/construction-2006 4/182
Construction
4
4.1.1 Introduction .......................................................................................................... 67
4.1.2 Definition of e-procurement.................................................................................. 67
4.1.3 Use of e-procurement in the construction industry .............................................. 68
4.1.4 Potential benefits of e-procurement ..................................................................... 72
4.1.5 Barriers................................................................................................................. 74
4.1.6 Business implications........................................................................................... 75
4.1.7 Implications of public e-procurement for construction enterprises....................... 76
Case Study: E-Vergabe, Germany ................................................................................... 79
Case Study: Implementation of Public E-procurement/ Y&H RCoE, United Kingdom..... 86
Case Study: Skanska, Scandinavian countries ................................................................ 92
Case Study: E-Construction, Greece................................................................................ 97
4.1.8 Summary of main points and conclusions ......................................................... 101
4.2 3D technology ............................................................................................................... 102 4.2.1 Introduction ........................................................................................................ 102
4.2.2 Definition of 3D technology ................................................................................ 102
4.2.3 Use of 3D technology in the construction industry............................................. 105
4.2.4 Potential benefits of 3D technology ................................................................... 107
4.2.5 Barriers............................................................................................................... 109
4.2.6 Business implications......................................................................................... 110
Case Study: Constructus, Lithuania ............................................................................... 113
Case Study: Akershus University Hospital, Norway ....................................................... 119
4.2.7 Summary of main points and conclusions ......................................................... 124
4.3 Project web .................................................................................................................... 124
4.3.1 Introduction ........................................................................................................ 124
4.3.2 Definition of project web..................................................................................... 125
4.3.3 Use of project webs in the construction industry ............................................... 127
4.3.4 Potential benefits of project webs ...................................................................... 129
4.3.5 Barriers............................................................................................................... 130
4.3.6 Business implications......................................................................................... 131
Case Study: Spie SCGPM, France................................................................................. 133
4.3.7 Summary of main points and conclusions ......................................................... 138
5 Conclusions ..................................................................................................... 140
5.1 Business impact ........................................................................................................... 140
5.2 Policy implications ....................................................................................................... 154
References............................................................................................................. 157
Annex I: The e-Business Survey 2006 – Methodology Report.............................. 161
Annex II: Expanded Tables – Data by Country ...................................................... 171
Annex III: Glossary of Technical Terms ................................................................ 177

7/28/2019 Construction 2006
http://slidepdf.com/reader/full/construction-2006 5/182
Construction
5
Executive Summary
Objectives and scope of the study
This sector study by e-Business W@tch focuses on the construction industry (CI). It
describes how enterprises in this industry use information and communications
technology (ICT) for conducting business, assesses the impact of this development for
firms and for the industry as a whole, and indicates possible implications for policy.
Analysis is based on literature, interviews, case studies and a survey among decision-
makers in European enterprises from the CI about the ICT use of their enterprise.
The sector covers the business activities specified in NACE Rev. 1.1 Groups F 45.2 and
45.3.1 The building of complete constructions (or parts thereof) and civil engineering
(NACE 45.2) is dominated by large construction and engineering enterprises, whereas
the building installation industry (NACE 45.3) is predominantly made up of small and
medium-sized enterprises. There are approximately 2.4 million construction enterprises in
EU-25, of which 97% are micro or small enterprises with fewer than 20 employees. The
industry employs about 14 million people, corresponding to about 7% of the European
work force and 28.5% of industrial employment.
Adoption of ICT and e-business in 2006 – survey results
The CI is a sector where ICT and e-business are used to a lesser extent than in most of the other sectors studied by e-Business W@tch in 2006. There are two main reasons for
this comparatively low ICT uptake:
the high concentration of SMEs in the CI and
the typical nature of the service provided in construction which, being an on-site
and often highly customised service, does not lend itself to the typical e-business
concept which is rather adapted to manufacturing industries.
Looking into the two sub-sectors covered by this report, complete construction
enterprises demonstrate, in general, a higher level of ICT uptake than building installation
enterprises. In addition, complete construction enterprises are larger enterprises, employ
ICT practitioners more often, use ICT more to support innovation and spend more on ICT
than companies from the building installation industry.
The 2006 e-Business Survey data also suggest that large construction enterprises are
increasing their focus on ICT issues, as they have started introducing more advanced ICT
solutions such as e-procurement systems, collaborative design systems and collaborative
document sharing. This trend is in line with the findings and case studies presented in
Section 4 on the use of specific ICT solutions for the CI.
1 NACE Rev. 1.1 is a 4-digit classification of business activities. It is a revision of the ‘GeneralIndustrial Classification of Economic Activities within the European Communities’ known by theacronym NACE and originally published by Eurostat in 1970.

7/28/2019 Construction 2006
http://slidepdf.com/reader/full/construction-2006 6/182
Construction
6
The same statistical findings, however, indicate that there is still a sort of "digital divide"
between the CI and the weighted averages of all sectors covered this year by e-Business
W@tch. Examples are the low percentage of firms employing ICT practitioners, as well as
the low adoption of enterprise resource planning (ERP) systems and advanced e-
procurement solutions. This cannot be entirely attributed to structural factors, i.e. thedominance of small firms, but is also explained by the nature of the services in the CI.
Another worth-mentioning finding from this year’s survey is that construction enterprises
have little focus on hiring ICT practitioners and ICT training. Furthermore, the use of e-
standards is limited in the CI but about in line with the weighted all-sectors average,
indicating that interoperability is a common issue across different sectors. The CI lags
behind on both product and process innovation when compared to the cross-industry total
(EU10). However, the reported shares of ICT-enabled product and process innovation in
CI are more or less the same with the respective cross-industry totals for the ten sectors
covered this year by e-Business W@tch.
Important e-business trends and implications
Important developments are taking place in the CI in the areas of e-procurement, 3D
technology and project web. These technologies carry signifi cant economic potential
for the industry, particularly with regard to process efficiency. The study shows that large
construction enterprises and the public sector drive the development. Large
enterprises, on the other hand, clearly possess the financial resources, human capital
and ICT capabilities which are necessary to benefit from these technologies at this point
in time. The public sector, on the other hand, could enhance and further accelerate
development, both as a major buyer of construction services and via policy initiatives.
e-Procurement
This study investigates two issues related to e-procurement: e-procurement conducted by
construction enterprises and e-procurement (e-tendering) of construction services
conducted by public authorities. The main trends identified this year confirm findings from
the 2005 sector study on the CI:
Developments are mainly driven by the broad introduction of e-procurement
in large European construction enterprises.
e-Procurement is used as a tool to enhance new procurement concepts such as
strategic procurement. Centralisations of tendering, establishment of framework
contracts, consolidation of the supplier base are aspects of strategic procurement,
and construction enterprises use e-procurement to optimise the price/quality ratio.
The benefits of e-tendering are first and foremost on the buyer side and the
development is mainly driven by the public sector (public e-tendering)
The public sector is a driver for promoting e-procurement, due to the overall
procurement volume and the –usually large- size of projects which are tendered by
public services. As the electronic notification of tenders and the on-line publication
of tender material generate more savings for the procurer than for the supplier,
public services are also likely to benefit more from e-tendering.
7/28/2019 Construction 2006
http://slidepdf.com/reader/full/construction-2006 7/182
Construction
7
This study suggests that change management is pivotal for the successful
implementation of e-procurement systems in a construction enterprise. This involves
commitment by the company’s senior management and a focus on employee training.
The correct set-up and outstanding business cases for electronic procurement,
however, are still not easy to identify. Thus, for smaller enterprises in particular, theabsence of a clear business case is a barrier for many types of e-procurement.
3D technology
3D technology (also called Building Information Modelling) is a significant tool for the CI.
Two relevant issues are discussed in this study, based on recent literature and expert
interviews: interoperability and compatibility . The study shows that the benefits of
using 3D technologies in the CI include cost reduction through risk minimisation, more
precise communication between stakeholders and earlier detection of miscalculations
and deviations. However, the study also shows that there are still barriers to a successful
uptake of 3D technology by CI companies:
The strong adherence to traditional workflow processes in the industry and a lack
of competences in 3D design;
The lack of European-wide standards increases the problem of system
incompatibility, both internally between different 3D technology solutions and
externally with other ICT applications.
Project web
Project web solutions can enable more efficient and secure exchange of information
between the stakeholders in construction projects. This study focuses on four areas:
usability, workflow processes, economic incentives and a discussion on the drivers for
development. The discussion presented in this report indicates that:
Project web solutions are complex . The uptake of project web solutions is
constrained by its technical complexity and lack of user-friendly interfaces. Project
web solutions require specific ICT competencies, which European CI SMEs do not
always possess.
Project web solutions lack integration possibili ties with existing ICT systems.
Project web solutions are normally not compatible with already existing ICT
systems such as electronic document management EDM and ERP systems. Thisincompatibility reduces the uptake of project web solutions in the CI.
Project web solutions are tailor-made for the existing workflow processes .
Traditional workflow processes in the CI are usually maintained in an effort to
reduce implementation barriers, but this may prevent reaping the full technology
benefits.
Business impact
The increased uptake of e-procurement will require a further strengthening of ICT skill s
among employees of European CI enterprises. Despite the currently rather slow uptake
of 3D technologies and project web solutions, these developments will eventually require

7/28/2019 Construction 2006
http://slidepdf.com/reader/full/construction-2006 8/182
Construction
8
large companies and SMEs in the CI to invest not only in the technologies themselves,
but also in ICT training to ensure that the required skills are in place.
Once the uptake of project web and e-procurement systems has gained momentum, this
is expected to affect organisational structures and workflow processes in the CI.
The increasing use of e-procurement by the public sector in calls for tenders for
construction services will have an impact on SMEs that contribute as sub-contractors to
these services. Again, one of the effects is that even smaller enterprises need to
familiarise themselves with using related ICT systems, i.e. they need to develop ICT
capabilities which many small CI enterprises are currently lacking.
Policy implications
In the previous e-Business W@tch sector study on construction (September 2005), the
issues of improving ICT skills, increasing the awareness of ICT benefits and potentials,
and facilitating interoperability, were identified as relevant policy initiatives. Findings from
this year’s survey and the discussion of the three major technology trends in this report
suggest that these implications are still relevant, with slight adjustments and elaborations:
Focus on identifying ICT skill s gaps
Having the right ICT skills has been identified as a challenge for SMEs both in
general and in respect to the three specific areas of ICT use in the CI. Most
importantly this concerns the transition to 3D technology, which is a rather complex
technology and contains many software features. Focus should be given to
defining the required ICT skills in the CI and to whether market imperfections exist
with regard to the training offered by public and private educational institutions.
Raise awareness of ICT benefits and e-business policies
It is important to raise awareness about ICT and e-business among CI enterprises
and business associations, in particular with regard to new technologies discussed
in this report (project web, 3D technology). In this context, the public sector can
play an active role by supporting initiatives to promote best practice examples
based on successful ICT implementation in construction enterprises. Industry
operators could facilitate such “peer-to-peer” demonstrations of successful cases
to improve awareness about ICT solutions in this industry.
Facilitating the process of i nteroperability
Setting standards and promoting interoperability is an important area to address.
On-going work towards common e-standards has promising benefits for the uptake
of ICT in the CI. Nevertheless, on the basis of the statistical findings and within
each of the three ICT application areas presented in this study, there is a number
of standardisation-related issues that should be addressed at international and
European levels. The European Commission could, for example, consider
analysing the benefits of introducing standard transfer protocols, and disseminating
the results of this analysis.

7/28/2019 Construction 2006
http://slidepdf.com/reader/full/construction-2006 9/182
Construction
9
1 Introduction
1.1 About e-Business W@tch
Policy background
The European Commission launched e-Business W@tch in late 2001 to monitor the
adoption, development and impact of electronic business practices in different sectors of
the economy in the European Union.
The initiative is rooted in the eEurope Action Plans of 2002 and 2005. The eEurope
2005 Action Plan defined the goal "to promote take-up of e-business with the aim of
increasing the competitiveness of European enterprises and raising productivity and
growth through investment in information and communication technologies, human
resources (notably e-skills) and new business models".2 e-Business W@tch has been an
important instrument for the European Commission to assess the developments and
progress in this field.
The i2010 policy3, a follow-up to eEurope, also stresses the critical role of ICT for
productivity and innovation, stating that "… the adoption and skilful application of ICT is
one of the largest contributors to productivity and growth throughout the economy,
leading to business innovations in key sectors" (p. 6). The Communication anticipates "a
new era of e-business solutions", based on integrated ICT systems and tools, which will
lead to an increased business use of ICT. However, it also warns that businesses " still face a lack of interoperability, reliability and security ", which could hamper the realisation
of productivity gains (p. 7).
In 2005, in consideration of globalisation and intense international competition, the
European Commission launched a new industrial policy4 to create better framework
conditions for manufacturing industries in the coming years. Some of the policy strands
described have direct links to ICT and e-business developments. One of the new sector-
specific initiatives covered by the policy is the taskforce on information and
communication technologies (ICT) competitiveness. The taskforce with stakeholders
representatives focuses on identifying and proposing measures to remove obstacles that
inhibit ICT take-up among enterprises. Another initiative is to conduct a series of
competitiveness studies, to include for ICT, food, and fashion and design industries, in
order to analyse trends affecting the competitiveness of these industrial sectors.
These policy considerations constitute the background and raison d'être of e-Business
W@tch as an observatory of related issues and a core theme for the analysis. Within this
2 "eEurope 2005: An information society for all". Communication from the Commission,COM(2002) 263 final, 28 May 2002, chapter 3.1.2
3 "i2010 – A European Information Society for growth and employment." Communication from the
Commission, COM(2005) 229 final.4 "Implementing the Community Lisbon Programme: A Policy Framework to Strengthen EU
Manufacturing - towards a more integrated approach for Industrial Policy." Communication fromthe Commission, COM(2005) 474 final, 5.10.2005
7/28/2019 Construction 2006
http://slidepdf.com/reader/full/construction-2006 10/182
Construction
10
broader policy context, two further important facets regarding the mission of the initiative
are relevant. First, e-Business W@tch studies focus on sectors (and not on countries).
Second, special emphasis is placed on developments and implications for small and
medium-sized enterprises (SMEs).
e-Business W@tch is one of several policy instruments used by DG Enterprise and
Industry in the field ICT industries and e-business. Other instruments include
the e-Business Support Network (eBSN – a European network of e-business policy
makers and business support organisations),
the eSkills Forum (a task force established in 2003 to assess the demand and
supply of ICT and e-business skills and to develop policy recommendations),
the ICT Task Force, a group whose work is to draw together and integrate various
activities aiming to strengthen Europe's ICT sector, and
activities in the areas of ICT standardisation, as part of the generalstandardisation activities of the Commission.5
Focus and scope
Since its launch, e-Business W@tch has published e-Business Sector Studies on more
than 20 sectors of the European economy, four comprehensive synthesis reports about
the state-of-play in e-business in the European Union, statistical pocketbooks and various
other resources, such as newsletters and special issue reports. All publications are
available at www.ebusiness-watch.org ('resources').
e-Business W@tch presents a 'wide-angle' perspective on the adoption and use of ICTin the sectors studied. The topic is not restricted to the measurement of e-commerce
transactions (the volume of goods and services traded online), but also comprises an
assessment of the degree to which business processes, including intra-firm processes,
are electronically linked to each other and have become digitally integrated.
In essence, e-Business W@tch studies cover the whole field of what could be described
as collaborative commerce (see following chapter). However, it becomes practically
impossible to cover in detail all areas and facets of e-business in a single sector study.
Therefore, each study focuses on a few specific issues, thus allowing the reader to zoom
into these topics in more detail.
In addition to the analysis of e-business developments, the studies also provide some
background information on the respective sectors. Readers, however, should not
mistakenly consider this part of each report as the main topic of the analysis. An e-
Business W@tch sector report is not a piece of economic research on the sector itself,
but a study which focuses on the use of ICT and e-business in that particular sector. The
introduction to the sector is neither intended, nor could it be a substitute for more detailed
industrial analysis.
5 The 2006 ICT Standardisation Work Programme complements the Commission's "Action Planfor European Standardisation" of 2005 by dealing more in detail with ICT matters.

7/28/2019 Construction 2006
http://slidepdf.com/reader/full/construction-2006 11/182
Construction
11
Methodology
e-Business W@tch combines quantitative and qualitative research elements. The
quantitative analysis of ICT and e-business adoption by firms is based to a large extent
on representative surveys among decision-makers in European enterprises ("e-Business
Survey"). Interviews are conducted by telephone, based on a standardised and computer
supported questionnaire (CATI6 method). In total, more than 25,000 enterprises were
interviewed in the surveys of 2002, 2003 and 2005. The most recent survey (conducted in
April/May 2006) covered more than 14,000 enterprises from 10 sectors in all EU Member
States and most EEA and Candidate Countries.7
The e-Business W@tch Surveys have won recognition by the international research
community as a useful instrument for piloting new e-business metrics. The experience
gained from this piloting is used, for example, by Eurostat for planning and developing
their own survey of ICT use by businesses.
e-Business W@tch complements the statistical picture by a more detailed presentation of
concrete e-business activity in individual enterprises from the sectors covered, mainly in
the form of brief case studies. About 75 case studies are conducted in 2006 adding to
more than 100 case studies conducted in previous years. Evidence from the survey and
case studies is backed up by desk research and interviews with industry
representatives and e-business experts.
The importance of networking and debate
Since its first implementation in late 2001, e-Business W@tch has increasingly developedfrom a market observatory into a think-tank and intermediary, stimulating debate
among stakeholders at an international level about the economic and policy implications
of e-business. The positive feed-back and large uptake for the various publications and
statistics provided by the e-Business W@tch, for example their exploitation by various
research institutions, reflects the demand for sectoral e-business analysis and discussion
on related issues.
e-Business W@tch uses several mechanisms for debate and networking with stake-
holders. An important platform for this is the website (www.ebusiness-watch.org), where
all reports and survey data are published. Furthermore, results are presented anddiscussed with industry at workshops, within and via the Advisory Board , and, lastly,
through the participation of study team members in other events, such as conferences,
workshops and working groups organised by third parties.
6 Computer Assisted Telephone Interviews, a widely used method in representative household or
decision-maker surveys.7 The EEA (European Economic Area) includes, in addition to EU Member States, Iceland,
Liechtenstein and Norway. Candidate Countries, which are candidates for accession into theEU, are (as of May 2006) Bulgaria, Croatia, Romania and Turkey.

7/28/2019 Construction 2006
http://slidepdf.com/reader/full/construction-2006 12/182
Construction
12
The mission of e-Business W@tch is to monitor, analyse and compare the
development and impact of e-business in different sectors of the European
economy – not the sectors themselves.
Its objective is to provide reliable results, based on commonly accepted
methodologies, which are not readily available from other sources and will
trigger the interest of policy-makers, researchers, and other e-business
stakeholders for more in depth analyses or statistical surveys.
e-Business W@tch has adopted a “wide-angle” perspective in its approach .
The necessary trade-offs are transparently depicted in each of its deliver-
ables.
The definition of sectors and the adequate level of aggregation
Economic sectors constitute the main level of analysis for e-Business W@tch. The 2006
studies cover sub-sets of ten different sectors whose configuration and definition are
based on the NACE Rev. 1.1 classification of business activities.8
Over the years since its initial implementation in late 2001, e-Business W@tch followed a
roll-out plan in the coverage of different sectors.9 In each new period, some new sectors
(not covered in previous years) were added.
The rather broad aggregation of various business activities into sectors in earlier implem-
entation periods (2002-2004) made it possible to cover a broad spectrum of the economy,
but also caused challenges for the analysis of e-business developments. In cases where
rather heterogeneous sub-sectors were aggregated, it was sometimes difficult to make
general observations or draw conclusions for "the sector" at stake. It also turned out that
industry has a clear preference for comparatively narrow sector definitions.
The approach for selecting and defining sectors which was used in 2005 and 2006
reflects these concerns. Many of the sectors studied since 2005 are sub-sectors that had
been part of larger aggregations in 2002-2004. A further argument for "zooming in" on
former sub-sectors is that the broad picture for whole sectors is already available from
earlier e-Business W@tch studies.
The selection of sectors in 2006 has been made on the basis of the following
considerations:
The roll-out plan of 2003.
Policy relevance of the sector from the Commission’s perspective.
Interest articulated by the industry in previous years on studies of this type.
The current dynamics of e-business in the sector and the impact of ICT and
electronic business, as derived from earlier e-Business W@tch sector studies.
8 NACE Rev. 1.1 is a 4-digit classification of business activities. It is a revision of the ‘GeneralIndustrial Classification of Economic Activities within the European Communities’, known by theacronym NACE and originally published by Eurostat in 1970.
9 See website: "selection of sectors" (www.ebusiness-watch.org/about/sector_selection.htm)

7/28/2019 Construction 2006
http://slidepdf.com/reader/full/construction-2006 13/182
Construction
13
The 10 sectors studied in 2006
The 10 sectors which are monitored and studied in 2006 include six manufacturing
sectors, construction and three service sectors. The pulp and paper manufacturing
industry is a 'new' sector, i.e. it had not been covered by the e-Business W@tch in any
earlier period of implementation; the other nine sectors have been covered in previous
years, mostly as parts of aggregated sectors (see Exhibit 1-1).
Exhibi t 1-1: Sectors stud ied by e-Business W@tch in 2006
No. NACE Rev. 1.1 Sector Reference to earlier (most
recent) coverage
1 DA 15(selected groups)
Food and beverages 2005
2 DC 19.3 Footwear 2003/04 (as part of the textileand footwear industry)
3 DE 21 Pulp, paper and paper products --
4 DL 30, 32.1+2 ICT manufacturing 2004 (as part of electricalmachinery and electronics)
5 DL 32.3 Consumer electronics 2004 (as part of electricalmachinery and electronics)
6 DM 35.11 Shipbuilding and repair 2004 (as part of transportequipment manufacturing)
7 F 45.2+3(selected classes)
Construction 2005 (in a broader aggregation,including F 45 in total)
8 H 55.1/3, I 63.3,O 92.33/52
Tourism 2005
9 I 64.2 Telecommunication services 2004 (as part of ICT services)
10 N 85.11 Hospital activities 2004 (as part of health andsocial services)
1.2 "e-Business" – the conceptual framework
Fresh momentum after the 2001 odyssey
Although the 'new economy' revolution has not taken place as it seemed for a shortmoment in history it might, the evolutionary development of electronic business does
not seem to have come to an end. On the contrary, the maturity of e-business has
substantially increased across sectors and regions over the past five years. It has been a
quiet revolution this time, but as a result, a new picture of the digital economy is
beginning to emerge. ICT and e-business do matter in the global economy – probably
even more than during the hype of the late 1990s.
The overall economic situation and market conditions for business innovation and invest-
ment have been difficult for European companies during the last few years. Nevertheless,
e-business shows a dynamic development in the European Union. Drivers are new
technological developments (wireless access technologies, for example) and the
increasing competitive pressure on companies in a global economy. Firms are in
constant search for opportunities to cut costs. This has probably been the most important
7/28/2019 Construction 2006
http://slidepdf.com/reader/full/construction-2006 14/182
Construction
14
promise of electronic business: cutting costs by increasing the efficiency of business
processes, internally and between trading partners in the value chain.
From e-Commerce to e-Business
As part of this maturing process, electronic business has progressed from a rather
specific to a very broad topic over the past 10 years. Initially, however, particularly in the
mid 1990s, the policy and research focus was very much on e-Commerce, which can be
defined as online commercial transactions.
The term 'transactions' refers to exchanges between a company and its suppliers or
customers. These can be other companies ("B2B" – business-to-business), consumers
("B2C" – business-to-consumers), or governments ("B2G" – business-to-government). In
the broad sense, transactions include commercial as well as other exchanges, such as
sending tax return forms to the tax authorities. In the context of this study on e-business,
transactions are predominantly commercial business transactions (see boxes for definitions).
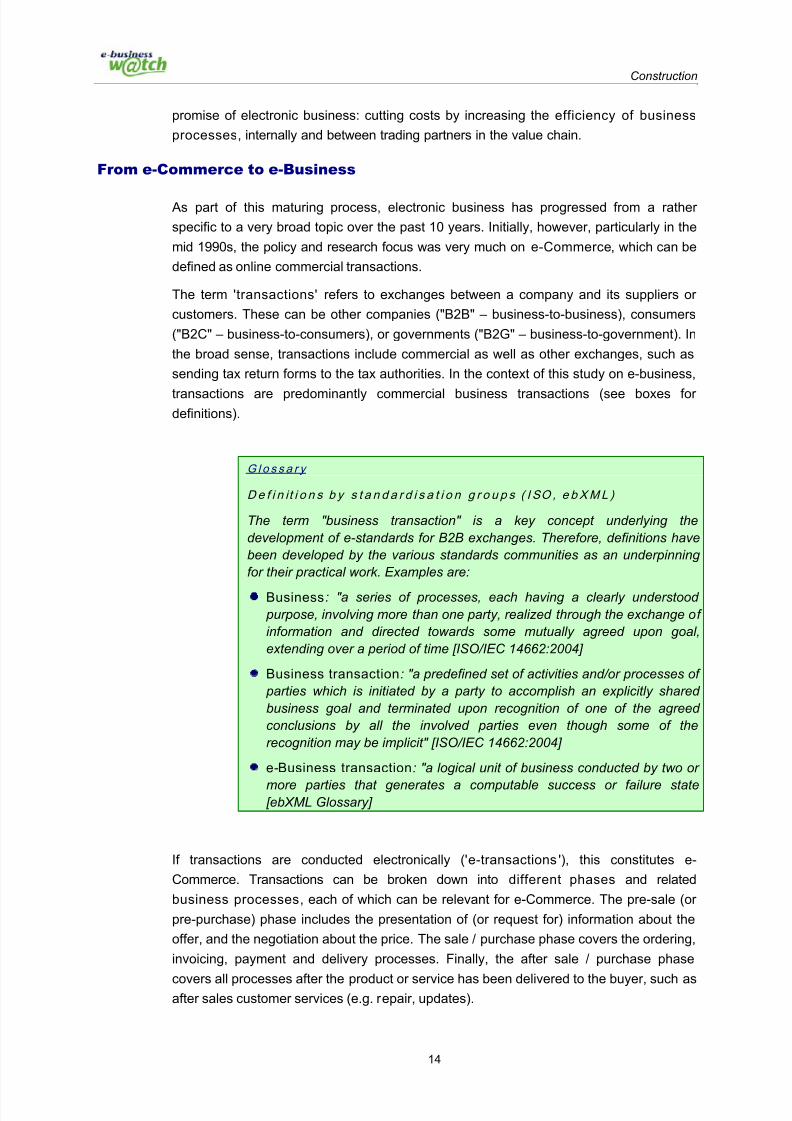
G l o s s a r y
De f i n it i o n s b y s t a n d a r d i s a t i o n g r o u p s ( I SO , e bXML )
The term "business transaction" is a key concept underlying the
development of e-standards for B2B exchanges. Therefore, definitions have
been developed by the various standards communities as an underpinning
for their practical work. Examples are:
Business: "a series of processes, each having a clearly understood
purpose, involving more than one party, realized through the exchange of
information and directed towards some mutually agreed upon goal,
extending over a period of time [ISO/IEC 14662:2004]
Business transaction: "a predefined set of activities and/or processes of
parties which is initiated by a party to accomplish an explicitly shared
business goal and terminated upon recognition of one of the agreed
conclusions by all the involved parties even though some of the
recognition may be implicit" [ISO/IEC 14662:2004]
e-Business transaction: "a logical unit of business conducted by two or
more parties that generates a computable success or failure state[ebXML Glossary]
If transactions are conducted electronically ('e-transactions '), this constitutes e-
Commerce. Transactions can be broken down into different phases and related
business processes, each of which can be relevant for e-Commerce. The pre-sale (or
pre-purchase) phase includes the presentation of (or request for) information about the
offer, and the negotiation about the price. The sale / purchase phase covers the ordering,
invoicing, payment and delivery processes. Finally, the after sale / purchase phase
covers all processes after the product or service has been delivered to the buyer, such asafter sales customer services (e.g. repair, updates).

7/28/2019 Construction 2006
http://slidepdf.com/reader/full/construction-2006 15/182
Construction
15
Exhibit 1-2: Process components of transactions
Pre-sale / pre-purchase
phase
Sale / purchase phase After sale / purchase
phase
Information about offer
Price comparisons
Negotiations betweenseller and buyer
Placing an order
Invoicing
Payment
Delivery
Customer service
Guarantee management
Credit administration
Handling returns
Practically each step in a transaction can either be pursued electronically (online) or non-
electronically (offline), and all combinations of electronic and non-electronic implement-
ation are possible. It is therefore difficult to decide which components actually have to be
conducted online in order to call a transaction (as a whole) ‘electronic’.
In this context, during 2000 the OECD proposed broad and narrow definitions of
electronic commerce both of which are still valid and useful:10 While the narrow definition
focuses on 'internet transactions' only, the broad definition defines e-Commerce as "thesale or purchase of goods or services, whether between businesses, house-holds,
individuals, governments, and other public or private organisations, conducted over
computer-mediated networks. The goods and services are ordered over those
networks, but the payment and the ultimate delivery of the goods or service may be
conducted on- or offline" (OECD, 2001).
G l o s s a r y
De f i n it i o n o f k e y t e rm s f o r t h i s s t u d y
e-Transactions: Commercial exchanges between a company and itssuppliers or customers which are conducted electronically. Participants
can be other companies ("B2B" – business-to-business), consumers
("B2C"), or governments ("B2G"). This includes processes during the pre-
sale or pre-purchase phase, the sale or purchase phase, and the after-
sale / purchase phase.
e-Commerce: Electronic Commerce. The sale or purchase of goods or
services, whether between businesses, house-holds, individuals, govern-
ments, and other public or private organisations, conducted over
computer-mediated networks. (OECD)
e-Business : Electronic Business. Automated business processes (both
intra- and inter-firm) over computer mediated networks. (OECD)
e-Interactions : Electronic Interactions include the full range of e-Trans-
actions, and in addition collaborative business processes (e.g. collabor-
ative design) which are not directly transaction focused.
10 In 1999, the OECD Working Party on Indicators for the Information Society (WPIIS) establishedan Expert Group on Defining and Measuring Electronic Commerce, in order to compiledefinitions of electronic commerce which are policy relevant and statistically feasible. By 2000,work of the Group had resulted in definitions for electronic commerce transactions.
7/28/2019 Construction 2006
http://slidepdf.com/reader/full/construction-2006 16/182
Construction
16
The addendum regarding payment and delivery is an important part of the definition, but
can be debated. The difficult question is which processes along the different transaction
phases constitute e-Commerce and which do not (see Exhibit 1-2). The OECD definition
excludes the pre-sale or purchase phase and focuses on a specific part of the sale /
purchase phase, namely the ordering process. e-Business W@tch follows the OECD
position on this issue.11
e-Commerce, defined in this way, is a key component of e-business, but not the only
one. In recent years, it has been increasingly acknowledged among policy and research
communities that the focus on e-commerce transactions may be too narrow to capture
the full implications of e-business. A wider, business process oriented focus has been
widely recognised. Reflecting this development, the OECD WPIIS12 proposed a (broader)
definition of 'e-business' as "automated business processes (both intra-and inter-firm)
over computer mediated networks" (OECD, 2004, p. 6). In addition, the OECD proposed
that e-business processes should integrate tasks and extend beyond a stand-alone or individual application.
This definition reflects an understanding of e-business that encompasses more than e-
commerce transactions. The broad concept of e-business also includes the digitisation of
internal business processes, as well as cooperative or collaborative processes
between companies which are not necessarily transaction-focused. Collaborative e-
design processes between business partners are a typical example from industrial
engineering. The OECD definition implicitly indicates that the focus and main objective of
electronic business is to be found in business process automation and integration, and
the impacts thereof.
To bridge the gap between 'e-Commerce' and 'e-Business', it was proposed in earlier
years (mainly around 2000) to use the term 'c-Commerce' (collaborative commerce).
Although this concept was rather abandoned when the new economy bubble burst, it has
some value as it stresses the role of ICT for cooperation among enterprises. If web
service and other emerging technologies (e.g. RFID, mobile applications) hold their
promise, the digital integration of B2B trading processes could be taken to a new level,
possibly with a considerable impact on industry structure. If so, it could be worth revisiting
the former 'c-Commerce' concept.
e-Business and the company's value chain
Given the broad concept of e-Business applied for this study, which concentrates on
business processes and a company's interactions with its environment, some further
structuring and mapping of processes is necessary. Michael Porter's framework of the
company value chain and value system between companies (Porter, 1985) is still valid
and useful in this context, although dating back 20 years to the pre-e-business era.
A value chain logically presents the main functional areas ('value activities') of a
company and differentiates between primary and support activities. However, these are
11 This is reflected in the updated wording of the respective survey questions in 2006, when for "placing / accepting online orders" was asked instead for "purchasing / selling online".
12 Working Party on Indicators for the Information Society

7/28/2019 Construction 2006
http://slidepdf.com/reader/full/construction-2006 17/182
Construction
17
"not a collection of independent activities but a system of interdependent activities", which
are "related by linkages within the value chain" (p. 48). These linkages can lead to comp-
etitive advantage through optimisation and coordination. In fact, it is exactly here that ICT
have a major impact, as they are a key instrument to optimise linkages and thus
increase the efficiency of processes.
The value system expands this concept by extending the perspective beyond the single
company. The firm's value chain is linked to the value chains of (upstream) suppliers and
(downstream) buyers, resulting in a larger set of processes – the value system.
e-Commerce, i.e. electronic transactions, occurs within this value system.
Exhibi t 1-3: Value chain framework of a company by Michael Porter
OperationsOutboundLogistics
Marketingand sales
ServiceInboundLogistics
Primary activities
ProcurementTechnology development
Human Resources Management
Firm infrastructure
Support activities
OperationsOutboundLogistics
Marketingand sales
ServiceInboundLogistics
Primary activities
ProcurementTechnology development
Human Resources Management
Firm infrastructure
Support activities
Source: Adapted from M.E. Porter (1985) – simplified presentation
Key dimensions of this framework (notably inbound and outbound logistics, operations,
and the value system) are reflected in the Supply Chain Management (SCM) concept.
Here, the focus is on optimising the procurement-production-delivery processes, not only
between a company and its direct suppliers and customers, but also aiming at a full
vertical integration of the entire supply chain (Tier 1, Tier 2, Tier n suppliers). In this
concept, each basic supply chain is a chain of sourcing, production, and delivery
processes with the respective process interfaces within and between companies.13 The
analysis of the digital integration of supply chains in various industries has been an
important theme in sectors studies previously prepared by e-Business W@tch.
e-Business and innovation
A very important aspect for e-Business W@tch studies is the link between ICT and
innovation. The European Commission places great emphasis on the critical role of
innovation for European businesses in order to stay competitive in the global economy.14
On the other hand, a strong competitive pressure provides powerful incentives for
companies to continuously engage in innovation and R&D. Thus, innovation, competition
and competitiveness are closely intertwined.
13 cf. SCOR Supply-Chain Council: Supply-Chain Operations Reference-model. SCOR Version7.0. Available at www.supply-chain.org (accessed in March 2006).
14 See, for example, "An innovation-friendly, modern Europe". Communication from theCommission, COM(2006) 589, 12 October 2006.
7/28/2019 Construction 2006
http://slidepdf.com/reader/full/construction-2006 18/182
Construction
18
ICT have been identified and widely recognised as a major enabler of innovation, in
particular for process innovation. According to the e-Business W@tch survey 2006,
75% of those companies that had introduced new business processes in 2005 reported
that this innovation was directly related to or enabled by ICT.
In many cases, the implementation of e-business processes in a company will const-
itute a process innovation in itself. In manufacturing sectors, e-business has triggered
significant innovation inside the companies, notably in supply chain and delivery proc-
esses, such as automatic stock replenishing and improved logistics. In service sectors
such as tourism, the innovative element is more evident in the way that external trans-
actions are accomplished. For example, if a company starts to sell its services online, this
can imply innovation in the service delivery process and in customer communication.
In some sectors, particularly in ICT manufacturing, consumer electronics and
telecommunications, ICT are also highly relevant for product innovation.
However, as more companies strive to exploit the innovation potential of ICT, it becomesmore difficult for the individual company to directly gain competitive advantage from this
technology. e-Business is becoming a necessity rather than a means to differentiate from
competitors.15 In addition, the introduction of innovation can cause substantial costs in
the short and medium term, as it may take time before the investments pay off. This
causes challenges in particular for small and medium-sized companies. It is one of the
reasons why e-Business W@tch focuses on such challenges in its sector studies (see
also ‘Policy Background’ in chapter 1.1).
15 Cf. Carr, Nicholas (2003). "IT Doesn't Matter". In: Harvard Business Review, May 2003.

7/28/2019 Construction 2006
http://slidepdf.com/reader/full/construction-2006 19/182
Construction
19
2 Context and Background
2.1 Sector definition – scope of the study
Business activities covered
This study explores the development of e-business in the European CI. The main focus is
on engineering and construction enterprises working as main- and sub-contractors. The
study also covers other important players in the construction value chain, such as
material suppliers and architects, when this is relevant for the analysis. Engineering and
construction enterprises constitute a rather homogeneous group in terms of value-adding
activities in the construction value chain, enterprise set-up and organisation, and ICT
capability level.
With this scope in mind, the study covers business activities specified by NACE Rev. 1.1
groups F 45.2 (except 45.22) and F 45.3 (except 45.34).16
Exhibi t 2-1: Business activi ties covered by this study (NACE Rev. 1.1)
NACE Rev. 1.1
Group(s) Class(es)Business activities
F 45.2 Building of complete constructions or parts thereof; civil engineering
45.21 General construction of buildings and civil engineering works
45.23 Construction of motorways, roads, airfields and sport facilities
45.24 Construction of water projectsF 45.3 Building installation
45.31 Installation of electrical wiring and fittings
45.32 Insulation work activities
45.33 Plumbing
As mentioned above, engineering and construction enterprises are interlinked with other
stakeholders in the CI. Exhibit 2-2 below illustrates a non-exhaustive example of a value
chain in the CI and indicates the links between the engineering and construction
enterprises and other industry stakeholders.
The sector value system
The CI value system consists of a large number of stakeholders. It is widely spread
across many value-adding activities including raw material discovery and retrieval,
construction material manufacturing, drawing, design, engineering, construction, and
supervision. This study focuses on engineering and construction enterprises and
construction clients/owners. However, as shown below in exhibit 2-2, these stakeholders
are interlinked with other stakeholders such as manufacturing enterprises and supporting
industries. The vertical value system represented in this exhibit starts with industrial
16 NACE Rev. 1.1 is a 4-digit classification of business activities. It is a revision of the ‘GeneralIndustrial Classification of Economic Activities within the European Communities’ known by theacronym NACE and originally published by Eurostat in 1970.

7/28/2019 Construction 2006
http://slidepdf.com/reader/full/construction-2006 20/182
Construction
20
enterprises producing and selling raw materials and ends with the users/owners of the
infrastructure.17
Exhibi t 2-2: The CI value chain
Source: Inspired by Danish National Agency for Enterprise and Construction, Building –House; a Business Analysis (Bygge – Bolig, en erhvervsanalyse), 2004
N.B: exhibit 2.2 above represents a simplified version of the construction supply chain.
Economic operators such as certification and inspection bodies, insurance enterprises
and administrations could be added to give a more detailed picture of the value chain.
2.2 Industry background
The European CI is currently experiencing a period of growth in production following a
decade of limited growth. The growth in production has been estimated at about 1.8% for
the year 2005 (CIFT 2006, p. 1). In the second quarter of 2006, the CI’s seasonally
adjusted production grew by 1.9% in EU25, compared to the previous quarter. Compared
to the second quarter of 2005, output in the second quarter of 2006 in the sub-sector of
building construction rose by 3.9% in EU25, after increases of 2.9% in the first quarter of
2006. The sub-sector of civil engineering grew by 0.4% in the EU25 after a fall of 3.9%
respectively in the previous quarter (European Commission, STAT/06/116, Sep. 2006).
17 The industry also includes stakeholders like official organs, construction industry think tanks,and trade- and industry associations.
INDUSTRIAL
ENTERPRISES
SUPPORTING
INDUSTRIES
END USERS
PPrroodduucceerrss oof f
rraaww mmaatteerriiaall PPrroodduucceerrss oof f
ccoonnssttrruuccttiioonn mmaatteerriiaall
RReettaaiilleerrss oof f ccoonnssttrruuccttiioonn mmaatteerriiaall
Universities, research institutions,
and construction equipment Real estate brokers
CCoonnssttrruuccttiioonn
mmaannaaggeemmeenntt
EEnnggiinneeeerrss / /
aarrcchhiitteeccttss
Client, owner
Enterprises/
private owners
CONSTRUCTION
ENTERPRISES
CLIENTS
CCoonnttrraaccttoorrss
Building
management
OOppeerraattiioonn & &
mmaaiinntteennaannccee

7/28/2019 Construction 2006
http://slidepdf.com/reader/full/construction-2006 21/182
Construction
21
The growth in production in the CI is, however, not evenly distributed across the EU
Member States. Certain Member States have experienced high rates of growth in
production (Ireland, Latvia, Slovakia, Slovenia, Czech Republic and, to a lesser extent,
Austria, the United Kingdom, and Romania). On the other hand, the German and
Portuguese CI have been subject to low growth in production for several years now (EBS2005, p. 14). The new Member States are expected to see the highest growth rates in the
CI over the years 2003-09, as their governments invest heavily to upgrade large sections
of their infrastructure (Camecon, www.camecon.com, April 2006).
2.2.1 Size of the EU construction industry
According to recent figures from the European Construction Industry Federation (FIEC),
the CI is the largest industrial cluster in the EU, representing some 9.9% of Gross
Domestic Product (GDP), corresponding to one-quarter of the total European industrial
output (FIEC 2006, p. 1). According to the European Commission, about 910bn euros
were invested in construction in 2003, representing approx. 10% of the GDP and more
than 50% of the Gross Fixed Capital Formation of EU-15.18
The estimated construction investment in EU-15 for 2004 is 1.004bn euros (FIEC 2006,
p. 1). There are approximately 2.4m construction enterprises, of which 97% are micro or
small enterprises with fewer than 20 employees. Enterprises with fewer than 250
employees (SMEs) account for 78% of the turnover and employ about 80% of the work
force. According to FIEC, the industry employs 14m people equal to 7.1% of the
European work force and 28.5% of industrial employment19. 26m workers in the EU
depend, directly or indirectly, on the CI (FIEC 2006, p. 2).
The main activities in the European CI are house-building (26%), non-residential building
(29%), civil engineering (20%) and rehabilitation (25%) (FIEC 2006, p. 2). Other sources
indicate that the total European turnover is generated from new residential buildings
(22%), maintenance and renovation of residential buildings (23%), new non-residential
buildings (20%), maintenance and renovation of non-residential buildings (14%) and
public procurement (21%) (European Builders Confederation, September 2006).
The new EU Member States also have large CIs. In Poland, the Czech Republic and
Hungary alone, the turnover was about 38bn euros in 2003 and the market is estimated
to grow significantly at an average rate of 4.2% per year.20
18 European Commission, http://europa.eu.int/comm/enterprise/construction, April 200619 Figures from the European Commission estimate the employment at around 11.8 m people.20 European Commission, http://europa.eu.int/comm/enterprise/construction, April 2006

7/28/2019 Construction 2006
http://slidepdf.com/reader/full/construction-2006 22/182
Construction
22
2.2.2 Trends and challenges
The European CI currently faces some challenges brought on by globalisation, cross-
border job migration and new ICT requirements. The industry is confronted with a trend
towards consolidation among industry stakeholders, increased use of sub-contractors,increased focus on environmental issues and the impact of globalisation on the
manufacturing of construction materials. The following section provides an overview of
these trends and challenges.
Globalisation affecting procurement behaviour
Globalisation affects the European CI as the production of building materials is
increasingly internationally based. Measures to offset the effects of globalisations are
promoted by EU initiatives for certification of all products to be sold or traded in the
European market. Globalisation is expected to lead to decreasing material prices, inparticular for larger enterprises that purchase large volumes of building materials.
Construction SMEs may have to collaborate in order to increase purchase volume, or
charge customers higher material prices (EBS 2005, p. 14).
Large construction enterprises are already altering their procurement behaviour from
decentralised site-specific procurement to centralised bulk procurement of frequently
used building materials. This centralisation of procurement is, however, often a time-
consuming process that requires organisational changes in order to be successful.
Globalisation of the markets is, by some, expected to help improve quality in construction
materials, and related additional costs can be shared across a broader market (EMCC
2005, p. 20).
Consolidation among industry stakeholders
Another - related - trend in the European CI is consolidation among construction
contractors and engineering enterprises (Ricaud, www.pwc.com, April 2006). The market
for construction materials is increasingly dominated by large enterprises with international
operations, capable of profiting from standardisation efforts in the field of product norms.
As a client of such enterprises, the CI is forced to acquire the appropriate market clout by
creating mega-enterprises and entering alliances, thus presenting a counterweight to the
growing bargaining power of its suppliers (UBS 2006, p. 1).
For larger construction enterprises, increasing customer demand – public, private, and
public-private partnerships – will strengthen the consolidation of the industry. Enterprises
require a broad range of qualifications, as well as a solid financial base, to be able to
interact with the customer to develop customised building solutions.
To complement the full-service enterprises, small specialised suppliers will evolve. Their
function will be to offer highly specialised and qualified products and services which the
large enterprises do not regard as one of their key competencies. Due to the size of
projects and the local character, continuous building maintenance will still mainly be
carried out by small, local enterprises (EMCC 2005, p. 21).
Increased use of sub-contracting

7/28/2019 Construction 2006
http://slidepdf.com/reader/full/construction-2006 23/182
Construction
23
Another trend in the European CI concerns the use of sub-contractors. According to one
source, construction enterprises have, in recent year, increased the use of third parties to
handle incoming orders (UBS 2006, p. 1). The continuity of resources – both human and
material – that are crucial to managing the flow of work, can often be assured only by
passing on some of the work to partner enterprises or by hiring temporary staff. Thismeans, however, that construction enterprises face increasing demands in terms of
quality assurance, cost planning and project monitoring.
Increased focus on environmental issues
Environmental issues have also gained importance in the European CI. The focus on
environment and sustainability is continuously increasing among public and private
building owners and users. This trend spans the whole life cycle of a building. In the
construction process, many aspects should be taken into consideration: re-using existingphysical assets; designing for minimum waste; minimising energy use throughout the life
cycle; avoiding pollution; adding to bio-diversity; conserving water resources; respecting
people and communities (EMCC 2005, p.19).
This trend is supported by the European Union Directive on energy efficiency. This
directive is targeted at achieving a 1% yearly energy saving in the retail, supply and
distribution of electricity, natural gas, urban heating, and other energy products including
transport fuels. The Directive will further support the trend toward construction of energy
efficient buildings and the promotion of energy-efficient construction processes. This
theme is also relevant when renovating large urban areas in the new EU Member States.
In these large-scale infrastructure projects, increasing emphasis is put on sustainable
construction.
2.3 Review of earlier sector studies
The 2005 e-Business W@tch sector study on the CI concluded that ICT was not
considered by the CI itself to be an essential parameter for business competitiveness.21
Two sets of explanations for the low use of ICT were presented in the 2005 e-Business
W@tch sector study on the CI:
Construction services consist of unique projects with a natural manual element
(labour-intensive). Customers generally demand tailor-made solutions and a
close customer relationship over a longer period of time is typical for the
construction process. Construction services thus seemed less suited for e-
commerce than, for example, IT services and/or industries dealing with mass
produced, standardised physical products.
21 To access the 2005 e-Business W@tch sector study on the CI please visit www.ebusiness-watch.org

7/28/2019 Construction 2006
http://slidepdf.com/reader/full/construction-2006 24/182
Construction
24
There is a predominant oral culture in the CI with a conversation-based rather
than a textual, information-based cooperation form. Traditions and habits seemed
to form a barrier to ICT uptake in the sector. At the same time, in comparison with
enterprises in some other sectors studied by the e-Business W@tch, construction
enterprises to a higher extent employed staff with limited ICT skills and offeredonly irregular ICT training to their employees. Consequently, many enterprises
demonstrated limited ICT competence levels.
The 2005 e-Business W@tch sector study also concluded that production improvements
via ICT in the CI as a whole lagged behind other industries. The reportedly low ICT usage
in construction SMEs, despite the purported availability of ICT solutions with good return
on investment (ROI), implied that something was missing in these enterprises – either
awareness of these systems or the competencies to use them (e-Business W@tch
2005b). Furthermore, it was concluded that in terms of internal integration, SMEs faced
different challenges than the larger CI enterprises. Small companies did not usually have
as many types of ICT applications as their larger counterparts and, thus, the issue of
integration did not have a strong resonance among SMEs. On the other hand, findings of
the 2005 survey indicated that many CI SMEs had neither a consistent ICT strategy nor
sufficient skills and competencies to ensure an efficient integration of the ICT systems
they already had. Other problems for SMEs in this sector included handling conflicting
demands from various external customers and a tradition of using “home-made” systems.
External collaboration, in the form of business-to-business (B2B) cooperation, was
identified as an area of high relevance and potential for SMEs in construction. Most
SMEs were quite dependent on external relations with other enterprises in the industry.
However, as demonstrated by case studies on the standardisation and interoperabilityinitiatives from Denmark, Luxembourg and the Netherlands, there was still a long way to
go before reaching more advanced solutions. Thus, many construction enterprises,
especially SMEs, were left with less complicated ICT solutions, whereas larger
enterprises were more active in this application area (e-Business W@tch 2005b, p. 66).
Finally, the field of e-procurement had thus far been driven primarily by the industry’s
large enterprises which were found using e-purchases to support a broader
rationalisation of procurement workflows. In last year’s sector study it was argued that
SMEs were only involved to a limited degree in e-procurement of building materials. The
most important challenge identified in this respect was supplying services to clients who
were increasingly oriented towards electronic tendering. Participation in e-tendering
meant that enterprises needed to have certain minimum ICT knowledge and literacy (e-
Business W@tch 2005b, p. 66).

7/28/2019 Construction 2006
http://slidepdf.com/reader/full/construction-2006 25/182
Construction
25
3 Adoption of ICT and e-Business in 2006
Background information about the e-Business Survey 2006
e-Business W@tch collects data on the use of ICT and e-business in European
enterprises by means of representative telephone surveys. The e-Business Survey 2006
was the fourth survey after those of 2002, 2003 and 2005. It had a scope of 14,081
interviews with decision-makers in enterprises from 29 European countries.22
Most of the tables in this report feature a breakdown of the population of enterprises
based on the aggregate of 10 EU countries – the "EU-10" .23 In these countries the
survey covered all 10 sectors (at least to some extent) and therefore comparability of the
sample across sectors is given. The EU-10 represent more than 80% of the total GDP
and inhabitants of the EU-25 and are thus to a large extent representative for the whole
EU.
The survey was carried out as an enterprise survey, i.e. focusing on the enterprise as a
business organisation (legal unit) with one or more establishments. Similarly to 2005, the
2006 survey also included only companies that use computers. The configuration of
the survey set-up (e.g. sampling) reflects the mandate of e-Business W@tch to focus on
sectors and SMEs. As a result, comparisons should mainly be made between sectors
and between size-bands of enterprises. Breakdowns by country are also possible, but
should be treated cautiously, for several reasons (see Annex I).
In the CI 2.654 interviews were conducted; out of these, 754 with companies from theEU-10. Some data are broken down into the two main sub-sectors, i.e. the two NACE
groups which make up the total CI as defined for this study (see Section 2.1): 45.2
(Building of complete constructions or parts thereof; civil engineering) and 45.3 (Building
installation).
When representing data for the two NACE groups in Chapter 3, the abbreviation “Comp.
con.” will be used to describe NACE group 45.2 and the abbreviation “Installation” will be
used when referring to NACE group 45.3. It should be noted that the average size of
surveyed “comp. con.” enterprises was 411 employees and, respectively, 95 employees
for “installation” companies. This difference in size indicates that complete constructionenterprises have larger human and financial resources to invest in ICT. In addition, large
construction enterprises more often take on the role of prime contractor and, hence, more
often need ICT to communicate with project stakeholders and project management.
22 The survey was conducted in March-April 2006 using computer-assisted telephone interview(CATI) technology. Field-work was co-ordinated by the German branch of Ipsos GmbH(www.ipsos.de) and conducted in co-operation with their local branches and partner
organisations. The countries covered include EU Member States, Acceding and CandidateCountries, and countries of the European Economic Area (EEA).
23 The EU-10 cover the Czech Republic, Germany, Spain, France, Italy, Hungary, theNetherlands, Poland, Finland and the UK.

7/28/2019 Construction 2006
http://slidepdf.com/reader/full/construction-2006 26/182
Construction
26
More detailed information about the survey methodology, including information about
sampling and the business directories used, the number of interviews conducted in each
country and sector, data on non-response rates, as well as selected results by country
are available in Annexes I and II and on the e-Business W@tch website.
3.1 Use of ICT Networks
Internet access
About nine out of every ten construction enterprises that were interviewed in 2006 said
that they have internet access. This share is slightly below the weighted average for the
10 sectors covered by the e-Business Survey 2006. Almost all construction enterpriseswith 250 employees or more said that they have access to the internet, while a little less
than 9 in 10 of this sector’s micro-enterprises (i.e. with nine or less employees) did so. By
share of employment, enterprises representing about 95% of the CI workforce reported
having internet access.
Looking at different enterprise size-bands, the e-Business W@tch survey indicates that
complete building enterprises have access to the internet more often than building
installation enterprises. This difference can be attributed to the average size of the
enterprise in the two different sub-sectors (see ‘Background information about the e-
Business Survey 2006’).
CI enterprises representing about three quarters of the sector’s workforce said that they
have a broadband internet connection. Compared to the weighted average of the 10
surveyed sectors, the CI is placed just below the average, which is 76%. Compared to
other sectors studied this year by e-Business W@tch, the CI has one of the lowest
uptakes of broadband internet access, both in terms of percentage of employees and of
firms. This can, to a large extent, be explained by the large number of SMEs in the CI and
the nature of the work which does not involve the same amount of ICT as many other
production sectors. Almost 9 in 10 of the large enterprises (250+ employees) have
adopted broadband, compared to about 6 in 10 of the micro enterprises (1-9 employees).
This difference may be attributed to the fact that many micro-enterprises are sub-
contractors to larger enterprises in this sector. When operating as a sub-contractor, the
need for broadband internet may not be as high as when operating as a prime contractor
with responsibility for project management, interaction and communication with the
building’s owner and the like.
In the two sub-sectors, adoption of broadband internet access is, again, more widespread
among complete construction enterprises than among building installation enterprises.
The explanation is the same as above, namely the higher share of large enterprises
among the complete construction enterprises, with larger human and financial resources
to invest in ICT, and a higher propensity to undertake assignments that require moresophisticated information systems.

7/28/2019 Construction 2006
http://slidepdf.com/reader/full/construction-2006 27/182
Construction
27
Exhibit 3-1: Internet access and remote access to company network
Companies
with internet
access
Companies
with
broadband
internet access
Average share
of employees
with internet
access*
Remote access
to company
network
Weighting: % of empl.
% of firms
% of empl.
% of firms
% of empl.
% of firms
% of empl.
% of firms
Construction (EU-10) 95 90 72 64 n.a. 47 25 13
Micro (1-9 empl.) 89 60 48 10Small (10-49 empl.) 99 73 28 23Medium (50-249 empl.) 99 86 38 40Large (250+ empl.) 98 87 42 56 NACE 45.2 (Comp. con.) 97 93 80 71 n.a. 55 31 13NACE 45.3 (Installation) 92 89 65 61 n.a. 43 20 12 Al l 10 sectors (EU-10) 95 93 76 69 n.a. 43 35 16
Micro (1-9 empl.) 89 62 51 12Small (10-49 empl.) 98 75 29 22
Medium (50-249 empl.) 99 83 33 43
Large (250+ empl.) 99 84 44 60 Food & beverages 95 88 72 64 n.a. 25 35 14Footwear 96 89 75 62 n.a. 28 17 10Pulp & paper 99 94 80 68 n.a. 40 56 21ICT manufacturing 100 99 84 79 n.a. 74 69 35Consumer electronics 98 97 87 74 n.a. 80 51 32Shipbuilding & repair 100 100 87 86 n.a. 30 41 27Construction 95 90 72 64 n.a. 47 25 13Tourism 93 90 72 68 n.a. 53 38 13Telecommunication 100 99 88 85 n.a. 90 74 46Hospitals activities 100 98 85 78 n.a. 41 39 34
Base (100%)firms usingcomputers
firms usingcomputers
firms withinternet access
firms usingcomputers
N (for sector, EU-10) 754 754 715 754Questionnaire reference A1 A3 A2 A5
* Read: “The average share of employees with internet access in a CI company is 47%”
Source: e-Business W@tch (Survey 2006)
According to the survey results, about half of employees in the CI enterprises have
access to the internet. This is slightly above the weighted average of the 10 industries
analysed this year. In comparison to other sectors studied by e-Business W@tch in 2006,
companies in the CI appear to be better performing than footwear or food & beverages
enterprises. In fact, only about a quarter of the employees in the footwear and food &
beverages industries were reported having internet access. Companies in the tourism
industry, however, appear to be performing better than CI ones in this field. This could be
explained by the tourism sector’s focus on e-marketing / e-reservation which require
increased access to the internet.
Concerning size-bands, data from this year’s survey indicate significant differences.
SMEs in CI have reported a lower share of employees with internet access than both
micro-enterprises and large enterprises. As regards micro-enterprises, the reported

7/28/2019 Construction 2006
http://slidepdf.com/reader/full/construction-2006 28/182
Construction
28
higher share of employees with internet access could be explained by the fact that even
small changes in the number of internet accesses in these companies would influence
the percentage of employees with internet access. Concerning large enterprises, the
higher representation of employees with internet access can be explained by the larger
number of skilled employees in addition to the greater availability of resources to invest inICT.
As regards differences between the two sub-sectors, less than 6 out of every 10
employees of complete construction enterprises have internet access, compared to
slightly more than 4 in 10 working in building installation enterprises. Often only owners
and key administrative personnel of small building installation enterprises use the internet
which helps explaining the lower number of employees with internet access in this case.
Use of internal computer networks
Local Area Network (LAN) can be seen as a basic indicator of the minimuminfrastructure requirements necessary to enable companies to conduct e-business on a
substantial level (e-Business W@tch, Sector Study, 2003/2004, p. 25). According to the
survey results about 4 in 10 surveyed enterprises in CI reported having a LAN. Compared
to the weighted average of the 10 surveyed sectors, the CI is about in line. The average,
however, covers significant differences between companies of different sizes, with a clear
relationship between enterprise size and the uptake of LAN. About 9 in 10 large
enterprises have implemented LAN as opposed to about a third of micro-enterprises. This
relationship can largely be explained, again, by the larger resources and need for
advanced ICT among large enterprises.
Complete construction enterprises also apply LAN technologies more often than building
installation enterprises. Again, this should mostly be due to the larger share of prime
contractors among complete construction enterprises.
Looking at wireless technology that can interlink computers with internal networks and the
Internet – i.e. Wireless Local Area Networks (W-LAN) – the survey results show that
about 1 in 10 of the CI enterprises has implemented such technologies. Compared to the
weighted average of the 10 sectors included in the survey, the CI is slightly below. Again,
a relationship between enterprise size and the uptake of WLAN can be identified, since
about a third of the large enterprises reported having a WLAN, whereas only about 1 in
10 micro-enterprises did so.
However, while all CI company sizes lag behind the all-sector average, the lower uptake
of WLAN in the CI is particularly pronounced for the larger size-groups. In the CI,
enterprises representing 20% of the employment said that they use WLAN as opposed to
enterprises representing about a third of employment in the weighted average of the 10
surveyed sectors. This lower uptake of WLAN in the CI can be partly explained by the
large proportion of micro-enterprises in the CI often lacking financial resources for
investment in WLAN. Indeed, it should be kept in mind that the sector – and thus the
survey sample – has a high share of micro-enterprises which would account for the close
proximity between the sector’s and the micro-enterprises’ averages.

7/28/2019 Construction 2006
http://slidepdf.com/reader/full/construction-2006 29/182
Construction
29
Exhibit 3-2: Networks and protocols used
LAN W-LANUse Voice-
over-IP
Use VPN for
remote access
Weighting: % of
empl.
% of
firms
% of
empl.
% of
firms
% of
empl.
% of
firms
% of
empl.
% of
firmsConstruction (EU-10) 58 43 20 13 13 11 52 34
Micro (1-9 empl.) 36 10 10 24
Small (10-49 empl.) 57 19 10 30
Medium (50-249 empl.) 86 29 11 60
Large (250+ empl.) 88 35 29 77
NACE 45.2 (Comp. con.) 65 50 22 11 14 11 53 12
NACE 45.3 (Installation) 52 40 18 14 12 11 50 45
Al l 10 sectors (EU-10) 65 46 32 16 16 13 57 26
Micro (1-9 empl.) 35 12 14 20Small (10-49 empl.) 59 21 11 32
Medium (50-249 empl.) 84 37 13 57
Large (250+ empl.) 96 47 22 79
Base (100%)firms usingcomputers
firms usingcomputers
firms usingcomputers
Firms enablingremote access
N (for sector, EU-10) 754 754 754 228Questionnaire reference A4a A4b A4c A6d
Source: e-Business W@tch (Survey 2006)
Voice-over-IP
The use of telephony services over the internet has gained momentum over the past few
years. Established as well as new telecommunication service companies and internet
service providers offer new, cost-efficient services based on this technology. These
services are commonly referred to as "Voice-over-IP" (VoIP) services, as they have in
common that they use the Internet Protocol (IP) to transfer voice calls.
The uptake of VoIP in the CI is, in line with findings for the other sectors studied, not very
high. About 1 in 10 construction enterprise reported using VoIP telecom services. This isroughly in line with the all-sectors weighted average. Furthermore, no significant
differences are observed between the two CI sub-sectors or different size-classes, except
for a significantly higher uptake among the largest enterprises – both in CI and across all
sectors studied this year by e-Business W@tch. This may be attributed to the fact that
VoIP is still an emerging technology.
Virtual Private Network
Production activities in the CI are often physically separated from supporting functions
such as administration, accounting and other back-office activities. Remote access to
company networks via virtual private networks (VPN) enables continuous information
retrieval, and could therefore provide added value to the construction enterprises by
7/28/2019 Construction 2006
http://slidepdf.com/reader/full/construction-2006 30/182
Construction
30
enabling employees to access enterprise systems on-site. Basically, VPN is a technology
that uses public communication infrastructure to provide employees with a secure
connection to the enterprise’s network.
Enterprises representing 52% of employment in CI said that they use VPN for remote
access to company networks. On this indicator, the CI is in line with the weighted 10-
sector average and, again, the data show a clear relationship between enterprise size
and VPN uptake. About 8 in 10 large enterprises have implemented VPN technology
compared with about 1 in 10 of the micro enterprises. Besides the obvious explanation
relating to financial and human resources for ICT growing with company size, another
reason could be that construction SMEs mainly do business locally, while the
geographical market reach is bigger for larger enterprises. Larger enterprises are,
therefore, more dependent on remote access to stay in contact with their employees and
may thus choose to a higher degree to invest in remote access systems.
Interestingly, the usual relationship between sub-sector and ICT uptake does not applywhen looking at the number of enterprises using VPN. Employment-weighted data
confirm the relationship between enterprise size and uptake of ICT in the two sub-sectors
but, when looking at the number of enterprises, it appears that only about 1 in 10
complete construction enterprises reported using VPN compared to more than 4 in 10
building installation enterprises which did so. If not caused by statistical errors, this
discrepancy would be difficult to explain without further investigation.
3.2 ICT Skills, Outsourcing and ICT Budgets
3.2.1 Demand for ICT skills and skills development
About 15% of construction enterprises surveyed by e-Business W@tch in 2006 said that
they employ ICT practitioners, a percentage which is in line with the all-sectors
average. Not surprisingly, there is a straight-forward relationship between company size
and the employment of ICT practitioners, ranging from 14% among micro-enterprises up
to more than half of the large firms. Again, the main explanation is that the larger the
enterprise, the greater the capacity to take on more complex assignments which may
require the company to be able to handle e.g. 3D technologies for construction design,
different types of document management and other advanced ICT systems. These types
of systems require ICT practitioners to implement and maintain. Compared with the other
sectors covered by this year’s survey, the CI is one of the four sectors reporting low rates
of employing ICT practitioners, both when looking at the employment-weighted numbers
(between 20 and 27%) and in terms of the share of firms (between 11% and 14%).
Another important element of ICT skills development is the use of ICT training of
employees. In the CI, 12% of enterprises said that they carry out regular ICT training of
their employees, which is again very close to the weighted average of the 10 surveyed
sectors. However, when looking at employment-weighted figures, the CI is somewhatbelow the all-sectors average. Also in this case, the survey results show differences in
the use of regular ICT training across different enterprise sizes. About one third of the

7/28/2019 Construction 2006
http://slidepdf.com/reader/full/construction-2006 31/182
Construction
31
surveyed large CI enterprises reported regular ICT training, a percentage which is about
three times as high as among this sector’s micro-enterprises. This confirms that there
seems to be more limited need for, and focus on, ICT skills development among
construction SMEs. Interestingly, building installation enterprises reported regular ICT
training more often than complete construction enterprises. This observation is interestingbecause, if confirmed by further analysis, it could indicate that there is a movement
towards reducing the ICT gap between the two sub-sectors.
Exhibit 3-3: Demand for ICT skills and skills development
Companiesemploying ICTpractitioners
Regular ICTtraining of employees
Companieswith hard-to-fillvacancies for
ICT jobs in2005
Companiesusing
e-learning
Weighting: % of empl.
% of firms
% of empl.
% of firms
% of empl.
% of firms
% of empl.
% of firms
Construction (EU-10) 22 14 18 12 2 1 12 8Micro (1-9 empl.) 14 10 1 9Small (10-49 empl.) 19 18 0 7Medium (50-249 empl.) 28 28 2 14Large (250+ empl.) 52 32 6 30 NACE 45.2 (Comp. con.) 24 14 16 7 2 0 14 9NACE 45.3 (Installation) 20 14 19 15 1 2 11 7 Al l 10 sectors (EU-10) 27 14 22 13 2 1 21 11
Micro (1-9 empl.) 12 9 2 12
Small (10-49 empl.) 15 16 0 11
Medium (50-249 empl.) 29 28 2 19Large (250+ empl.) 59 41 6 35
Food & beverages 26 11 26 14 2 0 16 9Footwear 20 13 14 6 1 0 7 5Pulp & paper 35 16 29 12 3 1 21 13ICT manufacturing 52 31 39 24 8 3 28 20Consumer electronics 35 17 21 16 4 2 23 18Shipbuilding & repair 36 33 29 20 4 0 14 15Construction 22 14 18 12 2 1 12 8Tourism 27 12 21 11 3 2 29 15Telecommunication 63 33 52 21 12 5 41 28
Hospitals activities 57 39 39 34 5 3 26 22Base (100%) firms using computers
N (for sector, EU-10) 754 754 754 754Questionnaire reference B1 B4 B2 B5
Source: e-Business W@tch (Survey 2006)
e-Learning, i.e. the support of training with learning material in electronic format (for
example material that is available on a company’s intranet or the internet), is another
interesting indicator for the uptake of ICT in the CI. According to the survey results, a
limited number of enterprises reported e-learning practices: 8% of CI enterprises,
representing 12% of employment, which is below the weighted all-sectors average, where
enterprises representing 21% of employment said that they use e-learning.

7/28/2019 Construction 2006
http://slidepdf.com/reader/full/construction-2006 32/182
Construction
32
In terms of differences between size-classes, about every tenth micro or small CI
enterprise reported using e-learning compared to about every third large enterprise.
These figures can, to a certain extent, be explained by the fact that many construction
SMEs conduct the bulk of their employee training on-site and on-the-job. Larger
construction enterprises may, due to a larger organisation, more resources and higher numbers of administrative personnel, have a higher propensity to prefer a more
standardised employee training programmes which can include e-learning.
Another interesting indicator is the share of companies which reported hard-to-fill ICT
jobs . This indicator may, on the one hand, indicate the condition of the current labour
market for ICT professionals and, on the other, provide useful insights about the demand
for ICT practitioners. Survey findings show that the reported number of hard-to-fill
vacancies for ICT jobs is limited in the CI, with only 1% of enterprises saying that they
have problems filling such vacancies. This picture is fully in line with the respective all-
sectors average and similar to most other sectors studied in 2006, except for the ICT-
intensive ones. This limited demand for ICT skills is further supported by the analysis in
Section 4, suggesting that SMEs have difficulties in identifying the benefits of using ICT
systems and employing ICT practitioners.
3.2.2 Outsourcing of ICT services and ICT investments
Outsourcing
In 2006 e-Business W@tch asked enterprises whether they had outsourced during the
previous year any of their ICT services which they were previously conducting in-house.
Outsourcing of services can be a solution when internal resources are not readily
available and/or when it is economically sound to place parts of the business process
outside the traditional boundaries of the enterprises.
14% of CI enterprises, representing a fifth of employment in this sector, said that they had
outsourced ICT services which they had previously conducted in-house. This figure is in
line with the weighted average of the 10 sectors both in terms of number of enterprises
and in terms of employment.
Looking at enterprise sizes, there are two interesting observations. Firstly, all CI
enterprise groups except the micro-enterprises are, for once, above the all-sectorsaverage when it comes to outsourcing ICT services. However, this is actually consistent
with the other indicators showing that CI in-house ICT capabilities are generally lower
than in other sectors studied this year, thus making it quite natural to outsource some ICT
processes. Secondly, there is a considerable gap between micro-enterprises, which
rarely outsource ICT services, and all other types of enterprises, which reported doing so
fairly regularly. This observation may be explained on the following grounds: when
outsourcing services, the volume, in terms of contract sum, must be high enough for ICT
service providers to be willing to engage in an outsourcing agreement. Many of the
operations in a micro-enterprise may not be large enough for outsourcing.

7/28/2019 Construction 2006
http://slidepdf.com/reader/full/construction-2006 33/182
Construction
33
Exhibit 3-4: Outsourcing and spending on ICT
Have
outsourced ICT
services in
2005
Share of ICT
budget as % of
total costs
Have made ICT
investments in
2005
Difficulty to
draw funds for
investments
Weighting: % of empl.
% of firms
% of empl.
% of firms
% of empl.
% of firms
% of empl.
% of firms
Construction (EU-10) 20 14 5 4 58 45 (7)* (11)*
Micro (1-9 empl.) 8 4 38 (13)**
Small (10-49 empl.) 24 4 60 (0)**
Medium (50-249 empl.) 23 5 79 (0)**
Large (250+ empl.) 41 8 85 (0)**
NACE 45.2 (Comp. con.) 24 14 5 3 64 52 (0)* (0)*
NACE 45.3 (Installation) 16 14 5 4 51 42 (15)* (18)*
Al l 10 sectors (EU-10) 19 14 6 5 65 50 19 15
Micro (1-9 empl.) 8 5 39 25
Small (10-49 empl.) 21 5 60 3
Medium (50-249 empl.) 21 6 78 6
Large (250+ empl.) 31 6 86 29
Base (100%)firms usingcomputers
all firms (excl."don't know")
firms usingcomputers
Firms withexternal fundingsources for their ICT investments
N (for sector, EU-10) 754 482 754 28
Questionnaire reference B6 C1 C3 C5( )* numbers are only indicative due to low number of observations (< 50)
** numbers are not of statistical value because of low number of observations (< 25)
Source: e-Business W@tch (Survey 2006)
In addition, the articulation and optimisation of internal business processes may not be as
highly prioritised among micro-enterprises. The same pattern to the one described above
can be identified for the all-sectors average, thus indicating that this is more of a general
pattern related to company size rather than a specific case for the CI. It could,
consequently, be argued that outsourcing follows a time sequence: large enterprises, due
to size and business volume, will be the first movers and medium, small and micro
enterprises will gradually follow for business processes useful for outsourcing in the CI.
The increased focus on outsourcing in the CI is further supported by the finding that 16%
of enterprises said that the amount of ICT outsourcing has increased in 2005 (compared
to the year before) while a very limited number of enterprises stated that outsourcing has
decreased. However, the trend toward outsourcing is much stronger in other industries,
indicated by the weighted average of the 10 surveyed sectors, where 1 in 4 companies
has reported increased outsourcing activities. In eight of the ten sectors studied this year
by e-Business W@tch, the share of enterprises that reported an increase in ICT
outsourcing is higher than in the CI.

7/28/2019 Construction 2006
http://slidepdf.com/reader/full/construction-2006 34/182
Construction
34
Exhibit 3-5: Outsourcing trend: percentage of companies that have increased / decreased
their outsourcing activities in 2005
-3
16
26
-1
-5 0 5 10 15 20 25 30
Construction (EU-10)
All 10 sectors (EU-10)
Outsourcing has decreased Outsourcing has increased
Base (100%): Companies that have outsourced ICT services. N (for sector, EU-10) = 117
Weighting: in % of firms. Questionnaire reference: C2
Source: e-Business W@tch (Survey 2006)
ICT investments and expenditure
Surveyed CI companies stated their ICT budget corresponds to about 4% of their total
expenditures (see Exhibit 3-5). This figure is in line with the respective weighted average
across all the studied sectors. Large CI enterprises use about twice as much of their total
budget on ICT compared to the sector’s micro-enterprises, clearly indicating that large
enterprises have more focus on ICT as a source of competitive advantage.
Exhibit 3-6: ICT budget trend: percentage of companies that plan to increase / decrease their
ICT budgets in 2006/07
-5
-9
-6
-5
-8
22
16
14
30
43
25
0
-2
-15 -10 -5 0 5 10 15 20 25 30 35 40 45 50
Total Construction (EU-10)
Micro (1-9 empl.)
Small (10-49 empl.)
Medium (50-249 empl.)
Large (250+ empl.)
All 10 sectors (EU-10)
Will decrease ICT budget Will increase ICT budget
Base (100%): Companies using computers (excl. "don't know"). N (for sector, EU-10) = 718.
Weighting: Totals (for the sector and for all 10 sectors) are weighted by employment and should be read as
“enterprises comprising…% of employment in the sector(s)”. Figures for size-bands are in % of enterprises from
the size-band. Questionnaire reference: C2
Source:e-Business W@tch
(Survey 2006)

7/28/2019 Construction 2006
http://slidepdf.com/reader/full/construction-2006 35/182
Construction
35
This is confirmed by the survey results on ICT budget trends (see Exhibit 3-6). Overall,
about 1 in 5 construction enterprises is expected to increase its ICT budget and only
about 1 in 20 expects to decrease it in the coming year. According to the same findings,
however, more than 40% of large CI enterprises intend to increase their ICT spending in
the coming year, while only about 15% of the sector’s micro and small enterprises saidthat they will do so. This should be viewed in conjunction with findings shown in exhibit 3-
5, according to which only four in ten micro-enterprises and about 6 out of every 10 small
CI companies reported having made ICT investments in 2005 compared to nine in ten
among the sector’s large enterprises. It, therefore, seems likely that, if no major changes
occur in companies’ investing behaviour, the already identified –negative- relationship
between enterprise size and ICT uptake in this sector will continue if not intensify.
About 1 in 10 enterprises has experienced difficulties in drawing funds for their ICT
investments, which is slightly below the all-sectors average. However, this figure is only
indicative due to statistical uncertainty (low number of observations).
Looking into the sources of finance for ICT investments, 74% of CI firms said that they
use cash-flow financing which is a little below the 82% of firms in the weighted 10-sectors
average, but exactly in line in terms of employment-weighted figures (see Exhibit 3-7).
Only about 1 in 10 CI firms reported using bank loans for ICT investments, while venture
capital and public funds are rarely used as financial source for ICT investments by this
sector’s companies.
Exhibit 3-7: Major source for investments in ICT
Cash-flow
financingBank loans Venture capital
Public funds
and other
Weighting: % of empl.
% of firms
% of empl.
% of firms
% of empl.
% of firms
% of empl.
% of firms
Construction (EU-10) 74 74 10 13 2 2 2 3
Micro (1-9 empl.) 73 15 2 2
Small (10-49 empl.) 76 8 1 2
Medium (50-249 empl.) 77 6 0 0
Large (250+ empl.) 79 0 3 0
NACE 45.2 (Comp. con.) 72 68 8 12 3 4 2 4
NACE 45.3 (Installation) 78 78 11 13 1 1 1 3
Al l 10 sectors (EU-10) 74 82 5 7 1 1 9 7
Micro (1-9 empl.) 82 8 1 2
Small (10-49 empl.) 81 6 1 2
Medium (50-249 empl.) 70 8 1 2
Large (250+ empl.) 67 2 1 8
Base (100%) firms that have made investments in ICT
N (for sector, EU-10) 458 458 458 458Questionnaire reference C4 C4 C4 C4
Source: e-Business W@tch (Survey 2006)
Compared to the respective all-sectors weighted averages, CI enterprises in general, and
in particular micro and small enterprises, seem to be using cash-flow financing less often

7/28/2019 Construction 2006
http://slidepdf.com/reader/full/construction-2006 36/182
Construction
36
and bank loans more frequently as the main source for their investments in ICT.
However, this is not the case for the medium-sized and large companies in this sector,
which have reported more cash-flow financing and less bank loan financing. This may be
a contributing factor to the rather low level of ICT budget especially among this sector’s
SMEs: ICT investments often require rather high once-off investments, which can bedifficult to finance through cash-flow, thus explaining the higher level of bank loan
financing among SMES.
Looking into the two sub-sectors analysed in this report, it is evident that building
installation companies use cash-flow financing more often than complete construction
enterprises. This may be partly explained by the latter’s greater awareness of external
funding opportunities such as venture capital and public funds, also taking into account
their usually larger average size and more regional, national and international activities.
3.3 Standards, Interoperability and ICT Security Issues
A "standard", used as a technical term, is "a technical specification approved by a
recognised standardisation body for repeated or continuous application, with which
compliance is not compulsory "24. The agreement on shared technical standards is an
instrument to achieve compatibility between different systems. Without interoperability of
ICT systems, which requires standards and compatibility between standards, advanced
forms of e-business (such as the digital integration of systems in B2B exchanges) is
hardly possible.
3.3.1 Types of e-standards used
The use of ICT-related standards is not widespread in the CI. Enterprises representing
about 3% of employment reported using EDI-based standards which is three times lower
than the weighted all-sectors average. In addition, enterprises representing 8%, 15% and
2% of the sector’s employment reported using XLM-based, proprietary and other
standards respectively. On all types of standards, the CI is below the respective all-
sectors weighted averages. The reported use of e-standards is much higher among largeCI enterprises, a finding which further supports the notion that larger enterprises apply
more advanced ICT solutions than the smaller size-bands. While no substantial
differences can be observed between the two sub-sectors, it is interesting to notice that
the share of large CI firms which reported using XML-based and/or proprietary standards
is quite high and practically in line with the respective all-sectors averages.
24 Directive 98/34/EC of the European Parliament and the Council of 22 June 1998, laying down aprocedure for the provision of information in the field of technical standards and regulations, seehttp://europa.eu.int/eur-lex/pri/en/ oj/dat/1998/l_204/l_20419980721en00370048.pdf

7/28/2019 Construction 2006
http://slidepdf.com/reader/full/construction-2006 37/182
Construction
37
Exhibi t 3-8: Use of e-standards
EDI-based
standards
XML-based
standards
Proprietary
standards
Other
standards
Weighting: % of
empl.
% of
firms
% of
empl.
% of
firms
% of
empl.
% of
firms
% of
empl.
% of
firmsConstruction (EU-10) 3 2 8 4 15 10 2 2
Micro (1-9 empl.) 2 4 12 2
Small (10-49 empl.) 2 6 8 0
Medium (50-249 empl.) 3 3 22 0
Large (250+ empl.) 11 32 26 7
NACE 45.2 (Comp. con.) 4 3 9 3 15 5 4 5
NACE 45.3 (Installation) 2 1 7 5 16 12 1 1
Al l 10 sectors (EU-10) 9 3 11 5 19 12 4 2
Micro (1-9 empl.) 2 6 10 1Small (10-49 empl.) 4 5 13 2
Medium (50-249 empl.) 10 10 24 2
Large (250+ empl.) 29 27 31 7
Base (100%)firms usingcomputers
Firms usingcomputers
firms usingcomputers
firms usingcomputers
N (for sector, EU-10) 754 754 754 754Questionnaire reference G1a G1b G1c G1d
Source: e-Business W@tch (Survey 2006)
Overall, in view of the all-sectors average, CI companies do not seem to implement ICT-related standards to the same degree as their counterparts in other sectors. This could
prove an obstacle to advanced forms of e-business. The slow uptake of ICT standards
which is shown by the survey results is also supported by the analysis presented in
Chapter 4. There, it is concluded that the slow uptake of ICT standards in the CI is
primarily due to the lack of international cross-sector standards.
3.3.2 Use of Open Source Software
The Open Source model
Open Source Software (OSS) refers to computer software under an open source
license. An open source license is a copyright license for software that makes the source
code available and allows for modification and redistribution without having to pay or seek
permission from the original author(s). In the past years, the public awareness of OSS
has grown steadily, with the operating system Linux (an alternative to proprietary
operating systems such as Windows) being the best-known project. Besides Linux, other
OSS such as the database mySQL and the internet browser Firefox (a Mozilla browser)
have each achieved significant market shares.
Policy-makers are interested in monitoring OSS developments and the uptake among
companies for several reasons. There is some debate and different views on whether the
use of OSS-based operating systems could reduce ICT costs for SMEs, at least in the

7/28/2019 Construction 2006
http://slidepdf.com/reader/full/construction-2006 38/182
Construction
38
long run. Another aspect is whether OSS systems may help to "unlock" companies from
specific ICT service providers in the future.
Deployment of Open Source Software
In 2006, e-Business W@tch asked enterprises on their use of OSS in operating systems,
databases and browsers. As illustrated in Exhibit 3-9, OSS is not widespread in the CI.
About 1 in 8 firms in this sector reported using OS operating systems, about 1 in 9 said
that they use OS databases and about 1 in 7 did so for OS browsers. In terms of different
enterprise sizes, it is evident that the uptake of OS browsers is almost the same for all
enterprise sizes, whereas the use of OS operating systems and databases tend to
increase with company size. This is not surprising, since databases and, in particular,
operating systems, are generally both more complex and more significant to key business
processes than internet browsers. Thus, using OS versions of these systems will often
require more ICT skills than proprietary systems. These findings are in line with the
analysis presented in Chapter 4 where it is argued that large enterprises apply more
advanced ICT solutions and technology and, in addition, they are more aware of the
potential for increased competitive advantage through the use of ICT.
Exhibi t 3-9: Companies using Open Source (OS) Software
129 7
18
2521
11
4 4
23
30
1816 16 14
19 1722
0
10
20
30
40
Total
Construction
(EU-10)
M icro (1-9
empl.)
Small (10-49
empl.)
M edium (50-
249 empl.)
Large (250+
empl.)
All 10 secto rs
(EU-10)
OS Operating Systems OS Databases OS Brow sers
Base (100%): Companies using computers. N (for sector, EU-10) = 754.
Weighting: Totals (for the sector and for all 10 sectors) are weighted by employment and should be read as
"enterprises comprising …% of employment in the sector(s)". Figures for size-bands are in % of enterprises
from the size-band. Questionnaire reference: G8
Source: e-Business W@tch (Survey 2006)

7/28/2019 Construction 2006
http://slidepdf.com/reader/full/construction-2006 39/182
Construction
39
3.3.3 Interoperability challenges
Interoperability refers to the "ability of two or more systems to exchange data, and to
mutually use the information that has been exchanged ."25 As illustrated in Exhibit 3-10,
only about 1 in 5 of the CI enterprises found the issue of interoperability critical for conducting different types of e-business. Interoperability is seen as less important for
producing products/services than for e-business in and between sectors. Of all ten
sectors surveyed this year by e-Business W@tch, the CI appears to be the one putting –
by far- less focus on the importance of interoperability. This observation is in line with the
overall analysis of ICT uptake in the CI.
Exhibit 3-10: Perceived importance of interoperability: percentage of companies saying that
interoperability is critical …
28
38
31
36
27
33
20
30
41
42
27
28
33
30
32
27
30
20
32
41
30
27
28
35
31
36
30
34
18
26
39
21
24
0 20 40 60 80 100
Food & beverages
Footwear
Pulp & paper
ICT manufactur ing
Consumer electronics
Shipbuilding & repair
Construction
Tourism
Telecommunication
Hospitals activities
All 10 sectors
for e-business w ithin sector for e-business betw een sectors for producing products/services
Base (100%): Firms using computers. N (for sector, EU-10) = 769.
Weighting: in % of firms. Questionnaire reference: G5a-c
Source: e-Business W@tch (Survey 2006)
25 Definition by IEEE and ISO, cf. e-Business W@tch Special Study on e-Business Interoperabilityand Standards, September 2005, p. 14. Available at www.ebusiness-watch.org ('resources').
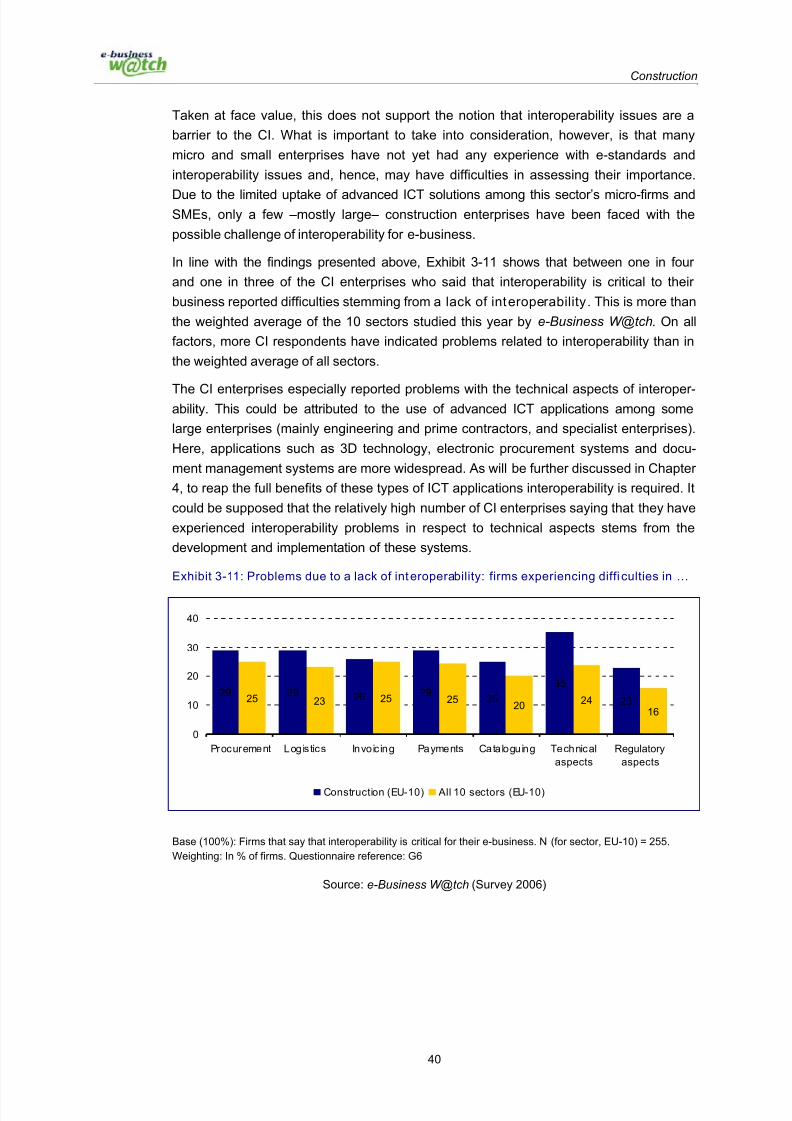
7/28/2019 Construction 2006
http://slidepdf.com/reader/full/construction-2006 40/182
Construction
40
Taken at face value, this does not support the notion that interoperability issues are a
barrier to the CI. What is important to take into consideration, however, is that many
micro and small enterprises have not yet had any experience with e-standards and
interoperability issues and, hence, may have difficulties in assessing their importance.
Due to the limited uptake of advanced ICT solutions among this sector’s micro-firms andSMEs, only a few –mostly large– construction enterprises have been faced with the
possible challenge of interoperability for e-business.
In line with the findings presented above, Exhibit 3-11 shows that between one in four
and one in three of the CI enterprises who said that interoperability is critical to their
business reported difficulties stemming from a lack of interoperability. This is more than
the weighted average of the 10 sectors studied this year by e-Business W@tch. On all
factors, more CI respondents have indicated problems related to interoperability than in
the weighted average of all sectors.
The CI enterprises especially reported problems with the technical aspects of interoper-ability. This could be attributed to the use of advanced ICT applications among some
large enterprises (mainly engineering and prime contractors, and specialist enterprises).
Here, applications such as 3D technology, electronic procurement systems and docu-
ment management systems are more widespread. As will be further discussed in Chapter
4, to reap the full benefits of these types of ICT applications interoperability is required. It
could be supposed that the relatively high number of CI enterprises saying that they have
experienced interoperability problems in respect to technical aspects stems from the
development and implementation of these systems.
Exhibit 3-11: Problems due to a lack of interoperability: firms experiencing diffi culties in …
29 29 26 2925
35
2325 23 25 2520
2416
0
10
20
30
40
Procurement Logistics Invoic ing Payments Cataloguing Technical
aspects
Regulatory
aspects
Construction (EU-10) All 10 sectors (EU-10)
Base (100%): Firms that say that interoperability is critical for their e-business. N (for sector, EU-10) = 255.
Weighting: In % of firms. Questionnaire reference: G6
Source: e-Business W@tch (Survey 2006)

7/28/2019 Construction 2006
http://slidepdf.com/reader/full/construction-2006 41/182
Construction
41
3.3.4 ICT security measures
e-Business W@tch analysed security controls and other measures applied by European
enterprises to counter security threats in detail in its survey of 2005. Results, which were
presented in a special report,
26
indicated that basic components such as firewalls andsecure servers – for those enterprises requiring these – already exhibited high levels of
penetration. As a follow-up to this study on ICT security, questions on selected security
measures of particular policy interest were also included in the e-Business Survey 2006.
Secure Server Technology
"Secure server technology" refers to data exchange between computers based on
certain technical standards or protocols, for example "Secure Sockets Layer" (SSL); this
is a commonly used protocol for managing the security of a message transmission using
the internet. SSL has recently been succeeded by Transport Layer Security (TLS), which
is based on SSL, but the latter is still widely used27.
One in five CI enterprises (representing about a quarter of the sector’s employment)
reported using secure server technology, which is in line with the weighted all-sectors
average but rather lower than the all-sectors average of 36% for employment-weighted
data (see Exhibit 3-12). Half of the sector’s large enterprises said that they use secure
server technology, compared with one in five micro-enterprises. Again due to the less
advanced ICT solutions implemented in micro-enterprises, the need for secure server
technology may not be as pronounced. In addition, awareness among micro-enterprises
of the usefulness of SSL is not deemed as high as among larger enterprises.
When looking into the application of firewalls, close to six in ten enterprises apply this
rather simple form of data protection. This is, again, slightly below the weighted 10-sector
average. Looking at the employment-weighted data, the difference is more pronounced
and again the CI is performing worse than the all-sectors average. This might mainly be
attributed to the relatively low uptake of ICT in general and, especially, to the low level of
e-commerce, e-marketing and other e-practices applied by CI enterprises. A relationship
between enterprise size and ICT uptake is visible as almost 9 in 10 large enterprises in
this sector reported using firewalls but only five in ten CI micro enterprises did so.
26 See e-Business W@tch Special Study on ICT Security, e-Invoicing and e-Payment Activities inEuropean Enterprises, September 2005. Available at www.ebusiness-watch.org ('resources').
27 Cf. Whatis.com (http://searchsecurity.techtarget.com)

7/28/2019 Construction 2006
http://slidepdf.com/reader/full/construction-2006 42/182
Construction
42
Exhibi t 3-12: Use ICT securi ty measures used by enterpri ses
Secure Server
Technology
Digital Signature
or Public Key
Infrastructure
Firewall
Weighting: % of empl.
% of firms% of empl.
% of firms% of empl.
% of firms
Construction (EU-10) 26 19 19 12 69 56
Micro (1-9 empl.) 19 10 52
Small (10-49 empl.) 18 18 72
Medium (50-249 empl.) 31 24 83
Large (250+ empl.) 53 32 89
NACE 45.2 (Comp. con.) 29 16 21 17 73 61
NACE 45.3 (Installation) 23 20 18 10 64 54
All 10 sectors (EU-10) 36 20 21 15 78 62
Micro (1-9 empl.) 16 13 56
Small (10-49 empl.) 23 17 73
Medium (50-249 empl.) 36 25 84
Large (250+ empl.) 64 39 94
Base (100%) firms using computers firms using computers firms using computers
N (for sector, EU-10) 754 754 754
Questionnaire reference G9a G9b G9c
Source: e-Business W@tch (Survey 2006)
Digital signature
e-Signature is electronic information attached to or associated with a contract or another
message used as the legal equivalent to a written signature. Electronic signature is often
used to mean either a signature imputed to a text via electronic means, or cryptographic
means to add non-repudiation or message integrity features to a document. Digital
signature usually refers specifically to a cryptographic signature, either on a document, or
on a lower-level data structure. The rationale for measuring the adoption of digital
signatures is that it is an important step in the integration of business processes between
different enterprises, specifically for the legal recognition of documents sent electronic-
ally, as is the case for invoices28.
The percentages of CI enterprises which said that they use digital signature or public key
infrastructure are slightly below the all-sectors averages when looking at either the
number of enterprises or the share of employment (see Exhibit 3-12). Again, substantial
differences are observed between different size-classes but this is also in line with
28 To this end, in 1999, the European Union issued the e-Signature Directive (Directive1999/93/EC of the European Parliament and of the Council of 13 December 1999 on aCommunity framework for electronic signatures. OJ No L 13 p.12 19/1/2000. 12 February 2000)

7/28/2019 Construction 2006
http://slidepdf.com/reader/full/construction-2006 43/182
Construction
43
findings across all sectors studied this year by e-Business W@tch. As illustrated in the
case study about e-Vergabe and discussed in Chapter 4, however, digital signature or an
equivalent can sometimes be a prerequisite for engaging in e-tendering procedures with
public authorities. If digital signature becomes a prerequisite in many electronic
interactions, the identified gap in the use of digital signatures may widen the ICT gapbetween micro and large enterprises in this sector.
3.4 Internal and External e-Integration of Processes
The use of ICT and e-business to support and optimise intra-enterprise processes has
become increasingly important in many European sectors, especially in manufacturing.
Through digitization of formerly paper-based processes, information and documents
related to incoming or outgoing orders can be seamlessly processed along the
enterprise’s value chain; orders can be linked with production and inventory
management, and the underlying software systems support controlling and management
by enabling full transparency of all business processes. Furthermore, collaborative
processes within and between companies are supported, such as information sharing
among employees (for example by use of an intranet), planning and demand forecast,
organising and archiving documents, and human resources management. In general, ICT
applications for these purposes are predominantly used initially by large enterprises, and
eventually also by SMEs.
Large enterprises in the CI are increasingly focusing their attention on the potential of digitalisation of the workflow processes. In particular for document sharing and
accounting purposes, some European construction enterprises have implemented
advanced ICT-based systems. The survey results on collaborative design processes (3D
technology) are presented in Section 4.2.
3.4.1 Use of software systems for internal process integration
The use of intranet enables employees to share information within the organisation. In
the CI, 22% of enterprises reported having an intranet (see Exhibit 3-13). Compared withthe all-sectors average, the CI is about in line when focusing on the number of
enterprises, but lagging behind on the employment-weighted averages: enterprises
representing about a third of employment in CI reported having an intranet, compared to
more than 40% across all sectors studied this year by e-Business W@tch.
As concerns the two sub-sectors, observed differences are not marked. Although a
higher share of building installation enterprises than of complete construction enterprises
said that they have an intranet, the picture is inverted when looking at the employment-
weighted figures. Differences between size classes are more distinct: about 7 in 10 large
CI enterprises reported having an intranet compared to only two in ten micro enterprises.
This observation is mainly due to the need for more formalised (ICT-based) knowledge-sharing in large enterprises.
7/28/2019 Construction 2006
http://slidepdf.com/reader/full/construction-2006 44/182
Construction
44
In smaller enterprises, accounting software typically substitutes the functionality of
enterprise resource planning systems (ERP), although on a much simpler level and with a
lower potential for automating order-related document flows. The small share of ERP
systems may hamper advanced forms of B2B integration, for instance e-invoices. About 6
in 10 CI enterprises out of those not using ERP have implemented accounting software.Overall, the share of CI enterprises which reported using accounting software is
completely in line with the all-sector average (in terms of both firm- and employment-
weighted data).
Compared to the uptake of accounting software, about one in ten CI enterprises reported
using ERP systems. This is in line with the weighted average for all 10 sectors studied
this year by e-Business W@tch. The overall figure, however, covers some differences
between size-bands: 37% of large enterprises said that they use ERP systems compared
to only 8% of micro-enterprises doing so. In continuation of the above observations on
accounting software, it can be argued that enterprises often start with more simple
accounting software and, when the enterprise grows, introduce more advanced solutions
such as ERP. This observation, however, cannot be directly supported when looking into
the use of ERP systems in the two CI sub-sectors. The survey shows that building
installation enterprises more often have ERP systems than complete construction
enterprises. This observation does not fit the general picture of the sub–sector, where
complete construction enterprises are generally larger and perform better on a number of
other indicators.
Document management systems (DMS) provide the ability to keep track of a large
quantity of documents and offer relatively easy access to the filing system. In the CI, 15%
of enterprises (representing 17% of the sector’s employment) said that they use DMS,which is in line with the weighted all-sectors averages. As indicated by the employment-
weighted data, differences between enterprises of different sizes are small as concerns
the use of DMS. Similarly to findings for ERP use, the pattern usually observed between
the two sub-sectors does not apply to this indicator either. Again, results show that
building installation enterprises use DMS more often than complete construction
enterprises – but there are no obvious explanations for this change in the pattern.
One observation is, however, common for all the above-mentioned ICT systems (intranet,
accounting, ERP and DMS): micro, small and medium-sized CI enterprises are well in
line with the respective all-sectors averages, but large CI companies appear lagging
behind their counterparts across all sectors studied this year by e-Business W@tch. A
similar trend can be detected on a number of other indicators, but the pattern is much
more pronounced for these internal process integration systems. This indicates even
more strongly than before that ICT use in the CI has a tendency to lag behind, since large
enterprises in all sectors are usually first-movers and the ones that set the standards for
the rest of the sector. The lagging behind of the large CI enterprises on these indicators
may, incidentally, also help in explaining the unusual patterns for the two sub-sectors,
since the complete construction sector has more large enterprises than the building
installation enterprises.

7/28/2019 Construction 2006
http://slidepdf.com/reader/full/construction-2006 45/182
Construction
45
Exhibit 3-13: Use of ICT systems for internal process integration
Intranet Accounting
softwareERP system
Document
Management
system
Weighting: % of empl.
% of firms
% of empl.
% of firms
% of empl.
% of firms
% of empl.
% of firms
Construction (EU-10) 31 22 68 58 18 11 17 15
Micro (1-9 empl.) 19 54 8 15
Small (10-49 empl.) 28 75 20 14
Medium (50-249 empl.) 36 88 26 16
Large (250+ empl.) 67 71 37 22
NACE 45.2 (Comp. con.) 33 16 74 63 17 7 14 10
NACE 45.3 (Installation) 29 24 63 56 20 13 19 18
Al l 10 sectors (EU-10) 42 23 70 57 19 11 19 13Micro (1-9 empl.) 19 50 7 11
Small (10-49 empl.) 28 70 16 13
Medium (50-249 empl.) 43 85 25 19
Large (250+ empl.) 76 88 45 42
Base (100%)firms usingcomputers
Firms not using anERP system
firms usingcomputers
firms usingcomputers
N (for sector, EU-10) 754 624 754 754
Questionnaire reference D1a D1e D1d D1c
Source: e-Business W@tch (Survey 2006)
3.4.2 Use of ICT for cooperative and collaborative business processes
Sharing of documents in a collaborative workspace can be used to disseminate
relevant information about construction projects to the involved partners, and make
possible the retrieval of vital information – construction plans and drawings – from the
partners at all times. Collaborative software supports project management and improves
productivity through effective online document handling, workflow coordination, drawing
mark-ups and knowledge management29.
Looking into the 2006 survey results, less than one in ten CI enterprises said that they
share documents in collaborative workspaces. This is well below the weighted all-sectors
average and can probably be explained by the traditional workflow processes in this
sector. Documents’ sharing in a collaborative work-space is much more frequent among
large enterprises than micro-enterprises, again supporting the strong relationship
between enterprise size and the uptake of ICT in this sector.
Management of capacity/inventory online is not widely used in the CI. Less than 10%
of CI enterprises (representing about 15% of the sector’s employment) reported using
such applications – but these figures are practically in line with the respective all-sectors’
29 Cf. e-Business Sector Study on the Construction Industry, July 2005, www.ebusiness-watch.org (‘resources’), p. 34.

7/28/2019 Construction 2006
http://slidepdf.com/reader/full/construction-2006 46/182
Construction
46
averages. Again, as would be expected, online capacity/inventory management is more
frequently used by medium-sized and large enterprises than by smaller CI firms. The
explanation lies mainly in this industry’s nature, with raw materials and semi-finished
products being often ordered directly from building sites as they are consumed.
Exhibit 3-14: Online cooperation and collaboration wi thin the value system
Share
documents in
collaborative
work space
Manage
capacity /
inventory
online
Collaborative
design
processes
Collaborative
forecasting of
demand
Weighting: % of empl.
% of firms
% of empl.
% of firms
% of empl.
% of firms
% of empl.
% of firms
Construction (EU-10) 22 9 14 8 9 5 14 8
Micro (1-9 empl.) 8 8 4 6
Small (10-49 empl.) 20 13 8 13
Medium (50-249 empl.) 30 17 9 16
Large (250+ empl.) 49 22 29 32
NACE 45.2 (Comp. con.) 27 15 14 7 13 6 17 8
NACE 45.3 (Installation) 17 6 14 8 5 4 11 8
Al l 10 sectors (EU-10) 27 14 22 10 15 7 20 11
Micro (1-9 empl.) 10 8 5 10
Small (10-49 empl.) 19 14 8 13
Medium (50-249 empl.) 31 21 13 19
Large (250+ empl.) 47 41 25 41
Base (100%)firms with internet
accessfirms with internet
accessfirms with internet
accessfirms with internet
access
N (for sector, EU-10) 723 723 723 723Questionnaire reference D5a D5e D5d D5c
Source: e-Business W@tch (Survey 2006)
Overall, the CI scores lower –but not much- than the respective all-sectors averages for
most aspects of e-collaboration. This rather low uptake of e-collaboration systems and
tools can be mainly attributed to the often low-tech nature of the CI which is especially
observed among micro-enterprises, whereas large enterprises are mostly on a par with
the respective all-sectors averages. This observation probably reflects the increasing
uptake among industry leaders of new collaborative tools such as 3D and project webs,
which will be discussed in more detail in Section 4.
3.4.3 Deployment of e-invoicing
e-Invoicing is a computer-mediated electronic transaction between a seller and a buyer,
which replaces traditional paper-based invoicing processes. The use of e-invoicing
promises cost savings to both parties due to faster processing compared to the traditional
invoicing process. In order to benefit from e-invoicing, these processes have to beintegrated with ERP systems or be conducted in a web-based environment. Enterprises
representing 12% of CI employment reported sending e-invoices to the public sector;

7/28/2019 Construction 2006
http://slidepdf.com/reader/full/construction-2006 47/182
Construction
47
14% said that they have sent invoices electronically to other private companies and 18%
said that they receive e-invoices. Comparing these findings to the weighted all-sectors
averages, where about 1 in 5 enterprises use different kinds of e-invoicing, it is evident
that the CI is lagging behind in this respect.
Figures again show a relationship between the uptake of e-invoicing and the size of the
enterprise. Among large CI enterprises, about a quarter said that they have sent and/or
received e-invoices. This figure is about twice as high as the respective share of micro-
enterprises, thus confirming previous arguments that the CI is characterised by a larger
uptake of ICT among large enterprises than micro enterprises.
Interestingly, it seems to be more common among construction enterprises to receive e-
invoices than to send them. This could indicate that the use of e-invoices is primarily
driven by sectors trading with/into the CI. Enterprises from these sectors may require the
construction enterprises to use e-invoicing, which could accelerate adoption of this e-
business application in the CI. Pressure to adopt e-invoicing could come, for example,from suppliers of raw materials and/or suppliers of semi-finished building products.
Exhibit 3-15: Adop tion of e-invoicing
12
8 8
14
25
18
14
8
1514
25
1918
15
22
12
2422
0
5
10
15
20
25
30
Total
Construction
(EU-10)
Micro (1-9
empl.)
Small (10-49
empl.)
Medium (50-
249 empl.)
Large (250+
empl.)
All 10 sectors
(EU-10)
Send e-invoices to public sector Send e-invoices to private sector Receive e-invoices
Base (100%): Companies with internet access. N (for sector, EU-10) =723.
Weighting: Totals (for the sector and for all 10 sectors) are weighted by employment and should be read as
"enterprises comprising …% of employment in the sector(s)". Figures for size-bands are in % of enterprises
from the size-band. Questionnaire reference: D5
Source: e-Business W@tch (Survey 2006)
CI enterprises responded in the survey that 12% of their total number of invoices was
sent electronically and 10% received electronically. In total, invoices corresponding to
about 10% of total turnover were e-invoices. These figures are all significantly below the
corresponding all-sectors averages.

7/28/2019 Construction 2006
http://slidepdf.com/reader/full/construction-2006 48/182
Construction
48
Exhibit 3-16: Share of e-invoices as % of total invo ices
12
19
10
15
10
17
0 5 10 15 20 25 30
Construction
(EU-10)
All 10 sectors
(EU-10)
% of invoices sent
electronically
% of invoices received
electronically
% of turnover corresponding to
e-invoices
Base (100%): Companies sending/receiving e-invoices (without "don't know"). N (for sector, EU-10) =
95/107/75. Questionnaire reference: D6, D7, D8
Source: e-Business W@tch (Survey 2006)
3.5 Supply Chain Management
3.5.1 e-Integrated supply chains: SCM, financial e-processes and ICT
links with suppliers
SCM – Supply Chain Management
Supply Chain Management (SCM) software can help enterprises match supply and
demand through integrated and collaborative interaction tools. SCM provides an overview
of the flows of products, materials, information, and finances, as they move through the
value chain. SCM coordinates and integrates these flows both within and among
companies. One of the key objectives of any effective SCM system is to reduce inventory
(with the assumption that products are available when needed).30
Enterprises representing about 16% of employment in CI –and across all sectors studiedthis year by e-Business W@tch- reported using an SCM system. However, in terms of
linking their ICT system with that of their suppliers, the respective figure in CI was
less than 10% which, again, is below the weighted average of all the surveyed sectors
(see Exhibit 3-17). Thus, the CI seems to be on a par with the weighted all-sectors
average concerning use of SCM, but the share of enterprises in the CI which have ICT
systems linked with suppliers is significantly below the all-sectors average. Traditionally,
ICT links with suppliers would be a prerequisite for the efficient use of SCM systems. The
finding may, however, be explained by enterprises using their SCM systems for internal
purposes only but not to interact with suppliers. With this approach, enterprises will not
fully reap the benefits of SCM through online supply chain integration.
30Cf. www.mariosalexandrou.com/definition/scm.asp: "Definition of Supply Chain Management"

7/28/2019 Construction 2006
http://slidepdf.com/reader/full/construction-2006 49/182
Construction
49
Exhibit 3-17: Supply chain integration: use of SCM and ICT links wi th supp liers
1610
15 13
26
168 10 6 3 9 12
0
10
20
30
40
Total
Construction
(EU-10)
Micro (1-9
empl.)
Small (10-49
empl.)
Medium (50-
249 empl.)
Large (250+
empl.)
All 10
sectors (EU-
10)
Use SCM ICT system linked w ith suppliers
Base (100%): Companies using computers. N (for sector, EU-10) = 754
Weighting: Totals (for the sector and for all 10 sectors) are weighted by employment and should be read as
"enterprises comprising …% of employment in the sector(s)". Figures for size-bands are in % of enterprises
from the size-band. Questionnaire reference: D1f, F13a
Source: e-Business W@tch (Survey 2006)
The 2006 survey results also indicate that the use of SCM systems in CI is –again- not
evenly distributed across size-bands. Looking at micro-enterprises, about 10% reported
using a SCM system compared to 26% of large enterprises which did so. This substantial
variation in ICT usage among small and large construction enterprises is also illustratedin the case study about Skanska in Section 4.1.
Integration of financial processes in international trade
About 6 in 10 CI enterprises said that they do not have international trading activities (see
Exhibit 3-18). This is about 50% more than the all-sectors average, confirming that
construction is a geographically limited sector (see also Exhibit 3-21). More than half of
those enterprises which reported international trading said that their respective financial
processes are paper-based – a share which is almost in line with the all-sectors average.
Overall, less than 15% of this sector’s firms said that they use internally automated
financial procedures when trading at the international level and practically none reported
externally automated relevant processes. As would be expected, percentages of
companies reporting some form of international trading and of integration of their related
financial processes increase with size.

7/28/2019 Construction 2006
http://slidepdf.com/reader/full/construction-2006 50/182
Construction
50
Exhibit 3-18: Integration o f fi nancial processes in international e-trade
26
30
21
30
32
32
14
8
8
14
38
22
1
2
2
7
59
60
71
53
30
40
0 20 40 60 80 100
Total Construction (EU-10)
Micro (1-9 empl.)
Small (10-49 empl.)
Medium (50-249 empl.)
Large (250+ empl.)
All 10 sectors (EU-10)
Paper based Internally automated Externally automated No international trade
Base (100%): Companies placing orders online (without "don't know"). N (for sector, EU-10) = 391
Weighting: Totals (for the sector and for all 10 sectors) are weighted by employment and should be read as
"enterprises comprising …% of employment in the sector(s)". Figures for size-bands are in % of enterprises
from the size-band. Questionnaire reference: E6
Source: e-Business W@tch (Survey 2006)
3.6 e-Marketing and Sales
ICT, and in particular the internet, can be used in various ways to support marketing
activities, including the communication with customers, offering products for sale, and
developing new marketing strategies. Normally, CI enterprises do not sell directly to
consumers (B2C) but more often offer their services to other enterprises. The exceptions
to this are the clients building their own private houses. In these cases, a B2C
relationship exists. However, the uptake of online solutions for marketing, promotion, PR
and sales is not yet widespread in the CI.
3.6.1 Enterprises receiving orders from customers online
About 10% of CI enterprises said that they accept orders from customers online which is
significantly lower than the all-sector average of 25% (employment-weighted shares are
13% and 36%, respectively). Compared to other individual sectors analysed in this year’s
survey, the CI has one of the lowest acceptance rates of orders online. The reported
levels of accepting orders online are not significantly greater for large CI enterprises
compared to micro and small enterprises. Nevertheless, among those enterprises saying
that they do accept online orders, large enterprises tend to receive a larger share of their orders online – and this share is comparable to the respective all-sectors average.

7/28/2019 Construction 2006
http://slidepdf.com/reader/full/construction-2006 51/182
Construction
51
When taking the nature of the service provided by the CI into consideration, this
observation should not be surprising. Most construction and building projects are
relatively long-term, customised projects , which require much interaction between
client and contractor, as well as high degrees of flexibility and adaptability. It can be
argued that the internet may not be fully suited to handle these types of orders, whichwould explain the low uptake of online ordering in CI.
Exhibit 3-19: Companies receiving orders f rom customers online
Accept orders
from
customers
online
Receive up to
25% of orders
online
Receive more
than 25% of
orders online
Use specific
ICT solutions
for e-selling
Weighting: % of empl.
% of firms
% of empl.
% of firms
% of empl.
% of firms
% of empl.
% of firms
Construction (EU-10) 13 11 84 88 16 12 8 5
Micro (1-9 empl.) 12 90 11 4
Small (10-49 empl.) 11 87 13 6Medium (50-249 empl.) 14 83 17 8Large (250+ empl.) 13 78 22 16 NACE 45.2 (Comp. con.) 13 9 75 75 25 26 9 4NACE 45.3 (Installation) 12 12 93 93 7 7 7 5 Al l 10 sectors (EU-10) 35 25 73 75 27 25 18 9
Micro (1-9 empl.) 23 79 21 6
Small (10-49 empl.) 26 76 24 12
Medium (50-249 empl.) 29 75 25 16
Large (250+ empl.) 26 74 26 27
Food & beverages 31 19 82 87 18 13 14 4Footwear 25 23 86 88 14 12 8 5Pulp & paper 26 28 78 77 22 23 19 11ICT manufacturing 26 27 55 64 45 36 24 12Consumer electronics 25 35 90 66 10 34 20 12Shipbuilding & repair 18 14 100 100 0 0 12 8Construction 13 11 84 88 16 12 8 5Tourism 49 36 68 72 32 28 28 11Telecommunication 36 40 66 63 34 37 37 21Hospitals activities 7 10 93 83 7 17 8 8
Base (100%)firms usingcomputers
firms acceptingorders online
firms acceptingorders online
firms usingcomputers
N (for sector, EU-10) 754 123 123 754Questionnaire reference F4 F6a+b+c F6d+e F10
Source: e-Business W@tch (Survey 2006)
Looking into the two sub-sectors covered by this survey, more building installation
enterprises tend to accept orders online than complete construction enterprises. The
difference is, however, not very significant. On the other hand, among those enterprises
that do accept orders online, significantly more complete construction firms than building
installation enterprises tend to accept a larger share of their orders online. The observed
difference may, again, be explained by the difference in the services provided by the twosub-sectors.

7/28/2019 Construction 2006
http://slidepdf.com/reader/full/construction-2006 52/182
Construction
52
According to the survey results about the use of specific ICT solutions for e-selling,
findings for the CI are in line with the previous observation on online orders: About 1 in 20
enterprises, representing only 8% of employment in this sector, said that they use a
specific ICT solution for e-selling. This is about half of the all-sectors average but can,
again, be partly explained by the nature of the product/service provided. Looking into sizespans, large enterprises are four times as likely to have a specific ICT solution for e-
selling as micro-enterprises. This is in line with previous findings, confirming once more
that construction SMEs do not use ICT to the same degree as large enterprises.
Compared to other sectors studied this year by e-Business W@tch, the CI is positioned in
the lower end along with the shipbuilding and hospitals sectors whose products and
services are also difficult to sell online.
ICT solutions can support various marketing and sales processes. As shown in Exhibit
3-20, about 4 in 10 of CI enterprises said that they use specific ICT tools to publish orders
online. This is about half as many as the weighted all-sectors average. In contrast, the
share of CI companies which reported using specific ICT tools for answering calls for
tenders online is significantly higher than the respective all-sectors average. Differences
between these two findings may be explained by the introduction of e-tendering systems
among many public clients (see a more detailed discussion on this topic in Section 4.1).
Lastly, it is quite evident that e-auction is not widely used in the CI and that the majority of
enterprises do not find this format useful for selling construction services.
Interestingly, about 4 in 10 enterprises from the CI that use specific ICT tools for e-
marketing purposes said that these tools are enabling their customers to pay online. This
is above the weighted all-sectors average and represents an interesting finding. Since the
number of respondents is relatively small (N=62), however, this finding should becautiously interpreted.
Exhibit 3-20: Marketing and sales processes suppor ted by specific ICT solutions
41
78
55
42
78
60
19
66
34
10
20
40
60
80
Publish offers to
customers
Answ er calls for
tenders
Launch sales
auctions
Receive orders
from customers
Enable customers
to pay online
Construction (EU-10) All 10 sectors (EU-10)
Base (100%): Companies using specific ICT solutions for marketing / sales. N (for sector, EU-10) = 62.Weighting: In % of firms. Questionnaire reference: F11
Source: e-Business W@tch (Survey 2006)

7/28/2019 Construction 2006
http://slidepdf.com/reader/full/construction-2006 53/182
Construction
53
Location and type of customers placing online orders
In the CI the reported location of customers which order online is mainly regional and
national, with a 56% majority being regional. This figure is about twice as high as the all-
sectors average. There are practically no international customers ordering in the CI,compared to more than 20% for the all-sectors average. The main explanation for this is
that more than 90% of the construction companies are SMEs which mainly operate at
regional/national level. The description of the industry presented in Chapter 2 clearly
indicates that CI is a locally/regionally-oriented sector. The seemingly non-existing
international online sales, illustrated in Exhibit 3-21, could be an additional indication that
a single European market for construction services is underdeveloped.
Exhibit 3-21: Main location of customers that order online
56
30
44
47 23
0 20 40 60 80 100
Total Construction (EU-10)
All 10 sectors (EU-10)
Mainly regional Mainly national Mainly international
Base (100%): Companies accepting orders online (without "don't know"). N (for sector, EU-10) = 121.
Weighting: In % of firms. Questionnaire reference: F7
Source: e-Business W@tch (Survey 2006)
Interestingly, the survey findings on the type of customers ordering online indicate that in
public clients rarely order online. As illustrated in Exhibit 3-22, more than a third of CI
companies which accept orders electronically said that the majority of their online
customers are other companies, while about 30% said that these are mainly private
customers. According to the survey, a very limited number of online customers are from
the public sector. The most plausible explanation is that many public clients either have
their own e-tendering systems or, as is still very common, require a more traditional
paper-based tendering procedure for construction projects.
Exhibi t 3-22: Main type of customers that order online (B2B / B2C / B2G)
36
18
29
39
1
6
35
37
0 20 40 60 80 100
Total Construction (EU-10)
All 10 sectors (EU-10)
Mainly companies (B2B) Mainly consumers (B2C) Mainly public sector (B2G) Mixed
Base (100%): Companies accepting orders online (without "don't know"). N (for sector, EU-10) = 121.Weighting: In % of firms. Questionnaire reference: F8
Source: e-Business W@tch (Survey 2006)
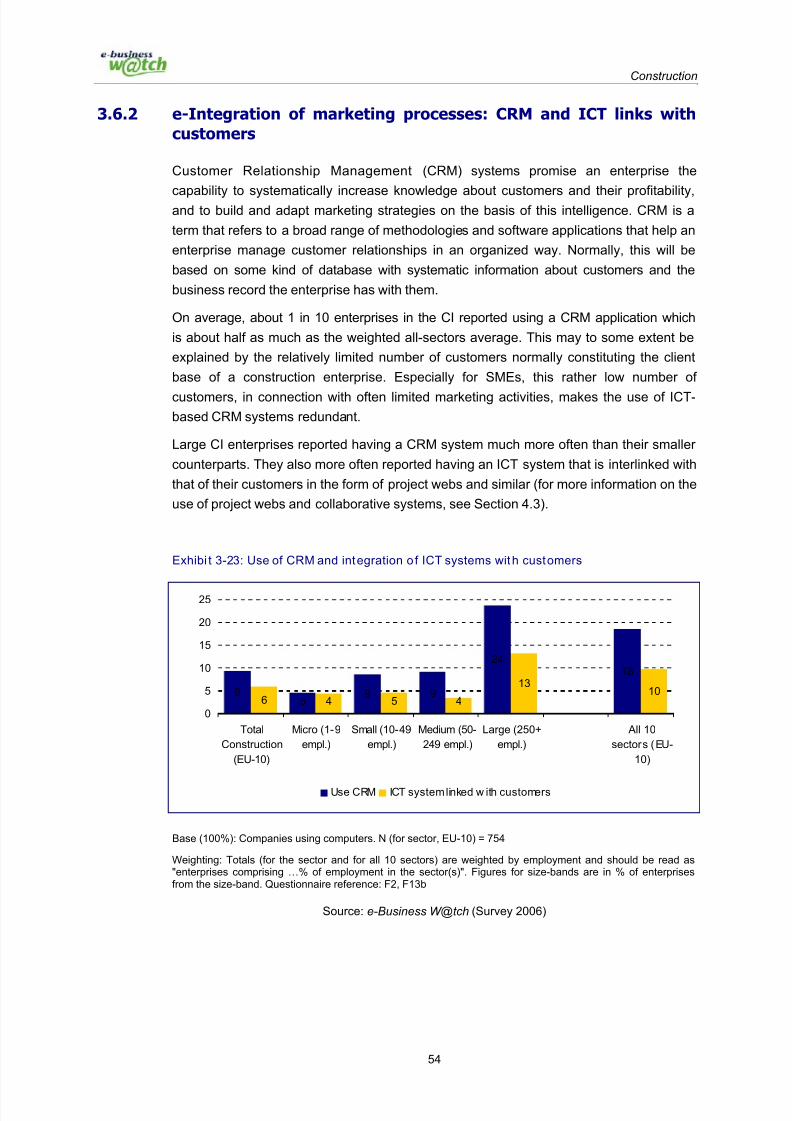
7/28/2019 Construction 2006
http://slidepdf.com/reader/full/construction-2006 54/182
Construction
54
3.6.2 e-Integration of marketing processes: CRM and ICT links with
customers
Customer Relationship Management (CRM) systems promise an enterprise the
capability to systematically increase knowledge about customers and their profitability,and to build and adapt marketing strategies on the basis of this intelligence. CRM is a
term that refers to a broad range of methodologies and software applications that help an
enterprise manage customer relationships in an organized way. Normally, this will be
based on some kind of database with systematic information about customers and the
business record the enterprise has with them.
On average, about 1 in 10 enterprises in the CI reported using a CRM application which
is about half as much as the weighted all-sectors average. This may to some extent be
explained by the relatively limited number of customers normally constituting the client
base of a construction enterprise. Especially for SMEs, this rather low number of
customers, in connection with often limited marketing activities, makes the use of ICT-based CRM systems redundant.
Large CI enterprises reported having a CRM system much more often than their smaller
counterparts. They also more often reported having an ICT system that is interlinked with
that of their customers in the form of project webs and similar (for more information on the
use of project webs and collaborative systems, see Section 4.3).
Exhibi t 3-23: Use of CRM and integration of ICT systems with customers
95
9 9
2418
6 4 5 4
1310
0
5
10
15
20
25
Total
Construction
(EU-10)
Micro (1-9
empl.)
Small (10-49
empl.)
Medium (50-
249 empl.)
Large (250+
empl.)
All 10
sectors (EU-
10)
Use CRM ICT system linked w ith customers
Base (100%): Companies using computers. N (for sector, EU-10) = 754
Weighting: Totals (for the sector and for all 10 sectors) are weighted by employment and should be read as"enterprises comprising …% of employment in the sector(s)". Figures for size-bands are in % of enterprisesfrom the size-band. Questionnaire reference: F2, F13b
Source: e-Business W@tch (Survey 2006)

7/28/2019 Construction 2006
http://slidepdf.com/reader/full/construction-2006 55/182
Construction
55
3.7 ICT and Innovation
e-Business W@tch asked enterprises whether they had launched any new or
substantially improved products or services during the 12 months prior to the interview.Surveyed companies were also asked if they had introduced new or significantly
improved internal processes in the same period of time. Enterprises that indicated that
they had introduced any such innovations were then asked follow-up questions on the
role of ICT in their innovation activity.
Exhibit 3-24: ICT and Innovation activity
Companies
with new
product
innovation in
2005
Share of ICT-
enabled
product
innovations
Companies
with process
innovation in
2005
Share of ICT-
enabled
process
innovations
Weighting: % of empl.
% of firms
% of empl.
% of firms
% of empl.
% of firms
% of empl.
% of firms
Construction (EU-10) 21 17 53 49 25 14 70 67
Micro (1-9 empl.) 20 47 13 65
Small (10-49 empl.) 13 38 19 57
Medium (50-249 empl.) 23 50 37 67
Large (250+ empl.) 36 70 49 86
NACE 45.2 (Comp. con.) 19 14 63 67 29 14 70 52
NACE 45.3 (Installation) 22 18 44 43 21 14 69 74
Al l 10 sectors (EU-10) 32 24 50 45 32 20 75 63
Micro (1-9 empl.) 22 41 16 69
Small (10-49 empl.) 25 42 25 57
Medium (50-249 empl.) 33 45 38 71
Large (250+ empl.) 48 49 53 81
Base (100%)firms usingcomputers
firms with productinnovation
firms usingcomputers
firms with processinnovation
N (for sector, EU-10) 754 151 754 171Questionnaire reference I1 I2 I3 I4
Source: e-Business W@tch (Survey 2006)
In the CI, 17% of enterprises experienced product innovation in 2005. This is, both in
terms of number and percentage of employment, lower than the weighted all-sectors
average. This may be explained by generally less focus on innovation in the CI compared
to other sectors, such as ICT manufacturing, consumer electronics and other
manufacturing sectors in this year’s survey. In addition, the data show that about 4 in 10
large enterprises have made product innovations in 2005 compared to two in ten micro
enterprises. As many micro enterprises work as sub-contractors to larger enterprises,
they will more often tend to perform standardised and predefined work that more rarely
gives rise to product or service innovations.
7/28/2019 Construction 2006
http://slidepdf.com/reader/full/construction-2006 56/182
Construction
56
Interestingly, among those firms which experienced some form of product or service
innovation, the reported share of ICT-enabled product innovations is slightly higher in
the CI than the weighted all-sectors average. However, these average figures conceal
some interesting findings at the sub-sector level: Complete construction enterprises said
that they use ICT much more often when innovating products compared to buildinginstallation enterprises. This could be explained by the generally lower ICT uptake among
building installation enterprises along with the higher number of SMEs in this sub-sector.
This argument is further supported when looking into the data spread on different
enterprise size classes. Again, the large enterprises more often use ICT to support
product innovation. Actually, whereas there is little difference between size groups in the
all-sectors average, the large CI enterprises stand out with an unusually high share of
ICT-enabled product innovation (70% of companies).
Looking at the indicator for process innovation, fewer CI enterprises reported making
process innovations in 2005 compared to the weighted all-sectors average. This is in line
with the results on product innovation above but, again, among those CI enterprises
saying that they made some process innovations, ICT is more often used as an enabler
compared to the weighted all-sectors average. Also looking at size spans, large
enterprises more often reported process innovations and also more often said that they
used ICT for this, compared to micro and small enterprises.31
The figures and findings from the table above are also illustrated in Exhibit 3-25, which
shows the share of enterprises that have conducted product/service and process
innovation in the 12 months before the survey and how much of these activities were
linked to ICT. As stated above, for both product/service and process innovation, fewer CI
enterprises make innovations compared to the weighted all-sectors average, but a larger share of these innovations are ICT-enabled. This can partly be explained by the nature of
the services offered in the CI and partly by the fact that most innovation in the CI is made
by large enterprises which, however, constitute a small fraction in terms of total number
of enterprises in this sector.
31 For more information about e-business and innovation, see also the e-Business W@tch specialreport (2006) on “The role of new companies in e-business innovation and diffusion”, availableat www.ebusiness-watch.org ('resources')."

7/28/2019 Construction 2006
http://slidepdf.com/reader/full/construction-2006 57/182
Construction
57
Exhibit 3-25: The role of ICT for product and p rocess innovation
Construction (EU-10) All 10 sectors (EU-10)
8 9
9 5
0
10
20
30
40
50
Firms w ith
product/service
innovation in past 12
months
Firms w ith process
innovation in past 12
months
Not ICT linked
ICT linked
11 13
13 7
0
10
20
30
40
50
Firms w ith
product/service
innovation in past 12
months
Firms w ith process
innovation in past 12
months
Not ICT linked
ICT linked
Base (100%): Companies using computers. N (for sector, EU-10) = 905/925
Weighting: In % of firms. Questionnaire reference: I1 – I4
Source: e-Business W@tch (Survey 2006)
3.8 Drivers and Inhibitors for the Uptake of e-Business
3.8.1 Drivers of e-business adoption
The survey confirms an expected slow uptake of e-business in the CI. Differences in
drivers for uptake of e-business clearly prevail between the CI and the weighted average
of the 10 sectors covered in 2006. In the CI, about 6 in 10 large enterprises adopt e-
business due to the use of e-business by competitors, which is only slightly higher than
the weighted all-sectors average. Especially for the larger CI enterprises, customer
expectations constitute also a main driver; this is actually the most important reported
driver across the 10 sectors studied this year by e-Business W@tch.
However, the most important driver for the CI enterprises is the desire to gain competitive
advantage – especially as regards micro-enterprises. Given the generally low uptake of e-business in this sector, it is not surprising that gaining competitive advantage is a
relatively more important motive in the CI. Apparently, there are still “first-mover”
advantages to be exploited for those that take the leap and invest in e-business solutions.

7/28/2019 Construction 2006
http://slidepdf.com/reader/full/construction-2006 58/182
Construction
58
Exhibit 3-26: Drivers of e-business adoption: companies saying that … was an important
reason for starting e-business
46 46 4336
62 595546
5851
67 70
42 4432
42 46 41
63 6557 54
71 67
0
20
40
60
80
100
Total
Construction(EU-10)
M icro (1-9
empl.)
Small (10-49
empl.)
M edium (50-
249 empl.)
Large (250+
empl.)
All 10 secto rs
(EU-10)
Competitors do it Customer expectations Supplier expectations Gaining competitive advantage
Base (100%): Companies saying that e-business is a part of their operations. N (for sector, EU-10) = 379.
Weighting: Totals (for the sector and for all 10 sectors) are weighted by employment and should be read as
"enterprises comprising …% of employment in the sector(s)". Figures for size-bands are in % of enterprises
from the size-band. Questionnaire reference: H2
Source: e-Business W@tch (Survey 2006)
3.8.2 Barriers to e-business adoption
As perceived by enterprises in both the CI and across the 10 sectors covered in the 2006
e-Business Survey, the most common barriers to e-business adoption are company size,
complicated and costly technology. Interestingly, the largest deviations between findings
for the CI and the weighted all-sectors average can be found on the issues of system
compatibility and technology complexity. In fact, both of these issues seem to be
perceived much more as a barrier in the CI than across the 10 sectors as a whole. This
finding could indicate that the issue of interoperability is the main barrier for the uptake of
ICT in the CI. This observation is supported by the discussion put forward in Section 4.2
on 3D technologies and system and software interoperability.
SME-typical barriers
Special attention is given to the barriers reported among SMEs in this year’s survey.
Based on the findings presented in Exhibit 3-27, it can be argued that the main barriers
for SMEs are company size, technology costs and security concerns.
Looking into the issue of company size, it is obvious that the size of an enterprise can be
a barrier to ICT uptake. Small enterprises have fewer needs but they usually also have
less resources to put into ICT - they employ fewer ICT practitioners and have less
financial resources than their larger counterparts. As illustrated in Exhibits 3-3 and 3-6,

7/28/2019 Construction 2006
http://slidepdf.com/reader/full/construction-2006 59/182
Construction
59
respectively, few micro and small CI enterprises employ ICT practitioners and most use
cash flow financing for their ICT investments. Findings shown in Exhibit 3-12 also indicate
that micro and small enterprises rarely have installed secure server technologies. Viewed
together, these three observations support the enterprises’ own perceptions that
company size, technology costs and security concerns are barriers to SMEs.
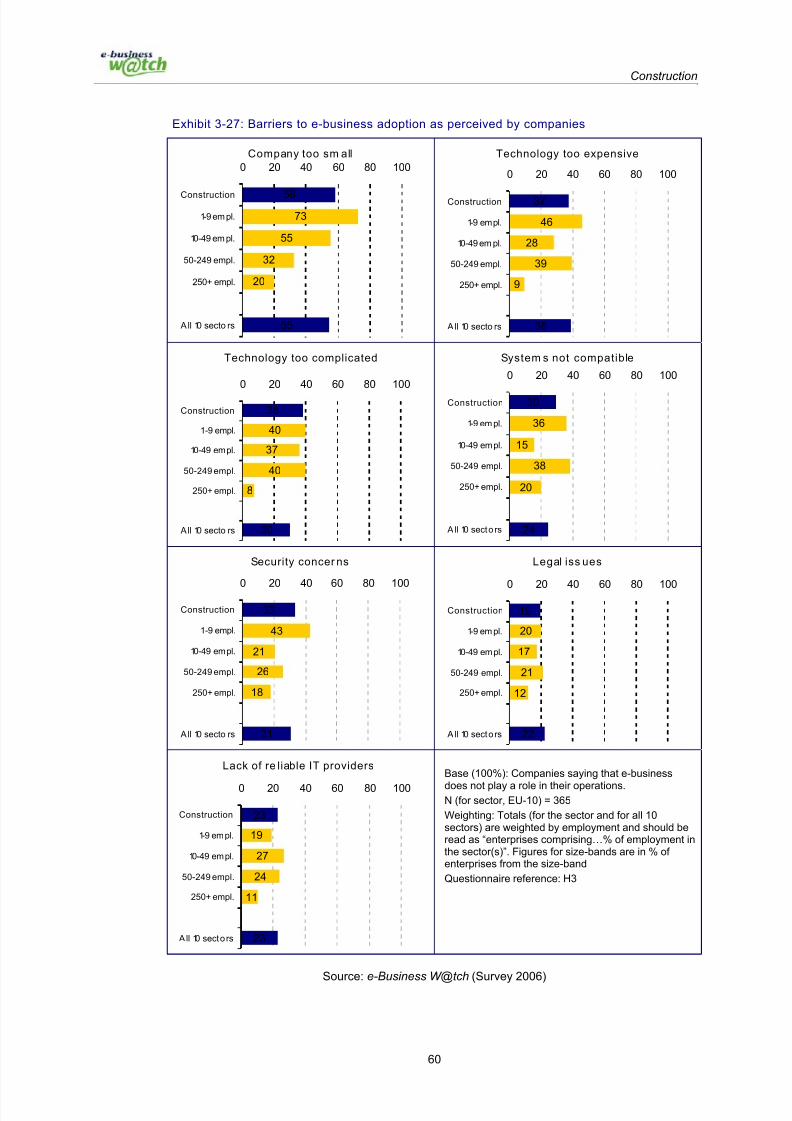
7/28/2019 Construction 2006
http://slidepdf.com/reader/full/construction-2006 60/182
Construction
60
Exhibit 3-27: Barriers to e-business adoption as perceived by companies
Company too sm all
73
55
32
20
55
58
0 20 40 60 80 100
Construction
1-9 empl.
10-49 empl.
50-249 empl.
250+ empl.
A ll 10 secto rs
Technology too expensive
46
28
39
9
37
38
0 20 40 60 80 100
Construction
1-9 empl.
10-49 em pl.
50-249 empl.
250+ empl.
A ll 10 secto rs
Technology too complicated
40
37
40
8
38
30
0 20 40 60 80 100
Construction
1-9 empl.
10-49 empl.
50-249 empl.
250+ empl.
A ll 10 secto rs
System s not compatible
36
15
38
20
30
24
0 20 40 60 80 100
Construction
1-9 em pl.
10-49 empl.
50-249 empl.
250+ empl.
A ll 10 sectors
Security concer ns
43
21
26
18
33
31
0 20 40 60 80 100
Construction
1-9 empl.
10-49 empl.
50-249 empl.
250+ empl.
A ll 10 secto rs
Legal iss ues
20
17
21
12
22
19
0 20 40 60 80 100
Construction
1-9 em pl.
10-49 empl.
50-249 empl.
250+ empl.
A ll 10 sectors
Lack of re liable IT providers
19
27
24
11
23
23
0 20 40 60 80 100
Construction
1-9 empl.
10-49 empl.
50-249 empl.
250+ empl.
A ll 10 sectors
Base (100%): Companies saying that e-business
does not play a role in their operations.N (for sector, EU-10) = 365
Weighting: Totals (for the sector and for all 10sectors) are weighted by employment and should beread as “enterprises comprising…% of employment inthe sector(s)”. Figures for size-bands are in % of enterprises from the size-band
Questionnaire reference: H3
Source: e-Business W@tch (Survey 2006)

7/28/2019 Construction 2006
http://slidepdf.com/reader/full/construction-2006 61/182
Construction
61
3.9 Summary
Main findings
CI is a sector where ICT and e-business are used to a lesser extent than in most of the
other sectors studied by e-Business W@tch in 2006. There are two main reasons for this
comparatively low ICT uptake:
first, the high concentration of SMEs in the CI and
second, the typical nature of the service provided in construction which, being an
on-site and often highly customised service, does not lend itself to the typical e-
business concept which is rather adapted to manufacturing industries.
Looking into CI sub-sectors covered by this study, complete construction enterprises
have in general a higher level of ICT uptake than building installations enterprises. For example, complete construction enterprises are usually larger enterprises, use ICT more
to support product innovation and spend more on ICT than building installation
enterprises. However, there also some interesting exceptions: building installation
enterprises reported having VPN, intranets and document management systems more
frequently than their counterparts in complete construction. Excluding statistical reasons,
such as bias in the survey sample, there are no obvious ways to explain findings where
building installation companies seem to have greater ICT uptake compared to complete
construction enterprises.
According to the survey data, large construction enterprises are currently increasingfocus on ICT issues, as they have started introducing more advanced ICT solutions
such as e-procurement systems, collaborative design systems (3D technology) or
collaborative document sharing (project webs). This is in line with the discussion and
case studies presented in the following chapter of this report.
In summary, therefore, the condensed presentation of survey results in the "e-Business
Scoreboard" should be carefully interpreted. Since the survey instrument used on the CI
was adapted from the e-business concept for manufacturing enterprises, it is quite clear
that the CI would not be among the intensive users in application areas such as supply
chain management or online marketing and sales. However, there are other areas –not
included in the Scoreboard– such as collaborative systems, where the CI is, to someextent, ahead of many other sectors studied this year by e-Business W@tch. This being
said, the Scoreboard nevertheless provides plenty of valid evidence that there is still a
sort of "digital divide" between the figures for the CI and the weighted all-sector averages.
Examples are the low percentage of firms employing ICT practitioners, as well as the low
adoption of ERP systems and advanced e-procurement solutions. This cannot entirely be
explained by structural factors, i.e. the dominance of small firms, but must also take into
consideration the nature of the services being offered by the CI. In this context and in
light of the 2006 e-Business Survey findings, the most important conclusions about the
use of ICT by CI companies are summarised in the following box.

7/28/2019 Construction 2006
http://slidepdf.com/reader/full/construction-2006 62/182
Construction
62
ICT practitioners: Construction enterprises have little focus on hiring ICT
practitioners and on ICT training.
ICT standards: The use of e-standards is limited in the CI but is about in linewith the weighted all-sectors averages. This indicates that interoperability
issues are widespread across different sectors.
Innovation: The CI lags behind on both product and process innovation when
compared to the respective cross-industry totals. However, the share of ICT-
enabled product and process innovation is more or less the same between the
CI and the cross-industry total.

7/28/2019 Construction 2006
http://slidepdf.com/reader/full/construction-2006 63/182
Construction
63
e-Business Index and Scoreboard 2006 32
e-Business Scoreboard 2006
A.1
A.2
A.3
A.4
B.1
B.2
B.3
B.4
C.1
C.2
C.3
C.4
D.1
D.2
D.3
D.4
Max Average Construction
Component indicators
(based in data in % of firms)
A. ICT Networks
A.1 Internet connectivity (index)
A.2 LAN
A.3 W-LAN
A.4 Remote access to company network
B. e-Integrated Business Processes
B.1 Intranet
B.2 ERP systems
B.3 Online tracking of production time
B.4 e-Invoicing
C. e-Sourcing and ProcurementC.1 Firms placing orders online (>5%)
C.2 Use of ICT systems for sourcing
C.3 ICT system linked with suppliers
C.4 Online inventory management
D. e-Marketing and Sales
D.1 CRM use
D.2 Firms receiving orders online (>5%)
D.3 Use of ICT systems for marketing/sales
D.4 ICT system linked with customers
e-Business Index 2006
(based on 16 component indicators of the Scoreboard)
based on data in % of firms(emphasizes activity in smaller companies)
based on employment-weighted data(places a higher weight on activity in larger firms)
100
94
83
81
72
61
56
46
40
38
0 20 40 60 80 100
Telecom
Hospitals (*)
Shipbuilding
ICT manuf.
Electronics
Pulp & paper
Tourism
Construction
Food
Footw ear
100
92
80
75
72
70
69
64
45
42
0 20 40 60 80 100
Telecom
ICT manuf.
Hospitals (*)
Pulp & paper
Electronics
Tourism
Shipbuilding
Food
Construction
Footwear
(*) The index for the hospital sector is not fully comparable to the other industries, as there are only few micro and small
organisations in this sector. Thus, the apparently more intensive use of ICT is largely an artefact of the specific structure of
this sector. When comparing only the large enterprises and organisations, hospitals would not be within the top rank.
Source: e-Business W@tch (Survey 2006)
32 See Methodology Annex for information about the structure and computation of the scoreboard.

7/28/2019 Construction 2006
http://slidepdf.com/reader/full/construction-2006 64/182
Construction
64
4 Current e-Business Trends and Implications
The previous chapter presented the results of the 2006 e-Business W@tch survey for the
CI. The aim of this chapter is, based on the analyses presented in Chapter 3, to provideindustry-specific insights into current ICT use and e-business activities. This chapter does
not claim to offer a comprehensive overview of the topics discussed, as that would
exceed the limits of this report. In fact, it would be difficult to achieve, as ICT and e-
business are relevant to nearly all core business areas of the CI. The issues analysed, as
well as the case studies presented in the following sections, should be understood as
representative examples of current practice and the related opportunities and challenges.
The following paragraphs introduce the issues that have been selected for in-depth study,
and explain the main reasons for their selection. This selection was made in co-ordination
and agreement with DG Enterprise and Industry, and with relevant industry stakeholders.
Solutions for electronic procurement
The 2005 e-Business W@tch sector study, as well as industry experts highlighted the
need to increase focus on benefits from centralised procurement initiatives. Due to rising
competitiveness among this industry’s players, CI enterprises focus increasingly on
internal processes in their search for business optimisation and cost savings. Some large
European construction enterprises have already introduced e-procurement initiatives and
the first experiences point to substantial benefits achieved in terms of cost savings and
quality improvement.
The first section of this chapter, therefore, looks into the topic of e-procurement activity
among construction enterprises. A special section focuses on the issue of public e-
procurement in CI, as a follow-up to the 2005 e-Business W@tch sector study which
highlighted the potential of public e-procurement solutions for promoting the uptake of
ICT solutions among this industry’s enterprises.
Relevant developments are described in Section 4.1. Analysis is supported by case
studies of the Swedish construction enterprise Skanska, the German public e-
procurement solution e-Vergabe, the Greek e-procurement portal E-Construction and the
UK based public e-tendering solution SCMS.
Solutions for 3D technology
According to interviews with industry experts from construction enterprises, IT and
software producers, supporting trades and academia, the development and uptake of
advanced drawing and simulation software like 3D technology is driven both by public
requirement and by the potential benefits of error reduction in the design and construction
phases for engineering enterprises. For instance, the Danish Government requires the
use of 3D technology in all public construction projects as of January 1, 2007.
Furthermore, several construction enterprises have pointed to the benefits of virtual
models with parametric data attached to the 3D elements and more efficientcommunication. Based on these considerations, Section 4.2 describes relevant
developments and implications in the area of 3D technology. It also explains barriers for
7/28/2019 Construction 2006
http://slidepdf.com/reader/full/construction-2006 65/182
Construction
65
the further adoption of 3D technology among European construction enterprises. It
provides, as examples, case studies of the Lithuanian construction enterprise
Constructus and the construction project of the Norwegian Akershus University Hospital .
Project web solutions for electronic collaboration
The 2005 e-Business W@tch sector study addressed the issue of e-collaboration.
According to the discussion in that study, electronic collaboration could be a tool that
enables quicker data transfer, advanced visualisation, and faster alterations during the
planning process. This would be achieved through the sharing of building plans, time
schedules, calculations, technical specifications and other project data (European
Commission 2004, p. 7) (Ricaud 2006).
Following-up the discussion on these conclusions, the last section in this chapter
describes the use of collaborative systems known as project webs, where the
stakeholders in a construction project communicate and share information via anelectronic portal. Section 4.3 analyses the impact of project webs on the various
stakeholders, as well as the requirements and benefits of implementing project webs. It is
supported by a case study on the French construction enterprise Spie SCGPM .
Case studies and business examples
The survey data presented and analysed in Chapter 3 along with the case studies/
business examples (summarised in Exhibit 4-1), and secondary literature, form the basis
for the conclusions and policy implications presented in Chapter 5 of this report.

7/28/2019 Construction 2006
http://slidepdf.com/reader/full/construction-2006 66/182
Construction
66
Exhibit 4-1: Case studies and business examples presented in this report
Section Enterprise / project Country Topic(s)
4.1Case study:
e-Construction
GreeceImplementation of a construction e-
procurement solution
4.1Case study:
e-VergabeGermany
Implementation of public e-procurement onfederal level
4.1Case study:
Y&H RCoE
UnitedKingdom
Implementation of a regional public e-
tendering solution
4.1Business example:
Water Services Belfast
UnitedKingdom
Implementation of a local publi c e-tendering solution
4.1Case study:
SkanskaSweden
Implementation of an e-procurement systemin a large international construction enterprise
4.2Case study:
ConstructusLatvia
Implementation of 3D technology in a smallEast European construction enterprise
4.2Case study:
Akershus University
Hospital
Norway Implementation of 3D technology and the useof IFC standards in a large hospital project
4.2Business example:
Autodesk FranceFrance Online solutions for the construction industry
4.2Business example:
Bentley Denmark
The opportunit ies in 3D modellingtechnology
4.2Business example:
Micrograf Portugal
Impacts of 3D technology on constructionenterprises
4.2Business example:
NCC ConstructionDenmark
3D technology in a European constructionenterprise
4.2
Business example:
Raiffeisen/Strabag/4DBooks
Hungary
Experiences from implementation of 3D
technology in a Hungarian constructionenterprise
4.3Case study:
SPIE SCGPM France
Implementation of a project web solution in aParis-based construction enterprise
4.3Business example:
Byggeweb A/SDenmark Use of project web solutions
4.3Business example:
Prosys SAFrance Use of project web solutions
4.3Business example:
Bouygues ConstructionFrance Project web in a construction enterprise

7/28/2019 Construction 2006
http://slidepdf.com/reader/full/construction-2006 67/182
Construction
67
4.1 e-Procurement
4.1.1 Introduction
This section describes the current use of e-procurement in the CI and analyses the
benefits, barriers and business implications within two specific areas of e-procurement in
the CI: e-procurement among construction enterprises and public e-procurement of
construction products.
These two topics represent two trends in the use of e-procurement in the European CI,
which were briefly touched upon in the e-Business W@tch 2005 sector study. The first
trend refers to buyer-driven e-procurement solutions that are mainly implemented and
operated by large construction enterprises (illustrated through the Skanska case below).
The second trend involves the benefits for construction enterprises when entering into
public e-tendering. Although the benefits of this development accrue to the buyers - i.e.the public institutions - in the short run, improvements in accessibility to information and
transparency in the tendering processes benefit the construction enterprises in the long
run (illustrated through the e-Vergabe case presented after Section 4.1.7).
4.1.2 Definition of e-procurement
e-Procurement is generally defined as the use of the internet for requisitioning,
authorising, ordering and payment of products and services (Lootah 2006, p.3). e-
Procurement is hence the application of a span of digital technologies to expand the
front-end and back-office integration of contracting, service, transportation and payment
of the products and services through electronic processes, decisions, and transactions
(Andersen et al. 2003, p. 963).
However, e-procurement can be more than just a system for online procurement. An e-
procurement system can connect a construction enterprise and its business processes
directly with suppliers while managing all interactions between them. This includes
management of correspondence, bids, questions and answers, previous pricing, and
multiple e-mails sent to multiple participants.
Enterprises can also engage in e-tendering which is the use of electronic means
throughout the tendering processes, i.e. finding and selecting suppliers of works or
services (European Commission working group on e-construction Phase II, 2004). When
the buyer is a public authority, the term public e-tendering is used, which is defined as the
acquisition of high value, low volume goods, works and services by seeking bids
(proposals) via a public process followed by the evaluation of bids and award of contracts
(IADB 2002, p. 4).
An integrated part of e-procurement is e-purchasing (also called e-ordering), which is the
use of electronic means in the process of procurement of goods, works, services and
utilities (This includes the processes from finding a product to invoicing and payment).
Thus, procurement includes the process of ordering, but also the final stages of theprocurement process, i.e. payment (European Commission 2004, p. 12).

7/28/2019 Construction 2006
http://slidepdf.com/reader/full/construction-2006 68/182
Construction
68
4.1.3 Use of e-procurement in the construction industry
A study from the UK Construction Federation estimates the possibility of annual cost-
savings for clients from producing, copying and distributing tender documents through the
use of electronic tendering by as much as 90% (UK Construction Federation 2006).The introduction of e-procurement by European construction enterprises and the introd-
uction of e-tendering by public clients have an effect on the dynamics between members
of the construction value chain. According to recent research by eMarket Services, an
enterprise engaging in electronic procurement could cut procurement costs by as much
as 8 to 15% (eMarket Services 2005a, p. 2 and 2005b, p. 2).
According to the 2006 e-Business W@tch Survey, more than half of the interviewed
enterprises said that they place orders online. The frequency is slightly lower for micro
and small enterprises than for large enterprises. A slightly greater number of enterprises
in the CI place orders online compared to the average for all sectors. More specifically,
sectors such as tourism, footwear and food & beverages, that the CI can be compared
with concerning ICT uptake, are positioned lower in terms of enterprises placing orders
online.
The uptake of e-procurement is, among other things, driven by the rather high number of
e-market places available for construction enterprises in many Member States. As shown
in Exhibit 4-2, about half of the responding enterprises place orders online. This is on a
par with the weighted all-sector average. Looking into enterprise sizes, there is no clear
relationship between enterprise size and the number of enterprises placing orders online.
Among building installation enterprises, more than half place orders online, compared to
about 1 in 3 complete construction enterprises. This observation may indicate thatbuilding installation enterprises use the internet more often to place orders online but the
difference may also be explained by the fact that more large enterprises have
implemented their own e-procurement solutions and hence do not buy products over the
open internet.
About 7 in 10 enterprises placing orders online, said that these concern less than 25% of
their total purchase activities. In other sectors, the relative share of e-procurement is
somewhat higher; particularly in ICT-related sectors, but also in shipbuilding and tourism,
more than a quarter of those companies that procure online said that this activity
accounts for more than 25% of their total orders.

7/28/2019 Construction 2006
http://slidepdf.com/reader/full/construction-2006 69/182
Construction
69
Exhibit 4-2: Companies ordering supply goods on line
Place orders
online
Place up to
25% of orders
online
Place more
than 25% of
orders online
Use specific
ICT solutions
for e-sourcing
Weighting: % of empl.
% of firms
% of empl.
% of firms
% of empl.
% of firms
% of empl.
% of firms
Construction (EU-10) 53 51 74 72 26 28 12 6
Micro (1-9 empl.) 51 72 28 4Small (10-49 empl.) 54 76 24 10Medium (50-249 empl.) 57 80 20 17Large (250+ empl.) 58 69 31 26 NACE 45.2 (Comp.con.) 49 37 76 83 23 17 14 7NACE 45.3 (Installation) 57 58 73 69 27 31 9 6 Al l 10 sectors (EU-10) 57 48 74 75 26 25 16 9
Micro (1-9 empl.) 44 73 27 7
Small (10-49 empl.) 54 80 20 10
Medium (50-249 empl.) 60 76 24 16
Large (250+ empl.) 68 75 25 29 Food & beverages 54 39 86 91 14 9 14 5Footwear 35 29 83 87 17 13 9 5Pulp & paper 59 49 81 75 19 25 14 8ICT manufacturing 72 69 67 49 33 51 20 10Consumer electronics 70 71 60 47 40 53 16 9Shipbuilding & repair 62 53 78 69 22 31 18 12Construction 53 51 74 72 26 28 12 6Tourism 60 39 77 72 23 28 20 12
Telecommunication 78 77 54 49 46 51 26 12Hospitals activities 67 67 71 73 29 27 19 12
Base (100%)firms usingcomputers
firms placingorders online
firms placingorders online
firms usingcomputers
N (for sector, EU-10) 754 401 401 754
Questionnaire reference E1 E3a+E3b+E3c E3d+E3e E7
Source: e-Business W@tch (Survey 2006)
As displayed in Exhibit 4-2, less than 1 in 10 enterprises reported using a specific ICT
solution for e-sourcing. It would be safe to assume that the rest might use internet or
supplier-driven solutions for online procurement, but not any specific system or specialised software. In comparison with the portion of enterprises placing orders online,
it could be inferred that firms in the CI currently use more simple solutions for e-
procurement that do not require specific software or extensive ICT skills among
employees. Interestingly, results seem to be in the same range (50-60%) for all size-
bands, but differences appear when looking at the two sub-sectors: surprisingly, it is
building installation enterprises which come higher, both in terms of number of firms and
in terms of employment-weighted data.
Enterprises using such specific solutions use them mainly for finding suppliers in the
market (53% of firms), inviting them to quote prices (62%) and ordering goods/services
(61%) – see Exhibit 4-3. The use of e-auctioning is very limited in the CI which, based on
the nature of the provided service, is not surprising. These findings should, however, only
be seen as indicative since the sample size is limited (N=87 ).
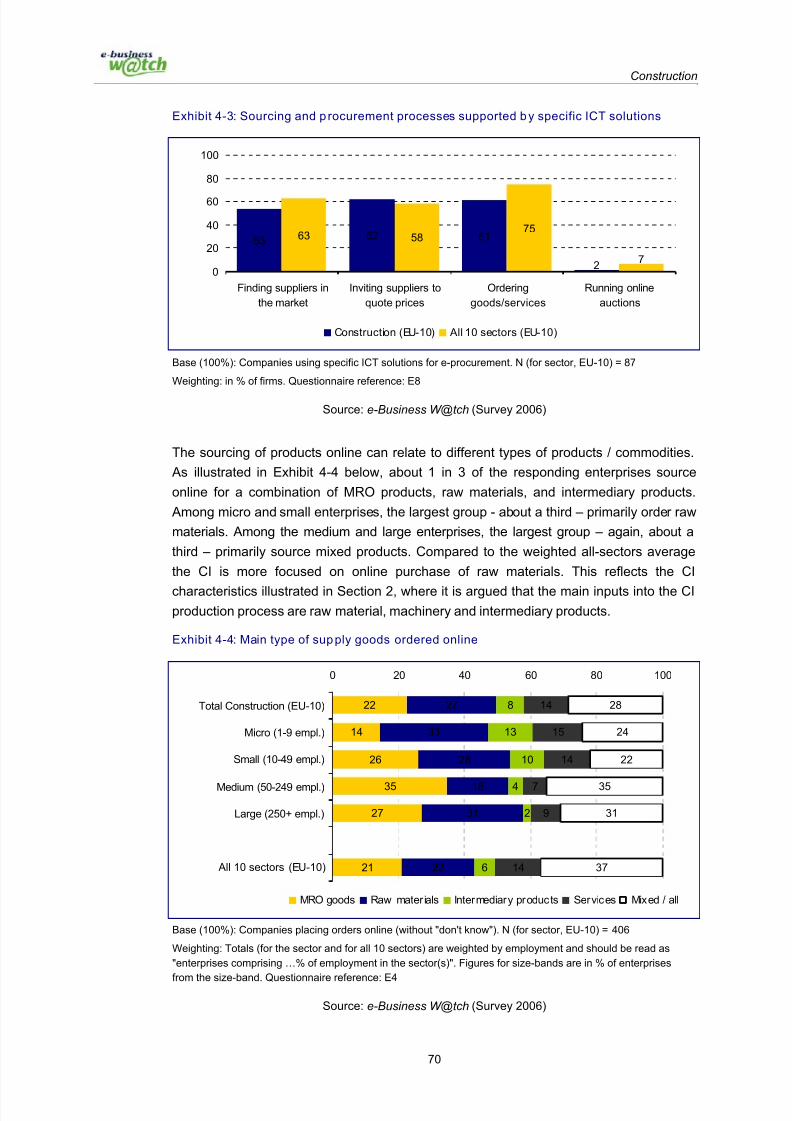
7/28/2019 Construction 2006
http://slidepdf.com/reader/full/construction-2006 70/182
Construction
70
Exhibit 4-3: Sourcing and p rocurement processes supported by specific ICT solutions
53 62 6163 5875
72
0
20
40
60
80
100
Finding suppliers in
the market
Inviting suppliers to
quote prices
Ordering
goods/services
Running online
auctions
Construction (EU-10) All 10 sectors (EU-10)
Base (100%): Companies using specific ICT solutions for e-procurement. N (for sector, EU-10) = 87
Weighting: in % of firms. Questionnaire reference: E8
Source: e-Business W@tch (Survey 2006)
The sourcing of products online can relate to different types of products / commodities.
As illustrated in Exhibit 4-4 below, about 1 in 3 of the responding enterprises source
online for a combination of MRO products, raw materials, and intermediary products.
Among micro and small enterprises, the largest group - about a third – primarily order raw
materials. Among the medium and large enterprises, the largest group – again, about a
third – primarily source mixed products. Compared to the weighted all-sectors average
the CI is more focused on online purchase of raw materials. This reflects the CI
characteristics illustrated in Section 2, where it is argued that the main inputs into the CIproduction process are raw material, machinery and intermediary products.
Exhibit 4-4: Main type of supply goods ordered online
22
14
26
35
27
21
27
33
28
18
31
22
8
13
10
4
2
6
14
15
14
7
9
14
28
24
22
35
31
37
0 20 40 60 80 100
Total Construction (EU-10)
Micro (1-9 empl.)
Small (10-49 empl.)
Medium (50-249 empl.)
Large (250+ empl.)
All 10 sectors (EU-10)
MRO goods Raw mater ials Intermediary products Services Mixed / all
Base (100%): Companies placing orders online (without "don't know"). N (for sector, EU-10) = 406
Weighting: Totals (for the sector and for all 10 sectors) are weighted by employment and should be read as
"enterprises comprising …% of employment in the sector(s)". Figures for size-bands are in % of enterprises
from the size-band. Questionnaire reference: E4
Source: e-Business W@tch (Survey 2006)

7/28/2019 Construction 2006
http://slidepdf.com/reader/full/construction-2006 71/182
Construction
71
Main location of suppliers in e-procurement
National suppliers are, by far, the most common type of suppliers when construction
enterprises procure online. 94% of the enterprises in the CI report that they mainly
procure from regional and/or national suppliers. Only 6% use international suppliers whenpurchasing online.
These findings highlight the local and regional focus of the CI where local raw materials,
due to transportation and storage costs, have traditionally been preferred. Compared to
the weighted average of the industries surveyed, the CI is more regionally and nationally
oriented, and international suppliers are only half as common in the CI as the average of
the industries surveyed. Interestingly, the use of local suppliers was reported more by
large enterprises than by micro and small enterprises. This further highlights the local
focus of CI companies when procuring essential raw materials. Apparently, however,
large enterprises also have a comparatively higher tendency to use international
suppliers than their smaller counterparts in this sector. This could be a result of their expected higher purchasing volume and geographically more far-reaching operations.
Exhibit 4-5: Main location of supp liers in e-procurement
33
33
30
27
42
24
61
60
63
70
47
64
6
6
6
3
12
12
0 20 40 60 80 100
Total Construction (EU-10)
Micro (1-9 empl.)
Small (10-49 empl.)
Medium (50-249 empl.)
Large (250+ empl.)
All 10 sectors (EU-10)
Mainly regional Mainly national Mainly international
Base (100%): Companies placing orders online (without "don't know"). N (for sector, EU-10) = 415
Weighting: Totals (for the sector and for all 10 sectors) are weighted by employment and should be read as"enterprises comprising …% of employment in the sector(s)". Figures for size-bands are in % of enterprises
from the size-band. Questionnaire reference: E5
Source: e-Business W@tch (Survey 2006)

7/28/2019 Construction 2006
http://slidepdf.com/reader/full/construction-2006 72/182
Construction
72
4.1.4 Potential benefits of e-procurement
The potential efficiency gains from e-procurement are especially expected from savings
related to:33
Procurement prices
Administrative costs for the buyers
Administrative costs for the suppliers.
These savings can be achieved by using e-procurement and in public e-tendering. The
potential savings in the CI when using e-procurement were illustrated by expert
comments arguing that the construction sector will be able to lower the cost of individual
items purchased by 20-30% (Cederblad 2001, p. 110). According to Farzin Saber,
Professional Relations Manager of IBX, the estimated savings are in the area of 12%.
Another analysis by e-Market Services of e-procurement in European enterprises showed
the average payback period for the investment in e-procurement to be less than a year
(eMarket Services 2005b, p. 2). However, the survey results presented in Section 3
showed that the European CI only uses e-procurement to a limited degree, and that only
the large enterprises are engaged in e-procurement. These two findings could indicate
that there is still untapped potential for CI enterprises in implementing e-procurement.
More specifically, the case study on Skanska in this section illustrates the fact that the
economic gains are centred on a general improvement of procurement practices,
including a decrease of the supplier base. The introduction of e-procurement will enable
enterprises to limit the number of suppliers used. This reduction can lead to better price
agreements with suppliers and the creation of a framework for long-lasting supplier relationships. The potential benefits from a limited supplier base include the possibility of
lower negotiated prices in framework contracts. This is the case when a construction
enterprise can designate a supplier to be the sole provider of specific materials (single
sourcing). The limitation of supplier bases and the potential use of single sourcing will
increase the collaboration between supplier and buyer.
As discussed in the above paragraphs, an expected impact from e-procurement is the
limitation of the number of suppliers, leading to a closer relationship between buyers and
suppliers. A large majority of the enterprises in the CI, however, do not seem to have
experienced any change in the number of suppliers as a result of their e-procurement
strategy (71%). In fact, 20% of enterprises have experienced an increase in the number
of suppliers and only 9% have experienced a decrease in the supplier base (see Exhibit
4-6). This development could be founded in the rather large number of suppliers
traditionally associated with a construction enterprise in order to meet specific needs for
clients concerning raw material selection and use of special intermediary products.
33 See e-Business W@tch 2005a, p. 38.

7/28/2019 Construction 2006
http://slidepdf.com/reader/full/construction-2006 73/182
Construction
73
Exhibit 4-6: Impact of e-sourcing and e-procurement on the number of suppliers
20
26
71
68
9
5
0 20 40 60 80 100
Construction (EU-10)
All 10 sectors (EU-10)
Increased Stayed the same Decreased
Base (100%): Companies placing orders online (without "don't know"). N (for sector, EU-10) = 395
Weighting: in % of firms. Questionnaire reference: E9
Source: e-Business W@tch (Survey 2006)
This development may, in the long run, improve the relationship between the two parties;
lead to lower transaction time as well as better quality of procurement catalogues. Thereduction of the supplier base through e-procurement is expected to lead to procurement
savings, compliance increases and procurement process optimisation. To ensure that
construction enterprises can remain competitive in the long run, occasional renegotiations
of terms with the single sourcing supplier are of course required.
An e-procurement system must have several call-off methods, i.e. ways in which a user
of the e-procurement platform can communicate with suppliers. Traditional supplier-
updated catalogues are the main call-off method. According to the case studies
conducted for this study, this may yield 20-40% of the total purchase being channelled
through the e-procurement system (Interview with Farzin Saber, March 2006). The most
common call-off method in e-procurement is an e-catalogue which offers the same value-
added features as a traditional paper-based catalogue, i.e. an overview of different
products with detailed information on products, pricing agreements and discount criteria.
e-Catalogues with an e-form are also used. This type of catalogue allows the user to
browse through an online catalogue and then place a request for the standardised items
presented in the catalogue. This type of call-off method provides the possibility of a free
text option where the buyer can specify extra requirements such as special design
features (customisation of the product) or special delivery terms. Applying these different
call-off methods, the percentage of the total purchase being channelled through the e-
procurement systems (also called the e-procurement ratio) of a construction enterprisecan increase to as much as 80-90%.34
34 Interview with Farzin Saber, conducted in March 2006, in the context of the Skanska case study.

7/28/2019 Construction 2006
http://slidepdf.com/reader/full/construction-2006 74/182
Construction
74
4.1.5 Barriers
A recent study by eMarket Services has shown that 83% of the enterprises in the
European CI procure online through supplier web pages. According to the same study,
21% use B2B e-marketplaces and 20% use extranets, whereas none of the surveyedenterprises used Electronic Data Interchange (EDI) for procurement purposes (eMarket
Services 2005c, p. 7). This is supported by the findings of this year’s e-Business Survey
which also showed that the use of EDI in the CI was very low.
Most traditional processes, such as accounting, have been automated, but relatively few
core processes (10%) have been re-engineered to be aligned with the potential of IT-
based technologies. Even fewer such processes (0.5%) have been transformed through
web-enabled inter-organisational collaboration (eMarket Services, 2005c, p. 7).
The CI is process-oriented and dependent on a high level of information. Standards vary
within and across national borders, e.g. there are various standards for describingcomponents, exchanging business documents, and for digital signature (e-Business
W@tch 2005a, p. 66). Moreover, the 2005 e-Business W@tch sector study on the CI
revealed that the main barriers to e-procurement adoption are cost, lack of standards,
decentralised organisation and resistance among suppliers (e-Business W@tch 2005a, p.
7). Based on this, it can be argued that the lack of common standards and e-standards is
a barrier to e-procurement uptake. This argument is also supported by the findings
presented in Exhibit 3-27.
The interviews conducted for the 2006 report highlighted some new barriers to the
introduction and successful use of e-procurement among European construction
enterprises. These new barriers are discussed in the following paragraphs. Common for
the barriers discussed below is that they make an otherwise solid business case for ICT
investment in e-procurement appear unclear to especially small and medium-sized
construction enterprises.
One such barrier is the discrepancy between short-term costs and long-term benefits.
The benefits of e-procurement, such as increased sales volume and single sourcing
partner status, are often gained in the medium-to-long term whereas price reductions
affect the supplier in the short term. This hampers the supplier’s desire to engage in the
e-procurement solution and may diminish the supplier’s resource allocation for e-
procurement catalogue updates. In short, the introduction of e-procurement in aconstruction enterprise mainly benefits the buyer side, especially in the short run.
Another barrier refers to the lack of ICT competencies among site and line managers on
the construction sites. Due to the specific nature of the procurement situation in a
traditional construction enterprise, the site and line managers handle much of the
procurement. ICT competencies among these employees are generally not very high and
this constitutes a barrier to the implementation of e-procurement.
To some extent, a culture-based resistance to change among site managers also
hampers the introduction of e-procurement (interview with Farzin Saber, March 2006). As
the daily purchase decisions in a construction enterprise are often made by site and linemanagers, a change in business processes from traditional procurement to e-
procurement should be accompanied by extensive e-procurement training of the site and

7/28/2019 Construction 2006
http://slidepdf.com/reader/full/construction-2006 75/182
Construction
75
line managers to optimise e-procurement system use (Aberdeen Group 2005, p. 32).
Furthermore, most SMEs do not have ICT skills and competencies to handle e-
procurement demand specification, system configuration and purchase and operation
(see Section 3.2). In addition, the introduction of new workflow processes may be an
obstacle especially for construction SMEs because they tend to operate with traditionalworkflow processes and may be less open to change.
Finally, another barrier to the uptake of e-procurement in the CI is the issue of
transparency introduced by e-procurement. E-Procurement has the advantage of making
all transactions traceable and a procurement audit can be conducted based on objective
procurement data. This may not be in the interest of some stakeholders. This assertion,
however, is not fully supported by the available findings and would need more data
collection and analysis before being confirmed.
4.1.6 Business implications
The implementation of e-procurement in the CI will have an impact on the workflow
process and the industry dynamics among construction enterprises and suppliers in the
value chain. By implementing e-procurement, the construction enterprises will be able to
negotiate better prices with their suppliers, thanks to a decrease of the administrative
costs associated with conducting business at both sides of the transaction (eMarket
Services 2005, p. 7).
This transfer of bargaining power from the supplier to the construction enterprise is
supported by the case studies about Skanska and Spie, presented in this report. This
possibility of lower prices through buyer-driven e-procurement is, however, not as evident
for small construction enterprises because limited procurement volume and economic
resources may hamper the introduction of such e-procurement solutions.
One implication is that a buyer-driven e-procurement solution may not be applicable or
feasible for all enterprise sizes. There are indications that buyer-driven e-procurement
can only be implemented by large construction enterprises with enough procurement
volume to activate suppliers and enough economic resources to invest in software
purchase, employee training and re-organisation. The case study on Skanska is a good
example of the requirements for organisational and workflow process changes that are
needed to take full advantage of the benefits of e-procurement. Change managementthen becomes one of the key factors for successful e-procurement implementation in a
construction enterprise.
An opportunity for construction SMEs to use e-procurement would be to engage in
supplier-driven e-procurement. Supplier-driven e-procurement is a solution where a
construction product supplier creates an electronic marketplace for its products - and,
possibly, others. The construction SME can then be given access to this supplier-driven
solution. By using this option, a construction SME may not gain the same scale
advantages as from a buyer-driven e-procurement solution because the e-procurement
solution is controlled by the supplier. On the other hand, the supplier bears all the cost of
maintenance, catalogue update, and the like.

7/28/2019 Construction 2006
http://slidepdf.com/reader/full/construction-2006 76/182
Construction
76
Thus, a supplier-driven e-procurement solution does not require a large one-off invest-
ment from the CI SME. In addition, the use of supplier-driven e-procurement solutions
may allow the CI SMEs to increase their ICT capabilities through the interaction with the
suppliers. Furthermore, the limited adoption of e-procurement among European constr-
uction SMEs may result in a strategic focus of some European construction supplierstowards the large buyer-driven e-procurement systems. This would imply that small and
medium-sized construction enterprises operating supplier-driven solutions could exper-
ience difficulties in activating enough suppliers to their individual solutions. The suppliers
may engage in framework contracts with a limited number of large, closed, buyer-driven
e-marketplaces and as a result, SMEs may have difficulty in attracting suppliers.
The main driver for some providers of e-procurement systems is the procurement
volume. If construction SMEs do not join forces on cross-enterprise-operated procure-
ment solutions, some of them may face difficulties in attracting software providers to
invest in the creation of a buyer-driven e-procurement solution.35
4.1.7 Implications of public e-procurement for construction enterprises
This section looks into the impact of public e-procurement developments for the CI, i.e.
procurement processes conducted via ICT where a public authority/body is the
prospective buyer and a construction enterprise is the tenderer.
Market size of public procurement
According to the UK Construction Federation, the total public procurement in the EU – i.e.the purchase of goods, services and public works by governments and public utilities –
was estimated at about 16% of the – then - EU-15 gross domestic product (GDP), or
1,500 bn euros, in 2002. The purchase volume as a percentage of GDP varies between
Member States, ranging between 11% and 20% of the GDP. In addition, in 2004, about
21,000 tenders with an estimated total value of 95-105 bn euros were published in the
Official Journal of the European Union (OJEU) (Wakeling 2006 p. 1). This represented
34% of the total value of public procurement in OJEU in 2004. In 2004 public
procurement represents about 40% of the total construction production value, i.e. 400bn
euros per year (Wakeling 2006 p. 1).
Development of e-procurement in the public sector
The opening up of public e-procurement within the Internal Market has increased cross-
border competition and improved prices paid by public authorities. For enterprises there
are, however, still opportunities for further competition in procurement markets and for
further savings.36 According to a report commissioned by the European Commission, if e-
procurement is generalised, it can save governments up to 5% in expenditures and up to
50-80% in transaction costs for both buyers and suppliers (European Commission 2004,
p. 3). Based on the information provided by the case studies of E-Vergabe and Yorkshire
35 Interview with Farzin Saber (March 2006), conducted in the context of the Skanska case study.36 Cf. European Commission, www.europa.eu.int/comm/internal_market, April 2006

7/28/2019 Construction 2006
http://slidepdf.com/reader/full/construction-2006 77/182
Construction
77
& Humber Regional Centre of Excellence, the introduction of advanced elements of e-
tendering, such as e-negotiation, is not yet under way. The E-Vergabe solution
represents a best practice example but still only applies the elements of e-procurement
that do not present high ICT skills requirements to the supplier side (in this case, the
construction enterprises). The business example of Water Services in Belfast shedsfurther light on the benefits of public e-procurement and especially e-tendering.
Bu s i n e s s e x am p l e :
Wa t e r Se r v i c e s i n Be l f a s t
The Water Services in Belfast uses public e-tendering with the tender
production software Qumi) to create and export the tenders. This allows the
tender documents to be returned electronically, thus increasing the speed,
confidentiality and effectiveness of tender analysis. Analysis has highlighted
some of the potential electronic tendering benefits as, for instance, per tender of 150 pages:
Material (paper and copying) = 110 UK pounds
Staff time (pre tender) = 90 UK pounds
Total savings (pert tender) = 200 UK pounds
Total cost savings = Est. 90% as compared to paper traditional notification,
publications and submission of tender.
Source: UK Construction Federation, A Beginner’s Guide to e-business in
Construction, 2006
If the CI is to engage in public e-procurement, the most likely method would be public e-
tendering. Reports indicate that the annual costs of producing, copying and distributing
tender documents to clients can be cut by as much as 90% through the use of e-
tendering (UK Construction Federation 2006, p. 16). It is argued that one advantage of
public e-tendering for construction enterprises is that enterprises trading with the public
sector develop an e-business capability (eMarket Services 2005d, p. 2).
Based on this evidence, it could be argued that public clients can, through their selection
of suppliers and their demand for ICT capabilities, increase the uptake of ICT amongconstruction enterprises and, in the long run, increase the competitiveness of the sector.
As enterprises move along the e-business learning curve, their knowledge and
application of e-business is expected to have a spill-over effect on other enterprises.
Seen from an enterprise perspective, the use of public e-tendering would lower the
information search requirements for enterprises because tender information would be
readily available online (e.g. through the OJEU). The introduction of public e-tendering is
also expected to reduce possible infringements of rules and regulation by increasing
transparency in the marketplace for public tenders (eMarket Services 2005b, p. 2).

7/28/2019 Construction 2006
http://slidepdf.com/reader/full/construction-2006 78/182
Construction
78
Implications
The use of public e-tendering affects the relationship between construction enterprises
and their public clients. If the public client introduces an e-tendering process, the supplier
is forced to possess specific ICT skills in order to be able to interact with the buyer. The
introduction of public e-tendering also moves some of the bargaining power from the
construction enterprise to the client. The advantages of introducing public e-tendering are
lower prices through greater competition, more transparent tender processes and better
control of public spending (eMarket Services 2005c, p. 4). The case study of E-Vergabe
presented in this sector study highlights the above benefits of public e-procurement.
Public e-procurement is widespread in many EU Member States, but in general is limited
to electronic notification of tender and tender publications. The more advanced public e-
procurement solutions (such as tender delivery, e-negotiation and e-auctions) are not yet
widespread. These solutions are designed to optimise the buyer side of the transactionwhich means that construction enterprises (acting as sellers) do not yet have strong
incentives to engage in public e-procurement (Interview with Marc-Christopher Schmidt,
Beschaffungsamt des Bundesministeriums des Innern, March 2006).
A result of this lack of incentives from construction enterprises to move into more
advanced solutions for e-procurement could be that the public sector, both as law maker
and large procurer, should play a more active role in the support and development of ICT
capabilities in the CI. This could, possibly, be done both through articulated ICT demands
to current/potential suppliers and through support in ICT skills development initiatives.
On the following pages, the case studies related to e-procurement are presented. Thecase study of the German e-procurement portal for public procurement illustrates the use
of e-tendering and e-procurement for public construction tenders. The case study
furthermore highlights the barriers to uptake of public e-tendering for construction
tenders. The second case study concerns the international, Swedish-based construction
enterprise Skanska and illustrates their experiences with e-procurement. The last case
study is on the Greek e-procurement portal provider E-construction and discusses the
uptake and implementation of e-procurement in the Greek CI.

7/28/2019 Construction 2006
http://slidepdf.com/reader/full/construction-2006 79/182
Construction
79
C ASE STUDY : E-V ERGABE , GERMANY
Abstract
E-Vergabe is a procurement/e-tendering platform for the federal public administration in
Germany (Vergabeplattform des Bundes). The main features of the platform include the
publication of public tender notices and tender documents, receipt of tender documents
and communication between buyer and supplier.
The main objective of the German Government for developing the procurement platform
was to improve the efficiency of the procurement process, including higher transparency
and better access to public services, by reducing dependency on paper-based
procedures. The e-Vergabe system is in place at 33 German federal tender offices and
numbers about 600 users (suppliers), including about 60 firms related to the CI.
The impact of using e-Vergabe has two main aspects: the impact on the buyer side
(public authorities) which are cost savings and modernisation of the administration
system; and the impact on the seller side (construction enterprises) which is better
transparency leading to equal opportunities for tendering. Cost savings of about 10% and
better communication within the Government and with businesses were also expected.
Case study fact sheet
Full name of the enterprise: e-Vergabe
Location (HQ / main branches): Germany
Sector (main business activity): Public procurement
Year of foundation: 2001Number of employees: -
Turnover in last financial year: -
Primary customers: 33 German federal tender offices
Most significant market area: Germany
Focus of case study: e-procurement, e-tendering
Key words: Procurement platform, transparency of procurement
practices
Background and objectives
E-Vergabe is part of the BundOnline 2005 project and belongs to the Öffentlicher
Eink@uf Online (Public Purch@sing Online) programme, which was initiated in 2000 with
the aim to offer all internet-enabled services of the federal administration from a single
platform by 2005. Following this initiative, the German Interior Ministry’s Procurement
Agency decided to develop its own online contract bidding system. They chose the
enterprise CSC Ploenzke to develop the e-Vergabe platform through a contract signed in
May 2001. CSC Ploenzke is the German branch, based in Cologne, of CSC, an American
enterprise providing IT consulting services worldwide, with a turnover of 14.6bn US
dollars (about 11.6bn euros) by the end of 2005.37
37 For more information on CSC, visit www.csc.com

7/28/2019 Construction 2006
http://slidepdf.com/reader/full/construction-2006 80/182
Construction
80
Today, the Öffentlicher Eink@uf Online programme consists of three elements
(www.bescha.bund.de, July 2006):
The Tendering Module (Vergabe-Modul “DOMEA®”), facilitating the work of buyers
at the Procurement Agency who invite tenders and award contracts
The e-Tendering platform (e-Vergabe)
The one-stop eGovernment shop (Kaufhaus des Bundes) is based on an electronic
catalogue. Federal authorities can request any item available from the suppliers
with whom the Procurement Agency has made a framework agreement.
Today, the e-Vergabe platform has 600 users, including about 60 firms related to the CI,
and is in place within 33 public authorities, at all three levels of government: federal,
state, and local. Another 22 authorities are expected to join shortly (Activity Report
2004/2005 Beschaffungsamt des Bundesministeriums des Innern, 2005). Furthermore,
1000 public tenders have been published on e-Vergabe in 2005 and this number is
expected to increase sharply in 2006 (Interview with Marc Christopher Schmidt,
Beschaffungsamt des Bundesministeriums des Innern, 27 March 2006).
The main objective for the German Government of introducing e-tendering is to improve
the efficiency of the entire tendering process by substituting all the paper-based
processes with electronic ones. This is expected to generate a better classification and a
more efficient retrieval of documents. In addition, by publishing all tenders online, all
enterprises have access and can apply for them. Through lowering the barriers to
participation, competition among enterprises is increased and is expected to lead to lower
procurement prices.
Finally, cost savings as a result of fewer paper-based processes and higher transparency
are expected by the Government. Contracts in tender by German public authorities are
worth 250bn euros annually (about 13% of the Germany’s GDP).
Overall, the Government expects to save 10% of this figure by using e-Vergabe (IDABC,
E-Procurement Case studies, 2002). This is supported by to the German Association of
Towns and Municipalities (Deutscher Städte und Gemeindebund), especting the costs of
public procurement should fall by 10 to 15%. As for the processing costs, according to the
Bund, both the contracting authorities and the suppliers can expect to save as much as
50 to 80%.
e-Business activities
Technical requirement
The entire e-Vergabe system runs on an application server. JBoss, an open source
software, supports applications like Java and is free to download.38 The database (where
all documents, tenders and contracts of e-Vergabe are stored) is based on the Oracle
Database 10g Release 2 version.39
38 For more information on JBoss application server:, visit www.jboss.com 39 For more information on Oracle Database 10g, visit www.oracle.com

7/28/2019 Construction 2006
http://slidepdf.com/reader/full/construction-2006 81/182
Construction
81
The e-Vergabe system is divided in two main parts: a notification platform and an
intercommunication platform. On the first platform, enterprises have access to all the
tenders published through e-Vergabe. A search function is used to identify specific
tenders. Furthermore, enterprises have access to the economic partner register. The
following screenshot shows an example of the classification of construction-relatedtenders published on the notification platform:
Exhibit 4-7: Screen shot of the E-Vergabe user interface
The second platform is used for communication using a Java Webstart software solution,
embedded in the application server JBoss. This communication includes correspondence
of questions and upload/download of documents in a secure manner. For example, the
Procurement Agency can communicate with single economic partners or with certain
groups, such as all the economic partners who are invited for a call for tender or all those
who have requested tendering documents.
The training provided by e-Vergabe is composed of an e-learning module provided by the
federal German Government, an online training platform for self-training, information
campaigns regarding implementation and usage of e-Vergabe and a phone and e-mail
based hotline. The main driver behind the development of e-Vergabe has been the desire
to create a secure channel for the distribution of public procurement tenders and
contracts. The development of a secure platform for e-Vergabe has undergone an
evolution from digital signature cards using a card reader towards software certificates.
Upon introduction in 2001, e-Vergabe used digital signature cards where each user
needed a smart card with two personalised digital certificates. Combined with a card
reader plugged into a computer, the user can sign a contract encrypted with his own key.
The supported trust centres (providing certificates) where users can obtain a digital
certificate are: Signtrust, DATEV, TeleSec, D-Trust and A-Trust. The client computers
need to have a class 3 or class 2 key card readers. Class 3 readers feature displays as
well as key panels and thus prevent attacks against unauthorised PIN use through input
logging. This solution can, however, create problems with interoperability of card readers
and signature cards as the e-Vergabe system supports 13 different card readers and 6

7/28/2019 Construction 2006
http://slidepdf.com/reader/full/construction-2006 82/182
Construction
82
different cards among 16 existing in Germany. The cost of this security system is approx.
200 euros per user and the card can last 2 or 3 years.
This initial solution was partly replaced by a secure system of software certificates and
the new system has been in operation since the beginning of 2006. Through this system,
each computer using e-Vergabe owns one unique personalised signature. The new
system requires fewer electronic features because the card reader and signature cards
are not relevant, except when the enterprise wants to sign a tender electronically. By
using software certificates, enterprises have access to the notification and
intercommunication platforms. There are no direct costs associated with using the new
software certificates for the users: e-Vergabe provides an online service that enables
enterprises to download a personalised software certificate directly onto their computer
by filling out and sending a form. The only requirement for this software solution is a
computer with a Windows operating system (Version 2000 or newer). The format used to
open and read contract files is PDF from Adobe. The e-Vergabe Software that enables
the user to bid online is available free of charge on the web site.
The e-tendering process is based on qualified signatures: the enterprise tendering must
have a signature card and a card reader installed on its computer to carry out the e-
tendering process. First, the buyer (public authority) prepares the tender documents. The
tender document is created using a PDF format identical to the traditional tender offer
form. The documents are then sent to all suppliers which have applied for participation in
the electronic tender process. Due to the use of qualified signature, the tenderer only has
to download the tender-offer document, fill out the contract and sign it by using the
signature card that is legally equivalent to a paper signature under German law. 40 Then
they can submit their bid as usual on the platform, where it is stored and locked as adigitally signed PDF file. Exhibit 4-8 illustrates the e-tendering process on e-Vergabe.
The platform guarantees the following security features through its tasks in the process:
Access to publishing (buyer) and receiving (supplier) bid invitations
Time registration of confirmation notice
Time registration of the tender
Integrity verification of the tender documents
Secure locking of tenders from the buyer and other tenderers until deadline.
The feature enables e-Vergabe to meet its security objectives which are:
Integrity and authenticity of tenders
Confidentiality of exchanged documents
Legally binding tenders.
40 For further information see www.bundesnetzagentur.de

7/28/2019 Construction 2006
http://slidepdf.com/reader/full/construction-2006 83/182
Construction
83
Exhibi t 4-8: E-Vergabe tender process
Source: E-Vergabe 2006
Enterprises may still print contracts and send them by traditional mail but the German
federal Government plans to stop acceptance of this process. Thus, according to e-
Vergabe, by the end of 2011, all tenders will be electronic. In addition, e-Vergabe expects
in the near future to replace qualified signature by advanced signature. This tendering
process will be easier for the enterprises as advanced signatures can be generated by e-Vergabe using software smart cards.
Impact
The implementation of e-Vergabe has not yet had a substantial impact on the buyer side,
although this is expected to be achieved in the near future. Even though enterprises are
forced to use the e-Vergabe platform because the web site www.bund.de is the only
German information source concerning public tenders, only 5% of the German
enterprises use the platform today. This limited use should be viewed in the context of the
German administrative structure: the German local governments and administrations
(municipalities and Länder) are still using their individual platforms. Furthermore, cities
generally use platforms where enterprises have to pay if they want to have access to
information.
This use of many different platforms across municipalities, Länder and the federal
government hampers the merging and centralisation into one single platform for the
country, as different vendors of the pay-for-use platforms will not be interested in missing
out on this income in order to merge with one free federally run procurement platform.
According to e-Vergabe, no statistics that measure the impacts on costs and efficiency of
the system have yet been established. The impact is expected to be analysed in more
depth by the Federal Government in the next couple of years according to MarcChristopher Schmidt. Preliminary analysis indicates that the new security features

7/28/2019 Construction 2006
http://slidepdf.com/reader/full/construction-2006 84/182
Construction
84
including software certificates, described above, will support the increased use of e-
Vergabe in the coming years.
The e-Vergabe platform also has an impact on construction firms. Among all the
enterprises using e-Vergabe, 10% to 20% are construction firms. Thus, public e-tendering
begins to be more widely used within the CI. In volume, however, the CI is the main
player in public tendering. This is due to the high individual cost of construction projects.
According to Ms Bettina Schneider from the Federal Government, impact is the same for
SMEs and big enterprises, as they use exactly the same e-tendering process. The use of
e-Vergabe brings about faster processes since procedures that would last several days
using traditional mail, only take a few hours to complete using e-Vergabe. In addition,
they require less administrative work which can lead to a much simpler work organisation
concerning tendering.
Information and services provided by e-Vergabe are free, except for the signature card
and card reader. Thus, the e-tendering process is cheaper than the traditional paper andmail-based process. In addition, according to the German Procurement Agency,
electronic tendering is a means to prevent corruption. In fact, in all the important steps of
the tendering process, all procedures are double-checked by two different employees so
that no enterprise can be preferred over another for subjective reasons. Managers are
also trained to be more aware of corruption problems. Finally, as all tenders are
published on the e-Vergabe platform, all enterprises, either SMEs or large firms, have
equal access and an equal opportunity to apply for tenders online.
Lessons learned
The first challenge of e-Vergabe has been to make public authorities adhere to using
the e-procurement system instead of their traditional systems. Now 33 different public
authorities use e-Vergabe and 22 new users are expected by the end of the year. Thus,
the new challenge of the Procurement agency is to focus more on the buyer side: e-
Vergabe can be modified to bring about more benefits in the e-procurement process of
authorities.
Moreover, during the implementation phase of the e-tendering platform, no workflow
system was included. This therefore enables the German Procurement Agency to be
more flexible in its choice of workflow.
Finally, to optimise security and usability an e-tendering platform should use software
certificates as opposed to digital signature cards. It is more likely that enterprises will
use a platform where they do not have to work with signature cards. But on the other
hand, it is important to make sure that the public authority can rely on the electronically
signed bid from the tenderer.
The use of the platform among construction enterprises is driven by a push from
authorities more than a pull from enterprises.

7/28/2019 Construction 2006
http://slidepdf.com/reader/full/construction-2006 85/182
Construction
85
References
Research for this case study was conducted by Anders Pennerup Gantzhorn, Ramboll
Management, on behalf of e-Business W@tch. Sources and references used:
Interview with Marc Christopher Schmidt, Beschaffungsamt des Bundes-ministeriums des Innern, 27 March 2006
Interview with Sonja Branskat, Beschaffungsamt des Bundesministeriums des
Innern, 20 April 2006
Interview with Bettina Schneider, Beschaffungsamt des Bundesministeriums des
Innern in Berlin, 20 April 2006
Digital Procurement Solution Helps Streamline German E-Government, LEF
TechEx Award, 2005
Security and Trust in Public e-procurement, Technical Report, IT Transfer Office,
Darmstadt University of Technology, 29 July 2006
IDABC, E-Procurement Case studies,http://europa.eu.int/idabc/en/document/630/197 , 2002
www.emarketservices.com, E-marketplaces in Germany, 2003
Websites:
www.beschaffungsamt.de
www.evergabe-online.de
7/28/2019 Construction 2006
http://slidepdf.com/reader/full/construction-2006 86/182
Construction
86
C ASE STUDY : IMPLEMENTATION OF PUBLIC E-PROCUREMENT/
Y&H RCOE, UNITED K INGDOM
Abstract
In 2005, Leeds City Council and the Yorkshire & Humber Region implemented a Supplier
and Contract Management System (SMCS). The SMCS handles supplier management,
electronic tendering and contract management and is implemented in 22 local authorities
in the region. The initial cost savings amounted to about 3.75m euros and are expected
to increase in the future.
The primary impacts are related to the collating of information on suppliers and contracts
across the region, which can be carried out faster and more cost-effectively. Furthermore,
information sharing between authorities has become easier.The lessons learned are 1) Clarity, simplicity and minimal graphics are essential when
drawing up specifications to be used electronically 2) Procedures and documentation
need to be standardised across different public departments (acting as procurers) for
maximum effect 3) The process must allow for resistance to change, especially at a
practical operational level and 4) Electronically enabling an imperfect manual system may
make it faster, but will not improve it.
Case study fact sheet
Full name of the enterprise:Leeds City Council and The Yorkshire & Humber
Regional Centre of Excellence (Y&H RCoE)
Location (HQ / main branches): Leeds, United KingdomSector (main business activity): Public procurement
Year of foundation: 2004
Number of employees: -
Turnover in last financial year: App. 1.8m euros
Primary customers: Public sector (local government)
Most significant market area: Local government municipalities
Focus of case study: Public e-procurement/ public e-tendering
Key words: Supplier and Contract Management system, interaction
between public authorities
Background and objectives
In 2005, the UK Government set out the target to improve the efficiency of UK local
governments and local/regional public authorities. Regional centres of excellence
(RCoEs) were established as the lead efficiency change agents for local governments.
Based on this initiative, the Yorkshire & Humber Regional Centre of Excellence (Y&H
RCoE) was created to provide support to 22 Local Authorities and to the Fire Police
Services and National Parks in the Yorkshire & Humber region (Leeds and surrounding
areas).
One of the projects promoted by Y&H RCoE was the introduction of public e-procurement and public e-tendering. To support the implementation and use of public e-
procurement, Y&H RCoE supervised the purchase of an electronic supplier and

7/28/2019 Construction 2006
http://slidepdf.com/reader/full/construction-2006 87/182
Construction
87
contract management system (SCMS) which serves as the basis for all public e-
procurement activities. The SCMS is based on a system implemented by Leeds City
Council called the Electronic Tendering System (ETS), which was in operation from
2001 to 2005.41 During the period of operation the ETS had about 10,000 registrations,
2,600 tenders placed, 1.1bn British pounds worth of contracts placed, 28,319 tender documents downloaded and more than 9 out of ten users rated the ETS as “good” or
“very good”.
e-Business activities
In the past, the authorities in the Yorkshire & Humber region used stand-alone systems
for supplier and contract management. The scope of the SCMS project was the
specification and procurement of a web-based service to deliver public e-procurement
and make it available to any contracting authority within the Yorkshire & Humber region.
The objective was to make contracting with local authorities in the region easier and moreaccessible, and to remove many of the obstacles, real or perceived, in relation to finding
procurement information quickly and easily.
The SCMS system joined all 22 Local Authorities in the region together with any supplier
associated with the Y&H RCoE. The objectives of the SMCS project were:
To give contracting authorities in the region immediate access to quality
procurement information, pre-qualified suppliers, and professionally
procured contractual arrangements
To give suppliers access to local authority procurement information -
including self-registration, current and forward contracting opportunities, andthe suppliers’ own historical records
To provide a catalyst for standardisation, aggregation and collaboration
across the region
To improve the efficiency and effectiveness of procurement within each user
authority
To share the back office elements of supplier and contract management.
An IT system supplier was selected through a competitive tendering procedure.
Authorities in the region worked jointly to agree on the specification for the SCMS and,following the competitive tendering procedure, Alito Limited was nominated as the
preferred bidder. Leeds City Council, acting in its capacity as host authority of the Y&H
RCoE, formally accepted the tender on 11th January 2006 for a five-year period.
Implementation and roll-out of the system was undertaken in two phases, with ten
authorities using the system by the end of June 2006, and the remaining authorities
‘going live’ in October 2006. Access to the public e-procurement website
(http://scms.alito.co.uk) is provided to all approved buyers and suppliers and the system
is in effect the central ‘core’ database for local authority procurement requirements
41 The existing electronic tendering system (ETS), which was used by twelve councils from 2001,was shut down in July 2006. In the 22 local authorities in the region a variety of legacy systemsexisted in varying degrees of sophistication.
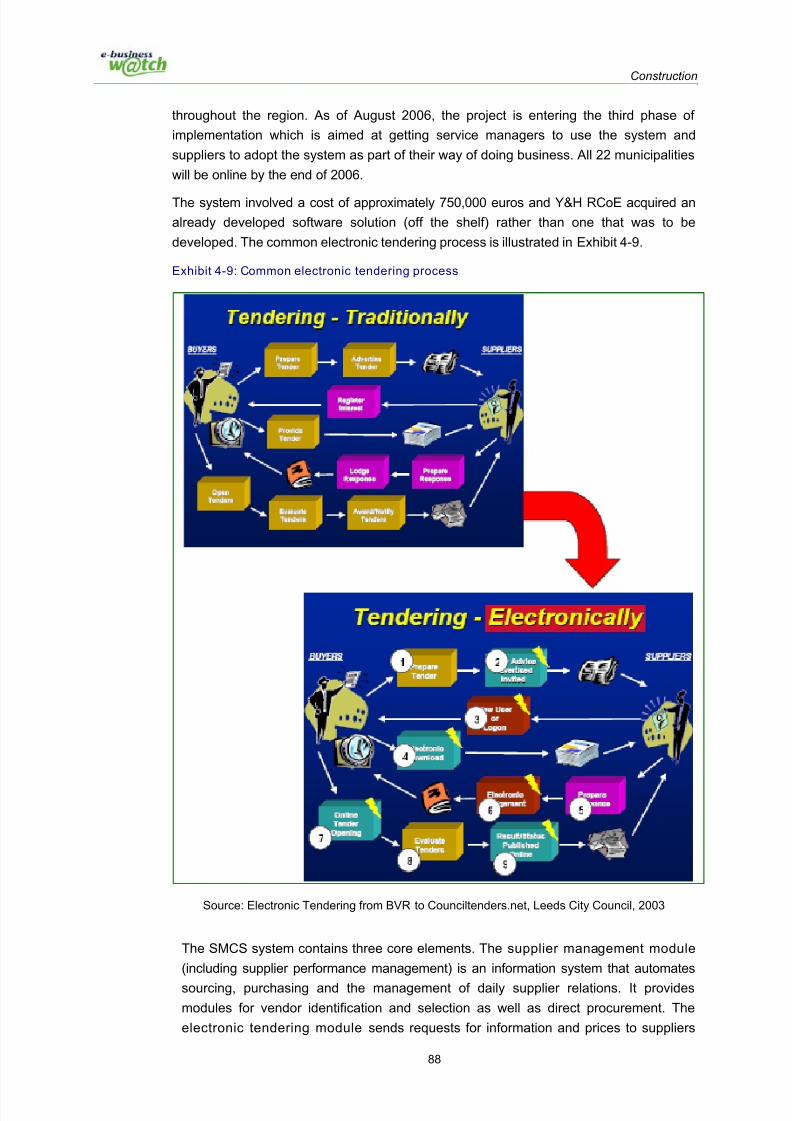
7/28/2019 Construction 2006
http://slidepdf.com/reader/full/construction-2006 88/182
Construction
88
throughout the region. As of August 2006, the project is entering the third phase of
implementation which is aimed at getting service managers to use the system and
suppliers to adopt the system as part of their way of doing business. All 22 municipalities
will be online by the end of 2006.
The system involved a cost of approximately 750,000 euros and Y&H RCoE acquired an
already developed software solution (off the shelf) rather than one that was to be
developed. The common electronic tendering process is illustrated in Exhibit 4-9.
Exhibit 4-9: Common electronic tendering process
Source: Electronic Tendering from BVR to Counciltenders.net, Leeds City Council, 2003
The SMCS system contains three core elements. The supplier management module
(including supplier performance management) is an information system that automates
sourcing, purchasing and the management of daily supplier relations. It provides
modules for vendor identification and selection as well as direct procurement. The
electronic tendering module sends requests for information and prices to suppliers

7/28/2019 Construction 2006
http://slidepdf.com/reader/full/construction-2006 89/182
Construction
89
and receives the responses of suppliers using the internet. The contract management
module encompasses all the activities that a local authority engages in while entering
into a business transaction with one or more construction enterprises and fulfilling all
the obligations related to the contract.
As an integrated part of the e-procurement procedure when using the SCMS system,
the client departments (acting as procurers) are requested to review and revise their
standard contract documentation to take account of the SCMS process. This includes
not only file configuration (bearing in mind the size of the file), but also file format (MS
Word or PDF), of how individual files are compiled and what documents must be
returned to the tenderer.
Impact
Based on the experiences from the implementation of the SCMS system, the Y&H
RCoE estimates that the region is now better equipped to conduct collaborativeprocurements through pooling of information on similar requirements and joining forces
to run procurements. The SMCS project contributes to efficiency gains by providing a
common resource that can be used to support procurement activities. The expected
impacts from the introduction of SCMS system are:
Cost reduction of 3.75m euros through efficiency gains (with a potential for
significant savings increase in the future)
Collating information on suppliers and contracts across the region is quicker
and more cost-effective.
Information sharing between authorities has become easier
Suppliers only have to pre-qualify once for one, several or all authorities in
the region, and can maintain their own details online
Because the system is transparent it has “demystified” the public
procurement process.
In addition to the above-mentioned impacts and benefits for the procurer, the Y&H
RCoE has collected information on the impacts of the SCMS system seen from a
supplier perspective. The following paragraphs sum up the impacts experienced by two
UK-based construction enterprises using the SCMS system:SEC Building services
SEC Building Services (SEC) is a construction enterprise owned by Scottish and
Southern Energy plc. SEC had a turnover of 257m euros in 2002/2003. Today,
approximately 5% of the total turnover of SEC is handled electronically. SEC has used
the SCMS system to tender for a Communal Heating system in Rothwell. SEC found
the system to be a quick and efficient way of submitting a tender and received an
automated receipt by return. Using this system saved time and costs and also removed
the worry as to whether the tender had arrived by the due date and time. Positive
measurable savings have been identified in delivery while additional costs have
incurred in printing. According to SEC, the clients are the driving force for the

7/28/2019 Construction 2006
http://slidepdf.com/reader/full/construction-2006 90/182
Construction
90
development of the SCMS concept because the clients experience the benefits in the
short run. The relationship with the client has remained the same.
Hobson & Porter
Hobson & Porter (H&P) is a medium-sized construction contractor employing around150 people and with an annual turnover of around 22m euros (2003). H&P have been
working with the SCMS since its launch. H&P log onto the site to download information
about tender opportunities, including prequalification questionnaires and tender
documents, and to be alerted to any extra information as it arises. H&P completes
submissions and return them electronically. According to H&P the e-procurement
system from the Y&H RCoE saves the enterprise time and money and enables them to
share information quickly and access it remotely. H&P have found the e-procurement
system simple to use and navigate, and they will continue to use it in the future.
Further development of the public e-procurement system
Many of the initial problems with the system were related to firms attempting to submit
documents which included electronic versions of glossy brochures, aerial photographs,
enterprise logos, or scanned images. Such actions dramatically increase the file sizes
of electronic documents and can result in submissions being unsuccessful. Despite the
file size warnings built into the SCMS system and in the guidance documents, some
enterprises still attempt to submit large files that exceed this limit. Efforts are now made
to address this via training and awareness sessions. Immediately prior to submitting a
tender electronically the tenderer is also requested to check the electronic files making
up the tender for viruses using fully current virus checking software, and to remove allviruses from the files.
A significant part of the next phase of the SCMS system will be to get public service
employees and managers (acting as procurers) to use the system more frequently. The
workflow elements of the SCMS system will make public administration of tenders
easier. Public service employees working in parts of the public administration where ICT
is more widespread are expected to be more likely to embrace e-procurement
technologies. This may indicate that the uptake among public civil servants working with
public construction, infrastructure or the like will be more reluctant to use the SCMS
system. Concerning the second large stakeholder group, the suppliers, the natural next
step is to promote the SCMS system towards SMEs and not-for-profit organisations.The current promotion activities have proved a success when addressing SMEs.
Without buy-in from both sides of the procurement process, the success of the SCMS
system will be limited. Procurers need to streamline and simplify tender documents to
make them user-friendly, as well as produce and maintain them electronically.
Lessons learned
Over the period of operation a number of lessons have been learnt:
If there is a political requirement to run parallel systems (i.e. hard and soft copy
options), the cost and resource savings will not be reduced. It would obviously be
beneficial to insist that all future tenders are dealt with electronically.

7/28/2019 Construction 2006
http://slidepdf.com/reader/full/construction-2006 91/182
Construction
91
Leeds City Council and the Y&H RCoE have experienced that the regional aspect
of suppliers and procurers is critical to the success of SCMS system. The more
national the SCMS system becomes the less effective it becomes because of
cultural and geographical differences among the procurers and suppliers.
The SCMS system is based on an old public e-procurement system (ETS). It has
thus been possible to gradually eradicate outstanding technical and operational
issues.
Clarity, simplicity and minimal graphics are essential when drawing up
specifications to be used electronically.
Procedures and documentation need to be standardised across different public
departments (acting as procurers) for maximum effect.
Electronically enabling an imperfect manual system may make it faster, but will not
improve it. Simply e-enabling an existing inadequate tendering process will not
make it measurably better.
Tenderers need to be convinced of the benefits, simplicity of use and security of
using the system, and all parties will continue to require training and support. The
amount of resources required has been above that originally estimated.
The process must allow for resistance to change, especially at a practical
operational level. Those public servants (acting as procurers) that have used the
SCMS system have been surprised at its ease of use and have been converted to
doing things electronically.
Electronic signatures are unnecessary due to the security built into the system.
References
Research for this case study was conducted by Anders Pennerup Gantzhorn, Ramboll
Management, on behalf of e-Business W@tch. Sources and references used:
Information provided by Mr. Tony Wiltshire, Regional Director of theYorkshire and Humber Regional Centre of Excellence, 8 August 2006
Review by Judith Smith, Secretary to the Regional Director of the Yorkshireand Humber Regional Centre of Excellence, 15 August 2006
Answers from Steve Stretton, SEC Building Services, LeedsElectronic Tendering from BVR to Counciltenders.net, Leeds City Council,2003
Websites:
Leeds City Council, www.leeds.gov.uk
Yorkshire & Humber Region Supplier and Contract Management
System, http://scms.alito.co.uk
Yorkshire and the Humber Centre of Excellence (Y&H CoE),
www.yhcoe.rcoe.gov.uk

7/28/2019 Construction 2006
http://slidepdf.com/reader/full/construction-2006 92/182
Construction
92
C ASE STUDY : SKANSKA , SCANDINAVIAN COUNTRIES
Abstract
Skanska AB is one of the world’s largest construction enterprises. With headquarters in
Sweden, the Skanska group employs 54,000 people worldwide and provides
construction-related services and project development. Skanska began to implement e-
procurement solutions in its Nordic branches in 2004. The main objectives were to reduce
procurement costs and improve efficiency of the procurement process while developing
closer cooperation with suppliers. This project was divided into five phases: e-
procurement, collaborative commerce, e-tendering, logistics, and e-invoicing.
Skanska has considered the e-procurement implementation as a change management
process rather than technology deployment. The two main focus points for the
development of the project so far have been support from top management and internal
change management including the training of staff and suppliers. The implementation of
e-procurement has already had an impact on cost savings: new procurement contracts
signed by the Swedish branch of Skanska (first to implement e-procurement) generated
about 5m euros in savings in 2005. As of September 2005, about 50% of Skanska’s total
monthly procurement spending in Sweden was channelled through the Skanska/IBX e-
procurement solution.
Case study fact sheet
Full name of the enterprise: Skanska
Location (HQ / main branches): Sweden
Sector (main business activity): Construction
Year of foundation: 1887
Number of employees: 54,000
Turnover in last financial year: 13.4 bn euros
Primary customers: Government and businesses
Most significant market area: Sweden, USA
Focus of case study: e-Procurement
Key words: e-procurement processes, change management as key
success factor
Background and objectives
With a turnover of 13.4bn euros in 2005 and 12,000 ongoing projects, Skanska is the
largest Nordic construction enterprise and the second largest construction enterprise in
Europe. The enterprise generates 41% of its revenue in the Nordic countries (including
20% in Sweden), 23% in the other European countries and 32% in the United States. The
enterprise has about 54,000 employees worldwide. According to the Skanska Annual
Report 2005, 54% of the group’s customers are public authorities. In its annual report
2005, Skanska identifies 4 different business streams:
Construction (91% of the group global revenue): building construction, including
non-residential and residential, and civil construction
Residential development (5% of the group global revenue)

7/28/2019 Construction 2006
http://slidepdf.com/reader/full/construction-2006 93/182
Construction
93
Commercial Development (4% of the group global revenue)
Infrastructure development (less than 1% of revenue).
The main objective of the “Project Effect” initiated in Skanska’s Nordic branches in 2003
was to reduce procurement costs and improve the efficiency of the procurement processwhile developing closer cooperation with suppliers and implementing better logistics
solutions.
e-Business activities
Skanska Denmark has just begun to implement e-procurement in 2006, while Norway did
so several months before Denmark. The Skanska branch with the most experience in
implementation and use of e-procurement is Sweden.
The timing of the implementation of electronic procurement process, according to
Skanska Sweden, is as follows:
2004-2006: e-procurement (the responsibility for the activation of suppliers and the
improvement of the catalogue quality was handed over to a permanent
organisation by April 2006)
Started in fall 2005: sourcing tools for frame agreements
Started in fall 2005: e-invoice (implemented by IT organisation)
Fall 2006: request (support project specific sourcing)
2007: matching of e-invoice and e-order.
Skanska’s strategy is to increase coordination of procurement volumes; i.e. to buy more
on common contracts. The enterprise wanted, therefore, to start with the implementation
of a tool which could support this procurement strategy. Thus they started directly with
the implementation of e-procurement, and already in 2004, e-procurement represented
more than 75% of the procurement volume of Skanska Sweden.
In the design and supplier selection process, Skanska wished to work with an e-
procurement software provider that was capable of hosting the e-procurement platform
and also provide essential supplier activation and ongoing procurement consultancy
services. For this task, Skanska finally chose to contract the Swedish enterprise IBX as e-
procurement partner.
The implementation of the e-procurement solution began in Sweden at the beginning of
2004. Based on a SAP system, the implementation focused on two aspects: the internal
change management and the supplier activation.
The internal change management concentrated on employee training. By spring 2006,
the status was as follows (Aberdeen Group, Best Practices in E-Procurement, 2005 p.
31-33):
A total of 3,000 users had been trained in Sweden
1,000 users out of a total of 1,200 had been trained in Norway
675 users out of a total of 700 had been trained in Finland.

7/28/2019 Construction 2006
http://slidepdf.com/reader/full/construction-2006 94/182
Construction
94
The task of training Skanska personnel is divided between Skanska and the e-
procurement provider IBX, which is responsible for a “train-the-trainers” programme.
Skanska handles the education of super-users and normal users, using internal Skanska
personnel as trainers. The “train-the-trainers” programme includes approximately 20
hours of teaching. The reason for this strong focus on training is to support the internalchange management process in order to alter the traditional work-flow processes.
According to Skanska, the main challenge is that the entire enterprise and all employees
take part in the system and adhere to the implemented solution as they are going to use it
daily. The daily procurement decision is often made by site and line managers who are
situated in the individual construction sites. These managers have traditional
procurement work-flow processes that need to be aligned with the requirements of the e-
procurement solutions.
The other important aspect of the implementation of e-procurement at Skanska has been
the involvement of suppliers. The solution from IBX includes a supplier quality
programme where each supplier is rated on a scale based on the quality of the e-
catalogues uploaded to the Skanska e-procurement solution. This rating of suppliers
enables Skanska, in cooperation with the suppliers, to address the improvements needed
to achieve high quality e-catalogues. In addition, the supplier quality assurance feature of
the e-procurement solution also offers Skanska several different “call-off” methods. A
“call-off” method is the format/way a Skanska user interacts with the suppliers. Traditional
e-procurement buyer/supplier interaction takes place through an electronic product
catalogue. IBX personnel checks the uploaded supplier product catalogues continuously
to ensure the catalogues’ compliance with predefined standards for information,
description and alike.
According to IBX, this call-off method only covers 20-40% of the procurement. The
Skanska solutions also support, among others, free text call-offs where individual
customisations are communicated. In total, the Skanska e-procurement solution offers 9
different call-off methods and this increases the potential e-procurement flow to 90-100%
of all procurements. In Sweden, 145 suppliers to Skanska are currently interlinked with
the e-procurement solution using catalogues.
Impact
The positive impact of the introduction of e-procurement in Skanska is clear. In Swedenalone, new contracts signed in 2005 have generated about 5m euros in savings. The
impact on logistics can be illustrated by the fact that as of September 2005, about 50% of
Skanska’s total monthly procurement of goods and services in Sweden was flowing
through the e-procurement system. This figure is expected to reach 100% by the end of
2006.
The e-procurement system has allowed for greater transparency of spending as it
provides full documentation of the purchase orders. Furthermore, through the work
provided by IBX, e-procurement has had an impact on business relationships with
suppliers. The online catalogue updated by IBX is a way to maintain competition among
suppliers, who are continuously compared to each another. Thus, they have to make adifference if they want to obtain contracts with Skanska. That enables Skanska to have

7/28/2019 Construction 2006
http://slidepdf.com/reader/full/construction-2006 95/182
Construction
95
more influence over them and thus more discounts and favourable framework contracts
can be negotiated.
Moreover, according to Skanska, the transparency in relation to the supplier generates a
major impact on the procurement process of the enterprise. In fact, a better knowledge of
the procurement behaviour improves the sourcing process and thereby the procurement
organisation. In addition, higher contract compliance, a higher degree of procurement of
the right assortment and better e-procurement discounts can be achieved.
Lessons learned
The following lessons can be learned from the introduction of e-procurement in Skanska:
Internal change management with focus on employee training programmes is key
to successful implementation of e-procurement. One of the success factors of e-
procurement implementation was to have train-the-trainer programmes run by the
software provider and to hold internal training sessions for the rest of the staff.
Focus should be placed on system support with hotlines and other relevant help
initiatives. This will increase the amount of Skanska staff using the e-procurement
solution instead of traditional procurement methods (such as letter, e-mail, and
phone).
Top management dedication and support is essential for the roll-out and usage of
the system. If senior management supports the system, the employees will adopt
the new work-flow processes faster.
Focus on the creation of an efficient procurement department to centralise thelarger procurement projects and to support any e-tendering activities.
Communication of the benefits to all employees will help in the adaptation of the
programme.
Use key performance indicators (KPIs) on site and line management to increase
system utilisation. By using measurable indicators, senior management can
promote and support the usage of the system.
Based on the experiences gained in 2005-2006 the objective of Skanska Sweden is to
achieve 100% spending flow through the IBX system by the end of 2006.
References
Research for this case study was conducted by Anders Pennerup Gantzhorn, Ramboll
Management on behalf of e-Business W@tch. Sources and references used:
Interview with Per Finnhammar, Project Manager for the Skanska e-procurement project, IBX, 28. March 2006
Interview with Sandra Petersson, Business Development Purchasing, Skanska, 21June 2006
Interview with Farzin Saber, Professional Relations Manager, IBX, 28. March 2006
Interview with Pernille Bychdorf-Pedersen, Project Manager, IBX, 28 March 2006
Skanska Annual Report 2005

7/28/2019 Construction 2006
http://slidepdf.com/reader/full/construction-2006 96/182
Construction
96
Best Practices in E-Procurement, Aberdeen Group December 2005
Websites:
Skanska AB, www.skanska.com
IBX AB, www.ibx.se
Bouygues Construction, www.bouygues.fr

7/28/2019 Construction 2006
http://slidepdf.com/reader/full/construction-2006 97/182
Construction
97
C ASE STUDY : E-CONSTRUCTION , GREECE
Abstract
E-Construction was founded in May 2002 by the three largest Greek construction
enterprises in order to provide electronic B2B solutions. In February 2003, E-Construction
launched the first Greek construction e-marketplace, www.b2bconstruct.gr . This
construction e-marketplace offers three main e-procurement options, being a commercial
catalogue of products offered on the site, an e-sourcing solution and online auctions.
During its 3 years of operation (2003-2006) www.b2bconstruct.gr has supported
transactions of construction goods exceeding a value of 220m euros. As of 2006, 629
construction suppliers have subscribed to this e-marketplace.
The construction enterprises using www.b2bconstruct.gr have experienced better
communication between stakeholders through a more secure e-procurement system,
changes in their human resource policy as more IT skilled employees have been hired to
carry out procurement and reduced procurement costs.
Case study fact sheet
Full name of the enterprise: E-Construction SA
Location (HQ / main branches): Greece
Sector (main business activity): E-Marketplace
Year of foundation: 2002
Number of employees: 22
Turnover in last financial year: 701,300 euros (2005)Primary customers: Construction enterprises
Most significant market area: Greece
Focus of case study: e-procurement
Key words: Electronic B2B solutions, e-marketplace
Background and objectives
E-Construction SA was founded in May 2002 by the three main Greek construction enter-
prises in order to improve their procurement process. Elliniki Technodomiki, J&P Hellas
and Terna S.A. are all shareholders of the society (they hold respectively 37.5%, 37.5%and 25% of the capital) and are the main actors in the use and development of the e-
marketplace42.
E-Construction employs 22 people in 2006 and its turnover in 2005 exceeded 700,000
euros. The project was launched in 2002 due to the construction boom that was
generated by the – then forthcoming - 2004 Summer Olympic Games in Athens.
42 For more information on the participating enterprises, see www.etae.gr , www.jandp-group.com and www.terna.gr , respectively.

7/28/2019 Construction 2006
http://slidepdf.com/reader/full/construction-2006 98/182
Construction
98
The objective of E-Construction was to substitute traditional paper-based procurement
processes and call-off 43 methods with modern electronic solutions for both construction
enterprises and suppliers. In order to achieve this goal, the two first objectives were to
introduce and train the construction enterprises’ employees to the new e-procurement
process, and then to make the existing suppliers of these enterprises use the system byproviding training to them as well.
The efficiency of this solution was expected to be achieved though real-time information
dissemination improving communication between buyers and suppliers. Moreover, up-
dated electronic catalogues were envisaged to ensure quality of procurement on the
buyer side and to give construction firms reliable references for their procurement.
e-Business activities
In 2002, after having studied all the alternative e-procurement solutions, the three Greek
construction enterprises chose the Commerce-One SA44 platform (now PerfectCommerce SA) to develop their own e-procurement solutions based on this technology.
Commerce One was selected for its good usability, its security, and because the platform
was already widely used in many countries and known among clients. The next step was
to create the independent enterprise E-Construction SA and www.b2bconstruct.gr to
implement adaptable e-procurement solutions for the three construction enterprises.
The services provided by E-Construction SA can be divided in three main parts:
Commercial e-Catalogue
e-Sourcing
e-Auctioning
Furthermore, additional services such as direct e-mail campaigns or printed catalogues
have been introduced.
The Commerce One platform is based mainly on JAVA, XML, Visual Basic and SQL.
However, the electronic commercial catalogue differs from e-sourcing and e-auction as it
has been created and developed in Greece on the basis of ASP technology that
interfaces with an SQL server. The main feature of the electronic commercial catalogue is
to advertise supplier enterprises on the E-Construction platform. Each supplier is listed
with data including enterprise name, address, and other contact details, as well as itslogo and profile, in the product categories it chooses. 629 suppliers are registered in 120
different product categories. Through a search engine, a construction enterprise can find
all the suppliers that can provide a certain product. A supplier can also be found
according to its name or location. Thus, a construction firm can access a list of all
suppliers registered according to its search criteria.
Another important feature of E-construction is the e-sourcing element. The e-sourcing
solution developed by E-Construction SA was implemented first and is based on the
43 A call-off method is the way a procurer interacts with a supplier. E-procurement solutions uses avariety of different call-off methods including electronic commodity catalogues, online auctions,reverse online auctions, customised Q&A interaction and alike.
44 For information on Perfect Commerce SA, please visit: www.perfect.com

7/28/2019 Construction 2006
http://slidepdf.com/reader/full/construction-2006 99/182
Construction
99
Commerce One Platform. The e-sourcing process can be described as follows: First, the
construction enterprise fills out and signs electronically a form for the required product.
The enterprise then chooses the relevant suppliers from the electronic catalogue and
sends the request and form electronically to each of the suppliers through the platform.
The supplier receives the request and form via e-mail. Using the form which is now alsosigned by the supplier, an offer is submitted to the construction enterprise through the
platform. The construction enterprise can now easily compare the offers and make its
choice by sending an electronic order through the platform to the selected supplier.
The third important element of E-Construction is the e-auction feature. The goal of this
electronic solution is – for the procurer - to find the lowest possible price for a product.
The procedure of an e-auction runs as follows: Suppliers are first invited to participate in
an online auction for which they have usually already submitted an offer through the e-
sourcing process mentioned above. Then the purchasing enterprise defines the opening
price of the auction and the supplying enterprises are put into contest without any further
interference. An e-auction usually lasts 30 minutes but recurrent extensions of 3 minutes
are added every time a supplier bids during the last 3 minutes of the auction.
Furthermore, a supplier can underbid as many times as he wants. Finally, the order goes
to the lowest bid.
All these electronic procurement solutions have a cost that can be divided into two main
parts. First, both the supplier and the construction enterprise pay an annual standard fee.
The fee amounts to 1,500 euros for a supplier enterprise. The fee includes the registry in
the electronic commercial catalogue, the creation of an account for 2 users, training for
these users (1 hour), participation in the e-sourcing and e-auction services, and phone
support.
For the construction enterprises, the annual standard fee is between 3,000 and 10,000
euros depending on the size of the firm. This fee includes the creation of an account,
technical phone support and training (3 hours). Moreover, some fees are added for each
service: for example any new request costs 10 euros, and every new e-auction launched
costs 800 euros.
Impact
The implementation of E-Construction e-procurement solutions has many impacts for the
stakeholders of this process, both on the supplier and construction enterprises’ side. For the suppliers, the electronic commercial catalogue is a way to keep in touch with
construction enterprises. For instance, they can present their special offers through e-
mail campaigns. Furthermore, electronic transactions managed in a secure way enable
the establishment of a better business climate between the stakeholders.
Both the construction enterprises and the construction material suppliers experience the
changes that the electronic B2B solution brings to the workflow and the recruitment of
new employees. One of the main barriers for the implementation of e-procurement is the
conservative mindset of the employees on both sides. The traditional workflow processes
make the introduction of new electronic solutions time consuming and costly. As a result,
suppliers and construction enterprises are hiring people with IT skills to effectively use the
e-procurement processes.

7/28/2019 Construction 2006
http://slidepdf.com/reader/full/construction-2006 100/182
Construction
100
Yet the main impacts can be observed on the construction enterprises’ side. Their
procurement process has completely changed with the implementation of e-procurement:
the elimination of the paper-based process has generated fewer administrative tasks,
faster procurement processes and a higher security of transaction. Moreover, e-
procurement has an impact on costs, mainly due to the implementation of e-auctions: onaverage, the provision costs have been lowered by an 8% as a result of this switch.
One of the construction enterprises using the E-Construction portal is the Greek
enterprise J&P-AVAX. This enterprise started the implementation of the B2B system in
March 2003 and uses the system mainly for request for quotation (RFQ), material
sourcing and e-auctions. The use of the B2B platform has reduced the time required for
material sourcing by a third when compared to the usual RFQ procedure. This extra time
is now spent on better and more analytical order control and follow up systems.
According to J&P-AVAX, the platform has also lowered procurement costs, especially
when the e-auction process is used. However, no quantitative data are available at the
moment.
Currently, E-Construction aims at raising the number of suppliers and buyers and
creating a network abroad by connecting its e-marketplace to existing European
construction e-marketplaces. This development strategy is expected to lead to more
foreign suppliers and buyers, and hence a richer diversity of products and services on the
one hand, and a larger buyers base on the other hand.
Lessons learned
Based on the development and implementation of the e-procurement portal, thedevelopers (E-Construction) and its users have identified the following learning points:
One of the main barriers for E-Construction is the conservative behaviour of the
enterprises’ employees to adopt new electronic solutions.
In relation to the Olympic Games, for which E-Construction was originally
designed, problems arose as the solution was not implemented until 2004. The
result was that paper-based methods were still used during the construction
boom generated by the Olympic Games. The optimal solution would have been
to implement the e-procurement solutions prior to this boom thus providing the
maximum savings in terms of cost and time for both suppliers and contractors
Since building materials and other inputs to the sector are increasingly sourced
internationally, a sector-specific e-procurement portal must be international to be
really interesting to national procurers. In other words, the e-procurement portal
needs to have international suppliers in its product catalogues.

7/28/2019 Construction 2006
http://slidepdf.com/reader/full/construction-2006 101/182
Construction
101
References
Research for this case study was conducted by Anders Pennerup Gantzhorn, Ramboll
Management, on behalf of e-Business W@tch. Sources and references used:Interview with Key Accounts Manager Giannis Katsiaris, E-Construction SA, 2.June 2006
Case review and interview with Key Accounts Manager Giannis Katsiaris, E-Construction SA, 16. June 2006
Interview with George Gouloussis, Purchasing Administrator, J&P-AVAX SA, 27 June 2006
Websites:
E-Construction SA, www.b2bconstruct.gr
Perfect Commerce SA, www.perfect.com
4.1.8 Summary of main points and conclusions
Many large construction enterprises are working towards strategic procurement and
consolidation of the supplier base, using e-procurement in order to optimise prices and to
secure compliance with quality standards, terms of delivery etc. In addition to the 2005 e-
Business W@tch sector study on the CI, this year’s study shows that change
management is a key element of a successful implementation of e-procurement systems
in a construction enterprise. The case study of Skanska supports this point. The changemanagement process should be driven by strong and dedicated senior management, and
focus should be on employee training.
As indicated in exhibit 4-2 (in Section 4.1.3) it is mostly large enterprises which use e-
procurement systems. This may indicate that the business case for e-procurement
implementation in large enterprises is now established. However, many construction
SMEs do not utilise the opportunities provided by e-procurement. It is still difficult for
construction SMEs to identify a solid business case for e-procurement due to the lack of
ICT skills and due to the volume and investment requirements associated with custom-
made e-procurement solutions. Because of these barriers, it is more likely that the short-term developments in the SME segment will be driven by suppliers’ networks, involving
building material providers and/or producers and the like.
Thus, for e-procurement to be interesting for European construction SMEs, it could be
argued that e-procurement solutions need to be more affordable, easier to use, and web-
based. Some of the data from the survey presented in Chapter 3 support this conclusion.
For example, SMEs are spending less on ICT and have more often difficulties drawing
funds for ICT investments compared to large enterprises (cf. Exhibit 3-4). Furthermore,
only few SMEs employ ICT practitioners (compared to larger enterprises), and fewer
SMEs send employees regularly to ICT training measures (cf. Exhibit 3-3). Thus, smaller
companies normally do not have the same e-skills base as their larger counterparts; for e-procurement systems (and ICT systems in general) to be accepted by them, these
systems will need to be more user-friendly and affordable.

7/28/2019 Construction 2006
http://slidepdf.com/reader/full/construction-2006 102/182
Construction
102
As discussed is Section 4.1.4, the advantages of framework contracts and single
sourcing in normal e-procurement situations may not be applicable to well-defined
construction purchases conducted by large construction enterprises. Such cases may be
better suited for an e-tendering process. The case study of E-Vergabe supports this
finding. In these cases, an e-tendering procedure may yield better economies of scalethan framework contracts.
The public sector is also a driver. The public e-procurement solutions are, however,
currently focused on the initial steps of the procurement process i.e. notification of public
tenders online and e-tendering, with the aim of increasing transparency in the public
procurement process.
4.2 3D technology
4.2.1 Introduction
3D technologies (also called Building Information Modelling or BIM) are used in the CI as
a tool to generate three-dimensional drawings, plans and construction outlines, and to
improve communication among construction project stakeholders (Yeomans 2005, p. 21).
This section will present the current use of 3D technology and subsequently analyse the
potential benefits, barriers and business implications for implementation of 3D technology
in the CI. It will be discussed how 3D technology can be used to optimise the preliminary
stages of the construction process – the design and estimation phase and technologicalplanning. Among other things, the ICT skills requirement for 3D technology are analysed
and a special section on the development for interoperability standards is presented. The
case study of the Lithuanian-based construction enterprise Constructus illustrates the use
and benefits of 3D technology. Furthermore, this section looks into the current use,
benefits, barriers and business implications of 3D technology in the CI.
It should be noted that the discussion on interoperability standards is also relevant for the
sections of e-procurement and project webs (Sections 4.1 and 4.3, respectively).
4.2.2 Definition of 3D technology
3D technology is part of a digital construction process, where all elements of a specific
construction project are created and stored in a digital three-dimensional model. 3D
technology can be used by the main stakeholders when planning, designing and
constructing buildings and infrastructure. A 3D model can give a full overview of the
building and generate an “as-built” database that can be handed over to other
stakeholders in the construction process (Tredal & Johnsen 2005, p. 8).
A traditional paper-based or electronic 2-dimensional model cannot provide the
stakeholders in a construction project with a fully fledged virtual model of a building with
all the necessary data attached to the drawing before starting the actual execution of the
project. 3D technology can provide faster quantity extraction, easier evaluation of
construction methods and faster communication with the contractor or other stakeholders

7/28/2019 Construction 2006
http://slidepdf.com/reader/full/construction-2006 103/182
Construction
103
(Terry 2005). Exhibit 4-10 illustrates an example of a user interface in a 3D technology
solution for the CI.
Exhibit 4-10: User interface in a 3D technology solution
Source: www.construcware.com, 12 April 2006
3D technology can provide stakeholders with an overview of the building’s attributes and
can identify weak points in the construction or irrational construction planning.
Furthermore, some 3D technology software can extract information on the number of
construction elements used in a specific project. The building objects can be pre-defined,
but with flexibility in type and position to allow for change in construction design. Instead
of data being static as in 2D models, data in a 3D model can be used in a parametric
manner (Interview with Eric Bessone, March 2006) (Tredal & Johnsen 2005, p. 8). As
illustrated in the Constructus case study described below, 3D technology can be used to
simulate various construction phases and foresee potential obstacles. In addition to theillustration of the attributes of a construction project, a 3D technology solution can also be
used to visualise the exterior and interior of a construction project. Exhibit 4-11 illustrates
this kind of visualisation.

7/28/2019 Construction 2006
http://slidepdf.com/reader/full/construction-2006 104/182
Construction
104
Exhibit 4-11: Visualisation using 3D technology
Source: Graphisoft, used by the California Academy of Sciences Project for Webcor Builders, Inc.
Some of the key issues in relation to the usage of 3D technology are illustrated by the
following two business examples on the software providers Autodesk France and
Micrograf.
Bu s i n e s s e x am p l e
Au t o d e s k F r a n c e – o n l i n e s o l u t i o n s f o r t h e c o n s t r u c t i o n
i n d u s t r y
Autodesk provides a selection of different software products to their customers such as AutoCAD, Architectural Desktop and Revit. The purpose
of the software is to enable various stakeholders in the CI to exchange data
and collaborate using a shared online platform.
The following key issues in relation to the online solutions were highlighted
by Autodesk:
- BIM or 3D technology can reduce risks and miscalculations, thus leading
to cost reductions in construction projects;
- It is mainly the building/ construction owners who have started to see
benefits from using and implementing 3D technology software in
construction projects;
- Barriers to 3D technology uptake include a conservative culture and
organisational behaviour and management approach;
- SMEs generally lack ICT capabilities, which poses barriers to the uptake
of 3D technology;
- The issue of interoperability and standardisation is seen as another
barrier. In France, governmental institutions are now pushing for more
Industry Foundation Classes formats (IFC) when exchanging data.
Autodesk sees IFC standards as a good way to share data. Owners and
governmental institutions have begun to make demands on the use of
more digitised data exchanges.
Source: Interview with Eric Bessone, Sales Manager, Building Solutions
Division, Autodesk France, March 2006 (summary)

7/28/2019 Construction 2006
http://slidepdf.com/reader/full/construction-2006 105/182
Construction
105
Bu s i n e s s e x am p l e
M i c r o g r a f – a d i s t r i b u t o r o f 3D t e c h no l o g y
Micrograf is the distributor of Autodesk software in Portugal. In an interview
with e-Business W@tch, Mr. Oliveria, Business Development Manager,
highlighted:
- Architects are using 3D technologies more than construction enterprises.
- There is huge impact and potential in using 3D technology as a tool for
collaboration in the CI.
- Using 3D technology can help the industry and its stakeholders avoid
errors and miscalculations, the two sources that contribute to additional
costs to the construction project. Micrograf estimates that 40% of the total
investment is wasted by errors due to poor communication, which can be
reduced by using 3D technology.
Source: Interview with Rui Oliveria, Business Development Manager,Micrograf, Portugal, March 2006 (summary)
4.2.3 Use of 3D technology in the construction industry
A commercial breakthrough is currently underway in countries where the use of ICT in the
CI is already well developed. As an example, the Nordic region is at the forefront, but the
technology is also gaining ground in other European regions.45 As seen in the case study
of Constructus, diffusion and penetration of 3D technology in Lithuania is limited to a
small number of CI enterprises. This also seems to be the case in other Eastern
European countries.
Based on data from the 2006 e-Business W@tch Survey (see Section 3.4.2), adoption of
collaborative design processes and forecasting of demand are still rare in the CI and the
10 sectors studied this year by e-Business W@tch. Breaking the numbers down by size-
band, “collaborative design processes” and “collaborative forecasting of demand” have
been adopted by about 1 in 20 micro enterprises; whereas 29% of large enterprises use
collaborative design processes and 32% collaborative forecasting of demands (see
Exhibit 3-14).
According to a recent study, the use of 3D technology is not widely diffused and is mainly
used on large projects, but the technology has the potential to enhance project
collaboration and help prevent change in orders due to interference fits for most project
sizes (CMAA 2005, p. 17). This study also showed that about half of the stakeholders
surveyed did not use 3D technology, about 40% used it selectively, one in ten used it on
most of their construction projects and only one in twenty used it on all their construction
projects (CMAA 2005, p. 17). In fact, other industry experts argue that most design
communication in the CI today is still done through 2D drawings or traditional text
documents (Evans 2003). This finding is also confirmed by another recent study, where
the issue of overcoming the 2D vs. 3D working culture was used to explain why
construction enterprises are not undertaking more 3D work (Yeomans 2005, p. 79).
45 Interview with Industry Sales Director Steen Læssøe, Bentley, February 2006

7/28/2019 Construction 2006
http://slidepdf.com/reader/full/construction-2006 106/182
Construction
106
The uptake and use of 3D technology in the CI is also affected by the IT vendors
producing the 3D technology software because the availability and usability is important
for especially SMEs’ purchasing decisions. Exhibit 4-12 lists some of the important 3D
technology providers. There is a variety of 3D technology software providers located
primarily in Europe and North America. Many of these software providers also produce3D technology software for other industries than construction (e.g. for the computer
games, automotive and aerospace industries).
The business example presented below further elaborates on the current implementation
of 3D technologies in the CI:
Bu s i n e s s e x am p l e
Be n t l e y – 3D mo d e l l i n g t e c h n o l o g y f o r t h e c o n s t r u c t i o n
i n d u s t r y
Bentley is a global software provider in the area of 3D modelling and BIM. In
an interview with e-Business W@tch, Mr. Læssøe highlighted:
- The use of 3D technology in the CI is still limited but is expected to grow.
- The market for BIM solutions is growing and an increasing number of
enterprises are starting to see the advantages of using these solutions.
- Lack of interoperability and standardisation is a barrier for the uptake of
3D technology.
- The main business impact is improvement of the design phase and risk/
cost reduction.
Source: Interview with Steen Læssøe, Industry Sales Director, Bentley,
February 2006
Exhibit 4-12: Non-exhaustive list of IT vendors of 3D technology software
Name Country Website
Autodesk U.S.A. www.autodesk.com
Bentley Systems U.S.A. www.bentley.com
BouwASP The Netherlands www.bouwasp.nl
Cycas Germany www.cycas.deCymap United Kingdom www.cymap.com
Graphisoft Hungary www.graphisoft.com
Leica Geosystems Sweden www.leica-geosystems.com
Nemetschek Germany www.nemetschek.de
PointLine Switzerland www.pointline.com
Scia Belgium www.scia-online.com
Star Informatic Belgium www.star.be
Tekla Finland www.tekla.com
Source: Desk research, Ramboll Management, March 2006

7/28/2019 Construction 2006
http://slidepdf.com/reader/full/construction-2006 107/182
Construction
107
4.2.4 Potential benefits of 3D technology
The benefits from introducing 3D technology in the CI should be seen in the light of the
losses resulting from design and construction errors and the lack of communication
between stakeholders in the construction value chain. The losses generated by errors inthe communication process between different stakeholders may amount to as much as
40% of the total investment of a construction project (Interview with Rui Oliveira, March
2006 and the NCC business example). In addition, the use of 3D technology for the
construction of prototypes is expected to reduce waste and number of revisions
(Yeomans 2005, p. 21). 3D technology enables architects, engineers and construction
enterprises to make simulations of buildings in the project planning phase, and thus
improvements can be introduced from the start of a construction project.
The following business example further highlights the potential benefits of 3D technology
on time management and cost control. The business example highlights the learning
point from the Scandinavian construction enterprise NCC in the construction of auniversity building:
Bu s i n e s s e x am p l e
3 D t e c h n o l o g y a t NCC C o ns t r u c t i o n ( De nm a r k )
NCC Construction used 3D technology on the construction of a 4m
euros/4,000 m2
university building project. The original schedule was
planned with typical Computers and Information Technology (CPM)-based
software. The problems were then analysed using 3D technology which
revealed inefficient use of time and subsequent risks arising from this lack of time management. Problems such as unsynchronised schedules, uneven
start-ups and durations, and many tasks in the same locations were
highlighted using 3D technology. The construction schedule was
streamlined, resulting in better time usage, more synchronised critical
activities and a more feasible schedule. The benefits were:
• A cut in project duration of 8 weeks
• A weekly reduction in overhead costs of 5,000 euros (management,
electricity and heating of facilities)
• A 30% decrease in resources spent.
Source: Graphisoft, 12 April 2006 (summary)
A construction project traditionally requires transfer of building models and construction
design plans from the architect to the building engineering and construction enterprises.
The document flow between architects and engineering/construction enterprises means
that architects do not receive cost feedback from the engineering/construction enterprises
until they have had the opportunity to review the forwarded plans. This process is time-
consuming and has a high potential for errors. The architects often keep on designing
and redesigning the building even if construction plans are under revision by engineering/construction enterprises, resulting in the risk of rework in the case of cost-driven design
changes promoted by the engineering/construction enterprises.

7/28/2019 Construction 2006
http://slidepdf.com/reader/full/construction-2006 108/182
Construction
108
The above problem can be limited by using 3D technology. Design changes evaluated on
the basis of their actual “costs of correction” (Cost-driven design) and construction
changes can be implemented into the 3D model in real time, reducing the construction
period and costs (Yeomans 2005, p. 32). Through the use of 3D technology, construction
design and cost estimation can be seen as one ongoing parallel process.
In addition to the abovementioned benefits, a 3D model can gradually be upgraded
during the design phases to include more data as the design progresses. This results in
cost estimates of increasing accuracy. As seen in the Constructus case, 3D technology
can be used to calculate the expenditure capacity of a construction project and create
precise working plans.
Another important benefit of 3D technology concerns construction SMEs working as
subcontractors. In traditional construction projects, subcontractors are often vulnerable to
the effects of incomplete design documentation, schedule starts/stops and ex-post legal
claims. The use of 3D technology creates a more predictable work environment. Studiesconducted by IT providers have shown that the implementation of 3D technology can lead
to a decrease in sub-contractor costs of 5%-20% (Graphisoft, www.graphisoft.com, April
2006).
The following business example of Raiffeisen Real Estate (Real estate developer),
Strabag (Construction enterprise) and 4D Books (Engineering services) from Hungary
further sheds light on the benefits of 3D technology:
Bu s i n e s s e x am p l e
Ra i f f e i s e n / St r a b a g /4D Boo k s
Raiffeisen Real Estate, a real estate developer in Hungary that works with
construction enterprises, and Strabag Hungary, the Hungarian branch of a
leading construction enterprise in Central and Eastern Europe, both work
with 3D technology provided by 4D Books.
4D Books is a Hungarian-based enterprise providing engineering services to
the Hungarian construction market. Created in 1992, the firm has provided
3D services since 1995. 4D Books employs 22 people in 2006 and had a
turnover of 440,000 euros in 2005. “Virtual Construction”, currently the main
service provided by 4DBooks, deals with the creation of 3D models based
on available paper-based and electronic documentation of a construction project. The 3D model developed for each construction project includes the
architecture plans and statistics concerning the mechanical and electricity
engineering (such as the protecting piping, the quantity and the budget of
each material used for instance).
The cost of 4D Books services amounts to about 1.5% of the net cost of the
construction project. The cost savings generated by ”Virtual Construction“
could reach 7- 8% of total construction cost.
Raiffeisen Real Estate’s objective when implementing 4D Books’ services
was mainly to reduce management hours spent. The main objectives of
Strabag were to study the technical feasibility of a project and find the errors
and the exact quantities needed before the construction phase.
7/28/2019 Construction 2006
http://slidepdf.com/reader/full/construction-2006 109/182
Construction
109
According to Raiffeisen Real Estate the main impact of 3D technology
implementation was:
- Improved communication between stakeholders through the 3D Model
which generates up-to-date information
- Better transparency and traceability of data
For Strabag the use of 3D technology had the following benefits:
- Fewer people were needed for administrative tasks since all information
was automatically gathered using the 3D model.
- 3D technology enables optimisation of the subdivision of tasks and of
the coordination of work.
Sources: Interviews with Mr. Gábor Sziegl, managing director of 4D Books,
April 2006, with Jozsef Takacs, Raiffeisen Real Estate, May 2006, and with
Robert Varga, Strabag Hungary, June 2006
4.2.5 Barriers
Last year’s e-Business W@tch sector study on the CI identified a number of barriers to
the uptake of 3D technology in the CI. The barriers included cultural barriers towards new
ICT possibilities and a lack of ICT capabilities, especially among construction SMEs. This
year’s study finds greater uptake and use of 3D technologies among architects, while
other stakeholders such as engineers and contractors in the value chain are still not that
familiar with 3D technologies (Yeomans 2005, p. 21) (Interview Steen Læssøe, February
2006)The uptake of 3D technology may also be hampered by the lack of clearly communicated
benefits of using 3D technology. Many construction enterprises are currently using 2D
technology and have a long, proven track record with this technology. In addition, some
construction enterprises cannot envision a clear business case for the adoption of 3D
technology, i.e. the costs in the short term versus the long-term positive effects of a 3D
technology investment.
The full benefits of advanced 3D technology solutions require interoperability between
different internal systems in the organisation. The building material list generated on the
basis of advanced 3D models can be integrated into the enterprises' Enterprise ResourcePlanning (ERP) system, and hence be fully integrated with procurement, logistics, and
inventory systems. It is, however, important to notice that the findings from the survey
presented in Section 3 indicated that only about 15% of the responding enterprises
reported having ERP systems. Thus, the benefits of material list integration with ERP can
currently only be reaped by a limited number of enterprises.
These features, however, require a data transfer standard. Such a data interchange
standard could be the IFC standards. The main goal of this standard is to improve the
exchange and share of information between different systems and software. Lately, IFC
have been supported by national public services (Pro IT News 2006) (Medi@construct
2004). For example, the French public sector has begun to promote the IFC standard inbuilding projects to avoid design and construction errors (Business example with
Autodesk). Whether the implementation of IFC standards could act as a barrier to the

7/28/2019 Construction 2006
http://slidepdf.com/reader/full/construction-2006 110/182
Construction
110
development of 3D technology is, however, still to be more closely investigated. Some
studies argue that the use of international data standards such as the IFC will hamper the
innovation of 3D technology and slow down the development of new software
applications, because the standards will be outdated once they are finished, due to the
long negotiation required.
The uptake of 3D technology may also be hampered by the lack of technical capacity,
especially within the area of broadband internet. A broadband connection is necessary to
effectively communicate 3D technology drawings and blueprints between stakeholders.
As analysed in Section 3.1 about 6 in 10 enterprises have a broadband internet access.
Looking at enterprise sizes, about 4 in 10 SMEs do not have the necessary internet
capacity to operate 3D technology, meaning that their ICT system cannot handle the
exchange of drawings and documents necessary to fully benefit from 3D technology.
This is, however, only a barrier if construction SMEs normally working as sub-contractors
want to be able to work actively with the 3D model. If they, on the other hand, want tocontinue with the traditional workflow processes, the 3D technology drawings and
blueprints can be transformed into traditional 2D drawings that can be easily
communicated over via e-mail.
4.2.6 Business implications
The introduction of 3D technology affects the European CI value chain. The impact in EU
´Member States is furthermore affected by factors like public support/legislation and
differences in industry structure.
The effect of 3D technology on construction stakeholders should be seen in connection
with legislation initiatives in some EU Member States to promote the use of 3D
technology. Some MS act as front runners in the promotion of 3D technology. E.g.
Denmark has put in place a law that, as of January 1, 2007, imposes the use of 3D
technology on all public construction projects. This law is expected to increase the uptake
of 3D technology among Danish construction enterprises (and among some non-Danish
construction enterprises operating in Denmark). There are indications that countries such
as Norway and Sweden are to follow the Danish example of imposing the use of 3D
technology in public construction projects. Another legislative implication can be found in
France where the uptake of 3D technology has been hampered by French law prohibitingconstruction enterprises from doing the conceptualisation of a construction project in-
house46. Thus, architects and engineering enterprises were the only driving forces of 3D
technology uptake in France. These examples illustrate the amplitude of the impact of
national law on the uptake of 3D technology.
Differences in the set-up of the CI between Member States also have an impact on the
uptake and introduction of 3D technology. Some Member States, such as Denmark and
France, have a divided industry where the stakeholders such as engineering and
architects are part of individual enterprises which cooperate with each other in
46 Law number 85-704 du 12 juillet 1985 relative à la maîtrise d'ouvrage publique et à ses rapportsavec la maîtrise d'oeuvre privée” has been amended through Ordinance no. 2004-566 of 17.June 2004

7/28/2019 Construction 2006
http://slidepdf.com/reader/full/construction-2006 111/182
Construction
111
construction projects. In other Member States, such as Sweden, architects and engineers
are typically part of the same enterprise. This affects how the value chain works in the
different countries. In countries where a construction enterprise is expected to
encompass both engineering and architecture, construction SMEs will act more as sub-
contractors to large construction enterprises, and thus use the 3D application chosen bythe main contractor. This means that 3D technology solutions are currently limited to
situations where a project’s main contractor is responsible for most of the construction
process including architecture and engineering (European Commission 2004, p. 11).
In connection with the discussion on e-standards and interoperability brought forward in
Section 3.3 of this study, the following fact box will briefly provide information on the
status of different interoperability initiatives:
F a c t b o x
S t a t u s o f w o r k t o w a r d s I n t e r na t i o n a l I n t e ro p e r a b il i t y
s t a n d a r d s f o r t h e C I Efforts are being made to create international interoperability standards
within the CI.
The International Alliance for Interoperability (IAI) is the main organisation
creating and distributing interoperability standards mainly within the CI. The
IAI is an alliance of organizations, software companies, building product
manufacturers, information publishers, owners, designers, and builders — in
the CI and other related industries - whose goal is to develop a universal
standard for information sharing and interoperability of intelligent digital
building models developed towards all phases of the building life-cycle(planning, design, pre-construction, construction maintenance and alike).
Since 1995, the IAI has developed and published a series of Industry
Foundation Classes (IFCs). The current version of the IFCs has been
approved by the International Standards Organization (ISO) as an
international standard.
IFCs are recognized international standards that provide an organized
structure for construction-related data. Use of IFCs, for example, would
enable a construction material manufacturer to provide its product data in a
format that can be inserted into a computer aided design program (CAD).
This "intelligent" product carries data about its properties, such as
dimensions, materials, strength, energy performance, fire rating, code
compliance, applicability, cost, availability, and source. Appropriate property
data about the window can then be exchanged with downstream
applications such as cost estimating and energy analysis (www.building-
connections.info, August 2006).
For further information on international interoperability standards visit:
- International Alliance for Interoperability – www.iai-international.org
- European Committee for Standardization (CEN) – www.cenorm.be

7/28/2019 Construction 2006
http://slidepdf.com/reader/full/construction-2006 112/182
Construction
112
Exhibit 4-13: List of organisations working for standardisation and data exchange standards
activities in the CI (Non-exhaustive)
Organisati
ons Planning DesignPre-
construction
ConstructionTenant
Improvements
Close
-out
Ongoing
operations
AISC
ASHRAE
Autodesk
BLIS
FIATECH
gbXML
Graphisoft
IAI
IFMA ( ) ( ) ( ) ( )
MIMOSA
NavisWorks
NFRC
NIBS
NIST
OSCRE ( ) ( ) ( ) PISCES
Primavera ( ) ( ) ( ) ( ) ( ) Solibri
W3DC
Source: www.building-connections.info, August 2006
There are indications which point towards a possible change in the balance between the
large and small construction enterprises in the value chain. The uptake of 3D technology
solutions is mainly driven by architects and engineers and then introduced into large
construction enterprises. The natural next step would be to promote 3D technology to
smaller construction subcontractors (usually SMEs) but this may prove more difficult.
Construction SMEs, operating as subcontractors or independent contractors, may have
difficulties in meeting the ICT skills requirements needed to interact and fully benefit from
the use of 3D technology. This means that, even if the architects / engineers and largeconstruction enterprises have integrated 3D technology, the sector’s SMEs might not be
able to gain the same economic benefits of 3D technology implementation. Taking into
account the limited ICT skills present in some construction SMEs (see exhibit 3-3), the
economic incentive and motivation may not be present.
The following pages feature a case study on the use of 3D technology in the Lithuanian
construction enterprise Constructus. This enterprise is the first Lithuanian construction
enterprise to introduce 3D technology, and the case study supports the analysis of this
section by highlighting the cost savings and the barriers to uptake of 3D technology in the
CI. The second case study is that of the Norwegian construction project Akershus
University Hospital where both 3D technology and IFC standards were used.

7/28/2019 Construction 2006
http://slidepdf.com/reader/full/construction-2006 113/182
Construction
113
C ASE STUDY : CONSTRUCTUS , LITHUANIA
Abstract
Constructus UAB is a large construction enterprise in Lithuania. It operates exclusively in
the Lithuanian market and provides various construction-related services. In 2004,
Constructus implemented a new e-business tool in its productivity processes called SAS
Programinis Paketas47
based on 3D technology. This Lithuanian-made software allows
construction project developers to integrate and coordinate the main preliminary stages of
construction – design, estimation, and technological planning. Based on the 3D model,
developers can speed up their work and save expenditures in developing, coordinating,
and adjusting construction design.
The software was used for the first time in the 2004-2005 PET Factory construction in the
city of Klaipeda. The software allowed improvements in planning, management of
production processes, and logistics.
Case study fact sheet
Full name of the enterprise: UAB Constructus
Location (HQ / main branches): Vilnius, Lithuania
Sector (main business activity): Construction related services
Year of foundation: 1994 (renamed in 2003)
Number of employees: 70 (2005)
Turnover in last financial year: 28.37 million euros in 2004
Primary customers: Private real-estate developers, private enterprises,banks, municipalities
Most significant market area:Designing and building industrial, commercial and
residential estates
Focus of case study: 3D technology
Key words: 3D model including time management
Background and objectives
UAB Constructus was founded in 2003 when the construction and project management
enterprise Skanska decided to exit the Lithuanian market. The shares of the enterprise
are now owned by a group of Lithuanian investors. The main activities of Constructus
comprise commercial, residential, industrial and civil construction. The enterprise
employs more than 70 people (2005), mostly project and construction managers,
engineers and other construction specialists.
Constructus operates only in the Lithuanian market with local clients The Lithuanian
construction market is facing rigid competition which has forced construction enterprises
to look for ways to lower production costs. In 2004, Constructus decided to implement the
47 SAS stands for Samatu Amortizuotas Sudarymas – a Lithuanian-built software package tocalculate estimates and create design. It was developed by the enterprise called SES (statybuekonomiai skaiciavimai), also responsible for a programme named SES2000 and SES2004(new version) – which is used only to calculate costs. SES2000 is part of SAS softwarepackage.

7/28/2019 Construction 2006
http://slidepdf.com/reader/full/construction-2006 114/182
Construction
114
e-business application SAS Software Package in its production processes. The main
motive for investing in the software was to improve the enterprise’s competitiveness in
the local market. So far, Constructus is the only enterprise in Lithuania using such 3D
software-based technology in construction. Constructus hopes that with the use of this e-
business tool, their construction projects will benefit from:
Improved planning capacity
Ability to anticipate and avoid mistakes during the construction project cycle
Better control of the process of construction while improving interoperability.
The above improvements can not be attributed to one single feature of the software, but
is rather a result of the use of all the features of the programme. These features are listed
in Exhibit 4-14 below:
Exhibi t 4-14: SAS Software Package features and benefits for Const ructus
SAS Software Features Benefits for Constructus
3D model visualisation Architects/engineers/clients can visualise the final product anduse component modelling. Furthermore, they can follow stagesof the production and modify the building design in real time
All-in-one data storagecapacity
Efficiency and improved interoperability of having buildingplans/drawings/working plans in one place and in one format.Convenience for project managers, architects, suppliers andother stakeholders of construction.
Component modelling Changing components in a building is easy and is reflectedimmediately in the final plans, drawings, prices and workschedules of the project manager.
Expenditure calculation The new final price is calculated every time changes are made
to the building; advantages of cost control of a project and theability to modify costs/prices during component modellingstage and directly on a final ‘invoice’.
Creation of precise workingplans
Automatic production and updating of work schedules; anychanges in the construction process will result in subsequentwork schedules being updated immediately with appropriatenew delivery times, supply orders, execution dates.
Comparing with alternatives(still being developed)
Ability to visualise and compare a number of whole buildingprocesses and final structures. Useful for comparingcompletely separate designs, different strategic decisions of building similar or different buildings.
Source: Constructus 2006
Most of the stakeholders of the construction process are expected to benefit from this e-
business tool by improving their effectiveness and efficiency of work. However, it is
argued by Constructus that, in the end, the building owner will benefit the most - through
a lower total construction price achieved by using the 3D technology to secure faster
planning and construction of building projects.
e-Business activities
Currently, the 3D model is not entirely finalised as parts of it are still being tested and
modified. However, since 2002, other parts of the system have been regularly used inmost of the Constructus assignments. In June 2004, the creation of a 3D model was
initiated by a consortium comprised of UAB Constructus, UAB INRE and “Statybų

7/28/2019 Construction 2006
http://slidepdf.com/reader/full/construction-2006 115/182
Construction
115
ekonominiai skaičiavimai (SES)“ – all local enterprises. The partners have contributed to
this 3D model by bringing in their individual experiences with:
the use of Bentley Systems software (INRE)
the use of the SES 2000 (SES’s own product)the creation of a 3D model (Constructus)
The 3D model is based on a 3D model concept supplemented by a capacity to estimate
the expenditure of construction, the ability to create/modify exceptionally precise work
schedules, and the ability to compare structural building alternatives based on price and
materials used (this type of 3D model is sometimes referred to as a “4D model” because
of the inclusion of the “time” dimension).
Exhibit 4-15: 3D model used in Vilnius Municipality Bui lding construction (2004)
Source: Constructus 2006
The 3D model part of the application was prepared by UAB INRE. In addition to providing
traditional information database and visualisation use for architects and project managers
(PMs), this part of the programme also allows for “component modelling”. This meansthat each separate part of the 3D model can be changed or modified. For example, the
wall structure can be altered in size or material used, or it can be replaced with pillars.
Such changes will immediately be reflected in the overall building plans, drawings,
visualisations, safety descriptions and the final cost of production.
The 3D model has been used successfully for the Vilnius Municipality building
construction which took place in 2002-2004. The real innovative features of the SAS
application are:
The expenditure calculation capacity of the model
The ability to create precise working plans.
This allows the PM to explore different alternatives of different materials, construction
types in the process of building and viewing expenditure changes in real time. This part of

7/28/2019 Construction 2006
http://slidepdf.com/reader/full/construction-2006 116/182
Construction
116
the software was developed using an existing SES 2000 cost estimation programme and
connecting it to the existing database of raw materials, prices and quantities.
The 3D model has been used by Constructus since 2002. The improved 3D model was
tested for the first time in a recent Constructus assignment – the 2004-2005 Klaipėda
PET Factory construction (Klai-PET). In total, almost 145m euros were invested in the
PET factory, of which more than 33m euros have been allocated to the construction and
technology installation work performed by Constructus.
The use of 3D technology specifically involved on-site work foremen, material suppliers
and subcontractors (more than 70 at times), construction workers (about 1000), post-
construction building installation suppliers, the client himself and other stakeholders in the
process.
Impact
The specific advantages can be attributed to the use of the 3D model during the Klai-PET
factory construction. The advantages were:
The 3D model was used to position the 500 ton capacity cranes in order to
maximise their ability to lift up to 125 ton structural loads to a height of 14 metres.
This process and its obstacles were simulated, which helped the engineers on the
ground responsible for the execution.
Exhibit 4-16: Positioning of the crane in Klai-PET factory construction using 3D model
Source: Constructus 2006
The 3D mappings and diagrams were handed over to the subcontractor AG
Zimmer (Germany), who was in charge of the technical installation of the factory. It
allowed the contractor to determine whether the proposed construction was
suitable for the specific equipment to be placed inside.
The 3D model visualisation was also an information source for the client who couldsuggest changes on-the-fly and see the effects of alterations immediately.

7/28/2019 Construction 2006
http://slidepdf.com/reader/full/construction-2006 117/182
Construction
117
The project team was able to use the model to create working schedules. The
managing team decided to connect the 3D model to the Microsoft Office Project
2003 programme using Bentley Navigator software. It was useful in this project
because there were four different physical work locations. These four work
locations needed an individual specific flow of material and manpower. Theintegration of project management software in the 3D model facilitated the
development of clear timetables for the demand of materials and manpower at
each of the four separate work locations.
In addition, the use of the 500 ton capacity crane brought down from Finland had to
be planned very precisely because of high rental costs and the complexity of the
assignment.
According to Constructus, the initial working plan of 1,200 positions was increased
to 3,500 positions using the 3D model after running a number of simulations.
Overall, Constructus suggested that in this particular project the 3D model allowedmost of the savings to be made in the building design phase, streamlining of
materials supply and overall organisation of works. The avoidance of potential
mistakes also served to reduce potential extra costs of the project. As a result, the
PET factory was built at a relatively fast pace and within 18 months.
It is still too early to draw general conclusions on Constructus’ 3D technology benefits as
the new version of the SAS software package has only been tested in one assignment.
However, based on this example and the experience of similar products abroad,
Constructus predicts that use of the SAS software can save up to 40% of the time used to
plan construction works and to estimate the final expenditure of the project. The 3D
technology used by Constructus can also be used in connection with maintenance of
finished construction projects. Constructus sees this as a major selling proposition
towards future clients. Using 3D technology, Constructus would furthermore be able to
maintain and renovate the building at lower cost than traditional building maintenance.
Lessons learned
The experiences gained from SAS in Constructus so far indicate advantages both in the
planning and implementation phases of projects. Cost savings can be achieved
especially in terms of time required to plan the assignments. It is also essential to note
that the 3D model is not used by any competitor, which gives the enterprise a competitiveadvantage in the domestic construction market (at least in the short term). To retain this
position, Constructus is planning to make SAS software an inherent part of its services,
offered to clients at no extra cost. The enterprise believes, however, that the competitive
advantage of such a tool will encourage other firms in the Lithuanian market to look for
similar e-business solutions for improving efficiency of their construction processes. The
developers have not noticed any major drawbacks of the 3D model yet.
References
Research for this case study was conducted by Simonas Vileikis, Ramboll Management Brussels, on behalf of e-Business W@tch. Sources and references used:
Written interview with Laura Kurselyte, March 2006

7/28/2019 Construction 2006
http://slidepdf.com/reader/full/construction-2006 118/182
Construction
118
Constructus enterprise brochures 2005 (Constructus, PET Factory construction)
Presentation: Kompiuterinis statinio modeliavimas: architekt ūrinės, konstrukcinės ir
technologinės dalies parengimas, statybos proceso ekonominis į vertinimas ir
planavimas. Dr. Vladimiras Popovas, Saulius Mikalauskas, Darius Migilinskas.
Vilnius November 1. 2005
Websites:
Constructus, www.constructus.lt
Government of the Republic of Lithuania,
www.lrvk.lt/main_en.php?id=en_aktualijos_su_video/p.php&n=122
EC DG Regio; Structural Funds in Lithuania
http://europa.eu.int/comm/regional_policy/atlas/lithuania/factsheets/pdf/fac
t_lt_en.pdf

7/28/2019 Construction 2006
http://slidepdf.com/reader/full/construction-2006 119/182
Construction
119
C ASE STUDY : AKERSHUS UNIVERSITY HOSPITAL , NORWAY
Abstract
The Danish architectural firm C.F. Møller has used 3D technology for the design and
construction of the Akershus University Hospital in Oslo, Norway. With a budget of about
900m euros, 116.000 m2
of new buildings, and 20.000 m2
of renovation work the
construction project is very large and 3D technology proved its value in decreasing the
number of design and construction errors, decreasing construction time and optimising
the flow of documents between stakeholders.
The main learning points were 1) The use of 3D models should be accompanied by
information libraries if the knowledge sharing is to increase. Implementing information
libraries could further enhance the effective project completion. 3) 3D technology, in the
form implemented in the Akershus project, is robust enough to handle the entire design
and construction process of even large and complicated projects and 3) The inclusion of
HVAC building elements in the model (heating, ventilating and air-conditioning) made the
building planning and execution easier.
Case study fact sheet
Full name of the enterprise: C.F. Møller Architects
Location (HQ / main branches): Aarhus, Denmark / Copenhagen, London, Oslo
Sector (main business activity): Architectural design, Hospital planning
Year of foundation: 1924
Number of employees: 261
Turnover in last financial year: About 25.5m euros
Primary customers: Building owners
Most significant market area: Design of large buildings, e.g. hospitals
Focus of case study: 3D technology
Key words: BIM modelling and IFC standards
Background and objectives
Established in 1924, C.F. Møller Architects (CFMA) is an international Danish
architectural firm specialised in the design of large construction projects within the office
and hospital segment, having designed more than 30 hospitals and other health care
related constructions, primarily in Scandinavia. The enterprise operates in more than 10
countries and employs 261 persons from 16 countries. Annual turnover is about 25.5m
euros (2005).
In 2000, C.F. M.A. won the architectural and design contract for one of the largest new
hospitals, the Akerhus University Hospital in Oslo, Norway. The client was the
“Helseregion Øst Norge” (Health Care Region East, Norway). The Akerhus University
Hospital is the largest in a series of new hospitals in Norway and will, when completed,
be one of the most advanced hospitals in Europe. The construction work started in March2004, and the new hospital will take over from the old one in October 2008. Thereafter
demolition and renovation of the old hospital will take another 3 years before the project
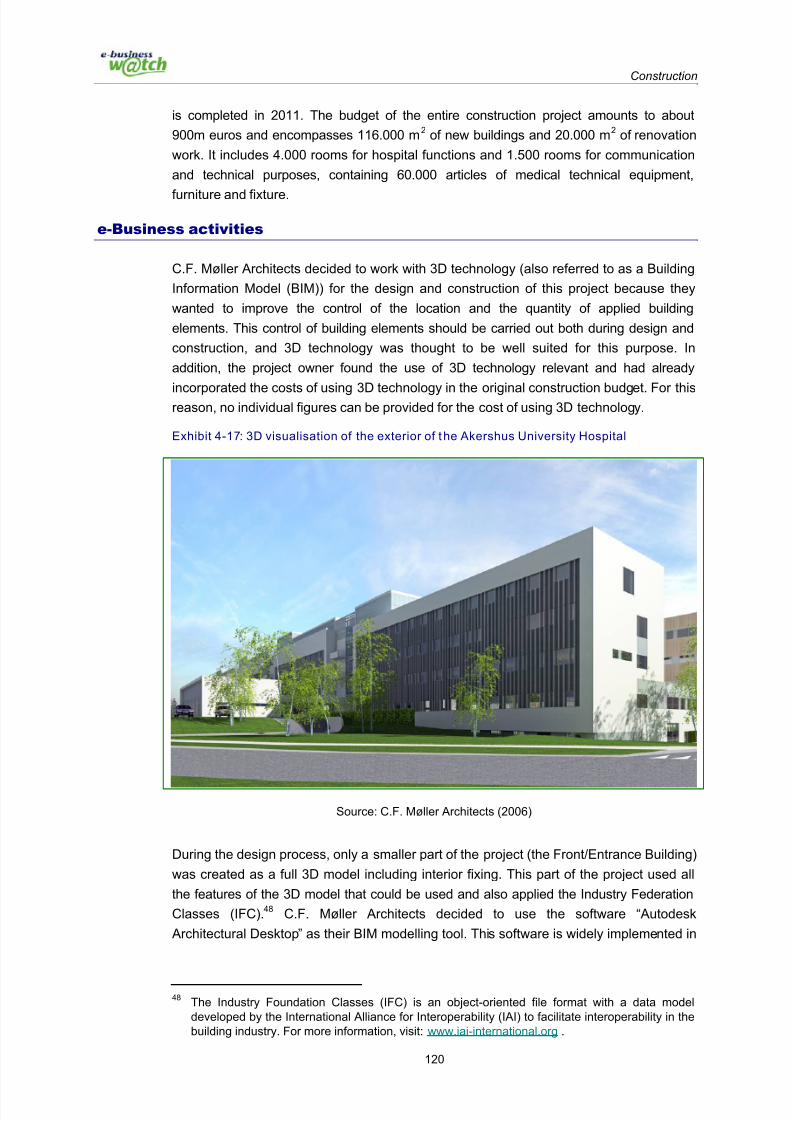
7/28/2019 Construction 2006
http://slidepdf.com/reader/full/construction-2006 120/182
Construction
120
is completed in 2011. The budget of the entire construction project amounts to about
900m euros and encompasses 116.000 m2 of new buildings and 20.000 m2 of renovation
work. It includes 4.000 rooms for hospital functions and 1.500 rooms for communication
and technical purposes, containing 60.000 articles of medical technical equipment,
furniture and fixture.
e-Business activities
C.F. Møller Architects decided to work with 3D technology (also referred to as a Building
Information Model (BIM)) for the design and construction of this project because they
wanted to improve the control of the location and the quantity of applied building
elements. This control of building elements should be carried out both during design and
construction, and 3D technology was thought to be well suited for this purpose. In
addition, the project owner found the use of 3D technology relevant and had already
incorporated the costs of using 3D technology in the original construction budget. For thisreason, no individual figures can be provided for the cost of using 3D technology.
Exhibit 4-17: 3D visualisation of the exterior of the Akershus University Hospital
Source: C.F. Møller Architects (2006)
During the design process, only a smaller part of the project (the Front/Entrance Building)
was created as a full 3D model including interior fixing. This part of the project used all
the features of the 3D model that could be used and also applied the Industry Federation
Classes (IFC).48 C.F. Møller Architects decided to use the software “Autodesk
Architectural Desktop” as their BIM modelling tool. This software is widely implemented in
48 The Industry Foundation Classes (IFC) is an object-oriented file format with a data modeldeveloped by the International Alliance for Interoperability (IAI) to facilitate interoperability in thebuilding industry. For more information, visit: www.iai-international.org .

7/28/2019 Construction 2006
http://slidepdf.com/reader/full/construction-2006 121/182
Construction
121
many architectural firms and engineering companies and was selected because it was
viewed as the most cost-effective in the specific circumstances.
The Building Information Model differs from the traditional paper-based drawing process
in so far as the files saved on the computer consist of virtual building objects and not lines
of graphical objects. The computer-aided design (CAD) tool allows the architects to
define data objects composed of building elements like walls, doors, rooms or windows.
The entire physical environment which needs to be visualized is built up with those
objects. All the objects are established in 3D and stored in a common central library.
Subsequently, after they have been assessed in a quality assurance procedure, they are
distributed to the project team. The intention is that all the information which is connected
to the objects should be reused by all the actors in the value chain. The 3D model also
includes information about national zoning regulations and laws.
3D technology does, however, not exclude traditional paper drawings: drawings can be
extracted from specific views of the model available on separate files. Exhibit 4-18 belowillustrates such a specific view of one of the hospital building in the Akershus University
Hospital project.
Exhibit 4-18: 3D visualisation of the interior of the Akershus University Hospital
Source: C.F. Møller Architects (2006)
The use of a 3D model that used the Industry Federation Classes (IFC) meant that extra
costs for training of key personnel among the project stakeholders were incurred. In
addition, the use of IFC standards was estimated to result in slightly higher personnel
costs in the early phases of the development of the 3D model.
As a special feature of the 3D model applied to the Akershus University Hospital project,
the model included HVAC elements (heating, ventilating and air-conditioning). The
subcontractors carrying out this work had access to the 3D model, and all building
elements related to HVAC were created in the 3D model. The inclusion of these building

7/28/2019 Construction 2006
http://slidepdf.com/reader/full/construction-2006 122/182
Construction
122
elements opened up new ways of working with production planning, and benefited the
execution of the project.
Impact
The interoperability achieved through the use of the IFC standards enables all
stakeholders to work on the same model, to monitor the development of each object by
calculating building statistics, cost of maintenance, cost of heating/cooling and to
visualize clash detection. Thus, quality assurance and communication within the project
team is improved. The use of the IFC standards also has an impact on the efficiency of
the construction project. The IFC standard makes it possible to export the building
information model to an open and transparent format. This standard also respects
national building codes and regulations. This means that compliance with regulation is
secured for all changes to the 3D model.
In addition to the above benefits of a 3D model, its adaptability to construction changeshas proven valuable. Due to organisational changes in the Norwegian national public
health system and budget problems, the Akershus University Hospital was scaled down
twice to about 75-80% of its originally planned size (in terms of square meters). This
meant that the entire building project had to be redrafted. Since the 3D model is
changeable and can perform real time simulation of any change to construction design,
the architects and engineers could fairly easily make the necessary changes without
large delays.
3D technology also has an impact on costs. The link between design and construction is
improved through the use of BIM: the BIM contains all building information concerning abuilding element or a room. The contractor can generate his drawings directly from the
updated BIM and thus the risk of mistakes is reduced. In addition, building part
information can be streamlined directly to manufacturing machines. This process
prevents errors occurring as a result of the use of non-updated plans or bad
communication between different stakeholders, thus reducing or eliminating the extra
costs associated with such errors.
The construction of the Front/entrance building, which is used as a test case for the use
of BIM among all the actors has just been started, and will be finished in autumn 2007.
Thus, no quantitative data concerning possible cost savings and productivity gains nor
the experiences and conclusions of the actors (contractors) concerning BIM are availableat this point.
Lessons learned
The use of BIM makes it possible to change the information flow of a construction project:
usually, information is pushed from the consultants and clients to the contractors. But
through the use of BIM, information can be pulled by all the stakeholders at any time.
During the project, the architects established libraries for building parts, equipment,
fixture and furniture. This was done as an attempt to keep track of all the different
elements and the information necessary to keep to a tight time schedule. Such libraries
should be available at the start of the project and should preferably be accessible to the
producers of building materials, in order to furnish them with all relevant and correct data.

7/28/2019 Construction 2006
http://slidepdf.com/reader/full/construction-2006 123/182
Construction
123
The main lesson learned for the architects is that it is possible to complete a large project
working with a BIM, and that this way of working provides enhanced control over all
elements in a large project.
A specific learning point from this project is the value of including HVAC building
elements into the 3D model. The inclusion of HVAC building elements made the building
planning and execution easier.
The use of IFC standards for interoperability has proven valuable in increasing the
knowledge sharing between the different stakeholders, to secure compliance with
national building and zoning regulations and to minimise construction errors.
References
Research for this case study was conducted by Anders Pennerup Gantzhorn, Rambøll
Management, on behalf of e-Business W@tch. Sources and references used:
Information provided by Architect Mr. Kjell Ivar Bakkmoen, C.F. Møller Architects,
Norway, 28. June 2006
Written interview with Architect Mr. Kjell Ivar Bakkmoen, C.F. Møller Architects,
Norway, 8. July 2006
Websites:
C.F. Møller Architects, www.cfmoller.com
Akershus University Hospital, www.nyeahus.no

7/28/2019 Construction 2006
http://slidepdf.com/reader/full/construction-2006 124/182
Construction
124
4.2.7 Summary of main points and conclusions
Based on the analysis and the case studies presented in the previous paragraphs of
Section 4.2, the main findings and conclusions about the use of 3D technology by
construction enterprises in Europe are summarised in the following:
The benefits of 3D technology such as cost reduction, risk minimisation, more
efficient communication between stakeholders and earlier error detection are well
documented. They are illustrated in the case study on Constructus, as well as in
the business examples of NCC, Raiffeisen Real Estate, Strabag and 4D Books. A
geographical difference in the promotion and uptake of 3D technology has been
identified, however, with the Nordic region acting as frontrunners. Furthermore,
this year’s study confirms that the uptake of 3D technology is not so much
hampered by barriers in the software itself as by barriers arising from the
traditional workflow processes not adapted to ICT and the low level of ICT skills
and capabilities, especially among construction SMEs.
Another barrier to the uptake of 3D technology is the lack of a clear business
case for the change from 2D to 3D technology, especially among engineering
and construction enterprises. 2D technology is currently being used by many
enterprises in the CI and they feel that their needs are sufficiently covered by this
technology. For some stakeholders, the extra benefits arising from 3D technology
(e.g. virtual construction, simulation of changes and the like) are not perceived as
valuable or necessary.
The benefits from using 3D technology are distributed throughout the value chain
in CI, but the architects and contractors often carry the ICT system investments
alone. In the short run, the sub-contractor and sometimes the building owner
have little incentive to work with 3D technology, because it may take a long time
to compensate for the potential cost burden. This, in conjunction with the lack of
broadband connections among a large section of construction SMEs (cf. Exhibit
3.1) makes the business case, from their perspective, difficult to identify.
4.3 Project web
4.3.1 Introduction
Previous sector studies by e-Business W@tch on the CI suggested that the use of ICT for
collaborative work processes can support project management and improve production in
the CI (e-Business W@tch 2005a, p. 66). Furthermore, a US study showed that 30% of
design and construction costs, excluding material costs, are wasted due to poor
communication and inefficiencies within and between stakeholders in a construction
project (Constructware 2005, p. 1). However, this year’s e-Business Survey results
presented in Chapter 3 show that only 1 in 10 CI enterprises in Europe reported sharing
documents in collaborative work spaces. This could indicate “hidden” potential for
construction enterprises in implementing project webs.
7/28/2019 Construction 2006
http://slidepdf.com/reader/full/construction-2006 125/182
Construction
125
This section looks into how an ICT solution called “project web” can be used to improve
the workflow processes in the CI. A project web is an application that can enable a better
and more secure exchange of information and documents in a construction project
(interview with Søren Bilsøe in February 2006). This section also discusses the diffusion
of the project web in the CI, problems with standardisation, potential benefits (e.g.reduction in errors, improved management, instant access to revised documents and
drawings), the challenge of traditional workflow process when using project webs and
related barriers, such as the lack of standards, costs, and limited awareness.
4.3.2 Definition of project web
Traditionally, cooperation in construction, as in any other industry, has been dealt with via
paper-based methods, CD-ROM, disks, email or home-made proprietary systems
(Constructware, www.constructware.com, April 2006). The main competitors to project
webs are in fact traditional paper-based document handling along with e-mail and ERP
systems (interview with Søren Bilsøe, February 2006). The 2006 e-Business Survey,
however, shows that only about 1 in 10 responding enterprises in the CI said that they
have an ERP system (see Exhibit 3-13). Thus, e-mail and traditional document handling
is seen to be the main competitor to project webs.
The use of traditional document handling may result in slow and complicated workflow
processes since there are many partners involved in a construction project. Furthermore,
this can easily lead to misunderstandings between the various stakeholders especially
regarding the expectations and assumptions of the client and the work provided by the
construction enterprises (Interview with Jean-Yves Ramelli, March 2006).
One of the ideas behind the development of project web solutions is to enhance the
element of virtual organisation in the CI. A project web is a tool to achieve a digital
building process where all work-flow processes are gathered in a single online and digital
platform that can be used by all the relevant users in a construction project. The idea is to
establish an effective project management tool that gives all the project stakeholders
easy access to the latest revised project information and documents via the online project
web. The project web thus ensures information exchange between users in the project,
e.g. one participant can easily transmit and exchange digital information to all other
participants (Alexander et al. 1998, p. 2) (see exhibit 4-19). A “virtual” organisation, where
documents and communication are electronic, may enable a “dialogue” between the
stakeholders in a construction project and create integration in a very fragmented industry
that is characterised by a large number of SMEs (Grassi 2006, p.1.).

7/28/2019 Construction 2006
http://slidepdf.com/reader/full/construction-2006 126/182
Construction
126
Exhibit 4-19: Example on a generic project web solution
Source: Alexander et al., Information and Communication on Construction: Closing the Loop. In
Construction Informatics Digital Library, 1998, p. 2
Exhibit 4-19 shows the exchange of information in a traditional construction project
versus a view of the construction project using an online project web solution.
A traditional construction project includes a flow of physical documents to share
information among stakeholders. Using a project web, the involved stakeholders can
send and retrieve documents, drawings, construction plans and minutes from the project
web server instead of having to send paper-based documents.
The information stored in the project web can be copied and read from the server by allusers, who have been given a username and password, wherever and whenever needed.
This means that a project web offers a wide variety of user access to the same material
despite the differences in the users’ own IT systems. Users can see all revised editions of
the documents used in the construction project. The project web can follow a construction
project from birth to delivery and the documents can also be viewed by the owner during
the the operation and maintenance phase (Constructware 2005, p. 6).
Interviews conducted for this report indicate that the concept of project web is
continuously being tailored to suit the specific needs of the enterprises in the CI.

7/28/2019 Construction 2006
http://slidepdf.com/reader/full/construction-2006 127/182
Construction
127
Bu s i n e s s e x am p l e
B y g g e w e b A /S
Byggeweb A/S has market activities in all Nordic regions; including Norway,
Sweden, Iceland, Finland and Denmark. Project web solutions are a growtharea; they facilitate the exchange of information and documents among
stakeholders in a construction project in a secure workspace. The project
web platform is continuously being tailored to suit the specific needs of
construction enterprises, taking into account comments and feed-back from
several Nordic construction enterprises in a systematic manner.
According to Byggeweb A/S, the main rival solutions are paper-based
document handling, e-mails, property-based systems, ERP systems and
other specialised applications. A barrier for a further uptake of internet-based
project web solutions is the relatively conservative nature and cultural
barriers in general in the CI. Furthermore, there is a lack of a European-wide
technical standard for interface between collaborative IT systems; it iscommon among project web suppliers to use different customised software,
coding and programming. As regards SMEs, they normally do not have the
financial resources to engage in project webs. In addition, as some SMEs
work as sub-contractors, they are not accustomed to using the electronic
features in the project web solutions and they lack the incentive to engage
and finance participation in project webs.
Source: Interview with Søren Bilsøe, Sales Director, Byggeweb A/S,
February 2006 (summary)
4.3.3 Use of project webs in the construction industry
The main stakeholders involved in the usage of project webs are the construction
enterprises and clients. The architects, engineers, construction management, contractors,
those in charge of operation and maintenance, the building management and the
client/owner are all a part of the construction process and can potentially participate in a
project web. The large number of participants may, however, complicate the
communication and information sharing among the project stakeholders.
The value of a project web is that it promises to reduce errors by supporting project
management. The uptake of project web solutions, however, is not very high. This year’s
survey shows that about 1 in 10 responding enterprises share documents in collaborative
work spaces. Looking at enterprise sizes, however, about half of the large enterprises
share documents in this way compared to only 8% of the micro-enterprises. Compared to
the weighted all-sectors average, the CI is performing below average in this field (See
Exhibit 3-14). This result can be explained by factors such as cultural barriers and the
conservative nature of the CI (Interview with Søren Bilsøe, February 2006).
Architects and engineers tend to be the early adopters of project web solutions
(B3Dkonsortiet 2006). At the (sub-) contractor level, and especially on the specific
construction site, the use of project web has, however, not gained much support. In a
Danish study, architects, engineers and contractors were asked about their usage of project webs. The study showed that it is mainly architects, engineers, contractors and
clients who are involved in project webs, whereas other stakeholders are infrequently

7/28/2019 Construction 2006
http://slidepdf.com/reader/full/construction-2006 128/182
Construction
128
mentioned. In addition, architects, engineers and contractors experience increasing
demand for the further development of competencies in the area of project web (Inhouse
Consulting 2006, p. 67) This trend is furthermore supported by an American study where
the order of project web usage is the following; the construction project manager (96%),
the administrative assistant (81%), the architect (79%), the construction manager (61%),the owner (60%), the engineer (55%) and finally the subcontractor (42%) are the most
frequent users (Constructware 2001, p. 17).
Another finding of the desk research about project web solutions is the following list of IT
vendors producing project web solutions:
Exhibit 4-20: Non-exhaustive list o f IT vendors developing project web software
Name Country Website
4Projects United Kingdom www.4projects.com
BouwASP The Netherlands www.bouwasp.nl
BuildOnline United Kingdom www.buildonline.comByggeweb Denmark www.byggeweb.dk
Citadon U.S.A. www.citadon.com
Constructware U.S.A. www.constructware.com
Eudata Belgium www.eudata.be
Formi France www.formi.fr
KPN The Netherlands www.livelinked.nl
NVision Luxemburg www.iconstruct.lu
Procos Belgium www.procos.be
ProjektWeb Denmark www.ramboll.dk
Prosys France www.prosys.fr
Quadram Luxemburg www.quadram.lu
Scia Belgium www.scia.be
SwITch Belgium www.asbuilt.be
Van Meijel Projectservice BV The Netherlands www.edificium.com
Source: CSTC, Les Portails de Projects – Gestion collaborative électronique
de documents dans les projects de construction, 2005.
As discussed in a report from the European Commission, exchange of information is not
frequent in the CI and is hindered by the deficiency of shared information standards
(European Commission 2004, p. 11). This can cause construction projects to exceed timelimits and costs because of problems with communication and collaboration (CMAA 2004,
p.11). Furthermore, Søren Bilsøe points to the problem that, due to the lack of a
European-wide technical standard for the interface between collaborative IT systems,
most producers of project web solutions use different customised software coding and
programming (Interview with Søren Bilsøe, February 2006). This is also confirmed in a
recent study which finds a: “lack of software interoperability particularly between different
types of systems, where it is not possible to transfer or use previous data” (Yeomans
2005, p. 41). For a further elaboration on the issue of interoperability standards see
Section 4.2.6.
Interviews support this point by highlighting that the different standards used by IT
vendors may have the effect that enterprises have to use different project web solutions

7/28/2019 Construction 2006
http://slidepdf.com/reader/full/construction-2006 129/182
Construction
129
from project to project. When no unified standard exists, some enterprises may be forced
to spend resources on training and ICT to be able to handle different user interfaces and
workflow processes in different types of project web software. This, in itself, may
constitute a barrier to the uptake of project web solutions (Interview with Søren Bilsøe,
February 2006).
4.3.4 Potential benefits of project webs
One of the main benefits of using project webs in the CI is the reduction of delays in
communication. An American study showed that 40% of the questioned enterprises saw
the project web as an eliminator of barriers such as delays in communication, workflow,
and processing information and documentation. 94% of the questioned enterprises saw
document management as a tool to reduce costs, with the main reduction stemming from
man-hours used for creating, filing and searching for documents. The study also showed
that enterprises gained a competitive advantage by using project webs, especially in the
area of more effective communication and operational efficiency (Constructware 2001, p.
9, 13).
This is supported by another study on the UK CI, which showed that the main advantages
from project webs are reduction of errors, improved possibility for audit, and reduction in
building time (Martin 2003, p. 5-6). Another benefit from project webs is the reduction of
errors arising from the use of different versions of key documents by stakeholders
(Interview with Søren Bilsøe, February 2006). Project webs normally offer functionalities
that enable users to retain their well-known workflow processes and access the needed
documents, drawings and minutes online.
The following business example builds upon the benefits of project webs presented
above and goes in greater detail with the possibility for auditing and log trail:
Bu s i n e s s e x am p l e
P r o s y s SA – a F r e n c h p r o j e c t w e b p r o v i d e r
Prosys SA is one of the major project web providers in France. The use of
project webs is not widespread in France at this stage, but for large projects
(more than 100m euros) it can be economically feasible to use a project web.
The goal of the software supplier is to develop new affordable products (less
than one euro per day per user) which can be adopted by the users
according to their needs. This gives the possibility of selling software
licenses, which allows the construction enterprise to use it for all their
projects. According to Prosys, the use of project webs can enhance the
transparency in the construction process and enables a continuous update
of plans and schedules. The project web technology also enables the
stakeholders to keep a watch on the log and audit trail in order to see who
and when the stakeholders have seen revised documents.
Source: Interview with Emmanuel Netter, Head of Marketing, Prosys(summary)

7/28/2019 Construction 2006
http://slidepdf.com/reader/full/construction-2006 130/182
Construction
130
Participation in a project web allows for fast access to the newest information and revised
documents and drawings. For SMEs, there are also savings on printing costs. This can
be seen e.g. in the best practice example conducted by the project web provider Citadon,
where the Brazilian engineering enterprise Odebrecht saved over 5,000 US dollars per
month in reduction of document dispatches and distribution and in printing costs (Citadon,www.citadon.com, March 2006).
4.3.5 Barriers
This section analyses the barriers to project web uptake in the CI. Three main barriers
are identified on the basis of the survey results presented in Section 3.8.2 and the
discussion in the previous paragraphs of Section 4.3.
Lack of standards. A barrier to the uptake of project webs in the European CI is that
many of the present project webs cannot be integrated with other business administrationsoftware such as ERP systems. This increases the number of different ICT systems used
in the enterprise and leads to increased ICT complexity, partly because employees have
to be capable of using multiple ICT systems and partly because data exchange does not
take place automatically. This complexity places a heavy burden on the staff (Yeomans
2005, p. 41). This lack of ICT systems’ integration derives from the absence of industry
standards within the area. Many different ICT systems (with different ICT formats and
user interfaces) are used across enterprises. This further complicates the interaction
between different enterprises. For construction enterprises participating in parallel
construction projects, this may be problematic.
Lack of financial resources. Another barrier identified in this report relates to costs. In
some cases, construction SMEs do not have the financial resources to engage in a
project web (interview with Søren Bilsøe, February 2006). The survey results presented
in Exhibits 3-4 and 3-7 support this argument by highlighting that SMEs use less of their
total budget on ICT compared to large enterprises and that SMEs more often are forced
to loan-finance their ICT investments compared to large enterprises. The one-off start-up
costs for software and hardware can, for an SME, be quite considerable, and hence act
as a barrier. This means that the large European construction enterprises drive the
uptake of project web solutions.
Since large construction enterprises are primarily investing in project web solutions, theissue of who is to pay for the sub-contractor’s participation in the project web arises. If it
is a prerequisite for a project that stakeholders have or buy a specific project web
solution, this may generate a barrier that hampers the access for SMEs to be
subcontractors in large projects. Small sub-contractors rarely use the electronic features
of the project web solutions, hence their incentives for engaging and partly financing the
project web solutions are limited (Interview with Søren Bilsøe, February 2006). It can
furthermore be argued that the use of project web solutions is closely connected to the
direct benefits from using the solution. And because benefits for small sub-contractors
seem to be limited, there are indications that the use of project web solutions is
decreasing throughout the value chain i.e. larger construction enterprises working asproject managers use project webs more than the smaller sub-contractors engaged in
these projects (Martin 2003).
7/28/2019 Construction 2006
http://slidepdf.com/reader/full/construction-2006 131/182
Construction
131
Limited awareness. Another barrier identified in the analysis concerns the diffusion and
penetration of project web in the CI. Many construction SMEs are not aware of the
content, requirements and benefits of project web solutions, and hence cannot assess
the usefulness of such software. In general, ICT is not a primary focus point of many CI
enterprises and this, in effect, hampers also the uptake of project web solutions.
4.3.6 Business implications
The business implications of implementing project webs in the European CI are that
enterprises using project webs can achieve improvements in productivity through faster
communication and fewer errors caused by versioning mistakes. The efficiency gains
from faster workflow processes may thus save time and money. Furthermore, project web
solutions can reduce building time and improve the maintenance and operation phase,
because all documents, drawings and their revisions can easily be retrieved from the
project web server.
The following business example is about the use of a project web solution in a
construction project. This business example also illustrates some of the implications that
project webs may have on the workflow processes and the efficiency of stakeholders
involved in a construction project.
The broad introduction of project web solutions may widen the ICT gap between SMEs
and large enterprises. Normally, the building owner, the engineering enterprises or the
prime contractor selects a project web solution. This may have a negative effect on SMEs
operating as sub contractors. If they want to be selected as sub-contractors on a specific
project, they must implement the selected project web solution, even if this means
implementing a new project web system, with possible new user-interfaces and ICT-skills
requirements. If, in the next project, another prime contractor selects a different project
web solution, the SMEs might be asked again to invest in new software.
Based on the survey presented in Section 3 it is argued that SMEs mainly finance ICT
investments from their cash flow and, in addition, that SMEs have limited focus on ICT
skills training (see Section 3.2). These factors could indicate that some SMEs would not
be able to support a continuous change of project web solutions. Overall, the
implementation and use of project webs are not expected to greatly impact the dynamics
and structure of the European CI. It is more likely that their use will reinforce currenttrends towards cost reduction in the construction process.

7/28/2019 Construction 2006
http://slidepdf.com/reader/full/construction-2006 132/182
Construction
132
Bu s i n e s s e x am p l e
Bo u y g u e s Co n s t r u c t i o n (F r a n c e )
Bouygues Construction is a French construction enterprise with a turnover of
5.5bn euros in 2004 and has 38,500 employees in 60 different countries.
Bouygues first adopted project web solutions in 2000 and in 2002 They
decided to use project web solutions systematically for all big construction
projects exceeding 50 different stakeholders. At present (2006), Bouygues is
using project web solutions on 20-25% of their projects.
Bouygues implemented a project web solution for the construction of the
Home Office Building in England. The Home Office project started in 2001
and ended in January 2005. Three buildings (75 000m2) were delivered for
3,400 employees and 255m euros in total have been invested in the project.
A clause of the contract stipulated that all the project stakeholders should
use the project web solution implemented by Bouygues. In June 2003, 237
different stakeholders were using the project web; 18 gigabytes of data were
shared (13,400 online documents). At the end of the project 50 gigabytes of
data were online. Bouygues chose software provided by Brigsnet. The costs
of the project web solution can be divided in three parts: 1) A monthly fee
100-200 euros; 2) maintenance and consulting equivalent to 3 fulltime
employees; 3) internal training costs amounting to approx. 600-2000 euros.
Based on the project webs, engineers and architects can conduct projects
from France in e.g. Tahiti, which would not be possible with traditional
papers and mails. The use of project web generated a 25% saving on cost
for paper and mail but the main impacts from project web implementation
seem to be not quantitatively but rather qualitatively measurable through
improved project execution.
Bouygues expects project web solutions to remain simple and maybe even
simpler to use in the future. The challenge is how to combine 3D technology
and project webs. There is a lack of standards concerning 3D technology
and stakeholders still work on 2D plans. The challenge for Bouygues is
therefore to implement a graphic charter (like IFC standards) so a 3D plan
with notification on each object can be realised and shared on a project web.
This can, according to Bouygues, lead to 20 to 30% savings during the
conception phase.
Source: Interviews with Mr. Eric Juin, Bouygues Construction, 28 March2006 and 20 April 2006; Annual Report 2005, Bouygues Construction
The following case study features the French construction enterprise Spie SCGPM which
successfully uses project webs in their construction projects. The case illustrates the
benefits and barriers to project web usage in the CI.

7/28/2019 Construction 2006
http://slidepdf.com/reader/full/construction-2006 133/182
Construction
133
C ASE STUDY : SPIE SCGPM, FRANCE
Abstract
Spie SCGPM, the regional branch of the fourth-largest French construction enterprise,
Spie Batignolles, is at the forefront of the implementation of project web solutions in the
CI. The mother enterprise, Spie Batignolles, had a global group turnover of 805m euros in
2004 and 60 offices in 5 European countries. The regional branch, Spie SCGPM, covers
the Paris area and employs around 500 people. In 2000, Spie SCGPM introduced project
web solutions into its construction projects and has, as of spring 2006, used project web
solutions in 10 different construction projects. The enterprise adopted the software called
Projecteo provided by Prosys SA, and this solution has generated a positive impact on
the work organisation of the enterprise as well as on the workflow process of construction
projects.
The main advantages of the use of this project web solution within Spie SCGPM have
been improved response time and communication among stakeholders in the
construction project and a greater efficiency in construction planning and building.
Case study fact sheet
Full name of the enterprise: Spie SCGPM
Location (HQ / main branches): France
Sector (main business activity): Construction
Year of foundation:1950 (SCGPM) (merged with Spie Batignolles in 1984
and became Spie SCGPM)
Number of employees: About 500 people
Turnover in last financial year: 160 m euros
Primary customers: Public and private contractors
Most significant market area: Construction projects
Focus of case study: Use of Project Web Solutions
Key words: Construction planning, project webs
Background and objectives
Spie Batignolles, the mother enterprise of Spie SCGPM, is the fourth largest French
construction firm. With branches in Germany, England, Spain, Portugal and Switzerland,
Spie Batignolles had a turnover of 945m euros in 2005 (35% in classic construction, 20%
within maintenance, 20% within specialised construction (such as underground or
technological construction projects), and 25% through partnerships in real estate projects
(www.spiebatignolles.fr, June 2004) and currently employs more than 5,000 people. Spie
SCGPM acts as a regional branch of Spie Batignolles in the geographical area of Paris
(Ile de France). Spie SCGPM works primarily within the four business segments of office,
residential buildings, commercial centres, hostelry and non-residential buildings
(hospitals, schools and equipment).
The enterprise is organised into two main activity branches: Concertance (Completebuilding projects) and Présance (Rehabilitation, renovation and maintenance). This
division is intended to secure higher efficiency within the four main business segments.

7/28/2019 Construction 2006
http://slidepdf.com/reader/full/construction-2006 134/182
Construction
134
Spie SCGPM executes projects for public clients such as the French Ministry of Culture
and Communication, the General Direction of the Civil Aviation (DGAC) or the Hospital
Saint Camille in Paris. Private clients include Hines (client of the Meudon Campus project
below mentioned), BNP Paribas, France Telecom and Renault (www.spiebatignolles.fr,
May 2005). The turnover of Spie SCGPM amounted to 160m euros in 2005. The maincompetitors to Spie SCGPM are Bouygues (France), Vinci (France) and Eiffage (France).
Since the activities of Spie SCGPM are only in the Paris area, this means that Spie
SCGPM only competes with enterprises also operating in the area. According to Spie
SCGPM the enterprise holds a market share of 15% - 20% within the greater Paris area
(Interview with David Barbin, Engineer, Spie SCGPM, March 2006). This competitive
position is obtained through close and long-lasting customer relationships. Moreover,
Spie SCGPM creates a competitive advantage by utilising synergies found in the
relatively small and flexible size of the enterprise.
e-business activities
Since the year 2000, Spie SCGPM has adopted project web solutions as this was a
requirement in public tenders. Furthermore, contractors wanted to be more involved in
the ongoing planning and execution of the construction projects. Spie SCGPM has
experience with project web solutions from 10 recent construction projects and currently
uses project web solutions for 3 different projects as illustrated in Exhibit 3-10:
Exhibit 4-21: Current construction projects using project web solutions
Construction project Project description Construction period
Antony Parc II 42m euros, 29,000 m2 offices May 2005 - April 2007
Montreuil Arborial35,000 m2 offices for the French Ministryof Agriculture
May 2005 - May 2007
Meudon Campus 95m euros, 6 buildings, 45 000 m2 offices April 2004 - December 2006
Spie SCGPM uses the software Projecteo LT provided by Prosys (though no exclusivity
clause with the provider has been signed ) as their Project Web solution. This choice is
based on the following criteria:
The project web vendor should be a French enterprise preferably situated in thegreater Paris area.
The project web solution should be cost-efficient with no or low implementation
cost and no requirements for high-tech hardware.
The system software should have a high degree of usability and provide easy
communication between the users and not add to the costs.
As the use of a project web solution was imposed by the client and represents an extra
cost for Spie SCGPM, the low price of the solution was a decisive criterion for Spie in
choosing the provider.
The main function of the Projecteo LT project web software is to host all data of a
construction project and to enable the diffusion of documents to selected stakeholders in

7/28/2019 Construction 2006
http://slidepdf.com/reader/full/construction-2006 135/182
Construction
135
the construction project. An interface is provided and the project web is divided in 4 main
parts:
A personalised welcome page
A list of all members taking part in the projectFiles and data sharing
Forum for communication with other stakeholders.
As the provider Prosys SA works closely with Microsoft in the development of software,
Projecteo is based on a Microsoft NET 2.0/SQL Server 2005 platform. The
interoperability of the system is built around standards like SOAP (Simple Object Access
Protocol), Web services, XML and XHTML. Moreover, the tool for visualisation in
Projecteo enables the users to open and annotate more than 200 different formats,
including formats such as CAO (AutoCAD, Microstation) and Office (Word, Excel,
Powerpoint). The feature for document handling is a main issue in terms of documentsecurity. Every time a document is uploaded into the project web solution, all the relevant
stakeholders in the construction project are informed via e-mail and have instant access
to these documents. Each user is responsible for the distribution of the documents and
the security of each document uploaded.
Spie SCGPM’s Meudon Campus works as an example of project-by-project
implementation of project web solutions. Here, the project web solution was not in
operation during the first study phase of the elaboration of the Meudon Campus project
(also called the commercial study period). In May 2004, when the project went into the
operational phase, a project web solution was introduced. In the beginning of 2004, a
meeting with the project web software provider, Prosys SA, was conducted with the
purpose to establish the content and set-up of the project web operation.
Then a one-day training session for Spie SCGPM’s administrator was conducted prior to
launch of the project web solution, and Prosys SA and Spie SCGPM organised two
additional training sessions of 2 hours to present the main aspects of the software and
the procedures to all the stakeholders of the Meudon Campus project.
Almost all the stakeholders in the construction process, with the exception of some sub-
contractors, use the system – including the contractor, construction firms, sub-
contractors, the engineering enterprise and the client. In the case of Meudon Campus, all
project data is shared via the project web including blueprints, plans, photos, memos and
syntheses. Only financial data is deemed too sensitive to be placed on the project web
platform. Each stakeholder/user has a personal access code, and needs a PC with
internet to use the project web solution. To upload data, the user has to first create a
folder by filling out a card with a code from the paper-version of the document. Then the
user can upload the different documents to this folder. Finally, the user has to notify the
upload to the persons that are going to access the file. Each stakeholder/user will receive
an e-mail and can access the documents immediately. The documents that have been
uploaded cannot be modified: the user must create a new folder if he wants to add or
over-write existing documents. The user-interface for document handling is illustrated
below.

7/28/2019 Construction 2006
http://slidepdf.com/reader/full/construction-2006 136/182
Construction
136
Exhibit 4-22: The Projecteo LT project web solution user interface (The Meudon Project)
In the Meudon Campus project, costs of using the project web solution can be divided in
two main elements: implementation costs and operational costs. Implementation costs at
project level amount to approx. 5,000 euros including meeting activities and training (not
including software purchase and/or licensing). Operational costs are around 50 euros per
month per user. By implementing project web solutions into more projects, Spie SCGPM
plans to decrease the cost per user. This goal is, however, still to have room for
upgrades, further development of the features and user-interfaces of the software.
Impact
Initially, Spie SCGPM did not expect any specific impact from the introduction of project
web, but after a few years this perception changed, and the enterprise has come torealise the potential of project webs. At the moment, the use of project webs cannot be
used as a sales argument in contract negotiations by Spie SCGPM because project webs
do not seem to be diffused throughout the CI and among the customers (Interview with
David Barbin, Engineer, Spie SCGPM, March 2006). However, Spie SCGPM expects the
value-adding potential of project webs to increase over the next years as customers
become more and more aware of the possible financial and managerial advantages of
using ICT and, in particular, project web solutions. At the moment, the impact generated
within the enterprise is most clearly seen in terms of efficiency gains on work-flow
processes.
The use of project webs has an impact on the work-flow process by improving the
communication capabilities within Spie SCGPM. This impact is mainly seen in the speed
at which information flows in and around the project organisation in the construction
projects. The use of e-mails as main communication channel and the use of common
standards for graphic charts, financial numbers and construction design have greatly
improved the information flows among project team members, and the quality of the
shared information has also improved. In addition, the accessibility of information has
increased due to the standardised process of document categorisation.

7/28/2019 Construction 2006
http://slidepdf.com/reader/full/construction-2006 137/182
Construction
137
Pre-project web work-flow process
A construction plan is circulated to all relevant personnel in the project team via traditional
mail and each member reviews the plan for mistakes, miscalculations and the like. The
drawback of the traditional work process is low response time due to slow workprocesses, lack of a warning system for delay in communication, etc. Moreover, the
traditional pre-project work-flow process is hampered in its effectiveness and efficiency by
the lack of a versioning control system. Several versions of the same document may
circulate between stakeholders, a circumstance which can lead to design and
construction mistakes.
Post-project web work-flow process
When a sub-contracting firm in the construction project uploads a specific document
online on the Prosys project web, relevant project team members receive an instant e-
mail with a notification of this new document. If, for example, an engineer in the projectteam finds a mistake in the measures, he/she can immediately contact the document
owner (in this case the construction sub-contractor) and notify him/her of the mistake in
the document.
The sub-contractor will not send out a revised document but can only cancel the old and
flawed document and then upload the new and revised document. In this way, the project
web reduces the mistakes arising from versioning issues.
Another impact of the use of project web is the increased possibility of changing sub-
contractor during the construction process. Traditionally, Spie SCGPM found it difficult to
shift sub-contractors during the construction process because highly relevant informationregarding the specific construction process was embedded with the sub-contractor. By
enforcing the use of a project web solution, Spie SCGPM has access to more information
and can, with greater ease, involve a new sub-contractor during the construction process.
Lessons learned
Spie SCGPM is satisfied with the positive impact of the project web so far. However,
according to Spie SCGPM, a difficult task in the implementation of project web solutions
has been to define the criteria of classification of the platform. These criteria depend on
the requirements of each project and consequently shift from project to project. Thismakes it difficult to make a generic project web platform to be used in different types of
construction projects.
On the other hand, the presentation of Projecteo software and the short training of the
users have been the most successful point of the implementation. It has enabled the
stakeholders to understand the project web and has induced a positive attitude towards
the concept before using it. Based on this, Spie SCGPM expects to use project webs
more and more in the future and hopes to implement the system on all the enterprise’s
construction projects irrespectively of project size.
The integration of systems like AutoCAD-based software into the project web would be
relevant for Spie SCGPM. It represents a future benefit related to the evolution of project
webs, as the visualisation tool for plans in project web are not precise enough today. This

7/28/2019 Construction 2006
http://slidepdf.com/reader/full/construction-2006 138/182
Construction
138
integration should, however, be done with software that does not require specific
hardware to be installed.
References
Research for this case study was conducted by Anders Pennerup Gantzhorn, Ramboll
Management, on behalf of e-Business W@tch. Sources and references used:
Interview with Principal Engineer David Barbin, Spie SCGPM, 14. March 2006
Interview and case review with Principal Engineer David Barbin, Spie SCGPM, 17.March 2006
Websites:
Spie SCGPM, www.spiebatignolles.fr
Prosys SA, Inc., www.prosys.com
4.3.7 Summary of main points and conclusions
Based on the survey findings presented in Chapter 3, the analysis and the case study on
SPIE presented in the previous paragraphs in Section 4.3, the main findings and
conclusions about the use of project webs by construction enterprises in Europe are
summarised as follows:
The uptake of project web solutions is hampered by different and often complex
software solutions based on different user interfaces and ICT standard.
Project webs are mainly used by large European construction enterprises and the
user interfaces are characterised by the complex nature of the projects they are
designed to address. This means that the software solution is often not
dimensioned to suit the requirements of construction SMEs. In addition, the
usage and the benefits from using project webs are not evenly distributed among
stakeholders in the value chain. This means that the economic incentives for
implementing project web solutions are not apparent for all stakeholders, in
particular construction SMEs.Complex user interfaces require ICT competencies that European construction
SMEs do not possess. Hence, more focus could be placed on creating simpler
and more cost-efficient project webs that would be easy for construction SMEs to
implement. By having both standardised “off-the-shelf” project web solutions for
construction SMEs and customised complex solutions for the large construction
enterprises, the uptake of project webs could increase. Project webs have to be
simple and have a relatively intuitive structure; otherwise there is a risk that the
application will not be used. In addition, due to a widespread lack of ICT skills,
the industry seems to be experiencing a decrease in the use of project webs in
the supply chain.

7/28/2019 Construction 2006
http://slidepdf.com/reader/full/construction-2006 139/182
Construction
139
Among industry experts there is still “open” debate as to whether project web
solutions should adapt to existing workflow processes or whether implementation
should lead to the abolishment of old workflow process. The reason for changing
the workflow process to fit the new electronic workflow process of a project web
solution should be to fully gain the benefits of online document handling andsharing. Otherwise, the traditional workflow processes may hamper utilisation of
the features of the project web solutions, making them less effective and efficient.
Due to the lack of integration possibilities between project web solutions and
already existing ICT systems (like ERP systems), some construction enterprises
do not implement project webs. This trend is mostly visible among European
construction SMEs and stems from the lack of a European-wide industry
standard for project webs. The uptake of project web solutions could be
supported by a focus on creating an industry-wide European standard concerning
the integration of collaborative systems with other business-related applications.

7/28/2019 Construction 2006
http://slidepdf.com/reader/full/construction-2006 140/182
Construction
140
5 Conclusions
The CI is, compared to the nine other sectors studied by e-Business W@tch in 2006, one
of the industries with the lowest uptake of ICT. For many of the indicators, figures for the
CI are ranked at or near the bottom of the ten surveyed sectors. However, survey results
and case studies also presented in this report show that CI enterprises are not far behind
their counterparts in other sectors studied this year on certain indicators such as e-
procurement, e-standards and ICT-enabled product or process innovation.
Based on the survey findings presented in Chapter 3, the three ICT trends and the case
studies discussed in Chapter 4, this chapter identifies possible impacts and implications
for CI enterprises and the industry as a whole. The final section identifies some policy
implications also arising from this analysis.
5.1 Business impact
5.1.1 Implications for enterprises
Perceived overall significance of e-business
The use of ICT and e-business is not yet generalised in the CI as shown by this year’s
survey findings in Chapter 3. This is also the case for the three ICT trends analysed in
Chapter 4 of this study. E-procurement, 3D technology and project webs are all at the
stage where innovative frontrunners are in the process of developing and implementing
these solutions. Large enterprises and public clients are mainly driving the uptake of
these technologies, but the further development and uptake are dependent on a more
wide adaptation of these technologies by small and medium-sized enterprises. An
indicator of the speed of adaptation is the overall perceived significance of ICT and e-
business among enterprises.
Exhibit 5-1 below presents data from the 2006 e-Business W@tch Survey on the
perceived overall importance of e-business. About 1 in 6 construction enterprises
responded that e-business is a “significant part ” of the way they operate, while about 4 in10 said that e-business plays “some part ” in how they operate. Compared to the weighted
all-sectors average, the CI is below in both the two abovementioned groups. In addition,
more than 4 in 10 construction enterprises did not find any importance of e-business to
the way they operate. It is worth noting, however, that about a third of large enterprises
found that e-business is a significant part of the way they operate and another half said
that they find it playing some part in how they operate. It is, therefore, clear that e-
business plays a greater role for the large than for the micro and small enterprises in this
sector.
One reason for this could be the large number of SMEs with limited ICT experience and,
therefore, a limited perception of the impact and importance of ICT on their business.
Another reason that may explain these findings can be that the service provided by
construction enterprises is delivered mostly on-site and customised to individual client

7/28/2019 Construction 2006
http://slidepdf.com/reader/full/construction-2006 141/182
Construction
141
needs. This may mean that especially SMEs often cannot see the connection between
their business and the opportunities brought on by ICT.
Exhibit 5-1: Perceived overall importance of e-business fo r enterprise operations
14
10
12
11
30
23
42
38
43
51
44
47
0 20 40 60 80 100
Total Construction (EU-10)
Micro (1-9 empl.)
Small (10-49 empl.)
Medium (50-249 empl.)
Large (250+ empl.)
All 10 sectors (EU-10)
"Significant part of how w e operate" "Some part of how w e operate"
Base (100%): Companies using computers (excl. "don't know"). N (for sector, EU-10) = 744
Weighting: Totals (for the sector and for all 10 sectors) are weighted by employment and should be read as
“enterprises comprising…% of employment in the sector(s)”. Figures for size-bands are in % of enterprises from
the size-band. Questionnaire reference: H1
Source: e-Business W@tch (Survey 2006)
In relation to the perceived impact of e-business presented above, the survey also asked
respondents about the perceived influence of ICT on their business. The positive ICT
influence is mainly to be found within areas such as business process efficiency, internal
workflow processes and customer service.
Of the factors defined in Exhibit 5-2, influence on procurement costs and product/service
quality were rated the least significant. This is an interesting finding because, as argued
in Section 4.1, the main benefits of e-procurement is a decrease in procurement cost
through consolidation of the supplier base and the introduction of framework contracts. Inaddition, it was illustrated in Section 4.2 of this report that the main benefits from 3D
technology and project web are a minimisation of errors in construction and an increase
in the delivered quality of product/service. These findings could indicate that the main
benefits of some of the ICT trends presented in Section 4 are among the benefits which
enterprises find less interesting or significant to their business.
The findings presented in Exhibit 5-2 indirectly support the findings shown on Exhibit 3-27
in Section 3.8, according to which CI enterprises cannot identify the benefits of ICT, but
still find this technology complicated, expensive and not compatible. These factors may
make it difficult for enterprises to justify investments in ICT when they find it expensive
and often without perceived positive impact.

7/28/2019 Construction 2006
http://slidepdf.com/reader/full/construction-2006 142/182
Construction
142
According to the 2006 e-Business Survey results, about 4 in 10 construction enterprises
perceive a positive ICT impact on their internal workflow processes (see Exhibit 5-2).
However, as shown in Exhibit 3-13 in Section 3.4.1, only a limited number of CI
enterprises actually have ERP or document management systems installed. In addition,
as presented in Section 3.4.2, only a limited number of enterprises have implementedcollaborative design processes, forecasting of demand systems or share documents in
collaborative work spaces (see Exhibit 3-14).
The discussion in Section 4.3 highlighted that the current traditional workflow processes
in CI may constitute a barrier to the uptake of project webs and 3D technologies. These
two technologies actually have the potential to improve internal workflow processes. It
could, thus, be argued that construction enterprises may be more ready to implement
project webs and 3D technologies than implied by the above mentioned survey findings.
This might be the case because CI firms currently perceive the value of these systems to
be higher than that of e-procurement, for example (see Exhibit 5-2).
Exhibit 5-2: Perceived ICT influence on the enterprise's business
29
37
43
27
26
35
33-2
-2
-2
-2
-1
-1
-10 0 10 20 30 40 50
Revenue grow th
Business processes eff iciency
Internal w ork organisation
Procurement costs
Product/service quality
Customer service
Productivity
Negative Positive
Base (100%): Companies using computers. N (for sector, EU-10) = 754
Weighting: in % of firms. Questionnaire reference: H4
Source: e-Business W@tch (Survey 2006)
Impact on specific business areas
Exhibit 5-3 presents the survey findings concerning the perceptions of CI enterprises
about the positive effect of ICT on different business areas. Areas such as business
process efficiency, internal work processes and productivity are, according to the survey,
found by most enterprises in this sector to be positively affected by ICT. In the other end
of the spectrum are areas such as revenue growth and product/service quality which are
deemed to be least affected by ICT. These findings are in line with the findings from
Exhibit 5-2 and further support the argument put forward above that enterprises,
currently, see the role of ICT to be more about internal process optimisation than in areas
such as procurement, marketing and quality.

7/28/2019 Construction 2006
http://slidepdf.com/reader/full/construction-2006 143/182
Construction
143
Exhibit 5-3: Companies perceiving a positive influence of ICT on…:
Revenue grow th
29
31
36
39
32
44
0 20 40 60 80
Construc tion (EU-10)
1-9 empl.
10-49 empl.
50-249 empl.
250+ empl.
All 10 secto rs (EU-10)
Business process efficiency
36
46
62
76
57
50
0 20 40 60 80
Construc tion (EU-10)
1-9 empl.
10-49 empl.
50-249 empl.
250+ empl.
All 10 secto rs (EU-10)
Internal w ork processes
41
56
67
67
55
61
0 20 40 60 80
Construc tion (EU-10)
1-9 empl.
10-49 empl.
50-249 empl.
250+ empl.
All 10 secto rs (EU-10)
Procurement costs
27
27
43
44
38
35
0 20 40 60 80
Construc tion (EU-10)
1-9 empl.
10-49 empl.
50-249 empl.
250+ empl.
All 10 secto rs (EU-10)
Product /service quality
26
26
37
38
30
38
0 20 40 60 80
Construc tion (EU-10)
1-9 empl.
10-49 empl.
50-249 empl.
250+ empl.
All 10 secto rs (EU-10)
Customer service
35
40
47
41
52
40
0 20 40 60 80
Construc tion (EU-10)
1-9 empl.
10-49 empl.
50-249 empl.
250+ empl.
All 10 secto rs (EU-10)
Productivity
31
42
56
56
43
55
0 20 40 60 80
Construc tion (EU-10)
1-9 empl.
10-49 empl.
50-249 empl.
250+ empl.
All 10 secto rs (EU-10)
Base (100%): Companies using computers.N (for sector, EU-10) = 754
Weighting: Totals (for the sector and for all 10sectors) are weighted by employment and should beread as "enterprises comprising …% of employmentin the sector(s)". Figures for size-bands are in % of enterprises from the size-band.
Questionnaire reference: H4
Source: e-Business W@tch (Survey 2006)

7/28/2019 Construction 2006
http://slidepdf.com/reader/full/construction-2006 144/182
Construction
144
Compared to the other nine sectors studied this year by the e-Business W@tch, the CI
lags behind in perceived positive influence of ICT on all the studied business areas. Lack
of ICT skills among this sector’s SMEs and subsequent lack of possibilities to optimise
the use of ICT could explain some of the observed differences.
Across the nine specific business areas shown in Exhibit 5-3, micro-enterprises in
general claim fewer positive impacts of ICT than large enterprises. A clear pattern
appears, in which micro-enterprise cannot see the positive influence of ICT on their
business to the same extent as large enterprises. This observation practically confirms
the argument brought forward in Section 4.3, that especially SMEs in this sector have
difficulties in identifying the benefits of introducing ICT systems such as e-procurement,
3D technology and project webs into their business.
Impact on organisation
In both the CI and in the other 9 benchmarked sectors, around a third of the enterprisesperceive ICT as having a positive influence on “organisational structure” and “task and
job descriptions” (see Exhibit 5-4). The impact of ICT on outsourcing has been limited in
the CI and the data indicates that only about 1 in 5 enterprises experience a positive
effect from ICT on their outsourcing decisions. In addition, only about 1 in 3 said that they
see a positive impact from ICT on employee training. The impact on the organisation from
the implementation of ICT can, based on the survey results presented in Exhibit 5-4, be
argued to be somewhat limited.
Looking into different sizes of enterprises, a relationship exists between enterprise size
and perceived importance, indicating that ICT is more important to this sector’s large
enterprises than to the plethora of micro-firms and SMEs in CI. The same relationship is
observed as regards the influence of ICT on employee training. At an aggregate level, the
CI lags behind the weighted all-sectors average, which confirms a possible lack of
awareness of the ICT potential. This may in turn explain the lacking focus of this sector’s
companies on investments related to employee training in this area.

7/28/2019 Construction 2006
http://slidepdf.com/reader/full/construction-2006 145/182
Construction
145
Exhibit 5-4: Perceived important influence of ICT on…:
Organisational structure
30
31
42
51
39
36
0 20 40 60 80
Construc tion (EU-10)
1-9 empl.
10-49 empl.
50-249 empl.
250+ empl.
All 10 secto rs (EU-10)
Task and job descriptions
24
35
41
40
34
38
0 20 40 60 80
Construc tion (EU-10)
1-9 empl.
10-49 empl.
50-249 empl.
250+ empl.
All 10 secto rs (EU-10)
Em ployee t raining
20
26
45
53
41
31
0 20 40 60 80
Construc tion (EU-10)
1-9 empl.
10-49 empl.
50-249 empl.
250+ empl.
All 10 secto rs (EU-10)
Outsour cing decisions
18
20
22
39
22
27
0 20 40 60 80
Construc tion (EU-10)
1-9 empl.
10-49 empl.
50-249 empl.
250+ empl.
All 10 secto rs (EU-10)
Base (100%): Companies using computers. N (for sector, EU-10) = 754Weighting: Totals (for the sector and for all 10 sectors) are weighted by employment and should be read as
“enterprises comprising…% of employment in the sector(s)”. Figures for size-bands are in % of enterprises from
the size-band. Questionnaire reference: H7
Source: e-Business W@tch (Survey 2006)
ICT impact on competitiveness and productivity49
Public e-tendering has helped increase transparency in the procurement market for
construction contracts, giving easier access to tender notices for both large and small
construction enterprises. This increased access to tender information is expected toslightly improve the competitiveness of construction SMEs because they will spend fewer
resources on business intelligence in the search for available tenders.
e-Procurement as a tool to support strategic procurement is a development which is
already reported to offer savings for large enterprises (see Section 4.1 and the case
study about Skanska). The survey findings presented in Section 4.1, however, illustrated
the rather limited used of e-procurement (Exhibit 4-2), that most of the materials procured
online were raw materials and mixed products (Exhibit 4-4) and that most of the suppliers
49 For more information on the impact that ICT may have on enterprises’ competitiveness andproductivity, see e-Business W@tch Special Study on the "Impact of ICT on corporateperformance, productivity and employment dynamics" (2006), available at www.ebusiness-watch.org ('resources')."

7/28/2019 Construction 2006
http://slidepdf.com/reader/full/construction-2006 146/182
Construction
146
of e-procurement were mainly regional or national (Exhibit 4-5). In addition, SMEs more
seldom use e-procurement compared to medium-sized and large enterprises.
Based on these findings, it is argued that large construction enterprises, with buyer-driven
e-procurement systems, are expected to improve their competitive situation vis-à-vis
smaller enterprises. This change in competitiveness is rooted in the large volume of raw
material and intermediate products that large construction enterprises are able to
purchase. This high volume allows for more favourable contracts with raw and
intermediate material suppliers which lead to lower unit costs compared to construction
SMEs with more limited procurement volumes.
The case studies and business examples presented in Section 4.3 illustrate that the use
of project web solutions is expected to increase productivity through more efficient
communication between construction project stakeholders. However, the effect of this
trend is not expected to greatly affect the overall competitive situation in the CI. Cases
presented in this study indicate that project webs are not used as an external salesargument in connection with clients, but more often as an internal project-related
optimisation tool. The survey data support this argument by pointing out that the
construction enterprises see ICT and e-business more as a tool to optimise internal
processes than as an external, customer-oriented tool (see Exhibit 5-3).
Expected ICT impact in the future
As illustrated in Exhibit 5-6 below, CI enterprises anticipate that ICT will have the highest
impact on management, accounting and customer support, while they expect ICT to have
less future impact on production.
Indeed, by using ICT, the supply and value chain can be optimised due to better
information sharing and interlinking with suppliers. As discussed in Chapter 4, however,
the main benefits of 3D technology and project webs are envisaged on the production
process, where both systems have the potential to increase productivity. It is, therefore,
interesting that, according to the survey results, construction enterprises do not perceive
ICT as having high impact on production compared to other aspects of their business.
This might indicate that the benefits of these technologies have not been successfully
communicated to potential customers in the CI.

7/28/2019 Construction 2006
http://slidepdf.com/reader/full/construction-2006 147/182
Construction
147
Exhibit 5-5: Ant icipated future impact o f ICT
24
35
20
13
22
23
24
31
29
17
25
27
26
29
45
36
63
62
51
51
47
0 20 40 60 80 100
Management
Accounting
R&D
Production
Marketing
Logistics
Customer support
Expect high impact Expect medium impact Expect low /no impact
Base (100%): Companies using computers. N (for sector, EU-10) = 754
Weighting: by employment, i.e. figures should be read as “enterprises comprising…% of employment in the
sector”. Questionnaire reference: H8
Source: e-Business W@tch (Survey 2006)
At the same time, ICT is not expected to have any considerable impact on research and
development in CI enterprises. Interestingly, the same more or less perception has been
identified across most of the sectors studied this year –with the expected exception of
ICT-related industries. This seems surprising, because combining ICT and R&D can
create a competitive advantage. In CI, for example, 3D technology (discussed in Section
4.2) can lead to both product and process innovation through simulation of individual
components in the project and through complete construction simulation.
Concluding assessment
Exhibit 5-5 below shows the identified impact of ICT and e-business on the CI. The
implications are divided into implications for large and small enterprises. The scores are
not to be understood as 'exact' results of a quantitative computation, based on some
model; they are tentative, reflecting the opinion which the study team has formed, on the
basis of the survey findings of the analysed in Section 3 and 4.1 along with expert inter-views, the case studies presented in Section 4.1-4.3 and the literature review. Based on
this, the concluding assessment presented in Exhibit 5-5 should be regarded as a vehicle
for debate.
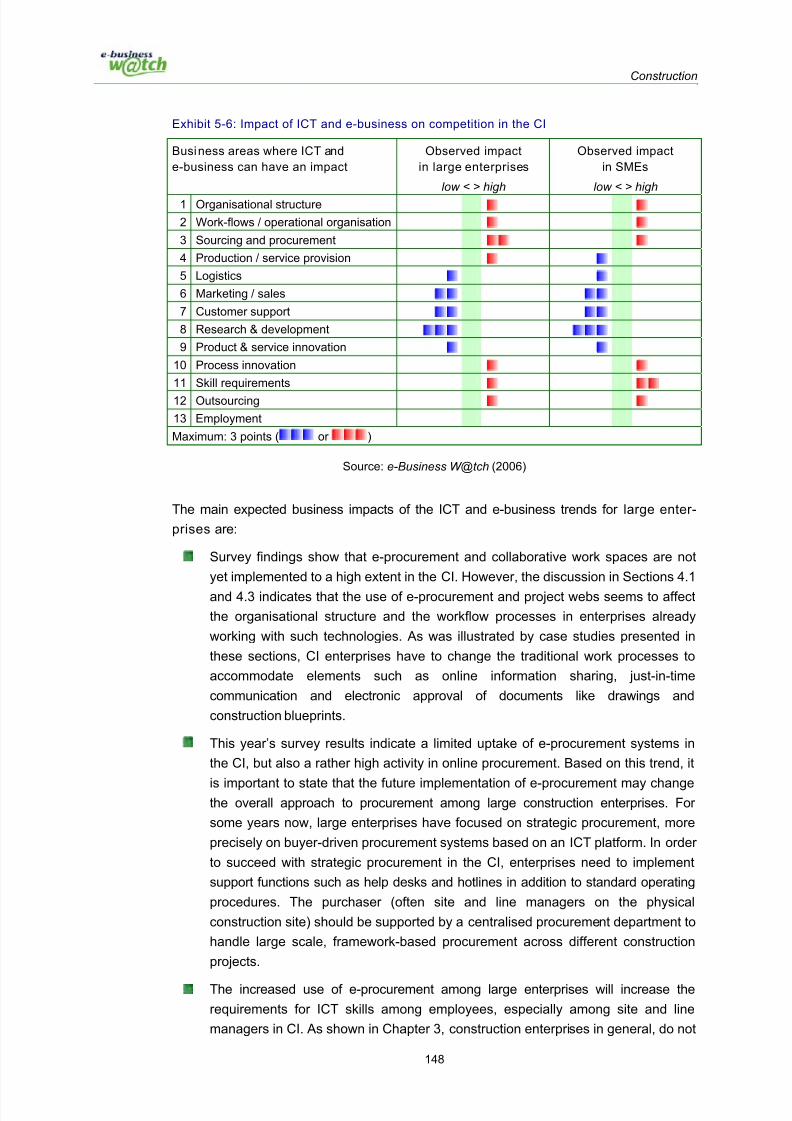
7/28/2019 Construction 2006
http://slidepdf.com/reader/full/construction-2006 148/182
Construction
148
Exhibit 5-6: Impact of ICT and e-business on competition in the CI
Business areas where ICT and
e-business can have an impact
Observed impact
in large enterprises
low < > high
Observed impact
in SMEs
low < > high
1 Organisational structure
2 Work-flows / operational organisation
3 Sourcing and procurement
4 Production / service provision
5 Logistics
6 Marketing / sales
7 Customer support
8 Research & development
9 Product & service innovation
10 Process innovation
11 Skill requirements
12 Outsourcing
13 Employment
Maximum: 3 points ( or )
Source: e-Business W@tch (2006)
The main expected business impacts of the ICT and e-business trends for large enter-
prises are:
Survey findings show that e-procurement and collaborative work spaces are not
yet implemented to a high extent in the CI. However, the discussion in Sections 4.1
and 4.3 indicates that the use of e-procurement and project webs seems to affect
the organisational structure and the workflow processes in enterprises already
working with such technologies. As was illustrated by case studies presented in
these sections, CI enterprises have to change the traditional work processes to
accommodate elements such as online information sharing, just-in-time
communication and electronic approval of documents like drawings and
construction blueprints.
This year’s survey results indicate a limited uptake of e-procurement systems in
the CI, but also a rather high activity in online procurement. Based on this trend, it
is important to state that the future implementation of e-procurement may changethe overall approach to procurement among large construction enterprises. For
some years now, large enterprises have focused on strategic procurement, more
precisely on buyer-driven procurement systems based on an ICT platform. In order
to succeed with strategic procurement in the CI, enterprises need to implement
support functions such as help desks and hotlines in addition to standard operating
procedures. The purchaser (often site and line managers on the physical
construction site) should be supported by a centralised procurement department to
handle large scale, framework-based procurement across different construction
projects.
The increased use of e-procurement among large enterprises will increase the
requirements for ICT skills among employees, especially among site and line
managers in CI. As shown in Chapter 3, construction enterprises in general, do not

7/28/2019 Construction 2006
http://slidepdf.com/reader/full/construction-2006 149/182
Construction
149
focus much either on hiring ICT practitioners or on regular ICT training of their
employees. Improved ICT skills, however, are necessary to take advantage of new
ICT technologies, such as project web solutions and 3D technology.
So far, 3D technology is only in use in selected projects, but experience indicates
that it does have an impact on this industry’s process innovation. Especially within
the activities of proposal writing, construction design, engineering and physical
construction, 3D technology may have profound impact on workflow processes.
The three selected technologies discussed in this study appear to have limited impact on
small and medium-sized construction enterprises, mainly because of their low uptake.
Nevertheless, some effect has been noted and the main identified impacts for small and
medium-sized enterprises include:
The introduction of a project web requires a change from traditional mail-based
communication among stakeholders to communication over a centralised project
web system. To reap all the benefits of project webs, stakeholders need to investtime in document description and handling, as well as in establishing new
operating processes for document handling and sharing. Survey findings presented
in Chapter 3 show that about 4 in 10 construction SMEs do not have a broadband
connection to the internet. Such a connection, however, is seen as a prerequisite
for implementation of project webs and its lack may impact this sector’s SMEs
negatively and decrease their competitiveness in the long run.
Concerning the ICT skills and capabilities among construction SMEs, the introd-
uction of e-procurement, 3D technology and project webs will require ICT skills
within several areas, such as handling of 3-dimensional drawings and blueprintsand electronic document handling. This means that the construction SMEs will
have to continuously, but probably not dramatically, upgrade ICT competences to
support the introduction of e-procurement, 3D technology or project webs.
5.1.2 Implications for industry structure
This section assesses the implications of ICT and e-business adoption on the structure of
the CI. As with the 2005 e-Business W@tch sector study on the CI, a 'five-forces-model',
developed by Michael E. Porter (1980), will by applied to discuss and assess e-business
implications on the industry’s structure.

7/28/2019 Construction 2006
http://slidepdf.com/reader/full/construction-2006 150/182
Construction
150
Ba c k g r o u n d i n f o rm a t i o n :
M i c h ae l E . Po r t e r ’ s F i v e -F o r c e s Mode l
The ‘Five Competitive Forces’ model was developed by Michael E. Porter in
his book “Competitive Strategy: Techniques for Analysing Industries and
Competitors“ in 1980. Since then, it has become an important tool for
analysing industrial structure, competition and strategic options of players.
Porter’s model is based on the insight that a corporate strategy should meet
the opportunities and threats in the organisation’s external environment.
Porter has identified five competitive forces that shape every industry and
every market. These forces determine the intensity of competition and,
hence, the profitability and attractiveness of an industry. The objective of
corporate strategy should be to modify these competitive forces in a way that
improves the position of the organisation. Porter’s model helps to identify the
main driving forces in an industry. Based on the information derived from the
Five Forces Analysis, enterprises can decide how to influence or to exploit
particular characteristics of their industry.
The instrument has been applied by e-Business W@tch since 2004/05 to
assess the influence of ICT and e-business on competition in a sector.
Michael E. Porter is Bishop William Lawrence University Professor at
Harvard Business School.
Even though industry experts and stakeholders are currently debating the effect and
impact of ICT on the development of the industry, the key drivers of competition are to a
high extent not to be found in ICT and developments in e-business. The expected
increase in rivalry in the European market due to cross-country enterprise consolidation
has limited origin in ICT related issues. The main driving forces and the major areas
where ICT and e-business will have an impact in the future are illustrated below. The
impacts illustrated graphically below are based upon the survey presented in Section 3
along with the analysis conducted in Section 4 and 5. In addition expert interviews with
academia and industry stakeholder have created the foundation for the following analysis.
The following section after Exhibit 5-7 elaborates on the findings of the Five Forces
analysis.

7/28/2019 Construction 2006
http://slidepdf.com/reader/full/construction-2006 151/182
Construction
151
Exhibit 5-7: Impact of ICT and e-business on competition in the CI
Competiti ve forces General importance
in the sector (currently)
low < > high
Impact of ICT and
e-business
low < > high
1 Threat of new entrants*
2 Substitution of products / services
3 Bargaining power of suppliers
4 Bargaining power of customers
5 Rivalry in the market
Maximum: 3 points ( or )
* "New entrants" in the sense of new enterprises being founded. “New entrants” in the sense of enterprises from
a different geographic area entering the European market are considered under "rivalry in the market".
Source: e-Business W@tch (2006), developed from Michael E. Porter
Threat of new entrants
There are different opinions about the impact of the EU enlargement on the CI. For some,
the accession of new Member States is perceived as having an important impact on this
industry. Others argue that this factor will not greatly change the competitive situation of
the European CI as a whole, but there may be, in some regions, an increase in new
entrants to the industry.
In any case, the introduction of ICT in enterprises is not expected to greatly affect the
possibilities for new entrants into the CI. The implementation of e-procurement, 3D and
project web technologies, for example, is mainly driven by the companies’ internal needto reduce mistakes in the construction process and increase efficiency in procurement
and communication. New entrants to the CI must have or acquire general ICT skills within
communication, accounting, document management, and process optimisation in order to
compete. These skills are, however, available in the marketplace from professional
education agencies and the like.
As regards the three technology trends discussed in this sector report, it can be said that
3D technology requires more specialised ICT skills in terms of engineering and design
skills. Such requirements, however, are not expected to be a barrier to potential new
entrants because these skills are available in the market place in the form of educated
personnel or can be acquired through training courses offered by professional institutions.
Substitution of products / services
The CI is not greatly affected by the issues of client substitution to other products and
services because there are no real alternatives to construction products/services.
Currently, there are no feasible alternatives for building owners when constructing
buildings and the like. Building owners can, however, choose to substitute between
different types of building materials. Due to architectural trends, some building materials
are more in fashion at certain times but it is argued that only a limited amount of building
materials need highly specialised know-how to install. In general, most types of building
materials can be applied by most enterprises.

7/28/2019 Construction 2006
http://slidepdf.com/reader/full/construction-2006 152/182
Construction
152
Bargaining power of suppliers
e-Procurement systems are gradually becoming more widely diffused, especially among
large construction enterprises. This development may decrease the bargaining power of
suppliers because buyers would then tend to engage in a limited number of framework
contracts. The possible limitation of the supplier base may increase competition among
suppliers of “off–the-shelf” construction products and raw materials, leading to decreased
bargaining power of suppliers. The case study of Skanska presented in Section 4.1 is an
example of the shift in bargaining power that can arise from the implementation of e-
procurement. In this case study, Skanska was able to negotiate more favourable
framework contracts with suppliers that resulted in lower procurement costs.
In some cases, such as design-protected materials, patented work processes or similar,
however, the construction enterprise is dependent on specialised supplies. This wouldput some suppliers in a more favourable position whereas suppliers with standardised
goods would be more vulnerable towards an opening of the market and the increased
transparency resulting thereof.
Bargaining power of customers
The bargaining power of the construction clients (customers) is already considered to be
high due to high competition in many EU Member States. The competitive situation is
affected by a rather stagnating market for the last few years which, until recently, have
given greater supply than demand. This has meant that the bargaining power of customers have been fairly high. The use of e-tendering by public and private clients may
further increase the bargaining power of the customers because a large number of
potential tenderers will have the ability to tender (due to greater information
transparency). An increased number of economic operators tendering for construction
contracts would lead to a decrease in prises and an increase in the bargaining power of
the clients / building owners.
As discussed in Chapter 4, some large construction enterprises focus on ICT-enabled
optimisation of internal workflow processes. In an effort to counteract the increased
external pressure, these companies aim at identifying potential cost savings that could
partly offset this external pressure on profitability.
Rivalry in the market
As described in Section 2.2, one trend in the CI is consolidation among building material
suppliers, engineers and construction enterprises. Rivalry in the construction market is
already considered high and the use of e-procurement is expected to add to this
development
Among complete construction enterprises, competitive rivalry is expected to be impacted
by the continuous consolidation among large enterprises. The uptake of ICT is, however,
not expected to impact this process, which is rather driven by volume and profitability
issues. This assessment is supported by survey results presented in Exhibit 5-8, which
indicate that about 1 in 10 enterprises finds competition to have significantly increased

7/28/2019 Construction 2006
http://slidepdf.com/reader/full/construction-2006 153/182
Construction
153
due to ICT, while about 1 in 4 enterprises argued that competition has somewhat
increased. Compared to the weighted all-sectors average, the CI does not consider the
impact of ICT on competitiveness to be as large. This observation is in line with findings
that CI enterprises, in general, do not perceive ICT to have as much influence on their
business as on average in the 10 sectors studied (see Exhibit 5-3). However, thesituation is different for the medium-sized and large construction companies; here, 45-
60% of all firms said that they have experienced at least some increase in competition
due to ICT. Among large firms, in particular, more than 20% said that ICT has led to a
significant increase in competition. Thus, the effect of ICT on competition might be more
pronounced for larger firms than for small ones in the CI.
Among building installation enterprises, the impact of ICT on competitiveness is even
smaller. Less than 1 in 10 found competition to have significantly increased due to ICT.
The rather limited perception of ICT impact on competitiveness may be attributed to the
low general uptake of ICT solutions by companies in this sub-sector, in connection with
internal focus of the ICT systems implemented in the CI.
Exhibit 5-8: Perceived impact of ICT on competition in the industry
26 21 2431
41
0
35
118 7
13
2117
-1-10-3-2-2
-20
0
20
40
60
80
Total
Construction
(EU-10)
M icro (1-9
empl.)
Small (10-49
empl.)
M edium (50-
249 empl.)
Large (250+
empl.)
All 10 secto rs
(EU-10)
"Significantly increased due to ICT"
"Somewhat increased due to ICT"
"Rather decreased due to ICT"
Base (100%): Companies using computers. N (for sector, EU-10) = 754
Weighting: Totals (for the sector and for all 10 sectors) are weighted by employment and should be read as
“enterprises comprising…% of employment in the sector(s)”. Figures for size-bands are in % of enterprises fromthe size-band. Questionnaire reference: H6
Source: e-Business W@tch (Survey 2006)

7/28/2019 Construction 2006
http://slidepdf.com/reader/full/construction-2006 154/182
Construction
154
5.2 Policy implications
The CI is undergoing significant changes due to internationalisation, increased
competitive pressure, consolidation and the resulting continuous requirements for higher productivity and efficiency (see Section 2.2.2).
The survey illustrated that the CI has limited focus on ICT skills development and
employment of ICT practitioners, and has a lower uptake of advanced ICT solutions such
as ERP, collaborative work spaces, and procurement systems, compared to the weighted
all-sector average. In this context, policies to promote ICT and e-business in the CI are
justified as one among different initiatives that may improve the uptake and use of ICT.
Due to the high turnover and number of jobs in the European CI, any improvements to
the competitiveness and effectiveness of European construction enterprises will have a
positive impact on other industries and may also have an impact on the European
economy as a whole.
Based on the analyses of this sector study n the CI, Exhibit 5-9 below illustrates the
possible implications arising from increased e-business activity in the CI.
Exhibit 5-9: Policy impli cations arising from e-business activity in the CI
Policy issues Possible initiatorsPolicy leverage
low < > high
1 Improve ICT skills
European Commission
National Governments
Regional Governments
Industry federationsBusiness support networks
2Raise awareness of ICT benefits andpotentials
European Commission
National Governments
Regional Governments
Industry federations
Business support networks
3 Facilitate the process of interoperability
European Commission
National Governments
Industry federations
Business support networks
Maximum: 3 points ( or )
Source: e-Business W@tch (2006)
Improve ICT skills
The survey results presented in Section 3.2 showed that construction enterprises have
limited focus on ICT skills development. Furthermore, ICT skills’ development was
identified as a challenge, especially for SMEs, in the three areas of ICT use discussed in
Chapter 4, perhaps most importantly in the transition to 3D technology. Large enterprises
(acting as prime contractor/business partner) and clients from the public sector areimportant drivers in this development, in the sense that they formulate new requirements
for ICT use in SMEs, but also by providing information about new ICT. In most countries

7/28/2019 Construction 2006
http://slidepdf.com/reader/full/construction-2006 155/182
Construction
155
in the European Union, ICT skills are already a part of existing business training and
education programmes. Thus, any new initiatives aiming at ICT skills development should
be coordinated and promoted locally to ensure commitment from local stakeholders and
the customisation of content to country specificities.
As was discussed in the 2006 e-Business W@tch Workshop on the CI sector study, the
European e-Skills Forum50, established by the European Commission and the CEN
Workshop Agreement (CWA)51 could be appropriate fora to discuss the issue of ICT skills
development in the CI. A product of such discussion could be an assessment of
required skills for enterprises in the CI. The required skills can be provided at a general
level, such as public education, or it can be about more specific ICT skills which could be
provided by vocational and higher education institutions or professional educational
programme vendors (private operators). In connection with this identification of ICT skills
requirements, the terminology of the e-Skills Forum concerning ICT practitioner skills, ICT
user skills and e-business skills should be applied (see European e-Skills Forum 2004, p.
6). It is important, however, to bear in mind that any public initiative to support and
improve ICT skills among enterprises should not interfere with private markets for training
and education, thereby possibly creating market imbalances.
In addition, it is recommended that industry and trade associations play a more active
role in the identification of the abovementioned ICT skill requirements. Knowledge from
enterprises could be filtered through industry and trade associations to the e-Skills Forum
and the CEN to support work toward identification of possible ICT skills gaps and the
solution to such issues.
Raise awareness of ICT benefits/ potentials and e-business policies
The analysis in this sector study has shown that raising awareness about ICT and e-
business is important. The survey illustrated that fewer enterprises in the CI found ICT
important for their business compared to the weighted all-sectors average.
Based on these findings, it appears that there is still need for policy to focus on raising
awareness among CI enterprises on the potential benefits and risks of ICT. Furthermore,
the public sector can play a more active role as promoter of ICT. Through its role as an
important client, the public sector can play a central role in encouraging the use of e-
construction and at the same time save money in its own administrative procedures.
Examples of an active role in this field include requirements for using e-tendering, e-signatures and 3D technology in public construction works.
In addition, analysis in this report and discussion at the 2006 e-Business W@tch
Workshop on the CI suggest that the European Commission and national authorities
could promote the uptake of ICT in the CI by encouraging the identification of best case
examples from enterprises already using ICT with success. Although construction
enterprises are already aware of the basic benefits and requirements of ICT, real case
examples of successful ICT implementation by their peers would be a good way of
50 For more information on the e-Skills Forum, see http://communities.trainingvillage.gr/esf 51 For more information on CEN Workshop Agreement (CWA) www.cenorm.be

7/28/2019 Construction 2006
http://slidepdf.com/reader/full/construction-2006 156/182
Construction
156
promoting further uptake in this industry. CI associations also have a role to play in this
respect, by facilitating peer-to-peer demonstrations of implemented ICT solutions.
Facilitate the process of interoperability
Setting standards and promoting interoperability is the third important policy implication
identified based on the analysis of this sector study. The 2006 e-Business Survey
findings indicated that a limited number of construction enterprises use e-standards.
Results presented in Section 3.3 also suggest that there is no immediate migration trend
in CI towards more advanced e-standards such as XML. In addition, according to
responses presented in Section 3.8, incompatibility of software is one of the main barriers
for ICT uptake in the CI. Furthermore, within each of the three technologies presented in
Chapter 4, there are a number of issues related to standardisation. Thus, a common e-
standard would be desirable.
The European Commission is supporting the work on ICT standards and interoperability,including the interoperability of networks, which is performed by the European Committee
for Standardisation (CEN - www.cen.eu, June 2006). This sector study could provide the
basis for a discussion on three issues which are of particular relevance for the CI:
flexibility and upgrade of e-standards,
market-dominating standards adopted by large IT providers, and
the introduction of e-signatures.
The work towards common standards has promising benefits for the uptake of ICT in the
CI but it would also be relevant for analysing the potential benefits of introducingstandard transfer protocols instead of e-standards. Proponents of the introduction of a
standard transfer protocol as opposed to a general e-standard argue that general
standards take too long to be agreed upon, will be outdated when introduced, and that
these solutions are hard to be implemented in upgrades by IT providers. It is also argued
that a standard transfer protocol is a more flexible solution that leaves room for frequent
technology and content upgrading. This discussion, however, is an open debate and
policy makers – notably at the European level – could invest in analysing the benefits and
drawbacks of these two approaches.

7/28/2019 Construction 2006
http://slidepdf.com/reader/full/construction-2006 157/182
Construction
157
References
Books, scientific articles and information material
Aberdeen Group 2005, Best practices in E-Procurement – Reducing Costs and Increasing
Value through Online Buying, December 2005
Alexander et al. 1998, Information and Communication on Construction: Closing the Loop. In
Construction Informatics Digital Library, Paper W78, 4. 1998
Andersen et al 2003, Fractional institutional endeadvors and E-Procurement in local
government. In Proceedings of the 16th Bled eCommerce Conference - eTransformation,
2003
B3D-konsortiet 2006a, Det Digitale Byggeri, IT-undersøgelse i byggeriet,
Spørgeskemaundersøgelse: Arkitekt, 2006
B3D-konsortiet 2006b, Det Digitale Byggeri, IT-undersøgelse i byggeriet,
Spørgeskemaundersøgelse: Bygherre, 2006
B3D-konsortiet 2006c, Det Digitale Byggeri, IT-undersøgelse i byggeriet,
Spørgeskemaundersøgelse: Ingeniør, 2006
Build On-line 2006, East Thames success stories, 2006
Buschak 2006, European Foundation for the Improvement of Living and Working Conditions,
2006
Carr, Nicholas (2003). "IT Doesn't Matter". In: Harvard Business Review, May 2003.
Cederblad 2001, The Construction Industry Builds its First Global e-Marketplace. In Industry
Focus Construction, 2001
CIFS 2006, New Market Opportunities for Construction, www.cifs.dk, September 2006
CMAA 2005, Sixth Annual Survey of Owners, Construction Management Association of
America (CMAA), 2005
CMAA 2004, Fifth Annual Survey of Owners, Construction Management Association of
America (CMAA) 2004
Constructware 2001, The 2001 Constructware Client Impact Study, 2001
Constructware 2005, The Strategic Role of Web-Based .Communication in the Design and
Construction Life Cycle, 2005
CSTC 2005, Les Portails de Projects – Gestion collaborative électronique de documents dans
les projects de construction, Rapport Centre Scientifique et Technique de la Construction(CTSC), No. 8, 2005
Cyon 2002, Keys to Success in the Web-based Project Management, Cyon Research
Corporation, 2002
EBS 2005, Annual Report, Activity Report, EU Builders - European Builders Confederation,
Luxembourg: Annual Congress 2005
e-Business W@tch 2004a, European Commission. Electronic Business in Craft & Trade. e-
Business Sector Study on the Craft and Trade Industry, May and August 2004. Sector
Studies No. 05-I and No. 05-II
e-Business W@tch 2004b, European Commission. The European e-Business Report 2004. a
portrait of e-business in 10 sectors of the EU economy. Luxembourg: Office for Official
Publications of the European Communities, 2004

7/28/2019 Construction 2006
http://slidepdf.com/reader/full/construction-2006 158/182
Construction
158
e-Business W@tch 2005a, European Commission. ICT and Electronic Business in the
Construction Industry. e-Business Sector Study on the Construction Industry, July 2005.
Sector Study No. 08-I
e-Business W@tch 2005b, European Commission. ICT and Electronic Business in the
Construction Industry. e-Business Sector Study on the Construction Industry, September
2005. Sector Study No. 08-II
eMarket Services 2005a, Benefits and barriers on B2B E-marketplaces, December 2005
eMarket Services 2005b, E-Government and e-Procurement, July 2005
eMarket Services2005c, E-marketplaces in the construction industry, May 2005
eMarket Services 2005d, Public e-procurement via e-market places, 2005
eMarket Services 2005e, E-marketplaces for the government and public sector, September
2005
EMCC 2005, Trends and drivers of change in the European CI: Mapping report, European
Monitoring Centre on Change (EMCC), 2005
European Builders Confederation 2005, Annual Report, 2005
European Commission 2004, Competitiveness working group on e-construction Phase II
(2001-2003) Final Report. Brussels: Enterprise Directorate-General Construction Unit,
2004
European E-Skills Forum 2004, http://ec.europa.eu/enterprise/ict/policy/doc/e-skills-forum-
2004-09-fsr.pdf, 2004
Eurostat 2006, Euro Indicators, News release 33/2006, 10 March 2006.
Evans 2003, Who will pay for the Building Information Model, Cambashi Limited, 2003
FIEC 2004, Key Figures – Construction in Europe, European Construction Industry Federation
(FIEC), 2004
FIEC 2006, Key Figures – Construction in Europe, April 2006
Grassi et al. 1999, The Virtual Construction Enterprise, 1999
IADB 2002, Standard Procurement Documents: User’s Guide for Prequalification Documents
for Procurement of Work, Inter-American Development Bank (IADB), December 2002
IDABC 2002, E-Procurement Case studies, 2002
Inhouse Consulting 2006, Det Digitale Byggeri, Implementering af byggeherrekravene.
Analyse af kompetencebehovene, Appendiks A, 2006
Martin 2003, e-Procurement and Extranets in the UK Construction Industry. In Current
Developments in Construction Economics, FIG Working Week, 2003
Medi@construct 2004, Newsletter #6, March 2004
NIST 2004, Cost Analysis of Inadequate Interoperability in the U.S. Capital Facilities Industry,National Institute of Standards and Technology (NIST), 2004
Lootah 2006, e-Procurement in UAE, OECD, 2006
Porter, Michael E. (1985). Competitive Advantage. New York: Free Press. Page references in
quotations refer to the Free Press Export Edition 2004.
Porter, Michael E. (1980). Competitive Strategy. New York: Free Press. Page references in
quotations refer to the Free Press Export Edition 2004.
Pro IT News 2006, January 2006
Ricaud 2006, Pricewaterhouse Coopers Construction Viewpoints 2006
Skanska 2005, Annual Report, 2005
Terry 2005, Real Life Experience with BIM in Large Projects, IAI Oslo, June 2005 Tredal & Johnsen 2005, 3D projketering hos rådgiver, BYG-DTU 2005
UBS 2006, Outlook Swiss Sectoral Trends 2006

7/28/2019 Construction 2006
http://slidepdf.com/reader/full/construction-2006 159/182
Construction
159
UK Construction Federation 2006, A beginners Guide to e-business in construction, 2006
University of New South Wales 2002, An Overview of eBusiness Impacts on Product Supply in
Construction, 2002
Wakeling 2006, Electronic Public Procurement, Eeuropean Commission, 2006
Yeomans 2005, ICT-enabled Collaborative Working Methodologies in Construction,Loughborough University, 2005
Young 2005, IAI, Interoperability – a Growing Understanding and Momentum Update from the
United States, International conference for Government and Industry, Oslo, Norway,
June 2005
Websites
Camecon, www.camecon.com, April 2006
Citadon, www.citadon.com/downloads/CS_Odebrecht_EPC_ProjectNet.pdf , March 2006
CMAA, www.cmaanet.org , March 2006
CSC, www.csc.com, March 2006
e-Market Services, www.emarketservices.com, March 2006
European Commission, www.europe.eu.int , March 2006
European Commission, http://europa.eu.int/comm/enterprise/construction, April 2006
European Committee for Standardization, www.cen.eu, June 2006
FIEC, www.fiec.org , April 2006
IAI, www.iai-international.org , March 2006
IAI France, www.iai-france.org/telechargement/IFC_en_3_pages.pdf , March 2006
www.prosys.com, March 2006
PWC, www.pwc.com/extweb/indissue.nsf/docid/68211BF9BDBFEF0685256CF4001DFE9B, April 2006
SPIE Batignolles, www.spiebatignolles.fr , March 2006
Interviews conducted for this report
Bettina Schneider, Beschaffungsamt des Bundesministeriums des Innern in Berlin, April 2006
David Barbin, Engineer, Spie SCGPM, March 2006
Dominique Caradant, Directeur Développement, FORMI SA
Emmanuel Netter, Head of Marketing, Prosys
Eric Bessone, Sales Manager, Building Solutions Division, Autodesk France, March 2006
Farzin Saber, Professional Relations Manager, IBX, March 2006
Jean-Yves Ramelli, French Ministry of Equipment, March 2006
Marc Christopher Schmidt, Beschaffungsamt des Bundesministeriums des Innern, March
2006
Michael Schwartz, Nordic Responsible Construction, February 2006
Per Finnhammar, Project Manager for the Skanska e-procurement project, IBX, March 2006
Pernille Buchhof Pedersen, Project Manager, IBX, March 2006
Rui Oliveira, Business Development Manager within Micrograf, Portugal, March 2006
Sonja Branskat, Beschaffungsamt des Bundesministeriums des Innern, April 2006
Steen Læssøe, Industry Sales Director, Bentley, February 2006

7/28/2019 Construction 2006
http://slidepdf.com/reader/full/construction-2006 160/182
Construction
160

7/28/2019 Construction 2006
http://slidepdf.com/reader/full/construction-2006 161/182
Construction
161
Annex I: The e-Business Survey 2006 –
Methodology Report
Background and scope
e-Business W@tch collects data relating to the use of ICT and e-business in Europeanenterprises by means of representative surveys. The e-Business Survey 2006, which wasthe fourth survey after those of 2002, 2003 and 2005, had a scope of 14,081 telephoneinterviews with decision-makers in enterprises from 29 countries, including the 25 EUMember States, EEA and Acceding / Candidate Countries.52 Interviews were carried outin March and April 2006, using computer-aided telephone interview (CATI) technology.
Questionnaire
The questionnaire is similar to those used in the previous surveys from 2002 to 2005 inorder to ensure a basic continuity of the research approach. The module on ICT impactwas substantially extended compared to 2005, in response to current policy interest, inexchange for some questions from other modules.
Some questions which were also used in previous surveys were slightly modified. Themost important change in this context concerns questions on e-commerce: up to 2005,companies were asked whether they "purchase / sell online"; in 2006, companies wereasked whether they "place / accept orders online". This is a more precise question, sincethe terms "purchasing" and "selling" leave it open whether ordered goods also have to bepaid online in order to qualify for "online purchasing / selling".
Some specific topics were added or expanded in the questionnaire in order to reflect thelatest e-business developments; examples are the new questions on the use of RFID andVoice-over-IP.
The questionnaires of all four surveys (2002, 2003, 2005, 2006) can be downloaded fromthe e-Business W@tch website (www.ebusiness-watch.org/about/methodology.htm).
Population
As in 2005, the survey considered only companies that used computers. Thus, thehighest level of the population was the set of all computer-using enterprises which wereactive within the national territory of one of the 29 countries covered, and which had their
primary business activity in one of the 10 sectors specified on the basis of NACE Rev.1.1.Evidence from previous surveys shows that computer use can be expected to be 99% or more in all sectors among medium-sized and large firms. Differences are more relevant,however, for micro and small enterprises, in particular in the food and beverages industry,the textile and footwear industries, construction and tourism. In these four sectors, 10-30% of micro enterprises and 4-15% of small firms (depending on the country and sector)do not use a computer.53 This should be considered when comparing figures over the
52 The EEA (European Economic Area) includes, in addition to EU Member States, Iceland,Liechtenstein and Norway. Acceding Countries with whom an Accession Treaty has beensigned are Bulgaria and Romania; Candidate Countries, which are candidates for accession
into the EU, are (as of September 2006) Croatia, the former Yugoslav Republic of Macedonia,and Turkey. In most of these countries, interviews and/or case studies were conducted.
53 Non-computer users include typically small craft firms (textile, construction), bars, restaurants or pensions (in tourism), and small food producing companies.

7/28/2019 Construction 2006
http://slidepdf.com/reader/full/construction-2006 162/182
Construction
162
years, as figures either represent a percentage of "all companies" (as in 2002 and 2003)or a percentage of "companies using computers" (as in 2005 and 2006). Differences areminimal, though, when figures have been weighted by employment.
The 10 sectors which were selected for the 2006 survey are extremely heterogeneous interms of their size. Construction and tourism are by far the largest with about 1.5 million
enterprises in each of the EU-25.54 At the other end of the range is the consumer electronics industry with about 5,400 enterprises; this is a factor of about 280 betweenthe largest and smallest sector. This imbalance has inevitably a substantial impact onweighting and thus on aggregate results, which are dominated by figures fromconstruction and tourism.
Table 1: Population coverage of the e-Business Survey 2006
No. NACE Rev. 1.1 Sectors covered No. of
enterprises
in EU-25 *
No. of
interviews
conducted
1 DA 15 (most groups) Food and beverages 282,000 1,709
2 DC 19.3 Footwear 13,700 980
3 DE 21 Pulp, paper and paper products 18,400 1,158
4 DL 30, 32.1+2 ICT manufacturing 31,800 1,687
5 DL 32.3 Consumer electronics 5,400 665
6 DM 35.11 Shipbuilding and repair 7,200 150
7 F 45.2+3 (selectedclasses)
Construction 1,546,000 2,655
8 H 55.1/3, I 63.3,O 92.33/52
Tourism 1,500,000 2,663
9 I 64.2 Telecommunication services 12,900 1,580
10 N 85.11 Hospital activities (e) 13,000 834
* mostly based on Eurostat SBS, latest available figures
(e) = estimated on the basis of figures for the former EU-15 (no figures available for EU-25)
Sampling frame and method
No cut-off was made in terms of minimum size of firms. The sample drawn was a randomsample of companies from the respective sector population in each of the countries, withthe objective of fulfilling minimum strata with respect to company size class per country-sector cell. Strata were to include a 10% share of large companies (250+ employees),30% of medium sized enterprises (50-249 employees), 25% of small enterprises (10-49employees) and up to 35% of micro enterprises with less than 10 employees.
Samples were drawn locally by fieldwork organisations based on official statistical
records and widely recognised business directories such as Dun & Bradstreet or Heinsund Partner Business Pool (both used in several countries).
The survey was carried out as an enterprise survey: data collection and reporting focuson the enterprise, defined as a business organisation (legal unit) with one or moreestablishments.
Due to the rather small population of enterprises in some of the sectors, target quota,particularly in the larger enterprise size-bands, could not be accomplished in each of thecountries. In these cases, interviews were shifted to the next largest size-band (fromlarge to medium-sized, from medium-sized to small), or to other sectors.
54 Construction (NACE Rev. 1.1 F 45) in total has about 2.3 million enterprises. The sub-sectorscovered in 2006 (see Table 1) account for about 1.5 million out of these.

7/28/2019 Construction 2006
http://slidepdf.com/reader/full/construction-2006 163/182
Construction
163
Fieldwork
Fieldwork was coordinated by the German branch of Ipsos GmbH (www.ipsos.de) andconducted in cooperation with its local partner organisations (see Table 2) on behalf of e-
Business [email protected]
The survey had a scope of 14,081 interviews, spread across the 29 countries and 10industries covered. In 10 countries ("EU-10"), all 10 sectors were covered; in the other countries, selected industries were surveyed. In most countries, between 400 and 750interviews were conducted. Pilot interviews prior to the regular fieldwork were conductedwith 23 companies in Germany in February 2006, in order to test the questionnaire(structure, comprehensibility of questions).
Table 2: Institutes that conducted the fieldwork of the e-Business Survey 2006 and no. of
interviews per country (#)
Institute # Int. Institute # Int.
BE Ipsos Belgium, 1050 Brussels 400 MT Misco International Ltd.,Valetta VLT 04
101
CZ Ipsos Czech Republic, Skolska32/694, 110 00 Praha 1
750 NL Ipsos Belgium, 1050 Brussels 400
DK Vilstrup Research AS, 1360Copenhagen
403 AT Spectra Marktforschungs-gesellschaft m.b.H., 4020 Linz
400
DE Ipsos GmbH, 23879 Mölln 800 PL Ipsos Poland, 02-508Warszawa
752
EE Marketing and Public OpinionResearch Centre SKDS, RigaLV-1010
314 PT Ipsos Portugal, 1070-15Lisbon
400
EL Synovate Hellas, 15451 Athens 407 SI GfK Gral-Iteo trazne raziskave
d.o.o., 1000 Ljubljana
400
ES Ipsos Eco Consulting, 28036Madrid
754 SK GfK Slovakia Ltd., 813 41Bratislava 1
400
FR Ipsos France, 75739 Paris 751 FI Taloustutkimus Oy, 00510Helsinki
752
IE Landsdowne Market Research,Dublin 1
400 SE GfK Sverige AB, 22100 Lund 400
IT Demoskopea S.p.A., 00199Roma
756 UK Continental Research,London EC1V 7DY
750
CY Synovate Cyprus, 2107 Nicosia 209 EEA and Acceding/Candidatecountries
LV 432 NO Norstat Norway, 0159 Oslo 401
LT
Marketing and Public OpinionResearch Centre SKDS, RigaLV-1010
404 BG TNS BBSS GallupInterbational, 1164 Sofia
400
LU Ipsos GmbH, 23879Mölln/20097 Hamburg
117 RO Field Insights, Bucharest 2 440
HU Szonda Ipsos, 1096 Budapest 772 TR Bilesim InternationalResearch & Consultancy Inc.Turkey, 34676 Istanbul
400
55 The survey was carried out under two different contracts. The survey in the six largest EUcountries (DE, ES, FR, IT, PL, UK) was carried out as part of the e-Business W@tch contractbetween the European Commission and empirica GmbH; the survey in the other countries wascarried out in parallel, but under a different contract (following an open call for tender for the"extended e-Business W@tch survey", issued in 2005).

7/28/2019 Construction 2006
http://slidepdf.com/reader/full/construction-2006 164/182
Construction
164
Non response: In a voluntary telephone survey, in order to achieve the targetedinterview totals, it is always necessary to contact more companies than just the number equal to the target. In addition to refusals, or eligible respondents being unavailable, anysample contains a proportion of "wrong" businesses (e.g., from another sector), andwrong and/or unobtainable telephone numbers. Table 3 shows the completion rate by
country (completed interviews as percentage of contacts made) and reasons for non-completion of interviews. Higher refusal rates in some countries, sectors or size bands(especially among large businesses) inevitably raises questions about a possible refusalbias. That is, the possibility that respondents differ in their characteristics from those thatrefuse to participate. However, this effect cannot be avoided in any voluntary survey (be ittelephone- or paper-based).
Table 3: Interview contact protocols: completion rates and non-response reasons (2006, examples)
CZ DE ES FR HU IT NL PL FI UK
1 Sample (gross) 5595 7763 7730 8686 21540 8533 4576 11054 3016 11821
1.1 Telephone number doesnot exist
283 1055 0 186 5545 717 349 2282 139 2663
1.2 Not a company (e.g.private household)
79 80 356 66 2076 89 219 681 34 324
1.3 Fax machine / modem 56 48 0 79 1120 61 28 53 4 130
1.4 Quota completed ->address not used
43 124 660 1939 1665 2154 1002 877 66 158
1.5 No target person incompany
17 359 730 142 9 178 232 959 319 736
1.6 Language problems 9 18 0 25 0 1 36 0 41 20
1.7 No answer on no. of employees
2 1 10 13 6 8 1 19 1 0
1.8 Company does not usecomputers
48 47 158 250 279 314 235 460 28 51
1.9 Company does not
qualify134 330 103 156 0 113 47 813 49 215
Sum 1.1 – 1.9 671 2062 2017 2856 10700 3635 2149 6144 681 4297
2 Sample (net) 4924 5701 5713 5830 10840 4898 2427 4910 2335 7524
2.1 Nobody picks up phone 1071 582 1645 6 1023 647 82 513 22 1898
2.2 Line busy, engaged 83 122 57 46 89 0 3 73 1 1
2.3 Answering machine 143 145 121 1315 1200 0 9 127 1 145
2.4 Contact person refuses 2080 1125 2553 131 2011 729 1653 2009 578 2523
2.5 Target person refuses 450 1865 202 1475 2776 642 113 280 405 1618
2.6 No appointment duringfieldwork period
3 11 70 182 2571 384 112 150 50 376
2.7 Open appointment 295 953 35 1896 258 1041 21 763 459 51
2.8 Target person is ill /unavailable 2 31 0 0 0 13 0 29 2 32
2.9 Interview abandoned 43 67 271 29 108 686 34 176 15 130
2.10 Interview error, cannotbe used
4 0 5 5 32 0 0 38 50 0
Sum 2.1 – 2.10 4174 4901 4959 5085 10068 4142 2027 4158 1583 6774
3 Successful interviews 750 800 754 751 772 756 400 752 752 750
Completion rate (= [3] /[2])
15% 14% 13% 13% 7,12% 15% 16,48% 15% 32% 10%
Average interview time(min:sec)
19:19 18:46 17:29 19:39 17:14 16:43 19:00 23:44 20:19 20:16

7/28/2019 Construction 2006
http://slidepdf.com/reader/full/construction-2006 165/182
Construction
165
Feedback from interviewers
No major problems were reported from the fieldwork with respect to interviewing(comprehensibility of the questionnaire, logical structure). The overall feedback from the
survey organisations was that fieldwork ran smoothly and that the questionnaire was wellunderstood by most respondents. The main challenge was the fulfilment of the quotas,which was difficult or impossible in some of the sectors, in particular among the larger size-bands. Some of the more specific remarks from fieldwork organisations, which pointat difficulties encountered in the local situation, are summarised in Table 4.
Table 4: Comments by national fieldwork companies on their experience (2006, examples)
Country Comments
Belgium • The questionnaire was very clear.• Business-to-business (B2B) research (i.e. surveys on behalf of companies or authorities
amongst companies) is often difficult when the questionnaire length is longer than 15minutes; target persons often complained that they have no time for an interview during
their normal work.• Positive reaction from respondents that the results can be found on the website.
Bulgaria • Many companies (especially within the tourism sector) have outsourced their ICToperations. Therefore, it was sometimes difficult for respondents to understand thequestions.
Czech Republic • It was difficult to fulfil quotas in several sectors which are mainly represented by verysmall companies, often by one-person-companies (self-employed), many of which arenot willing to do a relatively long interview. There was a high percentage of refusalsamong micro-companies.
Denmark • Some technical terms (such as internet protocol, LAN, W-LAN, VPN, RFID, and EDI)were hard for interviewers and respondents to understand.
Finland • The questionnaire was quite long and that is why there were more refusals than normal.• Smaller companies often refused to answer or interrupted the interview because they
thought that they did not know enough about e-business. Respondents in the pulp andpaper sector were especially not interested in this topic due to comparably low ICTusage.
Germany • As with previous e-Business surveys carried out, fieldwork ran relative smoothly overalland the questionnaire was easy to understand and interesting for most of respondents.
• Respondents from small companies often had difficulty when answering questionsrelated to specific technical terms and applications.
• Respondents reacted positively to the fact that the survey was carried out on behalf of the European Commission.
Greece • There were several cases where companies have outsourced the IT support and thusthere was no person to interview.
• Respondents who were not IT specialists found some of the IT terminology difficult tounderstand.
Spain • Fieldwork did not run as smoothly as expected due to several bank holidays occurring
during the period, therefore it was difficult to reach the target persons.• IT professionals in large companies were the most available.
France • In general, the fieldwork went without any problems and the questionnaire wasunderstood by the respondents.
• For some sectors, the lack of contact addresses was a serious problem.• For future surveys, the case concerning new companies which cannot answer the
financial questions should be considered.
Hungary • The cooperation level in this survey was similar to other telephone surveys amongcompanies; but a problem was that many small companies use only one computer, andonly for basic functions.
Ireland • The B2B sector (not general population or household surveys) is very over researched inIreland; hence there was a high level of refusals.
• In Ireland more than 90% of businesses employ less than 9 employees so many
companies do not have the need nor use for ICT.

7/28/2019 Construction 2006
http://slidepdf.com/reader/full/construction-2006 166/182
Construction
166
Italy • Many refusals among the smallest and/or family owned business, where only one PC isavailable and used more for personal reasons than for business.
• Respondents often lost their patience because considering the low use of the PC in their business, they had to spend time on the phone always giving the same answers ("no, donot use …").
Latvia • The main problem was the length of the questionnaire. Although the average interviewlength was 16 minutes and thus the shortest of all participating countries, surveys amongcompanies with interviews lasting more than 15 minutes are generally not recommendedin Latvia.
• It was rather hard for IT managers to answer about budget, market shares and so on.
The Netherlands • The questionnaire was very clear, so positive.
• Business-to-business surveys are often difficult when the questionnaire length is longer than 15 minutes.
• Secretaries/receptionists in the Netherlands are very well trained in refusing thetransferring of a call.
Norway • Interviewers experienced that many respondents / businesses did not wish to participatedue to the topic of the survey. Main reason was that they did not feel competent,although they qualified from the results of the screening.
Poland•
There were some difficulties in getting an interview with computer/IT specialists. In manybig companies they refuse to take time for an interview.• Many small companies did not understand some of the more technical terms.
Sweden • The questionnaire was understood by most of the respondents.
UK • Although some of the questions do appear to be quite technical, this did not prove aparticular problem for respondents.
• There was a very low universe of companies in certain quota cells. Given the limitedsample available in some sectors, and the need to target a high proportion of largecompanies, a longer field period would probably have helped to maximize the number of complete interviews.
• It is becoming increasingly difficult to secure interviews with IT/DP professionals, and wesuspect that this situation will only worsen in the future.
Weighting schemes
Due to stratified sampling, the sample size in each size-band is not proportional to thepopulation numbers. If proportional allocation had been used, the sample sizes in the250+ size-band would have been extremely small, not allowing any reasonablepresentation of results. Thus, weighting is required so that results adequately reflect thestructure and distribution of enterprises in the population of the respective sector or geographic area. e-Business W@tch applies two different weighting schemes: weightingby employment and by the number of enterprises.56
Weighting by employment: Values that are reported as employment-weightedfigures should be read as "enterprises comprising x% of employees" (in therespective sector or country). The reason for using employment weighting is thatthere are many more micro-enterprises than any other firms. If the weights did nottake into account the economic importance of businesses of different sizes in someway, the results would be dominated by the percentages observed in the microsize-band.
Weighting by the number of enterprises: Values that are reported as "x% of enterprises" show the share of firms irrespective of their size, i.e. a micro-companywith a few employees and a large company with thousands of employees bothcount equally.
56 In the tables of this report, data are normally presented in both ways, except for data by size-bands. These are shown in % of firms within a size-band, where employment-weighting isimplicit.

7/28/2019 Construction 2006
http://slidepdf.com/reader/full/construction-2006 167/182
Construction
167
The use of filter questions in interviews
In the interviews, not all questions were asked to all companies. The use of filter questions is a common method in standardised questionnaire surveys to make the
interview more efficient. For example, questions on the type of internet access used wereonly asked to those companies that had replied to have internet access. Thus, thequestion whether a company has Internet access or not serves as a filter for follow-upquestions.
The results for filtered questions can be computed on the base of only those enterprisesthat were actually asked the question (e.g. "in % of enterprises with internet access"), butcan also be computed on the base of "all companies". In this report, both methods areused, depending on the indicator. The base (as specified in footnotes of tables andcharts) is therefore not necessarily identical to the set of companies that were actuallyasked the underlying question.
Statistical accuracy of the survey: confidence intervals
Statistics vary in their accuracy, depending on the kind of data and sources. A'confidence interval' is a measure that helps to assess the accuracy that can be expectedfrom data. The confidence interval is the estimated range of values on a certain level of significance. Confidence intervals for estimates of a population fraction (percentages)depend on the sample size, the probability of error, and the survey result (value of thepercentage) itself. Further to this, variance of the weighting factors has negative effectson confidence intervals.
Table 7 gives some indication about the level of accuracy that can be expected for industry totals for the EU-1057 (based on all respondents) depending on the weightingscheme applied. For totals of all-sectors (in the EU-10), an accuracy of about +/- 3percentage points can be expected for most values that are expressed as "% of firms",and of about +/- 2 percentage points for values that are weighted by employment.
The confidence intervals for industry totals (EU-10) differ considerably depending on theindustry and the respective value; on average, it is about +/- 5 percentage points (in bothweighting schemes). Confidence intervals are highest for the shipbuilding and repair industry, due to the small number of observations, and because this sector is moresensitive to weights due to its structure (i.e. the dominance of large firms in acomparatively small population). Data for this industry are therefore indicative and cannotclaim to have statistical accuracy.
The calculation of confidence intervals is based on the assumption of (quasi-) infinitepopulation universes. In practice, however, in some industries and in some countries thecomplete population of businesses consists of only several hundred or even a few dozen
enterprises. In some cases, literally each and every enterprise within a country-industryand size-band cell was contacted and asked to participate in the survey. This means thatit is practically impossible to achieve a higher confidence interval through representativeenterprise surveys in which participation is not obligatory. This should be borne in mindwhen comparing the confidence intervals of e-Business W@tch surveys to thosecommonly found in general population surveys.
57 The EU-10 are composed of those countries in which all 10 sectors were covered by the survey.To ensure data comparability, only interviews from these countries are included in theaggregated "total" values. The EU-10 are: CZ, DE, ES, FR, IT, HU, NL, PL, FI, UK. These 10countries represent more than 80% of the population and GDP of the EU.
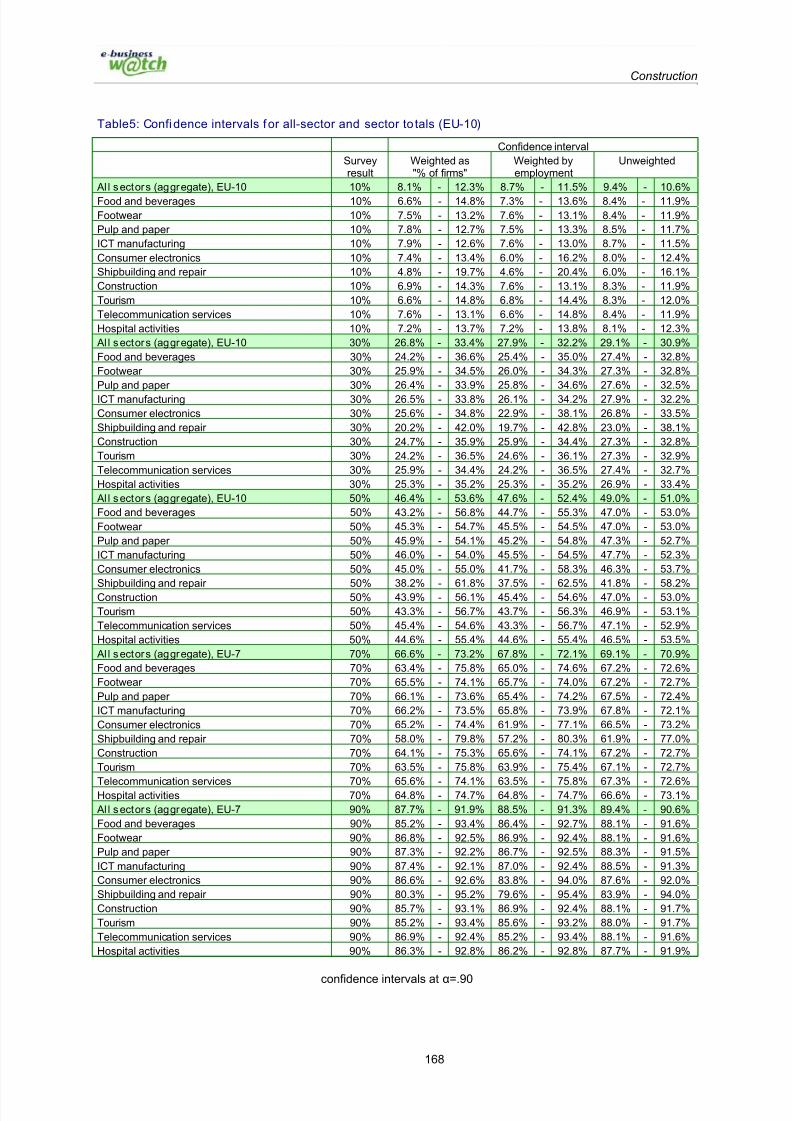
7/28/2019 Construction 2006
http://slidepdf.com/reader/full/construction-2006 168/182
Construction
168
Table5: Confidence intervals for all-sector and sector to tals (EU-10)
Confidence intervalSurveyresult
Weighted as"% of firms"
Weighted byemployment
Unweighted
Al l sectors (aggregate), EU-10 10% 8.1% - 12.3% 8.7% - 11.5% 9.4% - 10.6%
Food and beverages 10% 6.6% - 14.8% 7.3% - 13.6% 8.4% - 11.9%
Footwear 10% 7.5% - 13.2% 7.6% - 13.1% 8.4% - 11.9%
Pulp and paper 10% 7.8% - 12.7% 7.5% - 13.3% 8.5% - 11.7%
ICT manufacturing 10% 7.9% - 12.6% 7.6% - 13.0% 8.7% - 11.5%
Consumer electronics 10% 7.4% - 13.4% 6.0% - 16.2% 8.0% - 12.4%
Shipbuilding and repair 10% 4.8% - 19.7% 4.6% - 20.4% 6.0% - 16.1%
Construction 10% 6.9% - 14.3% 7.6% - 13.1% 8.3% - 11.9%
Tourism 10% 6.6% - 14.8% 6.8% - 14.4% 8.3% - 12.0%
Telecommunication services 10% 7.6% - 13.1% 6.6% - 14.8% 8.4% - 11.9%
Hospital activities 10% 7.2% - 13.7% 7.2% - 13.8% 8.1% - 12.3%
Al l sectors (aggregate), EU-10 30% 26.8% - 33.4% 27.9% - 32.2% 29.1% - 30.9%
Food and beverages 30% 24.2% - 36.6% 25.4% - 35.0% 27.4% - 32.8%
Footwear 30% 25.9% - 34.5% 26.0% - 34.3% 27.3% - 32.8%
Pulp and paper 30% 26.4% - 33.9% 25.8% - 34.6% 27.6% - 32.5%
ICT manufacturing 30% 26.5% - 33.8% 26.1% - 34.2% 27.9% - 32.2%
Consumer electronics 30% 25.6% - 34.8% 22.9% - 38.1% 26.8% - 33.5%
Shipbuilding and repair 30% 20.2% - 42.0% 19.7% - 42.8% 23.0% - 38.1%
Construction 30% 24.7% - 35.9% 25.9% - 34.4% 27.3% - 32.8%
Tourism 30% 24.2% - 36.5% 24.6% - 36.1% 27.3% - 32.9%
Telecommunication services 30% 25.9% - 34.4% 24.2% - 36.5% 27.4% - 32.7%
Hospital activities 30% 25.3% - 35.2% 25.3% - 35.2% 26.9% - 33.4%
Al l sectors (aggregate), EU-10 50% 46.4% - 53.6% 47.6% - 52.4% 49.0% - 51.0%
Food and beverages 50% 43.2% - 56.8% 44.7% - 55.3% 47.0% - 53.0%
Footwear 50% 45.3% - 54.7% 45.5% - 54.5% 47.0% - 53.0%
Pulp and paper 50% 45.9% - 54.1% 45.2% - 54.8% 47.3% - 52.7%
ICT manufacturing 50% 46.0% - 54.0% 45.5% - 54.5% 47.7% - 52.3%
Consumer electronics 50% 45.0% - 55.0% 41.7% - 58.3% 46.3% - 53.7%
Shipbuilding and repair 50% 38.2% - 61.8% 37.5% - 62.5% 41.8% - 58.2%
Construction 50% 43.9% - 56.1% 45.4% - 54.6% 47.0% - 53.0%
Tourism 50% 43.3% - 56.7% 43.7% - 56.3% 46.9% - 53.1%
Telecommunication services 50% 45.4% - 54.6% 43.3% - 56.7% 47.1% - 52.9%
Hospital activities 50% 44.6% - 55.4% 44.6% - 55.4% 46.5% - 53.5%
Al l sectors (aggregate), EU-7 70% 66.6% - 73.2% 67.8% - 72.1% 69.1% - 70.9%
Food and beverages 70% 63.4% - 75.8% 65.0% - 74.6% 67.2% - 72.6%
Footwear 70% 65.5% - 74.1% 65.7% - 74.0% 67.2% - 72.7%
Pulp and paper 70% 66.1% - 73.6% 65.4% - 74.2% 67.5% - 72.4%
ICT manufacturing 70% 66.2% - 73.5% 65.8% - 73.9% 67.8% - 72.1%
Consumer electronics 70% 65.2% - 74.4% 61.9% - 77.1% 66.5% - 73.2%
Shipbuilding and repair 70% 58.0% - 79.8% 57.2% - 80.3% 61.9% - 77.0%
Construction 70% 64.1% - 75.3% 65.6% - 74.1% 67.2% - 72.7%
Tourism 70% 63.5% - 75.8% 63.9% - 75.4% 67.1% - 72.7%
Telecommunication services 70% 65.6% - 74.1% 63.5% - 75.8% 67.3% - 72.6%Hospital activities 70% 64.8% - 74.7% 64.8% - 74.7% 66.6% - 73.1%
Al l sectors (aggregate), EU-7 90% 87.7% - 91.9% 88.5% - 91.3% 89.4% - 90.6%
Food and beverages 90% 85.2% - 93.4% 86.4% - 92.7% 88.1% - 91.6%
Footwear 90% 86.8% - 92.5% 86.9% - 92.4% 88.1% - 91.6%
Pulp and paper 90% 87.3% - 92.2% 86.7% - 92.5% 88.3% - 91.5%
ICT manufacturing 90% 87.4% - 92.1% 87.0% - 92.4% 88.5% - 91.3%
Consumer electronics 90% 86.6% - 92.6% 83.8% - 94.0% 87.6% - 92.0%
Shipbuilding and repair 90% 80.3% - 95.2% 79.6% - 95.4% 83.9% - 94.0%
Construction 90% 85.7% - 93.1% 86.9% - 92.4% 88.1% - 91.7%
Tourism 90% 85.2% - 93.4% 85.6% - 93.2% 88.0% - 91.7%
Telecommunication services 90% 86.9% - 92.4% 85.2% - 93.4% 88.1% - 91.6%
Hospital activities 90% 86.3% - 92.8% 86.2% - 92.8% 87.7% - 91.9%
confidence intervals at α=.90

7/28/2019 Construction 2006
http://slidepdf.com/reader/full/construction-2006 169/182
Construction
169
The e-Business Scoreboard 2006
The e-Business Scoreboard approach was developed by e-Business W@tch in 2004. It isa compound index that condenses data on ICT adoption and e-business activity, enabling
comparisons across different sectors, countries or size-bands.Conceptually, the e-Business Scoreboard owes a debt to the Balanced Scorecard (BSC)approach, which suggests that an organisation should be viewed from four perspectives,and that metrics (and targets) are to be defined for each perspective. Similarly, the e-Business Scoreboard looks at ICT use by enterprises from four (inter-related)perspectives. The Scoreboard consists of 16 component indicators (see next page),which represent the metrics for these perspectives. Component indicators (CI) can beaggregated on several levels.
First, CI can be aggregatedinto the 4 main
sub-indices (with 4 CIeach) that represent major application areas of e-business.
Second, the four sub-indicescan be further aggregatedinto 2 dimensions and,finally, into the overall"e-Business Index".
E - BusinessIndex
A. Ac cess toICT networks
4 Sub-Indices (by business function)
E - Business
Index
B. e-Process
integration
C. Supply-side activity
D. Marketing
and sales
16 Component
Indicators
A.1 Internet
A.2 LAN
A.3 W-LAN
A.4 Remote
B.1 Intranet
etc.
B.2 ERP
E - BusinessIndex
A. Ac cess toICT networks
4 Sub-Indices (by business function)
E - Business
Index
B. e-Process
integration
C. Supply-side activity
D. Marketing
and sales
16 Component
Indicators
A.1 Internet
A.2 LAN
A.3 W-LAN
A.4 Remote
B.1 Intranet
etc.
The e-Business Scoreboard takes into account the percentages (diffusion rates) from allsectors (size-bands, …) and show how a specific sector (size-band, …) differs from theall-sector-average. An index value is based on mean values and standard deviations.Thus, index values express the multiple of the standard deviation (1 or (-1)) for a specificsector and the selected indicator. 0 equals the mean value for all sectors (size-bands,…).
Indexes simplify multi-dimensional concepts. To correctly assess the validity andshortcomings of the Scoreboard and its overall index, the following notes should be takeninto account:
Weighting: Results are influenced by the selection of the underlying weightingscheme for component indicators. If employment-weighted figures are used, e-business activity in large firms is emphasized. If indicators are weighted by thenumber of enterprises (irrespective of their size), the situation in smaller firms isemphasized.
Component indicators: The selection of component indicators may have a biastowards manufacturing activities, as some indicators can be more relevant for manufacturing than for service sectors (e.g. ERP use).
Relative comparison: The Scoreboard results do not represent absolutemeasures of e-business activity, but depend on the respective set of sectors (or countries, ...) that are compared to each other, because figures express standarddeviations from the average of the respective set.

7/28/2019 Construction 2006
http://slidepdf.com/reader/full/construction-2006 170/182
Construction
170
Component indicators of the e-Business Scoreboard 2006
(Definitions for indicators weighted by employment)
A. ICT infrastructure and basic connectiv ity
A.1 Internet connectivity = the percentage of employees working in enterprises that areconnected to the internet, with a supplementary indicator for the typeof internet connection in terms of bandwidth. Enterprises that areconnected with broadband (via DSL, cable, direct fibre or wirelessbroadband) are computed with a factor of 1.0, enterprises connectedvia analogue dial-up modem or ISDN with a factor of 0.5. Themaximum value of 100 would be returned if all employees work inenterprises with broadband connections.
A.2 Use of LAN = the percentage of employees from a sector working in enterprises thathave connected computers with a Local Area Network (LAN).
A.3 Use of a Wireless LAN = the percentage of employees working in enterprises which use aWireless LAN.
A.4 Remote access to the
company's computer network
= the percentage of employees from a sector working in enterprises
where it is possible to access data from the company's computer system from a remote location.
B. Internal business process automation
B.1 Use of an intranet = the percentage of employees working in enterprises that use anintranet.
B.2 Use of an ERP system = the percentage of employees working in enterprises that haveimplemented an ERP (enterprise resource planning) system.
B.3 Use of online technology totrack working hours and/or production time
= the percentage of employees working in enterprises that use onlinetechnologies (other than e-mail) to track working hours and/or production times.
B.4 Companies sending or receiving e-invoices
= the percentage of employees working in enterprises that send and/or receive e-invoices.
C. Procurement and supply chain integrationC.1 Companies placing >5% of their
orders to suppliers online = the percentage of employees working in enterprises saying that they
place orders to suppliers online on the web or via other computer-mediated networks, for example via EDI based connections to their suppliers, and that these online orders account for at least 5% of their total orders.
C.2 Use of specific ICT solutionsfor e-procurement
= the percentage of employees working in enterprises that use specificIT solutions to support the selection of their suppliers and/or procurement processes.
C.3 Companies linking their ICT system with suppliers
= the percentage of employees that work in enterprises whose ICTsystem is linked with those of suppliers.
C.4 Companies managing capacityand inventory online
= the percentage of employees working in enterprises that that usetechnologies to manage capacity and inventory online.
D. Marketing and sales processes
D.1 Use of CRM software systems = the percentage of employees working in enterprises that use a CRM(customer relationship management) software to organise data abouttheir customers electronically.
D.2 Companies receiving >5% of orders from customers online
= the percentage of employees working in enterprises saying that theyaccept orders from customers online on the web or via other computer-mediated networks, and that these online orders account for at least 5% of their total orders received.
D.3 Use of specific ICT solutions tosupport marketing and salesprocesses
= the percentage of employees working in enterprises that uses specificIT solutions to support marketing and sales processes.
D.4 Companies linking their ICTsystem with customers
= the percentage of employees that work in enterprises whose ICTsystem is linked with those of customers.

7/28/2019 Construction 2006
http://slidepdf.com/reader/full/construction-2006 171/182
Construction
171
Annex II: Expanded Tables – Data by Country
General remarks on country data break-downs
The studies of e-Business W@tch have a sectoral perspective and focus, within sectors,
on small and medium-sized enterprises; the analysis of geographic differences is not in
the foreground. This decision on the study focus recognises that the e-business activities
of a company are mainly determined by its business activity, the configuration of its value
system and its size, rather than by the location of a firm.
For several reasons, country data on e-business adoption must be taken with a pinch of
salt. They can reflect, at least to some extent, the structure of the economy rather than
the overall e-maturity of firms. In Italy, for example, sectors dominated by small firms are
much more prevalent than in other countries. Since large firms are more advanced in
electronic business, aggregated data may point at a lower level of e-business activity in
Italy. In contrast to Italy, the relative performance of French and Dutch companies is
significantly better if the emphasis is on larger firms. These benchmarking results suggest
that the digital divide between small and large firms could be quite pronounced in these
countries.
It should also be considered that the average size of the companies interviewed in a
sector can differ by country, depending on industry structure and the available business
directories used for sampling. It cannot be excluded that some directories may have abias towards smaller / larger firms. Although this effect is counteracted by weighting the
answers (according to the representation of various company sizes in the population), it
cannot be excluded that structural differences in the sample have an impact on results.
Ideally, comparisons between different countries should only be made within the same
size-band of firms, rather than on the aggregate level. However, at least within a given
sector, the number of observations available does not allow a break-down by country and
size-band.

7/28/2019 Construction 2006
http://slidepdf.com/reader/full/construction-2006 172/182
Construction
172
Exhibit A2-1: Internet access and remote access to enterprise network
Companies
with internet
access
Companies
with
broadband
internet access
Share of
employees
with internet
access
Remote access
to enterprise
network
% of empl.
% of firms
% of empl.
% of firms
% of empl.
% of firms
% of empl.
% of firms
Construction (EU-10) 95 90 72 64 n.a. 47 25 13
Micro (1-9 empl.) 89 60 n.a. 48 10Small (10-49 empl.) 99 73 n.a. 28 23Medium (50-249 empl.) 99 86 n.a. 38 40Large (250+ empl.) 98 87 n.a. 42 56 NACE 45.2 (Comp. con.) 97 93 80 71 n.a. 55 31 13NACE 45.3 (Installation) 92 89 65 61 n.a. 43 20 12 Belgium 98 97 87 91 n.a. 50 26 10Czech Republic 100 100 64 65 n.a. 66 37 27
Denmark 100 100 82 71 n.a. 56 47 10Germany 98 95 62 44 n.a. 47 21 14Greece 100 100 54 43 n.a. 71 25 20Spain* 90 77 78 65 n.a. 42 24 4France 86 74 80 67 n.a. 31 27 16Ireland 100 100 52 27 n.a. 36 25 6Italy 97 95 60 49 n.a. 21 8 1Latvia 96 95 71 67 n.a. 56 13 13Lithuania 99 98 79 77 n.a. 46 18 14Luxembourg 96 96 78 71 n.a. 33 28 21Hungary 93 88 68 63 n.a. 66 32 24Netherlands 96 100 83 92 n.a. 65 46 22
Austria 100 98 69 53 n.a. 40 43 16
Poland 96 94 70 59 n.a. 66 19 17Slovenia 97 92 66 53 n.a. 53 26 21Slovakia 97 93 86 83 n.a. 60 44 19Finland 100 100 83 82 n.a. 73 42 12United Kingdom 96 93 61 59 n.a. 55 17 7Bulgaria 91 82 50 42 n.a. 44 11 24Norway 98 97 87 91 n.a. 50 26 10 Al l 10 sectors (EU-10) 95 93 76 69 n.a. 43 35 16
Micro (1-9 empl.) 89 62 51 12Small (10-49 empl.) 98 75 29 22Medium (50-249 empl.) 99 83 33 43Large (250+ empl.) 99 84 44 60
Base (100%) firms usingcomputers firms usingcomputers firms with internetaccess firms usingcomputers
N (for sector, EU-10) 754 754 715 754Questionnaire reference A1 A3 A2 A5
* Data only indicative due to low number of observations (N ~ 25-50).
Source: e-Business W@tch (Survey 2006)

7/28/2019 Construction 2006
http://slidepdf.com/reader/full/construction-2006 173/182
Construction
173
Exhibit A2-2: Demand for ICT skills and skills development
Companiesemploying ICT
practitioners
Regular ICTtraining of
employees
Companieswith hard-to-fillvacancies for
ICT jobs in2005
Companiesusing
e-learning
% of empl.
% of firms
% of empl.
% of firms
% of empl.
% of firms
% of empl.
% of firms
Construction (EU-10) 22 14 18 12 2 1 12 8
Micro (1-9 empl.) 14 10 1 9Small (10-49 empl.) 19 18 0 7Medium (50-249 empl.) 28 28 2 14Large (250+ empl.) 52 32 6 30 NACE 45.2 (Comp. con.) 24 14 16 7 2 0 14 9NACE 45.3 (Installation) 20 14 19 15 1 2 11 7
Belgium 22 10 19 7 4 0 13 4Czech Republic 15 4 29 12 0 0 25 12Denmark 40 27 25 13 4 0 26 18Germany 11 5 15 11 2 0 3 5Greece 54 44 26 17 8 5 15 12Spain* 23 10 16 13 0 0 19 16France 16 4 14 4 0 0 7 1Ireland 13 1 11 4 2 0 11 5Italy 25 24 18 13 0 0 10 11Latvia 41 25 23 12 8 3 18 15Lithuania 42 30 13 8 4 4 25 24Luxembourg 27 21 20 13 0 0 7 7Hungary 17 8 7 2 0 0 8 4Netherland 37 8 23 5 6 1 11 11
Austria 31 7 29 10 5 0 15 7Poland 34 29 26 18 5 11 11 6Slovenia 8 4 20 15 1 0 28 30Slovakia 26 14 33 16 4 2 16 17Finland 28 9 18 5 0 0 20 12United Kingdom 25 16 19 9 5 0 17 9Bulgarian 15 4 20 14 6 2 26 25Norway 48 41 25 8 1 0 31 21 Al l 10 sectors (EU-10) 27 14 22 13 2 1 21 11
Micro (1-9 empl.) 12 9 2 12
Small (10-49 empl.) 15 16 0 11
Medium (50-249 empl.) 29 28 2 19
Large (250+ empl.) 59 41 6 35
Base (100%)firms usingcomputers
firms usingcomputers
firms usingcomputers
firms usingcomputers
N (for sector, EU-10) 754 754 754 754Questionnaire reference B1 B4 B2 B5
* Data only indicative due to low number of observations (N ~ 25-50).
Source: e-Business W@tch (Survey 2006)

7/28/2019 Construction 2006
http://slidepdf.com/reader/full/construction-2006 174/182
Construction
174
Exhibit A2-3: Companies receiving orders from customers online
Accept orders
from
customers
online
Receive up to
25% of orders
online
Receive more
than 25% of
orders online
Use specific
ICT solutions
for e-selling
% of empl.
% of firms
% of empl.
% of firms
% of empl.
% of firms
% of empl.
% of firms
Construction (EU-10) 13 11 84 88 16 12 8 5
Micro (1-9 empl.) 12 90 11 4Small (10-49 empl.) 11 87 13 6Medium (50-249 empl.) 14 83 17 8Large (250+ empl.) 13 78 22 16 NACE 45.2 (Comp. con.) 13 9 75 75 25 26 9 4NACE 45.3 (Installation) 12 12 93 93 7 7 7 5 Belgium 9 6 91 99 9 1 6 0Czech Republic 25 27 62 83 38 17 7 4Denmark 19 17 96 100 4 0 9 5Germany 11 12 84 61 16 39 4 6Greece 5 5 76 96 24 4 10 12Spain* 10 6 79 99 21 1 10 10France 7 8 100 100 0 0 10 5Ireland 7 8 100 100 0 0 6 7Italy 7 11 100 100 0 0 1 0Latvia 7 12 79 80 21 20 5 5Lithuania 19 15 81 91 19 9 3 4Luxembourg 6 9 100 100 0 0 8 2Hungary 16 17 65 47 35 53 6 5Netherland 11 6 72 28 28 72 6 1
Austria 15 13 100 100 0 0 17 4Poland 18 23 100 100 0 0 9 12Slovenia 12 5 82 96 18 4 9 4Slovakia 21 32 75 71 25 29 8 13Finland 28 29 87 87 13 13 17 5United Kingdom 20 9 80 94 20 6 13 0Bulgaria 27 16 68 45 32 55 17 10Norway 20 23 86 79 14 21 16 15 Al l 10 sectors (EU-10) 35 25 73 75 27 25 18 9
Micro (1-9 empl.) 23 79 21 6
Small (10-49 empl.) 26 76 24 12
Medium (50-249 empl.) 29 75 25 16
Large (250+ empl.) 26 74 26 27
Base (100%)firms usingcomputers
firms acceptingorders online
firms acceptingorders online
firms usingcomputers
N (for sector, EU-10) 754 123 123 754
Questionnaire reference F4 F6a+b+c F6d+e F10
* Data only indicative due to low number of observations (N ~ 25-50).
Source: e-Business W@tch (Survey 2006)

7/28/2019 Construction 2006
http://slidepdf.com/reader/full/construction-2006 175/182
Construction
175
Exhibit A2-4: Companies ordering supp ly goods online
Place orders
online
Place up to
25% of orders
online
Place more
than 25% of
orders online
Use specific
ICT solutions
for e-sourcing
% of empl. % of firms % of empl. % of firms % of empl. % of firms % of empl. % of firms
Construction (EU-10) 53 51 74 72 26 28 12 6
Micro (1-9 empl.) 51 72 28 4Small (10-49 empl.) 54 76 24 10Medium (50-249 empl.) 57 80 20 17Large (250+ empl.) 58 69 31 26 NACE 45.2 (Comp. con.) 49 37 76 83 23 17 14 7NACE 45.3 (Installation) 57 58 73 69 27 31 9 6 Belgium 48 45 75 59 25 41 12 7Czech Republic 56 54 67 77 33 23 7 4
Denmark 87 77 57 58 43 42 10 12Germany 63 68 73 76 27 24 5 6Greece 43 38 81 81 19 19 15 10Spain* 37 21 81 92 19 8 12 10France 53 47 87 83 13 17 12 2Ireland 45 41 80 89 20 11 11 8Italy 51 53 72 74 28 26 7 1Latvia 52 52 82 76 18 24 9 11Lithuania 49 32 76 71 24 29 8 12Luxembourg 53 55 92 87 8 13 4 0Hungary 42 46 86 80 14 20 7 7Netherland 59 54 72 63 28 37 12 1
Austria 68 62 62 59 38 41 27 12Poland 68 71 55 42 45 58 8 6
Slovenia 36 37 81 78 19 22 4 5Slovakia 34 31 81 66 19 34 15 12Finland 73 55 67 78 33 22 26 7United Kingdom 58 64 77 76 23 24 24 9Bulgaria 40 38 69 69 31 31 13 10Norway 74 69 49 47 51 53 16 16 Al l 10 sectors (EU-10) 57 48 74 75 26 25 16 9
Micro (1-9 empl.) 44 73 27 7
Small (10-49 empl.) 54 80 20 10
Medium (50-249 empl.) 60 76 24 16
Large (250+ empl.) 68 75 25 29
Base (100%)firms usingcomputers
firms placingorders online
firms placingorders online
firms usingcomputers
N (for sector, EU-10) 754 401 401 754
Questionnaire reference E1 E3a+E3b+E3c E3d+E3e E7
* Data only indicative due to low number of observations (N ~ 25-50).
Source: e-Business W@tch (Survey 2006)

7/28/2019 Construction 2006
http://slidepdf.com/reader/full/construction-2006 176/182
Construction
176

7/28/2019 Construction 2006
http://slidepdf.com/reader/full/construction-2006 177/182
Construction
177
Annex III: Glossary of Technical Terms
Term Definition58
Access The ability to retrieve information and to communicate online through the use of digitalinformation and communication technologies.
B2B Business to Business. Electronic transactions between companies.
B2B e-marketplace Electronic trading platforms on the internet where companies can sell and/or buy goodsor services to/from other companies. They can be operated by a single buyer or seller or by a third party. Many marketplaces are industry-specific. Some marketplaces requireregistration and membership fees from companies that want to conduct trade on them.
B2C Business to Consumer. Electronic transactions, between companies and consumers.
Bandwidth The physical characteristic of a telecommunications system that indicates the speed atwhich information can be transferred. In analogue systems, it is measured in cycles per second (Hertz), and in digital systems in binary bits per second. (Bit/s).
Broadband High bandwidth internet access. In e-Business W@tch reports, broadband is defined asthe capacity to transfer data at rates of 2 Mbit/s (megabits per second) or greater.
Channel In communications, a physical or logical path allowing the transmission of information;the path connecting a data source and a receiver.
CRM Customer Relationship Management. Software systems that promise the ability tosynthesize data on customers' behaviour and needs and thus to provide a universal viewof the customer.
Dial-up The process of establishing a temporary connection (to the internet) via the switchedtelephone network.
Digital signature An electronic signature that can be used to authenticate the identity of the sender of amessage or the signer of a document, and to ensure that the original content of themessage or document that has been sent is unchanged. Digital signature usually refersspecifically to a cryptographic signature, either on a document, or on a lower-level data
structure.DRM Digital rights management. DRM is a system of IT components and services, along with
corresponding law, policies and business models, which strive to distribute and controlintellectual property and its rights. Product authenticity, user charges, terms-of-use andexpiration of rights are typical concerns of DRM.
DSL Digital Subscriber Line. A family of technologies generically referred to as DSL, or xDSL,capable of transforming ordinary phone lines (also known as "twisted copper pairs") intohigh-speed digital lines, capable of supporting advanced services. ADSL (AsymmetricDigital Subscriber Line), HDSL (High data rate Digital Subscriber Line) and VDSL (Veryhigh data rate Digital Subscriber Line) are all variants of xDSL
e-Business Electronic business. The e-Business W@tch uses the term "e-business" in the broadsense, relating both to external and to company internal processes. This includesexternal communication and transaction functions, but also ICT supported flows of
information within the company, for example, between departments and subsidiaries.ebXML Electronic business using XML. A proven framework and unified set of internationally
agreed upon technical specifications and common XML semantics designed to facilitateglobal trade.
e-Commerce Electronic commerce. As distinct from the broader concept of e-business, e-commercerefers to external transactions in goods and services between companies (B2B),between companies and consumers (B2C), or between companies and governments(B2G) and may therefore be seen as a subgroup or component of e-business activities.
EDI Electronic Data Interchange. A way for unaffiliated companies to use networks to linktheir businesses by using a common technical standard for exchanging business data.While electronic mail between companies is common, electronic data interchangepasses bigger bundles that replace large paper documents such as bills and contracts.
58 Some of the definitions in this glossary are derived from or based on definitions suggested byWhatis?com, a leading online ICT encyclopaedia and learning centre. Seehttp://whatis.techtarget.com.
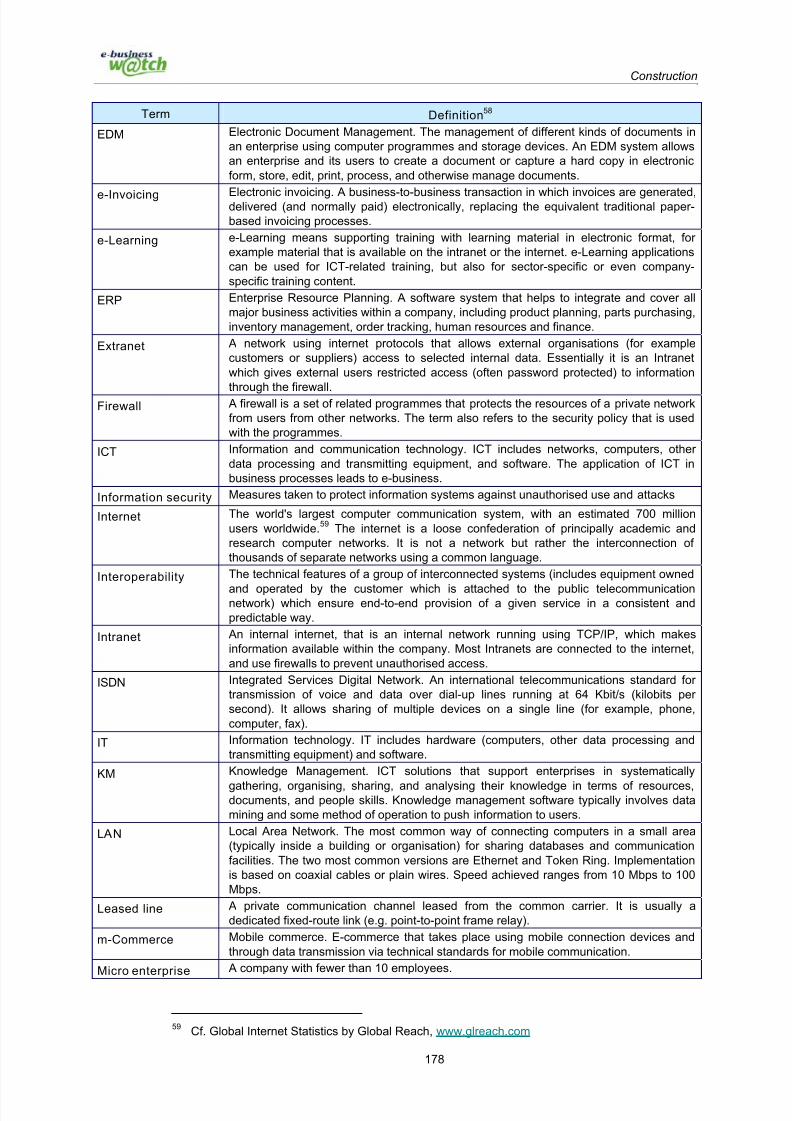
7/28/2019 Construction 2006
http://slidepdf.com/reader/full/construction-2006 178/182
Construction
178
Term Definition58
EDM Electronic Document Management. The management of different kinds of documents inan enterprise using computer programmes and storage devices. An EDM system allowsan enterprise and its users to create a document or capture a hard copy in electronicform, store, edit, print, process, and otherwise manage documents.
e-Invoicing Electronic invoicing. A business-to-business transaction in which invoices are generated,delivered (and normally paid) electronically, replacing the equivalent traditional paper-based invoicing processes.
e-Learning e-Learning means supporting training with learning material in electronic format, for example material that is available on the intranet or the internet. e-Learning applicationscan be used for ICT-related training, but also for sector-specific or even company-specific training content.
ERP Enterprise Resource Planning. A software system that helps to integrate and cover allmajor business activities within a company, including product planning, parts purchasing,inventory management, order tracking, human resources and finance.
Extranet A network using internet protocols that allows external organisations (for examplecustomers or suppliers) access to selected internal data. Essentially it is an Intranetwhich gives external users restricted access (often password protected) to information
through the firewall.Firewall A firewall is a set of related programmes that protects the resources of a private network
from users from other networks. The term also refers to the security policy that is usedwith the programmes.
ICT Information and communication technology. ICT includes networks, computers, other data processing and transmitting equipment, and software. The application of ICT inbusiness processes leads to e-business.
Information security Measures taken to protect information systems against unauthorised use and attacks
Internet The world's largest computer communication system, with an estimated 700 millionusers worldwide.59 The internet is a loose confederation of principally academic andresearch computer networks. It is not a network but rather the interconnection of thousands of separate networks using a common language.
Interoperability The technical features of a group of interconnected systems (includes equipment owned
and operated by the customer which is attached to the public telecommunicationnetwork) which ensure end-to-end provision of a given service in a consistent andpredictable way.
Intranet An internal internet, that is an internal network running using TCP/IP, which makesinformation available within the company. Most Intranets are connected to the internet,and use firewalls to prevent unauthorised access.
ISDN Integrated Services Digital Network. An international telecommunications standard for transmission of voice and data over dial-up lines running at 64 Kbit/s (kilobits per second). It allows sharing of multiple devices on a single line (for example, phone,computer, fax).
IT Information technology. IT includes hardware (computers, other data processing andtransmitting equipment) and software.
KM Knowledge Management. ICT solutions that support enterprises in systematically
gathering, organising, sharing, and analysing their knowledge in terms of resources,documents, and people skills. Knowledge management software typically involves datamining and some method of operation to push information to users.
LAN Local Area Network. The most common way of connecting computers in a small area(typically inside a building or organisation) for sharing databases and communicationfacilities. The two most common versions are Ethernet and Token Ring. Implementationis based on coaxial cables or plain wires. Speed achieved ranges from 10 Mbps to 100Mbps.
Leased line A private communication channel leased from the common carrier. It is usually adedicated fixed-route link (e.g. point-to-point frame relay).
m-Commerce Mobile commerce. E-commerce that takes place using mobile connection devices andthrough data transmission via technical standards for mobile communication.
Micro enterprise A company with fewer than 10 employees.
59 Cf. Global Internet Statistics by Global Reach, www.glreach.com

7/28/2019 Construction 2006
http://slidepdf.com/reader/full/construction-2006 179/182
Construction
179
Term Definition58
Modem Modulator/Demodulator. A device that modulates outgoing digital signals from acomputer or other digital device to analogue signals suitable to be transmitted through aconventional telephone line (copper twisted pair telephone). The reverse proceduretakes place for incoming signals.
MRO goods Maintenance, repair and operating goods. Supplies which companies need to maintaintheir operations, for example office supplies, in contrast to "direct production goods"which are components of the goods and services the company produces.
OOS Open source software refers to computer software under an open source license. Anopen-source license is a copyright license for software that makes the source codeavailable and allows for modification and redistribution without having to pay the originalauthor.
Processes Business processes are operations that transform the state of an object or a person.This can, for example, be an order placed via the internet. Ordering an object or aservice creates a liability for the supplier to deliver, and initiates the transfer of propertyrights from one entity to another. The electronic handling of processes is likely to speedthem up and to introduce new processes in the realisation of the same transaction.
PLM Product lifecycle management. The process of managing the entire lifecycle of a product
from its conception, through design and manufacture, to service and disposal. PLMsoftware helps companies effectively and efficiently innovate, for example by managingdescriptions and properties of a product starting from conception and development.
Remote access The ability of a company computer network's transmission points to gain access to acomputer at a different location.
RFID Radio Frequency Identification. A wireless technology which is used to uniquely identifyan object, animal, or person. RFID is coming into increasing use in industry as analternative to the bar code. The advantage of RFID is that it does not require directcontact or line-of-sight scanning.
SCM Supply Chain Management. Software that helps businesses to match supply anddemand through integrated and collaborative planning tools.
Sector Sectors of the economy with comparable business activities. These constitute the mainresearch unit of the e-Business W@tch. Aggregated information at the industry level is
used to document the diffusion of activities within the industries as well as the overallimportance of the observed phenomena for changes in the economy as a whole. Thedefinition of sectors follows NACE Rev.1.1 classifications.
Secure server
technology
Secure server technology means that data exchange between computers is based oncertain technical standards or protocols, for example "Secure Sockets Layer" (SSL).
SME Small and medium-sized enterprises with 0-249 employees. To be classified as an SME,an enterprise has to satisfy the criteria for the number of employees and one of the twofinancial criteria, i.e. either the turnover total or the balance sheet total. In addition, itmust be independent, which means less than 25% owned by one enterprise (or jointly byseveral enterprises) falling outside the definition of an SME or a micro-enterprise,whichever may apply. The thresholds for the turnover and the balance sheet total will beadjusted regularly, to take account of changing economic circumstances in Europe.
SSL Secure Sockets Layer. A commonly-used protocol for managing the security of a
message transmission on the internet. SSL has recently been succeeded by TransportLayer Security (TLS), which is based on SSL.
Standard A standard is a technical specification approved by a recognised standardisation bodyfor repeated or continuous application, with which compliance is not compulsory.
Transaction Electronic transactions can be subdivided into several steps, each of which initiates aprocess. There are pre-sale (or pre-purchase) phases, sale and after-sale phases.Typically a transaction starts with information gathering, price and quality comparisonsand possibly pre-sale negotiations. During the sale phase contracting and delivery arethe core processes, and payment is the final stage of this phase. After-purchasetransaction stages comprise customer service, the administration of credit payments andthe handling of returns as well as marketing activities preparing for the next purchase.
UMTS Universal Mobile Telecommunications Service. A third-generation (3G) digital standardfor mobile communication, enabling packet-based transmission of voice, text and video
at data rates up to 2 megabits per second (Mbps).Value added Gross output minus intermediate inputs. It is valued at producers’ prices and includes all
indirect taxes, but excludes VAT and subsidies.

7/28/2019 Construction 2006
http://slidepdf.com/reader/full/construction-2006 180/182
Construction
180
Term Definition58
VoIP Voice over Internet Protocol (IP). The use of telephony services over internet networks,by means of digitised voice transfer technology.
VPN Virtual Private Network. A way to use a public telecommunication infrastructure, such asthe internet, to provide remote offices or individual users with secure access to their
organisation's network.WAN Wide Area Network. A network allowing the interconnection and intercommunication of a
group of computers over a long distance.
WAP Wireless Application Protocol. A communication protocol for delivering data over mobiletelephone systems, allowing cellular phone sets and other mobile hand-set systems toaccess WWW pages and other wireless services.
Website A related collection of World Wide Web files that includes a beginning file called a homepage.
Wi-Fi Wireless fidelity. A popular term for a high-frequency wireless local area network (W-LAN). Wi-Fi technology is rapidly gaining acceptance as an alternative or complementaryinfrastructure to a wired LAN.
W-LAN Wireless Local Area Network. An implementation of a LAN with no physical wires, usingwireless transmitters and receivers. It allows a mobile user to connect to a LAN or WAN
through a wireless (radio) connection. A standard, IEEE 802.11, specifies thetechnologies for wireless LANs.
WWW World Wide Web. The collection of pages in HTML format which reside on web-servers. Although WWW and the internet are different, the terms are increasingly becominginterchangeably used.
XML Extensible Mark-up Language. A standard to describe the contents of a page or file.XML is a way to create common information formats and share both the format and thedata on the World Wide Web, intranets, and elsewhere.

7/28/2019 Construction 2006
http://slidepdf.com/reader/full/construction-2006 181/182

7/28/2019 Construction 2006
http://slidepdf.com/reader/full/construction-2006 182/182
EuropeanCommission
Enterprise and Industry Directorate-GeneralUnit D4 “Technology for Innovation /ICT industries and e-Business”1040 Brussels, Belgium
Fax: (32-2) 2967019e-Mail: [email protected]: http://ec.europa.eu/enterprise/index_en.htm
Contact information: