FY2017 3Q Financial Results - Topconglobal.topcon.com/invest/library/financial/fr2017/pdf/...©2018...
23
FY2017 3Q Financial Results January 30, 2018 TOPCON CORPORATION Director and Executive Officer, CFO General Manager of Accounting & Finance Div. Haruhiko Akiyama
Transcript of FY2017 3Q Financial Results - Topconglobal.topcon.com/invest/library/financial/fr2017/pdf/...©2018...
FY2017 3Q
Financial ResultsJanuary 30, 2018
TOPCON CORPORATIONDirector and Executive Officer, CFOGeneral Manager of Accounting & Finance Div.
Haruhiko Akiyama

©2018 Topcon Corporation 1
FY2017 Full Year Plan
Ⅲ Appendix
Ⅰ FY2017 3Q Financial Results
Ⅱ
CONTENTS
FY2017 3Q Financial Results

©2018 Topcon Corporation 2
Ⅰ. FY2017 3Q Financial Results
Ⅰ-1. FY2017 3Q Financial Results
Ⅰ-2. Overview of 3Q

©2018 Topcon Corporation 3
FY2017 3Q <Significant growth>
Net
Sales
0.0
4.0
8.0
0
20
40
60
80
100
FY20141-3Q
FY20151-3Q
FY20161-3Q
FY20171-3Q
Growth in sales and profit
Operating
Income
8.0
91.588.6
4.44.2
87.4
3Q Sales Trend
Net Sales
(billion yen)Operating Income
(billion yen)
101.7
6.2
Net Sales ¥101.7B* 116%
Operating Income ¥6.2B 141%
Ordinary Income ¥5.3B 177%
Net Income ¥2.9B 336%
*Recorded the highest sales in the past
as a result of 3Q sales
YoY

©2018 Topcon Corporation 4
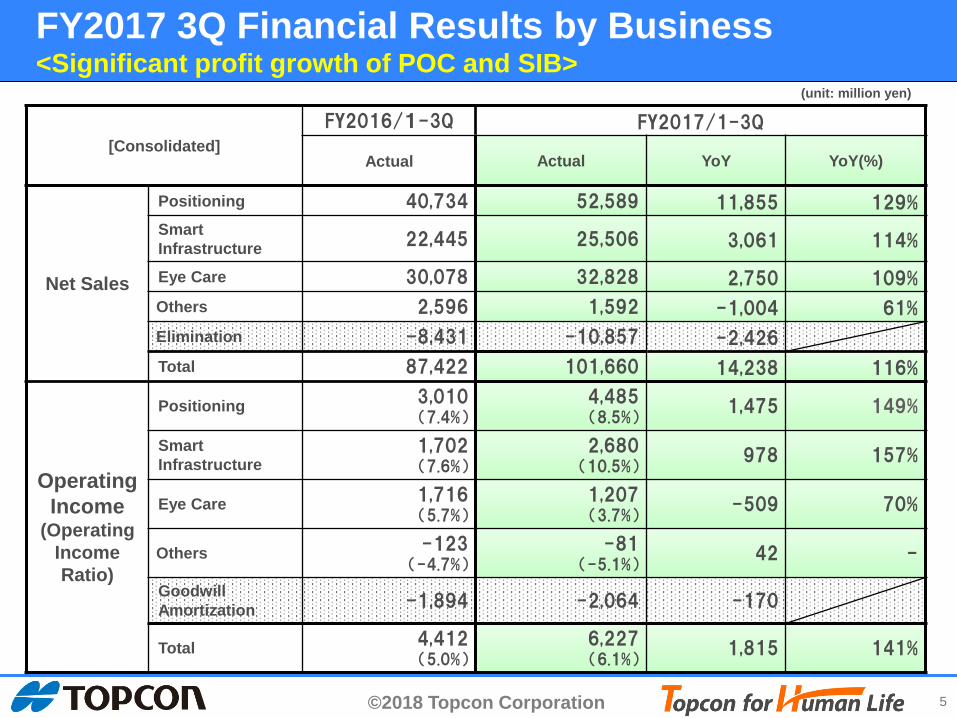
FY2017 3Q Financial Results <Growth in sales and profit>
[Consolidated]
FY2016/1-3Q FY2017/1-3Q
Actual Actual YoY YoY(%)
Net Sales 87,422 101,660 14,238 116%
Gross Profit
(Gross Profit Ratio)45,125 (51.6%)
51,894 (51.0%)
6,769
SGA 40,713 45,667 4,954
Operating Income
(Operating Income Ratio)
4,412 (5.0%)
6,227 (6.1%)
1,815 141%
Non-Operating Income
(Expenses)-1,403 -908 495
Ordinary Income 3,009 5,319 2,310 177%
Extraordinary Income (Loss) -174 -125 49
Income Before Income Taxes
and Minority Interests2,834 5,193 2,359
Net Income 878 2,946 2,068 336%
Exchange
Rate
(Average)
USD ¥107.88 ¥111.82 ¥3.94
EUR ¥119.13 ¥128.59 ¥9.46
(unit: million yen)
©2018 Topcon Corporation 5
[Consolidated]
FY2016/1-3Q FY2017/1-3Q
Actual Actual YoY YoY(%)
Net Sales
Positioning 40,734 52,589 11,855 129%
Smart
Infrastructure22,445 25,506 3,061 114%
Eye Care 30,078 32,828 2,750 109%
Others 2,596 1,592 -1,004 61%
Elimination -8,431 -10,857 -2,426
Total 87,422 101,660 14,238 116%
Operating
Income (Operating
Income
Ratio)
Positioning3,010(7.4%)
4,485(8.5%)
1,475 149%
Smart
Infrastructure1,702(7.6%)
2,680(10.5%)
978 157%
Eye Care1,716 (5.7%)
1,207 (3.7%)
-509 70%
Others-123
(-4.7%)-81
(-5.1%)42 -
Goodwill
Amortization-1,894 -2,064 -170
Total4,412(5.0%)
6,227(6.1%)
1,815 141%
(unit: million yen)
FY2017 3Q Financial Results by Business<Significant profit growth of POC and SIB>
©2018 Topcon Corporation 6
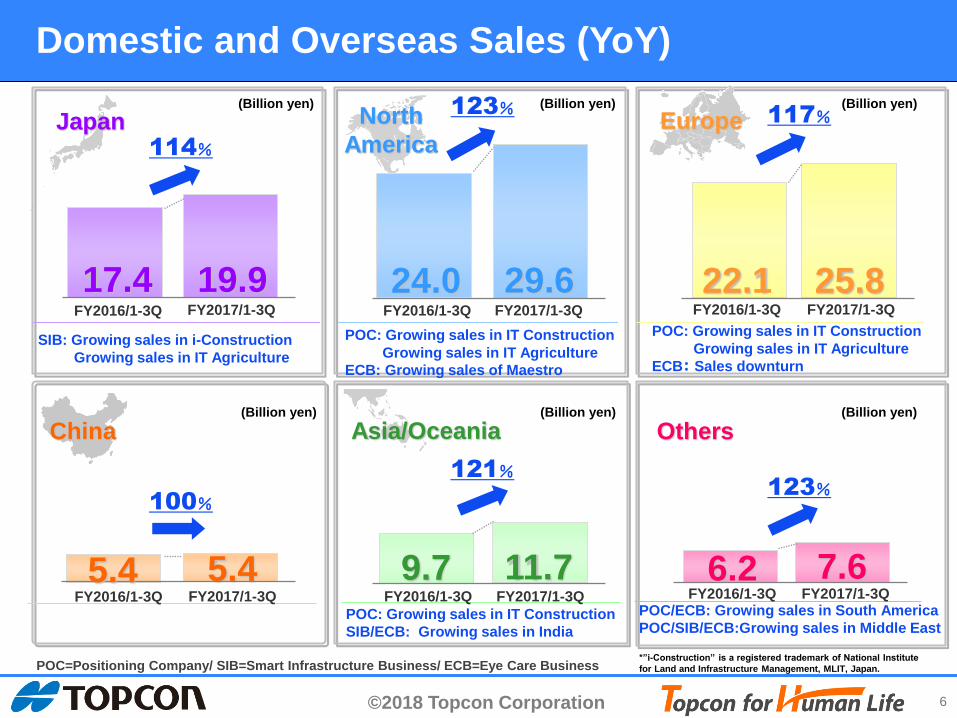
Japan North
AmericaEurope
China Asia/Oceania Others
(Billion yen) (Billion yen) (Billion yen)
(Billion yen)(Billion yen)(Billion yen)
Domestic and Overseas Sales (YoY)
POC: Growing sales in IT Construction
Growing sales in IT Agriculture
ECB: Growing sales of Maestro
SIB: Growing sales in i-Construction
Growing sales in IT Agriculture
POC: Growing sales in IT Construction
Growing sales in IT Agriculture
ECB: Sales downturn
POC/ECB: Growing sales in South America
POC/SIB/ECB:Growing sales in Middle East
POC=Positioning Company/ SIB=Smart Infrastructure Business/ ECB=Eye Care Business
POC: Growing sales in IT Construction
SIB/ECB: Growing sales in India
*”i-Construction” is a registered trademark of National Institute
for Land and Infrastructure Management, MLIT, Japan.
FY2016/1-3Q FY2017/1-3Q
19.917.4
114%
FY2016/1-3Q FY2017/1-3Q
29.624.0
123%
FY2016/1-3Q
22.1
117%
FY2017/1-3Q
25.8
FY2016/1-3Q FY2017/1-3Q
100%
5.4FY2016/1-3Q FY2017/1-3Q
11.79.7
121%
FY2016/1-3Q FY2017/1-3Q
123%
7.66.25.4

©2018 Topcon Corporation 7
4.4
5.0
-4.1
5.3
0.9
6.2
0
2
4
6
8
10
FY2016
1~3Q
Sales increase
and decrease,
Product mix
Fixed cost,
Lowering COGS
FX Effects FY2017
1~3Q
(Unit:Billion yen)
mainly
R&D Cost
Increase
YoY
120%
YoY
140%
Operating Income
w/o FX Effects
FY2017 3Q Operating Income YoY Breakdown<Profit growth, Accelerate upfront investment>

©2018 Topcon Corporation 8
Ⅰ. FY2017 3Q Financial Results
Ⅰ-1. FY2017 3Q Financial Results
Ⅰ-2. Overview of 3Q
©2018 Topcon Corporation 9
Positive factors
➢ Sales growth in IT Construction supported by solid global construction
investment (YoY 125%)
➢ Sales growth in IT Agriculture by increasing the number of OEM
partners (YoY 130%)
Topics
Overview of Each Business
Review of 3Q Financial Results
■ Exhibited at Agritechnica, the world’s largest agricultural machinery trade show
- The number of OEM partners rapidly increased to 200
by establishment of TA (over 100 OEM partners participated)
- Negative factor
➢ Acceleration of upfront investment (development of advanced technology,
enhancement of sales network)
-
(year)0
100
200
2013 2015 2017
(the number of
OEM partners)
Outline of AgritechnicaHeld in November 2017(once every two years)
Venue:Hanover Messe, Germany 500,000m
(the world’s largest convention center)
The number of visitors:over 500,000 people
TA
= Topcon Agriculture S.p.A
(headquarter:Turin, Italy)
*2
*1
*1 *2
+
2

©2018 Topcon Corporation 10
Topcon Precision Agriculture
Topcon Agriculture Canada
Topcon Electronics
Topcon Agriculture America
IT Agriculture : OEM sales growth according to expansion of cross-sells
A
B
C
D
E
Farm machinery
industryTopcon Agriculture S.p.A
Present
(Headquarter)
Past
Individual sales activities Organization integration
Significant
growth in
OEM sales
Maximization of
synergy effect
Supplier
Tractor Manufacturer
Agriculture group of POC

©2018 Topcon Corporation 11
Overview of Each Business
* "i-Construction" is a registered trademark of National Institute for Land and Infrastructure Management, MLIT, JAPAN.
Review of 3Q Financial Results
Positive factors
➢ Favorably prevailing the i-Construction in Japan (YoY 140%)
➢ Growing sales of IT Agriculture in Japan (YoY 400%)
■ Opened another i-Construction Training Center (Pre-opened in January 2018)
- Following those in Fukushima, Kobe and Kitakyushu the 4th one was
newly opened in Namekata-city, Ibaraki aiming for further spread of
i-Construction
Topics
■ Auto Steering System : Sales promotion to small farms in Japan
- Shared use : usable in several machinery such as small to mid-size
tractor or rice transplanter
- Adoption at small farms accelerate the spread of Auto Steering System
in Japan

©2018 Topcon Corporation 12
FY2014Actual
FY2015Actual
FY2016Actual
FY2017Plan
FY2018Plan
Promotion to small farms in Japan
Mainly targeted to large farms (due to cost-effective)
Small to medium
size tractor
Rice Transplanter
High
Promotion to small farms Improvement of cost effectiveness by Shared use
Present
Large size tractor
Small to mid-size
tractor
(over 50hp)
Preparation for planting
Place to use
Large farms(Hokkaido etc...)
Small farms Low
Annual tractor
production
(36,500 units)
Planting Growing
under 20%
over 80%
June to AugustMayApril
Production
composition
SharedUse
Auto Steering System :
Source :JAMMA Result
of production in 2016 (under 50hp)
Cost effectiveness
Rice farming process
Console
GNSS
receiver
Attachable to existing tractor
Steering wheel
with electric motor
✓Easy installation
Why shared use available?
Replace general handle with
Motor built-in steering wheel
Sales plan
(Auto Steering System)
(amount)
Small to
mid-size
tractor
Large size
tractor
Sales of IT Agriculture in Japan
SharedUse
SharedUse
Planting
Ditching
Ridge coating

©2018 Topcon Corporation 13
Overview of Each Business
Review of 3Q Financial Results
■ DRI OCT Triton
Topics
+ Positive factors
➢ Sales growth of 3D OCT (YoY120%)
➢ Sales growth of Retinal Camera (NW400) (YoY120%)
- Negative factors
➢ Cost increase due to upfront investment (Development of new IoT business,
R&D cost, Enhancement of FDA acquisition)
➢ Sales slow down in European market
- US FDA clearance on January 20th

©2018 Topcon Corporation 14
January 2018
DRI OCT Triton received FDA approval in US
Maestro received
FDA approval
Triton received
FDA approval
July 2016
R&D(University
Hospital, etc..)
Clinical(University Hospital,
Clinic)
Screening(Clinic, Medical Check-Up)
OCT series
Coverage area
5years ago
Expanding from clinical
to screening market
Expanding from R&D
to clinical market
Expand sales with state-of-the-art SS OCT and versatile Maestro
Received FDA approval as planned thanks to the persistent efforts
to cope with FDA regulatory

©2018 Topcon Corporation 15
FY2017 Full Year PlanⅡ.
©2018 Topcon Corporation 16
FY2017 Full Year Plan
[Consolidated]
FY2016 FY2017
Full Year Full Year
Actual New Plan Change YoY(%)Announced on October 27th
Net Sales 128,387 138,000 0 107% 138,000
Operating Income
(Operating Income Ratio)
9,551
(7.4%)
12,000
(8.7%)0
126% 12,000
(8.7%)
Ordinary Income 7,622 10,500 500 138% 10,000
Net Income 4,395 5,900 200 134% 5,700
ROE 7.4% 10% 10%
ROIC 5.5% 7% 7%
Dividends ¥16 ¥20 ¥20
Exchange Rate *
(Average)
USD ¥109.03 ¥110.24 ¥108.46
EUR ¥119.37 ¥125.45 ¥121.26
* Assumed exchange rate after January 2018 is ¥105/US$, ¥115/EUR
(unit: million yen)

©2018 Topcon Corporation 17
[Consolidated]
FY2016 FY2017
Full Year Full Year
Actual Plan YoY(%)Announced on October 27th
Net
Sales
Positioning 60,602 68,000 112% 68,000
Smart Infrastructure 33,091 36,000 109% 36,000
Eye Care 43,148 45,000 104% 45,000
Others 3,708 4,000 108% 4,000
Elimination -12,163 -15,000 -15,000
Total 128,387 138,000 107% 138,000
Operating Income(Operating Income Ratio)
Positioning5,596
(9.2%)7,000
(10.3%)
125% 7,000(10.3%)
Smart Infrastructure3,939
(11.9%)4,700
(13.1%)
119% 4,700(13.1%)
Eye Care2,598
(6.0%)2,800
(6.2%)
108% 2,800(6.2%)
Others10
(0.3%)0
(-)
- 0(-)
Goodwill Amortization -2,593 -2,500 -2,500
Total9,551
(7.4%)12,000(8.7%)
126% 12,000(8.7%)
Exchange Rate
(Average)
USD ¥109.03 ¥110.24 ¥108.46
EUR ¥119.37 ¥125.45 ¥121.26
FY2017 Full Year Plan by Business
(unit: million yen)
©2018 Topcon Corporation 18
Topcon for Human Life 医・食・住

©2018 Topcon Corporation 19
AppendixⅢ.

©2018 Topcon Corporation 20
6.6
8.4
7.5
10.6
7.8
9.28.5
0.3
1.1
0.3
2.2
0.8 0.8
1.1
0.0
1.0
2.0
3.0
0.0
5.0
10.0
FY16/1Q 2Q 3Q 4Q FY17/1Q 2Q 3Q
Net Sales
Operating Income
Net Sales (billion yen) Operating Income (billion yen)
1. Consolidated
8.8
10.8 10.5
13.1
9.1
12.311.4
0.5
0.8
0.4
0.9
-0.5
1.0
0.7
-1.0
0.0
1.0
2.0
0.0
5.0
10.0
15.0
FY16/1Q 2Q 3Q 4Q FY17/1Q 2Q 3Q
Net Sales
Operating Income
Net Sales (billion yen)
2. Positioning
3. Smart Infrastructure
12.814.3 13.6
19.9
17.218.7
16.7
0.7
1.7
0.5
2.6
1.72.2
0.60.0
1.0
2.0
3.0
0.0
5.0
10.0
15.0
20.0
FY16/1Q 2Q 3Q 4Q FY17/1Q 2Q 3Q
Net Sales
Operating Income
Net Sales (billion yen) Operating Income (billion yen)
26.2
31.7 29.5
41.0
31.6
36.533.6
0.7
3.0
0.7
5.2
1.3
3.2
1.7
0.0
2.0
4.0
6.0
8.0
0.0
10.0
20.0
30.0
40.0
FY16/1Q 2Q 3Q 4Q FY17/1Q 2Q 3Q
Net Sales
Operating Income
Net Sales (billion yen) Operating Income (billion yen)
4. Eye Care
Operating Income (billion yen)
Financial Results (Quarterly)

©2018 Topcon Corporation 21
31.430.6
27.2
33.435.9
32.1
1.7
0.7
2.5
3.1
3.9
3.1
0.0
2.0
4.0
0.0
10.0
20.0
30.0
40.0
FY15/1H FY15/2H FY16/1H FY16/2H FY17/1H FY17/2H
Net Sales Operating Income
Net Sales (billion yen) Operating Income (billion yen)
62.9 67.8
57.9 70.4
68.070.0
4.5
4.3 3.8
5.84.6
7.4
0.0
5.0
10.0
0.0
20.0
40.0
60.0
80.0
FY15/1H FY15/2H FY16/1H FY16/2H FY17/1H FY17/2H
Net Sales Operating Income
Net Sales (billion yen) Operating Income (billion yen)
16.2 16.815.0
18.117.0
19.0
1.92.0
1.4
2.5
1.6
3.1
0.0
2.0
4.0
0.0
10.0
20.0
FY15/1H FY15/2H FY16/1H FY16/2H FY17/1H FY17/2H
Net Sales Operating Income
Net Sales (billion yen) Operating Income (billion yen)
1. Consolidated
19.5
24.3
19.6
23.521.4
23.6
2.1
2.8
1.31.3
0.5
2.3
0.0
2.0
4.0
0.0
10.0
20.0
30.0
FY15/1H FY15/2H FY16/1H FY16/2H FY17/1H FY17/2H
Net Sales Operating Income
Net Sales (billion yen)
2. Positioning
3. Smart Infrastructure 4. Eye Care
Operating Income (billion yen)
Financial Results and Forecast (Semiannually)

©2018 Topcon Corporation 22
These materials contain forward-looking statements, including projections of future
operating performance. Such statements are based on management’s best judgment,
given the materials available to them at the time these statements are made.
However, please be aware that actual performance may differ from projected figures
owing to unexpected changes in the economic environment in which we operate, as
well as to market fluctuations.
The original disclosure in Japanese was released on January 30, 2018 at 16:30(UTC+9)
Inquiries:
Corporate Communication Div.
Investor Relations and Shareholder Relations Dept.
TOPCON CORPORATION
Tel: +81-3-3558-2532
E-mail: [email protected]
URL: http://global.topcon.com/invest/
Cautionary Note regarding Forward-Looking Statements