Consolidated Financial Results - KONICA MINOLTA · Consolidated Financial Results Fiscal Year ended...
45
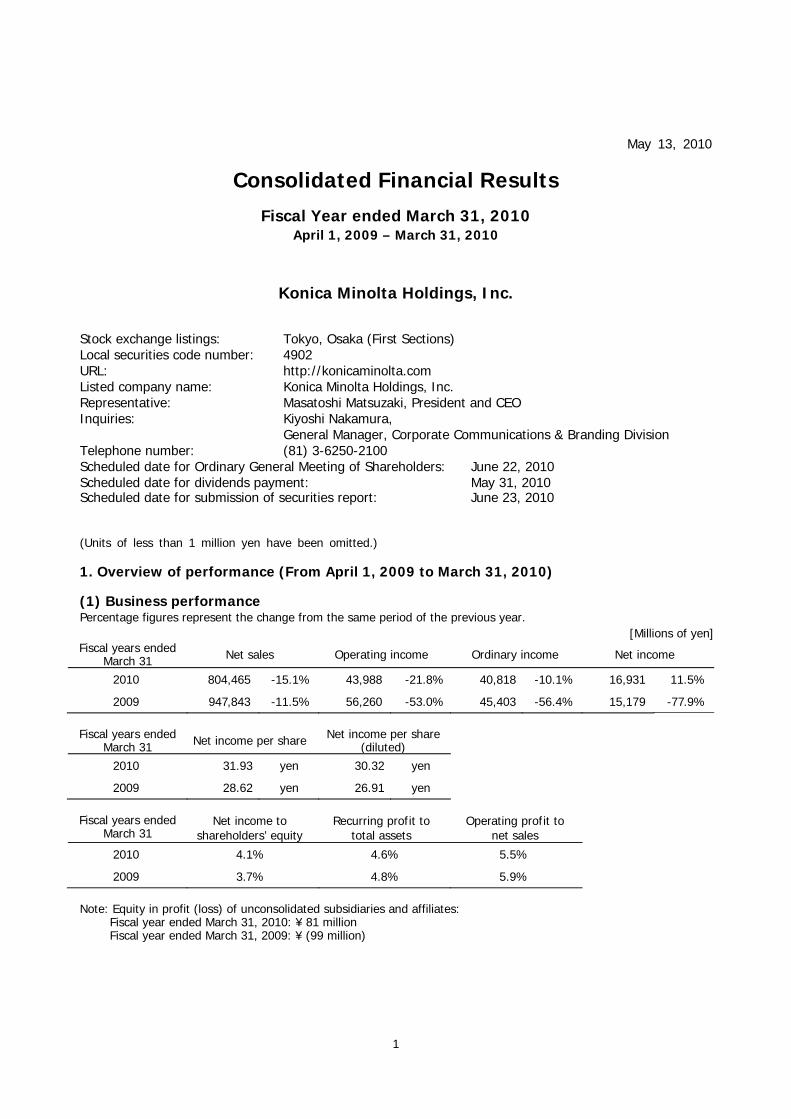
1 May 13, 2010 Consolidated Financial Results Fiscal Year ended March 31, 2010 April 1, 2009 – March 31, 2010 Konica Minolta Holdings, Inc. Stock exchange listings: Tokyo, Osaka (First Sections) Local securities code number: 4902 URL: http://konicaminolta.com Listed company name: Konica Minolta Holdings, Inc. Representative: Masatoshi Matsuzaki, President and CEO Inquiries: Kiyoshi Nakamura, General Manager, Corporate Communications & Branding Division Telephone number: (81) 3-6250-2100 Scheduled date for Ordinary General Meeting of Shareholders: June 22, 2010 Scheduled date for dividends payment: May 31, 2010 Scheduled date for submission of securities report: June 23, 2010 (Units of less than 1 million yen have been omitted.) 1. Overview of performance (From April 1, 2009 to March 31, 2010) (1) Business performance Percentage figures represent the change from the same period of the previous year. [Millions of yen] Fiscal years ended March 31 Net sales Operating income Ordinary income Net income 2010 804,465 -15.1% 43,988 -21.8% 40,818 -10.1% 16,931 11.5% 2009 947,843 -11.5% 56,260 -53.0% 45,403 -56.4% 15,179 -77.9% Fiscal years ended March 31 Net income per share Net income per share (diluted) 2010 31.93 yen 30.32 yen 2009 28.62 yen 26.91 yen Fiscal years ended March 31 Net income to shareholders’ equity Recurring profit to total assets Operating profit to net sales 2010 4.1% 4.6% 5.5% 2009 3.7% 4.8% 5.9% Note: Equity in profit (loss) of unconsolidated subsidiaries and affiliates: Fiscal year ended March 31, 2010: ¥ 81 million Fiscal year ended March 31, 2009: ¥ (99 million)
Transcript of Consolidated Financial Results - KONICA MINOLTA · Consolidated Financial Results Fiscal Year ended...
1
May 13, 2010
Consolidated Financial Results Fiscal Year ended March 31, 2010
April 1, 2009 – March 31, 2010
Konica Minolta Holdings, Inc.
Stock exchange listings: Tokyo, Osaka (First Sections) Local securities code number: 4902 URL: http://konicaminolta.com Listed company name: Konica Minolta Holdings, Inc. Representative: Masatoshi Matsuzaki, President and CEO Inquiries: Kiyoshi Nakamura, General Manager, Corporate Communications & Branding Division Telephone number: (81) 3-6250-2100 Scheduled date for Ordinary General Meeting of Shareholders: June 22, 2010 Scheduled date for dividends payment: May 31, 2010 Scheduled date for submission of securities report: June 23, 2010 (Units of less than 1 million yen have been omitted.) 1. Overview of performance (From April 1, 2009 to March 31, 2010) (1) Business performance Percentage figures represent the change from the same period of the previous year.
[Millions of yen] Fiscal years ended
March 31 Net sales Operating income Ordinary income Net income
2010 804,465 -15.1% 43,988 -21.8% 40,818 -10.1% 16,931 11.5%
2009 947,843 -11.5% 56,260 -53.0% 45,403 -56.4% 15,179 -77.9%
Fiscal years ended
March 31 Net income per share Net income per share (diluted)
2010 31.93 yen 30.32 yen
2009 28.62 yen 26.91 yen
Fiscal years ended
March 31 Net income to
shareholders’ equity Recurring profit to
total assets Operating profit to
net sales
2010 4.1% 4.6% 5.5%
2009 3.7% 4.8% 5.9%
Note: Equity in profit (loss) of unconsolidated subsidiaries and affiliates: Fiscal year ended March 31, 2010: ¥ 81 million Fiscal year ended March 31, 2009: ¥ (99 million)

2
(2) Financial position
[Millions of yen] As of March 31 Total assets Net assets Equity ratio Net assets per share
2010 865,797 420,775 48.5 % 791.28 yen
2009 918,058 414,284 45.0 % 779.53 yen
Notes: Shareholders’ equity As of Mar, 31, 2010: ¥ 419,535 million As of Mar. 31, 2009: ¥ 413,380 million
(3) Cash flows
[Millions of yen]
Fiscal years ended March 31 Operating activities Investing activities Financing activities
Cash and cash equivalents balance at
the end of period2010 113,377 (40,457) (43,803) 164,146
2009 107,563 (90,169) 4,959 133,727
2. Dividends
[Yen]
Fiscal years ended March 31 Dividends per share
1st Quarter 2nd Quarter 3rd Quarter Year-end Total (annual)
2009 - 10.00 - 10.00 20.00
2010 - 7.50 - 7.50 15.00
2011(forecast) - 7.50 - 7.50 15.00
3. Consolidated results forecast for fiscal year ending March 31, 2011
(From April 1, 2010 to March 31, 2011)
[Millions of yen] Net sales Operating income Ordinary income Net income Net income per
share % % % %
Six months 400,000 1.7 21,000 129.3 19,000 117.7 8,000 126.3 15.09 yen
Full-year 830,000 3.2 50,000 13.7 46,000 12.7 20,000 18.1 37.72 yen
Percentage figures for the full year represent the change from the previous fiscal year, while percentage figures for the six months period represent the change from the same period of the previous year.
Fiscal years ended March 31 Total dividends (annual) [millions of yen]
Dividend pay-out ratio (consolidated) [%]
Net asset-to-dividend ratio (consolidated) [%]
2009 10,606 69.9 2.6
2010 7,953 47.0 1.9
2011(forecast) 39.8

3
4. Other (1) Changes in status of material subsidiaries during the quarter under review (Changes to specified
subsidiaries accompanying the additional consolidation or removal from consolidation of companies): None
(2) Changes to consolidated financial statement principles, preparation processes, disclosure methods, etc.
(Description of changes to important items fundamental to financial statement preparation) a. Changes accompanied by the amendment of accounting principles: Yes b. Changes other than “a.”: None Note: Please refer to” [4] Accounting standards and methods” on page 27 for details. (3) Number of outstanding shares(common stock) a. Outstanding shares at period-end(including treasury stock)
As of March 31, 2010: 531,664,337 shares As of March 31, 2009: 531,664,337 shares
b. Treasury stock at period-end
As of March 31, 2010: 1,464,883 shares As of March 31, 2009: 1,370,709 shares
Note: For the number of shares, used for the calculation of net income per share, please see “Per Share Information” on page 45.

4
[Reference] Non-consolidated financial results 1. Overview of performance (From April 1, 2009 to March 31, 2010) (1) Business performance Percentage figures represent the change from the same period of the previous year.
[Millions of yen] Fiscal years ended
March 31 Net sales Operating income Ordinary income Net income
2010 19,965 -56.1% (9,768) -170.3% (8,775) -156.4% (4,586) -125.0%
2009 45,489 -30.6% 13,896 -59.7% 15,551 -57.2% 18,329 -61.8%
Fiscal years ended
March 31 Net income per share
Net income per share (diluted)
2010 (8.65) yen - yen
2009 34.56 yen 32.52 yen
Note: Net income per share (after full dilution) is not written, as the Group recorded a net loss. (2) Financial position
[Millions of yen] As of March 31 Total assets Net assets Equity ratio Net assets per share
2010 469,954 255,806 54.3 % 481.31 yen
2009 490,403 268,840 54.7 % 506.10 yen
Notes: Shareholders’ equity As of Mar. 31, 2010: ¥ 255,188 million As of Mar. 31, 2009: ¥ 268,380 million
Explanation of Appropriate Use of Performance Projections and Other Special Items This document contains projections of performance and other projections that were made based on information currently available and certain assumptions judged to be reasonable. There is a possibility that diverse factors may cause actual performance, etc., to differ considerably from projections. Please see the “3. Outlook for the fiscal year ending March 31, 2011” section on page 11 for more information on points to be remembered in connection with the use of projections.

5
1. Operating Results (1) Business Performance Analysis 1. Overview
[Billions of yen]March 31
2010 2009 Increase (Decrease)
Net sales Gross profit Operating income (loss) Ordinary income Income before income taxes and
minority interests Net income
804.4 364.4 43.9 40.8 36.0
16.9
947.8 427.6 56.2 45.4 33.2
15.1
(143.3) (63.1) (12.2) (4.5)
2.8
1.7
-15.1 %-14.8 %-21.8 %-10.1 %
8.6 %
11.5 %
Net income per share [yen] 31.93 28.62 3.31 11.6 %Capital expenditure Depreciation R & D expenses
36.9 61.1 68.4
61.1 70.1 81.7
(24.2) (9.0)
(13.3)
-39.6 %-12.8 %-16.3 %
Free cash flow 72.9 17.3 55.5 319.2 %Number of employees [persons] 36,048 36,875 (827) -2.2 %Exchange rates [yen]
US dollar Euro
92.85
131.15
100.54 143.48
(7.69)
(12.33) -7.6 %-8.6 %
Looking at economic circumstances in Japan and abroad, a credit crunch triggered by the financial crisis in the fall of 2008 had severe repercussions for the real economy, producing a vicious cycle of weak consumption, declining production, and worsening employment conditions that swept across the world, especially in advanced economies. The worst of this downturn has now passed, thanks largely to measures to restore financial order by the financial authorities and the success of government stimulus packages, and there were signs of a gradual recovery in the second half of the fiscal year under review. However, the recovery remained anemic as capital spending restrains and the credit crunch lingered. Moreover, a protracted appreciation of the yen put strong pressure on operating revenue at businesses including the Konica Minolta Group, where the ratio of overseas sales is high. The Group regards the drastic change in the business environment not as a temporary economic slowdown but as a turning point in society and an opportunity to enhance its corporate value to achieve stronger growth, the Group formulated BUSINESS PLAN <09-10>. And it is now executed it to ensure it is able to successfully navigate through this challenging period. The business plan has three pillars: (1) Improving corporate capabilities, (2) Achieving strong growth, and (3) Reforming the corporate culture. It will be executed during the fiscal year under review and in the next fiscal year. In the fiscal year under review, the first year of implementation, the Group focused on lowering break-even point by minimizing fixed costs through cost cutting and the execution of structural reforms, including the optimization of production systems in Japan and overseas, and the streamlining of overseas sales bases and sales personnel, including acquired sales companies, considering that the Group needs to urgently change its corporate structure to ensure it has free cash flows even in difficult business circumstances where growth in sales cannot be expected. The Group also took steps to trim down the balance sheet by reducing inventories, curbing capital expenditure, and improving accounts receivable periods and accounts payable periods. As a result of

6
those initiatives, free cash flows for the fiscal year under review topped ¥70 billion, far exceeding the year-ago level. Looking at the results of major businesses, sales of multi-functional peripherals (MFPs) for offices, the main products in the Business Technologies Business, were less than in the previous fiscal year, reflecting reduced capital spending by a corporate sector looking to cut costs, as well as tightening lease contracts attributable to the credit crunch. Nonetheless, the Group sought to boost demand by launching new color machines, and sales momentum consequently recovered in the Business Technologies Business in the second half of the fiscal year under review. In the Optics Business, as the LCD TV and personal computer markets recovered, sales of TAC films (protective films for polarizing plates) and glass hard disk (HD) substrates were sold well. In the Medical and Graphic Imaging Business, sales of digital equipment were almost on a par with the year-ago level, but that did not offset decrease in sales of film products.
As a result, Konica Minolta’s consolidated net sales for the fiscal year under review amounted to ¥804.4 billion, a decrease of 15.1% year on year, reflecting declines in sales of main products and the effect of exchange conversion associated with the strong yen. Although the Group cut fixed costs and research and development expenditure, among other cost reductions, operating income fell 21.8%, to ¥43.9 billion, and ordinary income slipped 10.1%, to ¥40.8 billion, respectively, reflecting a decline in profits associated with the decrease in sales and the effect of exchange rates. After posting a loss on valuation of investment securities and business structure improvement expenses as extraordinary losses, net income stood at ¥16.9 billion, up 11.5% year on year.

7
2. Segment Information [Billions of yen]
March 31 2010 2009 Increase (Decrease)
Business Technologies Net sales - external Operating income
540.8 38.9
623.6 52.5
(82.8) (13.5)
-13.3 % -25.9 %
Optics Net sales - external Operating income
136.7 14.3
173.4 12.5
(36.6) 1.8
-21.1 % 14.8 %
Medical & Graphic Net sales - external Operating income
104.3 1.4
125.8 3.0
(21.5) (1.6)
-17.1 % -52.3 %
Sensing Net sales - external Operating income (loss)
6.9 (0.0)
8.3 0.3
(1.4) (0.3)
-17.5 % -
Business Technologies Business [MFPs for offices] Konica Minolta strove to boost demand for MFPs for offices as companies cut costs and curbed capital expenditure in the protracted global downturn, updating the bizhub series by launching two models of high speed color MFPs, namely bizhub C652 and C552, and four models of medium-to-low speed color MFPs, bizhub C452, C360, C280, and C220, in the first half of the fiscal year. These six new products are designed to contribute to customers’ total cost of ownership (TCO) with new energy saving systems that slash power consumption compared with conventional models and with more durable components. They are also intended to help customers boost their productivity and reduce the environmental burden by offering high image quality with the use of the Company’s proprietary polymerized toner, cutting-edge network and security functions, and significantly lower machine operation noise. Partly reflecting the contribution of these new products, sales volumes of color MFPs for offices increased steadily every quarter. Although sales volumes for the full year fell short of the level of a year ago, those for the second half exceeded the year-ago level. Meanwhile, sales volumes of monochrome MFPs for offices recovered in the second half, with volumes in the North American market, which drove the recovery, exceeding the year-ago level. [Production printing field] Demand for color machines, such as bizhub PRO C6501 and C5501, remained stagnant in all markets in the global slowdown. On the other hand, with the launch of two new monochrome products, the bizhub PRO 1201/1051, sales of monochrome MFPs were up from a year ago, reflecting strong sales, principally in the North America and Asian markets. [Printer field] We stepped up our efforts to sell A4 tandem printers and A4 color MFPs for office use. Sales volumes of printers for the fiscal year under review far exceeded the year-ago level, driven by sharp rises in sales volumes of color machines for Europe and OEMs.
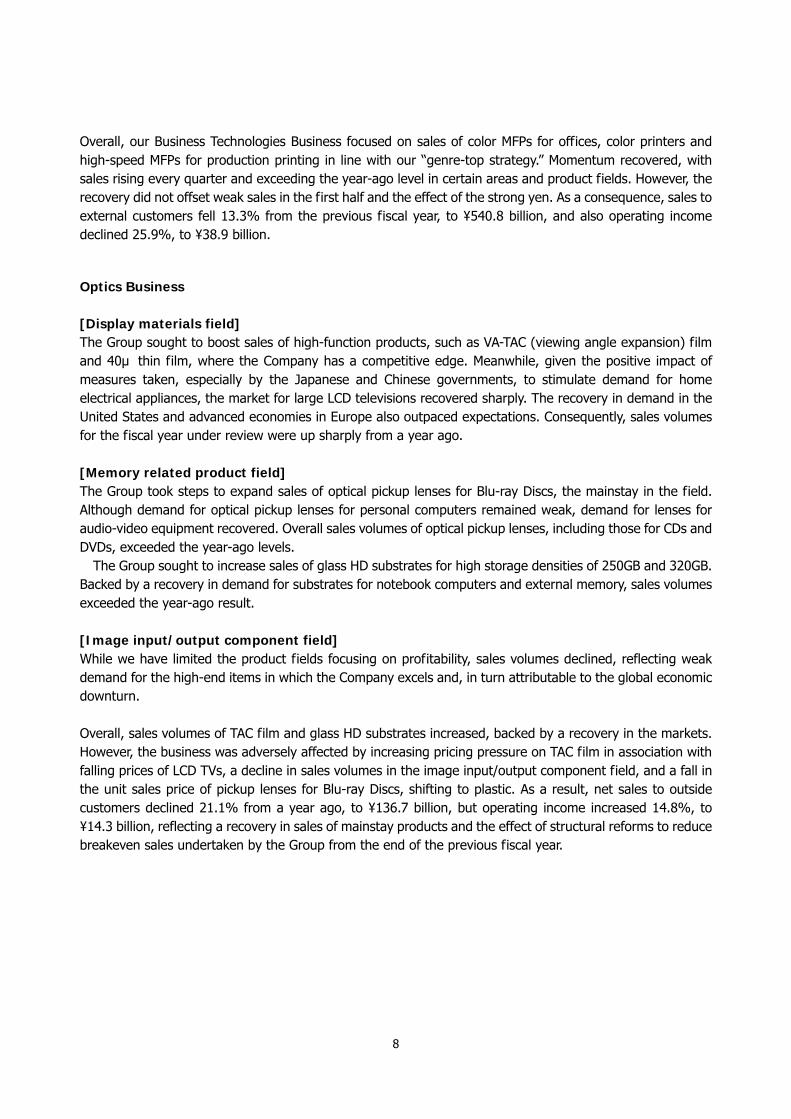
Overall, our Business Technologies Business focused on sales of color MFPs for offices, color printers and high-speed MFPs for production printing in line with our “genre-top strategy.” Momentum recovered, with sales rising every quarter and exceeding the year-ago level in certain areas and product fields. However, the recovery did not offset weak sales in the first half and the effect of the strong yen. As a consequence, sales to external customers fell 13.3% from the previous fiscal year, to ¥540.8 billion, and also operating income declined 25.9%, to ¥38.9 billion. Optics Business
[Display materials field] The Group sought to boost sales of high-function products, such as VA-TAC (viewing angle expansion) film and 40μ thin film, where the Company has a competitive edge. Meanwhile, given the positive impact of measures taken, especially by the Japanese and Chinese governments, to stimulate demand for home electrical appliances, the market for large LCD televisions recovered sharply. The recovery in demand in the United States and advanced economies in Europe also outpaced expectations. Consequently, sales volumes for the fiscal year under review were up sharply from a year ago. [Memory related product field] The Group took steps to expand sales of optical pickup lenses for Blu-ray Discs, the mainstay in the field. Although demand for optical pickup lenses for personal computers remained weak, demand for lenses for audio-video equipment recovered. Overall sales volumes of optical pickup lenses, including those for CDs and DVDs, exceeded the year-ago levels. The Group sought to increase sales of glass HD substrates for high storage densities of 250GB and 320GB. Backed by a recovery in demand for substrates for notebook computers and external memory, sales volumes exceeded the year-ago result. [Image input/output component field] While we have limited the product fields focusing on profitability, sales volumes declined, reflecting weak demand for the high-end items in which the Company excels and, in turn attributable to the global economic downturn. Overall, sales volumes of TAC film and glass HD substrates increased, backed by a recovery in the markets. However, the business was adversely affected by increasing pricing pressure on TAC film in association with falling prices of LCD TVs, a decline in sales volumes in the image input/output component field, and a fall in the unit sales price of pickup lenses for Blu-ray Discs, shifting to plastic. As a result, net sales to outside customers declined 21.1% from a year ago, to ¥136.7 billion, but operating income increased 14.8%, to ¥14.3 billion, reflecting a recovery in sales of mainstay products and the effect of structural reforms to reduce breakeven sales undertaken by the Group from the end of the previous fiscal year.
8

Medical and Graphic Imaging Business [Healthcare field]
In the digital X-ray diagnostic imaging area, main business sector, Konica Minolta launched a new computed radiography (CR) system, the REGIUS MODEL 210. The Company sought to expand sales to medical facilities both in Japan and overseas by offering digital radiography (DR) systems and diagnostic imaging workstations in addition to CR systems. As a result, sales volumes of this digital equipment were almost on a par with the levels of the previous year. We also took steps to expand our business sphere from the existing X-ray diagnostic imaging area, launching new products such as the I-PACS EX ceed, a network device, and the SONIMAGE 513 color ultrasonic diagnostic equipment. [Graphic imaging field]
Konica Minolta focused on sales of digital equipment, including Pagemaster Pro 6501, an on-demand printing system. Despite the continued cooling of capital expenditure in the printing industry associated with the lingering economic sluggishness, the Company endeavored to boost sales. As a result of its efforts, sales of digital equipment were almost on a par with the level of a year ago.
As noted, our Medical & Graphic Imaging Business focused on expanding the sales of the digital equipment and strengthening the digital solution business, but accelerating declines in sales of film products, in addition to the effect of a strong yen, could not be offset either in the healthcare field or in the graphic imaging field. As a consequence, net sales to outside customers fell 17.1% from the previous year, to ¥104.3 billion. As gross profit declined with a fall in sales volumes of film products, the Company stepped up its initiatives to reduce fixed costs. However, operating income slipped 52.3%, to ¥1.4 billion. Sensing Business
In the Sensing Business, Konica Minolta launched new products, the CM-5 spectrophotometer, the CR-5 colorimeter, and the RANGE5 non-contact 3D digitizer and sought to boost sales, especially in the fields of color sensing and 3D measuring. However, although sales increased sharply in China, capital expenditure continued to be curbed in the manufacturing industry in major markets in Japan, the United States, and Europe, reflecting economic stagnation, and consequently, sales volumes experienced sluggish growth. As a result, net sales to outside customers declined 17.5%, to ¥6.9 billion. The operating loss was ¥6 million.
9
10
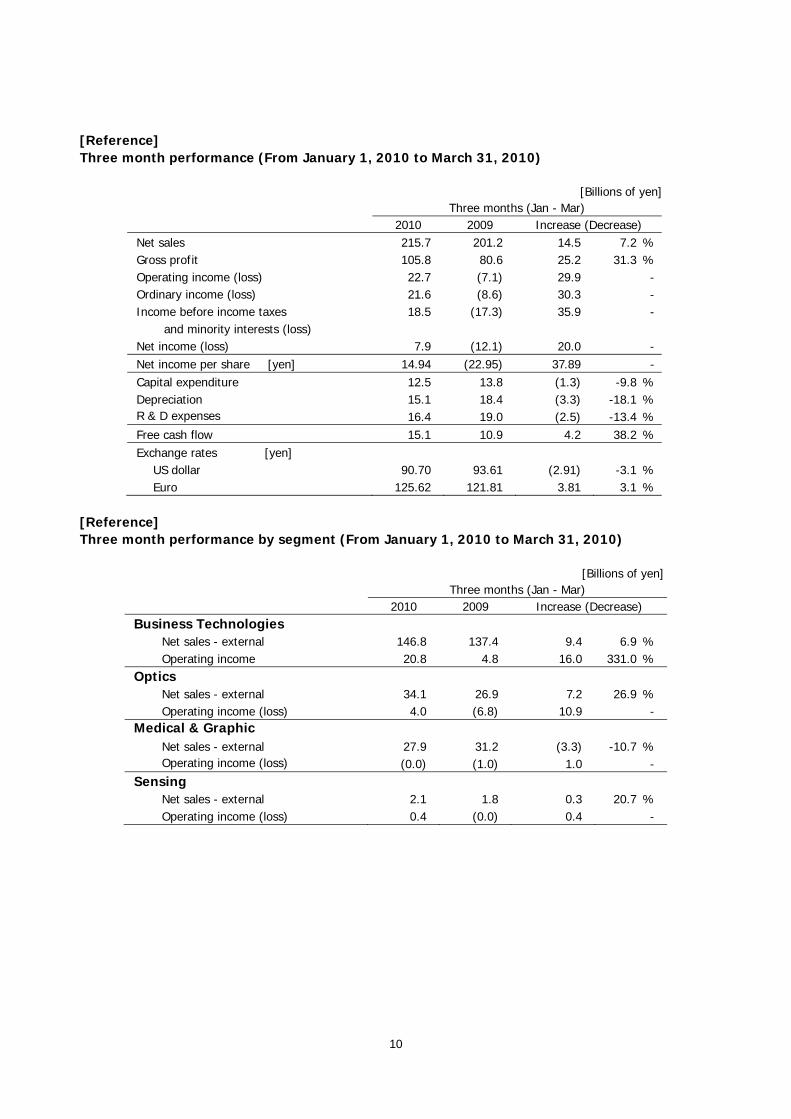
[Reference] Three month performance (From January 1, 2010 to March 31, 2010)
[Billions of yen] Three months (Jan - Mar)
2010 2009 Increase (Decrease) Net sales Gross profit Operating income (loss) Ordinary income (loss) Income before income taxes
and minority interests (loss) Net income (loss)
215.7 105.8 22.7 21.6 18.5
7.9
201.2 80.6 (7.1) (8.6)
(17.3)
(12.1)
14.5 25.2 29.9 30.3 35.9
20.0
7.2 %31.3 %
---
-Net income per share [yen] 14.94 (22.95) 37.89 -Capital expenditure Depreciation R & D expenses
12.5 15.1 16.4
13.8 18.4 19.0
(1.3) (3.3) (2.5)
-9.8 %-18.1 %-13.4 %
Free cash flow 15.1 10.9 4.2 38.2 %Exchange rates [yen]
US dollar Euro
90.70
125.62
93.61
121.81
(2.91)
3.81 -3.1 %3.1 %
[Reference] Three month performance by segment (From January 1, 2010 to March 31, 2010)
[Billions of yen] Three months (Jan - Mar)
2010 2009 Increase (Decrease) Business Technologies
Net sales - external Operating income
146.8 20.8
137.4 4.8
9.4 16.0
6.9 % 331.0 %
Optics Net sales - external Operating income (loss)
34.1 4.0
26.9 (6.8)
7.2 10.9
26.9 % -
Medical & Graphic Net sales - external Operating income (loss)
27.9 (0.0)
31.2 (1.0)
(3.3) 1.0
-10.7 % -
Sensing Net sales - external Operating income (loss)
2.1 0.4
1.8 (0.0)
0.3 0.4
20.7 % -

11
3. Outlook for the fiscal year ending March 31, 2011 The economic situation surrounding the Group, both in Japan and abroad, is generally expected to recover as emerging economies in Asia and elsewhere maintain the growth seen in the current fiscal year. Japan and the United States, along with advanced European economies, seem to enjoy moderate recoveries. Still, many concerns remains, including a very difficult employment situation, rising long-term interest rates, and a stronger yen. We think the economic outlook remains uncertain and challenging.
Looking at the main businesses of the Company, we believe the Business Technologies Business will enjoy a modest recovery in the fiscal year ending March 31, 2011, although it will take some time for demand for MFPs for offices and production printing to recover in earnest. In the Optics Business, demand for digital consumer electronics such as LCD TVs and personal computers is expected to continue to expand. We assume exchange rates of 90 yen against the US dollar and 125 yen against the euro. [Billions of yen] March 2011 forecast March 2010 Increase (Decrease) Six months Full year Six months Full year Six months Full year Net sales 400.0 830.0 393.3 804.4 6.6 25.5 Operating income 21.0 50.0 9.1 43.9 11.8 6.0 Ordinary income 19.0 46.0 8.7 40.8 10.2 5.1 Net income 8.0 20.0 3.5 16.9 4.4 3.0
Note: The above operating performance forecasts are based on future-related suppositions, outlooks, and plans at the time this report was released, and they involve risks and uncertainties. It should be noted that actual results may differ significantly from these forecasts due to various important factors, such as changes in economic conditions, market trends, and currency exchange rates.
12
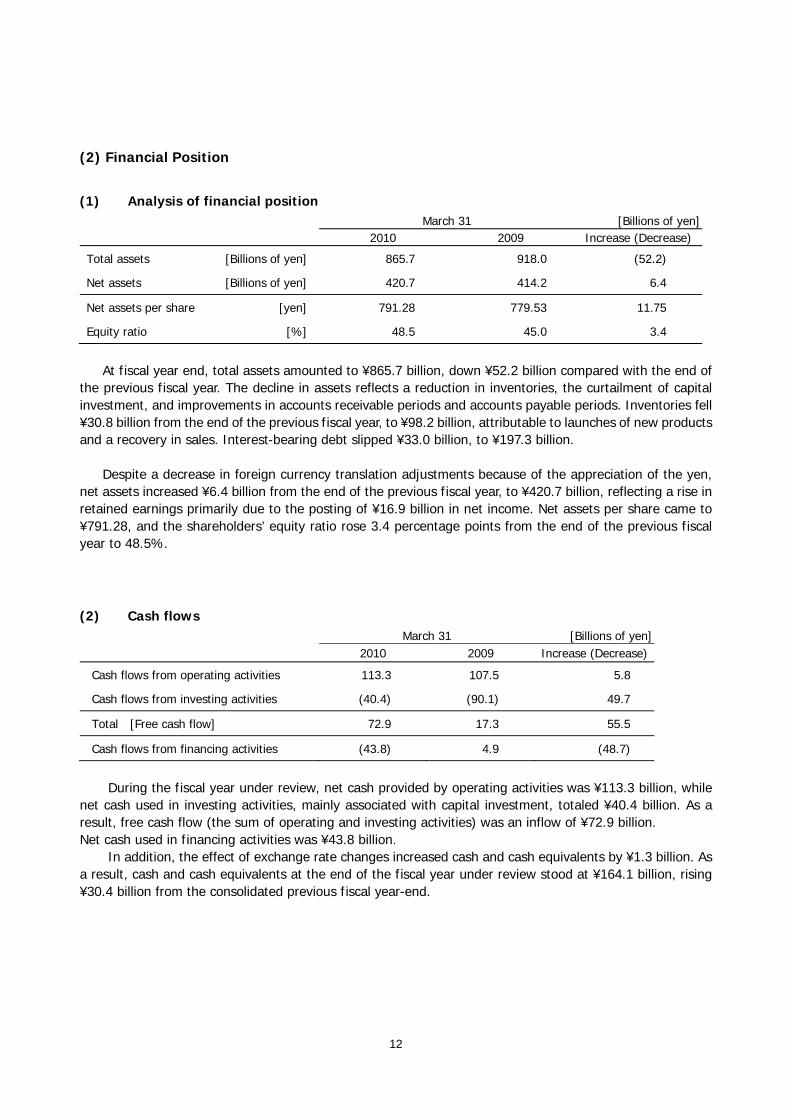
(2) Financial Position
(1) Analysis of financial position March 31 [Billions of yen] 2010 2009 Increase (Decrease)
Total assets [Billions of yen] 865.7 918.0 (52.2)
Net assets [Billions of yen] 420.7 414.2 6.4
Net assets per share [yen] 791.28 779.53 11.75
Equity ratio [%] 48.5 45.0 3.4
At fiscal year end, total assets amounted to ¥865.7 billion, down ¥52.2 billion compared with the end of
the previous fiscal year. The decline in assets reflects a reduction in inventories, the curtailment of capital investment, and improvements in accounts receivable periods and accounts payable periods. Inventories fell ¥30.8 billion from the end of the previous fiscal year, to ¥98.2 billion, attributable to launches of new products and a recovery in sales. Interest-bearing debt slipped ¥33.0 billion, to ¥197.3 billion.
Despite a decrease in foreign currency translation adjustments because of the appreciation of the yen,
net assets increased ¥6.4 billion from the end of the previous fiscal year, to ¥420.7 billion, reflecting a rise in retained earnings primarily due to the posting of ¥16.9 billion in net income. Net assets per share came to ¥791.28, and the shareholders’ equity ratio rose 3.4 percentage points from the end of the previous fiscal year to 48.5%.
(2) Cash flows March 31 [Billions of yen]
2010 2009 Increase (Decrease)
Cash flows from operating activities 113.3 107.5 5.8
Cash flows from investing activities (40.4) (90.1) 49.7
Total [Free cash flow] 72.9 17.3 55.5
Cash flows from financing activities (43.8) 4.9 (48.7)
During the fiscal year under review, net cash provided by operating activities was ¥113.3 billion, while
net cash used in investing activities, mainly associated with capital investment, totaled ¥40.4 billion. As a result, free cash flow (the sum of operating and investing activities) was an inflow of ¥72.9 billion. Net cash used in financing activities was ¥43.8 billion.
In addition, the effect of exchange rate changes increased cash and cash equivalents by ¥1.3 billion. As a result, cash and cash equivalents at the end of the fiscal year under review stood at ¥164.1 billion, rising ¥30.4 billion from the consolidated previous fiscal year-end.
13
Net cash provided by operating activities
Net cash provided by operating activities reached ¥113.3 billion (¥107.5 billion in the previous consolidated fiscal year). Although the Group reported income before income taxes and minority interests of ¥36.0 billion, depreciation of ¥61.1 billion, and an improvement of working capital of ¥17.5 billion, these amounts were partly offset by ¥6.5 billion in accounts payable and accrued expenses, ¥3.8 billion in interest expenses, and other factors. Net cash used in investing activities Net cash used in investing activities was ¥40.4 billion (¥90.1 in the previous fiscal year). Cash of ¥33.6 billion was mainly used for investments in molding for new products in the Business Technologies Business and in the acquisition of tangible fixed assets relating to the reinforcement of production capacities in the Optics Business, our strategic business. As a result, free cash flow (the sum of operating and investing activities) was an inflow of ¥72.9 billion (¥17.3 billion in the previous fiscal year). Net cash used in financing activities Net cash used in financing activities was ¥43.8 billion (net cash provided of ¥4.9 billion in the previous fiscal year), mainly reflecting ¥30.0 billion for the redemption of corporate bonds at maturity, ¥9.2 billion in dividend payments, and ¥4.4 billion for repayments of loans payable and lease obligations. (Note) Amounts mentioned above do not include consumption taxes.
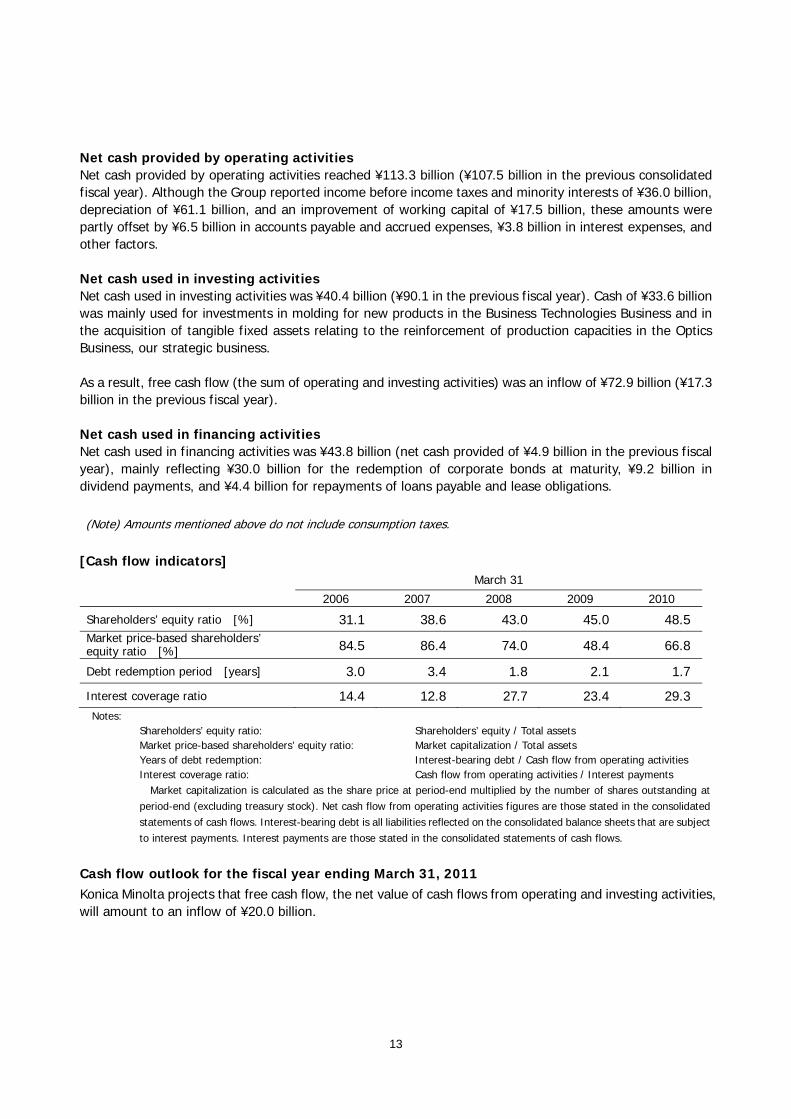
[Cash flow indicators] March 31
2006 2007 2008 2009 2010
Shareholders’ equity ratio [%] 31.1 38.6 43.0 45.0 48.5Market price-based shareholders’ equity ratio [%] 84.5 86.4 74.0 48.4 66.8
Debt redemption period [years] 3.0 3.4 1.8 2.1 1.7
Interest coverage ratio 14.4 12.8 27.7 23.4 29.3Notes:
Shareholders’ equity ratio: Shareholders’ equity / Total assets Market price-based shareholders’ equity ratio: Market capitalization / Total assets Years of debt redemption: Interest-bearing debt / Cash flow from operating activities Interest coverage ratio: Cash flow from operating activities / Interest payments
Market capitalization is calculated as the share price at period-end multiplied by the number of shares outstanding at period-end (excluding treasury stock). Net cash flow from operating activities figures are those stated in the consolidated statements of cash flows. Interest-bearing debt is all liabilities reflected on the consolidated balance sheets that are subject to interest payments. Interest payments are those stated in the consolidated statements of cash flows.
Cash flow outlook for the fiscal year ending March 31, 2011 Konica Minolta projects that free cash flow, the net value of cash flows from operating and investing activities, will amount to an inflow of ¥20.0 billion.
14
(3) Basic policy regarding profit distribution, dividends for the fiscal year under review, and
projected dividends for the current fiscal year
1. Basic policy regarding profit distribution
The policy regarding the payment of dividends from retained earnings, etc. calls for the basic approach of making a comprehensive evaluation of consolidated performance and funding requirements for promoting strategic investments in growth fields while seeking to sustain shareholder returns. Regarding the specific dividend target, the Company is aiming to sustain a dividend payout ratio of 25% or higher over the medium-to-long-term. With respect to the acquisition of treasury stock, the Company intends to make appropriate decisions regarding treasury stock acquisition as a means of profit distribution while giving due attention to such factors as the Company’s financial condition and stock price trends.
2. Dividends for the fiscal year under review and the current fiscal year In the fiscal year under review (fiscal year ended March 31, 2010), the Company reported lower profits as the business downturn was greater than anticipated in the first half of the fiscal year. Nevertheless, the Company intends to distribute a year-end dividend of 7.5 yen per share as initially planned, which combined with the interim dividend of 7.5 yen per share will bring the total annual dividend to 15 yen per share.
With respect to dividends for the current fiscal year (fiscal year ending March 31, 2011), given that the business environment demands prudence, the Company plans to distribute 7.5 yen per share for both the interim dividend and the year-end dividend, making a total annual dividend of 15 yen per share.
*Figures given in the text as billions of yen have been rounded off to the nearest hundred million.
15
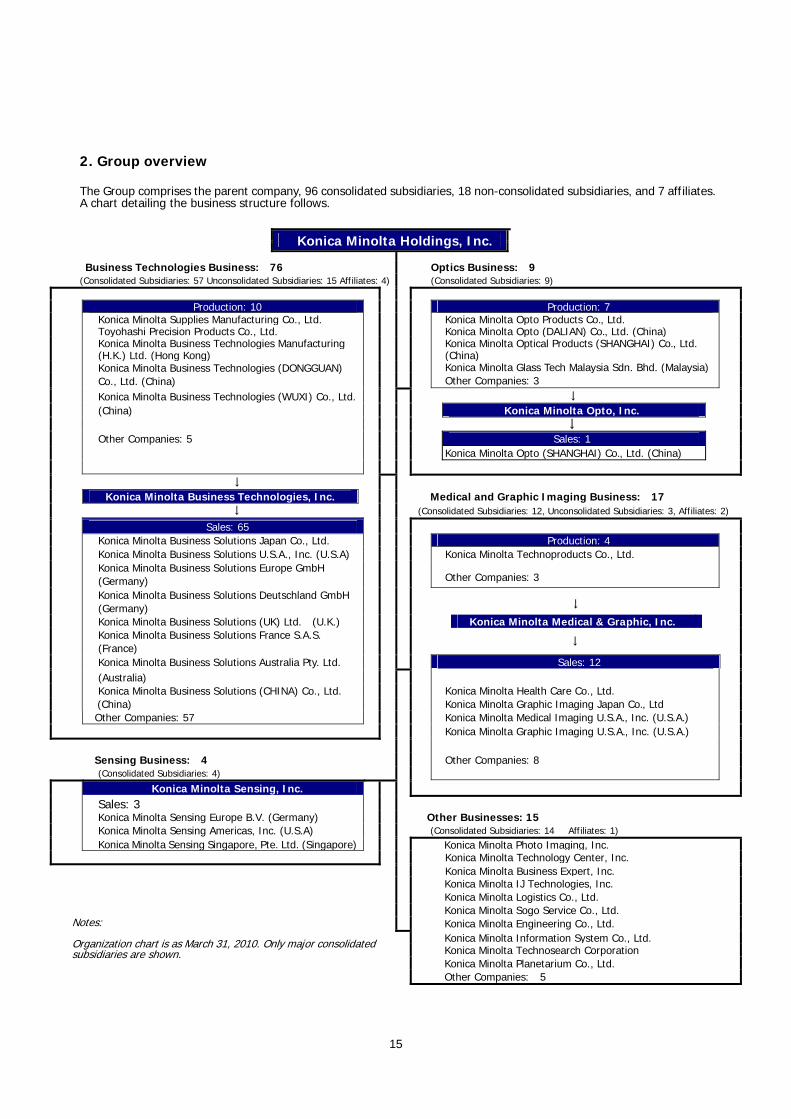
2. Group overview The Group comprises the parent company, 96 consolidated subsidiaries, 18 non-consolidated subsidiaries, and 7 affiliates. A chart detailing the business structure follows.
Konica Minolta Holdings, Inc.
Business Technologies Business: 76 Optics Business: 9 (Consolidated Subsidiaries: 57 Unconsolidated Subsidiaries: 15 Affiliates: 4) (Consolidated Subsidiaries: 9)
Production: 10 Production: 7 Konica Minolta Supplies Manufacturing Co., Ltd. Konica Minolta Opto Products Co., Ltd. Toyohashi Precision Products Co., Ltd. Konica Minolta Opto (DALIAN) Co., Ltd. (China)Konica Minolta Business Technologies Manufacturing (H.K.) Ltd. (Hong Kong)
Konica Minolta Optical Products (SHANGHAI) Co., Ltd. (China)
Konica Minolta Business Technologies (DONGGUAN) Co., Ltd. (China)
Konica Minolta Glass Tech Malaysia Sdn. Bhd. (Malaysia) Other Companies: 3
Konica Minolta Business Technologies (WUXI) Co., Ltd. ↓ (China) Konica Minolta Opto, Inc. ↓ Other Companies: 5 Sales: 1 Konica Minolta Opto (SHANGHAI) Co., Ltd. (China)
↓ Konica Minolta Business Technologies, Inc. Medical and Graphic Imaging Business: 17
↓ (Consolidated Subsidiaries: 12, Unconsolidated Subsidiaries: 3, Affiliates: 2) Sales: 65
Konica Minolta Business Solutions Japan Co., Ltd. Production: 4 Konica Minolta Business Solutions U.S.A., Inc. (U.S.A) Konica Minolta Technoproducts Co., Ltd. Konica Minolta Business Solutions Europe GmbH (Germany) Other Companies: 3
Konica Minolta Business Solutions Deutschland GmbH (Germany)
↓
Konica Minolta Business Solutions (UK) Ltd. (U.K.) Konica Minolta Medical & Graphic, Inc. Konica Minolta Business Solutions France S.A.S. (France)
↓
Konica Minolta Business Solutions Australia Pty. Ltd. Sales: 12 (Australia) Konica Minolta Business Solutions (CHINA) Co., Ltd. Konica Minolta Health Care Co., Ltd. (China) Konica Minolta Graphic Imaging Japan Co., LtdOther Companies: 57 Konica Minolta Medical Imaging U.S.A., Inc. (U.S.A.)
Konica Minolta Graphic Imaging U.S.A., Inc. (U.S.A.)
Sensing Business: 4 Other Companies: 8 (Consolidated Subsidiaries: 4)
Konica Minolta Sensing, Inc. Sales: 3 Konica Minolta Sensing Europe B.V. (Germany) Other Businesses: 15 Konica Minolta Sensing Americas, Inc. (U.S.A) (Consolidated Subsidiaries: 14 Affiliates: 1) Konica Minolta Sensing Singapore, Pte. Ltd. (Singapore) Konica Minolta Photo Imaging, Inc.
Konica Minolta Technology Center, Inc. Konica Minolta Business Expert, Inc.
Konica Minolta IJ Technologies, Inc. Konica Minolta Logistics Co., Ltd. Konica Minolta Sogo Service Co., Ltd.
Notes: Organization chart is as March 31, 2010. Only major consolidated subsidiaries are shown.
Konica Minolta Engineering Co., Ltd. Konica Minolta Information System Co., Ltd. Konica Minolta Technosearch Corporation
Konica Minolta Planetarium Co., Ltd. Other Companies: 5

16
3. Management policy (1) Basic management policy
Management philosophy: “The creation of new value” Management visions: “An innovative corporation that continues to create inspiring products and services in the field of imaging” “A global corporation that leads the market by
advanced technologies and reliability” Corporate Message: “The essentials of imaging” (Means providing the essentials to customers and being recognized as an essential company in the imaging world.)
(2) Medium-to long-term management strategies and pending issues We expect the current positive momentum will generally continue, with the ongoing growth of emerging economies, especially in Asia, and moderate recoveries in advanced economies such as Japan, the United States, and Europe. However, potential causes of instability among macroeconomic indicators are still of particular concern, including the employment situation, long-term interest rates, and exchange rates. Consequently, economic conditions remain uncertain and challenging. In this difficult environment, the Konica Minolta Group has stemmed the trend of declines in sales and profit for two consecutive fiscal years. Positioning the fiscal year ending March 31, 2011 as a turning point for a return to growth, the Group will be proactive in its initiatives to achieve strong growth, as stated in BUSINESS PLAN <09-10>, and will look to achieve sustainable growth not only in the immediate future but also five to ten years from now. The Group has focused on improving its corporate capabilities under the business plan. To do this, the Group will reform processes in all functions, including the planning, development, production, and sale of products, from the perspective of customers. We will also undertake comprehensive reforms in distribution, procurement, and information technology. We believe these reforms will strengthen the competitiveness of the entire Group. To achieve its vision for sustainable growth, the Group will take on the major challenges described below.
1. Bolstering existing businesses and expanding operations
In the Business Technologies Business, particularly in the office segment we will strive to meet the diversified needs of customers for offices by bolstering the competitiveness of MFPs and enhancing solution and service systems. For the production printing segment, we will enhance our product lineup by launching new products and will enter the commercial printing market by strengthening cooperation with internal and external resources, then expand the production printing business.
In the Optics Business, the Group aims to expand the sales volume and market share of TAC films and glass HD substrates by improving production efficiency and ramping up production capacity through active capital expenditure. Using its optical technologies, the Group will enter the LED lighting business, thus expanding operations into a new field other than the digital consumer electronics industry.
17
2. Strengthening operations in Asian markets
In Asian markets, where demand is expected to grow, the Group will focus on rapidly expanding sales in China and India as immediate priority, especially in the Business Technologies and Medical/Healthcare Businesses, and strengthen to sell the Group’s products and services. Meanwhile, we will continue to shift production bases to China and Malaysia and will step up local procurement. The Group aims to expand operations by enhancing its competitiveness through cost reductions.
3. Accelerating development of new businesses
For the Group to achieve strong, sustainable growth over the next five to ten years, it is important to add new businesses that will create a new era in addition to existing businesses. The Group will launch new businesses in the environment and energy, where social needs are increasing, and will harness its strengths to offer unique products. The Group will then develop a new area to serve as the third business, following the Business Technologies Business and Optics Business. Specifically, we are developing an organic light emitting diode (OLED) business based on a strategic alliance with General Electric Company (GE) of the United States. To establish mass production technology and to produce samples and products for limited sale aiming for cultivating potential customers, the Group is constructing a pilot line that is slated to be completed in the fall of 2010. Meanwhile, the Group has formed a capital and business alliance with Konarka Technologies, Inc., a U.S. venture, and is launching an organic thin film solar cell business, taking advantage of synergies with the OLED business. Through these businesses, the Group seeks to maximize its social contribution and elevate itself to a group of companies that better meet the needs of society, thereby increasing corporate value.

4. Consolidated Financial Statements
(1) Consolidated Balance SheetsMarch 31, 2009 and 2010
[Millions of yen]March 31, 2009 March 31, 2010
Consolidated balance sheetsAssets
Current assetsCash and deposits 85,753 85,533Notes and accounts receivable-trade 171,835 177,720Lease receivables and investment assets 13,598 13,993Short-term investment securities 48,000 79,000Inventories 129,160 98,263Deferred tax assets 25,326 19,085Accounts receivable-other 16,531 7,639Other 19,463 12,720Allowance for doubtful accounts (4,749) (4,703)Total current assets 504,919 489,253
Noncurrent assetsProperty, plant and equipment
Buildings and structures, net 71,937 66,708Machinery, equipment and vehicles, net 69,726 52,782Tools, furniture and fixtures, net 26,875 22,026Land 35,033 34,320Lease assets, net 196 366Construction in progress 11,522 16,901Assets for rent, net 12,568 11,952Total property, plant and equipment 227,860 205,057
Intangible assetsGoodwill 81,374 71,936Other 30,248 27,137Total intangible assets 111,623 99,074
Investments and other assetsInvestment securities 18,068 22,029Long-term loans receivable 461 164Long-term prepaid expenses 3,438 3,353Deferred tax assets 39,608 35,304Other 12,596 12,375Allowance for doubtful accounts (519) (815)Total investments and other assets 73,654 72,411
Total noncurrent assets 413,138 376,544Total assets 918,058 865,797
18
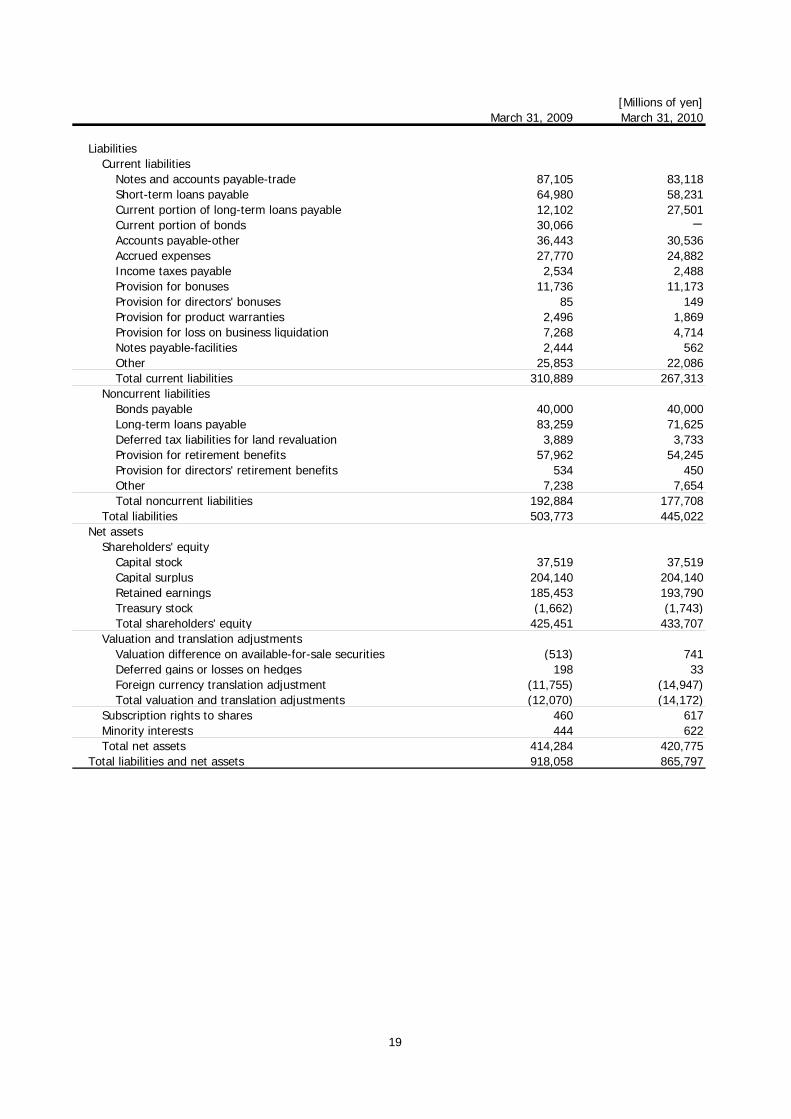
[Millions of yen]March 31, 2009 March 31, 2010
LiabilitiesCurrent liabilities
Notes and accounts payable-trade 87,105 83,118Short-term loans payable 64,980 58,231Current portion of long-term loans payable 12,102 27,501Current portion of bonds 30,066 -
Accounts payable-other 36,443 30,536Accrued expenses 27,770 24,882Income taxes payable 2,534 2,488Provision for bonuses 11,736 11,173Provision for directors' bonuses 85 149Provision for product warranties 2,496 1,869Provision for loss on business liquidation 7,268 4,714Notes payable-facilities 2,444 562Other 25,853 22,086Total current liabilities 310,889 267,313
Noncurrent liabilitiesBonds payable 40,000 40,000Long-term loans payable 83,259 71,625Deferred tax liabilities for land revaluation 3,889 3,733Provision for retirement benefits 57,962 54,245Provision for directors' retirement benefits 534 450Other 7,238 7,654Total noncurrent liabilities 192,884 177,708
Total liabilities 503,773 445,022Net assets
Shareholders' equityCapital stock 37,519 37,519Capital surplus 204,140 204,140Retained earnings 185,453 193,790Treasury stock (1,662) (1,743)Total shareholders' equity 425,451 433,707
Valuation and translation adjustmentsValuation difference on available-for-sale securities (513) 741Deferred gains or losses on hedges 198 33Foreign currency translation adjustment (11,755) (14,947)Total valuation and translation adjustments (12,070) (14,172)
Subscription rights to shares 460 617Minority interests 444 622Total net assets 414,284 420,775
Total liabilities and net assets 918,058 865,797
19

(2) Consolidated Statements of IncomeFiscal years ended March 31, 2009 and 2010
[Millions of yen]
2009 2010
Consolidated statements of incomeNet sales 947,843 804,465Cost of sales 520,206 439,978Gross profit 427,637 364,486Selling, general and administrative expenses 371,376 320,498Operating income 56,260 43,988Non-operating income
Interest income 1,655 1,749Dividends income 520 358Equity in earnings of affiliates - 81Other 5,748 5,654Total non-operating income 7,925 7,843
Non-operating expensesInterest expenses 4,866 3,808Equity in losses of affiliates 99 -
Foreign exchange losses 7,272 1,124Other 6,544 6,079Total non-operating expenses 18,782 11,013
Ordinary income 45,403 40,818Extraordinary income
Gain on sales of noncurrent assets 249 853Gain on sales of investment securities 6 699Gain on sales of subsidiaries and affiliates' stocks 2,803 -
Licence related income 560 257Gain on transfer of business 3,063 -
Reversal of provision for loss on business liquidation 932 1,025Other extraordinary income of foreign subsidiaries - 757Other 458 -
Total extraordinary income 8,073 3,593Extraordinary loss
Loss on sales and retirement of noncurrent assets 3,115 2,833Loss on sales of investment securities 0 351Loss on valuation of investment securities 3,826 499Impairment loss 1,168 2,561Business structure improvement expenses 10,094 2,084Loss on revision of retirement benefit plan 2,046 -
Total extraordinary losses 20,252 8,329Income before income taxes and minority interests 33,224 36,082Income taxes-current 13,183 9,306Income taxes-deferred 4,857 9,806Total income taxes 18,040 19,113Minority interests in income 5 37Net income 15,179 16,931
March 31
20

(3) Consolidated Statements of Changes in Net AssetsFiscal years ended March 31, 2009 and 2010
[Millions of yen]
2009 2010
Consolidated statements of changes in net assetsShareholders' equity
Capital stockBalance at the end of previous period 37,519 37,519Changes of items during the period
Total changes of items during the period - -
Balance at the end of current period 37,519 37,519Capital surplus
Balance at the end of previous period 204,140 204,140Changes of items during the period
Total changes of items during the period - -
Balance at the end of current period 204,140 204,140Retained earnings
Balance at the end of previous period 176,684 185,453Effect of changes in accounting policies applied to foreign 5,210 -
Changes of items during the periodDividends from surplus (9,283) (9,280)Net income 15,179 16,931Change of scope of consolidation 96 -
Disposal of treasury stock (117) (11)Amortization of net retirement benefit obligation in foreign (2,316) 697Total changes of items during the period 3,558 8,337
Balance at the end of current period 185,453 193,790Treasury stock
Balance at the end of previous period (1,340) (1,662)Changes of items during the period
Purchase of treasury stock (665) (106)Disposal of treasury stock 343 25Total changes of items during the period (321) (81)
Balance at the end of current period (1,662) (1,743)Total shareholders' equity
Balance at the end of previous period 417,003 425,451Effect of changes in accounting policies applied to foreign 5,210 -
Changes of items during the periodDividends from surplus (9,283) (9,280)Net income 15,179 16,931Change of scope of consolidation 96 -
Purchase of treasury stock (665) (106)Disposal of treasury stock 226 14Amortization of net retirement benefit obligation in foreign (2,316) 697Total changes of items during the period 3,236 8,256
Balance at the end of current period 425,451 433,707
March 31
21
[Millions of yen]
2009 2010
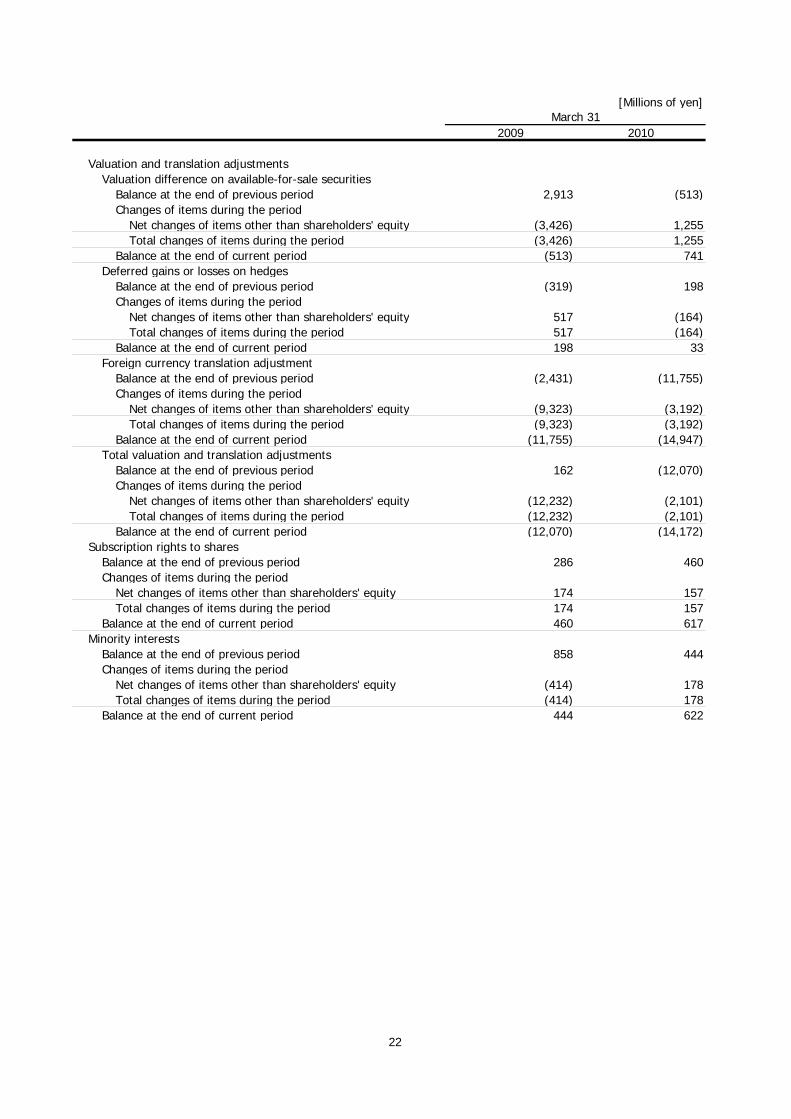
Valuation and translation adjustmentsValuation difference on available-for-sale securities
Balance at the end of previous period 2,913 (513)Changes of items during the period
Net changes of items other than shareholders' equity (3,426) 1,255Total changes of items during the period (3,426) 1,255
Balance at the end of current period (513) 741Deferred gains or losses on hedges
Balance at the end of previous period (319) 198Changes of items during the period
Net changes of items other than shareholders' equity 517 (164)Total changes of items during the period 517 (164)
Balance at the end of current period 198 33Foreign currency translation adjustment
Balance at the end of previous period (2,431) (11,755)Changes of items during the period
Net changes of items other than shareholders' equity (9,323) (3,192)Total changes of items during the period (9,323) (3,192)
Balance at the end of current period (11,755) (14,947)Total valuation and translation adjustments
Balance at the end of previous period 162 (12,070)Changes of items during the period
Net changes of items other than shareholders' equity (12,232) (2,101)Total changes of items during the period (12,232) (2,101)
Balance at the end of current period (12,070) (14,172)Subscription rights to shares
Balance at the end of previous period 286 460Changes of items during the period
Net changes of items other than shareholders' equity 174 157Total changes of items during the period 174 157
Balance at the end of current period 460 617Minority interests
Balance at the end of previous period 858 444Changes of items during the period
Net changes of items other than shareholders' equity (414) 178Total changes of items during the period (414) 178
Balance at the end of current period 444 622
March 31
22

[Millions of yen]
2009 2010
Total net assetsBalance at the end of previous period 418,310 414,284Effect of changes in accounting policies applied to foreign 5,210 -
Changes of items during the periodDividends from surplus (9,283) (9,280)Net income 15,179 16,931Change of scope of consolidation 96 -
Purchase of treasury stock (665) (106)Disposal of treasury stock 226 14Amortization of net retirement benefit obligation in foreign (2,316) 697Net changes of items other than shareholders' equity (12,473) (1,766)Total changes of items during the period (9,236) 6,490
Balance at the end of current period 414,284 420,775
March 31
23

(4) Consolidated Statements of Cash FlowFiscal years ended March 31, 2009 and 2010
[Millions of yen]
2009 2010
Net cash provided by (used in) operating activitiesIncome before income taxes and minority interests 33,224 36,082Depreciation and amortization 70,179 61,174Impairment loss 1,168 2,561Amortization of goodwill 8,909 9,233Interest and dividends income (2,176) (2,107)Interest expenses 4,866 3,808Loss (gain) on sales and retirement of noncurrent assets 2,866 1,980Loss (gain) on sales and valuation of investment securities 3,820 150Loss (gain) on sales and valuation of subsidiaries/affiliates' stocks (2,803) -
Loss (gain) on transfer of business (3,063) -
Increase (decrease) in provision for bonuses (3,290) (544)Increase (decrease) in provision for retirement benefits 5,708 (2,926)Increase (decrease) in provision for loss on business liquidation (4,459) (2,553)Decrease (increase) in notes and accounts receivable-trade 50,596 (10,718)Decrease (increase) in inventories (3,550) 28,688Increase (decrease) in notes and accounts payable-trade (10,372) (451)Transfer of assets for rent (7,419) (7,707)Decrease (increase) in accounts receivable-other 4,545 1,900Increase (decrease) in accounts payable-other and accrued expenses (12,821) (6,554)Decrease/increase in consumption taxes receivable/payable 952 3,646Other, net 8,058 889Subtotal 144,939 116,551Interest and dividends income received 2,000 2,271Interest expenses paid (4,594) (3,874)Payments for extra retirement payments (105) -
Income taxes (paid) refund (34,676) (1,572)Net cash provided by (used in) operating activities 107,563 113,377
March 31
24
[Millions of yen]
2009 2010
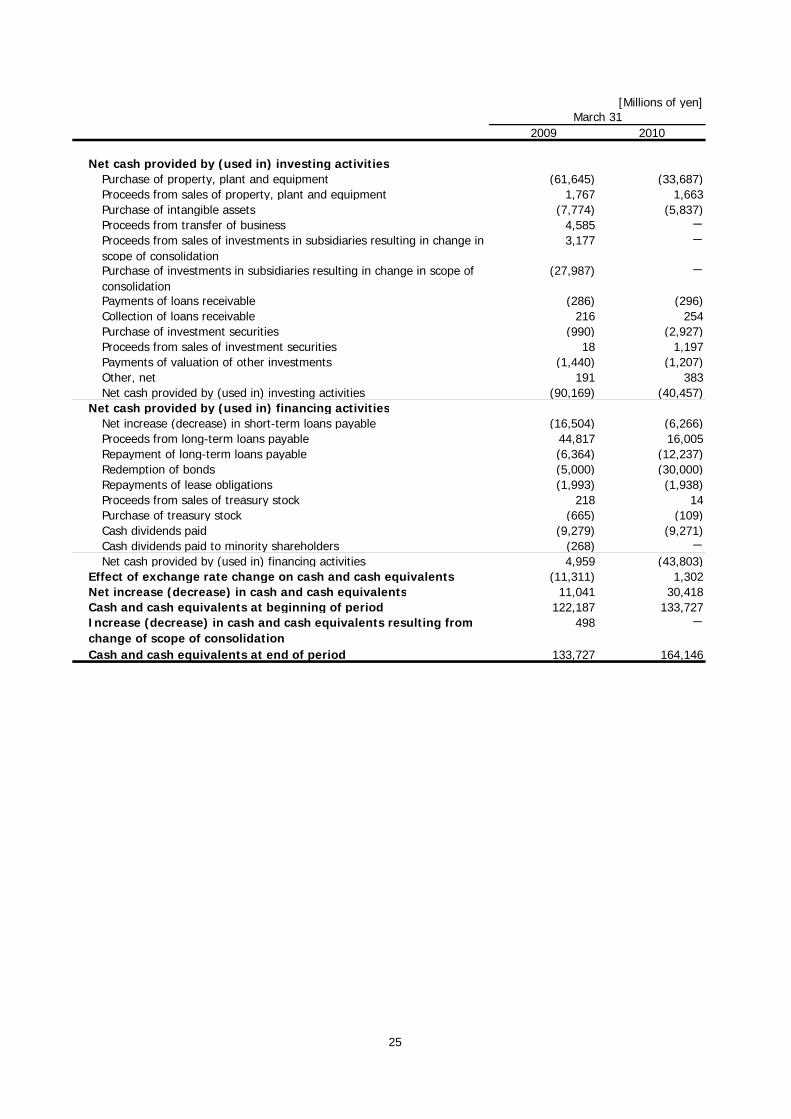
Net cash provided by (used in) investing activitiesPurchase of property, plant and equipment (61,645) (33,687)Proceeds from sales of property, plant and equipment 1,767 1,663Purchase of intangible assets (7,774) (5,837)Proceeds from transfer of business 4,585 -
Proceeds from sales of investments in subsidiaries resulting in change inscope of consolidation
3,177 -
Purchase of investments in subsidiaries resulting in change in scope ofconsolidation
(27,987) -
Payments of loans receivable (286) (296)Collection of loans receivable 216 254Purchase of investment securities (990) (2,927)Proceeds from sales of investment securities 18 1,197Payments of valuation of other investments (1,440) (1,207)Other, net 191 383Net cash provided by (used in) investing activities (90,169) (40,457)
Net cash provided by (used in) financing activitiesNet increase (decrease) in short-term loans payable (16,504) (6,266)Proceeds from long-term loans payable 44,817 16,005Repayment of long-term loans payable (6,364) (12,237)Redemption of bonds (5,000) (30,000)Repayments of lease obligations (1,993) (1,938)Proceeds from sales of treasury stock 218 14Purchase of treasury stock (665) (109)Cash dividends paid (9,279) (9,271)Cash dividends paid to minority shareholders (268) -
Net cash provided by (used in) financing activities 4,959 (43,803)Effect of exchange rate change on cash and cash equivalents (11,311) 1,302Net increase (decrease) in cash and cash equivalents 11,041 30,418Cash and cash equivalents at beginning of period 122,187 133,727Increase (decrease) in cash and cash equivalents resulting fromchange of scope of consolidation
498 -
Cash and cash equivalents at end of period 133,727 164,146
March 31
25

26
5. Note on the premise of going concern No relevant items occurred during fiscal year ended March 31, 2010 6. Basis of presenting consolidated financial statements [1] Scope of consolidation
(1) Number of consolidated subsidiaries: 96
Principal consolidated subsidiaries:
Konica Minolta Business Technologies, Inc. Konica Minolta Opto, Inc. Konica Minolta Medical & Graphic, Inc. Konica Minolta Sensing, Inc. Konica Minolta Photo Imaging, Inc. Konica Minolta Techonology Center, Inc. Konica Minolta Business Expert, Inc. Konica Minolta IJ Technologies, Inc.
Konica Minolta Business Solutions Japan Co., Ltd. Konica Minolta Health Care Co., Ltd. Konica Minolta Supplies Manufacturing Co., Ltd. Konica Minolta Business Solutions Europe GmbH Konica Minolta Business Solutions U.S.A., Inc. Konica Minolta Business Technologies Manufacturing (HK) Ltd.
The following companies have been excluded from consolidated subsidiaries: Konica Singapore Pte. Ltd., Konica Minolta Photo Imaging Asia H.Q. Pte. Ltd. and Konica Minolta Photo Imaging U.S.A., Inc. due to the completion of liquidation; Veenman Deutschland GmbH due to a merger into Konica Minolta Business Solutions Deutschland GmbH, a consolidated subsidiary; Konica Minolta Danka Imaging Company due to a merger into Konica Minolta Business Solutions U.S.A., Inc. , a consolidated subsidiary; and Konica Minolta Business Solutions Nederland B.V. and its subsidiaries Develop Nederland B.V., Holding Kantoor Communicatiesystemen B.V. and Flexi Technologies B.V. due to a merger into Konica Minolta Printing Solutions Benelux B.V., a consolidated subsidiary (Konica Minolta Printing Solutions Benelux B.V. has been renamed Konica Minolta Business Solutions Nederland B.V.).
(2) Principal unconsolidated subsidiaries: ECS Buero-und Datensysteme GmbH Unconsolidated subsidiaries have not been included in consolidation because they are relatively small and their assets, sales, net income, and retained earnings (in proportion to scale of equity ownership) do not have no material influence on consolidated financial statement.
[2] Scope of the use of equity accounting
(1) Equity accounting is employed for investments in 5 unconsolidated subsidiaries and 3 important
affiliates. Major subsidiaries and affiliates accounted for by the equity method:
Unconsolidated subsidiary: ECS Buero-und Datensysteme GmbH Affiliate: Toho Chemical Laboratory Co., Ltd.
Konica Minolta Photo Imaging (SHANGHAI) Co., Ltd., a non-consolidated subsidiary accounted for by the equity method, has been excluded from the scope of application of the equity method with the completion of liquidation.
(2) Unconsolidated subsidiaries that are not accounted for by the equity method (including Konica Minolta Software Laboratory Co., Ltd.) and affiliates that are not accounted for by the equity method (including Konica Minolta Business Support Aichi Co., Ltd.) are excluded from the scope of application of the equity method, because they have little impact on net income (loss) or retained earnings, and their significance as a whole is minor.

27
[3] Changes regarding consolidated subsidiaries during the fiscal year under review
Some consolidated subsidiaries have fiscal years ending on December 31, and consolidated financial statements are prepared using the financial statements of those companies as of that fiscal year-end date. Adjustments are made to consolidated accounts to account for important transactions involving those companies that occur between the end of those companies’ fiscal year-end date and the end of the consolidated fiscal year. (Consolidated Subsidiaries with Fiscal Years Ending on December 31) Konica Minolta Business Solutions (Shenzhen) Co., Ltd. Konica Minolta Medical & Graphic (SHANHAI) Co., Ltd. Konica Minolta Business Solutions do Brazil Ltda. Konica Minolta Business Solutions de Mexico SA de CV. Konica Minolta Medical Systems Russia Konica Minolta Business Solutions Romania s.r.l. Konica Minolta Business Solutions Russia LLC
[4] Accounting standards and methods (1) Asset valuation
1. Securities
Bonds held to maturity: Bonds held to maturity are recorded by the amortized cost method (straight-line method).
Other securities: Securities with fair market value are stated using the mark-to-market method based on the market price at the balance sheet date. (Total net unrealized gains or losses after tax effect adjustments are directly recorded in shareholders' equity, and the cost of securities sold is computed based on the moving-average method.) Other securities that do not have fair market values are primarily stated at cost using the moving value average.
2. Derivatives Derivatives are stated using the mark-to-market method.
3. Inventories Domestic consolidated subsidiaries’ inventories are, in the main, recorded at cost as determined by the periodic-average method (method of reducing book value when the contribution of inventories to profitability declines). Overseas consolidated subsidiaries’ inventories are, in the main, recorded at the lower of cost or market value, with cost determined by the first-in, first-out method.
(2) Amortization method for important depreciable assets 1. Tangible fixed assets (excluding lease assets)
The depreciable assets of the Company and its domestic consolidated subsidiaries are depreciated using the declining-balance method. Overseas consolidated subsidiaries adopt the straight-line method. However, the Company and its domestic consolidated subsidiaries have used the straight-line method for their buildings (excluding annexed structures) acquired since April 1, 1998.
2. Intangible fixed assets
We have adopted the straight-line method based on an estimated in-house working life of five years for the software we use.

28
3. Lease Assets
Lease assets arising from finance lease transactions that do not transfer of ownership Depreciation is computed using the straight-line method based on the assumption that the useful life equals the lease term and the residual value equals zero. Finance lease transactions not involving transfer of ownership commencing on or before March 31, 2008 are accounted for based on methods applicable to ordinary rental transactions.
(3) Standards for key allowances
1. Allowance for doubtful accounts To prepare for possible losses on uncollectable receivables, for general receivables, an amount is provided according to the historical percentage of uncollectables. For specific receivables for which there is some concern regarding collectability, an estimated amount is recorded by investigating the possibility of collection for each individual account.
2. Allowance for bonuses
To prepare for the payment of employee bonuses, an amount corresponding to the current portion of estimated bonus payments to employees is recorded.
3. Allowance for director’s bonus
To prepare for the payment of directors’ bonuses, an amount corresponding to the projected value of bonus payments to directors for the fiscal year under review is recorded.
4. Allowance for product warranty
The provisioning of free after-sales service for products is recorded based on past after-sales service expenses as a percentage of net sales.
5. Allowance for loss on withdrawal from operation
To provide for losses when the Company exits a business, provisions to this reserve are made in the amount of the estimated losses.
6. Reserve for retirement benefits and pension plans
In order to provide employee retirement benefits, the Company records an amount based on projected benefit obligations and pension assets at the end of the consolidated fiscal year under review. Prior service cost is being amortized as incurred by the straight-line method over certain periods (principally 10 years) which are shorter than the average remaining years of service of the employees at the time when the service cost is generated. Actuarial gains and losses are being amortized in the fiscal year following the fiscal year in which the gains or losses are recognized, by the straight line method over periods (principally 10 years) which are shorter than the average remaining years of service of the employees at the time when they are generated. (Change in accounting policy) Starting the fiscal year under review, Konica Minolta is applying Partial Amendments to Accounting Standard for Retirement Benefits (Part 3) (Accounting Standards Board of Japan Statement No. 19 issued on July 31, 2008). The application does not have any influence on the earnings and retirement benefit obligations for the fiscal year under review.
7. Reserve for directors’ retirement benefits Consolidated subsidiaries, to provide for the payment of directors’ retirement benefits, record reserve for benefits for retired directors and auditors in an actual amount equal to the need at the end of the year period under review based on the Company’s regulations.

29
(4) Principal accounting methods for hedge transactions
1. Hedge accounting methods
The deferred hedge method is used. Special accounting methods are used for interest rate swaps.
2. Hedge methods and hedge targets The hedge methods are forward exchange contracts, and interest rate swaps that meet certain conditions. The hedge targets are scheduled foreign currency denominated transactions, corporate bonds, and borrowings.
3. Hedge policy The Company and consolidated subsidiaries enter into forward foreign exchange contracts as hedging instruments only, not for trading purpose to make profits, within the limit of actual foreign transactions to reduce risk arising from future fluctuations of foreign exchange rates. In addition, the Company and consolidated subsidiaries enter into interest rate swaps to make interest rates on bonds and borrowings stable or reduce costs fluctuations for future capital procurement, both as hedging instruments only, not for speculation purpose, within the limit of actual financial or operating transactions.
4. Methods for evaluating the effectiveness of hedges Verification is made to ascertain a high correlation between value fluctuations of cash flows and hedging instruments.
(5) Other important items regarding the preparation of consolidated financial statements 1. Consumption tax
The tax-exclusion method is used to account for consumption taxes. In addition, asset-related consumption tax that cannot be excluded is accounted for as deferred consumption taxes, etc., in the long-term prepaid expenses item and amortized over a five-year period by the straight-line method.
2. Consolidated tax payment system
The consolidated tax payment system is applied.
[5] Valuation of consolidated subsidiary’s assets and liabilities The market value method is used to value the assets and liabilities of consolidated subsidiaries.
[6] Amortization of consolidation goodwill and negative goodwill
Amortization of goodwill is carried out separately for each goodwill item over a rational time period of 20 years or less.
[7] Range of cash within consolidated cash flow statements Cash (cash and cash equivalents) in the consolidated cash flow statements comprises cash on hand and short-term investments that are due for redemption in three months or less and that are easily converted into cash with little risk to a change in value.

30
7. Important notes in the basis of presenting consolidated financial statements
[Consolidated balance sheets items] 1. Assets used for collateral for long-term loans of ¥46 million are notes receivable of ¥696 million. 2. Accumulated depreciation directly deducted from tangible fixed assets: ¥434,396 million 3. Investments in securities of non-consolidated subsidiaries and affiliated companies are as follows.
Investment securities (stocks) 2,816 million yen 4. Breakdown of inventories
Merchandise and finished goods ¥67,349 million Work in process ¥15,541 million Raw materials and stores ¥15,373 million
5. Guaranteed obligations
The Company guarantees bank loans and lease obligations etc. of unconsolidated companies, etc. amounting to ¥1,926 million. In addition, the Company has made commitments of guarantee for bank loans of suppliers/customers totaling ¥85million.
[Consolidated statements of income items] 1. Main expense items and amounts of selling, general and administrative expenses are as follows. [Millions]
Selling ¥10,945 Transport and storage ¥18,595 Advertising ¥11,444 Salaries and wages ¥71,129 Provision for reserve for bonuses ¥4,108 Research and development ¥68,475 Depreciation ¥15,700 Retirement benefits ¥5,173 Provision for allowance for doubtful accounts ¥1,524
2. The cost of sales includes the cut-down of book values by ¥2,081 million, reflecting reduced profitability
of inventory held for normal sales purposes. 3. Regarding patent-related revenue, patent royalties related to Photo Imaging Business are recorded in a
lump sum. 4. Reversal of allowance for loss on withdrawal from operations represents the net value of the portion of
losses accompanying the decision to withdraw from Photo Imaging Business that were covered by the drawing down of the allowance for the loss on withdrawal from operations during the previous fiscal year and the value of such losses in the fiscal year under review. The value of these figures is as follows:
Drawing down of the allowance for loss on withdrawal from operations in the previous fiscal year: ¥1,327 million Loss on withdrawal from operations in the fiscal year under review: ¥301 million
5. Other extraordinary profit represents the reduction in refund obligation, etc. in accordance with US State laws at a U.S. sales subsidiary.

31
6. Impairment losses mainly represent the reduction of book values to recoverable values with respect to
the land and manufacturing facilities in the Medical & Graphic Imaging Businesses, and the land and manufacturing facilities in the Optics Business,
7. Restructuring expenses consist mainly in retirement allowances, etc. associated with staff
allocation/optimization in the Business Technologies Business, expenses on business reorganization in the Medical and Graphic Imaging Business, and expenses on the reorganization of manufacturing facilities in the Optics Business.
[Consolidated statements of changes in shareholder’s equity items] The figures for provision of retirement allowance debt of overseas subsidiaries stems from provisions for the accounting treatment of retirement benefit payments that affect a portion of consolidated subsidiaries in the United States.

32
Segment information (1) Business segment
Fiscal year ended March 31, 2009 (from April 1, 2008 to March 31, 2009) [Millions of yen]
Business Technologies Optics
Medical and
GraphicSensing Other Total
Elimination & corporate
Consoli- dation
Sales External 623,682 173,416 125,890 8,393 16,459 947,843 -- 947,843Intersegment 4,128 1,052 2,419 595 58,860 67,055 (67,055) --
Total 627,810 174,469 128,309 8,989 75,319 1,104,899 (67,055) 947,843
Operating expenses 575,259 161,930 125,226 8,641 72,043 943,100 (51,517) 891,583Operating income 52,551 12,538 3,083 348 3,276 71,798 (15,538) 56,260
Assets, depreciation, and capital expenditure
Assets 440,552 156,283 89,736 8,125 56,493 751,190 166,867 918,058
Depreciation 30,074 28,141 4,335 326 2,341 65,219 4,959 70,179
Impairment losses 150 785 232 - - 1,168 - 1,168
Capital expenditure 23,918 27,591 3,151 306 2,257 57,224 3,939 61,164
Notes: 1. Business classification is based on similarity of product type and market. The Group’s operations are classified into the
five segments of Business Technologies, Optics, Medical and Graphic Imaging, Sensing, and other businesses. 2. Principal products in each business segment
3. Operating expenses not allocated but included in Elimination/corporate under review amounted to ¥31,297 million are
principally R&D expenses incurred by the Company and expenses associated with head office functions.
4. Included within the Elimination & Corporate figure for assets are ¥202,373 million in corporate assets, which primarily include the holding company’s surplus operating funds (cash and marketable securities) and long-term investment funds (investment securities) as well as other assets held by the holding company.
5. Accounting changes
(1) Application of “ Accounting Standards for Measurement of Inventories” Beginning with the fiscal year under review, “ Accounting Standards for Measurement of Inventories” (No.9, issued by The Accounting Standards Board of Japan (ASBJ) on July 5, 2006) has been applied to domestic consolidated subsidiaries, and the main method of measurement of inventories was changed from the cost method determined by the periodic-average method to the cost method (method of reducing book value when the contribution of inventories to profitability declines), where cost is determined by the periodic-average method. As a result, compared with the previous method, the introduction of the new method had the effect of increasing operating expenses for each business segment as follows: for the Business Technologies business, ¥1,191 million; Optics business, ¥1,680 million; Medical and Graphic business, ¥668 million; Sensing business, ¥39 million, and other businesses, ¥64 million. Operating incomes for these businesses reduced by the respective amounts.
(2) Recording of Loss on Disposal of Inventories With the application of the “Accounting Standards for Measurement of Inventories” (No.9, issued by The Accounting Standards Board of Japan (ASBJ) on July 5, 2006) to domestic consolidated subsidiaries beginning with the fiscal year under review, the Group reviewed its accounting principles, and, effective the fiscal year
Business Segment Principal Products
Business Technologies MFPs, printers, etc.
Optics Optical devices, electronics materials, etc.
Medical and Graphic Imaging Medical products, graphic imaging products, etc.
Sensing Industrial-use and medical-use measuring instruments, etc
Other businesses Products other than the above

33
under review, loss on disposal of inventories is recorded under cost of sales. Consequently, certain overseas consolidated subsidiaries which recorded these expenses under non-operating expenses changed to the method of recording these expenses under cost of sales. As a result, compared with the previous method, the introduction of the new method had the effect of increasing the operating expenses for each business segment as follows: for the Business Technologies business, ¥2,092 million; Optics business, ¥294 million; Medical and Graphic business, ¥185 million; Sensing business, ¥17 million, and other businesses, ¥16 million. Operating incomes for these businesses reduced by the respective amounts.
6. Change in Method for Calculation of Depreciation of Tangible Fixed Assets
The Company and its domestic consolidated subsidiaries, in response to fiscal year March 2009 corporate income tax law revisions, with respect to mechanical device, have shifted to the use of the post-revision method of amortizing assets over the applicable useful lifetimes of those assets beginning with the fiscal year under review. As a result, compared with the method used in the previous fiscal year, the introduction of the new method had the effect of increasing the operating expenses of the consolidated fiscal year under review for each business segment as follows: for the Business Technologies business, ¥379 million; Optics business ¥6,145 million; Medical and Graphic business, ¥54 million; Sensing business, ¥1 million, and other businesses, ¥5 million. Operating incomes for these businesses reduced by the respective amounts.
Fiscal year ended March 31, 2010 (from April 1, 2009 to March 31, 2010) [Millions of yen]
Business Technologies Optics
Medical and
GraphicSensing Other Total
Elimination & corporate
Consoli- dation
Sales External 540,809 136,745 104,350 6,921 15,639 804,465 - 804,465Intersegment 3,681 924 1,569 970 46,493 53,640 (53,640) -
Total 544,490 137,670 105,920 7,892 62,132 858,105 (53,640) 804,465
Operating expenses 505,526 123,279 104,450 7,899 58,350 799,507 (39,030) 760,477Operating income (loss) 38,963 14,390 1,469 (6) 3,781 58,598 (14,610) 43,988
Assets, depreciation, and capital expenditure
Assets 402,012 139,051 46,668 7,474 55,679 680,886 184,910 865,797
Depreciation 30,973 18,799 4,214 281 2,185 56,453 4,720 61,174
Impairment losses 168 1,050 1,338 - 3 2,561 - 2,561
Capital expenditure 18,190 13,599 1,782 165 1,485 35,223 1,710 36,933
Notes: 1. Business classification is based on similarity of product type and market. The Group’s operations are classified into the
five segments of Business Technologies, Optics, Medical and Graphic Imaging, Sensing, and other businesses. 2. Principal products in each business segment
3. Operating expenses not allocated but included in Elimination/corporate under review amounted to ¥29,396 million are
principally R&D expenses incurred by the Company and expenses associated with head office functions.
4. Included within the Elimination & Corporate figure for assets are ¥232,694 million in corporate assets, which primarily include the holding company’s surplus operating funds (cash and marketable securities) and long-term investment funds (investment securities) as well as other assets held by the holding company.
Business Segment Principal Products
Business Technologies MFPs, printers, etc.
Optics Optical devices, electronics materials, etc.
Medical and Graphic Imaging Medical products, graphic imaging products, etc.
Sensing Industrial-use and medical-use measuring instruments, etc
Other businesses Products other than the above

34
(2) Information by geographical area Fiscal year ended March 31, 2009 (from April 1, 2008 to March 31, 2009)
[Millions of yen]
Japan North America Europe Asia excluding
Japan, others Total Elimination & corporation Consolidation
Sales
External 437,312 210,565 247,130 52,835 947,843 - 947,843
Intersegment 280,586 2,632 1,952 191,656 476,827 (476,827) -
Total 717,898 213,197 249,082 244,492 1,424,670 (476,827) 947,843
Operating expenses 662,001 221,571 247,096 238,702 1,369,371 (477,788) 891,583
Operating income (loss) 55,897 (8,373) 1,985 5,789 55,299 (-961) 56,260
Total assets 618,121 123,255 133,427 86,430 961,235 (43,176) 918,058
Notes: 1. Countries and territories are classified based on geographical proximity. 2. Principal countries in the above areas, excluding Japan, are as follows:
(1) North America: United States, and Canada (2) Europe: Germany, France, and United Kingdom (3) Asia excluding Japan, Others: Australia, China, and Singapore
3. Operating expenses not able to be properly allocated that are included in Elimination & corporate are principally R&D
expenses incurred by the Company and expenses associated with head office functions. This amount was ¥ 31,297 million. 4. Included within the Elimination & corporate figure for assets are ¥202,373 million in corporate assets, which primarily include
the holding company’s surplus operating funds (cash and marketable securities) and long-term investment funds (investment securities) as well as other assets held by the holding company, etc.
5. Accounting Changes
(1) Application of “ Accounting Standards for Measurement of Inventories” Beginning with the fiscal year under review, “ Accounting Standards for Measurement of Inventories” (No.9, issued by The Accounting Standards Board of Japan (ASBJ) on July 5, 2006) has been applied to domestic consolidated subsidiaries, and the main standard and method of measurement of inventories was changed from the cost method determined by the periodic-average method to the cost method (method of reducing book value when the contribution of inventories to profitability declines), where cost is determined by the periodic-average method. As a result, compared with the previous method, the introduction of the new method had the effect of increasing operating expenses for Japan by ¥3,644 million. Operating income for Japan reduced by the same amount.
(2) Recording of Loss on Disposal of Inventories With the application of the “Accounting Standards for Measurement of Inventories” (No.9, issued by The Accounting Standards Board of Japan (ASBJ) on July 5, 2006) to domestic consolidated subsidiaries beginning with the fiscal year under review, the Group reviewed its accounting principles, and, loss on disposal of inventories is recorded under cost of sales. Consequently, certain overseas consolidated subsidiaries which recorded these expenses under non-operating expenses changed to the method of recording these expenses under cost of sales. As a result, compared with the previous method, the introduction of the new method had the effect of increasing operating expenses for each geographical segment as follows: for North America, ¥995 million; for Europe, ¥1,140 million, and for Asia, Others, ¥470 million. Operating incomes for these geographical segments reduced by the same amounts.
6. Change in Method for Calculation of Depreciation of Tangible Fixed Assets The Company and its domestic consolidated subsidiaries, in response to fiscal year March 2009 corporate income tax
legislative revisions, with respect to mechanical device, have shifted to the use of the post-revision method of amortizing assets over the applicable useful lifetimes of those assets beginning with the fiscal year under review. As a result, compared with the method used in the previous fiscal year, the introduction of the new method had the effect of increasing the operating expenses for Japan by ¥6,587 million. Operating income for Japan reduced by the same amount.
35
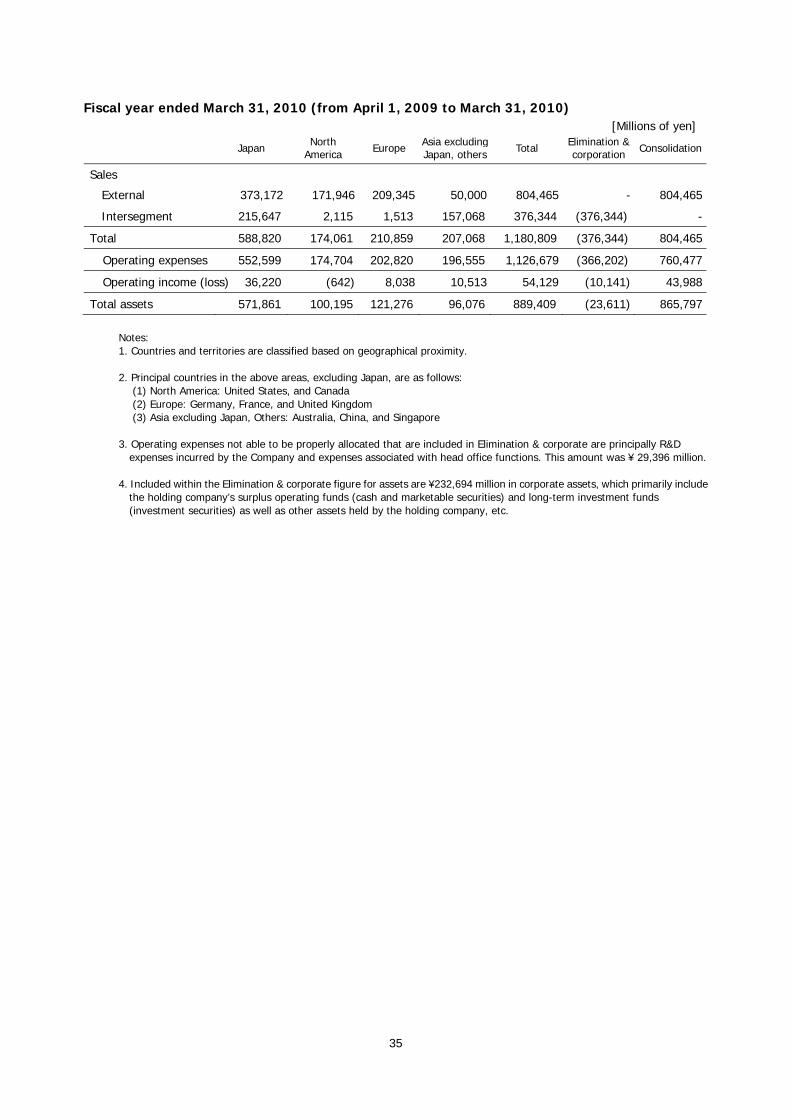
Fiscal year ended March 31, 2010 (from April 1, 2009 to March 31, 2010) [Millions of yen]
Japan North America Europe Asia excluding
Japan, others Total Elimination & corporation Consolidation
Sales
External 373,172 171,946 209,345 50,000 804,465 - 804,465
Intersegment 215,647 2,115 1,513 157,068 376,344 (376,344) -
Total 588,820 174,061 210,859 207,068 1,180,809 (376,344) 804,465
Operating expenses 552,599 174,704 202,820 196,555 1,126,679 (366,202) 760,477
Operating income (loss) 36,220 (642) 8,038 10,513 54,129 (10,141) 43,988
Total assets 571,861 100,195 121,276 96,076 889,409 (23,611) 865,797
Notes: 1. Countries and territories are classified based on geographical proximity. 2. Principal countries in the above areas, excluding Japan, are as follows:
(1) North America: United States, and Canada (2) Europe: Germany, France, and United Kingdom (3) Asia excluding Japan, Others: Australia, China, and Singapore
3. Operating expenses not able to be properly allocated that are included in Elimination & corporate are principally R&D
expenses incurred by the Company and expenses associated with head office functions. This amount was ¥ 29,396 million. 4. Included within the Elimination & corporate figure for assets are ¥232,694 million in corporate assets, which primarily include
the holding company’s surplus operating funds (cash and marketable securities) and long-term investment funds (investment securities) as well as other assets held by the holding company, etc.
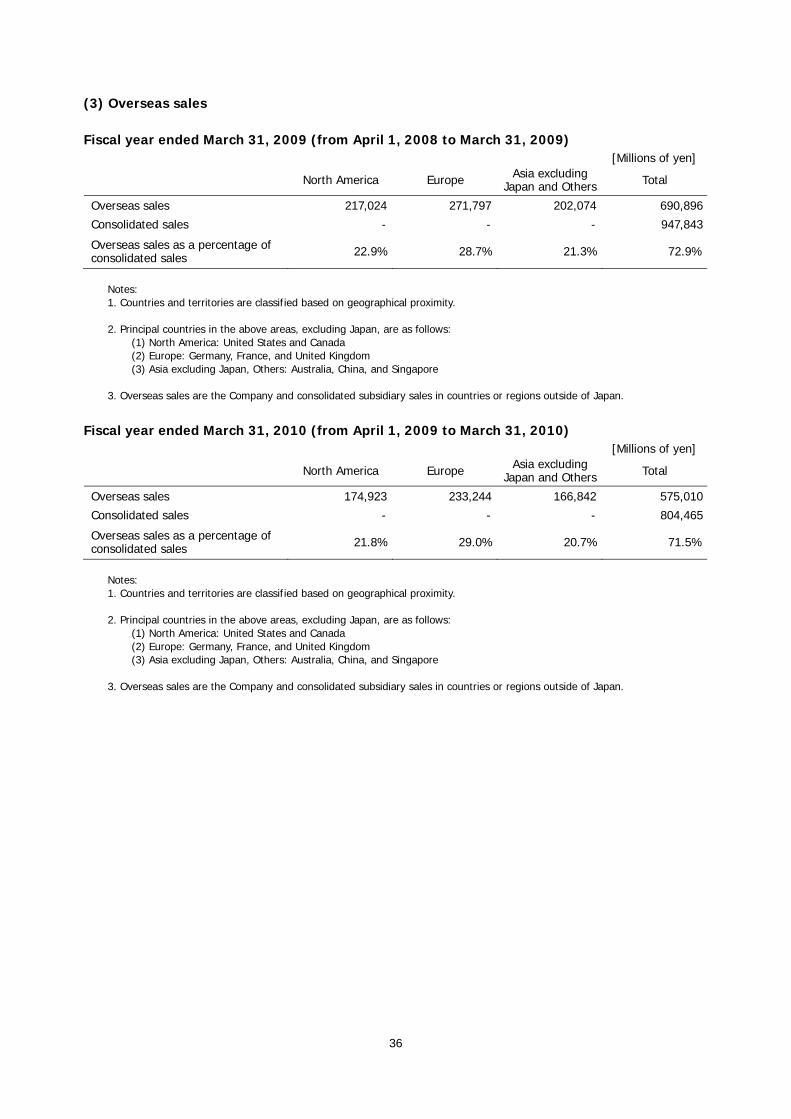
36
(3) Overseas sales Fiscal year ended March 31, 2009 (from April 1, 2008 to March 31, 2009)
[Millions of yen]
North America Europe Asia excluding Japan and Others Total
Overseas sales 217,024 271,797 202,074 690,896
Consolidated sales - - - 947,843
Overseas sales as a percentage of consolidated sales 22.9% 28.7% 21.3% 72.9%
Notes: 1. Countries and territories are classified based on geographical proximity. 2. Principal countries in the above areas, excluding Japan, are as follows:
(1) North America: United States and Canada (2) Europe: Germany, France, and United Kingdom (3) Asia excluding Japan, Others: Australia, China, and Singapore
3. Overseas sales are the Company and consolidated subsidiary sales in countries or regions outside of Japan.
Fiscal year ended March 31, 2010 (from April 1, 2009 to March 31, 2010)
[Millions of yen]
North America Europe Asia excluding Japan and Others Total
Overseas sales 174,923 233,244 166,842 575,010
Consolidated sales - - - 804,465
Overseas sales as a percentage of consolidated sales 21.8% 29.0% 20.7% 71.5%
Notes: 1. Countries and territories are classified based on geographical proximity. 2. Principal countries in the above areas, excluding Japan, are as follows:
(1) North America: United States and Canada (2) Europe: Germany, France, and United Kingdom (3) Asia excluding Japan, Others: Australia, China, and Singapore
3. Overseas sales are the Company and consolidated subsidiary sales in countries or regions outside of Japan.

37
Tax-effect accounting (1) Deferred tax assets and deferred tax liabilities
[Millions of yen] March 31 2009 2010 Deferred tax assets
Net operating tax loss carried forward 31,953 36,116Accrued retirement benefits over deductible limit 29,824 29,147Elimination of unrealized intercompany profit 9,064 4,761Write-down of assets, other 5,122 4,345Accrued bonuses 4,431 4,214Depreciation and amortization 5,661 3,901Provision for loss on discontinued operations 6,025 2,407Allowance for doubtful accounts 1,039 1,470Tax effects related to investments 1,717 1,337Accrued enterprise taxes 242 461Other 10,295 10,733
Deferred tax assets subtotal 105,378 98,898Valuation allowance (33,335) (34,254)Total deferred tax assets 72,043 64,644Deferred tax liabilities
Retained earnings of overseas subsidiaries (2,272) (3,417)Gain on establishment of employee pension trust (2,973) (2,920)Revaluation difference of marketable securities (440) (1,171)Reserve for advanced depreciation, other (558) (61)Other (1,703) (4,127)
Total deferred tax liabilities (7,948) (11,699)Net deferred tax assets 64,094 52,945Deferred tax liabilities related to revaluation
Deferred tax liabilities related to revaluation of land (3,889) (3,733)Net deferred tax assets are included in the following items in the consolidated balance sheets.
Current assets – deferred tax assets 25,326 19,085Fixed assets – deferred tax assets 39,608 35,304Current liabilities – other (734) (720)Long-term liabilities – other (105) (724)
(2) Breakdown of major items that have caused a significant difference between the
statutory effective tax rate and the burden ratio of corporate taxes, etc. [ % ]
March 31 2009 2010
Statutory income tax rate 40.7 40.7(Adjustments) Valuation allowance 6.4 1.8Tax credits (R&D expenses, other) (5.0) (0.7)Non-taxable income (0.5) (1.0)Difference in statutory tax rates of foreign subsidiaries (0.6) (8.5)Expenses not deductible for tax purpose 4.5 2.7Amortization of goodwill 10.9 10.1Impact of change in the recording standard of tax effects of retained earnings in accordance with revision of Corporate Tax Laws
(10.4) -
Retained earnings at overseas subsidiaries - 3.2Ineffective portion of unrealized (gain) loss 5.5 5.9Other 2.7 (1.2)
Effective income tax rate per consolidated statements of income 54.3 53.0

38
Financial instruments Fiscal year ended March 31, 2010 (from April 1, 2009 to March 31, 2010) 1. Matters relating to the status of financial instruments
The Konica Group raises short-term working capital mainly with bank borrowings and invests temporary surplus funds in financial instruments with extremely low risk. The Group has decided to engage in derivatives transactions within the scope of actual demand in accordance with its internal regulations.
In principle, the risk of currency fluctuations relating to receivables and payables denominated in foreign currencies are hedged using the forward exchange contract. With respect to the interest volatility risk relating to some long-term loans payable, we try to fix interest expenses using the interest-rate swap. Investment securities consist mainly of stocks, and the market values of listed stocks are determined on a quarterly basis. We try to reduce the credit risk of customers relating to notes and accounts receivable-trade through regular monitoring and the comprehensive management of deadlines and balances.
2. Matters relating to fair values, etc. of financial instruments
The consolidated balance sheet amount, the fair value and the difference between the two on March 31, 2010 (the closing date of the consolidated fiscal year under review) are as follows.
[Millions of yen] Consolidated balance sheet amount Fair value Difference
(1) Cash and deposits 85,533 85,533 -(2) Notes and accounts receivable-trade 177,720 177,720 -(3) Securities and investment securities
(i) Held-to-maturity securities 10 10 -(ii) Other securities 95,848 95848 -
(4) Notes and accounts payable-trade (83,118) (83,118) -(5) Short-term loans payable (58,231) (58,231) -(6) Long-term loans payable (71,625) (71,715) (90)(7) Derivatives (1,375) (1,375) -
1) Items that are posted in liabilities are enclosed in parentheses. 2) Net receivables and payables generated from derivatives trading are shown. Items generating net receivables are enclosed in
parentheses.
(Note 1) Methods of calculating the fair value of financial instruments and matters relating to derivatives transactions (1) Cash and deposits and (2) Notes and accounts receivable-trade
As they are settled in a short period and their market values are nearly identical to their book values, the book values are used.
(3) Securities and investment securities
For the fair values of securities and investment securities, the prices on the relevant exchanges are used. (i) As held-to-maturity securities are entirely school bonds and the creditworthiness of the issuers
has not changed materially from the time of acquisition, their book values are used.

39
(ii) For other securities, please refer to “Securities” in Notes. (4) Notes and accounts payable-trade and, (5) Short-term loans payable
As they are settled in a short period and their market values are nearly identical to their book values, the book values are used.
(6) Long-term loans payable
For the fair values of long-term loans payable at fixed interest rates, the total amount of the principal and interest is discounted using a rate that is assumed to be applied when a similar loan is newly borrowed. For the fair values of long-term loans payable at variable interest rates, as the credit risk of the Company has not changed materially and the market values are nearly identical to their book values, the book values are used. For those that are subject to the special treatment of interest rate swaps (see (7) (ii) below), the total amount of the principal and interest that were accounted for as a single item with the relevant interest rate swap is discounted with a rate that is assumed to be applied when a new, similar loan is taken out.
(7) Derivatives transactions
(i) Those which the hedge accounting does not apply to The contract amount or the amount equivalent to the principal set forth in the contract for each type of hedged item in derivatives transactions on the consolidated closing date, the market value and valuation gains or losses, and the method of calculating fair value are as follows: (a) Currency-related derivatives (the fair values of forward exchange contracts are calculated
using forward exchange rates, and the fair values of currency swaps are calculated using prices offered by relationship banks.)
[Millions of yen]
Category Type Contract amount, etc.
Fair value Valuation gains or losses More than
one year Transactions other than market transactions
Forward exchange contract 29,415 - (324) (324)Currency swap 18,897 - (1,001) (1,001)
(b) Interest rate-related derivatives (the fair values are calculated using prices offered by
relationship financial institutions.) [Millions of yen]
Category Type Contract amount, etc.
Fair value Valuation gains or losses More than
one year Transactions other than market transactions Interest rate swap 3,747 - (106) (106)
(ii) Those which the hedge accounting applies to
The contract amount or the amount equivalent to the principal set forth in the contract, etc. for each method of hedge accounting on the consolidated closing date are as follows:
[Millions of yen]
Method of hedge accounting
Type of derivatives transactions
Major hedged itemsContract amount, etc.
Fair value Calculation method of
the fair valueMore than one year
Special treatment of interest rate swap
Interest rate swap
Long-term loans payable 50,500 23,000 (*)
Planned transactions such as forward exchange contract
Forward exchange contract
Accounts receivable and accounts payable-trade
11,842 - 56 Forward exchange
rate (*) As interest rate swaps subject to the special treatment of interest rate swap are accounted for as a single item with underlying long-term loans payable, which are hedged items, their market values are included in those of long-term loans

40
payable. (Note 2) As unlisted stocks (consolidated balance sheet amount of 2,354 million yen) do not have market values, it is considered extremely difficult to calculate their fair values. Therefore, they are not included in “(3) (ii) Other securities.” (Note 3) The amount of monetary claims and securities with maturity to be redeemed after the consolidated closing date
[Millions of yen] Within one year More than one year, within five yearsCash and deposits 85,533 -Notes and accounts receivable-trade 177,720 -Securities and investment securities
Held-to-maturity securities - 10Other securities with maturity 79,000 -
Total 342,254 10 (Note 4) The amount of long-term loans payable to be repaid after the consolidated closing date
[Millions of yen] More than one year, within five years More than five years, within ten years
Long-term loans 63,622 8,002 Additional information
The “Accounting Standards for Financial Instruments” (ASBJ Statement No. 10, March 10, 2008) and the “Guidance on Disclosures about the Fair Value of Financial Instruments” (ASBJ Guidance No. 19, March 10, 2008) are applied from the consolidated fiscal year under review.
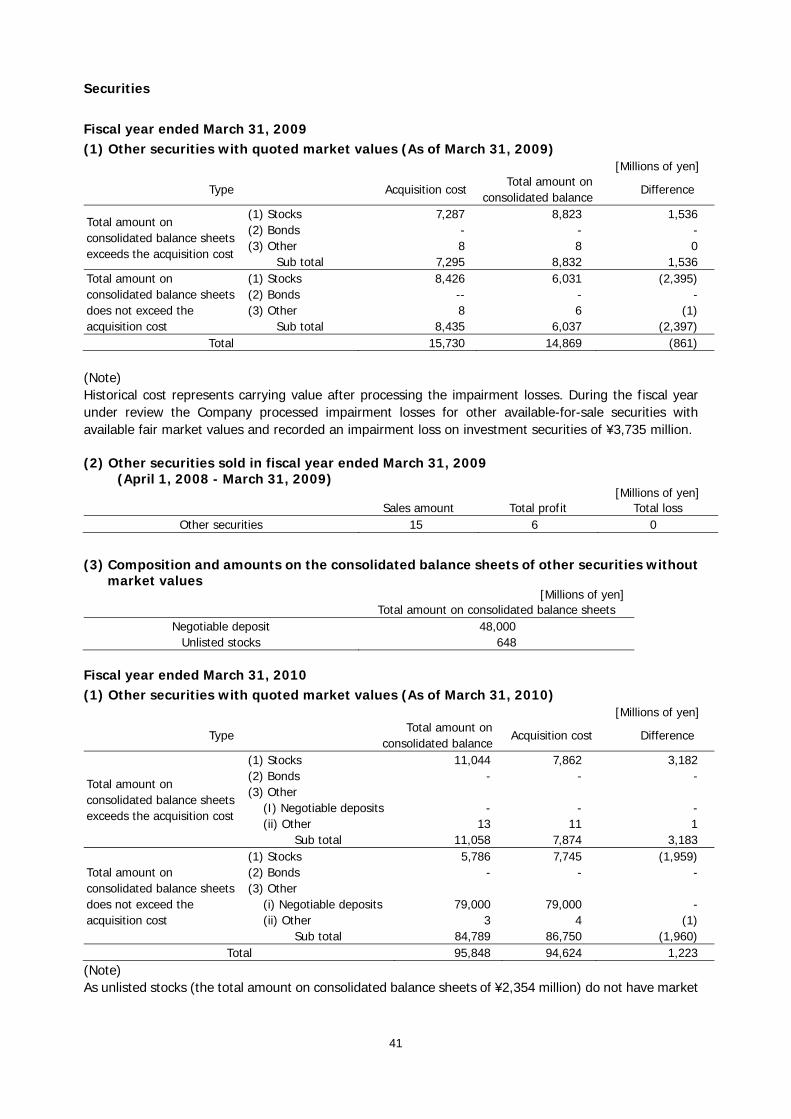
41
Securities Fiscal year ended March 31, 2009 (1) Other securities with quoted market values (As of March 31, 2009)
[Millions of yen]
Type Acquisition costTotal amount on
consolidated balance Difference
Total amount on consolidated balance sheets exceeds the acquisition cost
(1) Stocks 7,287 8,823 1,536 (2) Bonds - - - (3) Other 8 8 0
Sub total 7,295 8,832 1,536 Total amount on consolidated balance sheets does not exceed the acquisition cost
(1) Stocks 8,426 6,031 (2,395) (2) Bonds -- - - (3) Other 8 6 (1)
Sub total 8,435 6,037 (2,397) Total 15,730 14,869 (861)
(Note) Historical cost represents carrying value after processing the impairment losses. During the fiscal year under review the Company processed impairment losses for other available-for-sale securities with available fair market values and recorded an impairment loss on investment securities of ¥3,735 million. (2) Other securities sold in fiscal year ended March 31, 2009 (April 1, 2008 - March 31, 2009)
[Millions of yen] Sales amount Total profit Total loss
Other securities 15 6 0
(3) Composition and amounts on the consolidated balance sheets of other securities without
market values [Millions of yen]
Total amount on consolidated balance sheets Negotiable deposit 48,000
Unlisted stocks 648 Fiscal year ended March 31, 2010 (1) Other securities with quoted market values (As of March 31, 2010)
[Millions of yen]
Type Total amount on
consolidated balanceAcquisition cost Difference
Total amount on consolidated balance sheets exceeds the acquisition cost
(1) Stocks 11,044 7,862 3,182 (2) Bonds - - - (3) Other
(I) Negotiable deposits - - - (ii) Other 13 11 1
Sub total 11,058 7,874 3,183
Total amount on consolidated balance sheets does not exceed the acquisition cost
(1) Stocks 5,786 7,745 (1,959) (2) Bonds - - - (3) Other
(i) Negotiable deposits 79,000 79,000 - (ii) Other 3 4 (1)
Sub total 84,789 86,750 (1,960) Total 95,848 94,624 1,223
(Note) As unlisted stocks (the total amount on consolidated balance sheets of ¥2,354 million) do not have market
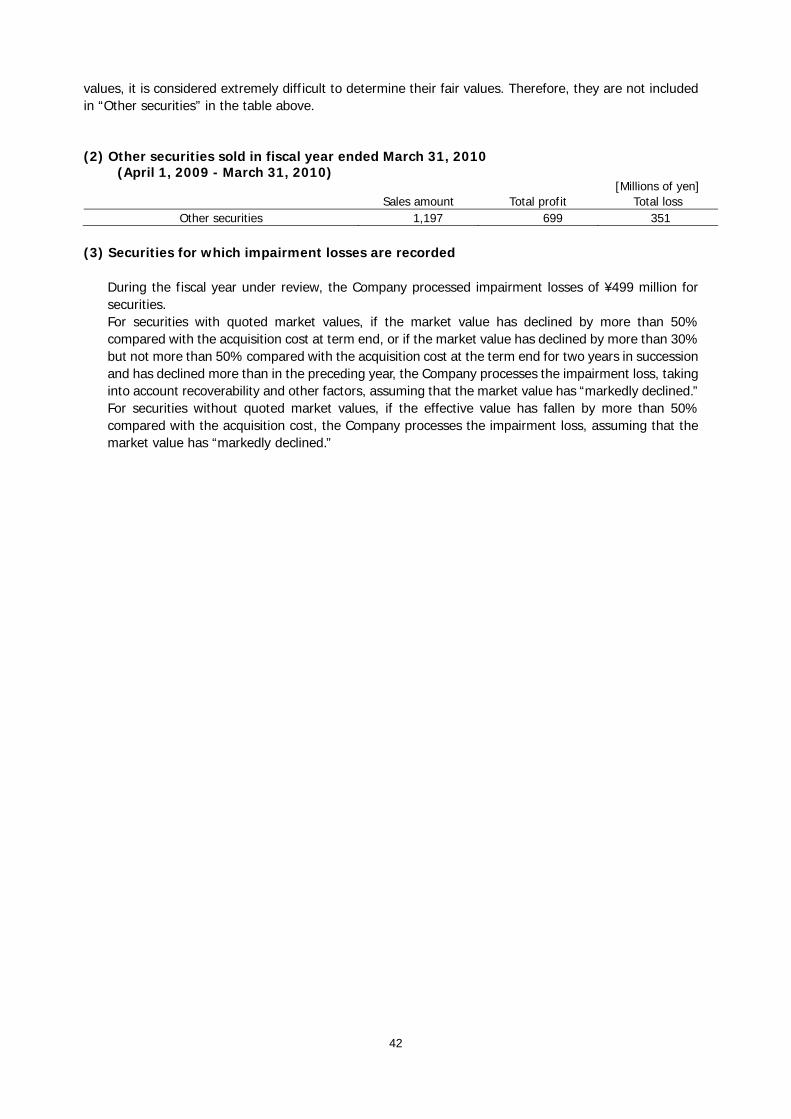
42
values, it is considered extremely difficult to determine their fair values. Therefore, they are not included in “Other securities” in the table above. (2) Other securities sold in fiscal year ended March 31, 2010 (April 1, 2009 - March 31, 2010)
[Millions of yen] Sales amount Total profit Total loss
Other securities 1,197 699 351 (3) Securities for which impairment losses are recorded
During the fiscal year under review, the Company processed impairment losses of ¥499 million for securities. For securities with quoted market values, if the market value has declined by more than 50% compared with the acquisition cost at term end, or if the market value has declined by more than 30% but not more than 50% compared with the acquisition cost at the term end for two years in succession and has declined more than in the preceding year, the Company processes the impairment loss, taking into account recoverability and other factors, assuming that the market value has “markedly declined.” For securities without quoted market values, if the effective value has fallen by more than 50% compared with the acquisition cost, the Company processes the impairment loss, assuming that the market value has “markedly declined.”

43
Retirement Benefit Plan (1) Outline of the retirement benefit system
The Company and some of domestic consolidated subsidiaries have defined benefit retirement plans (defined benefit-type corporate pension plans, tax-qualified retirement pension plans and lump-sum severance payments), and have defined contribution retirement plans (defined contribution-type corporate pension plans). Certain overseas consolidated subsidiaries have defined benefit retirement plans and defined contribution retirement plans. In some cases, retiring employees are paid an additional severance allowance. Additionally, the Company and certain domestic consolidated subsidiaries have a retirement benefit trust. (2) Items related to retirement benefit liabilities
[Millions of yen] As of March 31, 2009 As of March 31, 2010 a. Retirement benefit obligation (140,843) (146,078)b. Plan assets 74,124 85,965c. Unfunded retirement benefit obligation (a+b) (66,718) (60,112)d. Unrecognized actuarial differences 18,621 13,545e. Unrecognized prior service cost (reduction in liabilities) (7,033) (5,322)f. Net amount on consolidated balance sheets (c+d+e) (55,130) (51,889)g. Prepaid pension costs 2,831 2,356h. Accrued for retirement benefits (f-g) (57,962) (54,245)
As of March 31, 2009 As of March 31, 2010 1. Certain subsidiaries use a simplified method for the
calculation of benefit obligation 1. Certain subsidiaries use a simplified method for
the calculation of benefit obligation
(3) Items related to retirement benefit costs
[Millions of yen] April 1, 2007 – March 31, 2009 April 1, 2008 – March 31, 2010
a. Service costs (*) 5,181 (*) 4,098b. Interest costs 4,074 4,002c. Expected return on plan assets (2,280) (1,596)d. Amortization of actuarial differences 1,860 3,372e. Amortization of prior service costs 643 (1,402)f. Retirement benefit costs (a+b+c+d+e) 9,479 8,473g. Contribution defined contribution pension plans 3,168 2,449Total (f+g) 12,647 10,922
(*): April 1, 2008 – March 31, 2009 April 1, 2009 – March 31, 2010
1. Retirement benefit costs for consolidated subsidiaries using a simplified method are included in “a. Service costs”.
Retirement benefit costs for consolidated subsidiaries using a simplified method are included in “a. Service costs”.

44
(4) Items forming the basis for the calculation of retirement benefit liabilities
[Millions of yen] April 1, 2008 – March 31, 2009 April 1, 2009– March 31, 2010
a. Method of attributing the retirement benefits to periods of service
Periodic allocation method for projected benefit obligations
Periodic allocation method for projected benefit obligations
b. Discount rate Mainly 2.5% Mainly 2.5% c. Expected rate of return on plan
assets Mainly 1.25% Mainly 1.25%
d. Period for amortization of
unrecognized prior service cost Mainly 10 years (Amortization is made over a certain period, using the straight-line method within the average remaining years of service of employees when liabilities are accrued.)
Mainly 10 years (Amortization is made over a certain period, using the straight-line method within the average remaining years of service of employees when liabilities are accrued.)
e. Period for amortization of
unrecognized actuarial differences Mainly 10 years (Amortization is made over a certain period, using the straight-line method within the average remaining service period starting the year after actuarial loss or gain are recognized.)
Mainly 10 years (Amortization is made over a certain period, using the straight-line method within the average remaining service period starting the year after actuarial loss or gain are recognized.)
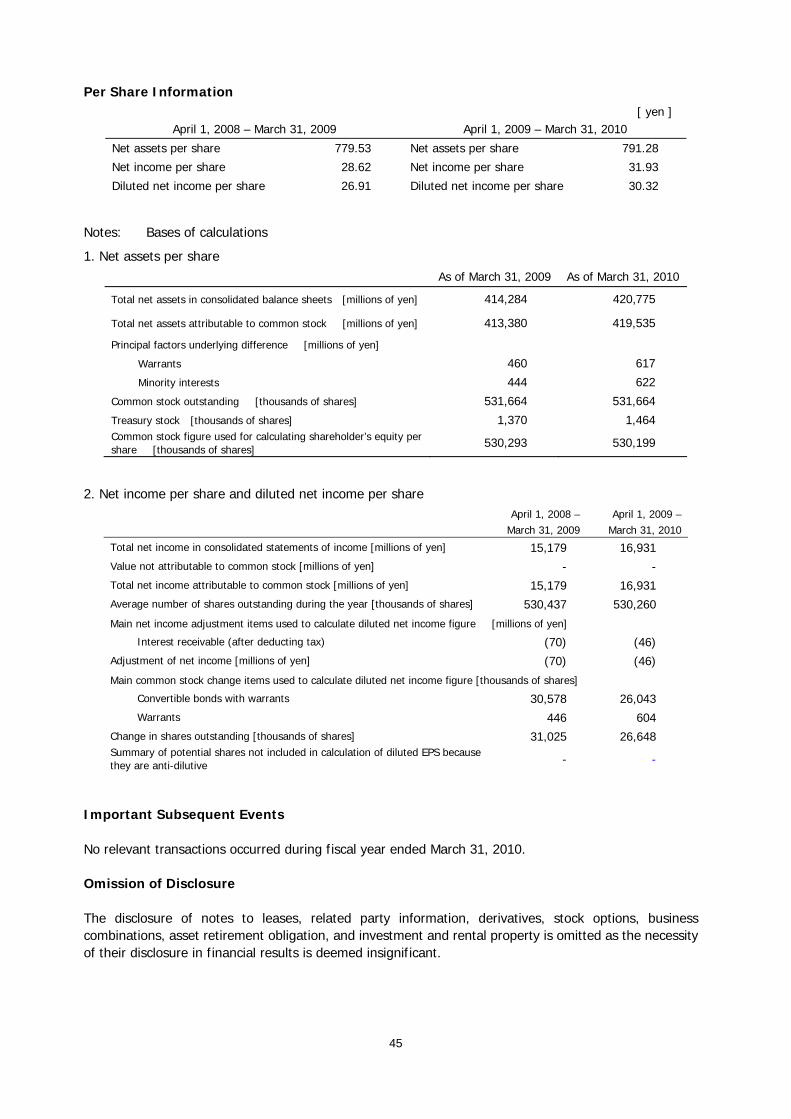
45
Per Share Information [ yen ]
April 1, 2008 – March 31, 2009 April 1, 2009 – March 31, 2010
Net assets per share 779.53 Net assets per share 791.28
Net income per share 28.62 Net income per share 31.93
Diluted net income per share 26.91 Diluted net income per share 30.32
Notes: Bases of calculations
1. Net assets per share As of March 31, 2009 As of March 31, 2010
Total net assets in consolidated balance sheets [millions of yen] 414,284 420,775
Total net assets attributable to common stock [millions of yen] 413,380 419,535
Principal factors underlying difference [millions of yen]
Warrants 460 617
Minority interests 444 622
Common stock outstanding [thousands of shares] 531,664 531,664
Treasury stock [thousands of shares] 1,370 1,464 Common stock figure used for calculating shareholder’s equity per share [thousands of shares] 530,293 530,199
2. Net income per share and diluted net income per share
April 1, 2008 –
March 31, 2009 April 1, 2009 –
March 31, 2010
Total net income in consolidated statements of income [millions of yen] 15,179 16,931 Value not attributable to common stock [millions of yen] - - Total net income attributable to common stock [millions of yen] 15,179 16,931 Average number of shares outstanding during the year [thousands of shares] 530,437 530,260
Main net income adjustment items used to calculate diluted net income figure [millions of yen] Interest receivable (after deducting tax) (70) (46)
Adjustment of net income [millions of yen] (70) (46)
Main common stock change items used to calculate diluted net income figure [thousands of shares] Convertible bonds with warrants 30,578 26,043 Warrants 446 604
Change in shares outstanding [thousands of shares] 31,025 26,648 Summary of potential shares not included in calculation of diluted EPS because they are anti-dilutive - -
Important Subsequent Events No relevant transactions occurred during fiscal year ended March 31, 2010. Omission of Disclosure The disclosure of notes to leases, related party information, derivatives, stock options, business combinations, asset retirement obligation, and investment and rental property is omitted as the necessity of their disclosure in financial results is deemed insignificant.