1H 2014 Consolidated Results
20
Terna 1H2014 Consolidated Results MATTEO DEL FANTE Chief Executive Officer ANDREA CRENNA Head of Administration, Finance and Control JULY 24 TH , 2014
-
Upload
ternaenergia -
Category
Business
-
view
50 -
download
2
Transcript of 1H 2014 Consolidated Results
Terna 1H2014Consolidated Results
MATTEO DEL FANTEChief Executive Officer
ANDREA CRENNAHead of Administration,Finance and Control
JULY 24TH, 2014
1H14 CONSOLIDATED RESULTS JULY 24th 2014
Investor Relations 1
1H14 Consolidated Results
July 24th, 2014
Matteo Del Fante Chief Executive Officer
Andrea Crenna Head of Administration, Finance and Control
1H14 CONSOLIDATED RESULTS JULY 24th 2014
Investor Relations 2
Agenda
Annexes
Highlights
3
1H14 Results
6
12
1H14 CONSOLIDATED RESULTS JULY 24th 2014
Investor Relations 3
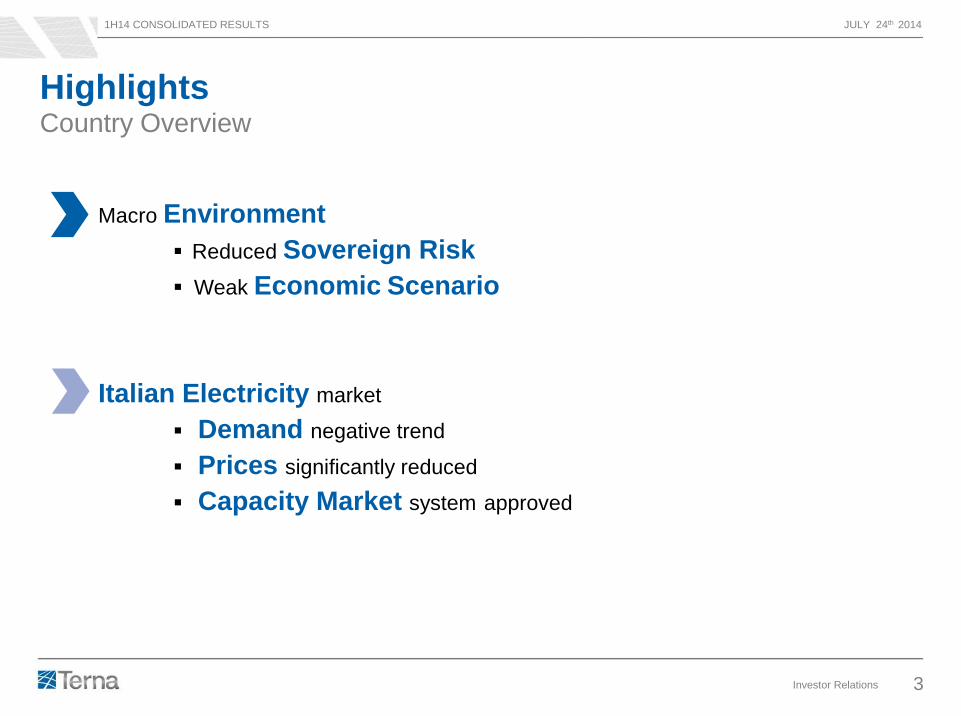
Highlights Country Overview
Macro Environment
Reduced Sovereign Risk
Weak Economic Scenario
Italian Electricity market
Demand negative trend
Prices significantly reduced
Capacity Market system approved
1H14 CONSOLIDATED RESULTS JULY 24th 2014
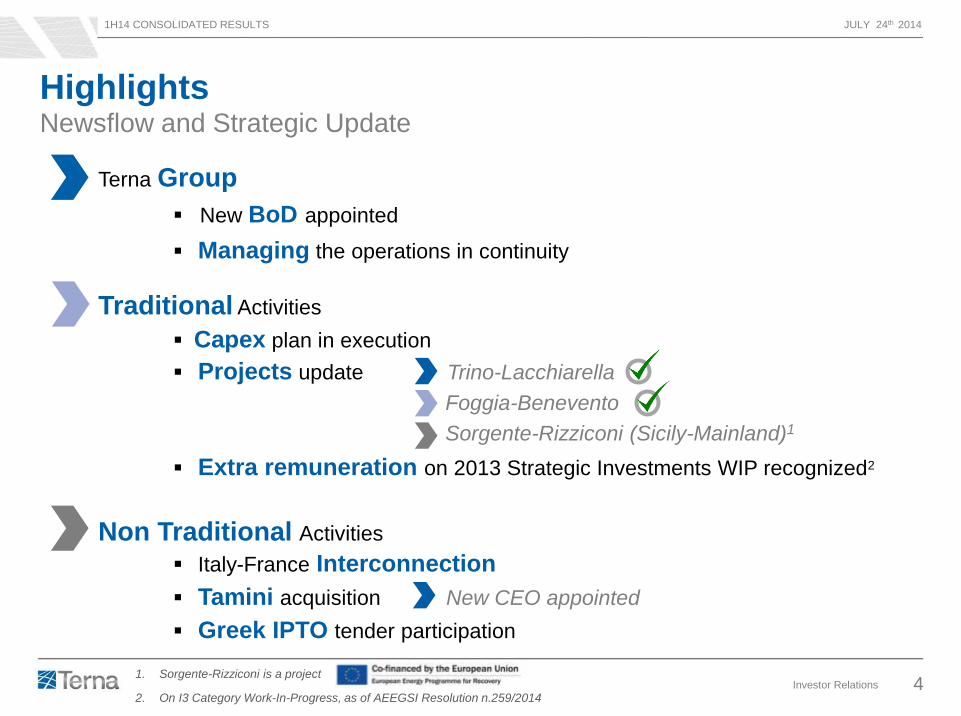
Investor Relations 4 1. Sorgente-Rizziconi is a project
2. On I3 Category Work-In-Progress, as of AEEGSI Resolution n.259/2014
Highlights Newsflow and Strategic Update
Terna Group
New BoD appointed
Managing the operations in continuity
Traditional Activities
Capex plan in execution
Projects update Trino-Lacchiarella
Foggia-Benevento
Sorgente-Rizziconi (Sicily-Mainland)1
Extra remuneration on 2013 Strategic Investments WIP recognized2
Non Traditional Activities
Italy-France Interconnection
Tamini acquisition New CEO appointed
Greek IPTO tender participation
1H14 CONSOLIDATED RESULTS JULY 24th 2014
Investor Relations 5
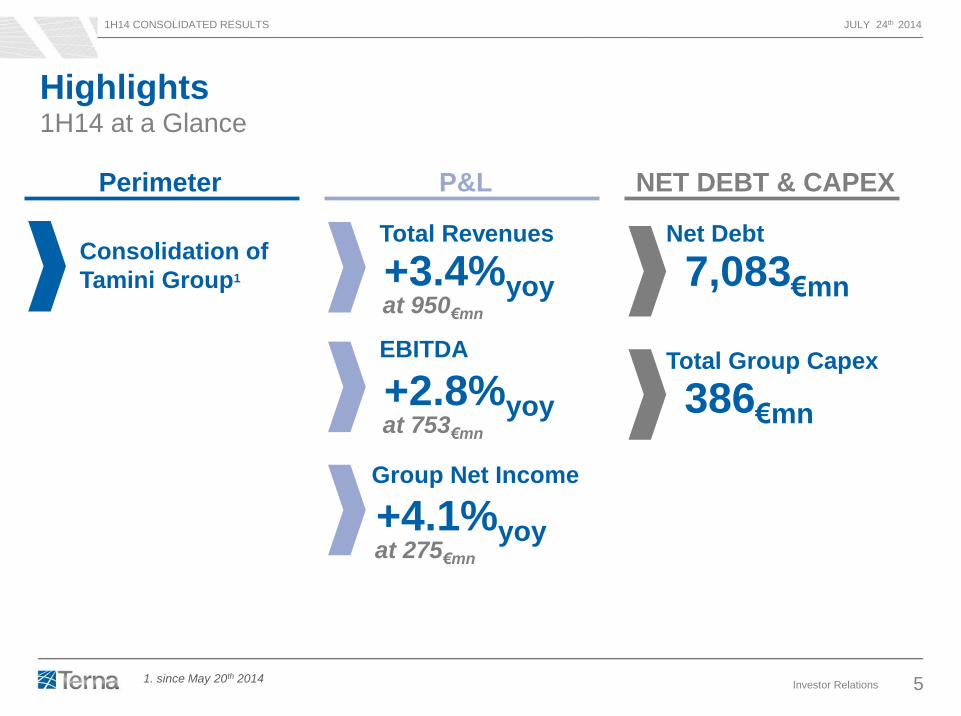
Highlights 1H14 at a Glance
Perimeter
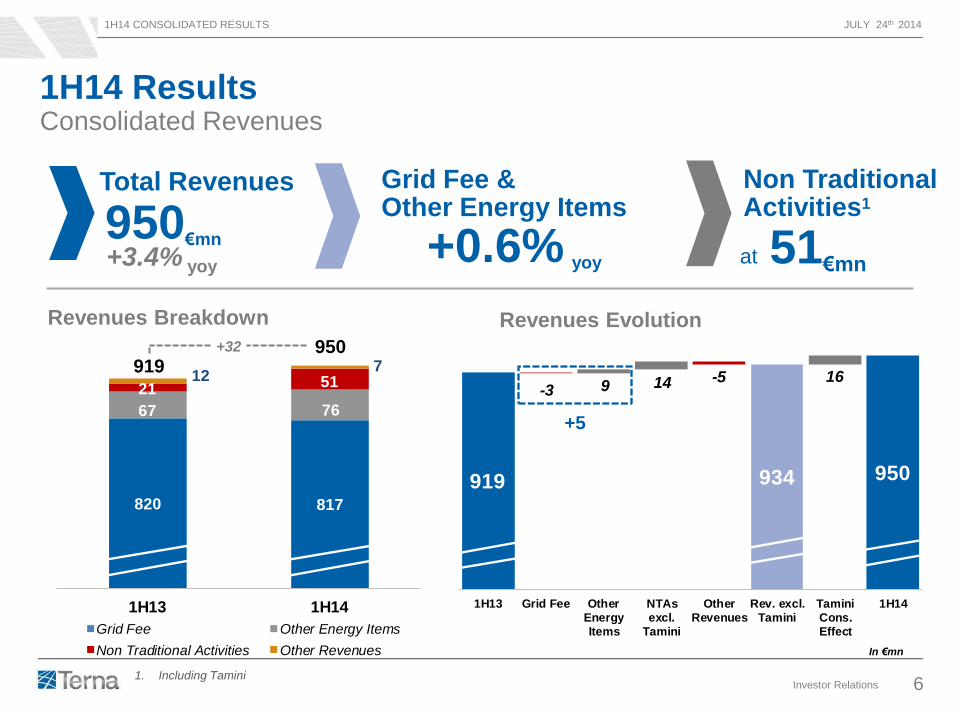
Total Revenues
+3.4%yoy at 950€mn
EBITDA
+2.8%yoy at 753€mn
Net Debt
7,083€mn
NET DEBT & CAPEX P&L
Group Net Income
+4.1%yoy at 275€mn
Total Group Capex
386€mn
1. since May 20th 2014
Consolidation of
Tamini Group1
1H14 CONSOLIDATED RESULTS JULY 24th 2014
Investor Relations 6
919 934 934 950 950
-3 9 14 -5 16
1H13 Grid Fee OtherEnergyItems
NTAsexcl.
Tamini
OtherRevenues
Rev. excl.Tamini
TaminiCons.Effect
1H14
820 817
67 76
21 51127
1H13 1H14
Grid Fee Other Energy Items
Non Traditional Activities Other Revenues
1H14 Results Consolidated Revenues
Total Revenues
Revenues Evolution
Grid Fee & Other Energy Items
Revenues Breakdown
+0.6% yoy
919 950
In €mn
+32
at 51€mn
+5
950€mn
+3.4% yoy
1. Including Tamini
Non Traditional Activities1
1H14 CONSOLIDATED RESULTS JULY 24th 2014
Investor Relations 7
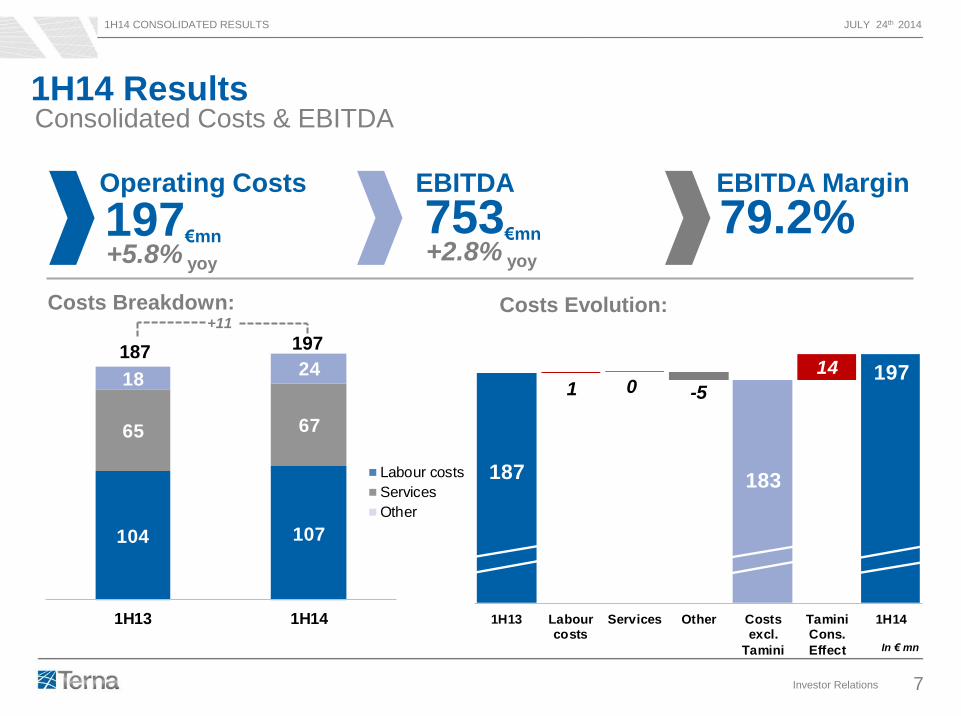
104 107
65 67
1824
1H13 1H14
Labour costs
Services
Other
1H14 Results Consolidated Costs & EBITDA
187 197
In € mn
+11
Operating Costs
Costs Evolution:
EBITDA
Costs Breakdown:
EBITDA Margin
79.2%
753€mn
+2.8% yoy
197€mn
+5.8% yoy
187187 183
1971 0 -5
14
1H13 Labourcosts
Services Other Costsexcl.
Tamini
TaminiCons.
Effect
1H14
1H14 CONSOLIDATED RESULTS JULY 24th 2014
Investor Relations 8
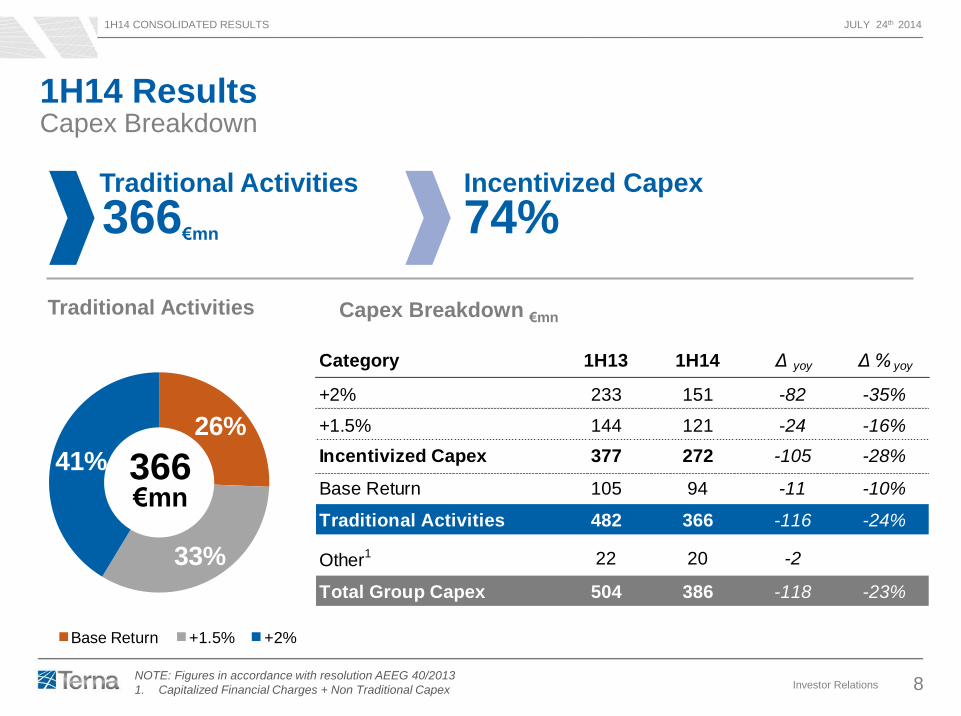
26%
33%
41%
Base Return +1.5% +2%
1H14 Results
366 €mn
NOTE: Figures in accordance with resolution AEEG 40/2013
1. Capitalized Financial Charges + Non Traditional Capex
Capex Breakdown
Traditional Activities
Capex Breakdown €mn
Incentivized Capex
Traditional Activities
74%
366€mn
Category 1H13 1H14 Δ yoy Δ % yoy
+2% 233 151 -82 -35%
+1.5% 144 121 -24 -16%
Incentivized Capex 377 272 -105 -28%
Base Return 105 94 -11 -10%
Traditional Activities 482 366 -116 -24%
Other1 22 20 -2
Total Group Capex 504 386 -118 -23%
1H14 CONSOLIDATED RESULTS JULY 24th 2014
Investor Relations 9
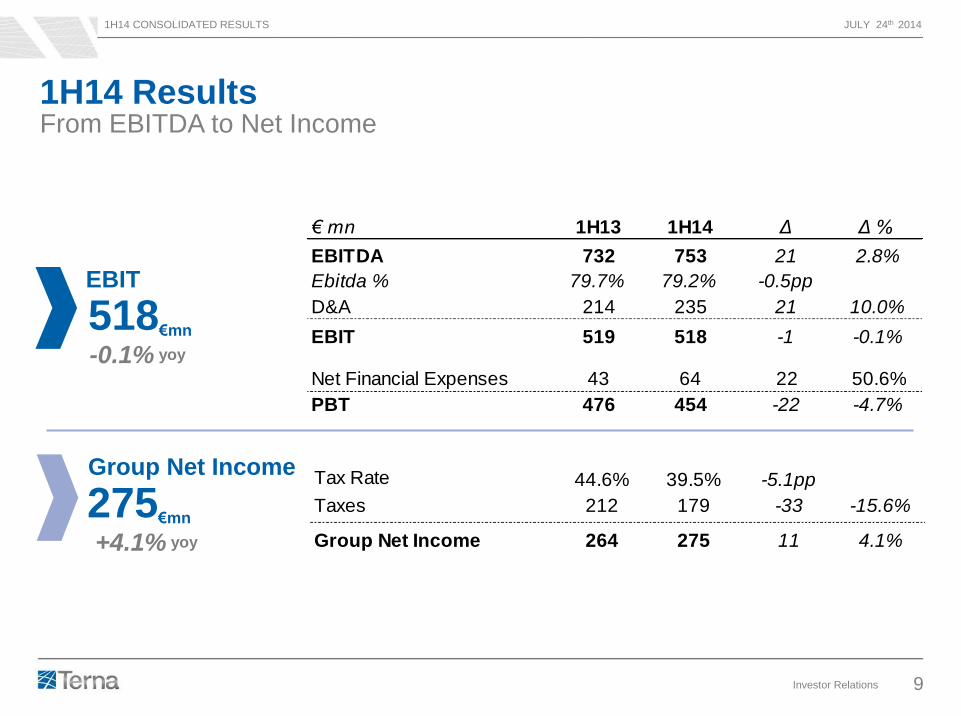
1H14 Results From EBITDA to Net Income
Group Net Income
EBIT
518€mn -0.1% yoy
275€mn +4.1% yoy
Tax Rate 44.6% 39.5% -5.1pp
Taxes 212 179 -33 -15.6%
Group Net Income 264 275 11 4.1%
€ mn 1H13 1H14 Δ Δ %
EBITDA 732 753 21 2.8%
Ebitda % 79.7% 79.2% -0.5pp
D&A 214 235 21 10.0%
EBIT 519 518 -1 -0.1%
Net Financial Expenses 43 64 22 50.6% - Financial Income & Equity inv.9 18 10
PBT 476 454 -22 -4.7%
1H14 CONSOLIDATED RESULTS JULY 24th 2014
Investor Relations 10
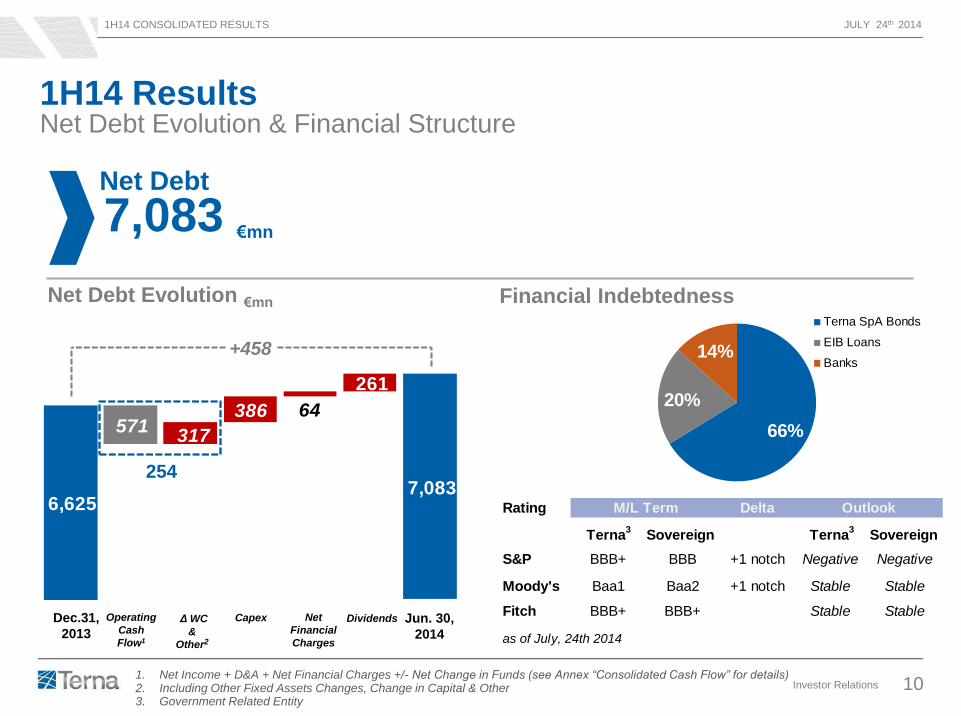
Net Debt Evolution €mn
Net Debt Evolution & Financial Structure
1. Net Income + D&A + Net Financial Charges +/- Net Change in Funds (see Annex “Consolidated Cash Flow” for details) 2. Including Other Fixed Assets Changes, Change in Capital & Other 3. Government Related Entity
Dec.31,
2013
Operating
Cash
Flow1
Δ WC
&
Other2
Jun. 30,
2014
+458
1H14 Results
Capex
Net Debt
7,083 €mn
Financial Indebtedness
66%
20%
14%
Terna SpA Bonds
EIB Loans
Banks
Rating Delta
Terna3
Sovereign Terna3
Sovereign
S&P BBB+ BBB +1 notch Negative Negative
Moody's Baa1 Baa2 +1 notch Stable Stable
Fitch BBB+ BBB+ Stable Stable
as of July, 24th 2014
M/L Term Outlook
Dividends
7,083 6,625
571 317
386 64
261
254
Net
Financial
Charges
1H14 CONSOLIDATED RESULTS JULY 24th 2014
Investor Relations 11
Matteo Del Fante Chief Executive Officer
Andrea Crenna Head of Administration, Finance and Control
THANK YOU. QUESTIONS?
1H14 CONSOLIDATED RESULTS JULY 24th 2014
Investor Relations 12
Annexes
1H14 CONSOLIDATED RESULTS JULY 24th 2014
Investor Relations 13
23
25
27
29
31
Jul Aug Sep Oct Nov Dec Jan Feb Mar Apr May Jun
Range last 5 years
Monthy energy demand
Prior Year
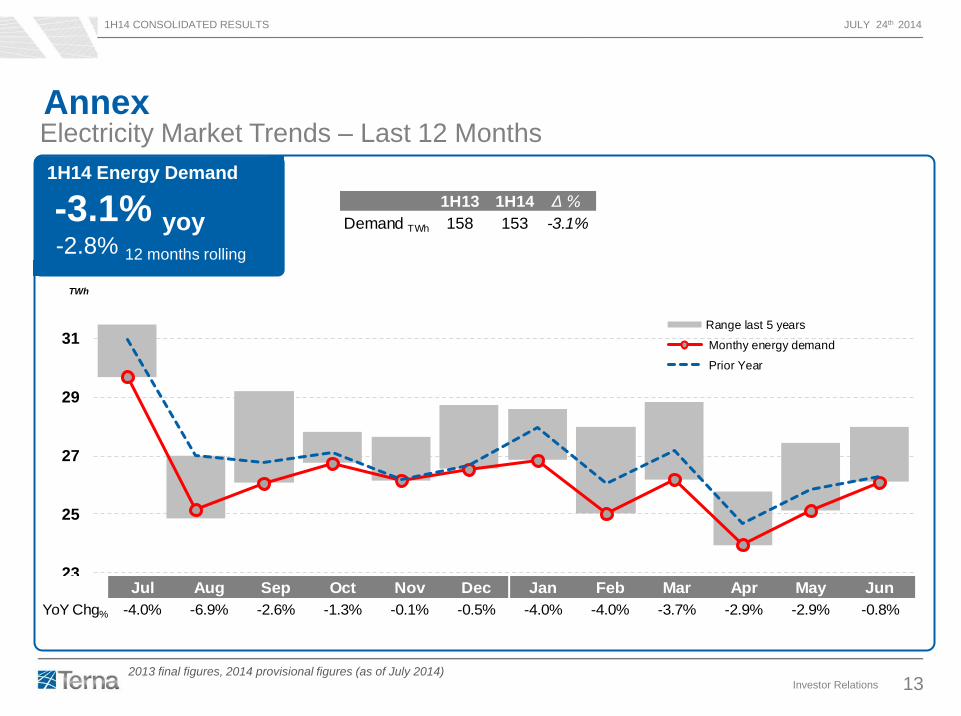
Annex Electricity Market Trends – Last 12 Months
1H14 Energy Demand
-3.1% yoy
-2.8% 12 months rolling
TWh
2013 final figures, 2014 provisional figures (as of July 2014)
1H13 1H14 Δ %
Demand TWh 158 153 -3.1%
Jul Aug Sep Oct Nov Dec Jan Feb Mar Apr May Jun
YoY Chg% -4.0% -6.9% -2.6% -1.3% -0.1% -0.5% -4.0% -4.0% -3.7% -2.9% -2.9% -0.8%
1H14 CONSOLIDATED RESULTS JULY 24th 2014
Investor Relations 14
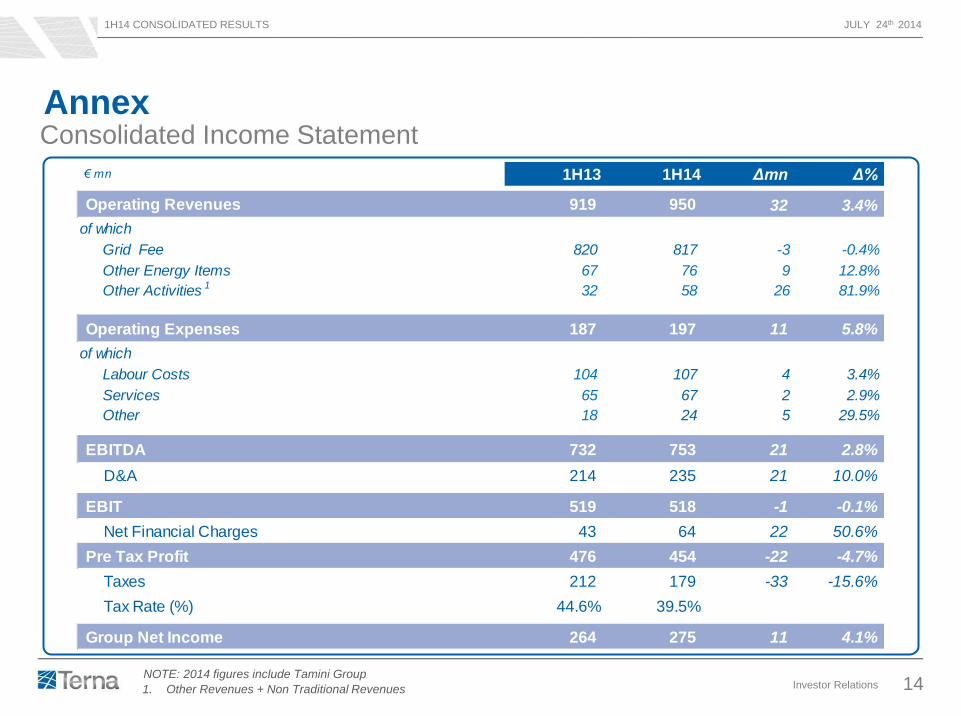
Consolidated Income Statement Annex
1. Other Revenues + Non Traditional Revenues
NOTE: 2014 figures include Tamini Group
€ mn 1H13 1H14 Δmn Δ%
Operating Revenues 919 950 32 3.4%
of which
Grid Fee 820 817 -3 -0.4%
Other Energy Items 67 76 9 12.8%
Other Activities 1 32 58 26 81.9%
Operating Expenses 187 197 11 5.8%
of which
Labour Costs 104 107 4 3.4%
Services 65 67 2 2.9%
Other 18 24 5 29.5%
EBITDA 732 753 21 2.8%
D&A 214 235 21 10.0%
EBIT 519 518 -1 -0.1%
Net Financial Charges 43 64 22 50.6%
Pre Tax Profit 476 454 -22 -4.7%
Taxes 212 179 -33 -15.6%
Tax Rate (%) 44.6% 39.5%
Group Net Income 264 275 11 4.1%
1H14 CONSOLIDATED RESULTS JULY 24th 2014
Investor Relations 15
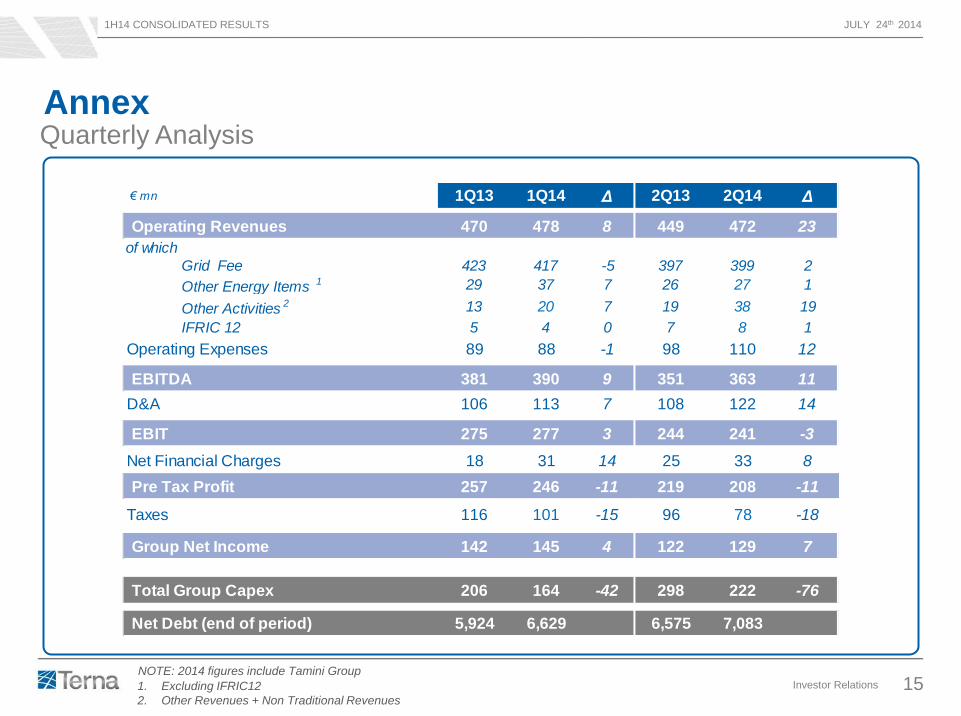
Quarterly Analysis Annex
€ mn 1Q13 1Q14 Δ 2Q13 2Q14 Δ
Operating Revenues 470 478 8 449 472 23
of which
Grid Fee 423 417 -5 397 399 2
Other Energy Items 1 29 37 7 26 27 1
Other Activities 2 13 20 7 19 38 19
IFRIC 12 5 4 0 7 8 1
Operating Expenses 89 88 -1 98 110 12
EBITDA 381 390 9 351 363 11
D&A 106 113 7 108 122 14
EBIT 275 277 3 244 241 -3
Net Financial Charges 18 31 14 25 33 8
Pre Tax Profit 257 246 -11 219 208 -11
Taxes 116 101 -15 96 78 -18
Group Net Income 142 145 4 122 129 7
Total Group Capex 206 164 -42 298 222 -76
Net Debt (end of period) 5,924 6,629 6,575 7,083
1. Excluding IFRIC12
2. Other Revenues + Non Traditional Revenues
NOTE: 2014 figures include Tamini Group
1H14 CONSOLIDATED RESULTS JULY 24th 2014
Investor Relations 16
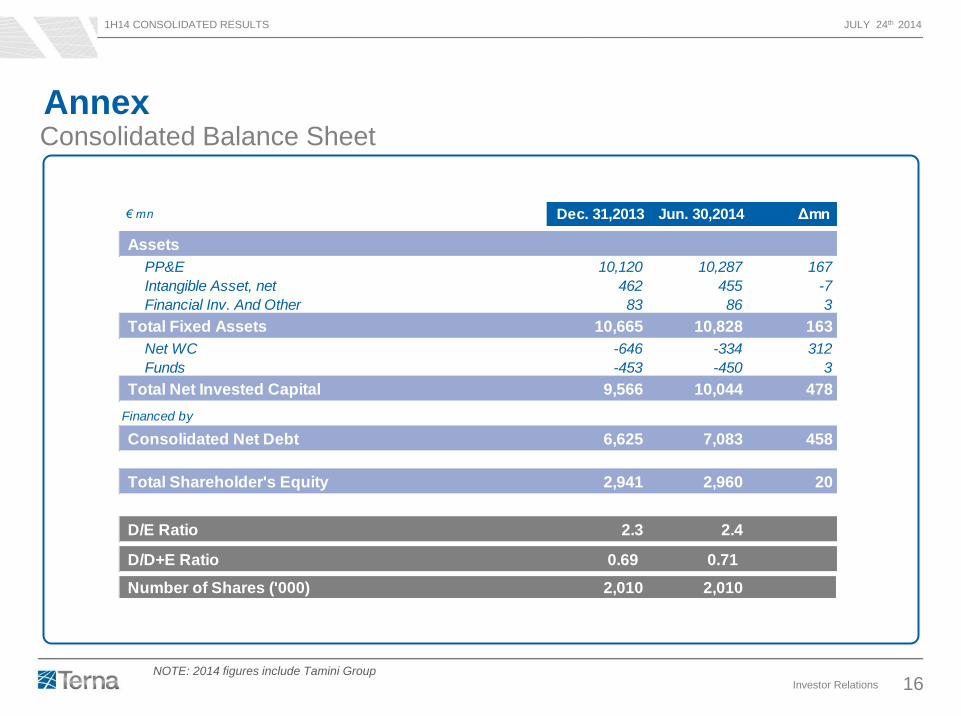
Consolidated Balance Sheet
Annex
€ mn Dec. 31,2013 Jun. 30,2014 Δmn
Assets
PP&E 10,120 10,287 167
Intangible Asset, net 462 455 -7
Financial Inv. And Other 83 86 3
Total Fixed Assets 10,665 10,828 163
Net WC -646 -334 312
Funds -453 -450 3
Total Net Invested Capital 9,566 10,044 478
Financed by
Consolidated Net Debt 6,625 7,083 458
Total Shareholder's Equity 2,941 2,960 20
D/E Ratio 2.3 2.4
D/D+E Ratio 0.69 0.71
Number of Shares ('000) 2,010 2,010
NOTE: 2014 figures include Tamini Group
1H14 CONSOLIDATED RESULTS JULY 24th 2014
Investor Relations 17
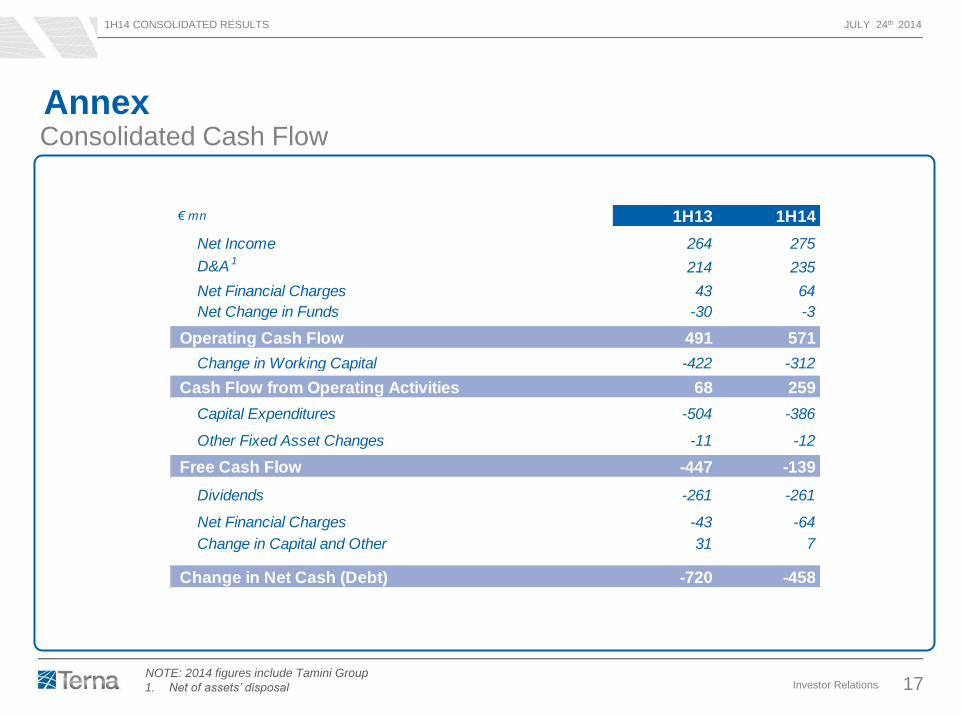
Consolidated Cash Flow
Annex
1. Net of assets’ disposal
€ mn 1H13 1H14
Net Income 264 275
D&A 1214 235
Net Financial Charges 43 64
Net Change in Funds -30 -3
Operating Cash Flow 491 571
Change in Working Capital -422 -312
Cash Flow from Operating Activities 68 259
Capital Expenditures -504 -386
Other Fixed Asset Changes -11 -12
Free Cash Flow -447 -139
Dividends -261 -261
Net Financial Charges -43 -64
Change in Capital and Other 31 7
Change in Net Cash (Debt) -720 -458
NOTE: 2014 figures include Tamini Group
1H14 CONSOLIDATED RESULTS JULY 24th 2014
Investor Relations 18
Disclaimer
THIS DOCUMENT HAS BEEN PREPARED BY TERNA S.P.A. (THE “COMPANY”) FOR THE SOLE PURPOSE DESCRIBED HEREIN. IN NO CASE
MAY IT BE INTERPRETED AS AN OFFER OR INVITATION TO SELL OR PURCHASE ANY SECURITY ISSUED BY THE COMPANY OR ITS
SUBSIDIARIES.
THE CONTENT OF THIS DOCUMENT HAS A MERELY INFORMATIVE AND PROVISIONAL NATURE AND THE STATEMENTS CONTAINED HEREIN
HAVE NOT BEEN INDEPENDENTLY VERIFIED. NEITHER THE COMPANY NOR ANY OF ITS REPRESENTATIVES SHALL ACCEPT ANY LIABILITY
WHATSOEVER (WHETHER IN NEGLIGENCE OR OTHERWISE) ARISING IN ANY WAY FROM THE USE OF THIS DOCUMENT OR ITS CONTENTS
OR OTHERWISE ARISING IN CONNECTION WITH THIS DOCUMENT OR ANY MATERIAL DISCUSSED DURING THE PRESENTATION.
THIS DOCUMENT MAY NOT BE REPRODUCED OR REDISTRIBUTED, IN WHOLE OR IN PART, TO ANY OTHER PERSON. THE INFORMATION
CONTAINED HEREIN AND OTHER MATERIAL DISCUSSED AT THE CONFERENCE CALL MAY INCLUDE FORWARD-LOOKING STATEMENTS THAT
ARE NOT HISTORICAL FACTS, INCLUDING STATEMENTS ABOUT THE COMPANY’S BELIEFS AND EXPECTATIONS. THESE STATEMENTS ARE
BASED ON CURRENT PLANS, ESTIMATES, PROJECTIONS AND PROJECTS, AND CANNOT BE INTERPRETED AS A PROMISE OR GUARANTEE
OF WHATSOEVER NATURE.
HOWEVER, FORWARD-LOOKING STATEMENTS INVOLVE INHERENT RISKS AND UNCERTAINTIES AND ARE CURRENT ONLY AT THE DATE
THEY ARE MADE. WE CAUTION YOU THAT A NUMBER OF FACTORS COULD CAUSE THE COMPANY’S ACTUAL RESULTS AND PROVISIONS TO
DIFFER MATERIALLY FROM THOSE CONTAINED IN ANY FORWARD-LOOKING STATEMENT. SUCH FACTORS INCLUDE, BUT ARE NOT LIMITED
TO: TRENDS IN COMPANY’S BUSINESS, ITS ABILITY TO IMPLEMENT COST-CUTTING PLANS, CHANGES IN THE REGULATORY ENVIRONMENT,
DIFFERENT INTERPRETATION OF THE LAW AND REGULATION, ITS ABILITY TO SUCCESSFULLY DIVERSIFY AND THE EXPECTED LEVEL OF
FUTURE CAPITAL EXPENDITURES. THEREFORE, YOU SHOULD NOT PLACE UNDUE RELIANCE ON SUCH FORWARD-LOOKING STATEMENTS.
TERNA DOES NOT UNDERTAKE ANY OBLIGATION TO UPDATE FORWARD-LOOKING STATEMENTS TO REFLECT ANY CHANGES IN TERNA’S
EXPECTATIONS WITH REGARD THERETO OR ANY CHANGES IN EVENTS.
EXECUTIVE IN CHARGE OF THE PREPARATION OF ACCOUNTING DOCUMENTS “LUCIANO DI BACCO” DECLARES, PURSUANT TO PARAGRAPH
2 OF ARTICLE 154-BIS OF THE CONSOLIDATED LAW ON FINANCE, THAT THE ACCOUNTING INFORMATION CONTAINED IN THIS
PRESENTATION, FOR WHAT CONCERNS THE ACTUAL FIGURES, CORRESPONDS TO THE DOCUMENT RESULTS, BOOKS AND ACCOUNTING
RECORDS.
THE SORGENTE-RIZZICONI PROJECT AND THE ITALY-FRANCE INTERCONNECTION ARE CO-FINANCED BY THE EUROPEAN UNION’S
EUROPEAN ENERGY PROGRAMME FOR RECOVERY PROGRAMME. THE SOLE RESPONSIBILITY OF THIS PUBLICATION LIES WITH THE
AUTHOR. THE EUROPEAN UNION IS NO RESPONSIBLE FOR ANY USE THAT MAY BE MADE OF THE INFORMATION CONTAINED THEREIN.
1H14 CONSOLIDATED RESULTS JULY 24th 2014
Investor Relations 19
[email protected] I +39 06 8313 9041 I www.terna.it