Connecticut’s Response to the EPA 9-Factor Analysis … 9-Factor Analysis for ... Population...
35
Connecticut’s Response to the EPA 9-Factor Analysis for PM2.5 Designations MARAMA/NECSAUM Air Monitoring Meeting October 2004 Peter Babich CTDEP, Bureau of Air Management
Transcript of Connecticut’s Response to the EPA 9-Factor Analysis … 9-Factor Analysis for ... Population...
Connecticut’s Response to the EPA 9-Factor Analysis for
PM2.5 Designations
MARAMA/NECSAUM Air Monitoring MeetingOctober 2004Peter Babich
CTDEP, Bureau of Air Management
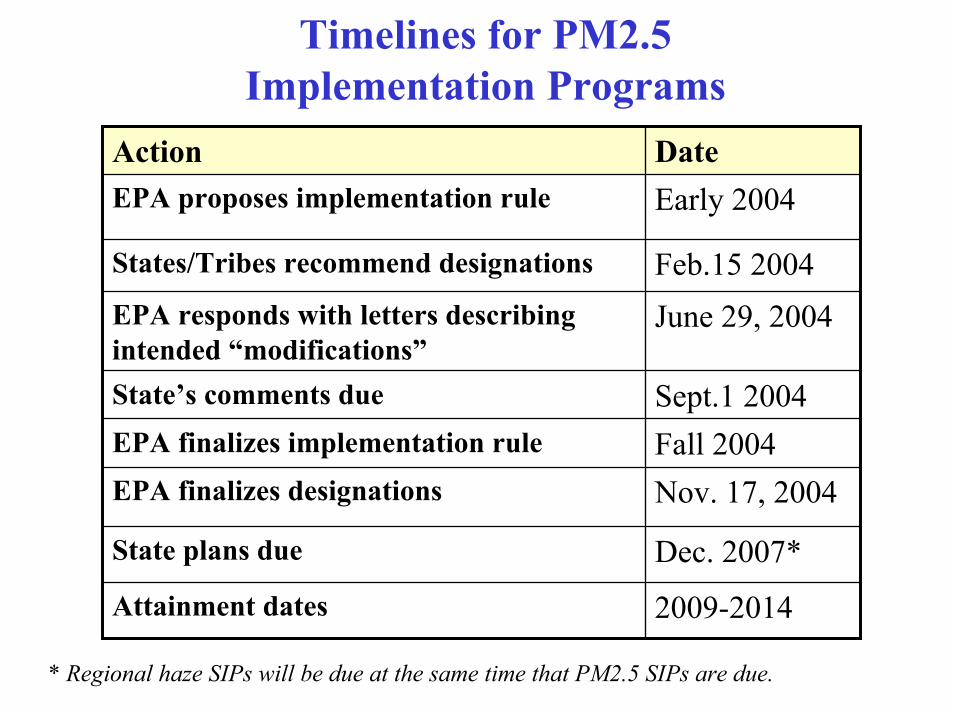
Timelines for PM2.5Implementation Programs
Sept.1 2004State’s comments due
June 29, 2004EPA responds with letters describing intended “modifications”
2009-2014Attainment dates
Dec. 2007*State plans due
Nov. 17, 2004EPA finalizes designationsFall 2004EPA finalizes implementation rule
Feb.15 2004States/Tribes recommend designations
Early 2004EPA proposes implementation ruleDateAction
* Regional haze SIPs will be due at the same time that PM2.5 SIPs are due.
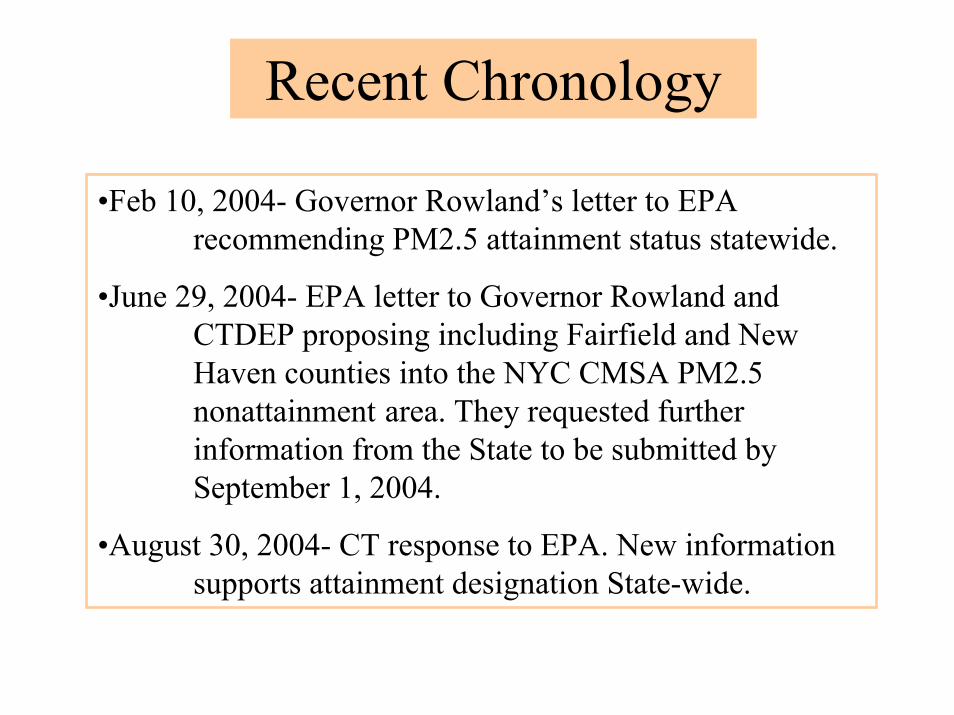
Recent Chronology
•Feb 10, 2004- Governor Rowland’s letter to EPA recommending PM2.5 attainment status statewide.
•June 29, 2004- EPA letter to Governor Rowland and CTDEP proposing including Fairfield and New Haven counties into the NYC CMSA PM2.5 nonattainment area. They requested further information from the State to be submitted by September 1, 2004.
•August 30, 2004- CT response to EPA. New information supports attainment designation State-wide.
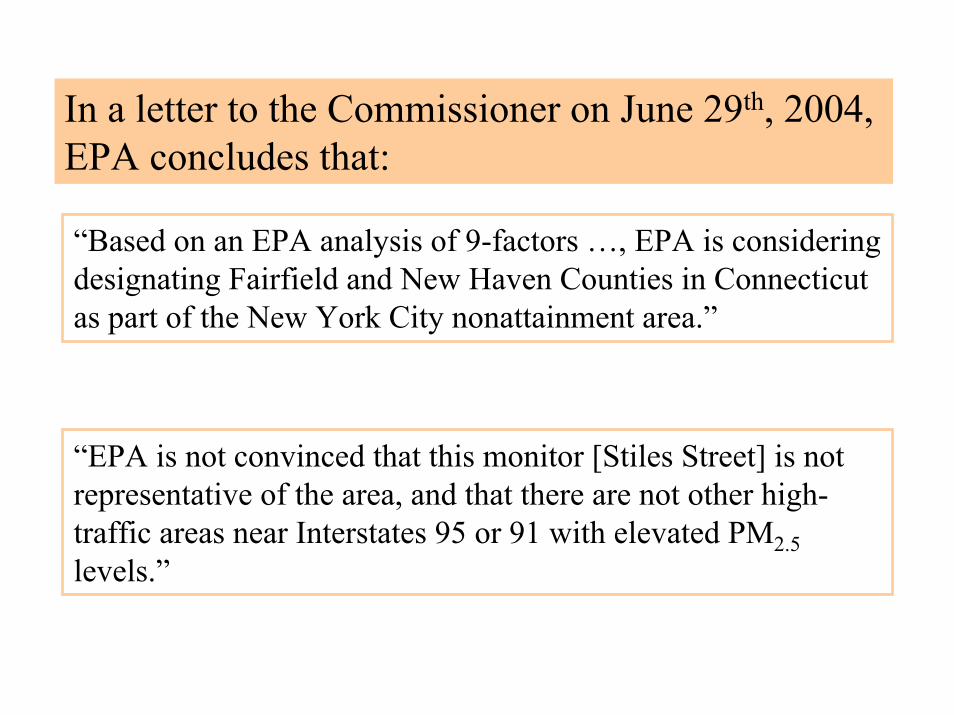
In a letter to the Commissioner on June 29th, 2004, EPA concludes that:
“Based on an EPA analysis of 9-factors …, EPA is considering designating Fairfield and New Haven Counties in Connecticut as part of the New York City nonattainment area.”
“EPA is not convinced that this monitor [Stiles Street] is not representative of the area, and that there are not other high-traffic areas near Interstates 95 or 91 with elevated PM2.5levels.”
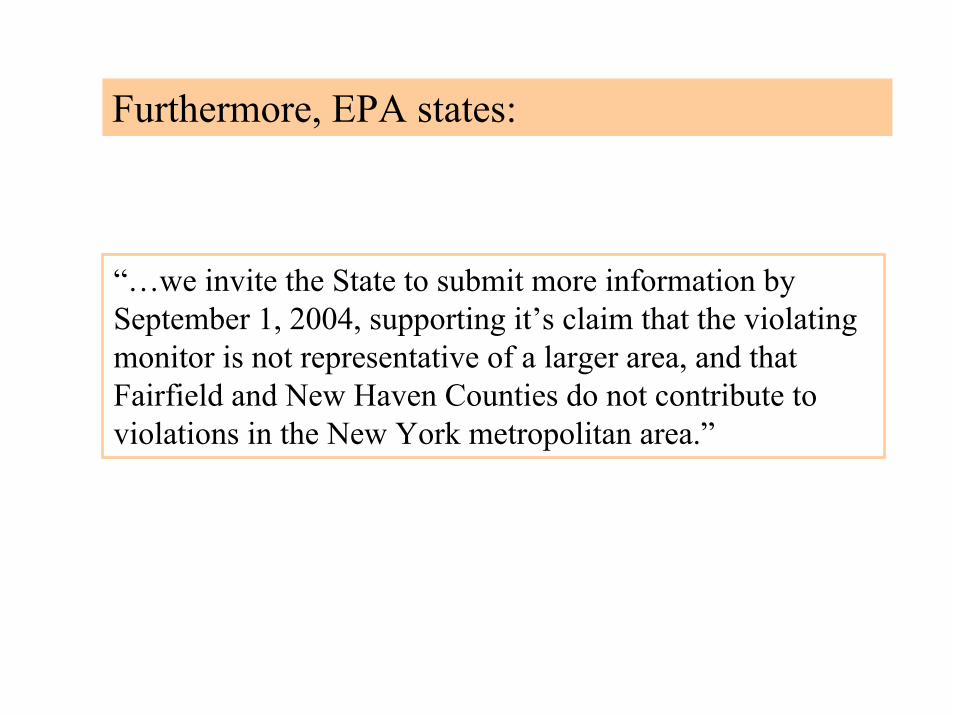
Furthermore, EPA states:
“…we invite the State to submit more information by September 1, 2004, supporting it’s claim that the violating monitor is not representative of a larger area, and that Fairfield and New Haven Counties do not contribute to violations in the New York metropolitan area.”
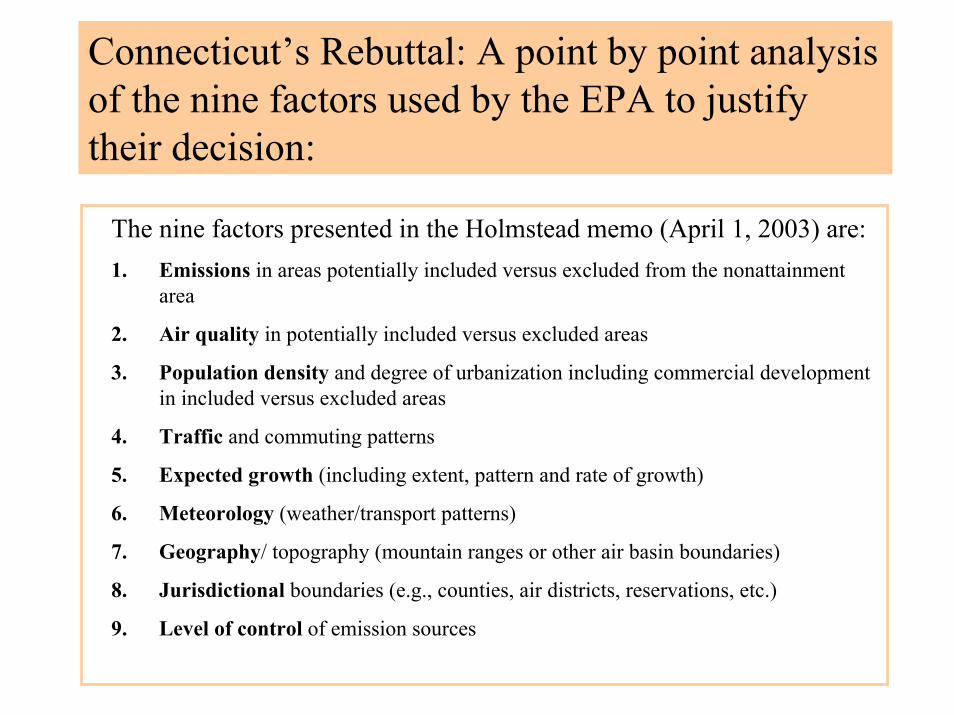
Connecticut’s Rebuttal: A point by point analysis of the nine factors used by the EPA to justify their decision:
The nine factors presented in the Holmstead memo (April 1, 2003) are:1. Emissions in areas potentially included versus excluded from the nonattainment
area
2. Air quality in potentially included versus excluded areas
3. Population density and degree of urbanization including commercial development in included versus excluded areas
4. Traffic and commuting patterns
5. Expected growth (including extent, pattern and rate of growth)
6. Meteorology (weather/transport patterns)
7. Geography/ topography (mountain ranges or other air basin boundaries)
8. Jurisdictional boundaries (e.g., counties, air districts, reservations, etc.)
9. Level of control of emission sources
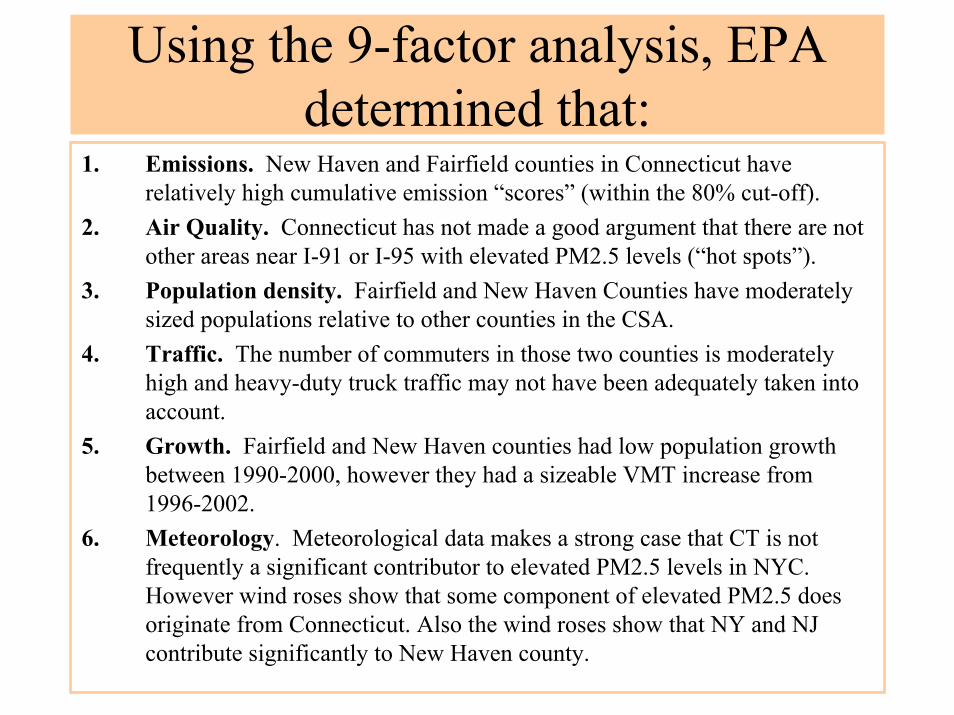
Using the 9-factor analysis, EPA determined that:
1. Emissions. New Haven and Fairfield counties in Connecticut have relatively high cumulative emission “scores” (within the 80% cut-off).
2. Air Quality. Connecticut has not made a good argument that there are not other areas near I-91 or I-95 with elevated PM2.5 levels (“hot spots”).
3. Population density. Fairfield and New Haven Counties have moderately sized populations relative to other counties in the CSA.
4. Traffic. The number of commuters in those two counties is moderately high and heavy-duty truck traffic may not have been adequately taken into account.
5. Growth. Fairfield and New Haven counties had low population growth between 1990-2000, however they had a sizeable VMT increase from 1996-2002.
6. Meteorology. Meteorological data makes a strong case that CT is not frequently a significant contributor to elevated PM2.5 levels in NYC. However wind roses show that some component of elevated PM2.5 does originate from Connecticut. Also the wind roses show that NY and NJ contribute significantly to New Haven county.
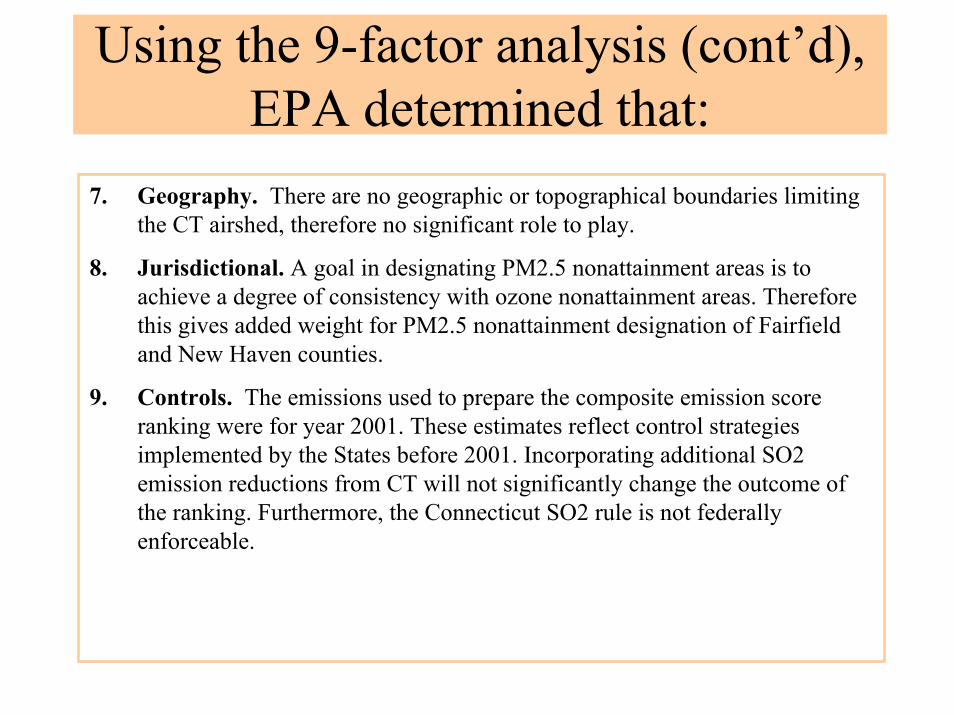
Using the 9-factor analysis (cont’d), EPA determined that:
7. Geography. There are no geographic or topographical boundaries limiting the CT airshed, therefore no significant role to play.
8. Jurisdictional. A goal in designating PM2.5 nonattainment areas is to achieve a degree of consistency with ozone nonattainment areas. Therefore this gives added weight for PM2.5 nonattainment designation of Fairfield and New Haven counties.
9. Controls. The emissions used to prepare the composite emission score ranking were for year 2001. These estimates reflect control strategies implemented by the States before 2001. Incorporating additional SO2 emission reductions from CT will not significantly change the outcome of the ranking. Furthermore, the Connecticut SO2 rule is not federally enforceable.
Factor 1: Emissions.
Connecticut feels that an arbitrary ranking of counties by emissions alone does not determine culpability for the urban excess at the Newark and NYC violating monitors.
This ranking does not take into account the:
•Meteorology involved in the transport.
•The distance of the county from the receptor, or
•The emission rates of the counties (emission densities)
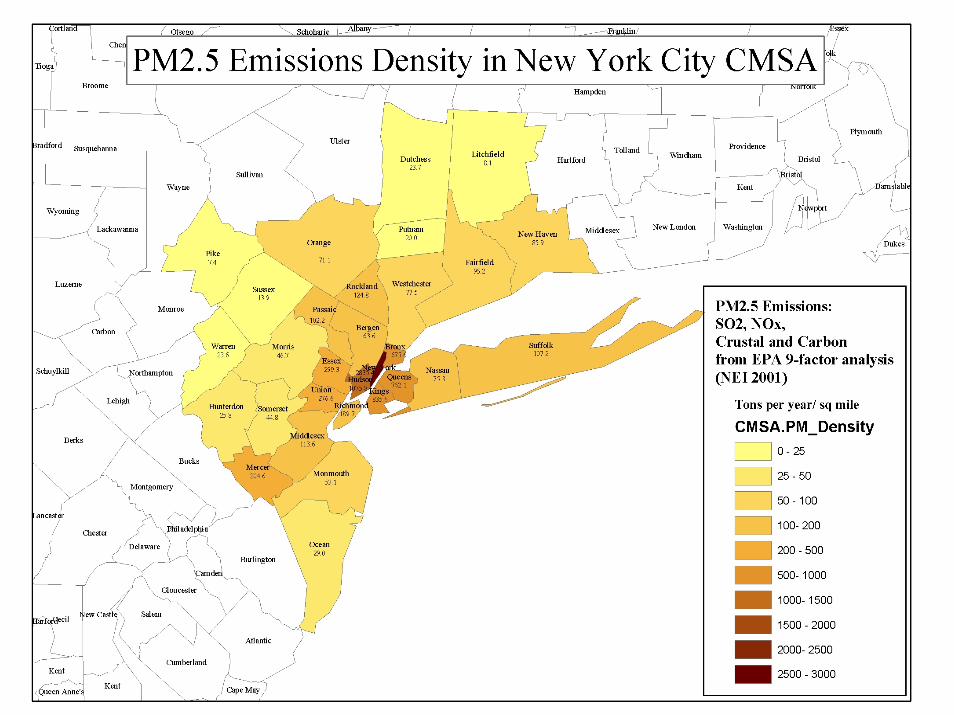
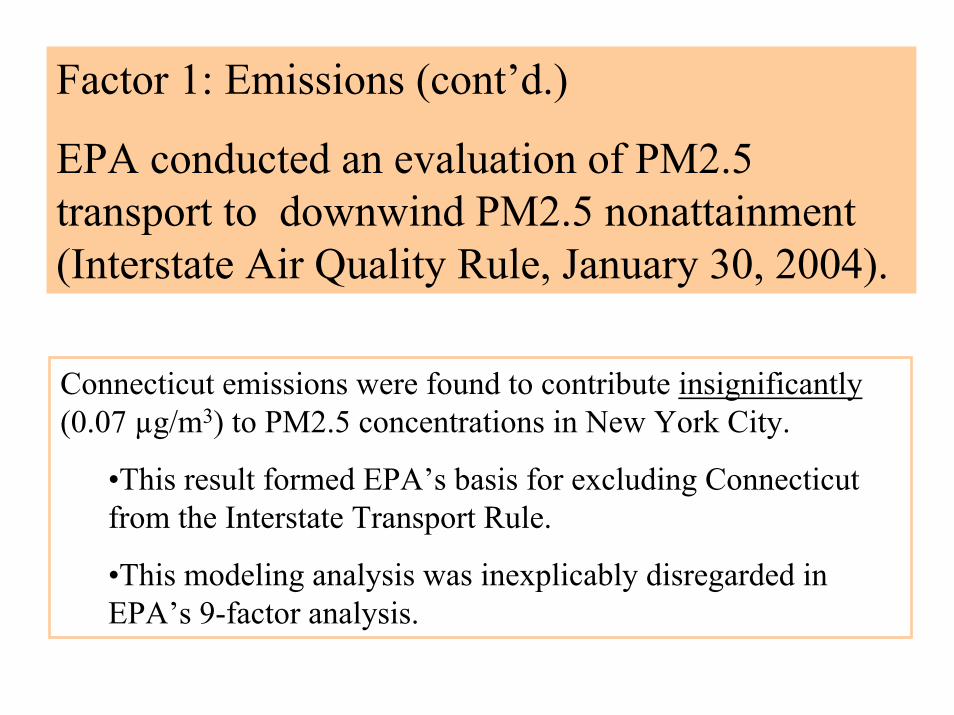
Factor 1: Emissions (cont’d.)
EPA conducted an evaluation of PM2.5 transport to downwind PM2.5 nonattainment (Interstate Air Quality Rule, January 30, 2004).
Connecticut emissions were found to contribute insignificantly(0.07 µg/m3) to PM2.5 concentrations in New York City.
•This result formed EPA’s basis for excluding Connecticut from the Interstate Transport Rule.
•This modeling analysis was inexplicably disregarded in EPA’s 9-factor analysis.
It was stated (Interstate Air Quality Rule, January 30, 2004):
“… that EPA proposes today thatConnecticut contributes significantly to downwind ozone nonattainment, but not to fine particle nonattainment.
Thus, Connecticut would not be subject to an annual NOx control requirement, and is not included in the 28-State and DC region we are proposing for annual controls.”
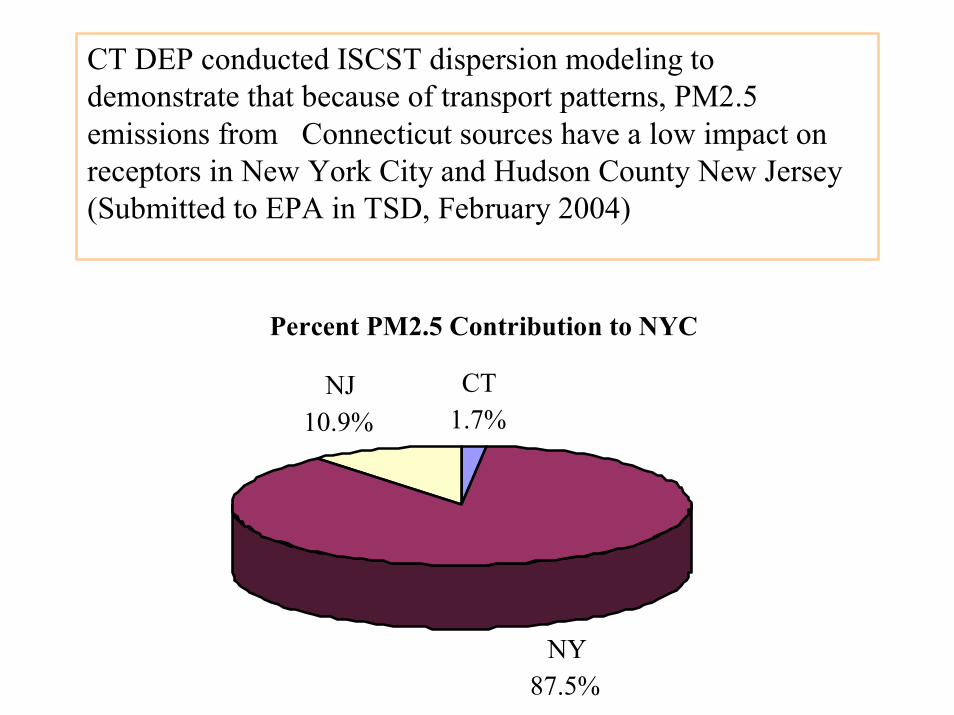
CT DEP conducted ISCST dispersion modeling to demonstrate that because of transport patterns, PM2.5 emissions from Connecticut sources have a low impact on receptors in New York City and Hudson County New Jersey (Submitted to EPA in TSD, February 2004)
Percent PM2.5 Contribution to NYC
CT1.7%
NY87.5%
NJ10.9%
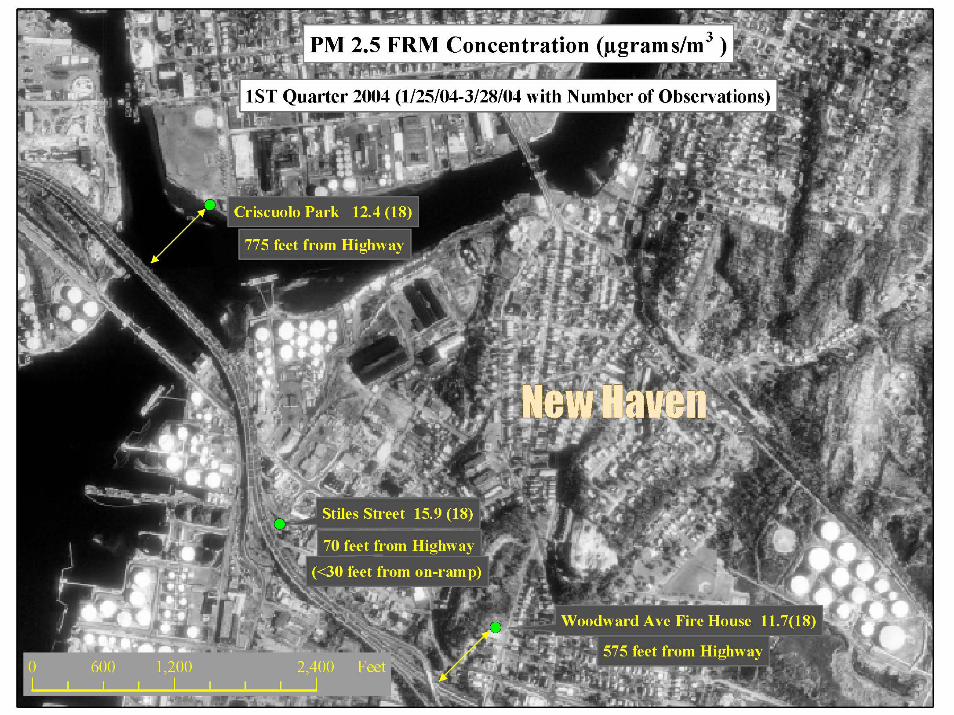
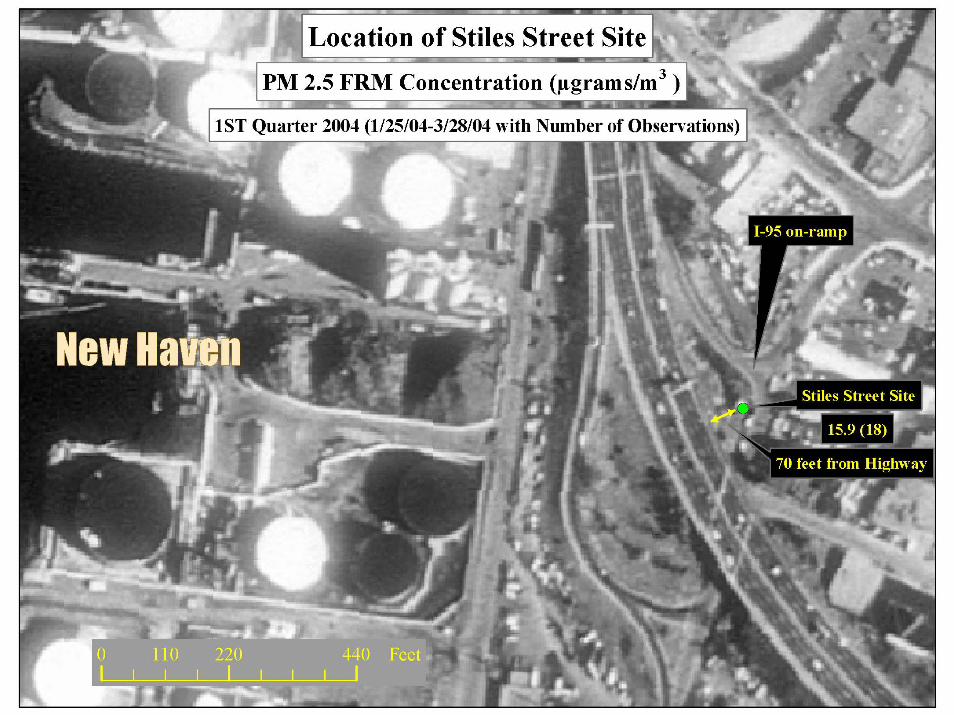
Factor 2: Air QualityCTDEP expanded it’s PM2.5 monitoring
network to assess microscale effects at Stiles Street and community exposure in New Haven.
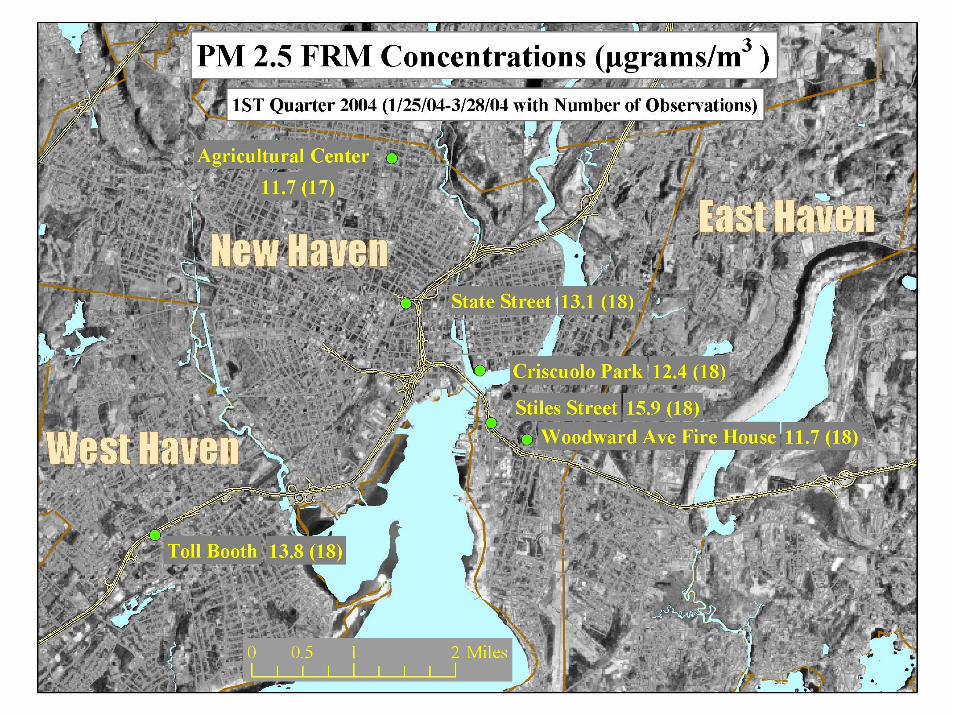
Connecticut has collected new data since the 3rd quarter, 2003. The following aerial photos along with the new data provide further justification that the micro-scale effects around the Stiles Street monitor preclude using these data for nonattainment designation.
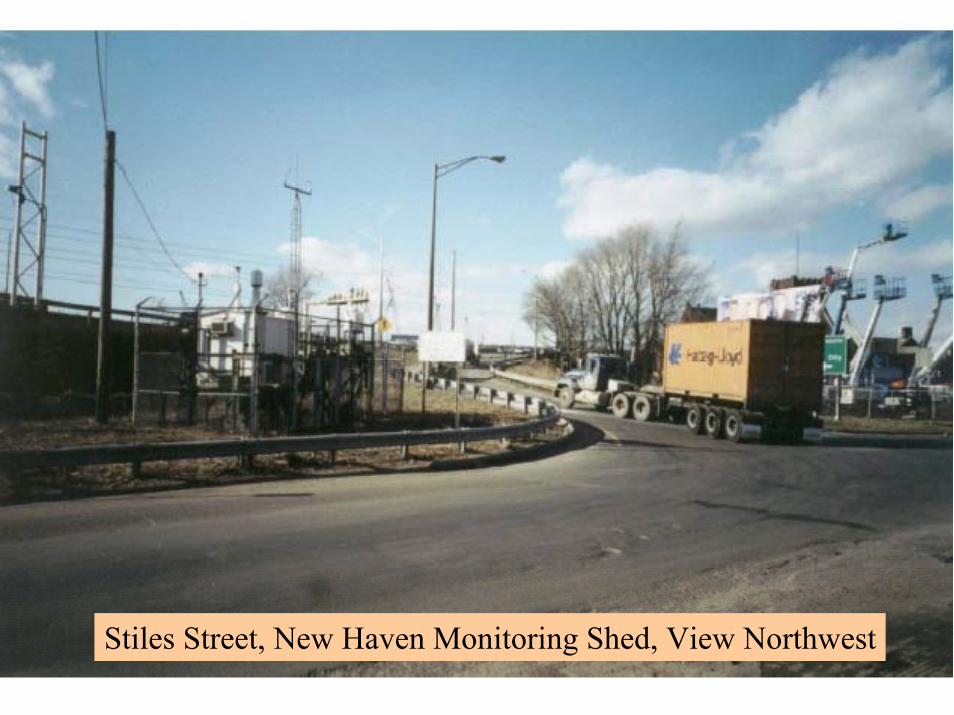
Stiles Street, New Haven Monitoring Shed, View Northwest
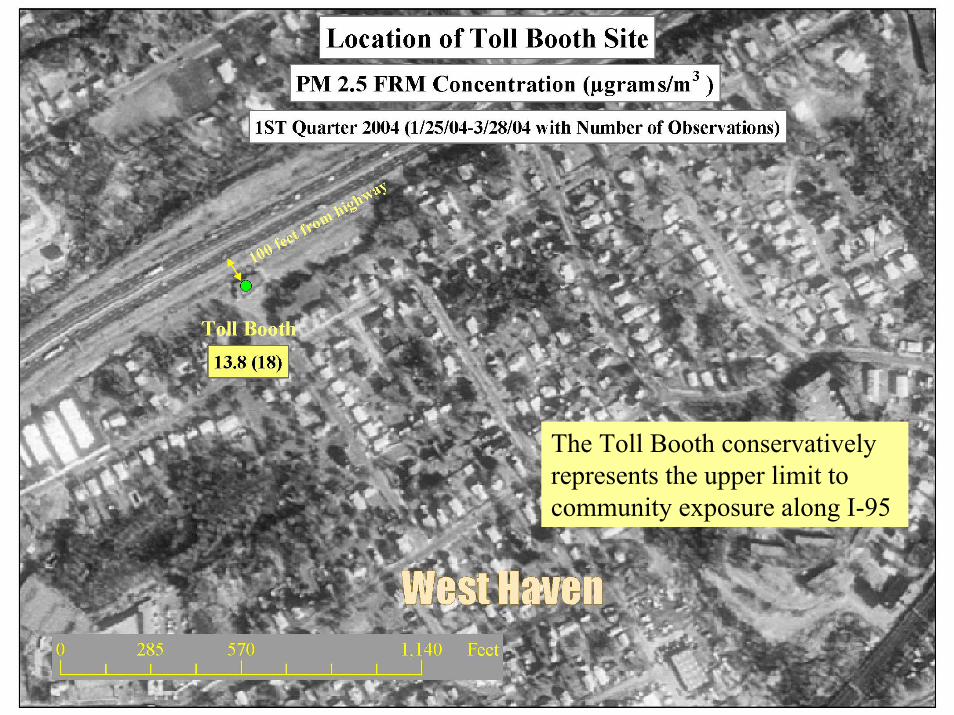
The Toll Booth conservatively represents the upper limit to community exposure along I-95
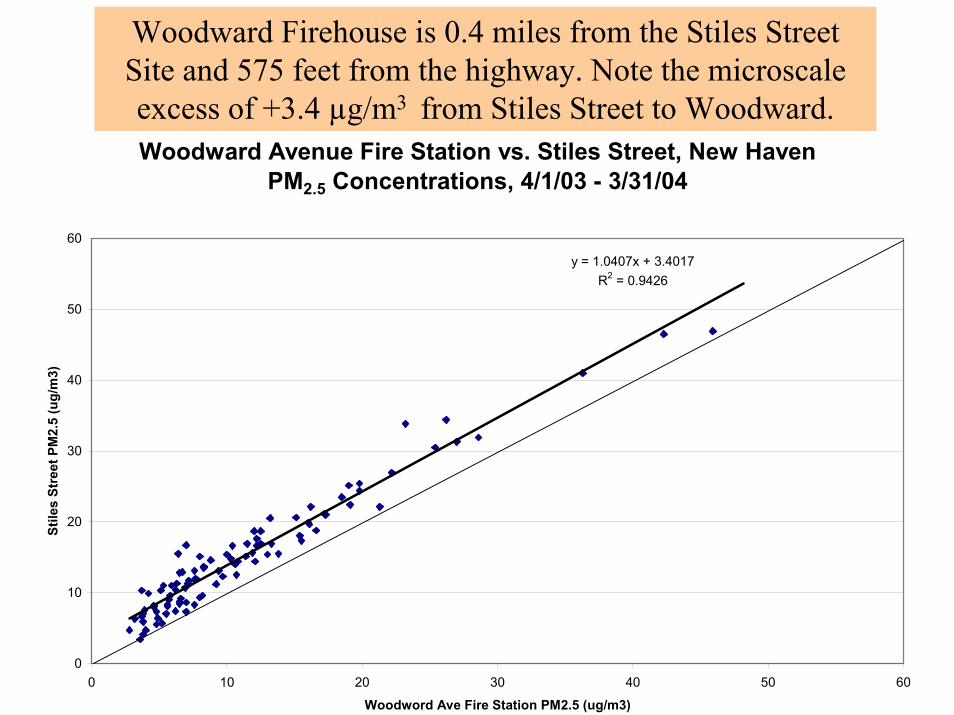
Woodward Avenue Fire Station vs. Stiles Street, New Haven PM2.5 Concentrations, 4/1/03 - 3/31/04
y = 1.0407x + 3.4017R2 = 0.9426
0
10
20
30
40
50
60
0 10 20 30 40 50 60
Woodword Ave Fire Station PM2.5 (ug/m3)
Stile
s St
reet
PM
2.5
(ug/
m3)
Woodward Firehouse is 0.4 miles from the Stiles Street Site and 575 feet from the highway. Note the microscale excess of +3.4 µg/m3 from Stiles Street to Woodward.
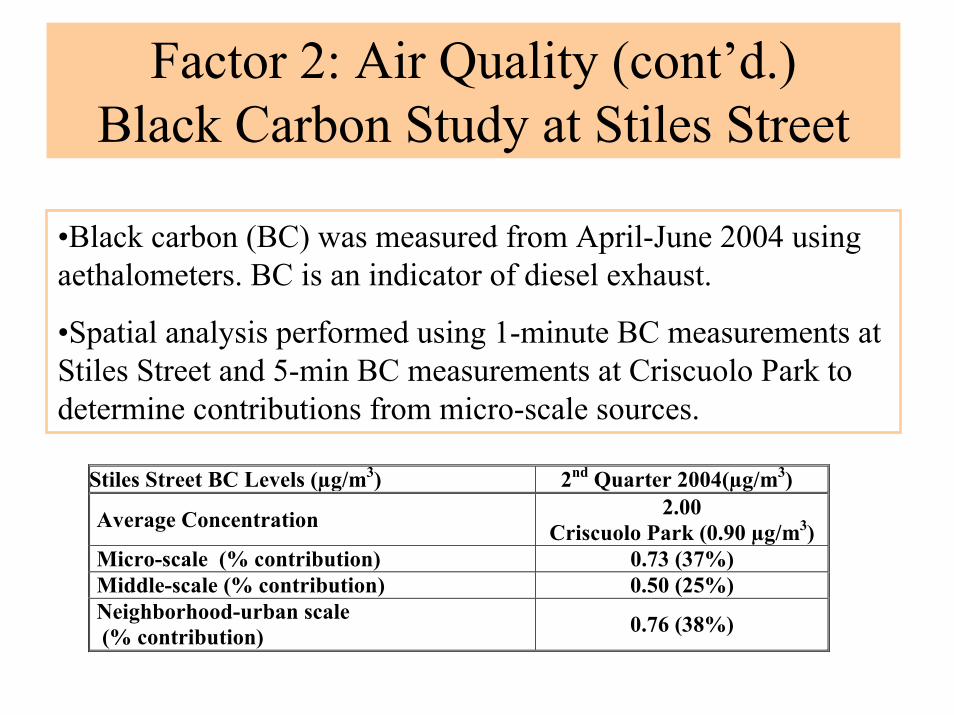
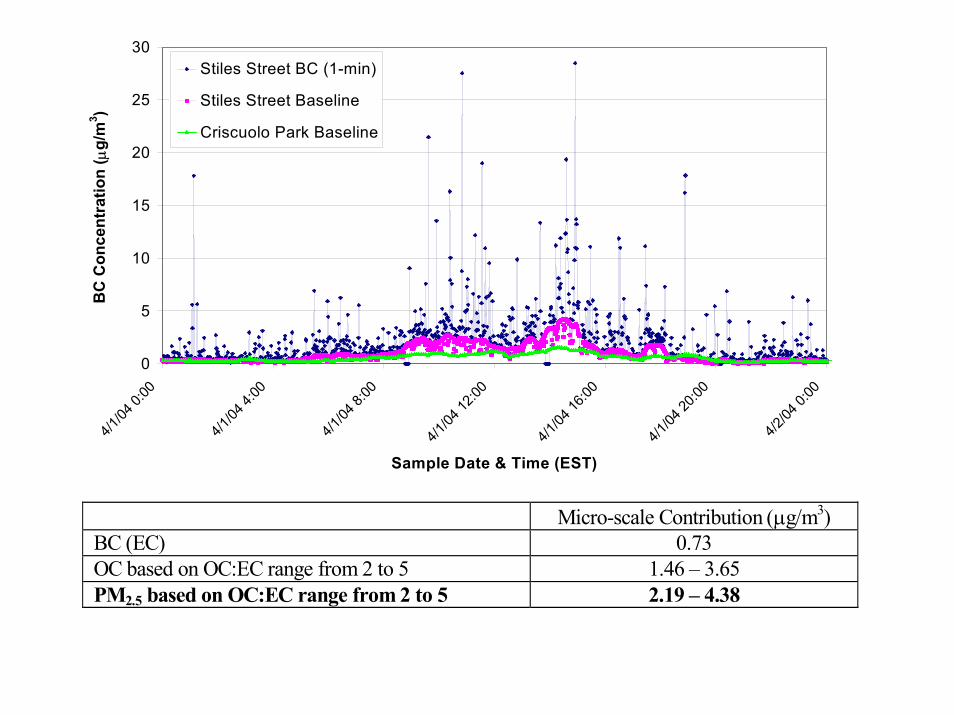
Factor 2: Air Quality (cont’d.)Black Carbon Study at Stiles Street
•Black carbon (BC) was measured from April-June 2004 using aethalometers. BC is an indicator of diesel exhaust.
•Spatial analysis performed using 1-minute BC measurements at Stiles Street and 5-min BC measurements at Criscuolo Park to determine contributions from micro-scale sources.
Stiles Street BC Levels (µg/m3) 2nd Quarter 2004(µg/m3)
Average Concentration 2.00 Criscuolo Park (0.90 µg/m3)
Micro-scale (% contribution) 0.73 (37%) Middle-scale (% contribution) 0.50 (25%) Neighborhood-urban scale (% contribution) 0.76 (38%)
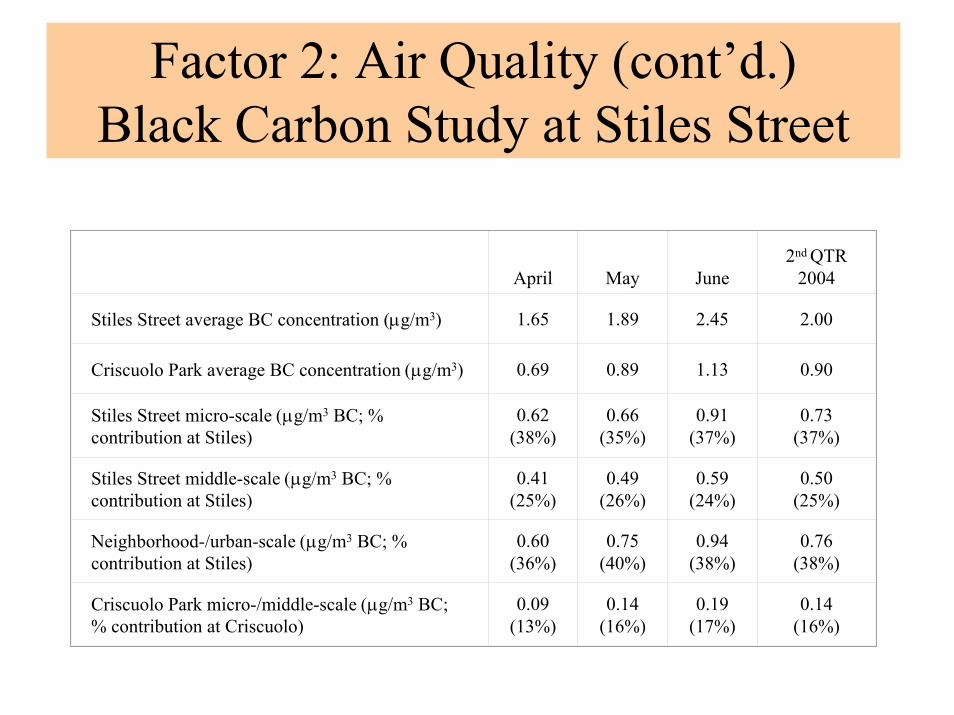
Factor 2: Air Quality (cont’d.)Black Carbon Study at Stiles Street
April May Junend QTR 2004
Stiles Street average BC concentration (µg/m3) 1.65 1.89 2.45 2.00
Criscuolo Park average BC concentration (µg/m3) 0.69 0.89 1.13 0.90
Stiles Street micro-scale (µg/m3 BC; % contribution at Stiles)
0.62 (38%)
0.66 (35%)
0.91 (37%)
0.73 (37%)
Stiles Street middle-scale (µg/m3 BC; % contribution at Stiles)
0.41 (25%)
0.49 (26%)
0.59 (24%)
0.50 (25%)
Neighborhood-/urban-scale (µg/m3 BC; % contribution at Stiles)
0.60 (36%)
0.75 (40%)
0.94 (38%)
0.76 (38%)
Criscuolo Park micro-/middle-scale (µg/m3 BC; % contribution at Criscuolo)
0.09 (13%)
0.14 (16%)
0.19 (17%)
0.14 (16%)
2
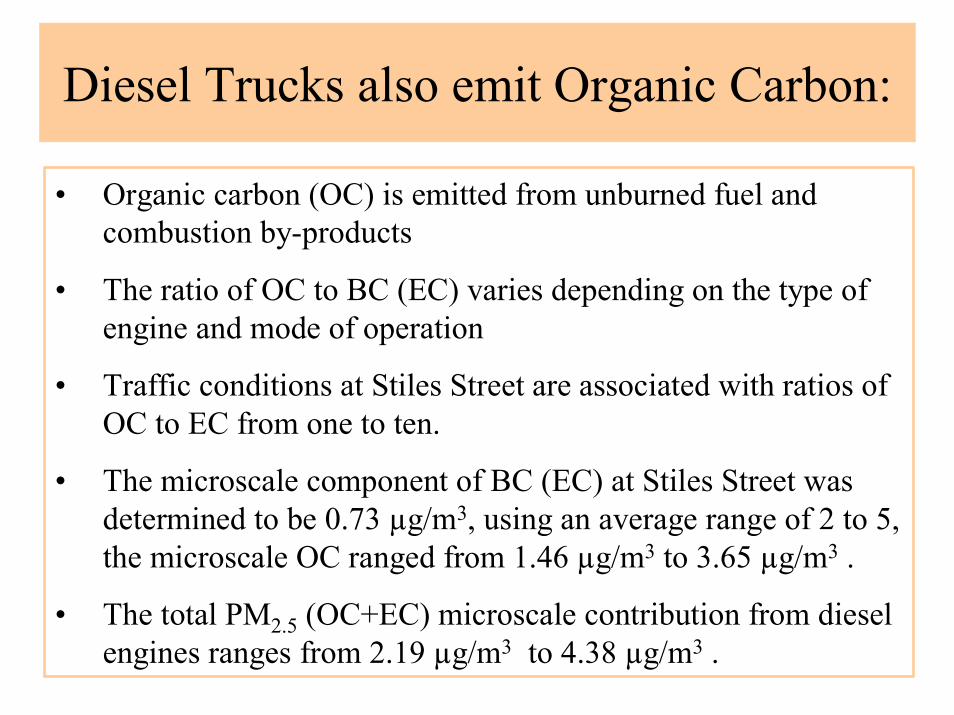
Diesel Trucks also emit Organic Carbon:
• Organic carbon (OC) is emitted from unburned fuel and combustion by-products
• The ratio of OC to BC (EC) varies depending on the type of engine and mode of operation
• Traffic conditions at Stiles Street are associated with ratios of OC to EC from one to ten.
• The microscale component of BC (EC) at Stiles Street was determined to be 0.73 µg/m3, using an average range of 2 to 5, the microscale OC ranged from 1.46 µg/m3 to 3.65 µg/m3 .
• The total PM2.5 (OC+EC) microscale contribution from diesel engines ranges from 2.19 µg/m3 to 4.38 µg/m3 .
0
5
10
15
20
25
30
4/1/04
0:00
4/1/04
4:00
4/1/04
8:00
4/1/04
12:00
4/1/04
16:00
4/1/04
20:00
4/2/04
0:00
Sample Date & Time (EST)
BC
Con
cent
ratio
n ( µ
g/m
3 )
Stiles Street BC (1-min)
Stiles Street Baseline
Criscuolo Park Baseline
Micro-scale Contribution (µg/m3) BC (EC) 0.73 OC based on OC:EC range from 2 to 5 1.46 – 3.65 PM2.5 based on OC:EC range from 2 to 5 2.19 – 4.38
These estimated PM2.5 contributions from micro-scale diesel sources is consistent with
the differences in the PM2.5 measurements observed between Stiles Street and the other New
Haven Sites.
Factors 3 and 4:
Population Density, Traffic and Commuting Patterns
• Population densities and intercounty commuting rates of Fairfield and New Haven counties are much less than NYC
• CT accounts for only 0.9% of work-trip commutes into NYC
• SW CT has relatively high levels of transit use
• Truck shipments from CT accounted for <0.5% (by weight) of shipments into NY State
Factor 5: Expected Growth
• EPA concluded that Fairfield and New Haven counties had a low population growth between 1990-2000
• All of CT’s counties are subject to the ozone transportation conformity in which VMT growth is constrained by emissions budgets.
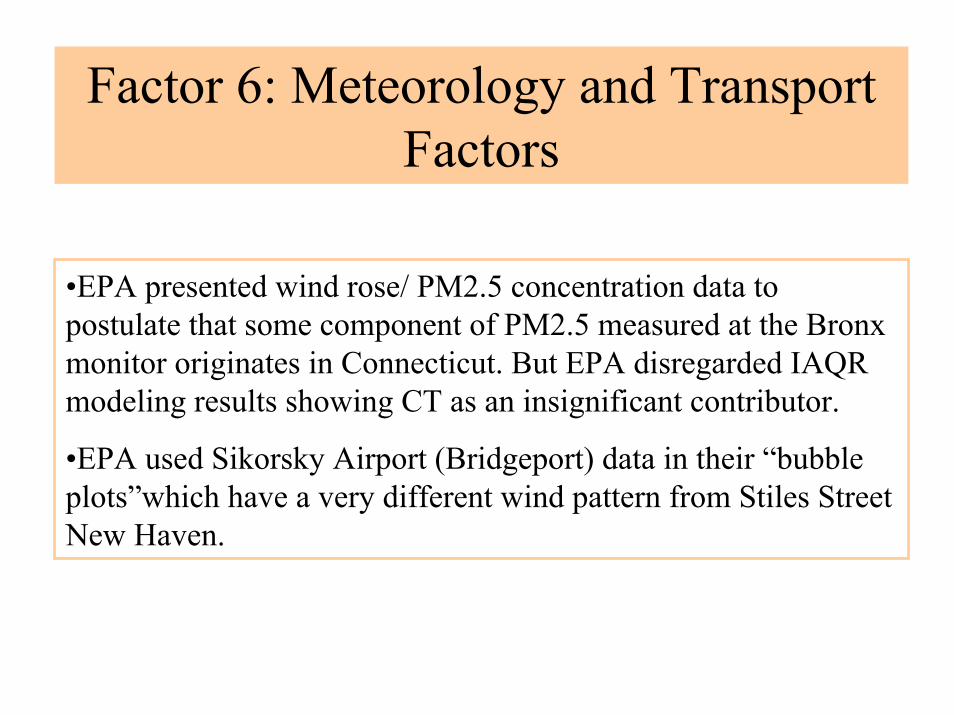
Factor 6: Meteorology and Transport Factors
•EPA presented wind rose/ PM2.5 concentration data to postulate that some component of PM2.5 measured at the Bronx monitor originates in Connecticut. But EPA disregarded IAQR modeling results showing CT as an insignificant contributor.
•EPA used Sikorsky Airport (Bridgeport) data in their “bubble plots”which have a very different wind pattern from Stiles Street New Haven.
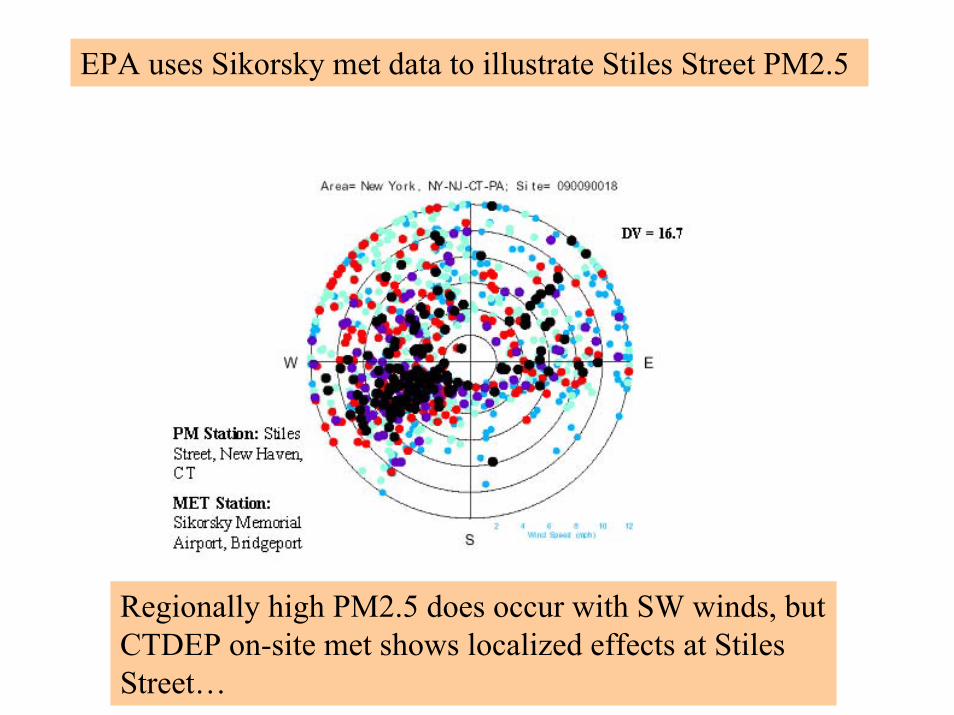
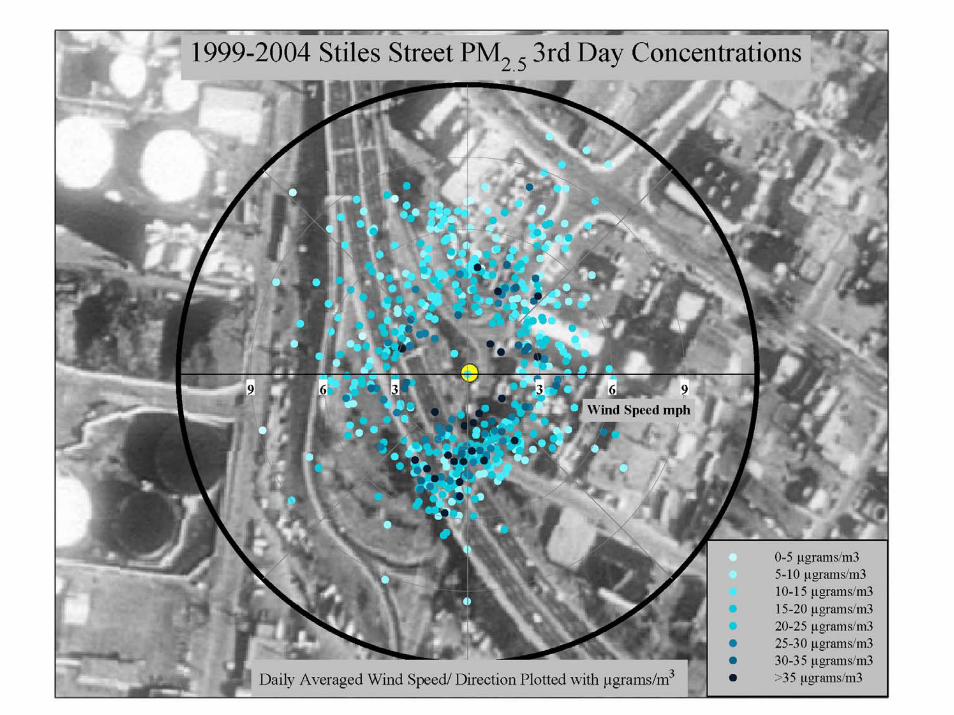
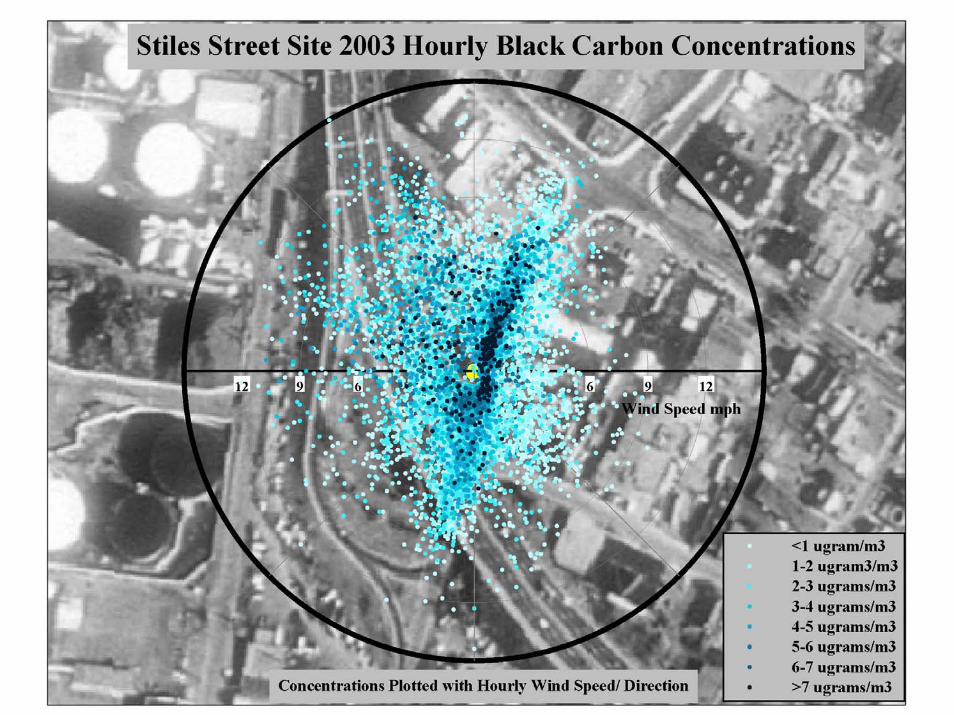
EPA uses Sikorsky met data to illustrate Stiles Street PM2.5
Regionally high PM2.5 does occur with SW winds, but CTDEP on-site met shows localized effects at Stiles Street…
Factor 7: Geography and Topography
• Sea breezes and elevated highway alignment can affect the local transport of PM2.5.
• These factors are considered small from a regional perspective.
Factor 8:Jurisdictional Boundaries• EPA, in their June 29, 2004 letter, stated that CT counties arecontributing to the nonattainment monitors around NYC
• However, EPA and CTDEP modeling demonstrate that CT is not contributing to these monitors
• CTDEP does not believe any weight should be given to EPA’s assertion
Factor 9: Level of Control of Emission Sources
• CT adopted stringent power plant SO2 limits in 2003 (.33 lb SO2 /mmbtu)
CT will continue adopting plans to lower PM2.5:
• School bus retrofits/fuels (Norwich, New Haven)
• Off-road construction equipment retrofits/fuels
• Possible truck retrofit/fuel program
• Enhanced I/M program
CONCLUSIONCT DEP has demonstrated that
•The New Haven community is not being exposed to PM2.5>NAAQS
• Stiles Street has excess micro-scale PM2.5 due primarily to diesel trucks on the entrance ramp, and thus the site should not be used to determine attainment for the annual PM2.5 standard
• EPA and CTDEP transport modeling show that CT emissions are not contributing significantly to the violating monitors in NYC & NJ
Therefore
All of Connecticut should be designated as attainment for PM2.5