Conducted for Shell Exploration and Production Co. at the ... · Report on the Air Emissions Test...
108
Report on the Air Emissions Test Program Conducted for Shell Exploration and Production Co. at the Its Facility Located in Pinedale, Wyoming Report No. 4412 November 4, 2013
Transcript of Conducted for Shell Exploration and Production Co. at the ... · Report on the Air Emissions Test...

Report on the Air Emissions Test Program
Conducted for Shell Exploration and Production Co. at the Its Facility Located in Pinedale, Wyoming
Report No. 4412
November 4, 2013

Shell Exploration and Production Co. Project No. 4412 Page 1
Table of Contents PROJECT OVERVIEW ............................................................................................................................... 2
General ........................................................................................................................................................ 2 Methodology ................................................................................................................................................ 2 Parameters .................................................................................................................................................. 4 Results ......................................................................................................................................................... 4
SUMMARY OF RESULTS .......................................................................................................................... 5
Table 1 – Summary of Destruction Efficiency and VOC Results................................................................. 5
TEST PROCEDURES .................................................................................................................................. 6
Method Listing ............................................................................................................................................. 6 Method Descriptions ................................................................................................................................... 6
EPA Method 1 .......................................................................................................................................................... 6 EPA Method 2 .......................................................................................................................................................... 6 EPA Method 2A ....................................................................................................................................................... 7 EPA Method 3 .......................................................................................................................................................... 7 EPA Method 4 .......................................................................................................................................................... 7 EPA Method 18 ........................................................................................................................................................ 8 EPA Method 22 ........................................................................................................................................................ 9 EPA Method 25A ..................................................................................................................................................... 9
APPENDIX
Figures Sample Calculations Parameters Field Data Printouts Field Data Analyzer Data Laboratory Data Calibration Data Process Data

Shell Exploration and Production Co. Project No. 4412 Page 2
Project Overview
General
Airtech Environmental Services Inc. was contracted by Shell Exploration and Production Co. (Shell) to perform an air emissions test program on one (1) combustor. The combustor was located at the Shell facility located in Pinedale, Wyoming. The specific objectives of the test program were as follows:
Determine the concentration of total volatile organic compounds (VOC) from the exhaust of one combustor
Determine the control efficiency (destruction efficiency) of one combustor
Testing was conducted to meet the requirements of Shell, J.W. Williams, and 40 CFR Part 63, Subpart OOOO. VOC and destruction efficiency results were compared to the emissions limits from 40 CFR Part 63, Subpart OOOO:
Constituent OOOO Limit Destruction Efficiency (%)
VOC 95
Constituent OOOO Limit (ppm@3%O2)
VOC 20
Testing was performed on October 16, 2013. Coordinating the field portion of the test program were:
Chuck Cornell – Shell Exploration & Production Co.
Blake Simburger – Airtech Environmental Services Inc.
Methodology
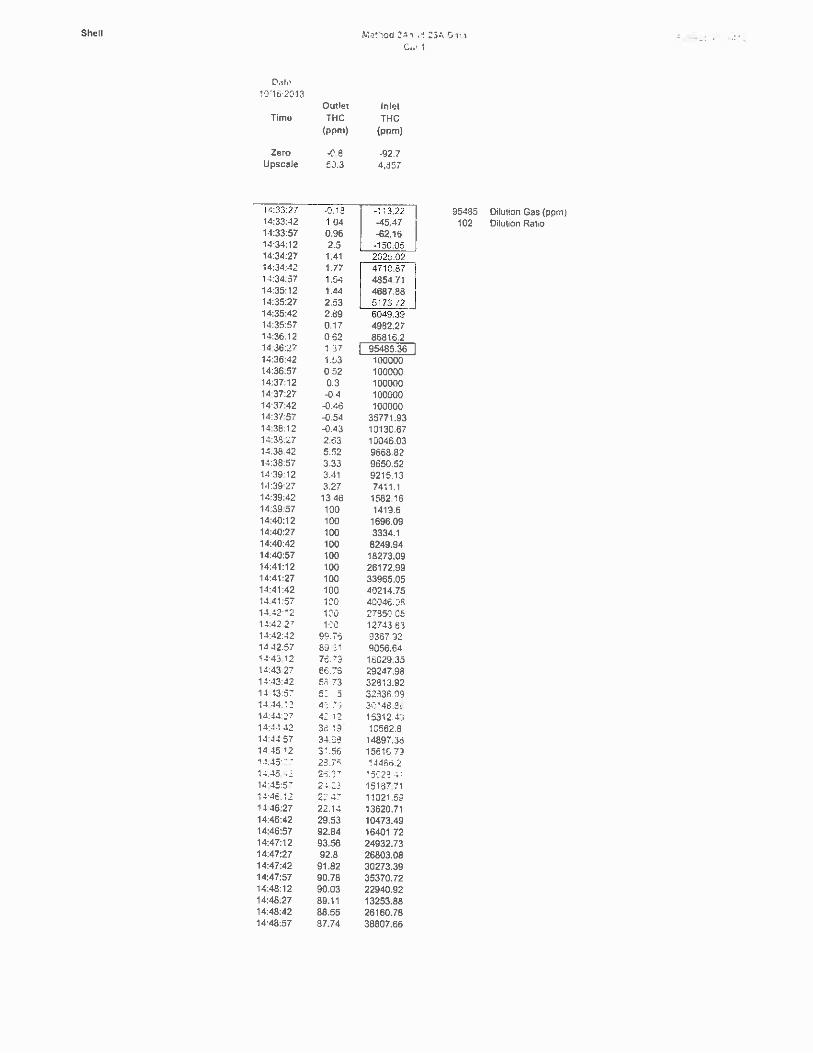
A determination of visible emissions from the test location was determined using EPA Method 22. In Method 22, an observer viewed the exhaust of the enclosed combustor for a period of two (2) hours and recorded the duration of any visible emissions. Visible emissions were less than five (5) minutes in duration. The total hydrocarbon (THC) concentration at the inlet and outlet of the combustor was determined using EPA Method 25A. In Method 25A a sample of the gas stream was withdrawn from the test location at a constant rate through a heated Teflon sample line. The sample gas then passed directly into a Flame Ionization Analyzer (FIA). At the flare

Shell Exploration and Production Co. Project No. 4412 Page 3
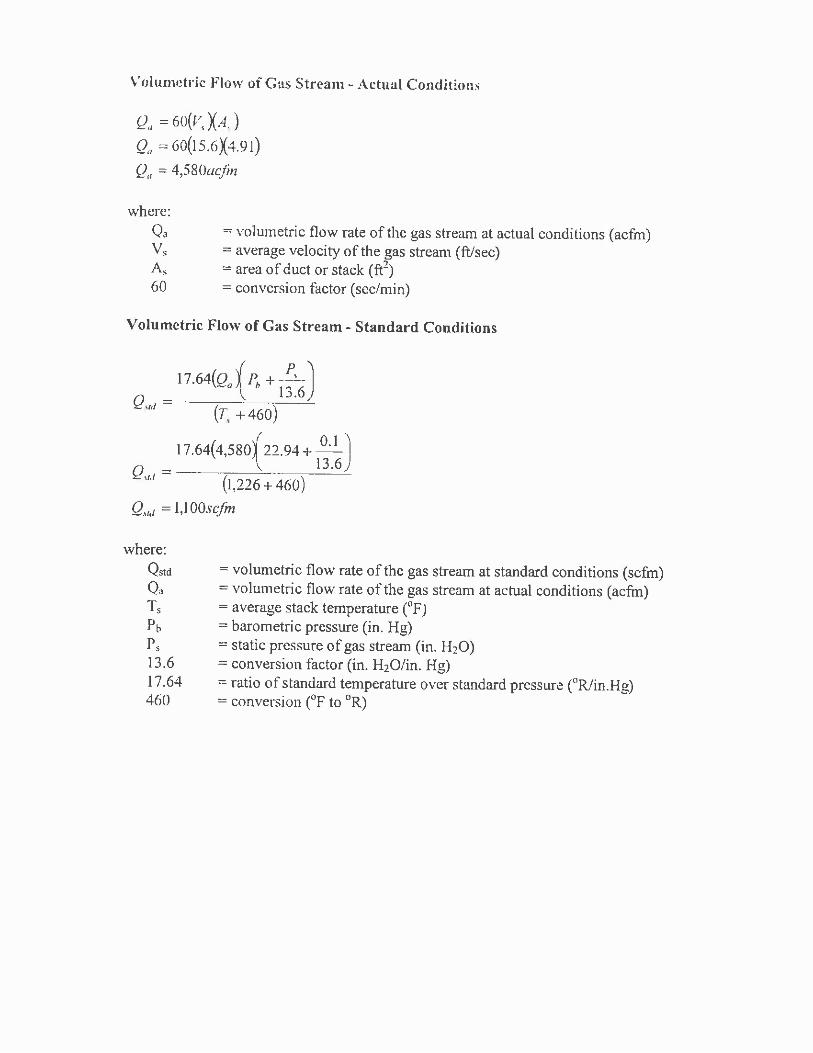
inlet, where high concentrations of THC were expected, a dilution sampling system was used. Because methane and ethane are included with Method 25A and are exempt VOCs, the methane and ethane concentrations were determined using EPA Method 18. The methane and ethane emission rates were subtracted from the THC emission rates to give a total non-methane/ethane THC or VOC emission rate. Analysis for methane and ethane was performed on-site using Gas Chromatography (GC) coupled with a Flame Ionization Detector (FID). To convert the concentrations of the methane, ethane, and total VOC to mass emission rates at the flare inlet, the volumetric gas flow rate was recorded using EPA Method 2A using an Actarus Dattus flow meter. To convert the methane, ethane, and total VOC concentrations at the flare outlet to mass emission rates, the volumetric flow rate was determined using EPA Method 2. Three (3) sixty-minute test runs were performed to satisfy the performance test requirements of Subpart OOOO.

Shell Exploration and Production Co. Project No. 4412 Page 4
Parameters
The following parameters were determined at each test location, except as noted:
gas velocity
gas temperature
moisture concentration (combustor outlet only)
oxygen concentration (combustor outlet only)
carbon dioxide concentration (combustor outlet only)
gas volumetric flow rate
methane concentration
ethane concentration
total hydrocarbon concentration
specific HAP concentrations (combustor outlet only)
visual emissions (combustor outlet only)
Results
A complete summary of test results is presented in Table 1 on Page 5. The dilution ratio for pollutants measured at the combustor inlet was determined by introducing a 10% propane standard through the dilution system and calculating a dilution ratio by comparing the measured results to the value specified by the gas standard. This procedure was performed before and after each test run. No visible emissions were observed throughout the test program.
Prepared by: Reviewed by:
Chet Gutwein Timothy Wojtach, QSTI

Shell Exploration and Production Co. Project No. 4412 Page 5
Summary of Results
Table 1 – Summary of Destruction Efficiency and VOC Results
Test Parameters Run 1 Run 2 Run 3 Average
Date 10/16/13 10/16/13 10/16/13
Start Time 13:33 15:01 16:27
Stop Time 14:33 16:01 17:27
Inlet Emissions THC Concentration (ppmwv) 95,936 132,320 122,127 116,794
THC Emission Rate (lb/hr) 2.23 3.38 3.06 2.89
Methane Concentration (ppmwv) 22,049 20,248 23,145 21,814
Methane Emission Rate (lb/hr) 0.186 0.188 0.211 0.195
Ethane Concentration (ppmwv) 246 180 217 214
Ethane Emission Rate (lb/hr) 0.00389 0.00313 0.00371 0.00358
TNMNEHC Emission Rate (lb/hr) 2.04 3.18 2.84 2.69
Outlet Emissions THC Concentration (ppmwv) 0.77 <0.050 1.33 0.717
THC Concentration (ppmdv) 0.83 <0.055 1.48 0.790
THC Concentration (ppmdv@3%O2) 2.66 <0.135 2.95 1.92
THC Emission Rate (lb/hr) 0.00578 <0.000480 0.0138 0.00668
Methane Concentration (ppmwv) ND ND ND ND
Methane Emission Rate (lb/hr) ND ND ND ND
Ethane Concentration (ppmwv) ND ND ND ND
Ethane Emission Rate (lb/hr) ND ND ND ND
TNMNEHC Emission Rate (lb/hr) 0.00578 <0.000480 0.0138 0.00668
Destruction Efficiency (%) 99.7 100.0 99.5 99.7

Shell Exploration and Production Co. Project No. 4412 Page 6
Test Procedures
Method Listing
The following test methods were referenced for the test program. These methods can be referenced in 40 CFR, Part 60, Appendix A.
Method 1 Sample and Velocity Traverses for Stationary Sources
Method 2 Determination of Stack Gas Velocity and Volumetric Flow Rate (Type S Pitot Tube)
Method 2A Direct Measurement of Gas Volume through Pipes and Small Ducts
Method 3 Gas Analysis for the Determination of Dry Molecular Weight
Method 4 Determination of Moisture Content in Stack Gases
Method 18 Measurement of Gaseous Organic Compounds Emissions by Gas Chromatography
Method 22 Visual Determination of Fugitive Emissions from Material Sources and Smoke Emissions from Flares
Method 25A Determination of Total Gaseous Organic Concentration Using a Flame Ionization Analyzer
Method Descriptions
EPA Method 1
EPA Method 1 was used to determine the suitability of the combustor outlet test location and to determine the traverse points used for the velocity determination. The test location conformed to the minimum EPA Method 1 requirements of being located at least two diameters downstream and at least 0.5 diameters upstream from the nearest flow disturbances. The combustor inlet test location was a round, vertical stack that had an inside diameter of 30 inches. Six (6) sample points in each of two (2) ports were sampled for a total of twelve (12) points. A cross-section of the combustor outlet test location can be found in Figure 1 of the Appendix.
EPA Method 2
EPA Method 2 was used to determine the gas velocity through the combustor outlet test location, using a type S pitot tube and an incline plane oil manometer. The manometer was leveled and “zeroed” prior to each test run. The sample train was leak checked before and after each run by pressurizing the positive side, or “high” side, of the pitot tube and creating a deflection on the manometer equal to at least three (3) inches of water (in. H2O). The leak check was considered valid if the manometer remained stable for a minimum of fifteen (15) seconds. The velocity head pressure and gas temperature were

Shell Exploration and Production Co. Project No. 4412 Page 7
then determined at each point specified in Method 1. The static pressure of the stack was measured using a water filled U-tube manometer. In addition, the barometric pressure was measured and recorded. The values measured in Method 2 along with the measurements made in Methods 3 and 4 were used to calculate the volumetric flow rate through the combustor outlet test location. A diagram of the Method 2 apparatus is shown in Figure 2 of the Appendix.
EPA Method 2A
EPA Method 2A was used to determine the volumetric flow rate at the combustor inlet test location. In EPA Method 2A, an Actaris Dattus flow meter, which is a volume type meter, was connected in-line with the inlet piping to the combustor. The meter works on the fluidic oscillation principle. Sample gas is vented through jets in the meter which cause the gas to oscillate. The frequency of the oscillations is measured by thermal sensors. The volume of gas is determined by measuring the number of oscillations detected by the sensors. Three (3) sixty-minute test runs were performed at the combustor inlet test location. Results are recorded in actual cubic feet per minute (acfm) and standard cubic feet per minute (scfm).
EPA Method 3
The carbon dioxide and oxygen concentrations at the combustor outlet were determined using procedures found in EPA Method 3. For Method 3, a gas sample was collected into a Tedlar bag from the back of the moisture sample train for the duration of each test run. Analysis was performed using Servomex 1440 paramagnetic oxygen gas analyzer and a Servomex 1440 infrared carbon dioxide analyzer. The Method 3 sample train is shown in Figure 4 of the Appendix, as part of the moisture sampling train. The carbon dioxide content and oxygen concentrations in the sample gas were used to calculate the dry molecular weight of the gas stream. The molecular weight was then used, along with the moisture content determined by EPA Method 4, for the calculation of the volumetric flow rate. For these calculations the balance of the gas stream was assumed to be nitrogen since the other gas stream components are insignificant for the purposes of calculating molecular weight.
EPA Method 4
The moisture content at each test location was determined using EPA Method 4. The moisture content was used to calculate the molecular weight of the gas stream and the gas volumetric flow rate. In Method 4, a sample of stack gas was withdrawn from the source, the moisture condensed, and the quantity of moisture determined volumetrically and gravimetrically. To condense the water vapor the gas sample passed through a series of four (4) impingers. The first two (2) impingers each contained 100 ml of water. The third impinger was initially empty and the fourth contained a known weight of silica gel to absorb any remaining water vapor. A diagram of the EPA Method 4 sample apparatus is shown in Figure 3 of the Appendix.

Shell Exploration and Production Co. Project No. 4412 Page 8
The sample train was leak checked prior to the test run by capping the probe tip and pulling a vacuum greater than the highest vacuum expected during the test run. A leak check was considered valid if the leak rate was below 0.02 cubic feet per minute (cfm). Sample was withdrawn from the source at a rate such that a minimum sample volume of twenty-one (21) dry standard cubic feet (dscf) was collected. The volume of dry gas exiting the gas condenser system was measured with a dry gas meter. The gas meter reading, gas meter inlet and outlet temperatures, gas meter static pressure and pump vacuum were recorded every five (5) minutes during each test run. After the test run the train was leak checked at the highest vacuum encountered during the test run. The amount of water gain in the condenser system was measured volumetrically with a graduated cylinder and the silica gel weight gain was determined gravimetrically.
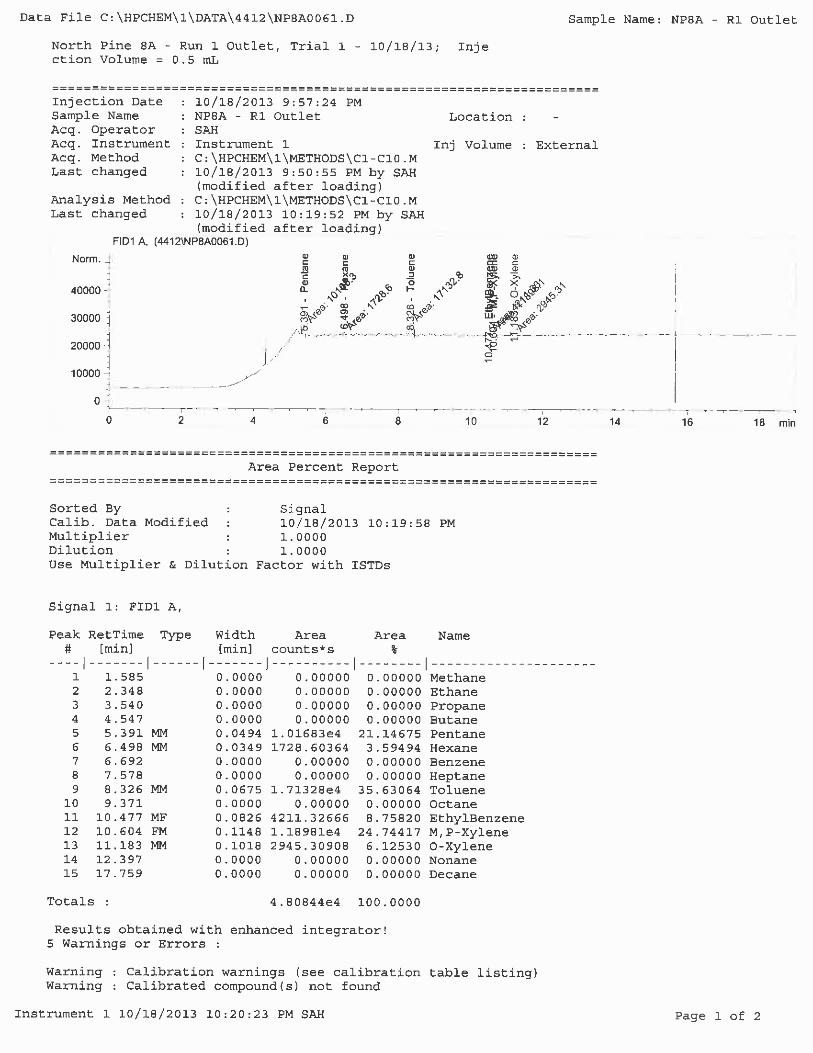
EPA Method 18
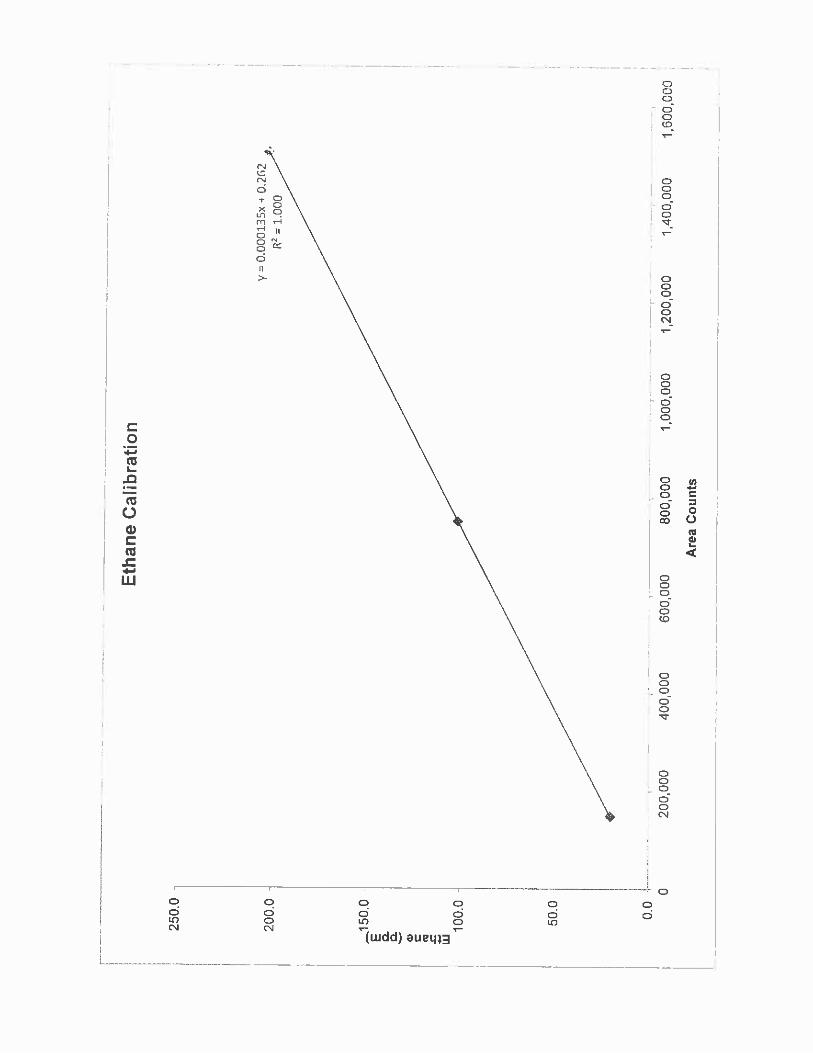
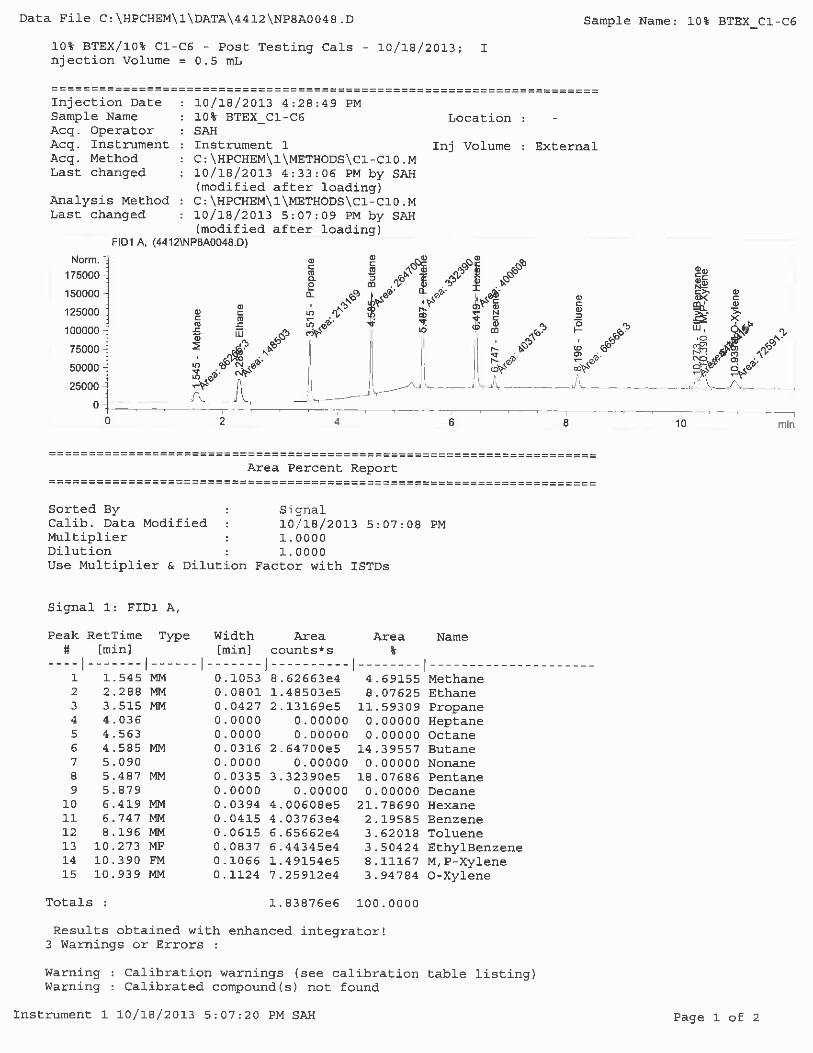
The Integrated Gas Sample (IGS) bag methodology of EPA Method 18 was used to determine the concentrations of methane and ethane at the test location. In Method 18, a sample of the gas stream was withdrawn from the source and a portion of the sample was injected into a Hewlett Packard 5890 Gas Chromatograph (GC) using a heated sample valve. The sample was separated using a GC and quantified using a Flame Ionization Detector (FID). The individual components of the gas sample were separated using a HP Plot-Q column. Nitrogen was used as a carrier to pass the sample through the column. After exiting the column, the separated sample components, along with the carrier gas, passed through the FID. The output of the FID was monitored using HP Chemstation computer integration software. The retention time and area of each peak was determined by the software. The identity of each peak was determined by comparing the retention time of the sample peak with the retention time determined by analyzing known standards. The GC was calibrated using certified standards that contain known concentrations of methane and ethane. Gas standards were supplied by a qualified gas vendor and were diluted to lesser concentrations using a gas tight syringe and inert sample bags. A minimum of three (3) standards of different concentrations were prepared and analyzed. The standards were prepared such that they bracketed the expected concentration at the test location. Methane and ethane calibration standards were made up of 1:1, 1:2, and 1:10 dilutions of its certified calibration gas. Results of each compound were calculated by comparing the areas of the standards to the area of the gas sample using linear regression analysis or an average response factor. Results were expressed in parts per million (ppm). A recovery study was performed by sending the 1:1 ethane calibration gas standard to the probe tip through the valve assembly and analyzing the gas sample. The results of the recovery study were within the method required of +/- 10% of the known gas value.

Shell Exploration and Production Co. Project No. 4412 Page 9
A post test calibration was performed on the GC. The calibration gas value was compared to the result from the analysis conducted prior to testing. The GC drift was within five percent (5%) of the initial calibration value for every target compound.
EPA Method 22
The amount of time that visible emissions were observed from the combustor was determined using EPA Method 22. An observation site was chosen where the sun was not directly in the observer’s eyes. Two stopwatches were used during the observation period. One stopwatch was used to monitor the duration of the observation period. The second stopwatch was actuated whenever visible emissions were observed from the emissions source and stopped whenever the emissions ceased. Three (3) twenty minute runs were performed. Emission results were reported as accumulated emission time in seconds and also as a percentage of total observation time.
EPA Method 25A
The total hydrocarbon concentration at each test location was determined using EPA Method 25A. In Method 25A, a sample of the gas stream is withdrawn from the test location at a constant rate through a Teflon sample line. At the combustor inlet test location, the sample was diluted at a ratio of approximately 100:1 to measureable concentrations using a dilution sampling system. At the combustor outlet test location, the sample line was heated to prevent condensation of water vapor or organics. The sample gases then passed directly into a Flame Ionization Analyzer (FIA). Zero hydrogen was used to fuel the instrument. Zero air and EPA Protocol calibration gases of propane in nitrogen were used for all calibration checks. The analyzer used for Method 25A is listed below:
Parameter Manufacturer Model Number
Operating Principle
Units Reported
Range used
Total Hydrocarbons
(inlet)
JUM 3-500 flame ionization
ppmwv 0-10,000
Total Hydrocarbons
(outlet)
JUM 3-500 flame ionization
ppmwv 0-1,000
Prior to sampling a calibration error test was performed. The zero gas and high level gas were introduced to the analyzers at the probe tip through the calibration valve assembly and the analyzers set to the appropriate levels. The mid and low level gases were also introduced to the analyzers and the predicted response compared to the actual response of the analyzers. The difference was less than the minimum requirement of five percent

Shell Exploration and Production Co. Project No. 4412 Page 10
(5%) of the calibration gas value. After each test run the instrument drift was determined by introducing the zero gas and one calibration gas at the probe tip through the calibration valve assembly while making no adjustments to the analyzers. For all test runs the drift was less than the maximum requirement of three percent (3%) of the span value. The Method 25A sampling apparatus is shown in Figures 4 and 5 of the Appendix.