
Condition Monitoring Knjiga
307
-
Upload
carbservice -
Category
Documents
-
view
223 -
download
0
Transcript of Condition Monitoring Knjiga

8/20/2019 Condition Monitoring Knjiga
http://slidepdf.com/reader/full/condition-monitoring-knjiga 1/306

8/20/2019 Condition Monitoring Knjiga
http://slidepdf.com/reader/full/condition-monitoring-knjiga 2/306
IET POWER AND ENERGY SERIES 56
Condition Monitoringof Rotating Electrical
Machines

8/20/2019 Condition Monitoring Knjiga
http://slidepdf.com/reader/full/condition-monitoring-knjiga 3/306
Other volumes in this series:
Volume 1 Power circuit breaker theory and design C.H. Flurscheim (Editor)Volume 4 Industrial microwave heating A.C. Metaxas and R.J. MeredithVolume 7 Insulators for high voltages J.S.T. Looms
Volume 8 Variable frequency AC motor drive systems D. Finney Volume 10 SF6 switchgear H.M. Ryan and G.R. JonesVolume 11 Conduction and induction heating E.J. DaviesVolume 13 Statistical techniques for high voltage engineering W. Hauschild and W. MoschVolume 14 Uninterruptible power supplies J. Platts and J.D. St Aubyn (Editors)Volume 15 Digital protection for power systems A.T. Johns and S.K. SalmanVolume 16 Electricity economics and planning T.W. BerrieVolume 18 Vacuum switchgear A. GreenwoodVolume 19 Electrical safety: a guide to causes and prevention of hazards J. Maxwell
AdamsVolume 21 Electricity distribution network design, 2nd edition, E. Lakervi and E.J. HolmesVolume 22 Artificial intelligence techniques in power systems K. Warwick, A.O. Ekwue and
R. Aggarwal (Editors)Volume 24 Power system commissioning and maintenance practice K. HarkerVolume 25 Engineers’ handbook of industrial microwave heating R.J. MeredithVolume 26 Small electric motors H. Moczala et al.
Volume 27 AC–DC power system analysis J. Arrillaga and B.C. SmithVolume 29 High voltage direct current transmission, 2nd edition J. ArrillagaVolume 30 Flexible AC Transmission Systems (FACTS) Y-H. Song (Editor)Volume 31 Embedded generation N. Jenkins et al.
Volume 32 High voltage engineering and testing, 2nd edition H.M. Ryan (Editor)Volume 33 Overvoltage protection of low-voltage systems, revised edition P. HasseVolume 34 The lightning flash V. Cooray Volume 35 Control techniques drives and controls handbook W. Drury (Editor)
Volume 36 Voltage quality in electrical power systems J. Schlabbach et al.Volume 37 Electrical steels for rotating machines P. Beckley Volume 38 The electric car: development and future of battery, hybrid and fuel-cell cars
M. Westbrook Volume 39 Power systems electromagnetic transients simulation J. Arrillaga and N.
WatsonVolume 40 Advances in high voltage engineering M. Haddad and D. WarneVolume 41 Electrical operation of electrostatic precipitators K. ParkerVolume 43 Thermal power plant simulation and control D. FlynnVolume 44 Economic evaluation of projects in the electricity supply industry H. KhatibVolume 45 Propulsion systems for hybrid vehicles J. MillerVolume 46 Distribution switchgear S. Stewart
Volume 47 Protection of electricity distribution networks, 2nd edition J. Gers andE. HolmesVolume 48 Wood pole overhead lines B. WareingVolume 49 Electric fuses, 3rd edition A. Wright and G. Newbery Volume 50 Wind power integration: connection and system operational aspects
B. Fox et al.
Volume 51 Short circuit currents J. SchlabbachVolume 52 Nuclear power J. WoodVolume 53 Condition assessment of high voltage insulation in power system equipment
R.E. James and Q. SuVolume 905 Power system protection, 4 volumes

8/20/2019 Condition Monitoring Knjiga
http://slidepdf.com/reader/full/condition-monitoring-knjiga 4/306
Condition Monitoringof Rotating Electrical
MachinesPeter Tavner, Li Ran, Jim Penman
and Howard Sedding
The Institution of Engineering and Technology

8/20/2019 Condition Monitoring Knjiga
http://slidepdf.com/reader/full/condition-monitoring-knjiga 5/306
Published by The Institution of Engineering and Technology, London, United Kingdom
© 2008 The Institution of Engineering and Technology
First published 2008
This publication is copyright under the Berne Convention and the Universal CopyrightConvention. All rights reserved. Apart from any fair dealing for the purposes of researchor private study, or criticism or review, as permitted under the Copyright, Designs andPatents Act, 1988, this publication may be reproduced, stored or transmitted, in any form or by any means, only with the prior permission in writing of the publishers, or inthe case of reprographic reproduction in accordance with the terms of licences issuedby the Copyright Licensing Agency. Enquiries concerning reproduction outside thoseterms should be sent to the publishers at the undermentioned address:
The Institution of Engineering and Technology Michael Faraday HouseSix Hills Way, Stevenage
Herts, SG1 2AY, United Kingdom www.theiet.org
While the author and the publishers believe that the information and guidance given inthis work are correct, all parties must rely upon their own skill and judgement whenmaking use of them. Neither the author nor the publishers assume any liability toanyone for any loss or damage caused by any error or omission in the work, whethersuch error or omission is the result of negligence or any other cause. Any and all suchliability is disclaimed.
The moral rights of the author to be identified as author of this work have beenasserted by her in accordance with the Copyright, Designs and Patents Act 1988.
British Library Cataloguing in Publication Data
A catalogue record for this product is available from the British Library
ISBN 978-0-86341-739-9
Typeset in India by Newgen Imaging Systems (P) Ltd, ChennaiPrinted in the UK by Athenaeum Press Ltd, Gateshead, Tyne & Wear

8/20/2019 Condition Monitoring Knjiga
http://slidepdf.com/reader/full/condition-monitoring-knjiga 6/306
This book is dedicated to Ying Lu
Considerate la vostra semenza;
Fatti non foste a viver come bruti,
Ma per seguir virtute e conoscenza.
Consider the seed from which you were made;
You were not made to live like brutes, But to pursue virtue and knowledge.
Dante’s Inferno,
Canto XXVI, lines 118–120, Ulysses

8/20/2019 Condition Monitoring Knjiga
http://slidepdf.com/reader/full/condition-monitoring-knjiga 7/306
The photograph is of 3 phase, 290 kW, 6.6 kV, 60 Hz, 6-pole. 1188 rev/min squirrelcage induction motors, manufactured by ATB Laurence Scott Ltd at Norwich in theUK, driving pumps on the offshore Buzzard platform in the North Sea.

8/20/2019 Condition Monitoring Knjiga
http://slidepdf.com/reader/full/condition-monitoring-knjiga 8/306
Contents
Preface xiii
Acknowledgments xvii
Nomenclature xix
1 Introduction to condition monitoring 1
1.1 Introduction 1
1.2 The need for monitoring 4
1.3 What and when to monitor 7
1.4 Scope of the text 9
1.5 References 10
2 Construction, operation and failure modes of electrical machines 13
2.1 Introduction 132.2 Materials and temperature 14
2.3 Construction of electrical machines 16
2.3.1 General 16
2.3.2 Stator core and frame 18
2.3.3 Rotors 18
2.3.4 Windings 18
2.3.5 Enclosures 20
2.3.6 Connections 26
2.3.7 Summary 262.4 Structure of electrical machines and their types 26
2.5 Machine specification and failure modes 33
2.6 Insulation ageing mechanisms 35
2.6.1 General 35
2.6.2 Thermal ageing 36
2.6.3 Electrical ageing 36
2.6.4 Mechanical ageing 37
2.6.5 Environmental ageing 38
2.6.6 Synergism between ageing stresses 392.7 Insulation failure modes 39
2.7.1 General 39
2.7.2 Stator winding insulation 40
2.7.3 Stator winding faults 45

8/20/2019 Condition Monitoring Knjiga
http://slidepdf.com/reader/full/condition-monitoring-knjiga 9/306
viii Condition monitoring of rotating electrical machines
2.7.4 Rotor winding faults 50
2.8 Other failure modes 54
2.8.1 Stator core faults 54
2.8.2 Connection faults (high-voltage motors and
generators) 54
2.8.3 Water coolant faults (all machines) 56
2.8.4 Bearing faults 56
2.8.5 Shaft voltages 56
2.9 Conclusion 59
2.10 References 59
3 Reliability of machines and typical failure rates 61
3.1 Introduction 61
3.2 Definition of terms 61
3.3 Failure sequence and effect on monitoring 63
3.4 Typical root causes and failure modes 65
3.4.1 General 65
3.4.2 Root causes 65
3.4.3 Failure modes 66
3.5 Reliability analysis 66
3.6 Machinery structure 69
3.7 Typical failure rates and MTBFs 71
3.8 Conclusion 75
3.9 References 76
4 Instrumentation requirements 79
4.1 Introduction 79
4.2 Temperature measurement 81
4.3 Vibration measurement 88
4.3.1 General 88
4.3.2 Displacement transducers 89
4.3.3 Velocity transducers 914.3.4 Accelerometers 92
4.4 Force and torque measurement 94
4.5 Electrical and magnetic measurement 97
4.6 Wear and debris measurement 100
4.7 Signal conditioning 102
4.8 Data acquisition 104
4.9 Conclusion 106
4.10 References 106
5 Signal processing requirements 109
5.1 Introduction 109
5.2 Spectral analysis 110
5.3 High-order spectral analysis 115

8/20/2019 Condition Monitoring Knjiga
http://slidepdf.com/reader/full/condition-monitoring-knjiga 10/306
List of contents ix
5.4 Correlation analysis 116
5.5 Signal processing for vibration 118
5.5.1 General 118
5.5.2 Cepstrum analysis 118
5.5.3 Time averaging and trend analysis 120
5.6 Wavelet analysis 121
5.7 Conclusion 125
5.8 References 125
6 Temperature monitoring 127
6.1 Introduction 127
6.2 Local temperature measurement 127
6.3 Hot-spot measurement and thermal images 132
6.4 Bulk measurement 1326.5 Conclusion 134
6.6 References 134
7 Chemical monitoring 137
7.1 Introduction 137
7.2 Insulation degradation 137
7.3 Factors that affect detection 138
7.4 Insulation degradation detection 142
7.4.1 Particulate detection: core monitors 1427.4.2 Particulate detection: chemical analysis 146
7.4.3 Gas analysis off-line 148
7.4.4 Gas analysis on-line 149
7.5 Lubrication oil and bearing degradation 152
7.6 Oil degradation detection 153
7.7 Wear debris detection 153
7.7.1 General 153
7.7.2 Ferromagnetic techniques 154
7.7.3 Other wear debris detection techniques 1557.8 Conclusion 157
7.9 References 157
8 Vibration monitoring 159
8.1 Introduction 159
8.2 Stator core response 159
8.2.1 General 159
8.2.2 Calculation of natural modes 161
8.2.3 Stator electromagnetic force wave 164
8.3 Stator end-winding response 167
8.4 Rotor response 168
8.4.1 Transverse response 168
8.4.2 Torsional response 171

8/20/2019 Condition Monitoring Knjiga
http://slidepdf.com/reader/full/condition-monitoring-knjiga 11/306
x Condition monitoring of rotating electrical machines
8.5 Bearing response 173
8.5.1 General 173
8.5.2 Rolling element bearings 173
8.5.3 Sleeve bearings 175
8.6 Monitoring techniques 176
8.6.1 Overall level monitoring 177
8.6.2 Frequency spectrum monitoring 179
8.6.3 Faults detectable from the stator force wave 182
8.6.4 Torsional oscillation monitoring 183
8.6.5 Shock pulse monitoring 187
8.7 Conclusion 189
8.8 References 189
9 Electrical techniques: current, flux and power monitoring 193
9.1 Introduction 193
9.2 Generator and motor stator faults 193
9.2.1 Generator stator winding fault detection 193
9.2.2 Stator current monitoring for stator faults 193
9.2.3 Brushgear fault detection 194
9.2.4 Rotor-mounted search coils 194
9.3 Generator rotor faults 194
9.3.1 General 194
9.3.2 Earth leakage faults on-line 1959.3.3 Turn-to-turn faults on-line 196
9.3.4 Turn-to-turn and earth leakage faults off-line 204
9.4 Motor rotor faults 207
9.4.1 General 207
9.4.2 Airgap search coils 207
9.4.3 Stator current monitoring for rotor faults 207
9.4.4 Rotor current monitoring 210
9.5 Generator and motor comprehensive methods 212
9.5.1 General 2129.5.2 Shaft flux 213
9.5.3 Stator current 217
9.5.4 Power 217
9.5.5 Shaft voltage or current 219
9.5.6 Mechanical and electrical interaction 221
9.6 Effects of variable speed operation 221
9.7 Conclusion 224
9.8 References 224
10 Electrical techniques: discharge monitoring 229
10.1 Introduction 229
10.2 Background to discharge detection 229
10.3 Early discharge detection methods 231

8/20/2019 Condition Monitoring Knjiga
http://slidepdf.com/reader/full/condition-monitoring-knjiga 12/306
List of contents xi
10.3.1 RF coupling method 231
10.3.2 Earth loop transient method 233
10.3.3 Capacitive coupling method 235
10.3.4 Wideband RF method 236
10.3.5 Insulation remanent life 236
10.4 Detection problems 238
10.5 Modern discharge detection methods 239
10.6 Conclusion 241
10.7 References 241
11 Application of artificial intelligence techniques 245
11.1 Introduction 245
11.2 Expert systems 246
11.3 Fuzzy logic 25011.4 Artificial neural networks 253
11.4.1 General 253
11.4.2 Supervised learning 254
11.4.3 Unsupervised learning 256
11.5 Conclusion 260
11.6 References 261
12 Condition-based maintenance and asset management 263
12.1 Introduction 26312.2 Condition-based maintenance 263
12.3 Life-cycle costing 265
12.4 Asset management 265
12.5 Conclusion 267
12.6 References 268
Appendix Failure modes and root causes in rotating electrical
machines 269
Index 277

8/20/2019 Condition Monitoring Knjiga
http://slidepdf.com/reader/full/condition-monitoring-knjiga 13/306

8/20/2019 Condition Monitoring Knjiga
http://slidepdf.com/reader/full/condition-monitoring-knjiga 14/306
Preface
Condition monitoring of engineering plant has increased in importance as more
engineering processes become automated and the manpower needed to operate and
supervise plant is reduced. However, electrical machinery has traditionally been
thought of as reliable and requiring little attention, except at infrequent intervals
when the plant is shut down for inspection. Indeed the traditional application of fast-acting protective relays to electrical machines has rather reduced the attention that
operators pay to the equipment.
Rotating electrical machines, however, are at the heart of most engineering pro-
cesses and as they are designed to tighter margins there is a growing need, for
reliability’s sake, to monitor their behaviour and performance on-line. This book
is a guide to the techniques available. The subject of condition monitoring of elec-
trical machines as a whole covers a very wide field including rotating machines and
transformers. To restrict the field the authors deal with rotating machines only and
with techniques that can be applied when those machines are in operation, neglectingthe many off-line inspection techniques.
The first edition of this book, Condition Monitoring of Electrical Machines, was
written by Peter Tavner and Jim Penman and published in 1987 by Research Studies
Press, with the intention of bringing together a number of strands of work active at that
time from both industry and academia. In academia there was a growing confidence in
the mathematical analysis of electrical machines, in computer modelling of complex
equivalent circuits and in the application of finite-element methods to predict their
magnetic fields. In industry there was growing interest in providing better monitoring
for larger electrical machines as rising maintenance costs competed with the heavyfinancial impact of large machine failures.
The original book was primarily aimed at larger machines involved in energy
production, such as turbine generators and hydro generators, boiler feed pumps, gas
compressors and reactor gas circulators. This was because at that time those were
the only plant items costly enough to warrant condition-monitoring attention. It also
reflected the fact that one of the authors worked in the nationalised generating utility,
colouring his approach to the subject.
The original book showed that, in respect of condition monitoring, electrical
machines are unusual when compared with most other energy conversion rotating plant. The all-embracing nature of the electromagnetic field in the energy conversion
process, which is the raison d’être of the electrical machine, enables operators to infer
far more about their operation from their terminal conditions than is usually the case
with non-electrical rotating machinery. In this earlier work the authors were inspired
8/20/2019 Condition Monitoring Knjiga
http://slidepdf.com/reader/full/condition-monitoring-knjiga 15/306
xiv Condition monitoring of rotating electrical machines
by a much earlier book by Professor Miles Walker, The Diagnosing of Trouble in
Electrical Machines, first published in 1921.
Our book covered the elemental aspects of electrical machine condition monitor-
ing but exposed a number of important facets of understanding that have subsequently
lead to a great deal of further work, namely
• the electromagnetic behaviour of electrical machines,
• the dynamic behaviour of electrical machines, particularly associated with the
control now available with modern power electronics,
• the behaviour of electrical machine insulation systems.
Each of these facets have now matured and are a rich source of fundamental
knowledge that has been related to the behaviour of machines in their operating
state, especially under fault conditions. Two examples of this further work areProfessor Peter Vas’, Parameter Estimation, Condition Monitoring and Diagnosis
of Electrical Machines, published in 1996; and Greg C. Stone’s, Electrical Insulation
for Rotating Machines, Design, Evaluation, Ageing, Testing and Repair , published
in 2004.
The economics of industry has also changed, particularly as result of the privati-
sation and deregulation of the energy industry in many countries, placing far greater
emphasis on the importance of reliable operation of plant and machinery, throughout
the whole life cycle, regardless of its first capital cost.
Finally the availability of advanced electronics and software in powerful instru-mentation, computers and digital signal processors has simplified and extended our
ability to instrument and analyse machinery, not least in the important area of visu-
alising the results of complex condition-monitoring analysis. As a result, condition
monitoring is now being applied to a wider range of systems, from fault-tolerant
drives of a few hundred watts in the aerospace industry, to machinery of several hun-
dred megawatts in major capital plant. The value of the fundamental contribution to
these advances by many analysts over the last 20 years cannot be underestimated and
they will play a major part in the future.
In this new book, Condition Monitoring of Rotating Electrical Machines, theoriginal authors have been joined by their colleague Dr Li Ran, an expert in power
electronics and control, and Dr Howard Sedding, an expert in the monitoring of
electrical insulation systems. Together we have decided to build upon the earlier
book, retaining the same limits we set out at the start of this preface, merging our own
experience with that of the important machine analysts through the years to bring
the reader a thoroughly up-to-date but practicable set of techniques that reflect the
work of the last 20 years. The book is aimed at professional engineers in the energy,
process engineering and manufacturing industries, research workers and students.
We have placed an additional limit on the book and that is to consider the machineitself rather than its control systems. While recognising the enormous growth of the
application of electronic variable speed drives in industry, we do not deal with their
specific problems except in passing. We acknowledge that this is important for future
growth but leave this area of investigation to a future author.

8/20/2019 Condition Monitoring Knjiga
http://slidepdf.com/reader/full/condition-monitoring-knjiga 16/306
Preface xv
The examples of faults have concentrated on conventional machines rather
than the emerging brushless, reluctance, permanent magnet and unusual topology
machines. This is because the industry is still dominated by these conventional
machines. The ‘failure mode’ information for newer designs has not yet emerged
but will be based on earlier machine experience. In this edition we have omitted case
studies because the range of application of condition-monitoring techniques on elec-
trical machines is now so wide and complex that it is difficult to select appropriate
applications from which general conclusions can be drawn.
We have introduced a ‘Nomenclature’ section and extended the references to cover
major recent journal papers and books that have illuminated the subject, including
some of the older seminal works, which still deserve scrutiny. The authors have also
taken the opportunity to correct errors in the previous book, rearrange the material
presented and add important information about failure mechanisms, reliability, instru-
mentation, signal processing and the management of rotating machine assets as thesefactors critically affect the way in which condition monitoring needs to be applied.
Finally, the diagrams and photographs representing the machines, the monitoring
systems and the signal processing used have been updated where appropriate.
Peter Tavner
Durham University, 2006

8/20/2019 Condition Monitoring Knjiga
http://slidepdf.com/reader/full/condition-monitoring-knjiga 17/306

8/20/2019 Condition Monitoring Knjiga
http://slidepdf.com/reader/full/condition-monitoring-knjiga 18/306
Acknowledgments
Peter Tavner and Li Ran acknowledge the assistance they have had from Durham
University in preparing this book, particularly from Barbara Gilderoy and Denise
Norman for assisting in transferring the material from our previous edition to this new
one and to Chris Orton and Julie Morgan-Dodds for carefully drawing many of the
diagrams. They also acknowledge the help of students and research assistants, includ-ing Xiang Jianping, Michael Wilkinson, Fabio Spinato and Mark Knowles, for their
contribution to the book through proofreading, discussions and their understanding of
the problems of machine reliability and monitoring. Peter Tavner acknowledges the
help of Dr Jim Bumby at Durham University for providing advice on the frequencies
of vibration, current, flux and power associated with faults.
The authors acknowledge the assistance of companies who have contributed
photographs and diagrams, in particular Brush Turbogenerators (Loughborough,
UK; Plzen, Czech Republic; and Ridderkirk, Netherlands), Marelli Motori S.p.A
(Arzignano, Italy), Dong Feng Electrical Machinery Ltd (Deyang, China) and Laurence, Scott & Electromotors Ltd (Norwich, UK).
The photograph on the front cover is of 3 290 kW, 6.6 kV, 60 Hz, six-pole,
1 188 rev/min induction motors, manufactured by Laurence, Scott & Electromo-
tors Ltd at Norwich in the UK, driving pumps on the offshore Buzzard platform in
the North Sea.

8/20/2019 Condition Monitoring Knjiga
http://slidepdf.com/reader/full/condition-monitoring-knjiga 19/306

8/20/2019 Condition Monitoring Knjiga
http://slidepdf.com/reader/full/condition-monitoring-knjiga 20/306
Nomenclature
Symbol Explanation
A effective cross-sectional area of a coil, m2
A availability, A = MTBF/(MTBF + MTTR)
A(t ) availability function of a population of components as a function
of timea scaling factor of time in a mother wavelet transform
α scale parameter in a power law expression
αn and bn strain coefficients for the strain energy of the stator core
αt cross-sectional area of a tooth, m2
α scale parameter in a Weibull function
αr resistance temperature coefficient, degree/ohm
αs skew angle of a stator, degree
B( f 1, f 2) bispectrum
B radial flux density in an airgap, Tesla
b1 or b2 stator or rotor side instantaneous radial flux density, Tesla
b time-shifting parameter in a mother wavelet transform
β shape parameter in a Weibull function
β half-angle subtended by a shorted turn, degrees
C volumetric concentration of a degradation product in a machine
C Carter factor to account for airgap slotting
C ( y, v) inverse wavelet transform
C (t ) cepstrum functionc damping constant of a support system, N/m/s
D damping factor for rotor vibrations
d rolling element diameter, m
E Young’s modulus of a material
E e stored energy in an electrical system, Joules
e specific unbalance e = mr / M , m
e(t ) instantaneous induced EMF, V
strain in a material
θ MTBF of a component, θ = 1/λ hours
θ 1 space position in the stator field, degrees
θ 2 space position in the rotor field, degrees
F parameter from shock pulse measurement of a rolling element bearing

8/20/2019 Condition Monitoring Knjiga
http://slidepdf.com/reader/full/condition-monitoring-knjiga 21/306
xx Condition Monitoring of Rotating Electrical Machines
F m(θ , t ) forcing function on a rotor or stator expressed in circumferential
angle θ and time t , N
F (t ) failure mode probability density, a Weibull function
F or F −
1 forward or backward Fourier transform f 0 first critical or natural frequency of a rotor system, Hz
f 1 or f 2(t ) stator or rotor side instantaneous magnetomotive force (MMF), N 1 I 1
or N 2 I 2, ampere-turns
f se electrical supply side frequency = 1/T , Hz
f sw PWM switching frequency, Hz
f m higher mth natural frequencies of the stator core, Hz
f sm mechanical vibration frequency on the stator side, Hz
f n the nth component of an unbalanced forcing function
f rm mechanical rotational frequency = N /60, Hz
G strain gauge factor
G degree of residual unbalance as denoted by the quantity G = eω
G( f k ) generalised power spectral function of frequency, f k , the k th harmonic
G∗( f k ) complex conjugate of G( f k )
G(m) stiffness function of an mth natural frequencies of the stator core
G(t n) generalised periodic function of time, t n
g acceleration due to gravity, m/s2
g airgap length, mmgn( z) natural frequency function an nth solution of the balance equation
h heat transfer coefficient from an insulation surface, W/m2K
ht tooth depth, m
I 1 or I 2 stator or rotor side rms current, A
i1 or i2(t ) stator or rotor side instantaneous current, A
J polar moment of inertia of the core cylinder, joules2
k integer constant, indicates the stator MMF space
harmonics, 1, 3, 5, 7…
k heat transfer coefficient through an insulating material, W/mK
k stiffness constant of a support system, N/m
k r reflection coefficient in the recurrent surge oscillography (RSO) test
k c integer number of commutator segments in a DC machine
k /nq Hall effect constant of an electronic material
k e integer constant, indicates eccentricity order number, which is zero
for static eccentricity and a low integer value for dynamic eccentricity
k c integer constant, indicates the circumferential modes in a vibrating
stator corek l integer constant, indicates the lengthwise modes in a vibrating
stator core
k wn stator winding factor for the nth harmonic
L active length of a core, m

8/20/2019 Condition Monitoring Knjiga
http://slidepdf.com/reader/full/condition-monitoring-knjiga 22/306
Nomenclature xxi
L inductance of a coil, H
integer number of stator time harmonics or rotor winding
fault harmonics
magnetic permeanceλ instantaneous failure rate or hazard function of a component or machine,
failures/component/year
λ(t ) failure rate of a component or machine varying with time,
failures/component/year
M mass of a rotating system, kg
M s mass of a support system, kg
m integer constant
m equivalent unbalance mass on a shaft, kg
µ permeability in a magnetic field N 1 or N 2 integer number of stator or rotor side turns of a coil
N speed of a machine rotor, rev/min
N r integer number of rotor slots
N s integer number of stator slots
n number of charge carriers per unit volume in a semiconductor
n integer constant, 1, 2, 3, 4…
nb integer number of rolling elements in a rolling element bearing
P1 stator side power, watt
p1(t ) instantaneous stator side power, watt p integer number of pole pairs
Q heat flow, watt/m2
Qm maximum partial discharge recorded in partial discharge tests
using a calibrated coupler, mv
q electronic charge, coulomb
q integer phase number
R change in resistance
R resistance, ohms
R shock pulse meter reading R(t ) reliability or survivor function of a population of components
as a function of time, failures/machine/year
R ff (t ) auto-correlation function on a time function f (t ) with a
delay of g t
R fh(t ) cross-correlation function between time functions f (t ) and h(t )
with a delay of gt
R0 resistance of a device made of the metal at 0 ˚C, ohm
RT resistance, ohm
r effective radius of an equivalent unbalanced mass, m
r mean mean radius of a core, m
r airgap radius of airgap, m
S constant related to the stiffness of a winding, insulation and
tooth components
8/20/2019 Condition Monitoring Knjiga
http://slidepdf.com/reader/full/condition-monitoring-knjiga 23/306
xxii Condition Monitoring of Rotating Electrical Machines
s slip of an induction machine, between 0 and 1
T torque, Nm
T temperature, ˚C
T period of a wave, secT volumetric vibration kinetic energy, joules/m3
T ( f 1, f 2, f 3) trispectrum
τ 0 radial thickness of a stator core annulus, m
ρ density of a material, kg/m3
σ electrical conductivity of a region, ohm.m
σ r and σ q radial and tangential Maxwell stress in the airgap, N/m2
τ w time duration of an overheating incident, s
τ r residence time of an overheating product in a machine, or
leakage factor, sτ time delay in a correlation function, s
u lateral displacement of a machine rotor, µm
ur and uθ radial and peripheral displacements in a strained stator core, µm
V rms voltage, volts
V machine volume, m3
V volumetric strain potential energy, joules/m3
v velocity of the rotor, relative to the travelling flux wave produced
by the stator, m/s
ν volumetric rate of production of a detectable substance, m3/sνb background rate of production of the substance, m3/s
ν Poisson’s ratio of a material
φ flux, Webers
φ contact angle with races of a rolling element bearing, degree
φ electrical phase angle of a stator MMF wave F s, degree
ψ angular frequency of an electrical supply, rad/s
ψ0 first critical or natural angular frequency of a rotor system, rad/s
ψse electrical supply side angular frequency, rad/s
ψsm mechanical angular vibration frequency on the stator side, rad/sψrm mechanical rotational angular frequency = 2 pN /60, rad/s
ψecc angular velocity of an eccentricity, rad/s
ψ(t ) mother wavelet function of time
W work function for strain energy in stator core
W (a, b) wavelet transform
w weight per unit length per unit circumferential angle of a stator core
cylinder, N/m
w y, wt , wi and ww weights of a core yoke, teeth, insulation and windings,
respectively, kg
X m2 second harmonic magnetising reactance, ohm
X 12 second harmonic leakage reactance, ohm
z longitudinal distance from the centre of a machine, m
Z 0 surge impedance of a winding, ohm

8/20/2019 Condition Monitoring Knjiga
http://slidepdf.com/reader/full/condition-monitoring-knjiga 24/306
Chapter 1I ntr oduction to condition monitoring
1.1 I ntroduction
Rotating electrical machines permeate all areas of modern life at both the domestic
and industrial level. The average modern home in the developed world contains 20–30electric motors in the range 0–1 kW for clocks, toys, domestic appliances, air condi-
tioning or heating systems. Modern cars use electric motors for windows, windscreen
wipers, starting and now even for propulsion in hybrid vehicles. A modern S-series
Mercedes-Benz car is reported to incorporate more than 120 separate electrical
machines.
The majority of smaller applications of electrical machines do not require monitor-
ing, the components are sufficiently reliable that they can outlive the life of the parent
product. However, modern society depends, directly or indirectly, upon machines of
greater rating and complexity in order to support an increased standard of living.The electricity we use so freely is generated in power plants by machines whose
rating can exceed 1 000 MW and which have evolved to a state of great sophistication.
These power plants are supported by fossil fuel and nuclear energy industries that
involve the transport of raw materials using pumps, compressors and conveyors
in sophisticated engineering processes incorporating rotating electrical machines of
powers ranging from 100 kW to 100 MW. These have been joined by a growing
renewable energy industry using many of these and new techniques to extract energy
from renewable sources often in combination with traditional sources.
The steel used in cars will have been rolled using large electrical machines and at anearlier stage the furnaces will have been charged using more electrical machines. Our
water and waste systems are also driven by electrical machines, as are the processes
that produce the raw materials for the agricultural, chemical and pharmaceutical
industries. Without all these our society, as it exists at the moment, would cease to
function.
The overall picture is that electrical machines come in many sizes and fulfil their
function either independently or as part of a highly complex process in which all
elements must function smoothly so that production can be maintained. It is the
usage of electrical machinery in the latter role that has risen dramatically towards theend of the twentieth century, and there is no reason to suspect that this trend will do
anything other than accelerate in the twenty-first century. However, historically the
function of an individual electrical machine was seen as separable from the rest of
the electromechanical system. It must be remembered that the power-to-weight ratio

8/20/2019 Condition Monitoring Knjiga
http://slidepdf.com/reader/full/condition-monitoring-knjiga 25/306
2 Conditi on monitor ing of rotati ng el ectri cal machines
of electrical machines has been much lower than steam, diesel and gas engines and
consequently their reliability has been much higher.
It is against this background that the basic principles of protective relaying
evolved. Protection is designed to intercept faults as they occur and to initiate action
that ensures that the minimum of further damage occurs before failure. In its basic
form the function of the protective relay is outlined in Figure 1.1.
Current ofvoltage signal
Flag
Initiate
executive action
Fi gure 1.1 The basic function of an electri cal protective relay
The signal provided by the transducer will be in the form of a current or voltage
and will be interpreted by the relay as an acceptable or unacceptable level, according
to a pre-set value determined by the relay designer or the maintenance staff. If the pre-
set value is exceeded then the relay will initiate further electromechanical action that
will often result in disconnection of the electrical machine, and it will flag the fact that
a fault, or even failure, has been identified. This is a simplistic view of the protective
relay, which was configured using electromechanical devices such as relays to carry
out their function, as the name implies. However, nowadays most protective relays
use digital processors to deploy a wide range of functions, and are programmable to
allow more sophisticated criteria for initiating interrupt procedures to be applied; for
example, to block the restart of a motor until it has cooled to an acceptable degree.
Figure 1.2 shows a typical modern programmable relay for fulfilling such a function.
From what has been said earlier it is apparent that protective relaying can beregarded as a form of monitoring, and indeed it is widely used with great success.
Modern digital relays have also started to fulfil a monitoring function since they can
record the voltages and currents they measure for a period before and after any fault. In
fact many failure investigations on electrical machines, involving root cause analysis,
start with the download and analysis of the digital protective relay data, which can
usually be displayed clearly in an Excel spreadsheet. Virtually all electrical machine
protection systems embody some form of protection device, and on typical machines
they are used in some or all of the following schemes
• earth fault protection,
• overcurrent protection,
• differential current protection,
• under- and overvoltage protection,

8/20/2019 Condition Monitoring Knjiga
http://slidepdf.com/reader/full/condition-monitoring-knjiga 26/306
Introduction to conditi on monitor ing 3
F igure 1.2 A typical moder n digi tal motor relay. [ Source: GE Power Systems, U SA]
• negative phase sequence protection,
• field failure protection,
• reverse power protection,
• overspeed protection,
• excessive vibration protection,
• thermal overload protection.
This list is representative rather than exhaustive.
It is important to stress the fact that protection is basically designed to act only
once a fault has occurred and it will normally initiate some executive action. In
the words of Electricity Training Association’s Power Systems Protection [1], ‘the
function of protective equipment is not the preventive one its name would imply, in
that it takes action only after a fault has occurred; it is the ambulance at the foot of the
cliff rather than the fence at the top’. Condition monitoring needs to establish itself as
the ‘fence at the cliff top’. The executive action may very well be the disconnection of
the piece of machinery from the supply. Such action is acceptable if the item of plantis readily dissociated from the process it is involved with, or if it exists substantially
in isolation. If, however, the piece of plant is vital to the operation of a process then
an unscheduled shutdown of the complete process may occur. The losses involved
may then be significantly greater than those resulting simply from the loss of output

8/20/2019 Condition Monitoring Knjiga
http://slidepdf.com/reader/full/condition-monitoring-knjiga 27/306
4 Conditi on monitor ing of rotati ng el ectri cal machines
during a scheduled shutdown. It must also be borne in mind that the capital cost of
an individual machine is more often than not small compared with the capital costs
involved in a plant shutdown. Maintenance is most effective when it is planned to
service many items in the course of a single outage. In summary, condition monitoring
of an electrical machine is not necessarily aimed solely at the machine itself, but at
the wider health of the process of which it is part.
1.2 T he need for monitor ing
The notion of the scheduled shutdown or outage introduces us logically to the case
to be made on behalf of monitoring. By condition monitoring we mean the continu-
ous evaluation of the health of plant and equipment throughout its serviceable life.
Condition monitoring and protection are closely related functions. The approach tothe implementation of each is, however, quite different. Also the advantages that
accrue due to monitoring are entirely different to those to be expected from protec-
tion. This is principally because monitoring should be designed to pre-empt faults,
whereas protection is essentially retroactive. Condition monitoring can, in many
cases, be extended to provide primary protection, but its real function must always
be to attempt to recognise the development of faults at an early stage. Such advanced
warning is desirable since it allows maintenance staff greater freedom to schedule
outages in the most convenient manner, resulting in lower down time and lower
capitalised losses.
We have said that advanced warnings of malfunction, as provided by monitor-
ing, are desirable. Are they? We must justify this because the implementation of a
monitoring system can involve the operator in considerable expense. There are other
questions to be answered too, for example:
• Once one has chosen to embark upon a programme of monitoring what form
should it take?
• Should the monitoring be intermittent, regular at fixed time intervals, or
continuous?
• If one employs a fixed time interval maintenance programme then is it necessaryto monitor at all?
• Monitoring can generate large quantities of data; how can this information be best
used to minimise future expenditure?
• Finally, and perhaps most importantly, how much needs to be spent on monitoring
in order to make it truly effective?
These questions do not have simple answers but we can get some indications by
considering the magnitude of the maintenance and replacement burden that indus-
try is continually facing, and the implications for the costs of various maintenance
strategies. We could consider three different courses of action
• breakdown maintenance,
• fixed-time interval or planned maintenance,
• condition-based maintenance.

8/20/2019 Condition Monitoring Knjiga
http://slidepdf.com/reader/full/condition-monitoring-knjiga 28/306
Introduction to conditi on monitor ing 5
Table 1.1 Expenditure on plant per employee of selected industr ies adapted fr om Neale Report, 1979 [ 2]
Industry Annual investment/employeein plant and machinery, £
North Sea oil and gas 160 000
Oil refining 14 000
Electricity supply 8 000
Chemical industry 2 400
Iron and steel 1 800
Water supply 800
Textile manufacture 600
Instrumentation manufacture 400Electrical engineering manufacture 400
Method (1) demands no more than a ‘run it until it breaks then replace it’ strategy,
while method (2) may or may not include a degree of monitoring to aid in the planning
of machinery outages. The final scenario method (3) requires a definite commitment
to monitoring.
The scale of investment can be seen from figures provided by the Neale Report [2], published in 1979. This information is 30 years old and comes from a period before a
long period of privatisation but is still invaluable. Table 1.1 shows the annual invest-
ment per employee in plant and machinery. We have modified these values in order to
reflect more realistically today’s costs and have selected those industries that would
have a high proportion of expenditure in electrical machinery and ancillary plant.
The same report shows that the average annual expenditure on maintenance was
80 per cent of the amount annually invested in plant and machinery. The figures for
some selected industries and industrial groupings are shown in Table 1.2, which shows
the annual maintenance expenditure as a percentage of the annual plant investmentexpenditure. This is a high figure in real terms and anything that helps to reduce it
must be welcome. The H ewl ett-Packard Journal has quoted the staggering figure of
$200 billion as the annual maintenance bill for US business, and a growth rate of
12 per cent. Now only a fraction of this sum will be spent on maintaining electrical
machinery, but even if it amounts to a fraction of one per cent of the total it is still an
enormous amount of money.
There are great incentives to maintain plant more efficiently, particularly when it
is estimated that approximately 70 per cent of the maintenance work carried out by
companies that use no planning at all may be classified as emergency work and must be done at premium costs. It is apparent that careful thought should be given to the
most appropriate form of maintenance planning. Breakdown maintenance can only
be effective when there is a substantial amount of redundant capacity or spares are
available, and a single breakdown does not cause the failure of a complete system.
8/20/2019 Condition Monitoring Knjiga
http://slidepdf.com/reader/full/condition-monitoring-knjiga 29/306
6 Conditi on monitor ing of rotati ng el ectri cal machines
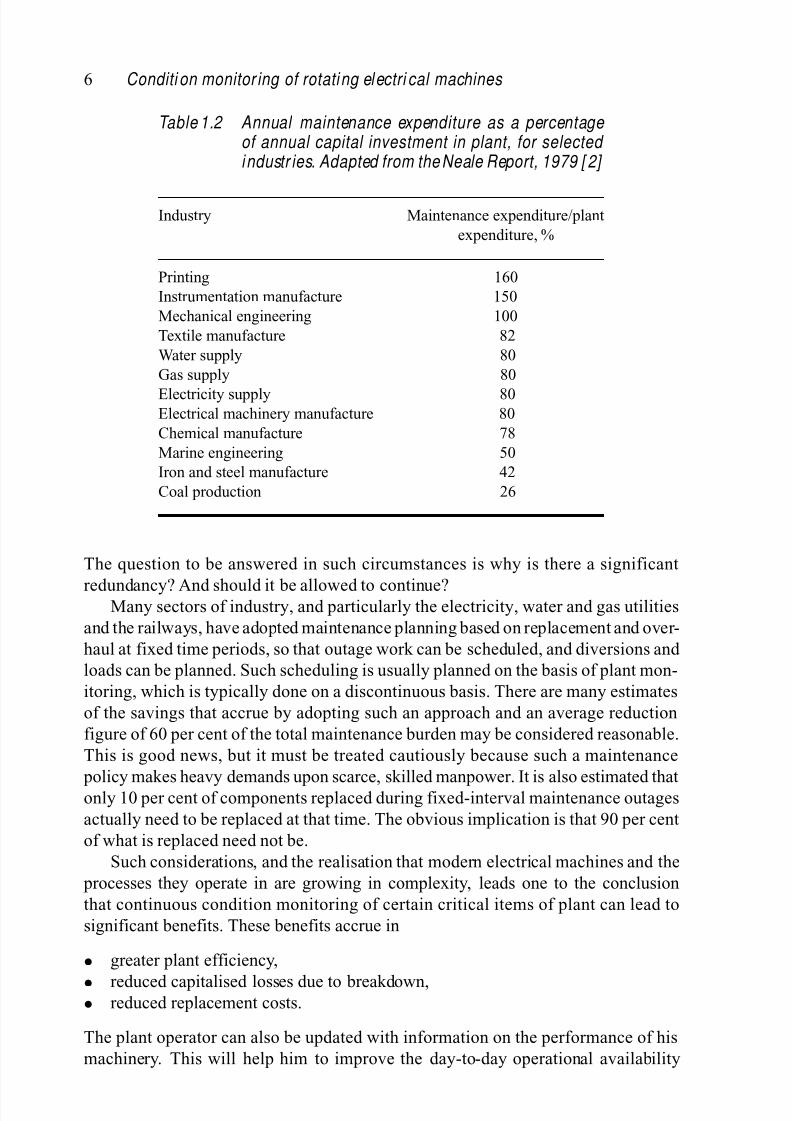
Table 1.2 Annual maintenance expenditure as a percentage of annual capital investment in plant, for selected i ndustr ies. Adapted from the Neale Report, 1979 [ 2]
Industry Maintenance expenditure/plant
expenditure, %
Printing 160
Instrumentation manufacture 150
Mechanical engineering 100
Textile manufacture 82
Water supply 80
Gas supply 80
Electricity supply 80Electrical machinery manufacture 80
Chemical manufacture 78
Marine engineering 50
Iron and steel manufacture 42
Coal production 26
The question to be answered in such circumstances is why is there a significant
redundancy? And should it be allowed to continue?Many sectors of industry, and particularly the electricity, water and gas utilities
and the railways, have adopted maintenance planning based on replacement and over-
haul at fixed time periods, so that outage work can be scheduled, and diversions and
loads can be planned. Such scheduling is usually planned on the basis of plant mon-
itoring, which is typically done on a discontinuous basis. There are many estimates
of the savings that accrue by adopting such an approach and an average reduction
figure of 60 per cent of the total maintenance burden may be considered reasonable.
This is good news, but it must be treated cautiously because such a maintenance
policy makes heavy demands upon scarce, skilled manpower. It is also estimated thatonly 10 per cent of components replaced during fixed-interval maintenance outages
actually need to be replaced at that time. The obvious implication is that 90 per cent
of what is replaced need not be.
Such considerations, and the realisation that modern electrical machines and the
processes they operate in are growing in complexity, leads one to the conclusion
that continuous condition monitoring of certain critical items of plant can lead to
significant benefits. These benefits accrue in
• greater plant efficiency,
• reduced capitalised losses due to breakdown,• reduced replacement costs.
The plant operator can also be updated with information on the performance of his
machinery. This will help him to improve the day-to-day operational availability

8/20/2019 Condition Monitoring Knjiga
http://slidepdf.com/reader/full/condition-monitoring-knjiga 30/306
Introduction to conditi on monitor ing 7
and efficiency of the plant. Condition monitoring should give information relevant
to both the operational and maintenance functions. There is an added bonus in that
better maintenance gives better safety.
In the longer term, condition monitoring also allows the operator to build up
a database that can be used for trend analysis, so that further improvements can
be made in the scheduling of maintenance. Such information should also be used
advantageously by plant manufacturers and designers in order to further improve
product reliability. This step effectively closes the loop.
In view of this, how much needs to be spent on monitoring? This depends on
the value of the process in which the machine works, and estimates vary, but they
are never less than 1 per cent of the capital value of the plant being monitored. A
more typical (and probably more realistic) figure would be 5 per cent for the general
run of industrial processes, while special requirements for high value processes, such
as those found in the offshore oil and gas industry, may push a realistic figure togreater than 10 per cent.
1.3 W hat and when to monitor
Now that we have examined some of the advantages to be gained from a commitment
to condition monitoring we can briefly address the questions, what should we monitor,
and when? The question of what to monitor has two implications.
• What machines?
• What parameters?
The first part is more easily answered. In view of the capital costs involved in pro-
viding monitoring, whether it takes the form of a permanent installation with its own
local intelligence, or a handheld device used periodically by a skilled operator, it
is unlikely that electrical machines with ratings of less than 20 kW would benefit.
There are, of course, exceptions to this where a smaller machine has a vital function
in the performance of a larger system. It will pay dividends to carefully consider the
implications of losing the output of an individual piece of machinery in the contextof a complete system.
Larger electrical drives, which support generating, process or production plant
if a high margin of spare capacity exists, will benefit from monitoring, although
perhaps not continuous monitoring. One could include induced and forced-draught
boiler fan drives, boiler water feed pump drives, and cooling water pump drives
in power stations in this category. It must be borne in mind, however, that suc-
cessful monitoring can allow a big reduction in the requirement for on-site spare
capacity.
Machines that have a high penalty in lost output costs need to be monitored continually. Large generators naturally fall into this category since lost output can
exceed £600 000 per day for a large machine in a high-efficiency power station. A
similar approach would apply to large propulsion motors and large process drive
motors.

8/20/2019 Condition Monitoring Knjiga
http://slidepdf.com/reader/full/condition-monitoring-knjiga 31/306
8 Conditi on monitor ing of rotati ng el ectri cal machines
The conclusion is that there are machines to which monitoring is readily applica-
ble, but there are other circumstances where careful assessment is needed before
deciding. One must always be mindful of the scale of the maintenance burden,
however, and not be driven to false economies on the basis that ‘nothing has gone
wrong so far’. On the other hand one must bear in mind the complexities of the
monitoring system itself and its own maintenance burden. Nothing can be worse than
investing in complex monitoring equipment, which because of poor design or main-
tenance gives rise to large numbers of false alarms and leads to the equipment being
ignored.
The parameters to be monitored are essentially those that will provide the
operator and maintainer with sufficient details to make informed decisions on oper-
ation and maintenance scheduling, but which ensure security of plant operation.
Automatic on-line monitoring has only recently begun to make an impact in the
area of electrical machines. Traditionally quantities, such as line currents and volt-ages, coolant temperatures, and bearing vibration levels, have been measured and
will continue to be used. Other quantities, involving the sensing of pyrolysed
products in cooling gases and oils, have recently been introduced, as have tech-
niques for measuring contamination levels in bearing lubricants. Other specialist
methods, involving the accurate measurement of rotational speed, or the sens-
ing of leakage fluxes, are being developed in order to monitor a variety of fault
conditions.
As the ready availability of sophisticated electronic and microprocessor-based
systems is increasingly translated into monitoring hardware, the more variables itis possible to consider, and the more comprehensive the monitoring can be. This
trend will be further accelerated as the costs of computing power fall still further, and
the complexity of microprocessors increases. Such developments are essential both
because of the complexity of the plant being monitored and the complexity of the
monitoring signals themselves.
The question of when to monitor is more easily answered. One should monitor
when it is cost-effective to do so, or when there are over-riding safety considerations
to be observed. The assessment of cost-effectiveness can be a relatively complex
matter, but in general terms monitoring is worthwhile when the net annual savings areincreased by its use. The net annual saving is the difference between the gross annual
saving and the annual costs. The costs of monitoring include the initial investigation,
purchase, and installation charges, the staff training costs, and the costs associated
with the data acquisition. This expenditure can be written off over the lifetime of the
monitoring system and set against the savings accrued. We have already considered
these savings in some detail earlier in this chapter, and it is sufficient to say that it
is not uncommon for the capital costs of a wisely chosen monitoring system to be
retrieved in the first year of its operational life.
Finally it is tempting to think that, with such a degree of monitoring power becoming available, the protective and monitoring functions could be merged. With
the development of more powerful digital protection and improved supervisory con-
trol and data acquisition (SCADA) systems this is happening but care must be taken
and operational experience must be established before these functions merge.

8/20/2019 Condition Monitoring Knjiga
http://slidepdf.com/reader/full/condition-monitoring-knjiga 32/306
Introduction to conditi on monitor ing 9
1.4 Scope of the text
Some time ago the authors recognised the need to draw together into a single source
an account of the techniques available to anyone wishing to involve themselves in
the monitoring of electrical machines.
The list of books on the subject of electrical machine condition monitoring is
short, the first historic reference of seminal interest being Walker [3], followed by
the present authors’ first edition [4] and then by Vas [5]. The most up-to-date book,
by Stone et al ., is aimed at winding and insulation problems [6].
The journal literature on condition monitoring of electrical machines is growing
rapidly. In fact, one author has said that it has picked up at a fervent pace and
another has called it an explosion, although the growth is not necessarily in directions
most useful to industry. There are a number of general survey papers of condition-
monitoring techniques for machines of which the most relevant are Finley and Burke[7], Singh and Al Kazzaz [8], Han and Song [9] and Nandi et al . [10].
Rao has given an overview of condition monitoring in his handbook [11], includ-
ing a chapter on electrical machines, while Barron [12] gives a succinct mechanical
engineer’s view of condition monitoring which is useful as an overview. It is impor-
tant in electrical machines monitoring for a bridge to be developed between electrical
and mechanical engineers.
Condition monitoring is an area of technology that is extremely wide-ranging,
requiring knowledge of
• the construction and performance of the machines to be monitored,
• the way they fail in service,
• the analysis of electrical, magnetic, vibration and chemical signals,
• the design of microprocessor-based instrumentation,
• the processing of these signals and their presentation in a comprehensible way.
In a book of this length it is not possible to enter into a detailed study of each area.
The art of condition monitoring is minimalist, to extract the correct information from
the machine that enables us, with a minimum of analysis, to give a clear detection of an incipient failure mode.
We have instead set ourselves the objective of covering the complete monitoring
field as it relates to electrical machinery, in a manner that will be useful to anyone
wishing to become familiar with the subject for the first time, and will assist people
actively engaged in condition monitoring to gain a perspective of new developments.
To restrict the field the authors deal with rotating machines only and with tech-
niques that can be applied when those machines are in operation, neglecting the
many off-line inspection techniques. We have added two further restrictions. While
recognising the enormous growth in recent years of the application of electronic vari-able speed drives to industry, this edition does not deal with the specific problems
of condition-monitoring electrical machines driven at variable speed. In imposing
this limit we acknowledge that variable speed drives will be an important area for
future growth in condition monitoring, but this technology will be founded firmly

8/20/2019 Condition Monitoring Knjiga
http://slidepdf.com/reader/full/condition-monitoring-knjiga 33/306
10 Conditi on monitor ing of rotati ng el ectri cal machines
upon the behaviour of machines at constant speed, which this book will address. We
have also concentrated on conventional machines rather than the emerging brushless,
reluctance, permanent magnet and unusual topology machines. This is because the
industry is still dominated by these conventional machines and the failure modes for
emerging designs are not yet clear, but will be based upon conventional machine
experience.
The text is divisible into four sections. The first section, Chapters 2 and 3, is
essentially ‘a description of the patient, the things that can go wrong with him, and a
general guide to the diagnosis’. Chapter 2 gives a broad guide to electrical machine
construction with descriptions of the materials and specification limits upon them. It
also details examples of faults that can occur and through a number of tables starts
to classify the principal failure modes and root causes. Chapter 3 then describes the
general principles of reliability theory and its applicability to electrical machines. In
particular it highlights the importance of failure modes in predicting failure probabilityand introduces the idea of condition monitoring addressing the root causes of failure
modes that have a slow failure sequence.
The second section, Chapters 4 and 5, gives a detailed account of specific instru-
mentation and signal processing techniques. We treat instrumentation at the functional
level and assume a certain basic knowledge of the techniques of spectral analysis of
signals.
The third section, Chapters 6–10, gives a detailed account of specific monitoring
techniques, starting with thermal and then chemical degradation methods, progressing
onto mechanical and finally electrical methods, considering first terminal conditionsand finally discharge monitoring of electrical machine insulation systems. There are
areas of overlap between each of the monitoring methods. As far as possible we have
subdivided the techniques within each chapter into the types and parts of machines
on which they are used. In these sections we describe current practice and discuss
some of the new developments now being introduced.
The fourth and final section, Chapters 11 and 12, considers first the application
of artificial intelligence to the condition monitoring of machines and then the use of
condition monitoring on the maintenance planning and asset management of plant.
We have tried to be mindful of the fact that, when describing developments ina relatively new subject area, a comprehensive bibliography is of the utmost impor-
tance. We have in general quoted the major recent journal papers and books that
have illuminated the subject. We have only quoted conference papers where they are
essential to identify a particularly relevant modern point. We have also included some
of the older seminal works, which still deserve scrutiny. It is inevitable that there will
be omissions but hopefully it will provide the interested reader with a useful source
of additional material.
1.5 R eferences
1. Electrical Training Association. Power System Protection , Vol. 1: Pr inciples and Components . Stevenage: Peter Peregrinus; 1981.

8/20/2019 Condition Monitoring Knjiga
http://slidepdf.com/reader/full/condition-monitoring-knjiga 34/306
Introduction to conditi on monitor ing 11
2. Neale N. and Associates. A Guide to the Condition Monitoring of Machinery .London: Her Majesty’s Stationary Office; 1979.
3. Walker M. The D iagnosing of Trouble i n Electri cal M achines . London: Library
Press; 1924.
4. Tavner P.J. and Penman J. Condit ion M onitoring of Electri cal Machines .Letchworth: Research Studies Press and John Wiley & Sons; 1987.
5. Vas P. Parameter Estimation, Condition Monitoring and Diagnosisof Electrical Machines . Oxford: Clarendon Press; 1996.
6. Stone G.C., Boulter E.A., Culbert I. and Dhirani H. Electrical Insulation for Rotating Machines, Design, Evaluation, Aging, Testing, and Repair . New York:
Wiley–IEEE Press; 2004.
7. Finley W.R. and Burke R.R. Troubleshooting motor problems. IEEE Transac- tions on Industry Applications 1994, 30(5): 1383–97.
8. Singh G.K. and Al Kazzaz S.A.S. Induction machine drive condition monitoringand diagnostic research – a survey. El ectr ic Power Systems Research 2003, 64(2):
145–58.
9. Han Y. and Song Y.H. Condition monitoring techniques for electrical equipment
– a literature survey. IEEE Transactions on Power Delivery 2003 18(1): 4–13.
10. Nandi S., Toliyat H.A. and Li X. Condition monitoring and fault diagnosis of
electrical motors – a review. IEEE Transactions on Energy Conversion 2005,
20(4): 719–29.
11. Rao B.K.N. Handbook of Condition M onitori ng . Oxford: Elsevier; 1996.
12. Barron R. Engineering Condition Monitoring: Practice, Methods and Applica- tions . Harlow: Longman; 1996.

8/20/2019 Condition Monitoring Knjiga
http://slidepdf.com/reader/full/condition-monitoring-knjiga 35/306

8/20/2019 Condition Monitoring Knjiga
http://slidepdf.com/reader/full/condition-monitoring-knjiga 36/306
Chapter 2 C onstr uction, oper ation and failur e modes of
electrical machines
2.1 I ntroduction
This chapter could also be subtitled ‘the way rotating electrical machines fail in
service’. Rotating electrical machines convert electrical to mechanical energy, or
vice versa, and they achieve this by magnetically coupling electrical circuits across
an airgap that permits rotational freedom of one of these circuits. Mechanical energy is
transmitted into or out of the machine via a drive train that is mechanically connected
to one of the electric circuits.
An example of one of the largest electromagnetic energy conversion units in the
world, at 1 111 megavolt-amperes (MVA), is shown in Figure 2.1. The construction
F igure 2.1 View of a 1 111 M VA, 24 kV, 50 H z steam turbine-dr iven, hydrogen- cooled, two-pole tur bine gener ator install ed i n a nuclear power station i n the Czech Republi c. The gener ator exciter is on the left, the turbi ne gener ator i s in the centre of the pi cture and the low pressure turbi ne to the ri ght. [ Source: Br ush Turbogener ators]

8/20/2019 Condition Monitoring Knjiga
http://slidepdf.com/reader/full/condition-monitoring-knjiga 37/306
14 Conditi on monitor ing of rotati ng el ectri cal machines
of electrical machines is similar, whether large or small, as shown later in the chapter
and their operational weaknesses are dominated by the same principles. The purpose
of this chapter is to explain their constructional principles and the main causes of
failure. The chapter is illustrated with a large number of photographs to demonstrate
to the reader the salient features of electrical machines.
2.2 M ater ials and temper ature
The magnetic and electric circuits essential to machines require materials of high
permeability and low resistivity, respectively, and these are generally metals. Metals
with good magnetic and electrical properties do not necessarily have high mechanical
strength. Indeed the atomic structure of a good conductor is such that it will naturally
have a low yield strength and high ductility. Yet the magnetic and electric circuitsof the machine must bear the mechanical loads imposed upon them by the transfer
of energy across the airgap. Furthermore, the magnetic and electrical circuits must
be separated by insulating materials, such as films, fibres and resins, which have
even weaker mechanical properties. Table 2.1 sets out the elastic moduli and tensile
strength of materials used in electrical machines and highlights the relative weakness
of electrical steel, conductor and insulating materials. Right from the outset then,
there is a conflict between the electrical and mechanical requirements of the various
parts of an electrical machine, which the designer must attempt to resolve.
Table 2.1 M echanical proper ties of mater ial s used in el ectri cal machines
Material Elastic modulus, GPa Tensile strength, MPa
High tensile steel 210 1 800
Structural steel 210 290–830
Electrical steel 220 450
Copper 120 210
Aluminium 70 310Epoxy-mica-glass composite 60 275
Moulded organic/inorganic resin 5 48
Phenol-formaldehyde resins 3 35
However, there is a further complication. The transfer of energy inevitably
involves the dissipation of heat, by ohmic losses in the electric circuit and by eddy
current and hysteresis losses in the magnetic circuit. The performance of the insulat-ing materials that keep these circuits apart is highly dependent upon temperature, and
deteriorates rapidly at higher temperatures. Materials that can sustain these higher
temperatures become progressively more expensive and their mechanical and dielec-
tric properties are often worse than lower temperature materials. Table 2.2 classifies

8/20/2019 Condition Monitoring Knjiga
http://slidepdf.com/reader/full/condition-monitoring-knjiga 38/306
Constr uction, oper ation and fail ure modes of electri cal machi nes 15
Table 2.2 Temperature capabili ties of insulating mater ial s
Class Material Temperature rating to
give an acceptable lifeunder prescribed
industrial conditions, C
O or Y obsolete Oleo-resinous natural fibre
materials, cotton, silk, paper, wood
without impregnation.
90
A Natural fibre materials, cotton, silk,
paper and wood impregnated,
coated or immersed in dielectric
liquid, such as oil.
105
E Synthetic-resin impregnated or
enamelled wire not containing
fibrous materials such as cotton, silk
or paper but including phenolics,
alkyds and leatheroid.
120
B Combinations of mica, glass and
paper with natural organic bonding,
impregnating or coating substances
including shellac, bitumen and
polyester resins.
130
F Combinations of mica, glass, film
and paper with synthetic inorganic
bonding, impregnating or coating
substances including epoxy and
polyester resins.
155
H Combinations mica, paper, glass or
asbestos with synthetic bonding,
impregnating or coating substances
including epoxy, polymide and
silicone resins.
180
C Combinations of asbestos, mica,
glass, porcelain, quartz or other
silicates with or without a high
temperature synthetic bonding,
impregnating or coating substance
including silicone. These can
include high-temperature aramid
calendared papers like Nomex.
220
the common insulating materials used in electrical machines and shows the relatively
low temperatures at which they are permitted to operate.
Uncertainties about the temperatures within a machine mean that the designer is
forced to restrict the maximum measurable operating temperature to an even lower

8/20/2019 Condition Monitoring Knjiga
http://slidepdf.com/reader/full/condition-monitoring-knjiga 39/306
16 Conditi on monitor ing of rotati ng el ectri cal machines
value than that given in Table 2.2, taken from the IEC standard [1], for the appro-
priate insulation, in order to provide a safety factor during operation. It is clear that
the heat dissipated within a machine must be removed effectively if design limits
are to be met. For example, in the 1 111 MVA turbine generator shown in Figure
2.1 with losses of the order of 12 MW, if cooling stopped the average temperature
of the generator body would exceed any of the maximum permitted insulation tem-
peratures within 12 seconds. The problem is exacerbated because the losses are not
evenly distributed and in practice at some locations the rise in temperature will be
even faster than this. So cooling and its distribution become a vital part of machine
design.
The health of an electrical machine, its failure modes and root causes, are
ultimately related to the materials of which it is made, the mechanical and elec-
trical stresses those materials are subjected to and the temperatures they attain in
service.
In Chapter 1 we explained how electrical machines are protected by relays, which
sense serious disruptions of the current flowing in the windings and operate to trip
or disconnect the machine. However, when fault currents are flowing the machine
has already failed as an electrical device. Electrical or mechanical failure modes
are always preceded by deterioration of one of the mechanical, electrical, magnetic,
insulation or cooling components of the machine. This is the case regardless of the
type of electrical machine. If this deterioration takes a significant period of time
and can be detected by measurement, then that root cause detection will be a means
of monitoring the machine before a failure mode develops. The heart of conditionmonitoring is to derive methods to measure, as directly as possible, parameters that
indicate root cause deterioration activity and provide sufficient warning of impending
failure in order that the machine may be taken off for repair or may be tripped before
serious damage occurs.
A degree of protection could be achieved by making the protective relays
especially sensitive and providing an alarm indication before tripping occurs.
Experience has shown that this is a precarious mode of condition monitoring
leading to false alarms and a lack of confidence in the monitoring process. The
following sections show how the construction, specification, operation and typesof fault can lead to the identification of generic failure mode root causes in the
machine.
2.3 C onstr uction of electr ical machines
2.3.1 General
The basic constructional features of the electrical machine are shown in Figure 2.2(a).
The rotor, which usually has a relatively high inertia, is normally supported on two bearings, which may be mounted on separate pedestals or incorporated into the enclo-
sure of the machine, as shown in Figure 2.2(a). Some larger, slower-speed machines
incorporate a single non-drive end bearing and rely on the prime mover or driven
plant and its bearings for the remaining support. Rolling element bearings are used

8/20/2019 Condition Monitoring Knjiga
http://slidepdf.com/reader/full/condition-monitoring-knjiga 40/306
Constr uction, oper ation and fail ure modes of electri cal machi nes 17
(a)
(b)
F igure 2.2 (a) M edium-sized synchronous gener ator. Section through a 125 M VA,15 kV, 60 Hz, two-pole, air-cooled, brushless excitation turbine gen- er ator showing the fabri cated main fr ame of t he machine, stator core,wi nding, rotor and on the r i ght the main exciter of the machine. (b) Large synchronousgener ator. Constr uction of the stator core of a 500 M W, two- pole, hydrogen-cooled tur bine gener ator showing the fabri cated inner fr ame of the machine and the segmented l aminations being inser ted into that frame. [Source: Brush Turbogenerators]
on smaller-size machines where shaft peripheral velocities are low, and sleeve bear-
ings with hydrodynamic oil films are used for larger machines. Vertically mounted
machines will incorporate a thrust bearing usually at the low end of the enclosure.
This may be a relatively modest angular contact ball bearing for a small, vertically

8/20/2019 Condition Monitoring Knjiga
http://slidepdf.com/reader/full/condition-monitoring-knjiga 41/306
18 Conditi on monitor ing of rotati ng el ectri cal machines
mounted pump motor but could be a large hydrodynamic oil film thrust pad Michell-
type bearing for a hydro-type generator where the rotor may weigh 100 tonnes or
more (see Figure 2.6(b)).
2.3.2 Stator core and fr ame
The stators of all AC machines are constructed from lightly insulated laminations
of electrical steel. As Table 2.1 shows, electrical steels are strong but the silicon,
incorporated into the alloy, to raise the resistance and impart magnetic properties,
weakens the material compared to structural steel, making it brittle. Furthermore, if
the laminated structure is to have the cohesion necessary to transmit the load torque,
and have low levels of vibration when carrying the magnetic flux, it must be firmly
clamped between cast or fabricated end-plates that are secured to a cylindrical frame
into which the core is keyed. The core is constructed within the frame and compressed
before the clamping plates are applied. The frame structure and its clamping are clearly
visible in Figures 2.2(b), 2.3(a) and 2.5(b). On larger machines the clamping plates
are tightened by large bolts (see Figure 2.3(a)), but on smaller machines interlocking
keys or even welds are used to secure the clamping plates, or the core itself may be
welded or cleated.
In a DC machine the laminated stator field poles are bolted to a rolled-steel yoke
that has much greater inherent strength than a laminated core (Figure 2.7(a)).
2.3.3 Rotors
The design of the rotor will depend on the particular type of machine. AC induction
and DC motors have laminated rotors where the laminations are clamped together and
shrunk onto the steel shaft (Figure 2.7(a)). Turbine-type generators have large, solid,
forged-steel rotors that are long and thin (Figure 2.3(b)), while hydro-type generators
have large, short, fat rotors with laminated pole shoes bolted onto a fabricated spider
(Figure 2.6(b)). Where air or gas cooling is necessary an axial or radial fan may be
fitted at either or both ends of the rotor shaft. However, smaller machines rely solely
on air circulation as a result of the windage of the rotor itself, which is usually slotted to accept the rotor windings (Figure 2.9).
The rotor windings of generators are constructed of hard-drawn copper and are
insulated with rigid epoxy or formaldehyde resin and impregnated into a woven
material. On squirrel cage induction motors the winding may consist of lightly insu-
lated copper bars driven into the slots in the laminated rotor or of aluminium bars cast
directly into the rotor. The rotor windings of a DC machine or wound rotor induction
motor are rather similar to a conventional AC stator winding that is described later.
Typical induction motor and generator rotors are shown in Figures 2.3 and 2.10 .
2.3.4 Windings
The stator windings of all high-voltage AC machines comprise conductor bars made
up of hard-drawn, higher strength copper subconductors that may be connected in

8/20/2019 Condition Monitoring Knjiga
http://slidepdf.com/reader/full/condition-monitoring-knjiga 42/306
Constr uction, oper ation and fail ure modes of electri cal machi nes 19
(a)
(b)
Fi gure 2.3 (a) Large synchronous generator. Stators for 2 500 M W, two-pole,hydrogen-cooled tur bine gener ators. The stator nearest the camer a is wound. The stator furthest from the camera is awaiting winding.(b) Large synchronous generator. Rotor for a 500 M W, two-pole,hydrogen-cooled tur bine generator showing rotor forging and r otor wi nding before the fit ting of end bell s. [ Source: Br ush Turbogener ators]

8/20/2019 Condition Monitoring Knjiga
http://slidepdf.com/reader/full/condition-monitoring-knjiga 43/306
20 Conditi on monitor ing of rotati ng el ectri cal machines
Wedge
Conductors
Main wallinsulation
Wedge
Conductors
Main wallinsulation
Wedge or top stick
(a) (b) (c)
Ground insulation or slot cell
Coil separator
Insulated magnet wire
Fi gure 2.4 Sectional vi ew of the slot section three stator wi ndings, not to the same scale. (a) A 400 V round wire winding for a 1 kW motor. (b) An 11 kV,1.5 M W motor wi nding. (c) A 23 kV conductor bar for the stator wi nding of a l arge turbi ne gener ator
series or parallel. Individual subconductors are covered with a paper or glass-based
tape and the assembled bar is overtaped with a similar material impregnated on older
designs with bitumen but nowadays with epoxy resins (see Figure 2.4). In the portion
of the conductor bar embedded in the stator slot the insulation system is compacted by
being heated and pressed or it may be impregnated under vacuum and pressure. In the
end-winding portion, where one coil is connected to another, the insulation system
is not compacted and may be slightly altered, containing less impregnant, so that
it is more flexible and therefore better able to withstand the large electromagnetic
forces that part of the winding experiences. An important part of the construction
is the manner of the bracing of these end windings. They are usually pulled back
onto rigid insulated brackets made of impregnated laminate or steel using nylon or
Terylene lacing cord. On the largest machines (Figure 2.5(a)) bracing rings of glass-
reinforced plastic are used with insulating bolts. The exact nature of the bracing
depends upon the machine rating and the relative length of the end winding, as
determined by the number of pole pairs. The yoke (or stator core) is fitted into a
frame and enclosure. On smaller machines and those of standard design, the stator core is secured directly into a simplified design of a machine main frame (Figure 2.10),
but on larger machines the core has its own inner frame, which is separate from the
outer frame so that the clamped core can be removed from the enclosure for repair
(Figure 2.5(b)).
2.3.5 Enclosures
The machine enclosure can take a wide variety of forms, depending on the manner
in which the machine is cooled, and the protection it needs from the environmentin which it will work. Where a pressurised gas system of cooling is used the enclo-
sure will be a thick-walled pressure vessel but for simple air-cooling with an open-air
circuit the enclosure will consist of thin-walled ducting. Typical enclosures are shown

8/20/2019 Condition Monitoring Knjiga
http://slidepdf.com/reader/full/condition-monitoring-knjiga 44/306
Constr uction, oper ation and fail ure modes of electri cal machi nes 21
(a)
(b)
F igure 2.5 (a) Large synchronous gener ator. End region of a 600 M W, two-pole,hydrogen-cooled turbine generator with water-cooled stator windings
showing the end wi nding bracing str ucture and the hoses carr ying water to t he windi ng. (b) Lar ge synchronous gener ator. Stator of a 600 M W,two-pole, hydrogen-cooled tur bine gener ator showing stator core, fr ame and windi ngs being i nser ted into it s stator pressure housing prepar atory to factory testing. [Source: Dongfang Electrical Machinery, China]

8/20/2019 Condition Monitoring Knjiga
http://slidepdf.com/reader/full/condition-monitoring-knjiga 45/306
22 Conditi on monitor ing of rotati ng el ectri cal machines
(a)
(b)
Fi gure 2.6 (a) Large synchronous generators. Generator Hall in the Gr and Coulee H ydroelectri c D am showing a number of hydro gener ator units,120 MVA, 88-pole, 60 Hz, 81.8 rev/min. [Source: Grand Coulee Dam,USA] (b) Large synchronous generator. Installation of the stator of a 75 MVA, 44-pol e, 50 H z, 136.4 rev/min hydro gener ator i n Iceland show- i ng stator core, frame and wi ndings being lowered over the 44-pole rotor suppor ted on its thr ust bear ing. [ Source: Br ush Tur bogener ator s]

8/20/2019 Condition Monitoring Knjiga
http://slidepdf.com/reader/full/condition-monitoring-knjiga 46/306
Constr uction, oper ation and fail ure modes of electri cal machi nes 23
(a)
(b)
F igure 2.7 (a) Small D C motor. Section through a 500 W, wound-field D C motor showing stator frame and bearing housings, armature and commutator on the left. [ Source: SEM M otors, U K ] (b) Large AC i nduction motor.7 M W, 11 kV, 50 H z, four -pole, 1486 rev/min designed to dr ive a high- speed flash gas compressor for offshore oil and gas. Note the dr ive shaft on left and the water-cool ed heat exchanger on top of machine. [ Source: Laurence, Scott & El ectromotors Ltd.]
in Figures 2.1, 2.2(a), 2.5(b), 2.7, 2.8 and 2.9. There is an increasing demand nowa-
days to reduce the noise level from electrical machines and apart from affecting
the basic design of the stator and rotor cores, this will require specially designed
noise-proof enclosures.

8/20/2019 Condition Monitoring Knjiga
http://slidepdf.com/reader/full/condition-monitoring-knjiga 47/306
24 Conditi on monitor ing of rotati ng el ectri cal machines
(a)
(b)
Fi gure 2.8 (a) Large AC induction motor. View of a 20 M W advanced induc- ti on motor for ship propulsion showi ng l ow speed dr ive shaft and heat exchangers on the machine flanks. This is a large multi-phase, multi- pole, var iable speed motor fed by a current-fed inver ter. Source: Al stom,Fr ance. (b) Small AC motor. View of a combined 4 kW motor and inverter used in a small Nissan full-electric-vehicle, the Hyper-Mini. [Source: H itachi, Japan]

8/20/2019 Condition Monitoring Knjiga
http://slidepdf.com/reader/full/condition-monitoring-knjiga 48/306
Constr uction, oper ation and fail ure modes of electri cal machi nes 25
(a)
(b)
Fi gure 2.9 (a) M edium synchronous generator. 400 V li ne, 40 kVA, four-pole generator for diesel genset, pilot exciter on the ri ght. (b) Small
AC motor. Induction motor, 400 V l ine, 40 kW. [ Source: M arell i Motori S.p.A.]

8/20/2019 Condition Monitoring Knjiga
http://slidepdf.com/reader/full/condition-monitoring-knjiga 49/306
26 Conditi on monitor ing of rotati ng el ectri cal machines
2.3.6 Connections
Electrical connections are made to the windings via copper busbars or cables that
leave the machine enclosure through bushings into a terminal box. The main three
phase busbars of the 1 111 MVA generator are visible rising from the stator frame inthe centre of Figure 2.1. The busbars may be lightly insulated to protect them against
the environment. The bushings usually consist of the busbar embedded into an epoxy
resin casting, although wound paper bushings may be used on older machines. The
electrical connections are well braced to withstand the large electromagnetic forces
that are developed when fault currents flow. The terminal enclosure allows the proper
termination of the supply cables or busbars, and must be specially designed to suit
the environment in which the machine works. For example, special enclosures are
required for motors that operate in inflammable areas and these incorporate baffles
and seals to ensure that any flashover in the enclosure does not ignite gas or vapour outside the terminal box.
Many machines incorporate brushgear for connection to the rotor windings either
through steel or copper sliprings or through a copper commutator (Figure 2.7(a).
The commutator is a very carefully designed component in which copper segments
interlock with the rotor so that they can withstand the bursting forces acting upon
them. Also, each segment must be well insulated from its neighbours, and mica is
normally used for this purpose. Sliprings are usually shrunk onto an insulating sleeve
mounted on a boss on the rotor shaft, and electrical connections to the sliprings are
insulated and carefully braced to withstand the centrifugal forces upon them. Brushes
are springloaded and mounted in brass brush boxes around the periphery of the rings
or commutator.
Heat exchangers for the cooling system of the machine are mounted on the enclo-
sure or may be a part of it, as shown in Figure 2.7(b). They may be as simple as a
finned casing to the machine to promote convective heat transfer to the surrounding
air or they may be a more complex water-cooled system through which the cooling
gas or air is ducted.
2.3.7 Summary These descriptions show the very wide range of materials that are used in an electrical
machine and Table 2.3 gives a summary of these based on the structure of the machine.
In particular it should be noted how important insulating materials are, both in terms
of volume and cost in the overall structure of an electrical machine. In the following
section this structure of the machine will be discussed in more detail.
2.4 Str uctur e of electr ical machines and their types
The previous sections provided a brief description of the major constructional com-
ponents of an electrical machine and the materials of which they are made. The
difference between the structure for assembly and for reliability will be described in
Chapter 3.

8/20/2019 Condition Monitoring Knjiga
http://slidepdf.com/reader/full/condition-monitoring-knjiga 50/306
Constr uction, oper ation and fail ure modes of electri cal machi nes 27
Table 2.3 M ateri als used in the construction of a typical electri cal machine
Subassembly Component Materials
Enclosure Enclosure
Heat exchanger electrical
connections
Bushings bearings
Fabricated structural steel
Steel, copper or brass tube
Copper or aluminium busbar or cable
Cast epoxy resin
Steel babbitt, high tensile steel rolling
elements or soft bearing alloy on
bearing shells
Stator body Frame
CoreCore clamp
Structural steel
Electrical steel laminations or rolled steel yoke
Structural steel or non-magnetic,
low-conductivity alloy
Stator winding Conductors insulation End
winding support
Hard drawn copper or copper wire
Mica-paper or glass or film
impregnated with resin
Glass fibre structural materials and
impregnated insulation felts, ropes and
boards
Rotor winding Conductors
Insulation
End winding support
Hard drawn copper or copper wire
Mica-paper or glass or film
impregnated with resin
Impregnated glass fibre rope
Rotor body Shaft
Core
Core clamp slip rings
Brushgear
Structural steel or forging
Electrical steel laminations or steel
forging integral with shaft
Structural steel or non-magnetic, low
conductivity alloy steel, brass or copper
Carbon or copper brushes in brass brushholders
In this section the detailed structure for assembly of the electrical machine is
discussed and the effect of different types of machine upon it. This structure is exem-
plified by Figure 2.10. Note the similarity between this 4 kW induction motor and
the 125 MVA synchronous generator shown in Figure 2.2(a).
This structure is also presented in tabular form in Table 2.3 and this will form the basis for considering the faults in machines later in the chapter. Note that generators
require an exciter to provide the field current for their rotor. They generally have
their exciters mounted on the shaft of the main machine and a large generator can
have a pilot exciter and main exciter. The main exciter is clearly visible on the left in
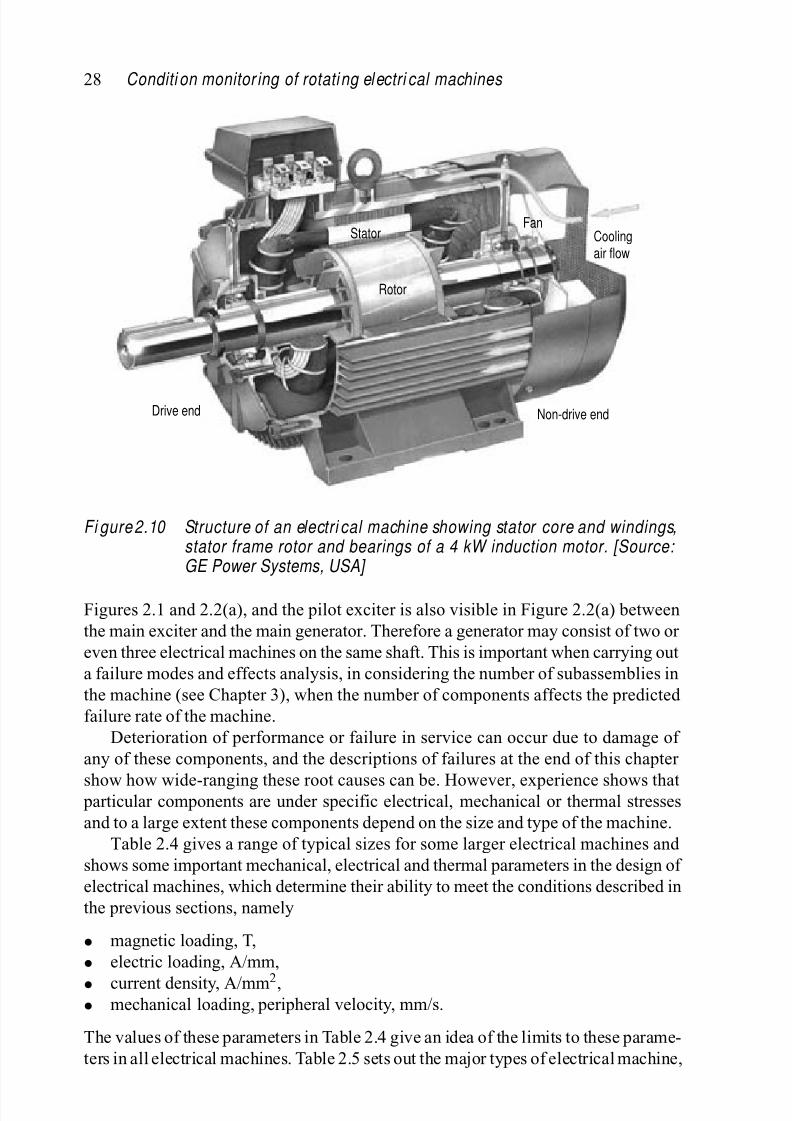
8/20/2019 Condition Monitoring Knjiga
http://slidepdf.com/reader/full/condition-monitoring-knjiga 51/306
28 Conditi on monitor ing of rotati ng el ectri cal machines
Drive end
Stator
Rotor
FanCoolingair flow
Non-drive end
Fi gure 2.10 Structure of an electri cal machine showing stator core and windings,stator frame rotor and bearings of a 4 kW induction motor. [Source: GE Power Systems, USA]
Figures 2.1 and 2.2(a), and the pilot exciter is also visible in Figure 2.2(a) between
the main exciter and the main generator. Therefore a generator may consist of two or
even three electrical machines on the same shaft. This is important when carrying out
a failure modes and effects analysis, in considering the number of subassemblies in
the machine (see Chapter 3), when the number of components affects the predicted
failure rate of the machine.
Deterioration of performance or failure in service can occur due to damage of
any of these components, and the descriptions of failures at the end of this chapter
show how wide-ranging these root causes can be. However, experience shows that particular components are under specific electrical, mechanical or thermal stresses
and to a large extent these components depend on the size and type of the machine.
Table 2.4 gives a range of typical sizes for some larger electrical machines and
shows some important mechanical, electrical and thermal parameters in the design of
electrical machines, which determine their ability to meet the conditions described in
the previous sections, namely
• magnetic loading, T,
• electric loading, A/mm,
• current density, A/mm2,• mechanical loading, peripheral velocity, mm/s.
The values of these parameters in Table 2.4 give an idea of the limits to these parame-
ters in all electrical machines. Table 2.5 sets out the major types of electrical machine,

8/20/2019 Condition Monitoring Knjiga
http://slidepdf.com/reader/full/condition-monitoring-knjiga 52/306
Table 2.4 Sizes and proper ties of some typical large electri cal machines. Taken from Tavner and Anderson [2]
Type of machine
Air-cooled induction
motor
Air-cooled turbine
generator
H2-cooled turbine
generator
Air-cooled hydro
generator
H2O and H2-cooled
turbine
generator
Stator winding
cooling
Air indirect Air indirect H2 indirect Air indirect H2O direct
Stator core
cooling
Air direct Air direct H2 direct Air direct H2 direct
Rotor cooling Air direct Air direct H2 direct Air direct H2 direct
S (MVA) 7.11 125 108.6 100 1 111
P (MW) 6.14 100 92.3 90 1 000
Poles 4 2 2 88 2
Rev/min 1 790 3 000 3 000 68.2 3 000
Core length,
mm
628 4 450 2 800 1 280 7 200
Rotor diameter, mm
742 890 924 12 968 1 200
Typical
weight, tonnes
18 90 120 400 350
Mechanical
loading, rotor
peripheral
velocity (m/s)
69.5 139.8 145.1 46.3 188.5
U (kV) 6.8 15 13.8 15.75 24Magnetic
loading, air
gap flux
density (Trms)
0.9 0.94 0.83 1.05 1
I (A) 604 6 560 4 543 3 666 26 729
Electric
loading
(A/mm)
93.0 116.3 146.8 62.5 255.3
Current
density,
(A/mm2)
3.9 2.8 3.8 3.7 11.1

8/20/2019 Condition Monitoring Knjiga
http://slidepdf.com/reader/full/condition-monitoring-knjiga 53/306
T a b l e 2 . 5
T y p e s o f r o t a t i n g e l e c t r i c a l m a c h i n e
M a i n t y p e o f
m a c h i n e
S u b t y p e s
S i z e r a n g e
M a i n c o n
s t r u c t i o n a l f e a t u r e s
R o o t c a u s e s
S y n c h r o n o u s
m a c h i n e s
S t e a m a n d
g a s - t u r b i n e d r i v e n
g e n e r a t o r
c .
2 5 – 1 5 0 0 M V A
L e n g t h
d i a m e t e r
H o r i z o n t a l l y m o u n t e d
H i g h r o t a
t i o n a l s p e e d ,
1 5 0 0 – 3 6 0 0
r e v / m i n
C l o s e c i r c u i t a i r o r g a s - c o o l i n g
W a t e r c o o l e d s t a t o r w i n d i n g s i n l a r g e r
s i z e s
F o s s i l f u e
l a n d n u c l e a r g e n e r a t i o n
E l e c t r i c a l f a u l t s i n c u r c o n s e q u e n t i a l
d a m a g e
H i g h - s p e e d b a l a n c e p r o b l e m
s
E x c i t a t i o n f a u l t s e x a c e r b a t e
b a l a n c e
p r o b l e m s
S t a t o r e n d w i n d i n g b r a c i n g p r o b l e m s
R o t o r e n d b e l l i n t e g r i t y p r o b l e m s
G a s - c o o l i n g c i r c u i t s e a l i n g p r o b l e m s
W a t e r - c o o l i n g c i r c u i t s e a l i n g p r o b l e m s
H i g h p e r f o r m a n c e o i l f i l m b
e a r i n g s
E n c l o s e d c a s i n g m e a n s d i f f i c u l t t o
i n s p e c t f r e q u e n t l y
W a t e r
t u r b i n e - d r i v e n
g e n e r a t o r
c .
1 0 – 8 0 0 M V A
D i a m e t e r
l e n g t h
V e r t i c a l l y
o r h o r i z o n t a l l y m o u n t e d
L o w r o t a t i o n a l s p e e d ,
8 0 – 3 0 0 r e v / m i n
A i r - c o o l e
d
W a t e r - c o o l e d s t a t o r w i n d i n g s i n l a r g e r
s i z e s
H y d r o e l e c t r i c g e n e r a t i o n
E l e c t r i c a l f a u l t s i n c u r c o n s e q u e n t i a l
d a m a g e
A i r - c o o l i n g a n d h i g h s t r e s s e
s l e a d t o
d i s c h a r g e e r o s i o n o n h i g h - v o l t a g e
w i n d i n g s
R o t o r p o l e i n t e g r i t y p r o b l e m
s
H i g h - p e r f o r m a n c e o i l f i l m t h r u s t
b e a r i n g
E n c l o s e d c a s i n g m e a n s d i f f i c u l t t o
i n s p e c t f r e q u e n t l y
E n g i n e - d r i v e n
g e n e r a t o r
c . 1
0 k V A – 6 0 M V A
L e n g t h ≈
d i a m e t e r
H o r i z o n t a l l y m o u n t e d
M e d i u m r o t a t i o n a l s p e e d
5 0 0 – 1 8 0 0 r e v / m i n
S t a n d b y , C H P , i s l a n d a n d m a r i n e
g e n e r a t i o n
E l e c t r i c a l f a u l t s i n c u r c o n s e q u e n t i a l
d a m a g e
R e c i p r o c a t i n g e n g i n e s g i v e t o r s i o n a l
a n d s e i s m i c v i b r a t i o n p r o b l e m s
A r d u o u s e n v i r o n m e n t c a n c a u s e
p r o b l e m s

8/20/2019 Condition Monitoring Knjiga
http://slidepdf.com/reader/full/condition-monitoring-knjiga 54/306
S y n c h r o n o u s m o t o r 1 – 3 0 M W
L e n g t h ≈
d i a m e t e r
H o r i z o n t a l l y m o u n t e d
W i d e r a n g e o f p o s s i b l e r o t a t i o n a l
s p e e d s 5 0
0 – 6 0 0 0 r e v / m i n
N o r t h A m
e r i c a n t e c h n o l o g y
R e c i p r o c a t i n g a n d t u r b o - c o m p r e s s o r
d r i v e s
H i g h - s p e e d c o m p r e s s o r s g i v
e h i g h
s p e e d b a l a n c e p r o b l e m s
R e c i p r o c a t i n g c o m p r e s s o r s g i v e
t o r s i o n a l a n d s e i s m i c v i b r a t i o n
p r o b l e m s
S t a t o r e n d w i n d i n g b r a c i n g p r o b l e m s
P e r m a n e n t
m a g n e t
m a c h i n e s
S y n c h r o n o u s m o t o r 0 . 5 – 5 0 0 k W
L e n g t h
d i a m e t e r
H o r i z o n t a l l y m o u n t e d
H i g h r o t a
t i o n a l s p e e d ,
5 0 0 – 5 0 0 0 r e v / m i n
V a r i a b l e s p e e d d r i v e a p p l i c a t i o n s
E l e c t r i c a l f a u l t s i n c u r c o n s e q u e n t i a l
d a m a g e
H i g h s p e e d b a l a n c e p r o b l e m
s
S y n c h r o n o u s
g e n e r a t o r
5 – 5 M W
D i a m e t e r
l e n g t h
V e r t i c a l l y
o r h o r i z o n t a l l y m o u n t e d
L o w r o t a t i o n a l s p e e d ,
8 0 – 3 0 0 r e v / m i n
R e n e w a b l e a p p l i c a t i o n s
E l e c t r i c a l f a u l t s i n c u r c o n s e q u e n t i a l
d a m a g e
I n d u c t i o n
m a c h i n e s
G e n e r a t o r s
1 0 0 k V A – 1 0 M V A
H o r i z o n t a l l y m o u n t e d
M e d i u m r o t a t i o n a l s p e e d s
5 0 0 – 3 6 0 0 r e v / m i n
B e c o m i n g c o m m o n i n w i n d g e n e r a t i o n
S h o r t a i r g a p d i v e s a i r g a p s t a b i l i t y
p r o b l e m s l i m i t i n g p e r m i s s i b
l e b e a r i n g
w e a r p a r t i c u l a r i n h i g h p o l e a g e l o w
s p e e d m a c h i n e s
S l i p r i n g a n d b r u s h g e a r p r o
b l e m s o n
d o u b l y f e d m a c h i n e s
M o t o r s
0 . 1
k W – 2 0 M W
L e n g t h ≈
d i a m e t e r
H o r i z o n t a l l y m o u n t e d
W i t h v a r i a b l e s p e e d d r i v e s w i d e r a n g e
o f p o s s i b l e r o t a t i o n a l s p e e d s
5 0 0 – 6 0 0 0 r e v / m i n
U b i q u i t o u s i n d u s t r i a l w o r k h o r s e
H i g h s t a r t i n g c u r r e n t l i m i t s t h e r m a l a n d
f a t i g u e l i f e
S h o r t a i r - g a p d i v e s a i r - g a p s t a b i l i t y
p r o b l e m s l i m i t i n g p e r m i s s i b
l e b e a r i n g
w e a r p a r t i c u l a r i n h i g h p o l e a g e l o w
s p e e d m a c h i n e s
R o t o r c a g e i n t e g r i t y a f t e r m a n y r e s t a r t s
S l i p r i n g a n d b r u s h g e a r p r o
b l e m s o n
d o u b l y f e d m a c h i n e s
C o n t i n u e d

8/20/2019 Condition Monitoring Knjiga
http://slidepdf.com/reader/full/condition-monitoring-knjiga 55/306
T a b l e 2 . 5
C o n t i n u e d
M a i n t y p e o f
m a c h i n e
S u b t y p e s
S i z e r a n g e
M a i n c o n
s t r u c t i o n a l f e a t u r e s
R o o t c a u s e s
D C m a c h i n e s
G e n e r a t o r s
2 0 k W – 5 M W
L e n g t h ≈
d i a m e t e r
H o r i z o n t a l l y m o u n t e d
M e d i u m r o t a t i o n a l s p e e d
5 0 0 – 1 8 0 0 r e v / m i n
D e c l i n i n g
a p p l i c a t i o n g e n e r a l l y f o r
t r a c t i o n a
n d s p e c i a l a p p l i c a t i o n s
C o m m u t a t o r f a u l t s
B r u s h g e a r f a u l t s
C a r b o n d u s t c o n t a m i n a t i o n p r o b l e m s
A s s o c i a t e d c o n t r o l g e a r p r o b l e m s
M o t o r s
1
k W – 2 M W
L e n g t h ≈
d i a m e t e r
H o r i z o n t a l l y m o u n t e d
M e d i u m r o t a t i o n a l s p e e d
5 0 0 – 1 8 0 0 r e v / m i n
D e c l i n i n g
a p p l i c a t i o n t o s p e c i a l i s e d
v a r i a b l e s
p e e d a p p l i c a t i o n s p a r t i c u l a r l y
t r a c t i o n
I n t e r m i t t e n t d u t y t h e r m a l p r o b l e m s
H i g h s h o c k l o a d i n g p r o b l e m
s
C o m m u t a t o r f a u l t s
B r u s h g e a r f a u l t s
C a r b o n d u s t c o n t a m i n a t i o n p r o b l e m s
A s s o c i a t e d c o n t r o l g e a r p r o b l e m s
A C r e l u c t a n c e
m a c h i n e s
M o t o r s
1 – 5 0 k W
L e n g t h ≈
d i a m e t e r
H o r i z o n t a l l y m o u n t e d
M e d i u m r o t a t i o n a l s p e e d
5 0 0 – 1 8 0 0 r e v / m i n
I n c r e a s i n g a p p l i c a t i o n t o s p e c i a l i s e d
v a r i a b l e s
p e e d h i g h t o r q u e a p p l i c a t i o n s
V i b r a t i o n
S t a t o r w i n d i n g d a m a g e
V a r i a b l e s p e e d d r i v e p r o b l e m s
A C c o m m u t a t o r
m a c h i n e s
M o t o r s
2 0 k W – 5 M W
N o w a l m o s t o b s o l e t e i n t h e f a c e o f
p o w e r e l e
c t r o n i c v a r i a b l e s p e e d d r i v e s
a p p l i e d t o
i n d u c t i o n a n d D C m o t o r s
C o m m u t a t o r f a u l t s
B r u s h g e a r f a u l t s
C a r b o n d u s t c o n t a m i n a t i o n p r o b l e m s
A s s o c i a t e d c o n t r o l g e a r p r o b l e m s

8/20/2019 Condition Monitoring Knjiga
http://slidepdf.com/reader/full/condition-monitoring-knjiga 56/306
Constr uction, oper ation and fail ure modes of electri cal machi nes 33
which shows the main constructional features of each type and the factors most likely
to lead to faults.
2.5 M achine specification and failure modes
Many faults occur because machines are incorrectly specified for the application to
which they are being applied. For example, a machine may be underpowered or have
an inadequate enclosure. The specification of a machine must ensure that it is of an
appropriate design for the use to which it is being put. It is a waste of time applying
sophisticated monitoring techniques to a machine that is unfit for its purpose. It is far
better to remove the monitoring and change the machine for one that is more suited
to the application. By the same token many operational problems could be avoided
by using an over-designed machine. For example, in a hot environment it may be
better to use an over-rated machine, which has a substantial design margin, than push
an adequately designed machine to its limit. On the other hand, it is sometimes an
operational fact of life, especially with an expensive machine, that it must continue to
operate even though it suffers from shortcomings in the original specification. In such
cases effective monitoring can help to ease the burden placed upon the maintenance
engineer.
The specification of a machine must reflect the mechanical, electrical and envi-
ronmental conditions in which the machine will work. These matters will have a
bearing on the mechanisms by which the machine may fail in service. The need for monitoring and the selection of the parameters to be monitored must be affected by
these operational conditions. Table 2.6 sets out the operational conditions that are
covered by a specification and that are relevant to monitoring. These operational
conditions are described by Bone and Schwarz [3].
Mechanically, machines can be exposed to periods of intermittent running, fre-
quent starting and to arduous duty cycles, where the load varies frequently between
no-load and full-load with occasional overloads. These can lead to insulation degra-
dation, bearing wear, vibration and slackening of windings, commutator or brushgear.
Similarly a machine driving a pulsating load, such as a compressor, is going to expe-rience heavy bearing wear, vibration and slackening of windings, commutator or
brushgear.
From an electrical supply point of view a machine, by virtue of its location
in a supply system or its task in a manufacturing process, may be subjected to a
variety of transients at its supply terminals. These may be slow fluctuations in the
supply voltage or even unbalance between the three phases that can cause operational
problems, for example, if the machine does not have the thermal capacity to deal
with the overheating that unbalance can lead to. More rapid transients in the supply
voltage, however, can overstress the winding insulation because the electric stress isnot uniformly distributed throughout the winding length. Modern interrupters produce
very rapid voltage surges that were known to break down class B (see Table 2.2) inter-
turn insulation on the line end coils of motors but with modern class F systems this is
now rare. The most severe electrical transients a machine can receive, however, are

8/20/2019 Condition Monitoring Knjiga
http://slidepdf.com/reader/full/condition-monitoring-knjiga 57/306
Table 2.6 Operati onal conditions, defined by specification, w hich affect fail ure mechanisms
Operationalcondition
Nature of condition
Detailed condition
Root causes and failuremodes
Mechanical Characteristics
of the load or
prime mover
Duty cycle
Pulsating load
repeated:
starting
load or drive
vibration
Successive overloads may
cause overheating or bearing
damage.
May cause bearing and low
cycle fatigue damage
Repeated application of high
starting torques may cause
excessive overheating and damage to rotor and stator
end windings
May cause high cycle fatigue
damage
Electrical Characteristics
of the electrical
system and the
machine
connected to it
Slow voltage
fluctuation
Fast voltage
fluctuation
System
unbalance
May cause loss of power and
motor stall or generator
pole-slip
May disrupt generator
excitation or cause insulation
failure in winding
May cause stator winding
heating
Environmental Characteristics
of the
environment in
which the
machine is
being used
Temperature
Humidity
Cleanliness
High ambient temperature
will cause faster insulation
degradation and bearing
deterioration. Low ambient
temperature may cause
frosting and icing
High humidity may lead tocondensation and tracking
damage to insulator surfaces
and corrosion of metal parts
leading to susceptibility to
corrosion fatigue failure
Dirt from the environment
may enter the machine,
contaminating insulation
surfaces, enhancing the
propensity to tracking,fouling heat exchangers and
contaminating brushgear

8/20/2019 Condition Monitoring Knjiga
http://slidepdf.com/reader/full/condition-monitoring-knjiga 58/306
Constr uction, oper ation and fail ure modes of electri cal machi nes 35
during starting or reswitching of the supply, and part of the duty of many machines in
industrial processes is to be repeatedly started and run for short periods. This will cause
overheating, slackening of winding systems, movement of electrical connections and
overstressing of terminal boxes.
Environmentally, there are thermal and contamination problems. The machine
may run exceptionally hot, because of cooling problems, ambient conditions or sim-
ply that the machine is being operated to its rating limit. These can deteriorate its
insulating materials. The machine may be operating in a dirty environment either
because of the industrial process in which it is working, such as a textile or paper
works, or because it has brushgear that produces carbon dust. If dirt can enter the
main coolant circuit it may contaminate windings, bushings and electrical connec-
tions causing a deterioration in insulation integrity. Alternatively, it may foul coolers,
seals, or bearings causing overheating and mechanical damage. The cooling gas may
also become damp because of ambient conditions, for instance in a tropical country,
or due to cooler leakage. Either of these can lead to the condensation of moisture
on the electrical insulation and connections giving a reduced insulation resistance.
A machine needs to be designed to meet the environmental, mechanical and electri-
cal disturbances it is likely to encounter during its life but any monitoring scheme
that is installed should be directed towards detecting the untoward effects of these
disturbances.
2.6 I nsulation ageing mechanisms
2.6.1 General
Electrical insulation faults are a significant contributor to the failure of rotating
machines. Industry studies described in the next chapter indicate that up to one-
third of rotating machine failures can be attributed to loss of function of the stator
winding electrical insulation. Therefore they deserve special consideration before we
consider failure modes in general. However, it should be borne in mind that although
the final failure mode may be electrical breakdown of a dielectric component, the
underlying mechanism driving the breakdown may be thermal, mechanical or envi-ronmental stress as well as electrical factors. This section will cover the basic stresses
that affect the performance of stator winding, stator core and rotor winding insulation
systems on operating machines as well as discussing the roles that design, operation
and maintenance have on the life of the equipment.
Insulation in service is exposed to high temperature, high voltage, vibration and
other mechanical forces, as well as some adverse environmental conditions. These
stresses can act together or individually to degrade insulation materials or systems.
Thermal ageing of insulating material due to high temperatures has been studied the
most and is perhaps best understood. The mechanism may be treated as a chemical rate phenomenon, described by the Arrhenius relationship, and includes loss of volatiles,
oxidation, depolymerisation, shrinkage and embrittlement. In actual service, loss of
insulation system integrity is aggravated by cyclic and transient mechanical forces,
which cause relative movement and abrasion of insulation. Furthermore, insulation
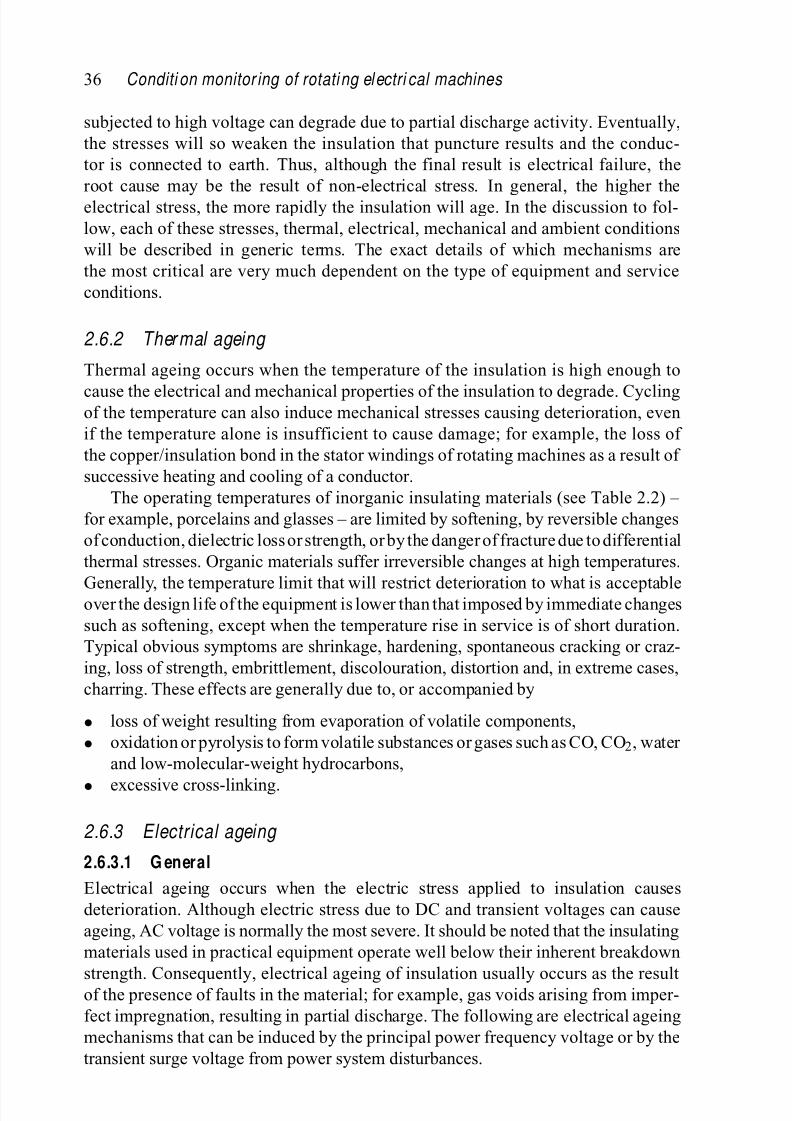
8/20/2019 Condition Monitoring Knjiga
http://slidepdf.com/reader/full/condition-monitoring-knjiga 59/306
36 Conditi on monitor ing of rotati ng el ectri cal machines
subjected to high voltage can degrade due to partial discharge activity. Eventually,
the stresses will so weaken the insulation that puncture results and the conduc-
tor is connected to earth. Thus, although the final result is electrical failure, the
root cause may be the result of non-electrical stress. In general, the higher the
electrical stress, the more rapidly the insulation will age. In the discussion to fol-
low, each of these stresses, thermal, electrical, mechanical and ambient conditions
will be described in generic terms. The exact details of which mechanisms are
the most critical are very much dependent on the type of equipment and service
conditions.
2.6.2 Ther mal ageing
Thermal ageing occurs when the temperature of the insulation is high enough to
cause the electrical and mechanical properties of the insulation to degrade. Cyclingof the temperature can also induce mechanical stresses causing deterioration, even
if the temperature alone is insufficient to cause damage; for example, the loss of
the copper/insulation bond in the stator windings of rotating machines as a result of
successive heating and cooling of a conductor.
The operating temperatures of inorganic insulating materials (see Table 2.2) –
for example, porcelains and glasses – are limited by softening, by reversible changes
of conduction, dielectric loss or strength, or by the danger of fracture due to differential
thermal stresses. Organic materials suffer irreversible changes at high temperatures.
Generally, the temperature limit that will restrict deterioration to what is acceptableover the design life of the equipment is lower than that imposed by immediate changes
such as softening, except when the temperature rise in service is of short duration.
Typical obvious symptoms are shrinkage, hardening, spontaneous cracking or craz-
ing, loss of strength, embrittlement, discolouration, distortion and, in extreme cases,
charring. These effects are generally due to, or accompanied by
• loss of weight resulting from evaporation of volatile components,
• oxidation or pyrolysis to form volatile substances or gases such as CO, CO2, water
and low-molecular-weight hydrocarbons,
• excessive cross-linking.
2.6.3 Electrical ageing
2.6.3.1 G eneral
Electrical ageing occurs when the electric stress applied to insulation causes
deterioration. Although electric stress due to DC and transient voltages can cause
ageing, AC voltage is normally the most severe. It should be noted that the insulating
materials used in practical equipment operate well below their inherent breakdown
strength. Consequently, electrical ageing of insulation usually occurs as the resultof the presence of faults in the material; for example, gas voids arising from imper-
fect impregnation, resulting in partial discharge. The following are electrical ageing
mechanisms that can be induced by the principal power frequency voltage or by the
transient surge voltage from power system disturbances.

8/20/2019 Condition Monitoring Knjiga
http://slidepdf.com/reader/full/condition-monitoring-knjiga 60/306
Constr uction, oper ation and fail ure modes of electri cal machi nes 37
2.6.3.2 Par tial discharges
In general, deterioration from partial discharges will occur in insulation that has voids
created during manufacture or by thermal or mechanical ageing in service. The direct
impingement of discharges on insulation surfaces will cause decomposition of thesolid insulation.
2.6.3.3 Sur face tr acking and moistur e absor ption
Electrical tracking; that is, the formation of conductive or carbonised paths over
an insulation surface, is caused by AC electrical stress. When an insulating surface
collects dust and moisture it can become conducting. The conduction current can
become large enough to swamp the effects of capacitance currents so that the voltage
distribution is no longer determined by capacitances, as for a clean surface, but
depends on how the conductance varies over the surface. The pollution film is never
uniform, and conduction through the film causes drying out that is most rapid in the
regions of highest resistivity. The drying out causes a further increase in resistivity in
these regions, so the effect is cumulative and eventually a dry band is formed across
the insulation. Most of the voltage across the surface appears across this dry band and
flashover can occur over the dry band, constituting a partial breakdown. An arc is
formed in the air adjacent to the dry band, which can do one of three things: extinguish
rapidly, stabilise and continue to burn, or extend in length until it bridges the insulation
causing complete breakdown. In the final stages the arc may grow slowly by thermal
drying, which is a reversible process, or may propagate rapidly and irreversibly due
to the stress concentration at the arc root. Arcs on polluted insulation can propagate
and cause failure at working stresses of 0.02–0.04 kV/mm. These stresses should be
compared with average breakdown stress of 3 kV/mm for uniform fields and 5 kV/mm
for point-plane gaps in air.
2.6.3.4 Tr ansient voltages
Transient or surge voltages can result from a number of causes such as lightning
strikes, switching operations, faults or from the power electronic devices feeding
the machine in the case of adjustable speed drives. Normally, insulation systems
are designed and qualified to withstand lightning and switching surges; however,faster transients, such as those associated with drives or gas insulated switchgear
operations, have been known to cause failures due to the non-uniform voltage distri-
bution resulting from steep-fronted surges. Consequently, part of the design process
requires knowledge of the electrical environment and the surge environment in which
the equipment will be operating. Transient events can also cause failure in older
equipment that has been subject to several years of thermal, electrical, mechanical or
ambient ageing.
2.6.4 M echanical ageing
Mechanical stress is a major direct or indirect contributor to many insulation system
ageing mechanisms. Mechanical ageing is principally produced by relative motion
of insulating components and results from mechanical and electromagnetic forces,

8/20/2019 Condition Monitoring Knjiga
http://slidepdf.com/reader/full/condition-monitoring-knjiga 61/306
38 Conditi on monitor ing of rotati ng el ectri cal machines
resonances, inadequate wedging and bracing, flexing, abrasion and environmental
factors that affect the mechanical properties of the insulation.
2.6.5 Environmental ageing The contamination of insulation systems by water, oils or chemicals can cause insu-
lating materials to degrade mechanically and electrically. Thermal ageing will also
proceed at a faster rate in air than in relatively inert atmospheres such as hydrogen.
The effects of moisture or water absorption are well known. The most common age-
ing effect is the worsening of the electrical properties of the insulation material and
a general tendency to poorer mechanical performance. In practice, the severity of
problems, caused by the presence of moisture in the insulation, is dependent on the
type of insulation system. Older insulation systems containing organic binders and
bonding varnishes are more susceptible to mechanical degradation from water absorp-
tion than modern systems containing inorganic binders and synthetic resins such as
epoxy. However, polyester-based materials can lose their electrical and mechanical
properties in wet environments. Hydrolysis is a mechanism by which moisture causes
rupture of the chemical bonds of the insulation. This tends to cause delamination and
swelling of the insulation exposing it to the risk of failure due to thermal, electrical
or mechanical factors. Oils, acids, alkalis and solvents can also attack certain insulat-
ing materials and bonding agents. Again, organic materials are more likely to suffer
significant deterioration. Contamination of insulating materials with dust can result
in electrical failure due to surface tracking.There are a number of high-voltage applications, such as primary heat transport
pump motors, within the reactor containment area of nuclear generating stations,
where radiation levels can be high. If acceptable insulation life is to be achieved, the
insulation systems used must contain materials with a high radiation resistance to
prevent rapid mechanical deterioration of mechanical properties. Materials such as
ceramics, mica and glass are known to be only slightly affected by the radiation levels
encountered in these areas. Organic materials, on the other hand, are strongly affected
by ionising radiation while polymers with aromatic rings, such as polyamides, will
tolerate higher doses without deterioration. Because of the susceptibility of organicmaterials to radiation damage, great care is required in selecting and qualifying insu-
lation materials and systems for use in these environments. The principle sources with
which the designer is concerned are γ -rays and neutrons that interact with insulating
materials to produce electrons that can be damaging.
The two molecular changes that may be produced by radiation in an organic insu-
lation are cross-linking of molecular chains and bond scission or cutting of polymer
chains. Cross-linking builds up the molecular structure, initially increasing tensile
strength, but then reduces elongation and eventually results in the loss of impact
strength. This changes rubbery or plastic material into hard, brittle solids. Scission breaks down molecular size, reduces tensile strength and usually adversely affects
other properties. In outdoor applications, attention should be paid to the resistance of
insulation to degradation by ultraviolet light that can also result in the embrittlement
of the material.

8/20/2019 Condition Monitoring Knjiga
http://slidepdf.com/reader/full/condition-monitoring-knjiga 62/306
Constr uction, oper ation and fail ure modes of electri cal machi nes 39
2.6.6 Synergi sm between ageing stresses
Typically, the operating environment of most rotating machines results in two or more
of these ageing mechanisms being present. Interactions between the stresses may be
complexand result in unexpected consequences. The complexity introduced by a com- bination of stresses is one of the reasons that most insulation materials, systems and
sometimes components are subjected to sequential application of individual stresses.
Multifactor ageing of insulation materials, which tries to represent the operating
conditions of an insulation system, is performed on sample insulation components in
some cases; however, the results require significant analysis. An understanding of the
synergistic effects between ageing stresses is central to the design of any condition-
monitoring programme since it will affect the selection of the hardware and the
interpretation of the data derived from these sensors and measuring instruments.
2.7 I nsulation failure modes
2.7.1 General
From the preceding sections it can be seen that the means by which electrical machines
fail depends not only on failure modes, which will be discussed in Chapter 3, but also
on the type of machine and the environment in which it is working. However, it is
possible to identify certain basic failure mechanisms that apply to all machines. We
must then identify the early root causes of these faults because it is by detecting theseroot causes that monitoring becomes possible and beneficial.
Any fault involves a failure mechanism, progressing from the initial fault to the
failure itself. The time taken for such a progression will vary, depending on a wide
range of circumstances. What is important, however, is that all faults will have early
indicators of their presence and it is here that monitoring must seek to look and act.
Also, any fault is likely to have a number of possible causes and is likely to give rise
to a number of early indications. A typical route to failure is shown in Figure 3.1.
In this and the following section we will give a description of the ailments with
which electrical machines are afflicted. A detailed schedule of failure mechanisms for electrical machines is given in the Appendix where the failure modes and root causes
for electrical machines are elaborated. By studying the Appendix the reader can iden-
tify what parameters should be worth monitoring in order to give an early indication
of a particular fault. However, the general overview in the Appendix may fail to give
the reader a clear image of the faults they may encounter on their machines. We will
therefore describe in these sections a number of specific machine failure modes that
draw out many of the factors that need to be considered in any monitoring system.
Most of these incidents have been taken from the authors’ experiences, so detailed
references do not exist. However, various electrical machine users have tried to record their own failure statistics and typical results are summarised in References 4–9. Insu-
lation faults present some of the most challenging problems for electrical machines, so
this section will begin with the major insulation failure modes of electrical machines
and then follow with other failure modes.

8/20/2019 Condition Monitoring Knjiga
http://slidepdf.com/reader/full/condition-monitoring-knjiga 63/306
40 Conditi on monitor ing of rotati ng el ectri cal machines
2.7.2 Stator winding insulation
2.7.2.1 G eneral
Stator winding insulation is affected by all of the aforementioned stresses: thermal,
electrical, environmental and mechanical; however, the extent to which these stressesin normal operation will cause problems in the short- or long-term will depend on fac-
tors such as the operating mode and type of ambient cooling conditions. For example,
air-cooled machines tend to be subject to higher rates of thermal ageing compared
to generators with direct liquid cooling of the stator winding. Further, generators
with this type of cooling usually operate in a compressed hydrogen atmosphere thus
eliminating oxidation.
2.7.2.2 D elamination and voids
Stator winding insulation is a laminated system consisting of numerous layers of
mica-paper tape on a fibreglass backing material impregnated and consolidated with
a synthetic resin, usually epoxy or polyester-based. The stator windings of rotating
machines built prior to 1970 are likely to contain a bitumenous resin instead of
epoxy or polyester. Further, these older insulation systems tend to employ large-flake
mica rather than mica-paper. Consequently, the results derived from any condition-
monitoring tool that is focused on stator winding insulation must be viewed in the
context of the differences in these materials. While the older thermoplastic resins
flow at relatively low temperatures, around 70 C, causing resin migration leading to
void formation and embrittlement of the main groundwall insulation, the high micacontent provides significant resistance to partial discharge deterioration. Further, the
propensity of bitumen-based insulation to soften at elevated temperatures permits the
groundwall to conform to the walls of the stator core slot. The lack of this property in
modern thermoset insulation systems based on synthetic resins resulted in the type of
problems discussed next. Consequently, the use of age as a reliable index of machine
health is not supported.
Voids or delaminations in the groundwall insulation of stator windings may result
from the manufacturing process and/or operating stresses. The presence of voids in
new stator windings, although not desirable and should be minimised, does not neces-sarily imply that the winding be rejected or that it is not fit for the design life intended.
Application of various diagnostic tests, such as partial discharge and dielectric loss,
as well as potentially destructive overvoltage tests, aid in the production of stator
windings with minimal void content. During the life of the machine, these initial
delaminations (or those initiated by thermal, mechanical or electrical stress) may
result in the growth of voids that are prone to partial discharge. The probability that
a void will be subject to partial discharge is governed by a number of factors such as
void dimensions, electrical stress, pressure, temperature and the presence of initial
electrons to cause discharge inception.A partial discharge is so-called because it represents a gas breakdown between
two dielectric surfaces or between a conductor and a dielectric surface. Details of the
physics of the process can be found in Pedersen et al . [10]. Partial discharge, similar
to any gas breakdown, results in the emission of heat, light and sound as well as the
8/20/2019 Condition Monitoring Knjiga
http://slidepdf.com/reader/full/condition-monitoring-knjiga 64/306
Constr uction, oper ation and fail ure modes of electri cal machi nes 41
production of electrons and ionic species. Depending on the energy of the discharge,
erosion of the void walls will result causing growth of the delamination and poten-
tially failure in the long term. However, from a practical perspective stator winding
failure caused by internal void discharge is very uncommon and is not considered by
manufacturers and users of rotating machines to be a significant problem. There are
two principle reasons that void discharge does not lead to rotating machine failure.
1. The presence of mica, a material that is extremely resistant to electrical discharge
attack, results in the partial discharge erosion occurring only in the organic bind-
ing resin component. Consequently, the electrical breakdown path must follow
a very circuitous route from the initiation site to the grounded core iron before
failure can result. Typically, the initiation point is located at the edge of the copper
conductor stack. Thus, the time-to-failure for such a process is very long, in the
order of decades.2. The widespread application of on-line partial discharge monitoring equipment as
well as advances in the interpretation of the data produced by these tools. Use
of partial discharge monitoring equipment has enabled machine users to better
determine the condition of stator winding insulation in operating machines and to
take corrective action at early stages. Although there is little maintenance avail-
able to remediate the presence of voids in the groundwall insulation, actions such
as maintaining the integrity of the slot support system or reducing the operating
stresses on the machine may arrest the process.
Thus, although void discharge has been and continues to be a subject of intense study
by academic and other research organisations, failure of stator winding insulation from
this mechanism is of low probability. The use of partial discharge measurements is of
value, however, because partial discharge is a symptom of many other stator winding
deterioration mechanisms that can cause failure. These mechanisms will be discussed
below.
2.7.2.3 Slot discharge
Slot discharge or high-energy discharge is a very damaging deterioration mecha-nism found generally, but not exclusively, in air-cooled machines. Left undetected
or uncorrected, failure from this type of mechanism can result in a relatively short
period of time, two to three years. Slot discharge is the term used to describe a dis-
charge occurring between the surface of the stator coil or bar and the grounded core
iron. Generally, this mechanism results from a loss of good electrical contact between
the insulated bar or coil surface and the stator core. Rotating machines rated above
3.3 kV employ a resistive coating applied to the slot portion of the stator coil or bar to
promote good electrical contact with the core. Deterioration of this coating or loss of
contact between bar surface and core iron can lead to conditions favourable for slotdischarge.
The key to preventing slot discharge is to minimise differential movement between
stator winding and core. Consequently, significant effort is expended by machine man-
ufacturers and users to maintain the integrity of the slot support system; that is, the

8/20/2019 Condition Monitoring Knjiga
http://slidepdf.com/reader/full/condition-monitoring-knjiga 65/306
42 Conditi on monitor ing of rotati ng el ectri cal machines
tightness of the stator wedges that restrain the winding in the slot. During the transi-
tion from thermoplastic to thermoset insulation systems, a significant increase in slot
discharge problems on large air-cooled machines was observed by Lyles et al . [11,12].
The failure modes of large hydro generators, of the type shown in Figure 2.6, were
described by Evans [13]. In these cases, the new hard insulation systems did not con-
form well to the stator slot unlike the older thermoplastic insulations. Consequently,
significant vibration of the stator winding was encountered that led, during operation,
to cyclical isolation of the stator bar or coil surface from the core iron. The resultant
loss of electrical contact with the grounded core at one or more points along the coil or
bar surface caused the surface potential on the bar to rise to line-to-ground potential. If
this potential was sufficient to break down the gas gap between bar and core iron then
a high energy discharge would result. Over a period of time these discharges would
erode the resistive surface coating leaving isolated non-conducting areas that further
exacerbated the problem since these locations would become capacitively charged,
resulting in further discharge and erosion of the groundwall insulation itself.
A further mechanism leading to slot discharge in machines with apparently good
bar-core iron contact resulted from abrasion of the resistive coating and the creation of
isolated insulating patches on the bar or coil surface [14,15]. Wilson et al . identified
the critical conditions leading to slot discharge for this case and also demonstrated
analytically that the problem could also occur throughout the winding and not be
limited to the high voltage coils or bars. This finding was borne out by experience in
the field that found visual evidence of slot discharge damage at, or close to, the neutral
point of the windings of large hydraulic generators as described by Lyles et al . [11,12].Slot discharge can be identified using on-line partial discharge measurements.
The partial discharge behaviour of slot discharge tends to be characterised by
• large magnitude pulses with a predominance of one polarity depending on how
the measurement is accomplished,
• the position of the occurrence of the partial discharge pulses, which may vary over
the power frequency cycle since the discharge is occurring between a capacitively
charged surface and the core iron and these surfaces are, due to vibration, not at
well-defined positions with respect to one another,• rapid increase in partial discharge magnitudes over a relatively short period of
time, such as doubling of pulse magnitudes over six months.
The production of ozone in open-ventilated air-cooled machines is both a symp-
tom of slot discharge and ultimately a life-limiting fault in itself. Ozone is a strong
oxidising agent and will have a negative effect on insulating and conducting mate-
rials. However, very often those machines that are producing excessive ozone are
removed from service and rewound because the concentrations of ozone exceed the
limits prescribed by health and safety legislation for workers.
2.7.2.4 Stator end windings
From the perspective of electrical insulation, the end windings of rotating machines
are prone to environmental and mechanical rather than electrical ageing. Assuming

8/20/2019 Condition Monitoring Knjiga
http://slidepdf.com/reader/full/condition-monitoring-knjiga 66/306
Constr uction, oper ation and fail ure modes of electri cal machi nes 43
that factory and/or acceptance overvoltage tests have demonstrated that the end-
winding clearances have been properly designed and manufactured, the key problem
areas for end windings are as follows.
• Sur face contaminati on . The design and testing of the clearances in end windingsare performed from the context of clean and dry insulating surfaces. However,
air-cooled machines, especially motors, often operate in ambient conditions
containing high levels of conducting contaminants such as salt, cement dust,
lubricating oil and brake dust. Over time, and in the presence of moisture,
these conductive layers distort the electrical field in the end winding and lead to
surface tracking. This deterioration mechanism if not corrected may lead to seri-
ous problems including phase-to-phase failure of the machine. Partial discharge
measurements can be used to detect the presence of contaminated end windings.
• Internal voids . Until relatively recently, the end-winding portion of stator barsand especially stator coils tended to be taped manually rather than by machine, as
is the case in the slot cell. Consequently, the insulation of the end-winding region
is prone to contain voids or delaminations. The presence of such faults is not as
critical as for the slot cell of the winding because the electrical stress in this area
is relatively low.
• M echanical aspects . The end-winding structure of a rotating machine, especially
for large turbine generators, represents several challenges for designers. Apart
from electrical clearance, the major issues are minimising vibration and differ-
ential movement. Modern synthetic insulation systems are quite rigid and thus prone to cracking either due to long-term cyclic fatigue in normal operation or
transient events causing end-winding distortion such as a close-in transformer
fault. Unfortunately, while the behaviour of insulating materials in this region of
the machine is considered of significant interest, relatively little work has been
done to develop a similar understanding of the creep and fatigue properties that
exist for metals.
2.7.2.5 End-w inding str ess gr ading
End-winding stress grading systems tend to be found on machines rated 6.6 kV and above. Their role is to reduce the electric field at the surface of the stator bar or
coil where it exits the core slot. Without application of such a material, there is a
high probability of surface discharge or even flashover from the capacitively charged
insulating surface back to the core iron. The functionality of the stress grading system
may be compromised by surface contamination or improper design and processing
of the interface between the end-winding grading and slot stress control systems. In
the latter case, a combination of electrical and thermal effects can cause erosion of
the junction between the two systems, potentially resulting in an increase in surface
discharge activity. While this fault can appear serious the discharges tend to be trans-verse to the surface resulting in a low probability of failure due to this mechanism.
Empirical evidence indicates that when the junction between end-winding and slot
stress control systems has been completely disrupted, and the electrical contact lost,
the surface discharges cease.

8/20/2019 Condition Monitoring Knjiga
http://slidepdf.com/reader/full/condition-monitoring-knjiga 67/306
44 Conditi on monitor ing of rotati ng el ectri cal machines
2.7.2.6 Stator winding inter-tur n faults
A common failure mechanism on machines employing multi-turn stator coils is break-
down of the turn insulation. The resultant short circuit between the copper turns causes
a significant circulating current to flow in the coil leading to rapid deterioration and failure. Turn failures tend to be very destructive, and involve burning of the insula-
tion and localised melting of the copper conductors. Often, failures resulting from
breakdown of the inter-turn insulation are inferred from the location of the puncture,
typically at or near the core exit, and the electrical position in the winding, typically
the first or second coil from the line end.
During the 1980s, an Electric Power Research Institute study investigated the
reasons for an apparent increase in the number of turn failures experienced by North
American utilities. Initially, the increase in breakdowns was attributed to the increase
in the use of vacuum circuit breakers as replacements for conventional magnetic air
circuit breakers. The steep-fronted, high-magnitude transients generated during oper-
ation of the vacuum circuit breaker was considered to exceed the capability of the
turn insulation. However, the Electric Power Research Institute study concluded that
the principal reason for the perceived increase in turn insulation failures was inad-
equate turn insulation. Those machines that incorporated dedicated turn insulation
consisting of either mica-paper tape or double Daglas were found to have superior
capability of withstanding the steep-fronted surges imposed by vacuum circuit break-
ers as well as being able to withstand the rigours of steady-state operation at power
frequency. The use of dedicated turn insulation provides abrasion resistance in the
event of differential movement between turns due to thermal or thermomechanicalageing.
Early detection of the onset of conditions likely to lead to breakdown of inter-turn
insulation may be possible using partial discharge methods and/or techniques based
on axial leakage flux detection, investigated by Penman et al . [16,17]. With regard to
partial discharge-based methods, a significant practical problem is that although the
deterioration of the inter-turn insulation can, in principle, be detected, attributing the
detected signals to this deterioration mechanism in the presence of partial discharge
pulses originating from other faults is practically impossible.
2.7.2.7 R epetitive tr ansients
Variable speed drives based on electronic inverters are widely applied on low-voltage
(600 V and below) motors. Insulation problems have been experienced on these
largely random wound machines resulting in failures. The bulk of the failures have
been attributed to electrical discharges in the end windings of these machines. The
steep-fronted surges generated by the insulated gate bipolar transistor (IGBT) devices
employed in these drives may cause voltage doubling resulting in transient voltages
that exceed the electric field required to cause breakdown in the air around the end
windings. The insulation systems employed in random wound machines, typically polyester-based enamels and Daglas, have poor discharge resistance and are thus
prone to failure in the presence of such discharges. Steps to mitigate this problem
include: better design of the winding, to minimise areas of high electrical stress;
consideration of the length of cables used to connect to the motors, to reduce the

8/20/2019 Condition Monitoring Knjiga
http://slidepdf.com/reader/full/condition-monitoring-knjiga 68/306
Constr uction, oper ation and fail ure modes of electri cal machi nes 45
probability of voltage doubling; the use of multi-converter topologies; and the use of
metal-oxide loaded enamels to grade the winding electric stress. High-voltage motors,
employing form wound stator windings, are less prone to the deterioration mechanism
described on p. 42 although some consideration is being given to the behaviour of
the resistive slot stress control material under repetitive transient conditions.
2.7.3 Stator winding faults
2.7.3.1 Stator winding faults (all machines)
It is clear that the insulation system is potentially one of the intrinsically weakest
components of an electrical machine, both mechanically and electrically and in the
earliest days of machine construction insulation faults were excessively frequent, as
described by Walker [18].
However, as described on p. 20, modern techniques of winding manufacture, usingthermosetting resin or vacuum pressure impregnated insulation, provide systems that
are mechanically tough and electrically sound. Nonetheless, modern machine use
drives insulation systems to their thermal, mechanical and electrical limits. How-
ever, there are very few incidences of failures on machines due simply to ageing of
insulation. A very thorough review of root causes of failures and failure modes in
insulation systems and conducting components is given in Stone et al . [19]. An exam-
ple of a generator winding failure is shown in Figure 2.11 and the final puncture of
the insulation system was the result of accelerated ageing due to an over-temperature
F igure 2.11 Stator fault in a 15 kV generator winding. View shows the main-wall insulation punctured in the top r ight as a result of core overheating.

8/20/2019 Condition Monitoring Knjiga
http://slidepdf.com/reader/full/condition-monitoring-knjiga 69/306
46 Conditi on monitor ing of rotati ng el ectri cal machines
in the adjacent generator core. An exception to this may be on air-cooled, highly
rated hydro-generators where epoxy mica insulation has failed due to erosion of the
insulation in the slot portion as a result of discharge activity, primarily because of
the rigidity of epoxy mica systems, the large forces on such large conductor bars, the
high dielectric stress on the windings and the fact that these machines are air-cooled.
However, failures due to isolated insulation faults do occur, due to manufacturing
faults such as voids or foreign bodies embedded in the main wall insulation, or pen-
etration of the insulation by foreign material such as oil or metal from elsewhere in
the machine.
Whether insulation failure occurs due to ageing or the action of an isolated fault,
the indications are similar in that there will be an increase in discharge activity in
the machine culminating in an insulation puncture like that shown in Figure 2.11.
Faults can also occur in low voltage windings, which are generally dipped in varnish
and do not experience high-voltage discharge. Figure 2.12 shows a typical failure
in a round wire winding that is varnish impregnated showing the effect of moisture
contamination and tracking that has eaten away part of the winding slot liner causing
a fault to earth.
Fi gure 2.12 Stator fault on a 200 V exciter winding. View shows the effect of moisture contaminati on and tr acking.
2.7.3.2 W inding conductor faults (gener ator s)
These faults are again generally confined to large generators where the current densi-
ties are such that the stator winding is electrically, thermally and mechanically highlystressed. It is normal to subdivide the conductor into a large number of subconductors
and to insulate and transpose them to minimise winding losses. In the most modern
machines the transposition is distributed throughout the conductor length employ-
ing the Roebel technique. This gives a uniform current distribution and minimises

8/20/2019 Condition Monitoring Knjiga
http://slidepdf.com/reader/full/condition-monitoring-knjiga 70/306
Constr uction, oper ation and fail ure modes of electri cal machi nes 47
the voltages between subconductors. Older machines, however, have the transposi-
tions made in the end winding at the knuckle joint and quite large voltages, up to
50 V root mean square (rms), can exist between subconductors. If severe mechanical
movement of the winding occurs during operation and the subconductor insula-
tion fails then subconductors can short together causing arcing. A number of older
machines have failed in the UK and US due to this arcing, which in the worst cases has
eroded and melted other subconductors, pyrolysing the main wall insulation of the
conductor bar. If this happens in the slot portion or near to other earthed metalwork,
then an earth fault can occur but if not, it is possible for the debris ejected from the burnt
area to produce a conducting path between electrical phases of the winding leading to
the more serious phase-to-phase fault, as shown in Figure 2.13. Subconductor arcing
has also been initiated by fatigue failure of subconductors, where the conductor bar
emerges from the core or enters a water box, due to excessive and winding vibration.
The consequences of such a failure are very similar to those of a subconductor short.
When this arcing takes place in a machine with hollow water-cooled subconductors,
perforation of a subconductor occurs and, since they are usually arranged so that there
is an excess of cooling gas pressure over the water, this leads to a leakage of gas into
the water-cooling system. The early indicators of such faults are arcing activity within
F igure 2.13 Example of the effects of a stator subconductor fault in a 588 MVA,23 kV, 50 Hz turbine generator winding. View shows stator conductor bars ejected into the generator air-gap and seriously disrupting the end wi nding. [ Taken from Tavner et al. [ 7] ]

8/20/2019 Condition Monitoring Knjiga
http://slidepdf.com/reader/full/condition-monitoring-knjiga 71/306
48 Conditi on monitor ing of rotati ng el ectri cal machines
the winding and the pyrolysing of insulation. The fact that burning takes place deep
within a conductor bar usually means that, initially at least, only small quantities of
particulate and gaseous matter produced by the burning are released into the cooling
gas circuit. Where water-cooled subconductors are present the fault causes a leakage
of gas into the winding cooling system.
2.7.3.3 Stator end-winding faults (all machines)
A considerable amount of effort over the whole range of machines has gone into the
design of end-winding structures. The first objective is to restrain the end winding
against the large forces on the windingduring transient loading or faults and the second
is to cushion the conductor bars against the smaller forces during steady, continuous
running. End-winding movements are larger on the older, less rigid, bituminous mica
insulation system but then that system, because of its softness, was more able to with-stand the steady fretting action of normal running than the hard epoxy-mica systems.
In either case end-winding movements in normal operation are quite significant and
can be as much as a few millimetres on a large turbine generator.
Faults occur in the end winding when the bracing structure slackens, due to tor-
sional and lateral vibration, either as a result of a succession of unusual overloads
or because of an extended period of continuous running. In some cases end-winding
insulation becomes cracked, fretted or worn away. In the limit a full line to line fault
can lead to a catastrophic failure of the end winding as shown in Figure 2.13. On the
largest machines fatigue failure of conductors can occur when the winding becomes
slack enough to permit a significant amount of conductor movement during normal
operation or during the much larger forces of starting or reswitching. In addition,
seismic excitation of the relatively weak end-winding structure can occur in applica-
tions with inherent vibration where the machine is mounted on a flexible foundation
and this has been a major cause of end-winding failures in the offshore industry.
Foreign bodies inside a machine such as steel washers, nuts or small portions
of insulation, get thrown around by the rotor. Damage is caused by these objects,
usually in the stator end-winding region, where the insulation is damaged by impact
or eroded by debris worming into the insulation under the action of electromagnetic
forces. The early indications of problems are an increase in end-winding vibration
and the possibility of electrical discharge activity to nearby earth planes.
2.7.3.4 Stator windi ng coolant system faults
Many large machines employ direct or indirect liquid cooling of the stator windings to
permit operation at higher energy densities. In the vast majority of cases, the coolant
medium is water; however, a small number of designs use oil. Consequently, there is
a risk that the coolant path will deteriorate resulting in the release of water, of varying
levels of purity, onto insulating or high voltage components resulting in deteriorationand potentially failure of the machine.
Large steam turbine generators employ direct liquid cooling of the stator wind-
ings in that demineralised water flows through hollow subconductors. Most designs,
whether single- or two-pass, use a manifold at one or both ends of the winding that

8/20/2019 Condition Monitoring Knjiga
http://slidepdf.com/reader/full/condition-monitoring-knjiga 72/306
Constr uction, oper ation and fail ure modes of electri cal machi nes 49
connects to the individual stator bars using insulated (Teflon) hoses (see Figure 2.5(a)).
Catastrophic failure of the hose or the connection of the hose to the bar or manifold
will result in water impinging on the stator winding. Depending on the condition
of the water, such an event may not cause an immediate stator earth ground alarm
or fault; however, the coolant loop pressure and stator winding temperature will be
affected. Smaller leaks would likely result in gas-in-coolant alarms and potentially
gas-locking.
Some types of turbine generators employ a plenum that connects a group of stator
bars directly to the water circuit without the use of hoses. The plenum consists of
cast insulating epoxy components, mechanical failure of which will cause loss of the
coolant circuit and water impingement on the stator winding. Other sources of poten-
tial water leaks onto the stator winding include faults in the hydrogen coolers. In this
case, the water is likely to have a relatively high conductivity and would have a high
probability of causing a stator ground fault alarm and ultimately fault.
Water leaks into the bulk of the stator winding insulation can also occur. This
water ingress has been observed on liquid-cooled stator windings using the clip design
where the connection of the stator bar to the coolant system is affected. Pinhole leaks
appear after a few years of service and moisture propagates along the brazed joint
until contact with the strand insulation. The moisture further wicks into the insulation
degrading the dielectric properties. Two principle root causes for moisture ingress
into stator winding insulation are
• crevice corrosion, resulting from chemical reaction between the coolant water
and the braze material,
• deficiency in the quantity of brazing material. The initial brazed joint is tight,
but over time vibration and thermal stresses cause voids in the braze to connect
creating a channel for the water.
In principle, the presence of a leakage channel in the brazed region should result
in a gas-in-coolant alarm. However, the insulation covering the water box is very tight
and hydrogen does not migrate easily through it. Therefore, water box leaks detected
in this way are rare.
Water ingress in the insulation wets the material to up to ten times the initial mois-ture level. Another consequence of water ingress in the groundwall insulation is a drop
in insulation resistance. This resistance decay can be quite slow. It is considered that it
takes about five years for water to migrate and cause a significant insulation drop. This
is the main mechanism for stator winding failure due to water box leaks. Several stator
earth fault failures are due to water ingress and thus to water box leaks. So far, water
box leak detection methods have been based on detecting one of the consequences of
the water ingress. However, no reliable on-line method has been developed.
In addition to problems caused by coolant leaks, serious damage can be caused
by blocking of the coolant flow in stator windings. Depending on the location and number of plugged subconductors catastrophic failure due to overheating can occur
rapidly. Other than blockages caused by foreign material entering the coolant loop and
gas locking, flow restrictions can result from the deposition of copper oxide deposits.
These deposits may result from poor control of stator water chemistry.

8/20/2019 Condition Monitoring Knjiga
http://slidepdf.com/reader/full/condition-monitoring-knjiga 73/306
50 Conditi on monitor ing of rotati ng el ectri cal machines
Plugging or flow restriction of the coolant medium in the hollow subconductors
of liquid-cooled stator windings can have serious if not catastrophic implications
for the reliable operation of large steam turbine generators. Significant efforts have
been and continue to be expended on understanding the fundamental mechanisms
resulting in coolant flow restriction. Apart from loose debris in the coolant circuit, the
predominant cause of blockage is corrosion of the copper conductors resulting in the
deposition of copper oxides that tend to clog the small-aperture hollow subconductors.
Consequently, much of the work in this field has focused on the chemistry of the
coolant water.
Unfortunately, for some utilities plugged subconductors are already a reality,
resulting in the derating of units and/or the implementation of complex flushing and
cleaning procedures. Again, many organisations are pursuing work to understand
and optimise these remedial actions. Consequently, significant work is underway, or
has already been performed, to understand the plugging mechanism and the means
to prevent or remedy it. These efforts are necessary to enable utilities to maximise
reliability and availability of their generators. However, there is a third aspect to
this problem; namely, for those utilities experiencing overheating due to plugged
subconductors, how best to manage the situation so as to minimise revenue loss
while ensuring that the stator winding suffers no undue loss of life.
Early detection of stator bar overheating due to plugging is complicated because
of, in many cases, the dearth of sufficient temperature and flow data. Even where
significant quantities of temperature data exist, such as on hose-type machines with
thermocouples on the outlets, the location of the temperature sensor with respect tothe hot spot increases the difficulty of successful early plugging detection. Some
organisations have recognised this problem and have attempted to address it by
detailed thermohydraulic modelling of the stator winding and/or the implementa-
tion of post-processing of the temperature. Notwithstanding these efforts, operators
of large steam turbine generators presently lack tools to objectively assess the
risks associated with operating machines with known or possible subconductor
plugging.
2.7.4 Rotor winding faults 2.7.4.1 G eneral
The rotor windings of generators are insulated with epoxy-glass laminates or
polyester-based materials (Nomex). Squirrel cage induction motor rotor windings
consist of lightly insulated copper bars driven into the slots in the case of a laminated
rotor or aluminium bars cast directly into the rotor. The principal stresses of concern
on rotor windings are thermal and mechanical.
2.7.4.2 I nduction motor rotor faults
Faults on the rotor windings of induction motors have not been easy to detect because
there is not necessarily an electrical connection to the winding and it is difficult
to measure the low-frequency currents induced in the rotor winding. Although the
rotor winding of a squirrel cage induction motor is exceptionally rugged, faults do

8/20/2019 Condition Monitoring Knjiga
http://slidepdf.com/reader/full/condition-monitoring-knjiga 74/306
Constr uction, oper ation and fail ure modes of electri cal machi nes 51
occur particularly on the larger machines when they are subjected to arduous thermal
and starting duty, which causes high temperatures in the rotor and high centrifugal
loadings on the end rings of the cage (see Figure 2.14).
Broken bars – note: bars have lifted from slots
Ventilating ducts
End ring
Rotor coreRotor shaft spider assembly
Fi gure 2.14 Rotor cage fault i n a 1.5 M W squir rel cage induction motor [ Taken from Thomson and Fenger [20]. © IEEE (2001)]
Faults may occur during manufacture, through defective casting in the case of die
cast rotors, or poor jointing in the case of brazed or welded end rings. Such a fault
results in a high resistance, which will cause overheating, and at high temperatures
the strength of the cage will be impaired. Cracking may then occur in the rotor bar and
indeed usually takes place at the cage end rings where the bars are unsupported by
the rotor core. Similar faults can occur because of differential movement of the cage
in the rotor slots, because of a succession of periods of high temperature running and shutdowns. This can lead to distortion and ultimately cracking of the end rings and
the associated bars. It should be remembered that the bars must provide the braking
and accelerating forces on the end ring when the motor changes speed. If the motor
speed fluctuates, because of changing load or as part of the normal duty cycle, then
high-cycle fatigue failures can occur at the joints between bars and ring. If the motor
is repeatedly started then the exceptional starting forces may lead to low-cycle fatigue
failure of the winding component. The early indications of these faults are pulsations
in the speed, supply current and stray leakage flux of the machine.
The rotor windings of wound rotor induction motors are of rather similar design tothe stator winding of the motor except that the end windings must be restrained against
centrifugal forces by steel wire or woven glass fibre banding rings. Damage to the
windings usually occurs in the end region due to centrifugal forces on the crossovers
and connections of the winding causing shorts between turns. These faults are similar

8/20/2019 Condition Monitoring Knjiga
http://slidepdf.com/reader/full/condition-monitoring-knjiga 75/306
52 Conditi on monitor ing of rotati ng el ectri cal machines
to the problems experienced on the rotor windings of high-speed turbine-type gener-
ators. An additional difficulty encountered with the wound rotor machine is that of
ensuring balance between the phases of the external resistors connected to the winding
via the slip rings. These resistors are usually water-based and can become unbalanced
with time, causing the currents flowing in the rotor windings to become unbalanced
and overheating to occur. This can lead to the rapid degradation of rotor winding
insulation and ultimately failure such as that shown in Figure 2.15. The problem is
difficult to detect because the rotor currents are at a very low slip frequency and one
must be able to detect relatively small changes in these currents.
Fi gure 2.15 Rotor winding fault i n a 3 MW sli p ri ng induction motor. View shows arcing damage between the phases in the winding end region. [Taken from Tavner et al. [7]]
2.7.4.3 Tur bine gener ator rotor winding faults
The rotor winding insulation and bracing system in turbine generators must be
designed to withstand the extremely high centrifugal forces present during operation.
An inter-turn short-circuit can occur between rotor turns due to puncture or crack-
ing of the turn insulation. The current that subsequently flows between turns createslocalised heating and the probability of further shorted turns. This disturbance of
the current flow will cause an asymmetry in the flux in the machine, which causes
unbalanced magnetic pull (UMP) leading to vibration of the rotor and this can be
compounded when the asymmetric heating leads to thermal bending of the rotor.

8/20/2019 Condition Monitoring Knjiga
http://slidepdf.com/reader/full/condition-monitoring-knjiga 76/306
Constr uction, oper ation and fail ure modes of electri cal machi nes 53
Two- and four-pole totally enclosed machines are particularly prone to these prob-
lems especially if they have a short airgap that will have a reduced coolant gas flow
and therefore rotor temperatures can be higher. Differential movement between turns
and fretting action in the rotor winding can produce copper dust, which may also
increase the probability of turn shorts. This phenomenon occurs because of the cyclic
movement that a large winding experiences relative to the rotor. The movement is
partly caused by self-weight bending of the rotor and thermal cycling. This prob-
lem can also be exacerbated by long periods of barring or turning gear. During this
type of very low speed operation, there are little or no centrifugal forces that act
to lock the key internal rotor components in place and hence minimise differential
movement.
If an insulation fault occurs between the winding and rotor body then a ground
fault current flows that can be detected by an earth leakage relay. The ground fault
current is limited such that a single ground fault is not serious but a second ground
fault can result in very large circulating currents. A second ground fault can cause an
arc to be struck at the fault location not only causing winding damage but also severe
damage to the rotor forging. The early indications of these faults are distortion of the
airgap flux and associated stray leakage flux around the machine, and an increase in
bearing vibration. Therefore the early indications of these faults are usually excessive
transverse bearing vibrations, although attention has also focussed on measuring the
torsional oscillations of the shaft itself.
F igure 2.16 Fai lure of a DC armature winding close to the commutator

8/20/2019 Condition Monitoring Knjiga
http://slidepdf.com/reader/full/condition-monitoring-knjiga 77/306
54 Conditi on monitor ing of rotati ng el ectri cal machines
2.7.4.4 R otor winding faults (D C machines)
DC machines encounter particular difficulties in their armature, where the AC winding
is directly connected to the commutator and electrical action between brushes and
commutator segments can lead to high temperatures and the production of carbondust. A common problem with DC armature windings is failure between conductors
close to the commutator connection (Figure 2.16 shows just such a failure) possibly
aggravated by the accumulation of carbon dust under the banding that provides the
centripetal force to retain the winding in place close to the commutator connections.
2.8 O ther failure modes
2.8.1 Stator core faults
A core fault is a rare event, which usually only occurs in the largest turbine-driven
generators where the laminated steel cores are sufficiently massive, and carry a suffi-
ciently high magnetic and electric loading (see Table 2.4). They can occur anywhere
in the laminated steel core of large rotating electrical machines but are more common
in the stator core [2]. A core fault initiates when core plates are electrically con-
nected together, either because of an insulation failure between them, or as a result
of physically imposed short circuits due to various causes including foreign bodies.
These connections circulate additional currents in the core, coupling the main flux,
leading to additional losses and heating, further weakening core plate insulation and
expanding the fault. The fault is then at a zone in the core that is overheated, buckled
and electrically interconnected. This can expand, melting material, leading to the
catastrophic runaway of the fault and creating a cavity in the core, continuing until
the main conductor insulation is damaged and the machine is disconnected for an
earth fault. Core faults generally occur some distance from the main conductors and
final disconnection frequently occurs after irreparable damage has been done to the
core and conductors. A number of large generators worldwide have experienced this
problem (see Figure 2.17) mainly as a result of damage to the their stator cores during
manufacture or rotor insertion, when laminations became shorted together, and the
application to the core of transient high flux conditions.
2.8.2 Connection faults (high-voltage motor s and gener ators)
Faults in the connections of electrical machines are very unusual in the lower voltages
(<1000 V rms) but become more common at higher voltages where the dielectric
stress on the bushings and forces on the conductors increase.
Insulation failures also occur from time to time on the bushings that carry the elec-
trical connections through the machine enclosure. On a turbine-type machine these
are mounted in the pressure-tight casing and therefore have to withstand the operat-ing pressure of the machine. Failure of a bushing can occur either due to mechanical
stresses or vibration on the conductor passing through the bushing, causing it to crack,
or due to debris being deposited on the exposed surfaces allowing it to track elec-
trically, as described in Section 2.6.3.3. Again the early indication is an increase in
discharge activity.

8/20/2019 Condition Monitoring Knjiga
http://slidepdf.com/reader/full/condition-monitoring-knjiga 78/306
Constr uction, oper ation and fail ure modes of electri cal machi nes 55
Fi gure 2.17 Core fault in the stator core of a 660 M W turbine generator [ Taken
from Tavner and Ander son [ 2] ]
F igure 2.18 Tr acking damage on a cast resin bushing simil ar to that used for the connections of high-voltage motors and generators
Figure 2.18 shows damage to a high-voltage switchgear bushing, similar to that
used in high-voltage machines, where moisture and contamination have allowed a
conductive film to form on the surface of the bushing and severe surface tracking

8/20/2019 Condition Monitoring Knjiga
http://slidepdf.com/reader/full/condition-monitoring-knjiga 79/306
56 Conditi on monitor ing of rotati ng el ectri cal machines
has taken place. The high dielectric stress on the surface of the bushing has allowed
tracking to take place over an extended period of time, probably many months and
possibly even more than a year. This kind of damage tends to occur where bushings are
exposed to the environment outside the machine. It is rare inside the machine unless
there is a cooling-liquid leak combined with solid contamination circulating in the
inner cooling circuit. This kind of damage can be diagnosed by physical inspection,
partial discharge measurements or thermography.
2.8.3 Water coolant faults (all machines)
In machines with water-cooled heat exchangers it is possible for coolant blockage
or failure to occur, either in the pipework leading to the heat exchanger or in the
heat exchanger itself. This can be the result of pipework debris being circulated
in the water system (although this should be removed by filters fitted close to the
inlet of the machine) or due to negligence when cooling systems or machines are
maintained. The normal vibration of a machine in service can excite resonances in an
improperly designed cooling pipework system and this can cause fatigue failure of
a pipe and loss of coolant. The early indications of these kinds of fault are indicated
by high conductor or cooling water temperatures, leakage from the water system and
pyrolysing insulation eventually leading to damaging discharge activity that will be
electrically detectable at the machine terminals.
2.8.4 Bearing faults
Rolling element, sleeve and pad bearings are used in rotating machines as guide and
thrust bearings and fail when the load upon the bearing is excessive or its lubrication
fails. The choice of bearing and the lubrication used depends upon the load borne and
the shaft speed. Table 2.6 gives a summary of the conditions involved in the choice.
These can be helpful when considering fault conditions. A good summary of bearing
selection is given in Neale [21] and shown in Figure 2.19.
Bearing failure is usually progressive but ultimately its effect upon the machine
is catastrophic. Failure is accompanied by a rising temperature at the bearing surface,in the lubricant and in the bearing housing, which are detectable by temperature
sensors. An important consequence of bearing deterioration for electrical machines
is the rotor becomes eccentric in the stator bore causing a degree of static and/or
dynamic eccentricity, disrupting the fine balance between the magnetic forces of
adjacent poles, causing UMP and placing more load on the bearing. This also causes
an increase in vibration as the shaft dynamics are affected by the altered airgap and
bearing stiffness. Bearings can also be damaged by the flow of shaft currents as
described in the following section.
2.8.5 Shaft voltages
Electrical machines can generate voltages in their shafts due to an unbalance in the
magnetic circuit of the machine [22]. The shaft voltage can circulate current through

8/20/2019 Condition Monitoring Knjiga
http://slidepdf.com/reader/full/condition-monitoring-knjiga 80/306
Constr uction, oper ation and fail ure modes of electri cal machi nes 57
Rubbing plain bearings in which the surfaces rub together.
The bearing is usually non-metallic.
0.01 0.1
Externally pressurised bearingscan be used over the wholerange of loads and speeds
10000000
1000000
100000
10000
T y p i c a l m a x i m u m l o a d .
n e w t o n s
1000
100
10
1000000
100000A p p r o x . m
a x . s p e e d c o m m e r c i a l r o l l i n g b e a r i n g s
A p p
r o x . s o
l i d s t e
e l s h
a f t b u r s t l i m
i t
10000
T y p i c a l m a x i m u m l o a d .
W .
l b f
1000
100
10
1 10 100
n , rev/s
n , rev/min
d = 5 0 0 m m
d = 2 5 0 m m
d = 1 0 0 m m
d = 5 0 m m
d = 5 0 m m d = 2 5 m m
d = 2 5 m m d = 1 0 m m
d = 1 0 m m d = 5 m m
d =
5 0 m m
d =
2 5 m m
d = 5 m m
d = 5 m m
d = 1 0 m m
d = 2 5 m m
d = 5 0 m m
d = 1 0 0 m m
d = 2 5 0 m m
d = 5 0 0 m m
1000 10000 100 000
1 10 100 1000 10000 100 000 1000 000
Plain bearings of porous metal impregnated with a lubricant.
Rolling bearings. The materials are hard, and rolling elements
separate the two moving components.
Fluid film plain bearings. A hydrodynamic pressure is gener-ated by the relative movement dragging a viscous fluid into a
taper film.
w
d
n
d = 50 mm
d = 25 mm
d = 10 mm
d = 5 mm
A p p
r o x . m
a x . s p
e e d g
a s
t
u r b i n e s p
e c i a l b a l l b e a r i n g
s
F igure 2.19 A summar y of beari ng selection cr iteria for all machiner y [ Taken from Neale [21] ]
the bearings of the machine and this leads to bearing damage. Voltages on small
machines such as those shown in Figure 2.9 can be of the order of 500 mV rms, but
in larger machines such as those in Figures 2.1 and 2.2 they can be 5–10 V rms.There is a considerable literature about shaft voltages and manufacturers
design machines to minimise their effects by insulating one bearing of the machine and
providing a shaft ground to allow the shaft voltage to be monitored. The damage that
occurs to bearings depends upon the type of bearing. In general a rolling element
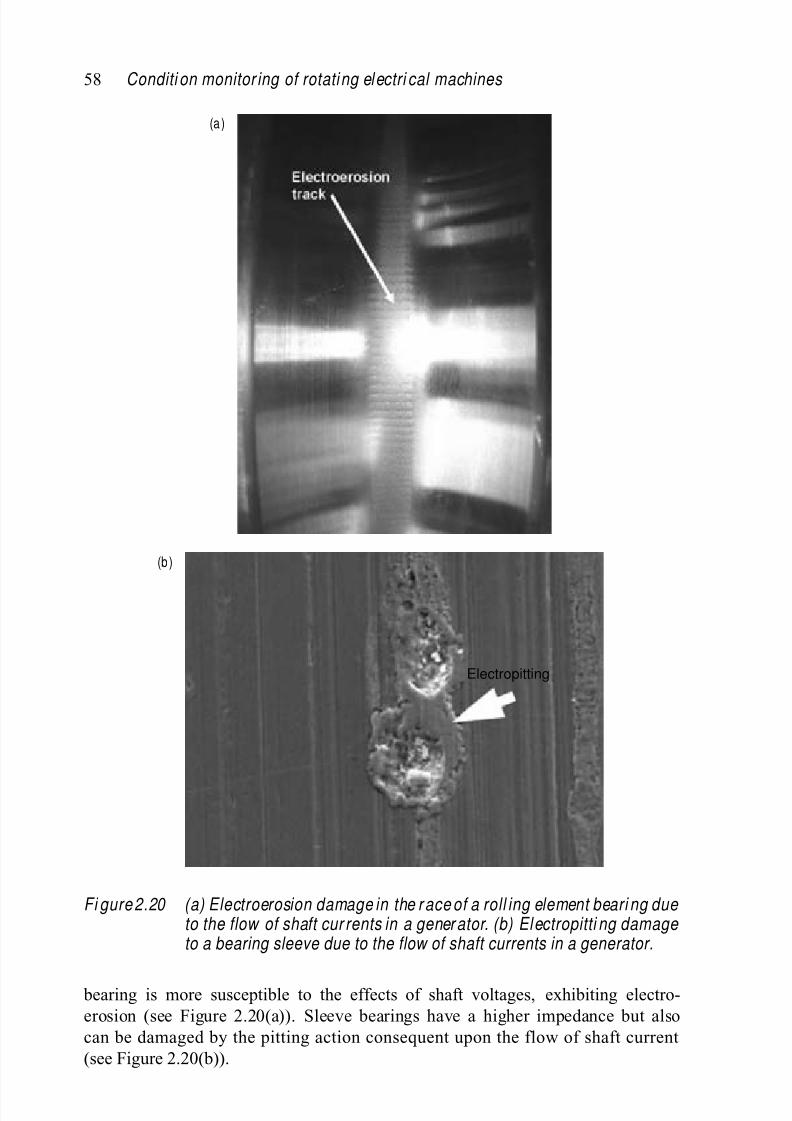
8/20/2019 Condition Monitoring Knjiga
http://slidepdf.com/reader/full/condition-monitoring-knjiga 81/306
58 Conditi on monitor ing of rotati ng el ectri cal machines
(a)
(b)
Electropitting
Fi gure 2.20 (a) Electroerosion damage in the r ace of a roll ing element beari ng due to the flow of shaft cur rents in a gener ator. (b) El ectropitti ng damage to a bearing sleeve due to the flow of shaft currents in a generator.
bearing is more susceptible to the effects of shaft voltages, exhibiting electro-
erosion (see Figure 2.20(a)). Sleeve bearings have a higher impedance but also
can be damaged by the pitting action consequent upon the flow of shaft current
(see Figure 2.20(b)).

8/20/2019 Condition Monitoring Knjiga
http://slidepdf.com/reader/full/condition-monitoring-knjiga 82/306
Constr uction, oper ation and fail ure modes of electri cal machi nes 59
2.9 C onclusion
This chapter has shown the common structure present in electrical machines regard-
less of their size. The construction of electrical machines has also been demonstrated
with an indication of the effect of operational service on failure modes. The impor-
tance of the insulation system of the machine has also been considered and discussed.
Finally, typical failures in service have been shown to identify the most common
failure modes that an engineer will encounter, starting with those originating in the
insulation system but then expanding to consider other sources. The failure modes
demonstrate how faults may be detected in their early stages by monitoring appropri-
ate parameters. In the next chapter we will describe reliability analysis, which will
connect root causes to failure modes and shows how condition monitoring can be
directed to address particular components in the electrical machine.
2.10 R efer ences
1. IEC 60085. Method for determining the thermal classification of electrical
insulation. BS 2757:1986. British Standards Institute, London, 1984.
2. Tavner P.J. and Anderson A.F. Core faults in large generators. I EE P roceedings Electri c Power Applications 2005; 152: 1427–39.
3. Bone J.C.H. and Schwarz K.K. Large AC motors. I EE P roceedings 1973; 120:
1111–32.
4. Dickinson W.H. IEEE Reliability Working Group. Report on reliability of elec-tric plant, parts I, II and III. IEEE Transactions on Industry Applications 1974;
IA-10: 201–52.
5. Barker B. and Hodge J.M. A D ecade of Exper i ence wi th Gener ator and Lar ge M otor Reli abil ity . Paris: CIGRE; 1982.
6. O’Donnell P. IEEE Reliability Working Group. Report of large motor reliabil-
ity survey of industrial and commercial installations, parts I, II and III. IEEE Transactions on Industr y Appl icati ons 1985; I A-21: 853–72.
7. Tavner P.J., Gaydon B.G. and Ward D.M. Monitoring generators and large
motors. IEE Proceedings, Part B, Electri c Power Appli cations 1986; 133:169–80.
8. Thorsen O.V. and Dalva M. A survey of faults on induction motors in off-
shore oil industry, petrochemical industry, gas terminals, and oil refineries. IEEE Transactions on Industr y Appl icati ons 1995; I A-31: 1186–96.
9. Albrecht P.F., Appiarus J.C., McCoy R.M., Owen E.L. and Sharma D.K.
Assessment of the reliability of motors in utility applications – updated. IEEE Transactions on Energy Conversion 1986; EC-1: 39–46.
10. Pedersen A., Crichton G.C. and McAllister I.W. The theory and measurement
of partial discharge transients. IEEE Transactionson Electrical Insulation 1991;EI-26: 487–97.
11. Lyles J.F., Goodeve T.E. and Sedding H. Parameters required to maximize a
thermoset hydro-generator stator winding life. Part I – design, manufacture,
installation. I EEE Transactions on Energy C onver sion 1994; EC-9: 620–27.

8/20/2019 Condition Monitoring Knjiga
http://slidepdf.com/reader/full/condition-monitoring-knjiga 83/306
60 Conditi on monitor ing of rotati ng el ectri cal machines
12. Lyles J.F., Goodeve T.E. and Sedding H. Parameters required to maximize a
thermoset hydro-generator stator winding life. Part II – monitoring, maintenance.
IE EE Transactions on Energy Conver sion 1994; EC-9: 628–35.
13. Evans D.L. IEEE Reliability Working Group. Report on problems with hydro-
generator thermoset stator windings, Part I, II and III. IEEE Transactions on Power Appar atus and Systems 1981; PAS-100: 3284–303.
14. Jackson R.J. and Wilson A. Slot-discharge activity in air-cooled motors and
generators. IEE Proceedings, Part B, El ectri c Power Applications 1982; 129:
159–67.
15. Wilson A. Slot discharge damage in air cooled stator windings. I EE Proceedings,Par t A, Science M easurement and Technology 1991; 138: 153–60.
16. Penman J., Sedding H.G., Lloyd B.A. and Fink W.T. Detection and location
of interturn short circuits in the stator windings of operating motors. IEEE
Transactions on Energy Conversion 1994; E C -9: 652–58.
17. Penman J., Hadwick G. and Stronach A.F. Protection strategy against faults in
electrical machines. Presented at the International Conference on Developments
in Power System Protection, London, 1980.
18. Walker M. The Diagnosing of Trouble in Electrical Machines. London: Library
Press; 1924.
19. Stone G.C., Boulter E.A., Culbert I. and Dhirani H. Electrical Insulation for
Rotating Machines, Design, Evaluation, Aging, Testing, and Repair. New York:
Wiley–IEEE Press; 2004.
20. Thomson W.T. and Fenger M. Current signature analysis to detect inductionmotor faults. I EEE Industry Applications Magazine 2001; 7: 26–34.
21. Neale M.J. Tri bology H andbook . London: Butterworth; 1973.
22. Tavner P.J. Permeabilitatsschwankungen auf Grund von Walzeffekten in Kern-
platten ohne Valenzrichtung. Elektrotechnik und M aschinenbau 1980; 97:
383–86.

8/20/2019 Condition Monitoring Knjiga
http://slidepdf.com/reader/full/condition-monitoring-knjiga 84/306
Chapter 3 R eliability of machines and typical failur e r ates
3.1 I ntroduction
Chapter 2 described the construction and operation of electrical machines and the
way they fail in service. We now need to move towards identifying the conditionmonitoring that needs to be applied to detect those faults.
Condition monitoring has been seen primarily as the province of those who
analyse fault signals and interpret results. However, interpretation must be informed
by causality and the authors’ view is that one of the important changes to occur
in condition monitoring over the last 30 years is ensuring that it is firmly directed
towards the root causes of machine failure. In so doing, successful condition moni-
toring directly addresses machine unreliability or, more importantly for the operator,
lack of availability. This chapter sets out the issues concerned with this causality.
3.2 D efinition of ter ms
In considering the progression to failure of machinery it is necessary to define a
number of useful terms.
• Failure is when the electrical machine fails to perform its energy conversion
function. Failure is complete and does not imply partial functionality.
• Fai lure mode is the manner in which final failure occurred. For example
• insulation failure to ground,• structural failure of a shaft.
• Root cause is the manner in which the failure mode was initiated. For example
for the two cases above
• overheating of the insulation could be the root cause leading to the failure
mode of insulation failure to ground,
or
• excessive shock torque being applied to the shaft could be the root cause
leading to the failure mode of structural failure of the shaft.
•
Fail ure mechanism is the physical manner in which a failure process progressesfrom the root cause to the failure mode. For example in the two cases above
• overheating causes degradation of the insulation material leading to reduced
voltage withstand capability,
or

8/20/2019 Condition Monitoring Knjiga
http://slidepdf.com/reader/full/condition-monitoring-knjiga 85/306
62 Conditi on monitor ing of rotati ng el ectri cal machines
• excessive shock torque on the shaft causing yield and an increase in stress
in the remaining parts of the shaft leading to a progressive and ultimately
catastrophic yield of the component.
• Root cause analysis (RCA) is the analysis following a failure of the failure modes
and underlying root causes.
• D uration of the fail ure sequence is considered in this book to be the time from root
cause to failure mode. This may be a period of seconds, minutes, days, months
or weeks and can depend on
• the failure mode itself,
• the operating conditions of the machine,
• the ambient conditions.
• Reliability (R ) is the probability that a machine can operate without failure for
a time t and in this book is generally quoted as a failure rate. A high reliability
machine has few failures, a high mean time between failure, a high percentage
reliability and a low failure rate. The reliability as a function R (t ) is sometimes
known as the survivor function because it indicates what proportion of the starting
population survives at a particular time t . A word definition of reliability would be
‘the probability that a system will operate to an agreed level of performance for
a specified period, subject to specified environmental conditions’.
• Availability (A) is the probability that a machine will be available to operate for
a time t and in this book is generally quoted as a percentage. A high availability
machine has only short periods of time shut down due to failure or maintenance.
• Failurerate (λ(t )) istherateatwhichfailuresoccurinamachineandinthisbookisgenerally quoted as failures/machine/year. Failure rate is sometimes considered to
be constant throughout machine life but in fact it varies according to the operating
condition and age of a machine. The failure rate as a function of time is sometimes
called the hazard function . It is the objective of the maintenance engineer of the
machine to keep the failure rate low, constant and predictable.
• Time to fail ure (TTF) is the time measured from the instant of installation of the
machine to the instant of failure. The mean time to fail ure (MTTF) is the expected
value of that and successive TTFs. MTTF does not include the time to repair as
a result of a failure. The MTTF is usually given in hours.• Time to repair (TTR) is the time measured from the instant of first failure to the
instant when the machine is available for operation again. The mean time to repair (MTTR) is the average of that and successive TTRs and can be averaged over a
number of machines in a population. The MTTR is usually given in hours.
• Under the hypothesis of minimal repair, that is repair that brings the unit back
to the condition before failure, ti me between fai lur e (TBF) is the time measured
from the instant of installation of the machine to the instant after the first failure
when the machine is available for operation again. The mean ti me between fai lur e
(MTBF) is the average of that and successive TBFs and can be averaged over anumber of machines in a population. MTBF is the sum of the MTTF and MTTR.
The MTBF or θ is usually given in hours.
• Fail ure mode and effects analysis (FMEA) is a subjective analysis tool, defined
by US standards [1] that uses a qualitative approach to identify potential failure

8/20/2019 Condition Monitoring Knjiga
http://slidepdf.com/reader/full/condition-monitoring-knjiga 86/306
Reliability of machines and typical failure rates 63
modes, their root causes and the associated risks in the design, manufacture or
operation of a machine.
3.3 Failur e sequence and effect on monitoring
The failure sequence from operation to failure for a specific failure mode in a typical
subassembly or component, in this case the main shaft of the machine, can be drawn
vertically as shown in Figure 3.1 and contains the sequence root cause–failure mode–
failure.
The duration of the failure sequence depends on the failure mode, the operating
condition of the machine and the ambient condition in which it is operating.
Main shaft
failure
Fracture Deformation
Failure mode
Why?Root cause
analysis
How?Conditionmonitoring
and diagnosis
High cycle
fatigueCorrosion
Low cycle
fatigue or
overload
Misalignment
Root causes
F igure 3.1 Cause-and-effect diagr am showing the relationshi p between the fail ure sequence and root cause analysis for an example fail ure, the fr acture of a main shaft i niti ated by stress cor rosion cracking
Figure 3.2 demonstrates this process for a failure mode described by a normaldistribution. Figure 3.2(a) shows the progression from reliable to non-reliable opera-
tion rapidly at the 50 per cent life point for a fast fault. The probability of failure rises
sharply close to this point, the area under the curve being equal to 1 because in the
life of the machine there is 100 per cent probability of failure. Figure 3.2(b) repeats
the sequence for a medium speed fault. Finally Figure 3.2(c) repeats the sequence for
a slow speed fault.
This process is at the heart of condition monitoring. If a failure sequence is very
rapid; for example, a few seconds like the fast fault in Figure 3.2(a), then effective
condition monitoring is impossible. This is the situation for most electrical failuremodes which actuate the electrical protection, where the period of action of the final
failure mode may be only a few seconds or even only a few cycles of the mains.
However, if the failure sequence is days, weeks or months, like the slow fault in
Figure 3.2(c), then condition monitoring has the potential to provide early warning

8/20/2019 Condition Monitoring Knjiga
http://slidepdf.com/reader/full/condition-monitoring-knjiga 87/306
64 Conditi on monitor ing of rotati ng el ectri cal machines
0
10
20
30
40
50
60
70
80
90
100
0 20 40 60 80 100Life of component, %
R e l i a b i l i t y o f p l a n
t , %
0
1
1
2
2
3
P e r c e n t a g e p r o b a b i l i t y o f f a i l u r e
Slow fault
Slow fault
failure
probability
Medium fault
Medium fault
failure
probability
Fast fault
Fast fault
failure
probability
0
10
20
30
40
50
60
70
80
90
100
0 20 40 60 80 100
Life of component, %
R e l i a b i l i t y o f p l a n t , %
0
5
10
15
20
25
30
35
40
45
P e r c e n t a g e p r o b a b i l i t y o f f a i l u r e
0
10
20
30
40
50
60
70
80
90
100
0 20 40 60 80 100Life of component, %
R e l i a b i l i t y o f p l a n t , %
0
1
1
2
2
3
3
4
4
5
P e r c e n t a g e p r o b a b i l i t y o f f a i l u r e
Fi gure 3.2 The failure sequence showing operabili ty falli ng with time as a fault progresses. (a) Fast speed fault. (b) Medium speed fault. (c) Slow speed fault.

8/20/2019 Condition Monitoring Knjiga
http://slidepdf.com/reader/full/condition-monitoring-knjiga 88/306
Reliability of machines and typical failure rates 65
of impending failure and the ability to continue operating the machine before failure
and maintain it to avoid failure. Therefore condition monitoring must concentrate
on those root causes and failure modes that exhibit a failure sequence of substantial
duration and our ability to detect its initiation and progress is crucial to successful
condition monitoring.
3.4 Typical r oot causes and failure modes
3.4.1 General
It is important to distinguish between root causes, which initiate the failure sequence
and can be detected by condition monitoring, and failure modes, which terminate it.
After a failure, operators are used to tracing the sequence back from the failure mode
to the root cause, in order to determine the true cause of failure. This is the process
of root cause analysis (RCA) or asking why a failure occurred. On the other hand
the designer of a condition-monitoring system must keep in mind the need to predict
the reverse of that process, tracing how a failure develops, as shown in Figure 3.1.
On this basis the authors propose the following as the most common root causes and
failure modes in rotating electrical machines, based on the descriptions in Chapter 2
and the Appendix. They are similar to the root causes and failure modes identified
by the IEEE survey [2] and by Thorsen and Dalva [3] and could be related to the
more detailed analysis of failure modes developed by Bonnett and Soukup [4] for
induction motors. It is surprising how few root causes and failure modes there areand the reader should note that these failure modes and root causes are generic and
could be applied to many different subassemblies and components of the machine.
3.4.2 Root causes
These are outlined as follows
• defective design or manufacture,
• defective material or component,
• defective installation,• defective maintenance or operation,
• ambient conditions,
• overspeed,
• overload,
• low cycle fatigue or shock load,
• high cycle fatigue or excessive vibration,
• component failure,
• excessive temperature
•
winding overtemperature,• bearing overtemperature.
• excessive dielectric stress, steady or transient,
• debris or dirt,
• corrosion.

8/20/2019 Condition Monitoring Knjiga
http://slidepdf.com/reader/full/condition-monitoring-knjiga 89/306
66 Conditi on monitor ing of rotati ng el ectri cal machines
3.4.3 Failure modes
These are outlined as follows
• electrical:
• core insulation failure;
• stator winding insulation failure;
• rotor winding insulation failure;
• brushgear failure;
• slip ring failure;
• commutator failure;
• electrical trip.
• mechanical:
• bearing failure;
• rotor mechanical integrity failure;• stator mechanical integrity failure.
3.5 R eliability analysis
Component failure modes and the failure sequence described in Section 3.4 are con-
trolled by statistical processes in the components, such as insulation degradation or
degradation of metal components due to fatigue. These processes govern the transi-
tion from operation to failure exemplified by Figure 3.2. This process is the subjectof detailed texts on reliability such as Billinton and Allen [5] and Caplen [6]. Each
component failure mode will have its own probability density function that derives
from its own physical processes. For example, the shape of the probability density
function for winding insulation deterioration depends upon ambient and operating
temperatures, deteriorating slowly as the insulation degrades with time. Whereas the
probability density function for shaft fatigue would show a rapidly rising trend as
fatigue cycles are accumulated.
The mathematical function f (t ) for a component failure mode probability density
function should have the flexibility to represent a wide range of major failure modes,such as are present in most machinery. A flexible function that is available for this
work is the Weibull function:
f (t ) =β
θ
t
θ
β−1
e −(t /θ)β
(3.1)
The instantaneous failure rate, λ(t ), or hazard function of a component in a population
of components can be obtained from f (t ) because
λ(t )=
f (t )
R (t ) (3.2)
where R (t ) is the reliability or survivor function of a population of components, which
for a Weibull distribution would be given by
R (t ) = e −(t /θ)β(3.3)

8/20/2019 Condition Monitoring Knjiga
http://slidepdf.com/reader/full/condition-monitoring-knjiga 90/306
Reliability of machines and typical failure rates 67
Therefore
λ(t ) =β
θ
t
θ
β−1
(3.4)
which can be simplified to
λ(t ) = αβt β−1 (3.5)
where β s a shape parameter and α is a scale parameter equal to 1/θ β and reduces
to 1/θ when β = 1 where θ is the MTTF of the component and ≈ MTBF. This
expression is a very powerful mathematical tool to understanding the behaviour
of components, subassemblies and complete machines from a reliability point
of view.
0
5
10
15
20
25
30
35
0.0 1.0 2.0 3.0 4.0 5.0 6.0 7.0 8.0 9.0 10.0
Life
P r o b a b i l i t y o
f f a i l u r e ,
%
b = 0.5
b = 1
b = 5
Fi gure 3.3 Variation i n probabili ty density function of failures to a component showi ng the effect of di fferent degr adati on processes at wor k
Figure 3.3 shows the effect on the probability of failure of a component for
different values of β, using (3.1) in this case life is expressed in arbitrary units. So
for example the curve with β = 0.5 could describe the behaviour of a population of
rolling element bearings whose probability of failure decreases progressively with
time as the bearing and grease runs in.On the other hand the curve with β = 2 or 5 could describe the behaviour of an
insulation component subjected to increased degradation with time and temperature.
Figure 3.4 shows the hazard function or failure rate using (3.5) for such components
against life. The bearing component shows a failure rate decreasing steadily with
time, whereas the insulation component shows an accelerating failure rate.

8/20/2019 Condition Monitoring Knjiga
http://slidepdf.com/reader/full/condition-monitoring-knjiga 91/306
68 Conditi on monitor ing of rotati ng el ectri cal machines
0
0.1
0.2
0.3
0.4
0.5
0.6
0.0 1.0 2.0 3.0 4.0 5.0 6.0 7.0 8.0 9.0 10.0
Life
F a i l u r e r a t e
b = 0.5
b = 1
b = 2
b = 5
Fi gure 3.4 Vari ation in hazard function of a population of components for different under l ying probabil ity density functions showing the effect of different
degradation processes on the deterioration of failure rate and therefore on the reli abili ty
The complete failure rate of a population of components varies over time as shown
in Figure 3.5. Each phase of the segregated failure rate curve can be represented by
(3.5), for different values of shape parameter β. When components are assembled
into subassemblies and thence into a complex piece of machinery, the aggregated
component failure mode sequences results in a composite failure rate curve, such as
that in Figure 3.5, derived from (3.5).
Figure 3.5 is a combination of three curves that represent three stages of operation
of the population under consideration:
• Early l i fe (β < 1): this stage is also known as infant mortality or burn-in, where
the failure rate falls as the components prone to early failure are eliminated.
• U seful li fe (β = 1): this stage represents normal operation of the system, when
the failure rate is sensibly constant over an extended period of time.
• Wear-out (β > 1): this stage represents increasing failure rate of the system,
occurring towards the end of its useful life, due to deterioration of the individual
components that start to fail in increasing numbers.
However, pieces of machinery do not always follow the typical bathtub form.
The authors have noted how complex electronic equipment does not often exhibit
infant mortality symptoms. This is because such subassemblies are subjected to

8/20/2019 Condition Monitoring Knjiga
http://slidepdf.com/reader/full/condition-monitoring-knjiga 92/306
Reliability of machines and typical failure rates 69
Early life(Falling failure rate,
infant mortality)
Useful life(Constant failure
rate)
Wearout period(Rising failure rate)
Operating life, t
F a i l u r e r a t e ,
l ( t )
b < 1 b > 1
b = 1
F igure 3.5 Aggregatehazard function or fail ure rate for a population of components or subassembli es forming a compl ete piece of machinery, known as the bathtub curve showing the effect of the shape function β at thebeginning and end of machiner y l ife
automatic and accelerated life testing on completion of manufacture, before delivery,
specifically designed to minimise the number of early-life failures.
In another way, electrical insulation systems do not tend to show a low, constant,
mid-life failure rate but a rather gradual worsening in failure rate over the whole life,
as the insulation material steadily deteriorates with ageing, as shown in Figure 3.4
with β = 2. However, the hazard function of the bathtub curve is instructive for those
engaged in condition monitoring because they demonstrate the character of failure
modes, which we want the condition monitoring to detect, and the different phases
of machinery life.
The low, constant, mid-life failure rate at the bottom of the bathtub is achieved
partly by good design and manufacture of machinery components but its base valuecan be reduced and duration extended by maintenance and in turn by monitoring.
So the shape of the bathtub for a complex engineering plant is dependent upon the
maintenance and monitoring regime that is adopted as set out in Chapter 1.
3.6 M achiner y str ucture
The structure of a machine is an important factor in the cause-and-effect diagram and
in the aggregation of failure mode probability density functions, as described in the previous section. We may consider that structure to be simply the assembly struc-
ture of individual components into subassemblies and then the aggregation of those
subassemblies into a complete machine. This could be exemplified by the exploded
diagram of the machine and was discussed in Chapter 2 (see Figure 2.10 for example).
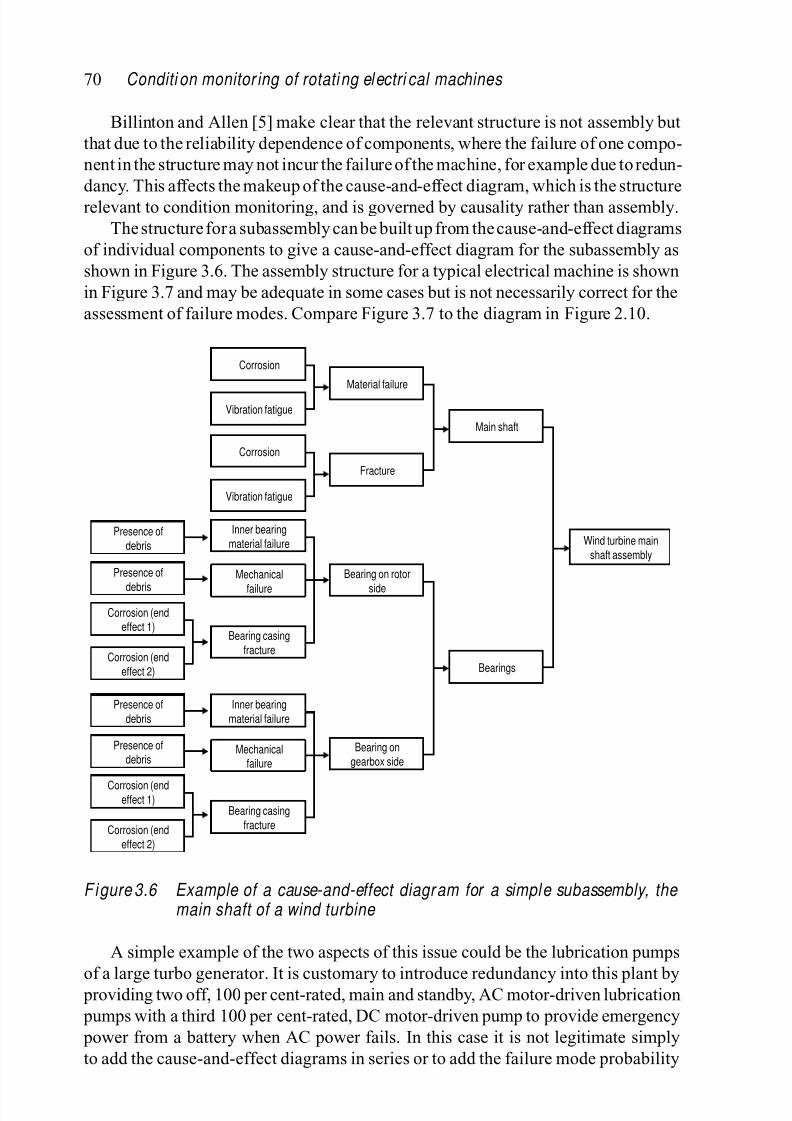
8/20/2019 Condition Monitoring Knjiga
http://slidepdf.com/reader/full/condition-monitoring-knjiga 93/306
70 Conditi on monitor ing of rotati ng el ectri cal machines
Billinton and Allen [5] make clear that the relevant structure is not assembly but
that due to the reliability dependence of components, where the failure of one compo-
nent in the structure may not incur the failure of the machine, for example due to redun-
dancy. This affects the makeup of the cause-and-effect diagram, which is the structure
relevant to condition monitoring, and is governed by causality rather than assembly.
The structure for a subassembly can be built up from the cause-and-effect diagrams
of individual components to give a cause-and-effect diagram for the subassembly as
shown in Figure 3.6. The assembly structure for a typical electrical machine is shown
in Figure 3.7 and may be adequate in some cases but is not necessarily correct for the
assessment of failure modes. Compare Figure 3.7 to the diagram in Figure 2.10.
Corrosion
Corrosion
Vibration fatigue
Vibration fatigue
Inner bearing
material failurePresence of
debris
Presence of
debris
Corrosion (endeffect 1)
Corrosion (end
effect 2)
Corrosion (endeffect 1)
Corrosion (end
effect 2)
Presence of
debris
Presence ofdebris
Mechanical
failure
Bearing casing
fracture
Inner bearing
material failure
Mechanicalfailure
Bearing casing
fracture
Bearing on
gearbox side
Bearings
Main shaft
Material failure
Fracture
Bearing on rotor
side
Wind turbine main
shaft assembly
Fi gure 3.6 Example of a cause-and-effect diagr am for a simpl e subassembly, the main shaft of a wind turbine
A simple example of the two aspects of this issue could be the lubrication pumps
of a large turbo generator. It is customary to introduce redundancy into this plant by providing two off, 100 per cent-rated, main and standby, AC motor-driven lubrication
pumps with a third 100 per cent-rated, DC motor-driven pump to provide emergency
power from a battery when AC power fails. In this case it is not legitimate simply
to add the cause-and-effect diagrams in series or to add the failure mode probability

8/20/2019 Condition Monitoring Knjiga
http://slidepdf.com/reader/full/condition-monitoring-knjiga 94/306
Reliability of machines and typical failure rates 71
Induction motor
system
Enclosuresubsystem
Bearing
assembly
Heat
exchanger
Stator
core
Stator
winding
Wedging
and bracing
Rotor
winding
Rotor core Sensors
Terminalbox
Fans
Frame
Shaft
Ventilationsubsystem
Statorsubsystem
Rotorsubsystem
Instrumentationsubsystem
Fi gure 3.7 Example of a typical electrical machine structure diagram (see Figure 2.10)
functions of the three pumps, since a large turbo generator can operate with any one
out of three pumps functioning. The correct approach is to consider the three systems
in parallel and take account of the probability density functions in the same way.
3.7 Typical failure rates and M T BFs
The approach of this chapter can be put into context by considering the MTBFs of
typical electrical machines. Such data can be notoriously difficult to find but some
information, particularly about MTBF, is available from reliability surveys, mostly
conducted in the US under the auspices of the IEEE [2]. Information about the life of
electrical machines has also come to light from experience in the defence industry,
where reliability predictions are a contractual requirement of equipment purchase [7].
Finally information is available from the wind industry about generators being fitted to
the wind turbines being installed in increasing numbers, where fault data is recorded sufficiently frequently to deduce the life curves of typical electrical machines and
their reliability [8].
The MTBF can be a deceptive quantity. It is intended to represent the prospective
life of the machine, assuming it has a constant failure rate, as shown in the constant
failure rate region of Figure 3.5. Then one could consider that there would be a 50
per cent probability of failure before the MTBF and 50 per cent probability of failure
afterwards. However, machines can have a failure rate that improves with time and
then it is possible that a higher proportion of failures could occur before the MTBF.
However, a well-maintained machine can expect to be operating in the constant failurerate region, in which case MTBF gives a good indication of prospective life, which
engineers can appreciate without being overwhelmed by any statistical interpretation.
Table 3.1 extracts data from a number of surveys of electrical machines and gives
the failure rates and MTBFs for a range of machines, showing a remarkable degree of

8/20/2019 Condition Monitoring Knjiga
http://slidepdf.com/reader/full/condition-monitoring-knjiga 95/306
T a
b l e 3
. 1
A l i s t o
f t y p
i c a
l m e a s u r e
d f a i l u r e r a
t e s a n
d m e a n
t i m e b e
t w e e n
f a i l u r e s
( M T B F s )
f o r
e l e c
t r i c a
l m a c
h i n e s o
b t a i n e
d f r o m
t h e
l i t e r a
t u r e
M a c h i n e t y p e
N o . o f m a c h i n e s
M a c h i n e y e a r s
N o . o f f a i l u r e s
F a i l u r e r a t e ,
M T B F , h o u r s
S o u r c e o f d a t a
i n s u r v e y
i n s u r v e y
i n s u
r v e y
f a i l u r e s / m a c h i n e / y e a r
L a r g e s t e a m t u r b i n e
g e n e r a t o r s
N o t k n o w n
7 6 2
2 4
0 . 0 3 1 5
2 7 3 7 5 0
[ 2 , 9
]
I n d u c t i o n m o t o r s
6 0 1 – 1 5 0 0 0 V
N o t k n o w n
4 2 2 9
1 7 1
0 . 0 4 0 4
2 1 6 8 3 1
[ 2 , 9
]
M o t o r s g r e a t e
r t h a n
2 0 0 h p , g e n e r a l l y M V a n d
H V i n d u c t i o n
m o t o r s
1 1 4 1
5 0 8 5
3 6 0
0 . 0 7 0 7
1 2 3 7 3 5
[ 2 , 1
0 ]
M o t o r s g r e a t e
r t h a n
1 0 0 h p , g e n e r a l l y M V a n d
H V i n d u c t i o n
m o t o r s
6 3 1 2
4 1 6 1 4
1 4 7 4
0 . 0 3 5 4
2 4 7 3 1 2
[ 1 1 ]
M o t o r s g r e a t e
r t h a n
1 1 k W g e n e r a
l l y M V a n d
H V i n d u c t i o n
m o t o r s
2 5 9 6
2 5 6 2 2
1 6 3 7
0 . 0 6 3 9
1 3 7 1 0 9
[ 1 2 ]
W i n d t u r b i n e
g e n e r a t o r s
< 2 M W
6 4 3
5 1 7 3
7 1 0
0 . 0 4 0 0
2 1 9 0 0 0
[ 8 ]

8/20/2019 Condition Monitoring Knjiga
http://slidepdf.com/reader/full/condition-monitoring-knjiga 96/306
Reliability of machines and typical failure rates 73
consistency with MTBFs ranging from 18 to 33 years, if a year is assumed to contain
8 766 hours operation. The table also gives an idea of the significance of each survey
by noting the number of machines surveyed and the number of failures recorded. It
should be noted that the large surveys are dominated by induction motors because of
their ubiquity.
The distribution of failures within the structure of the machine is also impor-
tant because it should guide the direction in which condition monitoring is applied.
Table 3.2 gives an analysis of failures based on the literature and three important
areas of the machine are identified: stator related, primarily the winding; rotor related,
including slip rings and commutators; and bearings. The remainder of failures are
grouped as other. The data comes from different surveys and while these surveys are
not necessarily complementary they are substantial and do show a consistent aspect
of failure areas in descending order of importance
• bearings,
• stator related,
• rotor related.
The relative importance of failures is affected by the size, voltage and type of
machine under consideration. In particular the relative weighting of stator to rotor
winding failures does depend upon the type and size of machine under consideration.
For example small, low-voltage induction machine failures, exemplified by the first
two columns of Table 3.2, are dominated by bearings, as low-voltage windings expe-
rience very few faults. Smaller machine bearings are usually rolling element and
their reliability depends heavily on the standard of maintenance. Induction machines
show a much lower number of rotor winding or squirrel cage faults compared to
stator winding faults, because of the ruggedness of cage construction. But larger,
high-voltage machines, exemplified by the next three columns of Table 3.2, receive
a higher proportion of failure modes on the stator winding, due to dielectric stress
and vibration root causes, and this can rise to be of a similar significance to bear-
ing faults. Large machine bearings are also usually of sleeve construction and with
constant lubrication are generally more reliable than bearings in smaller machines.
Table 3.2 also shows that other component failure modes, for example in the cool-ing system, connections and terminal boxes, become more significant on larger
machines.
An interesting aspect of this analysis is the attention that is being paid to different
machine failure mechanisms in the published literature. The authors have used the
search engine IEEEXplore to consider IEEE and IEE journal papers only in the period
1980 to date and searched the metadata under the following headings:
• broken bars in induction motor rotor cages: 35 papers;
•
discharge activity in medium- and high-voltage stator windings in motors and generators: 9 papers;
• stator winding faults excluding discharge activity in motors and generators:
19 papers;
• bearing; faults in electrical machines: 17 papers.

8/20/2019 Condition Monitoring Knjiga
http://slidepdf.com/reader/full/condition-monitoring-knjiga 97/306
T a
b l e 3
. 2
T h e
d i s t r i b u
t i o n o
f f a i l e d s u
b a s s e m
b l i e s
i n e
l e c
t r i c a
l m a
c h i n e s o
b t a i n e
d f r o m
t h e
l i t
e r a
t u r e
S u b a s s e m b l i e
s P r e d i c t e d b y a n O E M
t h r o u g h f a i l u r e m o d e s
a n d e f f e c t s a n a l y s i s
t e c h n i q u e s , 1
9 9 5 – 1 9 9 7 ∗
M O D s u r v e y ;
[ 7 ]
I E E E l a r g e
m o t o r s u r v e y
,
1 9 8 5 ; [ 1 0 ]
M o t o r s i n u t i l i t y
a p p l i c a t i o n s ;
[ 1 1 ]
M o t o r s u r v e y
o f f s h
o r e a n d
p e t r o
c h e m ; [ 1 2 ]
P r o p o r t i o n o f 8 0
j o u r n a l
p a p e r s p u b l i s h e d i n I E E E
a n d I E E o n t h e s e s u b j e c t
a r e a s o v e r t h e p a s t 2 6 y e a r s
T y p e s o f
m a c h i n e s
S m a l l t o m e d i u m
l o w - v o l t a g e m o t o r s a n d
g e n e r a t o r s < 1 5 0 k W ,
g e n e r a l l y s q u i r r e l c a g e
i n d u c t i o n m o t o r s
S m a l l
l o w - v o l t a g e
m o t o r s a n d
g e n e r a t o r s
< 7 5 0 k W ,
g e n e r a l l y
s q u i r r e l c a g e
i n d u c t i o n
m o t o r s
M o t o r s g r e a t e r
t h a n 2 0 0 h p
g e n e r a l l y
m e d i u m - a n d
h i g h - v o l t a g e
i n d u c t i o n
m o t o r s
M o t o r s g r e a t e r
t h a n 1 0 0 h p
g e n e r a l l y
m e d i u m - a n d
h i g h - v o l t a g e
i n d u c t i o n
m o t o r s
M o t o r s g r e a t e r
t h a n
1 1 k W
g e n e r a l l y
m e d i u m - a n d
h i g h - v o l t a g e
i n d u c t i o n
m o t o
r s
A l l m a c h i n e s
B e a r i n g s
7 5 %
9 5 %
4 1 %
4 1 %
4 2 %
2 1 %
S t a t o r - r e l a t e d
9 %
2 %
3 7 %
3 6 %
1 3 %
3 5 %
R o t o r - r e l a t e d
6 %
1 %
1 0 %
9 %
8 %
4 4 %
O t h e r
1 0 %
2 %
1 2 %
1 4 %
3 8 %
—
∗
P r i v a t e c o m m
u n i c a t i o n f r o m L a u r e n c e , S c o t t &
E l e c t r o m o t o r s L t d
8/20/2019 Condition Monitoring Knjiga
http://slidepdf.com/reader/full/condition-monitoring-knjiga 98/306
Reliability of machines and typical failure rates 75
The spread of this collection of 80 publications is shown distributed alongside the
relevant failure areas in Table 3.2. It shows that more publishing effort has gone into
the study of the less prevalent rotor faults than into the more prevalent bearing faults.
Induction motor rotor cage faults can be detected through perturbations of the
airgap magnetic field (see Chapter 9). The distribution of journal papers towards
those faults is probably due to the fact that the airgap field is scientifically interesting,
analytically tractable and cage induction motors are very numerous.
Bearing faults, on the other hand, involve a more complex interplay of mechanical
and electrical physical effects. However, bearing faults lead to airgap eccentricity and
the effect on the resultant magnetic field is also tractable, although more complex
than the effect of rotor cage faults. Some of the lessons learnt from rotor cage fault
detection, combined with the study of the effect of eccentricity on the airgap magnetic
field, can be applied to the detection of bearing faults and this topic is returned to
in Chapters 8 and 9. It is interesting that the study of the effects of eccentricity in
induction motors, the most numerous of electrical machines, can also be elicited from
the literature survey given earlier and that 36 papers have addressed the subject since
1980. Some of these papers address issues of noise and speed control but the number
demonstrates the attention that is beginning to be focused on this important issue.
3.8 C onclusion
This chapter has shown that causality must be the guiding principle when applyingcondition monitoring to electrical machines. First, the operator must be aware of
the failure modes and root causes for the machine being considered for condition
monitoring. Second, causality must be traced through prospective failure sequences,
possible by the use of cause-and-effect diagrams. The probability of failure of a
component of a machine can be described by a probability density function for that
component. The resultant hazard function curves for each component in a subassem-
bly can be aggregated to give a prospective life curve for that subassembly and
can then be aggregated to give the life curve of the machine. The aggregation of
cause-and-effect diagrams and hazard functions needs to be done with care, taking
account of the assembly structure of the machine and the reliability dependence of
components. From the aggregate hazard function a model for the complete machine
could be derived. Third, condition monitoring needs to address the root causes that
have a slow failure sequence to the failure mode and this information can be derived
from knowledge of the failure modes in operation in an electrical machine.
In Chapter 1 we proposed three different courses of maintenance action:
1. breakdown maintenance, implying uncertainty and a high spares holding;
2. fixed-time interval or planned maintenance, implying extended shut-down or
outage periods and lower availability;3. condition-based maintenance, implying low spares holding and high availability.
Real engineering plant demands a flexible combination of maintenance regimes based
on the above. This chapter has shown that by addressing failure modes that are slow to
mature, condition monitoring could significantly affect the detection of faults before

8/20/2019 Condition Monitoring Knjiga
http://slidepdf.com/reader/full/condition-monitoring-knjiga 99/306
76 Conditi on monitor ing of rotati ng el ectri cal machines
they occur. Condition monitoring can then form part of planning fixed-time interval
maintenance (2) and will be at the heart of maintenance for method (3).
Prior to determining the type of equipment and frequency of monitoring, some
consideration should also be given to whether the cost of implementing such a program
is justified. Factors involved in this decision may include
• replacement or repair cost of the equipment to be monitored,
• criticality of the plant to safe and reliable operation,
• long-term future of the facility in which the equipment is installed.
Assuming that consideration of these points indicates that the expenditure is jus-
tified, the following points will aid in determining how the condition-monitoring
programme should be implemented
• design,• manufacture,
• installation,
• operation,
• maintenance.
In the majority of cases, the end users of rotating machines are dealing with
existing plant and will have to consider all five of these points. This task is complicated
because often there is very little design information, the manufacturer may no longer
exist and installation, operation and maintenance records may be incomplete. The
paucity of information can lead to the assumption that the age of the equipmentindicates the need for more rigorous monitoring. However, this is not always the case
since the refinement of design tools and the constant pressure on manufacturers to
reduce costs has, in some cases, led to decreased design margins.
The practicability of these approaches for electrical machines depends upon the
application of the machine and the engineering plant it serves. That is the basis of this
book. In the next two chapters we describe the instrumentation and signal processing
needs for condition monitoring.
3.9 R eferences
1. US Department of Defense. MIL-STD-712C Military Standard Procedures for
Performing a Failure Mode, Effects and Criticality Analysis. Washington DC:
US Government; 1980.
2. IEEE Gold Book. Recommended Practice For Design of Reliable Industrial and
Commercial Power Systems. Piscataway: IEEE Press; 1990.
3. Thorsen O.V. and Dalva M. Failure identification and analysis for high-voltage
induction motors in the petrochemical industry. I EEE Transactions on I ndustr y Applications 1999; I A-35: 810–18.
4. Bonnett A.H. and Soukup G.C. Cause and analysis of stator and rotor failures
in three-phase squirrel-cage induction motors. IEEE Transactions on Industry Applications 1992; I A-28: 921–37.

8/20/2019 Condition Monitoring Knjiga
http://slidepdf.com/reader/full/condition-monitoring-knjiga 100/306
Reliability of machines and typical failure rates 77
5. Billinton R. and Allan R.N. Reliability Evaluation of Engineering Systems – Concepts and Systems . 2nd edn. New York: Plenum; 1992.
6. Caplen R.H. A Practical Approach to Reliability . London: Business Books;
1972.
7. Tavner P.J. and Hasson J.P. Predicting the design life of high integrity rotat-
ing electrical machines. Presented at the 9th IEE International Conference on
Electrical Machines and Drives (EMD), Canterbury, 1999.
8. Tavner P.J., van Bussel G.J.W. and Spinato, F. Machine and converter reliabilities
in wind turbines. Presented at the 3rd IET International Conference on Power
Electronics Machines & Drives (PEMD), Dublin, 2006.
9. Dickinson W.H. IEEE Reliability Working Group. Report on reliability of elec-
tric plant, part I, II and III. IEEE Transactions on Industry Applications 1974;
IA-10: 201–52.
10. O’Donnell P. IEEE Reliability Working Group. Report of large motor relia-
bility survey of industrial and commercial installations, part I, II & III. IEEE Transactions on Industr y Appl icati ons 1985; I A-21: 853–72.
11. Albrecht P.F., Appiarius J.C. and Sharma D.K. Assessment of the reliabil-
ity of motors in utility applications – updated. IEEE Transactions on Energy Conversion 1986; EC-1: 39–46.
12. Thorsen, O.V. and Dalva M. A survey of faults on induction motors in off-
shore oil industry, petrochemical industry, gas terminals, and oil refineries. IEEE Transactions on Industr y Appl icati ons 1995; I A-31: 1186–96.

8/20/2019 Condition Monitoring Knjiga
http://slidepdf.com/reader/full/condition-monitoring-knjiga 101/306

8/20/2019 Condition Monitoring Knjiga
http://slidepdf.com/reader/full/condition-monitoring-knjiga 102/306
Chapter 4 I nstr umentation r equirements
4.1 I ntroduction
The development of a condition-monitoring system involves the measurement of
operating variables of the plant being monitored, and interpretation as well as man-agement of the acquired data. In many plants, measurements are already used for
control and protection objectives. From a cost point of view, it would be ideal if such
measurements could also be used for condition monitoring. However, knowledge
of the limitations of the existing measurements and understanding of the difference
between the objectives of control, protection and condition monitoring is important,
as will be seen later in the book.
One feature of condition monitoring, described in Chapter 3, is to detect impeding
faults at an early stage, capturing weak signatures in measurements that are usually
mixed with noise. Furthermore, some impeding faults may manifest themselves innon-electrical variables that are not normally used in control or protection. Before
getting into the details of the instrumentation elements, we need to view a condition-
monitoring system from a higher level where the functionality of different parts of the
system can be more clearly described. By doing this, it should be possible to identify
the common elements of a condition-monitoring scheme, irrespective of the system
detail. In essence we are saying that an engineer examining occasional meter readings,
with a view to producing an operational and maintenance strategy, is involved in a
procedure that is analogous to a sophisticated condition-monitoring system.
In view of this analogy, we believe that the following tasks are essential elementsin a condition-monitoring system (Figure 4.1).
1. The measurement or transduction task (sensing of primary variables).
2. The data acquisition task (conversion of sensed variables into digital data in
condition-monitoring system).
3. The data processing task (identifying of information buried in data).
4. The diagnostic task (acting on processed data).
Tasks (1) and (2) are usually carried out while the plant being monitored is operating.
Tasks (3) and (4) can be performed off-line and the results of these tasks may not be fed back immediately to the plant operators. This is a non-intrusive approach of
condition monitoring. In contrast, it is possible to use an intrusive approach in which
a signal is injected into the plant being monitored and the response is used to control
the plant status. This is particularly attractive in plant involving power electronic

8/20/2019 Condition Monitoring Knjiga
http://slidepdf.com/reader/full/condition-monitoring-knjiga 103/306
80 Conditi on monitor ing of rotati ng el ectri cal machines
Transduction Dataacquisition
Processing DiagnosticsPlant
Operationalstrategy
Fi gure 4.1 The monitoring tasks
converters that generate monitoring signals and are very fast acting. For the time
being, we will confine our description to the non-intrusive approach.
In each of these four tasks human intervention is possible and often desirable.
Indeed in some cases some of these tasks may be entirely carried out by the operator.
Let us return to the analogy of the engineer collecting their meter readings, and try
to identify the tasks. The meter deflections or the numbers displayed on the panels
will naturally be in response to measurements made elsewhere in the plant under
monitoring, and may be picked up by current transformers, voltage transformers,
thermocouples or accelerometers, for example. This is the transduction task, and is
normally performed automatically as it is difficult for the human operator to act in
anything but a qualitative way in fulfilment of this task. That is, they may be able totell if one piece of plant is hotter than another but little else. Having that said, it often
relies on a human operator to ensure that the result of the transduction task is reliable.
The data acquisition task could be simplified to the action of the engineer in writing
down the series of readings from each meter, together with information regarding the
time, location, loading and ambient conditions perhaps, of the plant under monitoring.
In our example this is wholly under human control. The frequency of such readings,
and how long the observations are made, will depend on the characteristic of the
plant.
The processing task corresponds to the analysis of the readings in the same way.It may be considered appropriate to average several of the readings for example, and
to present them in a way that allows easy comparison with other data. This phase
can vary greatly in complexity, and it is this task that demands the application of
significant computing power in automatic systems. We shall return to many of the
more common processing techniques later merely noting at the moment the use of
methods such as spectral analysis, time averaging, and auto- and cross-correlation.
The diagnostic task operates on the results of the processing task in order to
recommend actions that will hopefully result in improved operational readiness and
performance, and improved maintenance scheduling. Again, returning to our simpleanalogy, on the basis of examining the average meter readings and comparing them
with the manufacturer’s operational limits, say, the engineer decides for the next plant
shutdown which items of machinery must be overhauled or replaced. The engineer
arrives at this judgement on the basis of their experience and the data available to

8/20/2019 Condition Monitoring Knjiga
http://slidepdf.com/reader/full/condition-monitoring-knjiga 104/306
Instrumentation requirements 81
them as a result of collecting and processing the meter readings, and having access
to the manufacturer’s data on operational limits. For the manufacturer to set the
operational limits, a relationship between the plant condition and the signature during
operation should have already been established. Understanding of the mechanism of
fault development is particularly useful in determining such threshold values. The
diagnostic task is still most often carried out with significant input from the human
operator, but with the development of knowledge-based expert systems or other forms
of artificial intelligence. Full automation of this phase is being realised.
Recent development of communication technology; for example, in fibre-optics
and semiconductor sensing devices, allows the data acquired to be sent to a cen-
tral point or to the manufacturer where they are processed and analysed. With the
current trend of restructuring in many industrial sectors, the responsibility of plant
condition monitoring has also started to change; operators, asset owners and manu-
facturers may all have parts to play with the manufacturers taking more responsibility
than they traditionally have. Depending on its application, a plant can be equipped
with condition-monitoring functionalities as a selling point. As manufacturers can-
not schedule plant shutdowns, the central position of the operator could hardly be
replaced. Here we are mainly interested in the technical aspects of condition mon-
itoring. The trend towards thorough life costing of plant means that manufacturers
are more closely involved with the operator in managing plant beyond the warranty
period and this opens up an increased market for service work, which can be sustained
by condition-monitoring activity. In Figure 4.1, we summarise, in schematic form,
the four tasks associated with condition-monitoring activity, and indicate the obviousstep of closing the loop as an aid to improve the operational performance.
We must now examine the first two of the four condition-monitoring tasks in
some detail, both in a general way and as they apply to electrical machines. The
data processing task will be examined in Chapter 5 while the diagnostic task will be
delayed to later in the book. At all times we must be mindful that the monitoring
activity is aimed at reaping the benefits to be gained by closing the loop identified in
Figure 4.1.
4.2 Temper ature measurement
Temperature is widely monitored in electrical drives and generators. For example, it
is common to find temperature sensing used to monitor specific areas of the stator
core and the cooling fluids of large electrical machines such as turbine generators.
Such measurements can only give indications of gross changes taking place within
the machine but they are extremely effective if mounted and monitored in care-
fully selected sites. When temperature measurement is combined with information
about the loading and ambient conditions of the machine, it provides valuable mon-itoring information. Bearing temperatures are commonly monitored on drive trains
and, together with vibration sensing, temperature measurement provides the standard
approach to the assessment of the condition of these elements. The typical tech-
niques and sites for temperature measurement in an electrical machine are described

8/20/2019 Condition Monitoring Knjiga
http://slidepdf.com/reader/full/condition-monitoring-knjiga 105/306
82 Conditi on monitor ing of rotati ng el ectri cal machines
in Chapter 8. Here we describe the three principal methods of measuring temperature
electronically
• resistance temperature detection,
• thermistors,• thermocouples.
Each type has acceptable areas of application, which we will now briefly investigate.
The resistance temperature detector (RTD) is also called the resistance thermome-
ter, which uses the resistance change of a metal to indicate temperature change.
Platinum and nickel are usually used because they are retardant to corrosion and
because they have sensitive resistance versus temperature characteristics, as shown
in Figure 4.2 where R 0 is the resistance of the device made of the metal at 0 C [1].
An RTD can be made by either winding insulated metal wire around a thin cylin-
drical former or by evaporating a thin coating of the metal on an insulating, usually
ceramic, substrate. Figure 4.3 shows a commercial sensor enclosed in a thin stainless
R T /
R 0
°C
200 400 600 800 1000
2
1
3
4
5
6
7
Nickel
Copper
Platinum
Tungsten
Fi gure 4.2 Typical temper ature-resi stance character istics of metals
F i gure 4.3 A resi stance temper ature detector device [ Source: Labfacil ity Ltd.]

8/20/2019 Condition Monitoring Knjiga
http://slidepdf.com/reader/full/condition-monitoring-knjiga 106/306
Instrumentation requirements 83
steel tube for protection. Such devices are widely used for gas and liquid tempera-
ture measurement applications up to 1 000 C and are the usual choice for electrical
machine manufacturers for insertion between winding conductors in machine slots.
RTD devices are constructed generally to a base resistance of 100 at 0 C and
have the advantage of being linear over a wide operating range. They have very good
accuracy and precision but have a relatively low sensitivity. They are generally used in
a four-wire configuration of Wheatstone bridge, but two-wire or three-wire operation
is also possible. The circuit converts the change of resistance into the change of output
voltage.
Figure 4.4 shows a Wheatstone bridge circuit for an RTD device made of
platinum. The RTD device has the following temperature–resistance relationship:
R T = R 0(1 + αT ) where R T is the resistance in ohms () and T is the temperature
in degrees celsius; αr = 0.00385/C, R 0 = 100 and the power supply to the cir-
cuits is V s = +15 V . Ignoring the zero adjustment resistance, Table 4.1 shows the
output voltage calculated for two resistance values: R = 5530 and R = 48. The
overall sensitivity and linearity between 0–100 C are then derived. The sensitivity
is defined as the ratio of change of output to the change of input while the linearity
is defined as the deviation from the straight line between the two end points of the
whole range, that is from 0–100 C. It is clear that increasing the value of R causes
the sensitivity to be reduced but the linearity to be improved. The self-heating error
is reduced as the value of R is increased. The Wheatstone bridge arrangement allows
the lead resistance to be easily compensated as shown in the figure.
V s
0 V
R R
R 0 R T(RTD)
Lead compensation
+
−
V o
Zero adjustment
F igure 4.4 Wheatstone bri dge cir cuit for a resistance temper ature detector
Temperature measurement using thermocouples is based on the well-known See-
beck effect whereby a current circulates around a circuit formed using two dissimilar
metals, when the metal junctions are held at different temperatures. If a break is made

8/20/2019 Condition Monitoring Knjiga
http://slidepdf.com/reader/full/condition-monitoring-knjiga 107/306
84 Conditi on monitor ing of rotati ng el ectri cal machines
Table 4.1 Response of a Wheatstone bri dge resistance temperature detector circuit
T (C) R T () V 0(V @R = 5530) V 0(V @R = 48)
0 100 0 0
20 107.79 0.0204 0.24
40 115.54 0.0406 0.46
60 123.24 0.0606 0.66
80 130.89 0.0804 0.84
100 138.5 0.1 1.0
Sensitivity 0.001 V/C 0.01 V/C
Linearity 0.6C error 6C error
Table 4.2 Ranges, outputs and sensiti vity of thermocouple junction materials
Type Junction materials Range (C) Output at Sensitivity at
100 C (mV) 30 C (mV/C)
E chromel/constantan −
279/1000 6.317 0.0609J iron/constantan −210/1200 5.268 0.0517
K chromel/alumel −270/1370 4.095 0.0405
N nicrosil/nisil −270/1300 2.774 0.0268
T copper/constantan −240/400 4.277 0.0407
in one of the wires then a voltage is generated across the break, which increases with
the temperature difference between the junctions. One junction is held at a temperature
that can be easily measured to allow the so-called reference junction compensation.By doing this the need for a carefully controlled reference junction temperature is
avoided and a device with effectively only a single junction results [2]. Some typi-
cal junction materials and their associated operating ranges and outputs are given in
Table 4.2, derived from standard thermocouple tables. Multiple thermocouples can
be combined to form a thermopile of higher sensitivity.
Figure 4.5 shows thermocouples being bonded on the coils of an air-cored axial
flux permanent magnet motor in an electric vehicle for condition monitoring. It is
essential to use the correct leads when extending the wires to the point where the
output voltage is measured. As the thermocouple output is already in the form of a voltage, there is no need to use additional circuit such as a Wheatstone bridge
for signal conversion. However downstream devices are still generally required for
amplification and reference junction compensation. Figure 4.6 shows a reference
junction temperature compensation circuit using an LM35 integrated circuit whose

8/20/2019 Condition Monitoring Knjiga
http://slidepdf.com/reader/full/condition-monitoring-knjiga 108/306
Instrumentation requirements 85
F igure 4.5 Thermocouplesto monitor coil temper aturei n a permanent magnet dri ve motor
1
2
3
LM35
Measurement junction
Copper
Constantan
Copper
Copper
Compensatedoutput voltage
+5 V
R 1: 100 K
10 mV/ C
R 2: 424
F igure 4.6 Reference j unction compensation for a ther mocouple
output voltage is 0 V at 0 C and increases at a rate of 10 mV/C. A voltage divider is
included to cause an approximately 40µV/C voltage gradient across resistor R 2 that
forms part of the measured output voltage. The voltage across R 2 will then compensate
the voltage developed across the cold junction marked as ‘3’ in Figure 4.6, assuming
that the cold junction is at room temperature, around 18–23 C. When appropriate,
the sparking welding technique can be used to cause a thermocouple junction directly
on a metallic surface.The working life of thermocouples depends on the working temperature and
the physical dimensions of the junction materials, but copper/constantan and
chromel/alumel, which are most widely used in electrical machine condition moni-
toring, can be expected to survive for many years. Depending on the quality of the

8/20/2019 Condition Monitoring Knjiga
http://slidepdf.com/reader/full/condition-monitoring-knjiga 109/306
86 Conditi on monitor ing of rotati ng el ectri cal machines
signal conversion circuit, the performance of RTD temperature transduction can be
very good. It is, however, relatively expensive. Thermocouples usually offer slightly
reduced performance at much more modest cost. We noticed that the changes of
output involved in both types of temperature transducer were small.
Another type of temperature transducer we wish to briefly mention is the
thermistor, which provides a coarse but very sensitive response. Thermistors are
manufactured from blends of metal oxides of cobalt, iron, titanium and nickel, which
are fired like clays into small discs or beads that may be encapsulated in resin or
enclosed in protective brass tubes. They are also available in the form of washers
for easy mounting. Figure 4.7 shows a range of commercial thermistors. Thermis-
tors exhibit a large change in resistance as a function of temperature. In addition to
sensitivity, they also have the advantages of high stability, fast response and very
small physical size. Typically a glass-bead device will have a diameter in the order
of 0.25 mm, while flake thermistors are produced in thickness down to 0.025 mm
with cross-sections of 0.5 × 0.5 mm. The size advantage means that the time constant
of thermistors operated in sheaths is small. But the size reduction also decreases the
heat dissipation capability and so makes the self-heating effect of greater importance.
Thermistors are generally limited to 300 C, above which level the stability reduces.
They do not provide a linear output and this must be taken into account. For this
reason, it is also difficult to control the consistency between samples of thermistors,
implying that the precision achievable is relatively low. A thermistor is usually used
as a logic-switching device to operate an alarm when the temperature exceeds a preset
limit. Thermistors are inexpensive.
Surfacemountdevices
Tube sheath
Disk in sleeve
Screw
Disk
Bead
Washer
Fi gure 4.7 Commercial thermistors [ Source: EPCOS Inc. and Tyco El ectronics Corp.]
Figure 4.8 shows four typical temperature-resistance characteristics of
thermistors. The nominal values of resistance 10 k , 20 k , 30 k or 100 k
are defined for a room temperature of 25 C. We note that the vertical axis is in
logarithmic scale implying that the change of resistance with temperature is indeed

8/20/2019 Condition Monitoring Knjiga
http://slidepdf.com/reader/full/condition-monitoring-knjiga 110/306
Instrumentation requirements 87
R ,
( k Ω )
104
103
102
10
1
10−1
10
−2
−50 50 150 250 350
T, °C
30 kΩ20 kΩ10 kΩ
100 kΩ
Fi gure 4.8 Thermistor characteri stics
significant. Since the accuracy of the device is hardly high and the characteristic
may also slightly drift after long-time thermal cycling, the signal conversion scheme
adopted for a thermistor is usually quite simple; in most applications, a voltage divider
will be more sensible than a Wheatstone bridge circuit, helping to keep the overallcost down.
In recent years, semiconductor temperature transducers in the form of integrated
circuits have found more applications [1]. Their design results from the fact that
semiconductor diodes (p – n junctions) have temperature sensitive voltage-current
characteristics. With external power supply and internal feedback mechanisms, tran-
sistors in the integrated circuit can be made to produce an output current or voltage
that is proportional to the absolute temperature. A voltage is developed as the current
flows through a fixed resistor. The use of integrated circuit temperature sensors is
limited to applications where the temperature is within a −55
C to 150
C range.Their errors are typically ±3 per cent, quite low indeed. They are very inexpensive
and therefore have been used in large quantities to monitor the temperature distribu-
tion of equipment with large dimensions such as pipes and cables. We have described
reference junction compensation for a thermocouple. Such integrated circuits can also
be used for that purpose.
Other techniques such as quartz thermometers, fibre-optic temperature sensing
and infrared thermography can be used to achieve high accuracy, fast response or pro-
vide non-contact and spark-free solutions. They are generally more expensive than the
techniques described earlier and have not been widely used in condition monitoring of electrical machines. However, in cases where the value of the monitored equipment
greatly exceeds the cost of the transducers, such techniques are now increasingly
being used. For instance, fibre-optic temperature sensing has been applied to identify
hot spots in switchgear, transformers and more recently synchronous generators [3,4].

8/20/2019 Condition Monitoring Knjiga
http://slidepdf.com/reader/full/condition-monitoring-knjiga 111/306
88 Conditi on monitor ing of rotati ng el ectri cal machines
Laser light
source
Backscattering
Optic fibresensor
Computer
Coupler
Detector
Data
acquisition
Fi gure 4.9 Pr inciple of fibre-optic temper ature sensing
For this reason, we now outline the principle and characteristics of such a technique,
indicating its advantages and limitations.
Figure 4.9 shows the basic concept of fibre-optic temperature sensing. When a
laser pulse is injected into the optic fibre, it is subject to scattering as it travels and
the back scattered pulse is returned as shown in the principle of optical time domain
reflectometry [4,5]. The back-scattered light consists of a Rayleigh component, a
Brillouin component and a Raman component, which differ in wavelength. Thermally
influenced molecular vibration causes the Raman-scattered component to change and
therefore it is sensitive to temperature. According to the time when the signatures in
the back-scattered light are received, the temperature along the optical fibre can be detected. Therefore fibre-optic temperature sensing can be a naturally distributed
method. Spatial resolution is typically in the 1 m range in terms of the fibre length. By
winding the optic fibre around the body whose surface temperature is to be measured,
better spatial resolution in terms of physical body dimensions can be achieved [6].
Using a technique called fibre Bragg grating, distributed temperature sensing can
be multiplexed with strain and displacement measurements in the same fibre-optic
system, as to be described later in this chapter. The temperature resolution is typically
less than 0.1 C in the range of zero to a few hundred degrees celsius. The response
time of fibre-optic temperature sensing is around 2 s.
4.3 V ibration measurement
4.3.1 General
In Chapter 8 we will discuss at length the techniques available and the applicability of
vibration monitoring. This is particularly useful for monitoring the condition of com-
ponents in the mechanical drive train of electrical machines, such as gearboxes, shaftcouplings, bearings and rotor unbalance. More recent work has extended that to the
extraction of condition information from electrical variables such as current, vibration
sensing (including acoustic noise) remains a most important monitoring technique for
the operators of electromechanical plant [7]. Its use is extremely widespread and has

8/20/2019 Condition Monitoring Knjiga
http://slidepdf.com/reader/full/condition-monitoring-knjiga 112/306
Instrumentation requirements 89
reached a high degree of sophistication. It revolves around the measurement of three
quantities that are related by numerical integration or differentiation
• displacement,
• velocity,• acceleration.
Which quantity one should measure depends on the size of the plant being monitored,
and the frequency range in which one is interested. Generally, machines of similar
type and size have a more or less constant vibrational velocity. Also as the vibration
frequency increases it is likely that displacement levels will fall but acceleration levels
will rise. This suggests that with increasing frequency it is better to progress from a
displacement device to a velocity transducer, and ultimately to an accelerometer. As
a guide, the approximate frequency ranges of application are as shown in Figure 4.10.
It is useful to appreciate that the process of numerical integration attenuates
measurement noises while numerical differentiation amplifies them.
100.1 1 100 1000 10000 100000
Frequency, Hz
Displacement
Velocity
Acceleration
F igure 4.10 Normal frequency ranges of applicabili ty for vi bration measurements
Care must be exercised, however, when monitoring systems that have small mov-
ing masses, for in such circumstances transmitted forces may be small and the mass
of the accelerometer may be significant compared to the body mass. Here, displace-ment will usually provide the best indication of condition. We can now characterise
vibration transducers according to the quantity they measure.
4.3.2 D isplacement tr ansducer s
Here we shall confine our interests to non-contacting displacement probes or proxime-
ters. This excludes some capacitive and low-frequency inductive devices such as the
LVDT (linear variable differential transformer). One type of non-contact device that
is used in condition monitoring operates by using a high-frequency current/voltagesource to generate an electromagnetic field at the probe tip. The system energy, due
to eddy currents in the target, is dependent upon the local geometry of the area sur-
rounding the probe tip. If the system energy changes (for example, when the target
surface, which is ferromagnetic and electrically conductive, moves with respect to

8/20/2019 Condition Monitoring Knjiga
http://slidepdf.com/reader/full/condition-monitoring-knjiga 113/306
90 Conditi on monitor ing of rotati ng el ectri cal machines
the probe) then the system energy also changes. This change is readily measured
as the change of voltage/current in the high-frequency excitation circuit is related
to the displacement of the target surface from the probe tip. It should be noted that
such systems measure the relative motion between the probe and the target, hence
the vibration of the housing in which the probe is mounted is not readily measured
by this technique. Figure 4.11 shows the operation of a proximity probe.
Shaft
Housing
Housing
Driver/detector DC output
proportional to g
Air gapg
Fi gure 4.11 Operati on of a proximeter probe
Sensitivities in the order of 10 mV/µm displacement are easily achievable with
displacement probes, and they find wide application in situations where heavy hous-
ings ensure small external movements. The measurements of shaft eccentricity and
differential movements due to expansion are therefore most easily achieved using
displacement transducers. The same principle has been used to develop devices
that effectively measure rotational displacement or speed by sensing the passageof keyways on the shafts. These are sometimes called key phasors.
As mentioned previously, displacement is most effectively measured at the lower
frequencies even though the frequency range of eddy current systems can extend
above 10 kHz. They are relatively robust transducers and the driving and detec-
tion circuits are straightforward. Essentially the high-frequency signal applied to the
probe is modulated by the passage of the target, and the demodulated signal used as
the measurement quantity. Consideration of Figure 4.11, which illustrates the basic
displacement measurement principle, shows us that the output of the system will
depend not only on the displacement between the probe and the target, but also onthe material from which the target is made. This is because the eddy current reac-
tion of the target, and hence the system energy, is dependent upon the conductivity
and/or permeability of the material. Proximity probes must therefore be calibrated
for each target material. Care must also be taken when mounting the probe to ensure

8/20/2019 Condition Monitoring Knjiga
http://slidepdf.com/reader/full/condition-monitoring-knjiga 114/306
Instrumentation requirements 91
that electrically conducting and magnetic surfaces around the probe tip do not cause
unnecessary disturbance of the applied high-frequency field and that the target surface
is smooth with no surface or magnetic disturbances.
Another non-contact device uses a fibre optic, which detects the light reflection
and compares it with the injected light to determine the distance between the reflec-
tion surface and the optic-fibre end. This is illustrated in Figure 4.12. The result is
converted into a voltage signal using a photodiode in the receiver. The contact-free
measurement range is up to 0.3 mm with a typical resolution of 0.01 mm. There are
other fibre-optic displacement sensors based on fibre Bragg grating that can have a
larger measurement range. However they usually require contact to the target surface;
temperature compensation may also be necessary as the displacement is translated into
strain for measurement [8]. In general, fibre-optic devices are intrinsically immune
to electromagnetic noise problems.
Laser lightsource
ReceiverHousing
Shaft
g
Fi gure 4.12 Pri nciple of fibre-optic proximetry
4.3.3 Veloci ty tr ansducer s
Rotational speed in electrical machine systems is usually measured for the purpose
of control. Optical encoders are now used as common practice. They effectively
derive speed information by counting the position rotated per unit time. The opticalencoder, which when in use is attached to the rotating shaft, carries a disk cut in
slits. A light source and a receiving device are aligned on both sides of the disk.
Light pulses are caused on the receiver, which are converted into electrical pulses
by a photo-sensitive transistor. Such an encoder is very suitable to interface with
a digital control system. The angular resolution is typically 0.18 corresponding to
2 000 pulses per revolution. Linear encoders are commercially available. However,
application of such optical encoders for vibration measurement has been limited to
the very-low-frequency range because position variation is hardly enough when the
vibration frequency is high. High-precision electromagnetic resolvers can also beused to obtain rotational information from a drive shaft.
For vibration measurement, velocity is most usefully sensed in the frequency
range from 10 Hz to 1 kHz. This is usually achieved in an analogue manner by
designing a spring mass system with a natural frequency less than 10 Hz, and letting

8/20/2019 Condition Monitoring Knjiga
http://slidepdf.com/reader/full/condition-monitoring-knjiga 115/306
92 Conditi on monitor ing of rotati ng el ectri cal machines
Spring
Coil
Mass in the formof a magnet
Probe tip
Fi gure 4.13 Pr inciple of an electromagnetic velocity probe
the mass take the form of a permanent magnet, as illustrated in Figure 4.13. The
device is responsive regardless of the range of displacement involved in vibration.
The magnet is then surrounded by a coil that is securely attached to the housing.
Whenever the housing is placed in contact with a vibrating surface the housing and
coil move with respect to the magnet and cause an EMF to be induced in the coil, in
accordance with the expression
e = Bv (4.1)
where e is the induced EMF, the effective length of the conductor in the coil, B the
radially directed flux density, which is ideally constant, and v is the velocity in the
axial direction.
This transducer is relatively delicate but has the advantage of producing an output
signal that is relatively large, and therefore requires little or no signal condition-
ing. Modern electromagnetic velocity transducers are designed using computer-aided
design software including finite-element analysis to ensure the quality of dynamic
response in the target frequency range.
4.3.4 Accelerometer s
Nowadays, however, velocity and displacement are commonly measured using
accelerometers, the required parameters being derived by integration. Accelerome-
ters are rigidly fastened to the body undergoing acceleration. For each accelerometer
there is a sensing axis aligned with the direction of the acceleration that is intended to
be measured. Accelerometers produce an electrical output that is directly proportional
to the acceleration in the sensing axis. The output should be low if the acceleration isapplied at 90 to the sensing axis; the non-zero output is due to cross-sensitivity.
The piezoelectric device has become almost universally accepted as the transducer
to use for all but the most specialised of vibration measurements. The piezoelectric
crystals act as both the spring and damper in the accelerometer that is consequently
very small and light in weight. The piezoelectric accelerometer is physically much

8/20/2019 Condition Monitoring Knjiga
http://slidepdf.com/reader/full/condition-monitoring-knjiga 116/306
Instrumentation requirements 93
more robust than the velocity transducer and has a far superior frequency range. This
has become more important as condition-monitoring techniques involving frequen-
cies well above 1 kHz have been adopted. The construction of a typical piezoelectric
accelerometer is illustrated in Figure 4.14.
Piezoelectric elementin shear
Preloadingring
Delta shear typeBase
Output
Seismic mass
Triangularcentre post
Preloading spring
Piezoelectric elementin compression
Output
Compression type
F igure 4.14 A piezoelectri c accelerometer [ Source: Bruel & Kj aer]
When it is subject to vibration, the seismic mass, which is held against the
piezoelectric crystal element, exerts a force upon it. This force is proportional to
the acceleration. Under such conditions the piezoelectric crystal, which is usually a
polarised ceramic material, generates a proportional electric charge across its faces.
The output can then be conditioned using a charge amplifier and either incrementalvelocity or displacement signals recovered by integration. The device has the obvi-
ous advantage of generating its output without an external electrical source being
required. As the electrical impedance of a piezoelectric crystal is itself high, the
output must be measured with a very high-impedance instrument to avoid loading
effects. Integrated circuit piezoelectric devices have become available with a high-
impedance charge amplifier resident in the accelerometer encapsulation. In recent
years, integrated accelerometer circuits, which include more than one sensing axis,
have been developed to permit 2D and 3D measurements.
When using piezoelectric accelerometers it is important to realise that, unlike proximity probes, the natural frequency of the device is designed to be above the usual
operating range. A typical frequency response is shown in Figure 4.15. This limits the
Operating range
| A |
25
Accelerometerresonance peak
Frequency, kHz
F igure 4.15 Accelerometer response

8/20/2019 Condition Monitoring Knjiga
http://slidepdf.com/reader/full/condition-monitoring-knjiga 117/306
94 Conditi on monitor ing of rotati ng el ectri cal machines
useful operating range to around 30 per cent of the natural frequency. Also, because
the output is low at low frequencies the normal range of application of accelerometers
is approximately 1–8 kHz, although small devices may have ranges extending beyond
200 kHz and integrated amplifier allows measurement at nearly DC [9].
There is an extremely wide range of piezoelectric accelerometers available today,
from very small devices that will measure shocks of high acceleration (in excess
of 106 ms−2) to large devices with sensitivities greater than 1 000 pC/ms−2. Highly
sensitive devices, on the other hand, have to be physically large so as to accommodate
the increased seismic mass required to generate the high output. In all cases, however,
care must be taken when mounting accelerometers since they can be easily destroyed
through over-tightening. Table 4.3 provides a short summary of the area of application
of each of the vibration transducer types discussed.
Table 4.3 Application of vibrati on monitori ng techniques
Application Transducer type
Motor/pump drives Velocity or acceleration
Motor/fan drives Displacement or velocity
Motors connected to gear boxes
(rolling element bearings)
Acceleration
Motor with oil film bearings Displacement
Generators steam turbines Displacement
Overall vibration levels on all of
the above
Velocity
4.4 Force and tor que measurement
One of the commonest ways of measuring force is to use a strain gauge, a simple
device that comprises a long length of resistance wire formed into a zigzag shape
and securely bonded to a surface that will alter shape elastically under the action of
the force. When the gauge is stressed under the action of the force, the cross-section
and length of the wire changes so that its resistance alters. In recent years, wire-type
gauges have largely been replaced by metal foil or semiconductor types. Figure 4.16
shows a metal-foil-type strain gauge; the material used is typically the ‘advance alloy’
made of copper, nickel and manganese. Cutting a foil into the required shape is much
easier than forming a piece of wire into the required shape, and this makes the devices
cheaper to manufacture.
The input–output relationship of a strain gauge is expressed by the gauge factor,
G , which is defined as the relative change in resistance, R , for a given value of strain,ε; that is,
G =R /R nominal
ε(4.2)

8/20/2019 Condition Monitoring Knjiga
http://slidepdf.com/reader/full/condition-monitoring-knjiga 118/306
Instrumentation requirements 95
Fi gure 4.16 A metal foil-type strain gauge
Strain gauges are manufactured to various nominal values of resistance, of which
120, 350 and 1 000 are the most common. The typical maximum change of resis-
tance in a 120 device would be 5 at maximum deflection. The resistance of
the gauge is usually measured by a bridge circuit, and the strain (and hence force)
is inferred from the bridge output measured. The maximum current that is allowed
to flow in a strain gauge is in the region of 5–50 mA, generally small to limit the
self-heating effect.
In order to measure forces, strain gauges need to be applied in a particular arrangement, examples of which are shown in Figure 4.17. Within the same stressed
F
F
F
Gaugeelements
Load cell Beam element
Proving ring
F igure 4.17 Ar rangement of strai n gauges to measure force

8/20/2019 Condition Monitoring Knjiga
http://slidepdf.com/reader/full/condition-monitoring-knjiga 119/306
96 Conditi on monitor ing of rotati ng el ectri cal machines
−V s
V out
R +∆R
+
−
+V s
R −∆R
R +∆R R −∆R
Fi gure 4.18 Wir ing of strai n gauges in a Wheatstone bri dge
structure, usually two strain gauges are subject to tension while other two are subject to
compression. Consequently the resistance of some strain gauges increases while that
of others decreases. Figure 4.18 shows a common way of wiring four strain gauges
into a Wheatstone bridge where the increased and decreased resistance alternates
to maximise the output sensitivity. Note that the voltage supply to the Wheatstone
bridge circuit is ±V rather than between 0 and 2Vs. This is to avoid commonmode voltage in the output that can cause common mode errors in the downstream
circuits [10].
Force transducers of this type are routinely used to measure forces ranging from
a few newtons to many tonnes force. Care must be taken to either operate them at a
constant temperature or properly compensate for the effects due to expansion. Modern
strain gauge bridge systems, to measure R , may be self-balancing with automatic
read-out.
It is immediately apparent that such devices can be used to measure torques
applied to shafts but if the shaft is in motion the additional problem of extractingthe signal must be faced. This may be done using instrumentation grade slip rings
attached to the shaft, or by suitable noise-free telemetry. Telemetry systems in the
electrically noisy environment around electromechanical machinery can be difficult
to implement. Alternatively, contact-free inductive (magneto-elastic) or fibre-optic
(fibre Bragg grating) torque transducers can be used that work on the change of the
material permeability or the reflection of polarised light. Table 4.4 outlines a few such
strain measurement methods that, although still relatively expensive, are becoming
increasingly popular owing to the computing power available for compensation of
temperature and/or non-linearity effects. For instance, Sihler and Miri [11] described a case of using an inductive torque transducer in a synchronous generator system
to monitor the occurrence of subsynchronous resonance and this enables the control
system to provide damping using active compensation, this subject is dealt with in
more detail in Chapter 7.
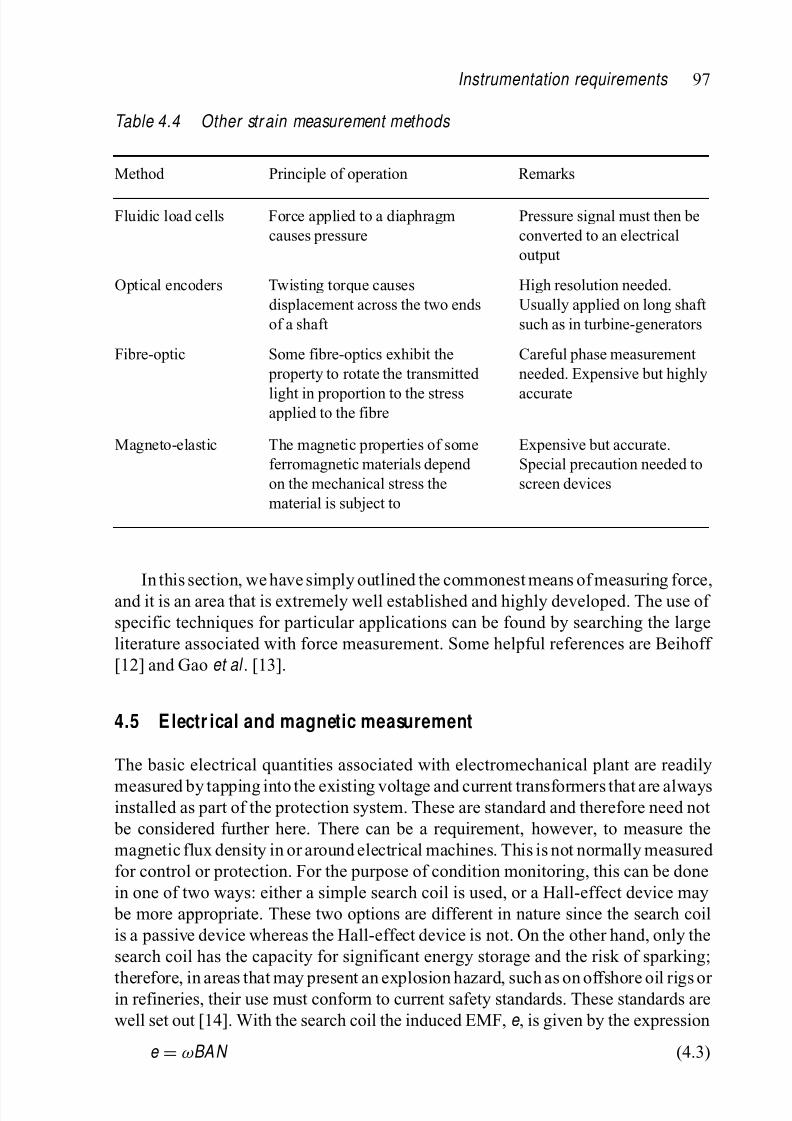
8/20/2019 Condition Monitoring Knjiga
http://slidepdf.com/reader/full/condition-monitoring-knjiga 120/306
Instrumentation requirements 97
Table 4.4 Other str ain measurement methods
Method Principle of operation Remarks
Fluidic load cells Force applied to a diaphragm
causes pressure
Pressure signal must then be
converted to an electrical
output
Optical encoders Twisting torque causes
displacement across the two ends
of a shaft
High resolution needed.
Usually applied on long shaft
such as in turbine-generators
Fibre-optic Some fibre-optics exhibit the
property to rotate the transmitted
light in proportion to the stressapplied to the fibre
Careful phase measurement
needed. Expensive but highly
accurate
Magneto-elastic The magnetic properties of some
ferromagnetic materials depend
on the mechanical stress the
material is subject to
Expensive but accurate.
Special precaution needed to
screen devices
In this section, we have simply outlined the commonest means of measuring force,
and it is an area that is extremely well established and highly developed. The use of
specific techniques for particular applications can be found by searching the large
literature associated with force measurement. Some helpful references are Beihoff
[12] and Gao et al . [13].
4.5 E lectr ical and magnetic measurement
The basic electrical quantities associated with electromechanical plant are readily
measured by tapping into the existing voltage and current transformers that are alwaysinstalled as part of the protection system. These are standard and therefore need not
be considered further here. There can be a requirement, however, to measure the
magnetic flux density in or around electrical machines. This is not normally measured
for control or protection. For the purpose of condition monitoring, this can be done
in one of two ways: either a simple search coil is used, or a Hall-effect device may
be more appropriate. These two options are different in nature since the search coil
is a passive device whereas the Hall-effect device is not. On the other hand, only the
search coil has the capacity for significant energy storage and the risk of sparking;
therefore, in areas that may present an explosion hazard, such as on offshore oil rigs or in refineries, their use must conform to current safety standards. These standards are
well set out [14]. With the search coil the induced EMF, e , is given by the expression
e = ωBA N (4.3)
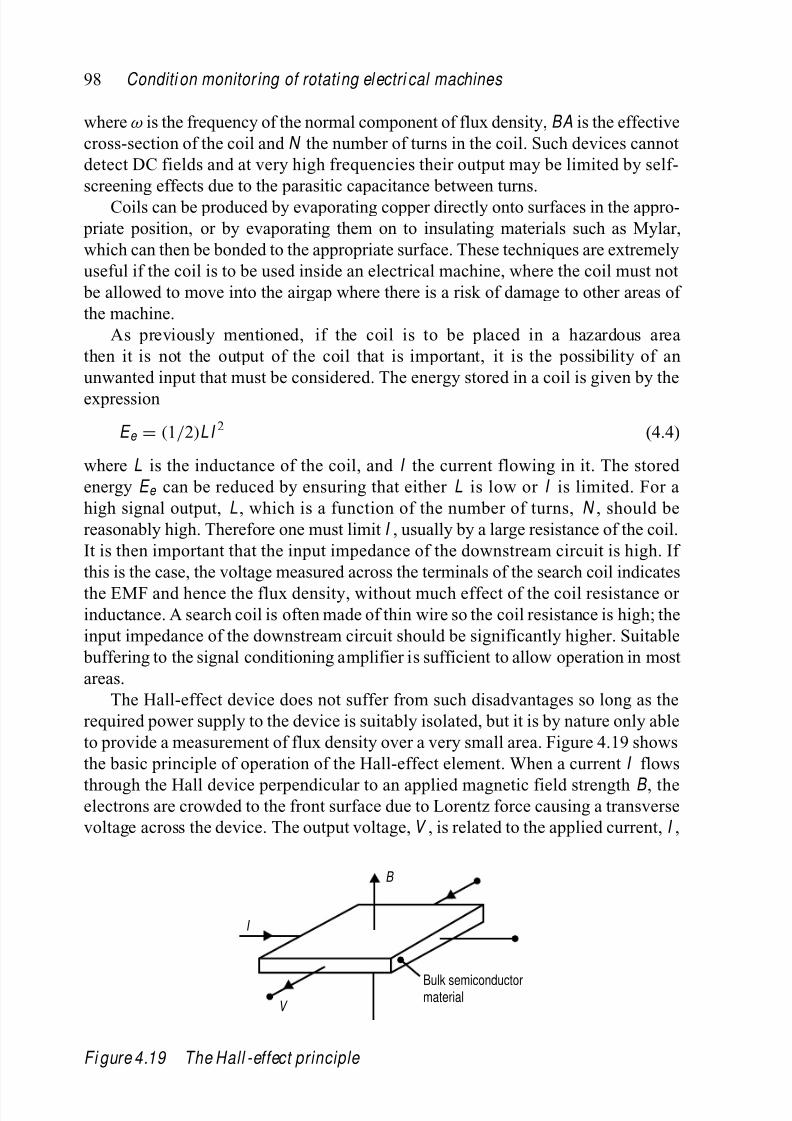
8/20/2019 Condition Monitoring Knjiga
http://slidepdf.com/reader/full/condition-monitoring-knjiga 121/306
98 Conditi on monitor ing of rotati ng el ectri cal machines
where ω is the frequency of the normal component of flux density, BA is the effective
cross-section of the coil and N the number of turns in the coil. Such devices cannot
detect DC fields and at very high frequencies their output may be limited by self-
screening effects due to the parasitic capacitance between turns.
Coils can be produced by evaporating copper directly onto surfaces in the appro-
priate position, or by evaporating them on to insulating materials such as Mylar,
which can then be bonded to the appropriate surface. These techniques are extremely
useful if the coil is to be used inside an electrical machine, where the coil must not
be allowed to move into the airgap where there is a risk of damage to other areas of
the machine.
As previously mentioned, if the coil is to be placed in a hazardous area
then it is not the output of the coil that is important, it is the possibility of an
unwanted input that must be considered. The energy stored in a coil is given by the
expression
E e = (1/2)LI 2 (4.4)
where L is the inductance of the coil, and I the current flowing in it. The stored
energy E e can be reduced by ensuring that either L is low or I is limited. For a
high signal output, L , which is a function of the number of turns, N , should be
reasonably high. Therefore one must limit I , usually by a large resistance of the coil.
It is then important that the input impedance of the downstream circuit is high. If
this is the case, the voltage measured across the terminals of the search coil indicates
the EMF and hence the flux density, without much effect of the coil resistance or inductance. A search coil is often made of thin wire so the coil resistance is high; the
input impedance of the downstream circuit should be significantly higher. Suitable
buffering to the signal conditioning amplifier is sufficient to allow operation in most
areas.
The Hall-effect device does not suffer from such disadvantages so long as the
required power supply to the device is suitably isolated, but it is by nature only able
to provide a measurement of flux density over a very small area. Figure 4.19 shows
the basic principle of operation of the Hall-effect element. When a current I flows
through the Hall device perpendicular to an applied magnetic field strength B , theelectrons are crowded to the front surface due to Lorentz force causing a transverse
voltage across the device. The output voltage, V , is related to the applied current, I ,
B
I
V
Bulk semiconductormaterial
Fi gure 4.19 The Hall -effect principle

8/20/2019 Condition Monitoring Knjiga
http://slidepdf.com/reader/full/condition-monitoring-knjiga 122/306
Instrumentation requirements 99
and the field, B , by
V =kI B
nq (4.5)
where q is the electronic charge, n is the number of charge carriers per unit volume
in the semiconductor, k is a constant, and k /nq is the Hall constant of material. In
measuring magnetic field the current is established and regulated by a power supply.
Hall-effect devices have the advantage of being able to measure down to DC, and
can be made in extremely small sizes. Since Hall effect can be established in less than
a nanosecond, the response bandwidth of a Hall-effect transducer can easily be over
100 MHz.
We said at the beginning that current and voltage measurements are usually
obtained from current transformers and voltage transformers. This is often the only
option we have for large generators in power plants. For small- and medium-size
electric machines, for example motors in most variable speed drives, it is often
more common to measure both current and voltage using Hall-effect transducers.
Figure 4.20 shows a board with three Hall-effect current transducer channels and
a board with three Hall-effect voltage transducer channels. The operating principle
of the transducer is still that shown in Figure 4.19. Commercial Hall-effect current
transducers require voltage supply to establish the current while the magnetic field is
set up by the current to be measured. This allows contact-free arrangement as the con-
ductor carrying the current passes through the Hall transducer that is shaped in a ring.
F igure 4.20 H all -effect current and voltage transducers

8/20/2019 Condition Monitoring Knjiga
http://slidepdf.com/reader/full/condition-monitoring-knjiga 123/306
100 Conditi on monitor ing of rotati ng el ectri cal machines
Hall-effect transducers are also available for measuring voltage, where the voltage
is turned into weak current through a large ohmic resistor, say 100 k . Both cur-
rent and voltage measurement using Hall-effect transducers requires on-board signal
conditioning to set the ratio.
Another current transduction technique used for condition monitoring of electrical
machines is the Rogowski coil whose operating principle is similar to that of a search
coil. However, a Rogowski coil is specifically arranged to provide features that are
desirable in some applications. As shown in Figure 4.21, a Rogowski coil is an air-
cored toroidal coil that can be placed around a conductor that may carry current. An
EMF is induced by the alternating magnetic field. Since there is no saturable magnetic
component in the coil, the total magnetic field is strictly proportional to the current that
excites it and the net effect of any current external to the toroidal coil is always zero.
To complete the Rogowski coil current transducer, the induced EMF is electronically
integrated so that the output from the integrator, properly initialised, is a voltage
that accurately reproduces the current waveform. Rogowski coils are often used to
capture the high-frequency spikes in the neutral current that may be used to interpret
internal faults or partial discharge in an electrical machine [15]. Conventional CTs
are not suitable for this purpose due to more limited bandwidth and possible core
saturation.
Currentv o (EMF)
Fi gure 4.21 Il lustrati on of a Rogowski coil measuri ng current in a busbar
4.6 W ear and debris measurement
In many electrical machines, we can derive crucial condition information from fluid
lubricant and coolant. For example, bearing damage accounts for at least 50 per
cent of rotating electrical machine failures (see Chapter 3 and Reference 16). As the
bearing wears, we would naturally expect to detect debris in the lubricant. Similarly,
when internal faults such as partial discharges occur in the machine, we would expectthat the coolant would be contaminated. Chemical methods of monitoring the wear
and contamination will be discussed more fully in Chapter 6. For completeness, we
will here briefly describe the physical techniques of debris measurement in line with
the transduction task in monitoring. The most common method of doing this is to
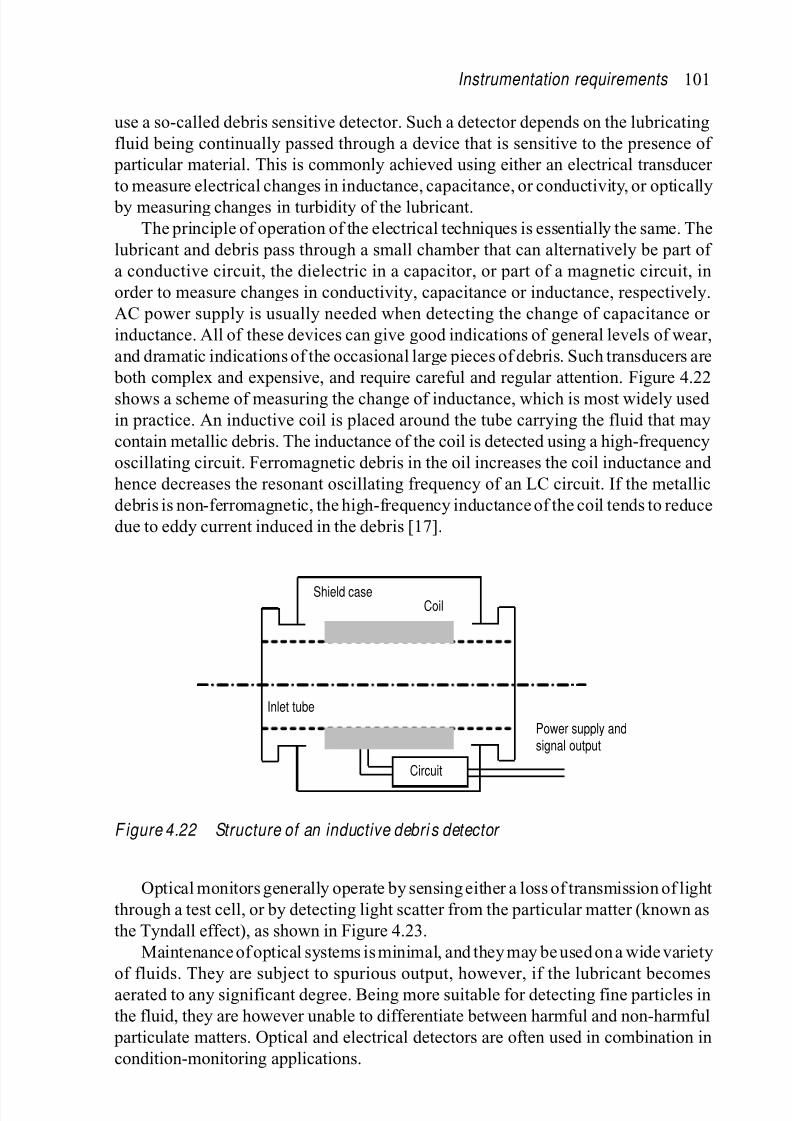
8/20/2019 Condition Monitoring Knjiga
http://slidepdf.com/reader/full/condition-monitoring-knjiga 124/306
Instrumentation requirements 101
use a so-called debris sensitive detector. Such a detector depends on the lubricating
fluid being continually passed through a device that is sensitive to the presence of
particular material. This is commonly achieved using either an electrical transducer
to measure electrical changes in inductance, capacitance, or conductivity, or optically
by measuring changes in turbidity of the lubricant.
The principle of operation of the electrical techniques is essentially the same. The
lubricant and debris pass through a small chamber that can alternatively be part of
a conductive circuit, the dielectric in a capacitor, or part of a magnetic circuit, in
order to measure changes in conductivity, capacitance or inductance, respectively.
AC power supply is usually needed when detecting the change of capacitance or
inductance. All of these devices can give good indications of general levels of wear,
and dramatic indications of the occasional large pieces of debris. Such transducers are
both complex and expensive, and require careful and regular attention. Figure 4.22
shows a scheme of measuring the change of inductance, which is most widely used
in practice. An inductive coil is placed around the tube carrying the fluid that may
contain metallic debris. The inductance of the coil is detected using a high-frequency
oscillating circuit. Ferromagnetic debris in the oil increases the coil inductance and
hence decreases the resonant oscillating frequency of an LC circuit. If the metallic
debris is non-ferromagnetic, the high-frequency inductance of the coil tends to reduce
due to eddy current induced in the debris [17].
Shield caseCoil
Circuit
Inlet tube
Power supply andsignal output
F igure 4.22 Structure of an inductive debri s detector
Optical monitors generally operate by sensing either a loss of transmission of light
through a test cell, or by detecting light scatter from the particular matter (known as
the Tyndall effect), as shown in Figure 4.23.
Maintenance of optical systems is minimal, and they may be used on a wide variety
of fluids. They are subject to spurious output, however, if the lubricant becomesaerated to any significant degree. Being more suitable for detecting fine particles in
the fluid, they are however unable to differentiate between harmful and non-harmful
particulate matters. Optical and electrical detectors are often used in combination in
condition-monitoring applications.

8/20/2019 Condition Monitoring Knjiga
http://slidepdf.com/reader/full/condition-monitoring-knjiga 125/306
102 Conditi on monitor ing of rotati ng el ectri cal machines
To signal conditioning
Lubricant
Test cell fortransmissionmeasurement
Light sensor
Fi gure 4.23 Ar rangement for an optical debri s sensor
4.7 Signal conditioning
Signals from sensing devices will often require some type of modification before they
are transferred for data acquisition. This requires local signal conditioning circuits
that usually employ analogue devices. The modification may be amplification or aver-
aging, for example. In noisy environments, it is often necessary to filter the outputs of
the transducers. Figure 4.24 shows two typical signal conditioning circuits using oper-
ational amplifiers and their input–output relationships under ideal conditions. Their
operation is explained thoroughly in many textbooks. Figure 4.25 shows a buffer
amplifier circuit that can avoid the effect of the resistance of the leads. This allows
transmission of analogue signals over distances up to 100 m using screened cables.
R F
R
v in
v out = v in (R F / R +1)
−
+
R F
v 3 v out =
−
R F / R (v1+v2+v3
v 1
v 2
R
R
R −
+
Fi gure 4.24 Two commonly used ampli fier circuits
We saw in previous sections that many transducers output a differential voltage
signal by using a Wheatstone bridge whose loading capability is very small; that is, the
current drawn from the bridge should ideally be zero. Furthermore, we often would
like to turn the differential voltage into a voltage signal referenced to the commonground with the rest to the downstream circuit. This can be achieved by an instrumen-
tation amplifier, as shown in Figure 4.26, for an RTD temperature transducer. The
entire instrumentation amplifier circuit is usually made in a single chip and value R G
can be tuned externally to adjust the overall gain of amplification [10].

8/20/2019 Condition Monitoring Knjiga
http://slidepdf.com/reader/full/condition-monitoring-knjiga 126/306
Instrumentation requirements 103
−
+
Load
R L
R
V in
V out
V out = V in (R L / R )
Cable resistance has little effect.
F igure 4.25 Buffer ampli fier circuit for signal transmission
−
+
R
+
−
−
+
R
R 0 R T
R G
V s −V s
V o
0 V
Instrumentationamplifier
Fi gure 4.26 Instrumentation amplifier
More generally, great care must be taken with regard to the cabling and termination
of transducers and equipment to reduce noise problems [18]. Cables should be of high
quality and routed through unexposed areas wherever possible, so as to avoid the possibility of accidental damage. If many channels coexist in the same transmission
corridor, care must be taken to avoid common impedance coupling between channels
by segregating power from signal cables and ensuring that cables cross at right angles
where Electromagnetic Compatibility (EMC) isolation is important. In most cases
twin-screened twisted pairs should be used to couple a transducer to the primary data
acquisition unit to avoid induction from low frequency fields <500 Hz. Screened
coaxial cables are suitable to screen from high frequency fields >100 kHz. Optical
fibre cabling is now robust and therefore a frequently used alternative, particularly
when high noise immunity is essential. These issues are particularly important withcondition-monitoring electrical machines supplied from harmonic rich converters.
Communications between the primary data acquisition unit and the processing system
should also be established via a high-integrity low-noise link to avoid any chance of
data corruption or interruption.

8/20/2019 Condition Monitoring Knjiga
http://slidepdf.com/reader/full/condition-monitoring-knjiga 127/306
104 Conditi on monitor ing of rotati ng el ectri cal machines
4.8 D ata acquisition
The precise nature of the data acquisition techniques used is usually determined by the
subsequent algebraic manipulations that will be performed on the datasets produced
by the transduction process. It is not really possible, therefore, to separate these two
tasks fully in most cases. What is of paramount importance, however, irrespective of
the complexity of the monitoring system, is the fidelity of the information received
by the processing unit. Transmitted or recorded data must be sufficiently noise-free
to comply with the demands of the monitoring system and must be wholly consistent.
If this is not the case then the whole dataset, perhaps spanning several months, may
be effectively corrupted and therefore useless. In complex systems handling many
inputs, either continuously or on a sampled basis, it is usual to have the processing
system remote from the plant. In such cases some degree of local data conversion
may be advisable. For example the signals taken from a group of machines in adja-
cent locations may be routed to a nearby collection point that digitises the incoming
signals and identifies them for onward transmission to the central system. In noisy
environments it may even be desirable to digitise signals at the collection point, and
then forward them to a gathering point.
Figure 4.27 illustrates a preferred structure for a fully automatic system. The
basic data acquisition system shown earlier is broken down into three concatenated
functions: (1) multiplexing; (2) sampling and holding; and (3) analogue-to-digital
conversion. An analogue multiplexer directs different signal channels for down-
stream processing and allows the channel identity to be passed through. The useof a multiplexer is essential if a large number of channels are to be monitored, and
can be appropriate even for small numbers of channels because it allows the use of
a single high-quality analogue-to-digital conversion, rather than recourse to many
Plant1
Plant2
PlantN
Signalcond.
Local Short distance Long distance
Diagnostics
Processing
Processingand
diagnostics
Signalcond.
Analog.multi-plexer
Sample andhold
ADC
Transductions Data acquisition
Signal
cond.
Fi gure 4.27 General arr angement of data acquisiti on

8/20/2019 Condition Monitoring Knjiga
http://slidepdf.com/reader/full/condition-monitoring-knjiga 128/306
Instrumentation requirements 105
lower-grade devices. Commercial multiplexers can now accommodate many chan-
nels. An analogue-to-digital converter turns an analogue voltage signal into a digital
number that can be recognised by the computer according a defined comparison
scheme or scaling factor. During conversion time, the input analogue signal is sam-
pled and the sample is held constant. Resolution of the analogue-to-digital converter,
which affects the sensitivity of the condition-monitoring system, depends on the
number of bits. Since condition monitoring aims to capture weak signals at early
stages of impeding faults, high sensitivity is desirable. A 12-bit analogue-to-digital
converter has a resolution of 1 in 4 096 and typically completes conversion in less
than 0.01 µs. The switching rate of the multiplexer can therefore be in the range of
10 MHz, adequately high to avoid any significant time lag between the multiplexed
channels.
General-purpose data acquisition units, designed in line with the generic structure
described earlier, are now commercially available and have naturally been used for
condition-monitoring purposes. For example Figure 4.28 shows an 8-channel, 14-bit
data acquisition board that can interface with a standard PC and operate in a specific
software environment. This is a suitable choice provided that the use of a dedicated PC
can be arranged. Other options such as LabVIEW are also available, which normally
provide output channels to implement some simple control actions.
F igure 4.28 A commercial data acquisition device to interface to a PC [ Source: Adept]
In data acquisition, it is important to determine how often the signal is sampled
and how many samples are kept for further processing. This is an area where mistakescan be easily made and we will examine this issue in the next chapter after some signal
processing techniques have been explained. Here we just mention that the Shannon
sampling theorem must be observed. The theorem states that the sampled data can be
used to faithfully reproduce a time-varying signal provided that the sampling rate is at

8/20/2019 Condition Monitoring Knjiga
http://slidepdf.com/reader/full/condition-monitoring-knjiga 129/306
106 Conditi on monitor ing of rotati ng el ectri cal machines
least twice the highest frequency present in the signal. This minimum sampling rate is
called Nyquist frequency. Given a sampling rate, the total number of samples kept for
signal processing implies the duration during that the signal is sampled. This duration
determines the frequency resolution that a spectrum analysis performed on the data
can give. For example, if a signal is sampled for 1 s, the frequency resolution is 1 Hz.
4.9 C onclusion
This chapter has shown the wide range of instrumentation and data acquisition tech-
niques now available to monitor electrical machines. Modern techniques and methods
have been shown and in the following chapter we show how the signals from these
sensors can be processed to provide condition-monitoring information.
4.10 R eferences
1. Morris A.S. M easurement & Instrumentation Pr inci ples . Oxford: Butterworth-
Heinemann; 2001.
2. Horowitz P. and Hill W. The Art of Electronics . Cambridge: Cambridge
University Press; 1989.
3. Boiarski A.A., Pilate, G., Fink T. and Nilsson N. Temperature measurements in
power plant equipment using distributed fiber-optic sensing. IE EE Transactions
on Power Delivery 1995; PD-10: 1771–78.4. Miyazaki A., Takinami N., Kobayashi S., Nishima H. and Nakura Y. Long-
distance 275 kV GIL monitoring system using fiber-optic technology. IEEE Transactions on Power D eli ver y 2003; PD-18: 1545–53.
5. Rogers A.J. Distributed optical-fibre sensors. Journal of Physics D: Applied Physics 1986; 19: 2237–66.
6. Kher S., Gurram S., Saxena M.K.and Nathan T.P.S. Development of dis-
tributed fibre optic sensor with sub-metre resolution. Current Science 2004;
86: 1202–204.
7. Nandi S., Toliyat H.A. and Xiaodong L. Condition monitoring and fault diagnosisof electrical motors – a review. IE EE Transactions on Energy Conver sion 2005;
EC-20: 719–29.
8. Iwaki, H., Yamakawa H. and Mita A. FBG-based displacement and strain sen-
sors for health monitoring of smart structures. Presented at the 5th International
Conference on Motion and Vibration Control, Sydney, Australia; 2000.
9. Bruel & Kjaer. M achine Health Vibr ation . Naerum: Bruel & Kjaer; 1984.
10. Bogart Jr T.F., Beasley J.S. and Rico G. Electronic Devices and Circuits . New
Jersey: Pearson Educational; 2004.
11. Sihler C. and Miri A.M. A stabilizer for oscillating torques in synchronousmachines. IEE E Transactions on I ndustr y Appli cations 2005; 41: 748–55.
12. Beihoff B. A survey of torque transduction methodologies for industrial appli-
cations. Presented at the IEEE Pulp and Paper Industry Technical Conference,
Birmingham, AL; 1999.
8/20/2019 Condition Monitoring Knjiga
http://slidepdf.com/reader/full/condition-monitoring-knjiga 130/306
Instrumentation requirements 107
13. Gao G., Steinhauser M., Kavanaugh R. and Chen W. Using fiber-optic sensors
to measure strain in motor stator end windings during operation. Presented at the
Electrical Insulation Conference and Electrical Manufacturing & Coil Winding
Conference, Cincinnati; 1999.
14. Garside R. I ntri nsicall y Safe Instrumentation Safety Technology . London:
Feltham; 1982.
15. Xiao C., Zhao L., Asada T., Odendaal W.G. and van Wyk J.D. An overview
of integratable current sensor technologies. Proceedings of the 38th IEEE IAS Annual Meeting ; Salt Lake City, 12–16 Oct 2003; 2: pp. 1251–8.
16. Durocher D.B. and Feldmeier G.R. Predictive versus preventive maintenance.
IEEE Industry Applications Magazine 2004; September/October: 12–21.
17. Whittington H.W., Flynn B.W. and Mills G.H. (1992). An on-line wear debris
monitor. M easurement Science Technology 1992; 3: 656–61.
18. Williams T. EM C for Product D esigner s . Oxford: Newnes; 1996.

8/20/2019 Condition Monitoring Knjiga
http://slidepdf.com/reader/full/condition-monitoring-knjiga 131/306

8/20/2019 Condition Monitoring Knjiga
http://slidepdf.com/reader/full/condition-monitoring-knjiga 132/306
Chapter 5 Signal pr ocessing r equir ements
5.1 I ntroduction
Broadly speaking, the processing task is that part of the monitoring activity where
data, which has been collected and suitably formatted, is operated upon or other-
wise transformed so that a diagnosis of plant condition can readily be made. As we
have mentioned in the previous chapter, it is here that the most significant scope for
automation exists. Indeed, to perform many of the data processing functions now com-
monly used in condition monitoring, considerable computational power is required.
Processing may be done on- or off-line and this choice will predominantly depend
upon whether the monitoring system is one that operates on a continuous basis or
not. It also depends on the understanding regarding how quickly the monitored faults
can develop. Usually, condition monitoring in a continuously operating plant or those
where faults that can develop quickly, should allow the obtained data to be processed on-line. However the distinction cannot be clearly drawn. Modern data acquisition
units now permit data to be obtained from a running plant and analysed at a different
location without any significant time delay.
In the past, dedicated signal analysers were applied to analogue voltage signals
from the transduction process to obtain the spectra that could indicate the occurrence
and level of signal components at particular frequencies. Their use has now almost
been completely replaced by general computer algorithms acting on data acquired in
a digital format.
Although commercial computer software packages are available for digital sig-nal processing applications and can be used for condition monitoring of electrical
machines, it is important to fully appreciate the characteristics of the different algo-
rithms in order to avoid unreliable results being obtained, leading to misinterpretation
of the plant condition. Requirements of such algorithms and their limitations must be
clearly understood. For such a reason, this chapter describes in greater detail some
of the more important numerical techniques used for signal processing in condition
monitoring.
Perhaps the simplest form of signal processing is one in which the magnitude of
the raw incoming signal is examined on a regular basis, as a function of time. In factthis is essentially the basis of all visual inspection techniques or trend analysis, which
involves active collection of data by personnel. The processing in such cases may
consist of a comparison of the current record with the previous value or with some
preset or predetermined threshold. This process is simple to automate, even when
8/20/2019 Condition Monitoring Knjiga
http://slidepdf.com/reader/full/condition-monitoring-knjiga 133/306
110 Conditi on monitor ing of rotati ng el ectri cal machines
many hundreds of inputs are being monitored. The processor is simply required to
associate the incoming reading with a particular item of plant. If the incoming data
is to be trended, to examine the lead up to an atypical event, then a data storage
medium is essential. Magnetic disk or optical storage is the commonest method.
Semiconductor memory may also be appropriate provided that it can be protected
against instrument power failure with the use of a battery back-up system. It is easy,
when monitoring many inputs, to accumulate exceedingly large volumes of data, so
it is desirable to automatically refresh the data storage so that after a given period of
time the data storage elements either transfer their contents to a bulk storage media,
or are overwritten by the incoming data stream. When a plant malfunction is detected,
a common practice is to annunciate the event and discontinue data storage on that
channel. In this way the diary of events leading up to the malfunction is preserved
for subsequent examination if required.
The earlier example of magnitude detection implies that the plant condition infor-
mation is seeded in the change of signals obtained from the plant. Indeed, the variation
of signals usually tells us the change of condition. Variation of a signal in the time
domain can be more saliently expressed as components in the frequency domain.
Therefore spectral analysis is naturally a very common technique of signal pro-
cessing used in condition monitoring. Spectral analysis is effective when applied
to steady-state periodic signals, which is usually the case with monitoring machine
faults that gradually develop. In recent years, higher-order spectral analysis has been
used to make use of phase information and improve the signal-to-noise ratio. We will
describe first- and higher-order spectral analysis techniques in this chapter. Sometimesa condition-monitoring technique may also be applied to transient and non-stationary
signals. Wavelet transform techniques that have more recently been developed will
then be described for this objective. Furthermore, correlation analysis, which is a
powerful tool in revealing the buried relationships between signals and hence iden-
tifying the causes and consequences of fault, will also be described, together with
some other basic signal processing techniques that are frequently used in condition
monitoring.
5.2 Spectr al analysis
Spectral analysis is the name given to describe methods that transform time signals
into the frequency domain. The spectral representation of a time signal is therefore
a collection of components in the frequency domain, each with a specific frequency,
amplitude and phase angle. The transformation is achieved using the techniques of
Fourier analysis whereby any periodic signal, g , of period T , has
g (t )
= g (t
+ T ) (5.1)
This can be represented by equally spaced frequency components G (f ):
G (f k ) =1
T
T /2
−T /2
g (t )e − j 2π f k t dt , k = 0, ±1, ±2 (5.2)
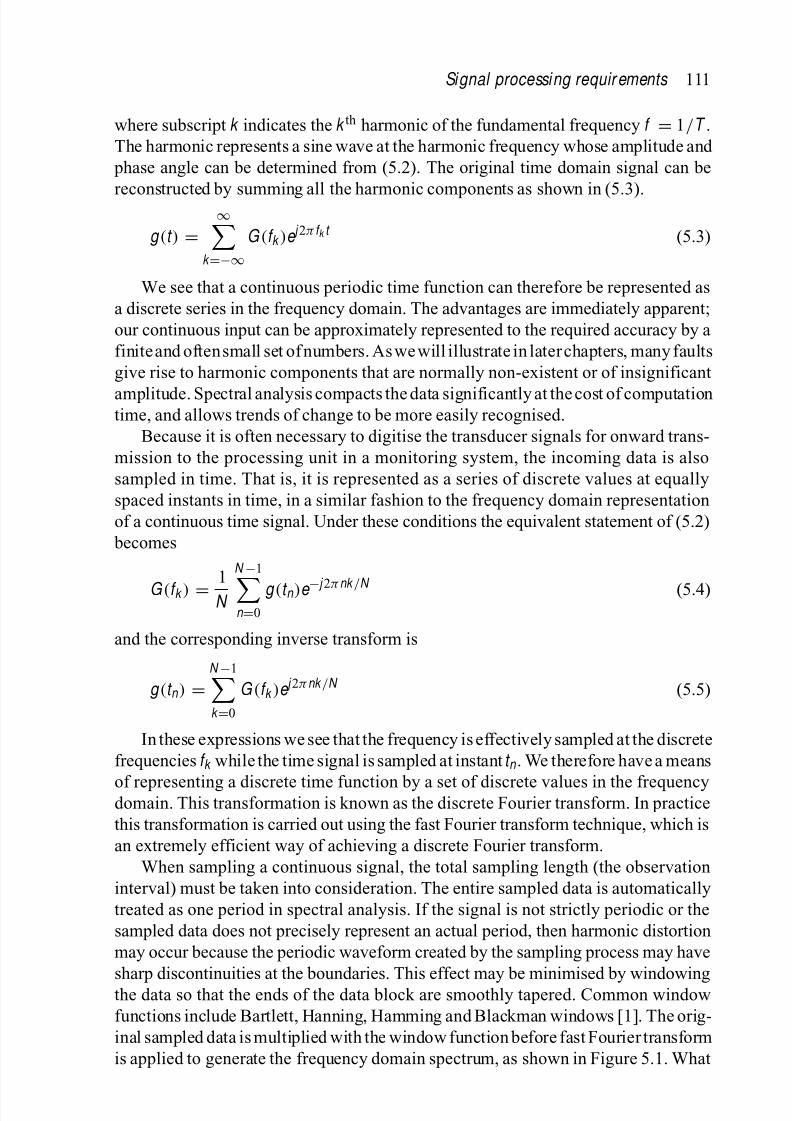
8/20/2019 Condition Monitoring Knjiga
http://slidepdf.com/reader/full/condition-monitoring-knjiga 134/306
Signal processing requir ements 111
where subscript k indicates the k th harmonic of the fundamental frequency f = 1/T .The harmonic represents a sine wave at the harmonic frequency whose amplitude and
phase angle can be determined from (5.2). The original time domain signal can be
reconstructed by summing all the harmonic components as shown in (5.3).
g (t ) =∞
k =−∞G (f k )e j 2π f k t (5.3)
We see that a continuous periodic time function can therefore be represented as
a discrete series in the frequency domain. The advantages are immediately apparent;
our continuous input can be approximately represented to the required accuracy by a
finite and oftensmall set of numbers. As we will illustrate in later chapters, many faults
give rise to harmonic components that are normally non-existent or of insignificant
amplitude. Spectral analysis compacts the data significantly at the cost of computationtime, and allows trends of change to be more easily recognised.
Because it is often necessary to digitise the transducer signals for onward trans-
mission to the processing unit in a monitoring system, the incoming data is also
sampled in time. That is, it is represented as a series of discrete values at equally
spaced instants in time, in a similar fashion to the frequency domain representation
of a continuous time signal. Under these conditions the equivalent statement of (5.2)
becomes
G (f k ) =1
N
N −1n =0
g (t n )e − j 2πnk /N (5.4)
and the corresponding inverse transform is
g (t n ) =N −1k =0
G (f k )e j 2πnk /N (5.5)
In these expressions we see that the frequency is effectively sampled at the discrete
frequencies f k while the time signal is sampled at instant t n . We therefore have a means
of representing a discrete time function by a set of discrete values in the frequencydomain. This transformation is known as the discrete Fourier transform. In practice
this transformation is carried out using the fast Fourier transform technique, which is
an extremely efficient way of achieving a discrete Fourier transform.
When sampling a continuous signal, the total sampling length (the observation
interval) must be taken into consideration. The entire sampled data is automatically
treated as one period in spectral analysis. If the signal is not strictly periodic or the
sampled data does not precisely represent an actual period, then harmonic distortion
may occur because the periodic waveform created by the sampling process may have
sharp discontinuities at the boundaries. This effect may be minimised by windowingthe data so that the ends of the data block are smoothly tapered. Common window
functions include Bartlett, Hanning, Hamming and Blackman windows [1]. The orig-
inal sampled data is multiplied with the window function before fast Fourier transform
is applied to generate the frequency domain spectrum, as shown in Figure 5.1. What

8/20/2019 Condition Monitoring Knjiga
http://slidepdf.com/reader/full/condition-monitoring-knjiga 135/306
112 Conditi on monitor ing of rotati ng el ectri cal machines
0 200 400 600 800 10000
2
4
6
W i n d o w e d s i g n a l
Sample (n )
0 200 400 600 800 10000
2
4
6
S i g n a l
0 200 400 600 800 10000
0.5
1
H a m m i n g w i n d o w
Sample (n )
Fi gure 5.1 Il lustration of window function
we obtain is not a true spectral representation of the original time domain signal, but
the effect of boundary discontinuities is attenuated. A way to view the windowing
technique is that the finite sampling process itself has already windowed the true
waveform with a rectangular window. Applying an additional window will give a
more desirable result that minimises frequency domain distortion.
Another way often used in practice is to increase the length of the sampled data
block, by increasing the observation interval. This lowers the fundamental frequency
assumed in the spectral analysis. For a given sampling rate, the observation intervalis proportional to the number of samples taken for the fast Fourier transform. With
increased observation interval, the harmonic distortion due to the discontinuity at
boundaries tends to concentrate in the low-frequency range; their contribution in the
high-frequency range is reduced. It must be understood that the finite observation
interval always results in a fundamental limit on the frequency resolution. Length-
ening the observation interval increases the frequency resolution in the resultant
spectrum.
Since fast Fourier transform only provides components at discrete harmonic fre-
quencies, which are integer multiples of the fundamental frequency, there is alwaysthe risk that the target component for condition monitoring is at a frequency that
is between two integer harmonic frequencies. This means that not all frequencies
can be seen by the fast Fourier transform, due to the so-called ‘picket fence’ effect,
disregarding the length of the observation interval. In such a case, the energy of the
components unseen by the fast Fourier transform slips through the picket fence and
leaks into the harmonics that are seen by the fast Fourier transform. Several algo-
rithms, including polynomial estimations, have been developed to detect the target
component from the harmonics that have been identified by fast Fourier transform.
For example Figure 5.2 shows how the energy of harmonics of unity amplitude of a machine current signal at 59.83, 59.85 or 59.87 Hz could leak to components at
59.6, 59.7, 59.8, 59.9, 60 and 60.1 Hz that are at the fast Fourier transform output
frequencies, and this depends on the sampling scheme used. Details of the algorithms
to estimate the components at intermediate frequencies, as a reverse process of what

8/20/2019 Condition Monitoring Knjiga
http://slidepdf.com/reader/full/condition-monitoring-knjiga 136/306
Signal processing requir ements 113
59.6 59.7 59.8 59.9 60 60.10
0.2
0.4
0.6
0.8
11
Frequency, Hz
C o n t r i b u t i o n t o F F T c o m p o n e n t s , p . u .
59.80
59.83
59.85
59.8759.90
F igure 5.2 Il lustrati on of picket fence leakage
is shown here, can be found in Reference 2. In condition monitoring of rotating elec-
trical machines, the target frequency component in a signal is usually dependent onthe speed of the machine that may vary continuously depending on the load condition.
As a result, the target frequency is unlikely to be a multiple integer of the fundamental
frequency determined by the length of the observation interval.
A final point that we would like to highlight here is the risk of aliasing that
can occur in the spectral analysis. More and more electrical machines nowadays are
connected to power electronic converters, which generate harmonics. High-frequency
harmonics exist in both machine current and vibration signals that may be used for
condition monitoring. Figure 5.3 illustrates the cause of aliasing. Suppose the original
continuous time signal has a spectrum shown in Figure 5.3(a). The sampled discretetime data then will have a spectrum shown in Figure 5.3(b) where the original spectrum
is duplicated according to integer multiples of the sampling frequency [3]. If the
f f
|G (f )| |G (f )|aliased
aliased
−f sampling0 0
(a) (b)
f sampling
F igure 5.3 Occurr ence of ali asing. (a) Tr ue spectrum. (b) Ali ased spectrum.

8/20/2019 Condition Monitoring Knjiga
http://slidepdf.com/reader/full/condition-monitoring-knjiga 137/306
114 Conditi on monitor ing of rotati ng el ectri cal machines
sampling frequency is lower than the Nyquist frequency that is twice of the highest
frequency in the signal, as shown in Figure 5.3, then aliasing occurs. In this case,
some harmonic components in the spectrum obtained by performing fast Fourier
transform on the sampled signal are due to aliasing or sampling effects rather than
real components of the original continuous time signal.
Consider an example. Figure 5.4(a) shows the stator current of an inductor motor
fed by a PWM (pulse-width modulation) voltage source inverter with a symmetrical
PWM switching frequency of f sw = 2.5 kHz. The current is then sampled, also at
a rate of 2.5 kHz, and the result is shown in Figure 5.4(b). The sampling rate may
be considered natural because it coincides with the internal clock of the controller
that generates the PWM pulses. Suppose that the output fundamental frequency of
the inverter is f o = 10 Hz. The actual current then contains a fundamental component
and harmonics at f sw
± 2kf o where k
= 1,2,3 . . ., giving harmonics at 2 480 Hz,
and 2 520 Hz, due to the modulation process in the inverter [4]. A section of the
0.92 0.94 0.96 0.98 1−40
−30
−20
−10
0
10
20
30
40
Time, s
M o t o r c u r r e n t , A
0.9 0.92 0.94 0.96 0.98 1−40
−30
−20
−10
0
10
20
30
40
Time, s
M o t o r c u r r e n t , A
(a) (b)
Fi gure 5.4 Inver ter fed motor current. (a) Inver ter fed motor current. (b) Sampled motor current.
(a) (b)
0 10 20 30 40 50
−60
−50
−40
−30
−20
−10
0 0
10
20
30
40
M o t o r c u r r e n t , d B / A
Frequency, Hz0 10 20 30 40 50
Frequency, Hz
−60
−50
−40
−30
−20
−10
10
20
30
40
M o t o r c u r r e n t , d B / A
Fi gure 5.5 Effect of sampli ng on inverter fed motor curr ent spectrum. (a) True spectrum of motor current. (b) Spectrum of sampled motor current.

8/20/2019 Condition Monitoring Knjiga
http://slidepdf.com/reader/full/condition-monitoring-knjiga 138/306
Signal processing requir ements 115
true spectrum is shown in Figure 5.5(a). The corresponding spectrum of the sampled
current in Figure 5.4(b) is shown in Figure 5.5(b). The 2 480 Hz and 2 520 Hz com-
ponents in the original spectrum, after being shifted downwards by 2.5 kHz, have
contributed to the 20 Hz component in the aliased spectrum that may be misinterpreted
in condition monitoring and therefore should be taken care of. The 40 Hz component
is caused by the same mechanism. The effect of sampling also depends on the instant
of a sample is taken in a PWM switching cycle [5].
If the sampling rate cannot be further increased, then a common practice is to
physically filter the signal and limit its frequency bandwidth before it is sampled.
This anti-aliasing filter can prevent unrealistic components being introduced to the
resultant spectrum. In general, the filter bandwidth and the sampling rate afterwards
should be determined after knowing the target frequencies that are to be extracted for
the purpose of condition monitoring.
5.3 H igh-or der spectr al analysis
High-order spectral analysis is a relatively new technique used for condition moni-
toring. The first-order spectral analysis as described in the previous section makes
little use of the phase information of the Fourier harmonic components. This can be
taken into account in higher-order spectral analysis and the signal-to-noise ratio can
be consequently improved [6].
For first-order harmonic components defined by (5.1), a second-order power spectral density at frequency f k can be defined as
P (f k ) = G (f k )G ∗(f k ) (5.6)
where G ∗(f k ) is the complex conjugate of G (f k ). Extending this definition to third-
and fourth-order measures gives birth to the bispectrum B (f 1, f 2) and trispectrum
T (f 1, f 2, f 3) as shown below.
B (f 1, f 2) = G (f 1)G (f 2)G ∗(f 1 + f 2) (5.7)
T (f 1, f 2, f 3) =
G (f 1)G (f 2)G (f 3)G ∗(f 1 +
f 2 +
f 3) (5.8)
From (5.7) and (5.8), we may see that, unlike the power spectral density P (f k ),
the bispectrum and trispectrum are functions of more than one frequency index and,
further, we may also see that they are complex quantities; that is, they contain both
magnitude and phase information about the original sampled time signal. In contrast,
P (f k ) contains only real values.
We can appreciate the value or potential of such high-order spectral analysis
by looking into what happens during some typical faults that cause electromagnetic
disturbances in the machine. For example, a broken rotor bar fault in an induction
motor will usually give rise to harmonics at two frequencies f 1 and f 2 in the airgapflux density, with phase angles φf 1 and φf 2 . A vibration signal is likely to be related
to the flux according to a quadratic function [7]. As a result, the vibration signal that
can be acquired through an accelerometer contains harmonics at frequencies f 1, f 2and f 1 + f 2 due to the quadratically non-linear relationship. Their phase angles will be

8/20/2019 Condition Monitoring Knjiga
http://slidepdf.com/reader/full/condition-monitoring-knjiga 139/306
116 Conditi on monitor ing of rotati ng el ectri cal machines
φf 1 , φf 2 and φf 1 + f 2 = φf 1 + φf 2 , showing a quadratic phase coupling that can be
easily indicated by a peak in the bispectrum of the vibration signal at the bifrequency,
B (f 1, f 2), where the associated biphase φ(f 1, f 2) tends to zero. Faults of other types
that cause flux components at different frequencies can be similarly detected provided
that the target frequencies are known. Higher-order spectral analysis can be used
when multiple faults exist in the machine so that more signature frequencies can
be identified with a high signal-to-noise ratio, by exploiting the property of phase
coupling. Examples of using high-order spectral analysis for condition monitoring of
induction machines are shown in Reference 6.
5.4 C or relation analysis
This is a time domain technique. Correlation between two signals, in the time domain,is a process mathematically very similar to that of convolution. The auto-correlation
function provides a measure of the similarity between a waveform and a time-shifted
version of itself, while the cross correlation function refers to two different time
functions.
The auto-correlation function of a time signal f (t ) can be written as
R ff (τ ) = ∞
−∞f (t − τ )f (t )dt (5.9)
The function f (t − τ ) is delayed version of f (t ), by a time τ . Essentiallythe process may be thought of as one signal searching through another to find
similarities.
If R ff (τ ) is plotted against τ , then the result is a correlogram. If the signal tends to
repeat, the correlogram plot will give a peak indication when τ is around the time that
it takes the signal to show some repetition. Therefore auto-correlation is a powerful
tool to identify the repeating features that can be hidden in a signal mixed with noises
and disturbances. Figure 5.6 illustrates the principle. The time signals are shown in
Figure 5.6(a) and 5.6(b), and the resulting correlogram in 5.6(c). It is apparent that
signals exhibiting a periodicity, which may be difficult to extract from a background of noise, can be identified using this technique.
The cross-correlation function of two different signals f (t ) and h (t ) may be
written as
R fh (τ ) = ∞
−∞f (t − τ )h (t )dt (5.10)
The similarity between correlation and convolution is now clearly seen. For example
the convolution of the two time functions f (t ) and h (t ) would be expressed as
g (t ) = ∞
−∞f (t − τ )h (τ )d τ (5.11)
The only difference is that one of the time functions is effectively reversed.

8/20/2019 Condition Monitoring Knjiga
http://slidepdf.com/reader/full/condition-monitoring-knjiga 140/306
Signal processing requir ements 117
h (t )
f (t– t )
(a)
(b)
(c)
t
t
t
R fg (t )
t
Fi gure 5.6 The use of correlation functions
Like the auto-correlation function, the cross-correlation function can also be used to recover both the amplitude and phase of signals lost in a noisy background. If two
signals are inherently related but are phase shifted due to transmission delay in the
system or modulated by physical processes in the system, cross-correlation function
can reveal the similarity between these signals, which are then confirmed to be due
to the same cause. Because of such a property, correlation functions are particularly
suitable to monitor faults like bearing degradation and partial discharge activity on
worn transformers, including their on-load tap changers, which have intermittent
effects during operation [8,9]. Correlation functions provide a means of relating the
condition-monitoring signatures to the causes of faults. Correlation functions can
also be used to exclude the effects of factors that may not have direct implication
on the plant condition, for example known variations of load or changes of ambient
temperature.
If we redefine (5.9) and (5.10) in a slightly different way, that is let the cross-
correlation function between two signals f (t ) and h (t ) be
R fh (τ ) = limT →∞
1
T
T
0
f (t − τ )h (t )dt (5.12)
it is easy to see how the correlation process can be realised in a numerical algorithm.Figure 5.7 illustrates the activity schematically; the time averaging operation required
will be described in the next section.

8/20/2019 Condition Monitoring Knjiga
http://slidepdf.com/reader/full/condition-monitoring-knjiga 141/306
118 Conditi on monitor ing of rotati ng el ectri cal machines
f (t )
h (t )
f (t – t )
Time delay t
MultiplierTime
averagingCorrelogram
R fh
(t )
Fi gure 5.7 Implementing the measurement of corr elograms
5.5 Signal pr ocessing for vibrat ion
5.5.1 General
Vibration monitoring requires a number of specialised techniques and two shall be
briefly mentioned here. Although they are beginning to establish themselves as pow-
erful diagnostic tools, their acceptance (and subsequently their application) is at the
moment limited primarily to the diagnosis of faults in gearboxes.
5.5.2 Cepstrum analysis
Mathematically the cepstrum, C (τ ), of a time function is described as the inverse
Fourier transform of the logarithm of the power spectrum of the function; that is, if
we define the power spectrum, P g (f ), of a time function g (t ) as
P g (f ) = F g (t )2 (5.13)
then the corresponding cepstrum is:
C (τ )
= F −1
loge P g (f )
(5.14)
where F and F −1 represent the forward and inverse Fourier transforms described in
Section 5.2. Therefore P g (f ) is the power spectrum of the time signal g (t ), which
is also defined in (5.6). The dimension of the parameter τ in (5.14) is time and is
introduced by the inverse Fourier transform; hence we can display the magnitude
of the cepstrum with respect to time intervals in the same way as the spectrum can
be illustrated with respect to frequency. The logarithm is employed so that the har-
monic components in P g (f ) that have relatively low amplitudes are also taken into
account; their existence is highlighted. The inverse Fourier transform in (5.14) tries
to reconstruct the time signal but only highlights the time instants when considerableactivities are occurring. From this, the repetition of the activities can be identified,
which is demonstrated next [10].
The use of the cepstrum has found favour in examining the behaviour of gearboxes
because such items of equipment tend to produce many families of side bands in their

8/20/2019 Condition Monitoring Knjiga
http://slidepdf.com/reader/full/condition-monitoring-knjiga 142/306
Signal processing requir ements 119
vibration spectra, due to the variety of meshing frequencies and shaft speeds that may
be present. Figure 5.8(a) shows the power spectrum of a gearbox vibration signal,
containing harmonic side bands that are spaced according to a pattern. We hope
to identify such a pattern in order to derive information about the condition of the
gearbox and the cause of fault, if present. Figure 5.8(b) shows the cepstrum calculated
from the power spectrum using (5.14). The horizontal axis here is practically time
and the spikes correspond to the instants when significant activities are present in the
original time signal. It is clear that the activities repeat predominantly according to
two time periods, marked as A and B respectively in Figure 5.8(b). By measuring the
periods (8.083 ms and 19.6 ms), we know that the fundamental repetition frequencies
are 123.75 Hz and 51 Hz. We can then further infer that the power spectrum of
100m
50m
10m
5m
1m
500u
100u
50u
10u
5.0
B
B
B
B
A
A
A A
AA
A
A A A
4.5
4.0
3.5
3.0
2.5
2.0
1.5
1.0
0.5
0
0 20m 40m 60m 80m 100m 120m
0 0.5k 1.0k 1.5k 2.0k
Frequency, Hz
Time, s
(a)
(b)
2.5k 3.0k
B
Fi gure 5.8 Vibration spectra and associated cepstra. (a) Power spectrum of a vibr ation signal. (b) C epstr um of the gearbox vibr ation signal.

8/20/2019 Condition Monitoring Knjiga
http://slidepdf.com/reader/full/condition-monitoring-knjiga 143/306
120 Conditi on monitor ing of rotati ng el ectri cal machines
0 0.5k 1.0k 1.5k 2.0k 2.5k 3.0k
100m
10m
1m
100,
10,
100m
10m
1m
100,
10,0 0.5k 1.0k 1.5k 2.0k
Frequency, Hz
(c)
2.5k 3.0k
Fi gure 5.8 Continued (c) Power spectrum of a vibrati on signal.
Figure 5.8(a) contains two sets of harmonic side bands that are separated by 123.75 Hz
and 51 Hz respectively, as illustrated in Figure 5.8(c).
So the cepstrum essentially highlights multiple periodicity in complicated sig-
nals, and hence identifies clearly various families of side bands. The identification
of various side bands in a rich signal may be practically impossible using spectral
analysis, but as Figure 5.8 shows the cepstrum easily picks them out.
We note in passing that although the horizontal scales of the cepstrum are in
seconds it is usual practice to refer to the horizontal quantity as ‘frequency’, the
peaks in the cepstrum as the ‘harmonics’ and the process is known as ‘filtering’.
This is done to firmly identify the methodology with that of spectral analysis. If this
technique can identify side bands with ease, then it may hold significant possibilities
for the identification of faults in induction machines, particularly when they are fed from harmonic rich inverters. To the best of the authors’ knowledge no work on this
application has yet been reported but it may yet prove to be a fruitful path to follow. Its
disadvantages lie with the complexity of the technique. It is a post-spectral analysis
tool, in much the same way as spectral analysis is generally employed once one’s
suspicions are aroused by anomalies in time domain signals taken using overall level
monitoring.
5.5.3 Time aver aging and trend analysis
In Figure 5.7, the need for signal averaging is noted during the practical computation
of correlation functions. The averaging technique has found considerable favour in
its own right for the detection of faults in gearboxes and rolling element bearings.
It achieves this by simply averaging a large number of samples, taken successively

8/20/2019 Condition Monitoring Knjiga
http://slidepdf.com/reader/full/condition-monitoring-knjiga 144/306
Signal processing requir ements 121
from the same transducer or an upper stream numerical process, with each sample
carefully timed to the same period. With rotating plant the rotational period of the
element under inspection is usually chosen. In this way noise generated elsewhere
in the system is effectively smoothed out, and the signals due to faults that exhibit a
cyclic pattern over the chosen period, enhanced.
Averaging can be implemented using one of the many transient signal capture
techniques. For example if it is necessary to take the average of 1 000 records, say,
then each record must be captured and then stored for a simple average to be obtained
on a point-by-point basis. This is an inefficient technique since it requires a large
amount of digital storage. It is possible to reduce this requirement significantly by
approximation and defining the average of a sampled quantity, x n , as
¯x n
= ¯x n
−1
+x n − x n −1
n
(5.15)
where n is the record number, x n is the value for the n th record, and x n and x n −1
are the average values up to the n th and (n − 1)th records respectively. Using this
technique it can be seen that only two records need to be stored at any given time,
yet the truly moving average is still calculable. The corresponding saving of digital
memory is obvious, but it has been gained at the expense of requiring more rapid
processing hardware, particularly if the period of each record is short. This problem
is not always significant, particularly as fast processors are becoming more easily
available in embedded systems. Time averaging is seldom applied to a signal that
changes very quickly with time. For example, it should not be used for time domainvoltage and current signals. Time averaging is usually applied to a signal that indicates
the level of a signature in the frequency domain, for example the rms value of the
voltage or current. Time averaging helps to avoid the effect of random background
noise in the signal. It is nearly always possible to choose records with suitable gaps
between them. It is however of paramount importance to ensure that each record is
properly synchronised. In addition to time averaging that filters out the random noise
in the measurement, it is often necessary to perform some trend analysis to capture
the change of a condition-monitoring signature in a relatively long period of time.
Auto-regression models in time series analysis [11,12] can be applied for the purposeon monitoring developing fault.
The usefulness for time averaging techniques in monitoring electrical machines
is somewhat limited although it is effectively the technique described by Tavner et al .[13] for detecting rotor cage faults by speed variation. It may also prove helpful for
drive systems where the effect of a gearbox, excluding the input shaft and bearings,
can be removed using this technique.
5.6 W avelet analysis
We do not attempt to present even an overview of the rich subject of wavelet transform;
interested readers are referred to Flordin [14] for example. But there is increasing
interest in developing condition-monitoring techniques based on signal processing

8/20/2019 Condition Monitoring Knjiga
http://slidepdf.com/reader/full/condition-monitoring-knjiga 145/306
122 Conditi on monitor ing of rotati ng el ectri cal machines
methods using wavelet transform. This is primarily because of the limitations of
conventional spectral analysis based on Fourier series. For example, spectral analysis
assumes that a signal is periodic and the harmonic components are obtained as average
over the entire observation interval; there is no information about local variation of
a signal at certain frequency during a particular short period of time. Faults of an
intermittent nature, such as mechanical faults on the drive train of an electric machine
system, cause intermittent, non-stationary, oscillatory signals (e.g. see Reference 15).
If the oscillatory signature lasts for only a relatively short period each time it occurs, it
may be easily masked if spectral analysis is applied over a long observation interval.
Also, capturing such a signature may require a high sampling rate that may not be
acceptable to sample the signal for a long period of time; a flexible sampling scheme
is desirable. For the reasons to be shown next, wavelet transform is more suitable in
such a case. It can employ a long window and low sampling rate for a low-frequency
component in the signal, and at the same time a short window and high sampling
rate for a high-frequency component. Furthermore, wavelet transform exhibits time-
frequency localisation, which gives a more precise description of the signal, providing
more informative data for condition monitoring.
It is true that condition monitoring is usually applied to steady-state signals, even
if the signature carried by the signals is of an intermittent nature. However, it has been
realised that sometimes the target signature can be too difficult to separate from the
dominant fundamental signal. For example, a broken rotor bar fault in an induction
machine causes side band current components whose frequencies are only slightly
different from the fundamental frequency, the difference depending on the slip, whichis normally very small in the steady state. It has recently been suggested that a more
effective method is to detect the current signatures during start-up of the machine
when slip is large [16,17]. However, the transient current during start up is not a
stationary and periodic signal. Conventional spectral analysis would give erroneous
results in this case. Again, wavelet transform, due to its time–frequency localisation
property, can be a more suitable technique for extracting the signatures from the
transient current.
Fourier analysis uses sine waves of different amplitudes, frequencies and phase
angles to synthesise a periodic signal. Wavelet transform expands this concept byconsidering that a time domain signal, not necessarily periodic, can be reconstructed
using a series of small waveforms that can be transitioned in time and scaled in
amplitude. Such small waveforms, which are called wavelets, no longer need to
be periodic, like sine waves. As an example, for a time signal f (t ), and a chosen
basic mother wavelet function ψ(t ), the corresponding wavelet transform, W (a , b ),
is defined as:
W (a , b ) = 1√ a
∞
−∞
f (t )ψ∗
t − b
a
dt , a > 0, −∞ < b < ∞ (5.16)
where a is the scaling factor of time, b is the time-shifting parameter in the mother
wavelet function and ψ is defined below. The mother wavelet function is usually
chosen as an oscillatory waveform that decays in both directions from the centre of
the wavelet, as shown in Figure 5.9. So parameters a and b in (5.16) therefore scale the

8/20/2019 Condition Monitoring Knjiga
http://slidepdf.com/reader/full/condition-monitoring-knjiga 146/306
Signal processing requir ements 123
−4 −3 −2 −1 0 1 2 3 4−1
−0.8
−0.6
−0.4
−0.2
0
0.2
0.4
0.6
0.8
1
Time, s
Fi gure 5.9 A mother wavelet function
mother wavelet frequency and shift the centre of the mother wavelet respectively. For
a given instant t
= b , if the signal f (t ) contains significant oscillation at a frequency
coinciding with 1/a , then the integration shown in (5.16) will result in a significantoutput. Because the mother wavelet decays in both directions away from the centre
t = b , what happens to the signal f (t ) a long time before t = b or after t = b does
not matter. Therefore wavelet transform provides the local frequency information in
signal f (t ) around t = b . As parameter b is varied, the f (t ) is scanned through in
terms of time. As parameter a is changed, signatures at different frequencies in the
signal are revealed.
The decaying rate of the mother wavelet is usually selected to depend on the
scaling factor a . If a is small, so that the corresponding frequency is high, then
the decaying rate can be fast. If a is large, corresponding to a low frequency, then thedecaying rate is slow. In this way, wavelet transform exhibits the property of multiple
resolutions. The low-frequency information, which is present for a relatively long
period of time in the signal, and the high-frequency information, which exists for
a short period of time, can be obtained simultaneously. The most commonly used
mother wavelet function, whose waveform is partially (real part) shown in Figure 5.9,
is the Gaussian function:
ψ(t ) = e −t 2/2[cos(2π t ) + j sin(2π t )] (5.17)
It is obvious that wavelet transform as defined in (5.16) can be calculated numericallyin a way similar to that shown in Figure 5.7, further taking into account the complex
number nature of the mother wavelet function. It is, however, important to note that
wavelet transform may involve different sampling rates and different observation
lengths. It is therefore important to keep synchronisation in the sampling scheme. As

8/20/2019 Condition Monitoring Knjiga
http://slidepdf.com/reader/full/condition-monitoring-knjiga 147/306
124 Conditi on monitor ing of rotati ng el ectri cal machines
ψ(t ) is complex, from the output of wavelet transform W (a , b ) both amplitude and
phase information can be retrieved.
For the sake of completion, (5.18) gives the inverse wavelet transform where
C (ψ , v ) = ∞
0 [ψ
∗(v )ψ(v )/v
]dv :
f (t ) = 1
C
∞0
∞−∞
1
a 2√
a W (a , b )ψ(
t − b
a )db · da (5.18)
Figure 5.10(a) shows a measured starting current signal of an induction motor
taken from References [18] and [19]. It was found that transient torsional vibration
was excited during the direct on-line starting of the motor. The natural frequency of
the mechanical shaft was known to be 22 Hz. Research showed that the torsional
(a)
(b)
Fi gure 5.10 M onitoring the onset of torsional vibration duri ng the start up of a downhole motor pump set [Taken from Yacamini, Smith and Ran [18,19]]

8/20/2019 Condition Monitoring Knjiga
http://slidepdf.com/reader/full/condition-monitoring-knjiga 148/306
Signal processing requir ements 125
vibration could be indicated in the motor stator current as side band components at
28 Hz and 72 Hz assuming a supply frequency of 50 Hz. As the starting current was
transient and non-stationary, wavelet transform was applied to the current signal and
the result is shown in Figure 5.10(b). The development of the 28 Hz component is
clearly observed while the 72 Hz component is shadowed by the fundamental [18].
5.7 C onclusion
This chapter has described the signal processing methods now available for computer
monitoring electrical machines. The following five chapters will describe the major
temperature, chemical, mechanical and electrical techniques available for monitoring.
5.8 R eferences
1. Madisetti V.K. and Williams D.B. (eds.) The Digital Signal Processing Hand- book . Boca Raton: CRC Press; 1998. pp. 1-21–1-23.
2. Durocher D.B. and Feldmeier G.R. (2004). Predictive versus preventive main-
tenance. IEEE Industry Applications Magazine 2004; (September/October):
12–21.
3. Flankin G.F., Powell J.D. and Workman M. D i gital Control of D ynamic Systems .Menlo Park: Addison-Wesley Longman; 1998. pp. 160–66.
4. Mohan N., Undeland T.M. and Robbins W.P. Power El ectronics – C onver ter s,Appli cations and D esign . New York: John Wiley & Sons; 2003. pp. 225–30.
5. Jintakosonwit P., Fijita H. and Akagi H. Control and performance of a fully-
digital-controlled shunt active filter for installation on a power distribution
system. I EEE Tr ansactions on Power E lectronics 2002; PE-17: 132–40.
6. Arthur N. and Penman J. Induction machine condition monitoring with higher
order spectra. IEEE Transactions on Industri al Electronics 2000; IE-47:
1031–41.
7. Onadera S. and Yamasawa K. Electromagnetic vibration analysis of a squirrel-
cage induction motor. I EEE Transactions on M agneti sm 1993; M -29; 2410–12.8. Yazici B. Statistical pattern analysis of partial discharge measurements for qual-
ity assessment of insulation systems in high-voltage electrical machinery. IEEE Transactions on Industr y Appl icati ons 2004; I A-40: 1579–94.
9. Kang P. and Birtwhistle D. Condition monitoring of power transformer on-
load tap-changers, part 1: automatic condition diagnostics. IEE Proceedings Generation Transmission Distribution 2001; 148, 301–306.
10. Wismer N.J. Gearbox Analysis using Cepstrum Analysis and Comb Liftering .Bruel & Kjaer Application Note. Naerum: Bruel & Kjaer; 2002.
11. Morris, A.S. M easurement & I nstr umentation Pr inci ples . Oxford: Butterworth-Heinemann; 2001.
12. Stack J.R., Habetler T.G. and Harley R.G. Bearing fault detection via auto-
regressive stator current modeling. I EEE Transactions on Industry Applications 2004; I A-40: 740–47.

8/20/2019 Condition Monitoring Knjiga
http://slidepdf.com/reader/full/condition-monitoring-knjiga 149/306
126 Conditi on monitor ing of rotati ng el ectri cal machines
13. Tavner P.J., Gaydon B.G. and Ward D.M. Monitoring generators and large
motors. IEE Proceedings, Part B, Electric Power Appli cations 1986; 133:
169–80.
14. Flordin P. Time-Frequency Time Scale Analysis . New York: Academic Press;
1999.
15. Lin J. and Zuo M.J. Gearbox fault diagnosis using adaptive wavelet filter.
Mechanical Systems and Signal Processing 2003; 17: 1259–69.
16. Zhang Z., Ren Z. and Huang W. A novel detection method of motor broken rotor
bars based on wavelet ridge. IEEE Transactions on Energy Conversion 2003;
EC-18: 417–23.
17. Douglas H., Pillay P. and Ziarani A.K. A new algorithm for transient motor
current signature analysis using wavelets. I EEE Transactions on Industry Applications 2004; I A-40: 1361–8.
18. Yacamini R., Smith K.S. and Ran L. Monitoring torsional vibrations of elec-
tromechanical systems using stator currents. Journal of Vibr ation and Acousti cs 1998; 120; 72–9.
19. Ran, L., Yacamini R. and Smith K.S. Torsional vibrations in electrical induction
motor drives during start up. Journal of Vibration and Acoustics 1996; 118:
242–51.

8/20/2019 Condition Monitoring Knjiga
http://slidepdf.com/reader/full/condition-monitoring-knjiga 150/306
Chapter 6 Temper atur e monitor ing
6.1 I ntroduction
As has been described in Chapter 2, the limits to rating of electrical machines are
generally set by the maximum permissible temperature that the insulation can with-stand. Indeed the performance testing of machines, before they leave a manufacturer’s
works, is dominated by the measurement of winding or embedded temperatures and
the need to achieve temperature rises within the appropriate standards. The measure-
ment of temperature therefore has an important place in the monitoring of electrical
machines and the following describes how this can be done using the measurement
techniques described in Chapter 4.
There are three basic approaches to temperature monitoring.
1. To measure local temperatures at points in the machine using embedded
temperature detectors.
2. To use a thermal image, fed with suitable variables, to monitor the temperature
of what is perceived to be the hottest spot in the machine.
3. To measure distributed temperatures in the machine or the bulk temperatures of
coolant fluids.
These approaches demonstrate the fundamental difficulty of thermal monitoring,
which is resolving the conflict between point temperature measurements that are
easy to make, but give only local information, and bulk temperature measurements
that are more difficult and run the risk of overlooking local hot-spots.The following three sections show how these approaches can be applied
practically.
6.2 L ocal temperatur e measurement
This can be done using thermocouples, resistance temperature detectors or embedded
temperature detectors, whose characteristics are described in Chapter 4. To monitor
the active part of the machine they are usually embedded in the stator winding and in the stator core. They can also be located in the bearings to detect hot running. The
choice of location requires careful consideration during the specification stage of the
machine. For example temperature detectors embedded in the stator winding need to
be located close to its hottest part, which may be in the slot portion or end-winding

8/20/2019 Condition Monitoring Knjiga
http://slidepdf.com/reader/full/condition-monitoring-knjiga 151/306
128 Conditi on monitor ing of rotati ng el ectri cal machines
portion, depending on the thermal design of the machine. Alternatively, for a machine
with an asymmetrical cooling arrangement they should be located at the hottest end
of the machine. Some guidance as to where embedded temperature detectors should
be located is given by Chalmers [1] and this is summarised in Figure 6.1. It should be
T4
T2 T3 T3
T5
T1
T5
Coolant in
Coolant out
tator coretator coreStator core
T1
T2
T3T4
a) Embedded between conductors in the slot portion (T1)
Embedded in core pack laminations (T2)
Mounted on potentially hot components such as pressure plates (T3)
Embedded on conductors in the end winding portion (T4)
b) Water or air inlet to the heat exchanger (T1)
Water or air outlet from the heat exchanger (T2)
Re-entry air to the machine from the heat exchanger (T3)
Exhaust air from the machine to the heat exhanger (T4)
Bearing temperatures (T5)
c) Bearing temperature (T)
T
Fi gure 6.1 Location of temper ature detectors in electri cal machines

8/20/2019 Condition Monitoring Knjiga
http://slidepdf.com/reader/full/condition-monitoring-knjiga 152/306
Temperature monitoring 129
noted that when embedded temperature detectors are fitted in bearings, precautions
must be taken to ensure that the bearing insulation is not breached.
The weakness of these methods is that thermocouples and resistance temperature
detectors are metallic devices and cannot be located on the hottest active component,
the winding copper, because they need electrical isolation. On a winding the devices
have to be embedded in the insulation at some distance from the copper itself (see
Figure 6.2(a)). As a result, the measured temperature will not necessarily be that of
the winding itself but an image of it, as shown in Figure 6.2(b). The heat flow per
unit area, Q , through the insulation system can be described by simple conduction
equations as follows:
Q = h (T s − T g ) =k
t 2(T s − T t ) =
k
t 1(T c − T t ) (6.1)
where t is insulation thickness, T is temperature, k is the heat transfer coefficient
through an insulating material, and h is the heat transfer coefficient from the insulation
surface.
Eliminating T s between the first two expressions gives
T t = T g + Q
t 2
k +
1
h
, (6.2)
therefore
T t = T g + (T e − T t ) (t
2+ (k /h ))
t 1
(6.3)
and
T 1 =T g + T c
(t 2+(k /h ))
t 1
1+(t 2+(k /h ))
t 1
(6.4)
so
T 1 ≈ T c if T g T c and
(t 2 + (k /h ))
t 1 1; that is, if t 2 +k
h t 1 (6.5)
So the measured temperature T t will approach the temperature of the hottest
active component T c if the thickness of insulation, t 2, applied over the ETD is suf-
ficient compared to the main insulation. This problem does not occur for devices
embedded in the slot portion between two conductors, as shown in Figure 6.2(c),
where there is a low heat flux between the active copper parts. But it is an impor-
tant difficulty when monitoring end-winding temperatures, such that the thickness
of overtaped insulation, t 2, needs to be substantial if sensible readings are to be
obtained.It would be very desirable to develop a temperature-monitoring device that can
be affixed to a high-voltage winding and give electrical isolation. Such a device
was developed in the 1980s for power transformers, comprising a small phial of
liquid that had a high vapour pressure that varied widely with temperature. The phial

8/20/2019 Condition Monitoring Knjiga
http://slidepdf.com/reader/full/condition-monitoring-knjiga 153/306
130 Conditi on monitor ing of rotati ng el ectri cal machines
Embedded temperaturedetector
Maininsulation
Overinsulation
T 1 T 1
T
Tt
T c T s
Copperconductor
Heat flux Q
t1 t2
Tc
Tt
Ts
Tg
T e m p
Distance
Embeddedtemperaturedetector
Heat fluxQ 0
a)
b)
c)
Conductor bar
Coolinggas
T g
Fi gure 6.2 Effect of embedding a temperature detector away from an active part.(a) Asymmetrically embedded temperature dectector. (b) Temperature dectecti on f rom (a). (c) Symmetr i call y embedded temper ature detector.
8/20/2019 Condition Monitoring Knjiga
http://slidepdf.com/reader/full/condition-monitoring-knjiga 154/306
Temperature monitoring 131
was affixed to the high voltage winding whose temperature was required. The pres-
sure in the phial was then monitored through a non-conducting silicone rubber tube
and the temperature was derived electronically from the pressure measurement. The
device was applied, on a trial basis, to operational transformers where it performed
satisfactorily.
More widespread modern methods of measuring temperature in high-voltage
components have also been developed using fibre-optic techniques, as described
in Chapter 4 and shown in Figure 6.3. A particular design using the dependence of
the polarisation of light on the temperature of a material is described by Rogers [2,3].
Laser light
source
Back
scattering
Optic fibre
sensor
Computer
Coupler
Detector
Data
acquisition
F igure 6.3 Pr incipl e of fibre-optic temper ature sensing
Light from a laser is transmitted to the device and is passed through a polarising
prism before being launched into a fibre maintained at the temperature to be measured.
This material introduces a rotation of the light beam that is dependent on temperature.
The beam is reflected back through the fibre and polariser and is relaunched with a
light amplitude proportional to the polarisation that has taken place in the fibre. By
arranging two passes through the fibre the polarisation is rendered insensitive to
electrical or magnetic field effects.
The temperature measurements described so far have all been on stationary partsof the machine and on many machines the thermal design is stator-critical, so the
hottest spot will be located there. But many machines are rotor-critical, particularly
larger induction motors, because under stall conditions the rotor losses are very large,
and the temperatures can rise rapidly to values that could damage the rotor integrity.
On such machines there may well be no apparent deterioration after one or two stalls,
but should this occur repeatedly there will be a weakening of rotor bars and/or end
rings that may result in premature mechanical failure. In the past there have been
various crude methods of measuring rotor temperatures for experimental purposes,
using heat-sensitive papers or paints, or thermocouples connected through slip rings.Until recently, however, there has not been a method sufficiently reliable to use for
monitoring purposes. Siyambalapitiya et al . [4] have described a device for monitor-
ing eight thermocouples, multiplexing the signal on the rotor, then optically coupling
to the stator and decoding in a digital signal processor.

8/20/2019 Condition Monitoring Knjiga
http://slidepdf.com/reader/full/condition-monitoring-knjiga 155/306
132 Conditi on monitor ing of rotati ng el ectri cal machines
6.3 H ot-spot measurement and ther mal images
Local temperature measurements give the machine operators considerable confidence
that they knows the operating temperature of key points in the machine, but there is
always the nagging suspicion that temperature detectors may not be located at the
hottest point. This problem has long been recognised in power transformers where it
is extremely difficult to obtain even embedded winding temperatures, because of the
need for extra-high voltage isolation and the great thickness of electrical insulation
necessary, so thermal images of the hot spot temperature are used. The thermal image
consists of a dial-type thermometer with its bulb immersed in the region where the
transformer oil is hottest. A small heating coil, connected to the secondary of a
current transformer, serves to circulate around the bulb a current proportional to the
load current and is such that it increases the bulb temperature by an amount equal to
the greatest winding-to-coil temperature gradient. The indicator therefore registers
an approximation to the hot-spot temperature.
The thermal image technique has not received wide application on rotating elec-
trical machines, although it deserves to. The availability of a thermal image hot-spot
temperature of machine could be used for motor monitoring and protection purposes,
as proposed by Zocholl [5], Milanfar and Lang. [6] and Mellor et al . [7], who pro-
posed a technique for small, totally enclosed, forced-cooled induction motors where
a thermal model of the machine is configured in a digital signal processor that is
fed with signals proportional to the ambient air temperature and the stator winding
current. The model can calculate the predicted temperatures at a variety of key pointsin the machine. Stator core, stator winding slot, or stator end-winding representa-
tion must be programmed solely using the design information for the machine. The
instrument is designed to produce an analogue voltage that is proportional to several
temperatures at the hottest points.
Mellor et al . have used the device on two totally enclosed fan-cooled machines and
compared the predictions of the thermal image with the actual measured temperatures
in the stator end winding that was found to be the hottest point in this design of the
machine. Figure 6.4 shows the comparison of results for these two machines after
they had been put through very severe duty cycles and it can be seen that the resultsare extremely good. The device has been designed to be part of the thermal protection
of a motor but could equally well be used for monitoring a machine for operational
purposes, particularly, for example, on a crucial machine located in an inaccessible
position where hot-spot measurements may be difficult to obtain.
6.4 Bulk measurement
In the electrically active part of the machine, even when hot-spot locations are knownor hot-spot temperatures can be surmised from a thermal image, there is still a desire
to obtain a bulk indication of the thermal state of the machines. This can be found
from the measurement of the internal and external coolant temperature rises, obtained
from thermocouples located, for example, as shown in Figure 6.1. This is done on

8/20/2019 Condition Monitoring Knjiga
http://slidepdf.com/reader/full/condition-monitoring-knjiga 156/306
Temperature monitoring 133
T e m p e r a t u r e
, ° C
100
50
0
0 4591 82 73 6
C u r r e n t , A
20
10
0 4591 82 73 6
a)
0
Time, min
Rated current
b)
T e m p e r a t u r e ,
° C
100
50
0
0 4591 82 73 6
C u r r e n t , A
160
40
0 4591 82 73 6
c)
0
Time, min
Rated current
d)
80
120
Measured
Simulated
Fi gure 6.4 Compari son between measurements and the predictions of a ther-
mal image of an electrical machine. [Taken from Mellor et al. [7]] (a) Comparison for 5.5 kw induction motor. (b) Duty cycle for (a).(c) Comparison for 7.5 kw induction motor; Duty cycle for (c).

8/20/2019 Condition Monitoring Knjiga
http://slidepdf.com/reader/full/condition-monitoring-knjiga 157/306
134 Conditi on monitor ing of rotati ng el ectri cal machines
most larger machines but it is normal for coolant temperatures to be displayed and rare
for the point values to be subtracted to give the temperature rise directly. An increase
in temperature rise from such a device would clearly show when a machine is being
overloaded or if the coolant circuits are not performing as they should. However,
the method is insensitive to localised overheating in the electrically active parts of
the machines, therefore considerable effort has been devoted, as an alternative to the
thermal image, to devising methods whereby single indications of high temperature
can be obtained from a device that is embedded in the bulk of the machine.
Lengths of signal cable using heat-sensitive semiconducting material as the insu-
lation have been proposed but most effort has been devoted to the use of optical fibres.
Brandt and Gottlieb [8] have described various methods, including simple point mea-
surements on high-voltage components, using the optical fibre for isolation purposes.
They have also described how, using the temperature sensitive properties of fibre
optics, a continuously sensitive fibre could be embedded in the machine, adjacent to
the high-voltage copper, to detect localised overheating anywhere in the winding and
yet provide a single indication. The method proposed would utilise the black body
radiation in the optical fibre, alongside the hot-spot, being transmitted back to the
detector and being used to determine the hottest point along the fibre’s length. Such
a device would therefore need to be embedded in the machine during manufacture
and as yet a practicable instrumentation scheme has not been devised. An interesting
modern approach to monitoring temperature in a variable speed induction motor by
Chen et al . [9] is described briefly in a later chapter.
6.5 C onclusion
This chapter shows that temperature measurement can yield very valuable bulk
indications of the condition of an electrical machine using simple sensors and narrow-
bandwidth (<1 Hz), low-data-rate signals and, because temperature limits the rating
of a machine, over-temperature is a valuable condition-monitoring signal. Tem-
perature detection has repeatedly been shown to be an effective global monitoring
technique for electrical machines, but has been neglected as a monitoring method.
Temperature measurement is usually done in traditional and rather antiquated
ways, and there are some simple changes that could be made in existing practice to
make more sense of it. These changes are generally in the area of signal processing and
in particular the importance of presenting temperature rises to the operator, rather than
absolute temperature. There are also advances in the application of modern sensors,
which will allow temperature measurements to be made closer to the active parts of
a machine, and these should be exploited.
6.6 R eferences
1. Chalmers B.J. Electri cal M otor H andbook . 1st ed. London: Butterworths; 1988.
2. Rogers A.J. Optical temperature sensor for high voltage applications. Appli ed Optics 1982; 21: 882–85.

8/20/2019 Condition Monitoring Knjiga
http://slidepdf.com/reader/full/condition-monitoring-knjiga 158/306
Temperature monitoring 135
3. Rogers, A.J. Distributed optical-fibre sensing. M easurement Science & Technol- ogy 1999; 10: R75–R99.
4. Siyambalapitiya D.J.T., McLaren P.G. and Tavner P.J. Transient thermal char-
acteristics of induction machine rotor cage. IEEE Transactions on Energy Conversion 1988; EC-3: 849–54.
5. Zocholl S.E. Motor analysis and thermal protection. IEEE Transactions on Power D eli very 1990; PD-5: 1275–80.
6. Milanfar P. and Lang J.H. Monitoring the thermal condition of permanent-
magnet synchronous motors. I EEE Transactions on Aerospace and E lectronic Systems 1996; A ES-32: 1421–29.
7. Mellor P.H., Roberts D. and Turner D.R. Lumped parameter thermal model for
electrical machines of TEFC design. I EE Proceedings Part B, El ectri c Power Applications , 1991; 138: 205–218.
8. Brandt G.B. and Gottlieb M. Fiber-optic temperature sensors using optical fibers.
Abstracts of Papers – American Chemical Society 1982; 184: 64-ANYL.
9. Chen S.E., Zhong E. and Lipo T.A. A new approach to motor condition mon-
itoring in induction motor drives. I EE Tr ansactions on I ndustry Applications .1A-30(4): 905–911.

8/20/2019 Condition Monitoring Knjiga
http://slidepdf.com/reader/full/condition-monitoring-knjiga 159/306

8/20/2019 Condition Monitoring Knjiga
http://slidepdf.com/reader/full/condition-monitoring-knjiga 160/306
Chapter 7 C hemical m onitor ing
7.1 I ntroduction
The insulating materials used in electrical machines are complex organic materials,
which, when they are degraded by heat or electrical action, produce a very largenumber of chemical products in the gas, liquid and solid states. Lubrication oils also
carry not only the products of their own degradation but also those from the wear of
the bearings and seals they cool and lubricate. Techniques to provide early warning of
the deterioration of electrical machines should include measurement of these complex
degradation products where they can be accessed in the machine.
7.2 I nsulation degr adation
What are the mechanisms by which insulation can be degraded? Well, the table in the
Appendix shows how important excessive temperature and therefore thermal degra-
dation is as a failure mode and this is largely determined by the thermal performance
of the insulation. The insulation mainly consists of organic polymers, either natural
forms such as bitumen, or more commonly nowadays, synthetic epoxy resins. Chapter
2, Section 2.7.2 has described the majority of the failure modes associated with insu-
lation degradation. The thermal degradation of these materials is a complex process.
However, as the temperature of the insulation rises above its maximum permitted
operating value, c . 160
C, volatiles used as solvents in the insulation manufacturestart to be driven off as gases. Then the heavier compounds making up the resin may
reach their boiling point. The gases so produced are generally the heavier hydro-
carbons such as ethylene. As the temperature rises further, above 180 C, chemical
decomposition of the resin components starts. A supersaturated vapour of the heavier
hydrocarbon decomposition products then forms in the cooling gas close to the high
temperature area of insulation. Rapid condensation of that vapour occurs as the cool-
ing gas leaves the hot area producing condensation nuclei that continue to grow in size
by further condensation until they reach a stable droplet size. These droplets, usually
called particles, are of submicron size and form what would commonly be called smoke. The precise materials given off depend primarily on the insulation material
being heated but also on the cooling gas of the machine. The binder material of the
insulation, whether it be wood, paper, mica or glass fibre, can usually withstand much
higher temperatures, but eventually as 400 C is reached, they start to degrade and
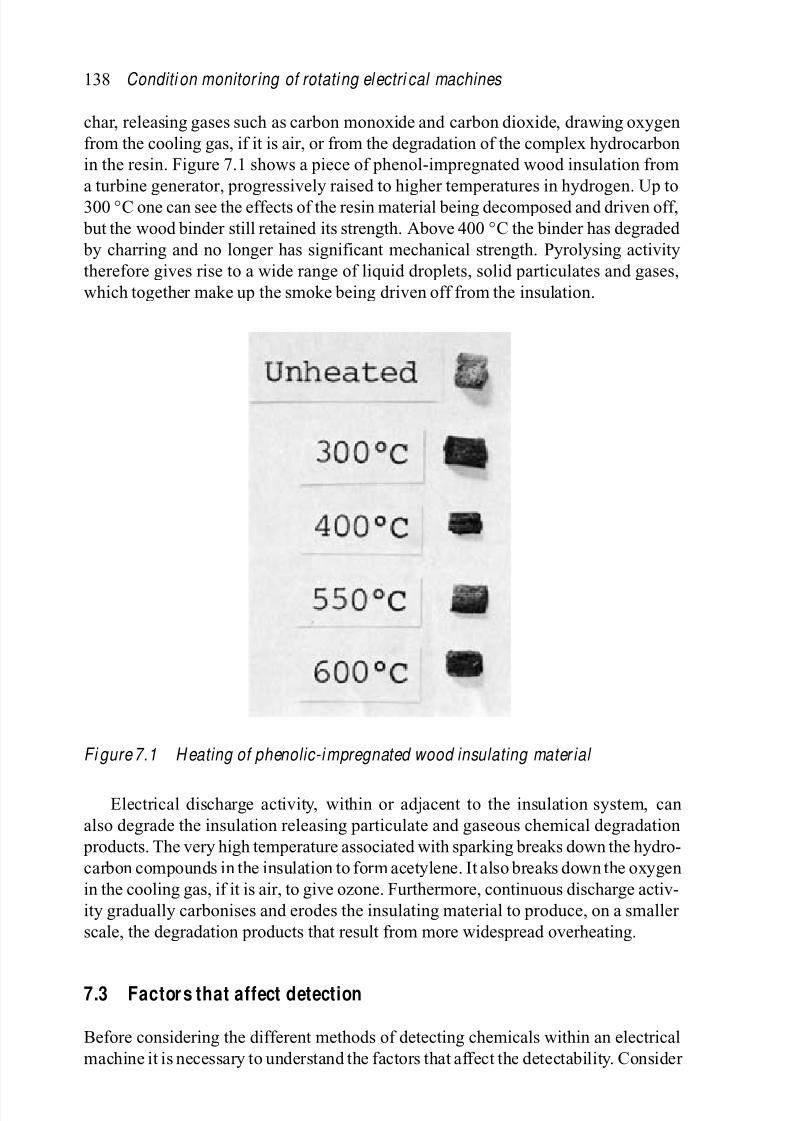
8/20/2019 Condition Monitoring Knjiga
http://slidepdf.com/reader/full/condition-monitoring-knjiga 161/306
138 Conditi on monitor ing of rotati ng el ectri cal machines
char, releasing gases such as carbon monoxide and carbon dioxide, drawing oxygen
from the cooling gas, if it is air, or from the degradation of the complex hydrocarbon
in the resin. Figure 7.1 shows a piece of phenol-impregnated wood insulation from
a turbine generator, progressively raised to higher temperatures in hydrogen. Up to
300 C one can see the effects of the resin material being decomposed and driven off,
but the wood binder still retained its strength. Above 400 C the binder has degraded
by charring and no longer has significant mechanical strength. Pyrolysing activity
therefore gives rise to a wide range of liquid droplets, solid particulates and gases,
which together make up the smoke being driven off from the insulation.
Fi gure 7.1 H eating of phenolic-i mpregnated wood insulating mater ial
Electrical discharge activity, within or adjacent to the insulation system, can
also degrade the insulation releasing particulate and gaseous chemical degradation
products. The very high temperature associated with sparking breaks down the hydro-
carbon compounds in the insulation to form acetylene. It also breaks down the oxygen
in the cooling gas, if it is air, to give ozone. Furthermore, continuous discharge activ-
ity gradually carbonises and erodes the insulating material to produce, on a smaller
scale, the degradation products that result from more widespread overheating.
7.3 Factor s that affect detection
Before considering the different methods of detecting chemicals within an electrical
machine it is necessary to understand the factors that affect the detectability. Consider

8/20/2019 Condition Monitoring Knjiga
http://slidepdf.com/reader/full/condition-monitoring-knjiga 162/306
Chemical monitoring 139
Figure 7.2(a), which shows the machine within its enclosure, the rate of change of
concentration of a detectable substance can be determined by the following equation:
Rate of change of concentration of a detectable substance in the cooling circuit
of a machine = (specific production rate of detectable substance - leakagerate from machine)/machine volume
dC
dt =
ν −
VC τ r
V
(7.1)
where V is the machine volume, C is the volumetric concentration of the substance
concerned, τ r is a leakage factor and ν is the volumetric rate of production of the
detectable substance.
When leakage is low, τ r is effectively a residence time constant for the substance in
the machine enclosure. The rate of production, ν , is related to the volume of material
being overheated and its chemical composition. This variable is in fact a function of
time v (t ). So the equation could be rewritten:
dC
dt +
C
τ r =
ν(t )
V (7.2)
D +1
τ r
C =
ν(t )
V (7.3)
The complementary function for this equation is
C = A exp
−
t
τ r
(7.4)
The particular integral is
C =(ν − νb )τ r
V (7.5)
where ν(t ) = ν + νb , ν is a step increase in the volumetric rate of production and νb
is the background rate of production of the substance.
When t = 0, C = C b (the background concentration), then
C b =νb τ r
V and A =
ντ r
V (7.6)
∴ C =ντ r
V
1 − exp
t
τ r
+
νb τ r
V (7.7)
By studying (7.7) it is possible to determine how the detectable concentration
depends upon the design of the machine, the nature of the overheating it is suffering
from and the concentration of material involved. Figure 7.2(b) will help to explainthis. A machine with a tightly sealed and pressurised cooling system, such as a
turbine generator, will have a long residence time (τ r ) of many hours, the background
concentration level of the detectable substance (C b ) will be high. On the other hand
the concentration level, which can be reached after an extended period of overheating,

8/20/2019 Condition Monitoring Knjiga
http://slidepdf.com/reader/full/condition-monitoring-knjiga 163/306
140 Conditi on monitor ing of rotati ng el ectri cal machines
will also be correspondingly high. But if the length of the overheating incident (τ o )
is short compared to the residence time, say a few minutes, then the concentration
will not build up to a significant level compared to the background. A machine with
an open cooling circuit will have a short residence time (τ r
) of perhaps merely a
few seconds. So the background concentration will be low and there will need to be
a large volumetric production (V ) from an overheating incident to produce a large
increase in concentration (C ), but the concentration level will respond rapidly to any
overheating.
Detectability of overheating depends upon:
1. a large signal-to-noise ratio; that is, the magnitude of the indication, (X in Figure
7.2(b)), must be large compared to the background, C b ;
2. a long duration of indication.
The larger the signal-to-noise ratio of the indication and the longer its duration the
easier it will be to detect. These two conditions can be considered mathematically:
For a large signal-to-noise ratio, (1) above, ν νb and X (νb τ r )/V . Now
X =ν
V τ r
1 − exp
τ 0
τ r
(7.8)
where τ 0 is the duration of the overheating incident. So
1 − exp−τ 0
τ r
νb
ν
(7.9)
1 −
νb
ν
exp
−
τ 0
τ r
(7.10)
That is ν must be νb and τ 0 > τ r , or ν must be > νb and τ 0 τ r . For a long
duration of indication, (2) above, τ 0 τ r .
The time constant, τ 0, depends on
• the type of fault causing the overheating,
• the extent of the fault,
• the nature of the material being overheated,• the nature of the substance being released and detected.
So, for example, a small intermittent shorted turn in the rotor winding of a large
turbine generator will produce heating for only a few minutes and the increase in
concentration of detectable substances in that time will be small because of the long
residence time, τ r , in such a machine. On the other hand overheating in a terminal
connection or due to excessive stray losses will operate for many hours and produce
a substantial indication.
The effect of the substance being detected can be considered as follows. Aninsulation material that is heated at a steady but relatively low temperature of say
190 C will produce a considerable amount of hydrocarbon gases over a long period
of time, up to 2–3 hours, until those gases are all driven off. Particulates will also be
formed but these will have a short lifetime in the enclosure because of recombination

8/20/2019 Condition Monitoring Knjiga
http://slidepdf.com/reader/full/condition-monitoring-knjiga 164/306
Chemical monitoring 141
V
V (t )
V b
TrV V
b TrV V
Cb
X
Concentration of
(a)
(b)
(c)
detectable chemical, C
Total cooling gas volume, V
Overheating
Volumetric rate of productionof detectable chemical, V
Time
Time
C
F igure 7.2 The concentration of detectable chemicals in coolant gasof an electri cal machine. ( a) Cross-section of machine. (b) Step change i n the r ate of producti on of chemical . (c) Response of the concentr ati on of detectable chemical to a step change in the rate of production of that chemical.
and condensation, say 10–15 minutes. If the insulation is raised to higher temperatures
the production of copious quantities of gases will take place over a much shorter period
of time and will stop before charring commences. If the machine is air-cooled, large
amounts of carbon monoxide and carbon dioxide will also be produced, if overheating

8/20/2019 Condition Monitoring Knjiga
http://slidepdf.com/reader/full/condition-monitoring-knjiga 165/306
142 Conditi on monitor ing of rotati ng el ectri cal machines
takes place over a long period of time, because production of those gases continues
even during charring.
All these factors need to be taken into consideration when deciding which of the
following techniques should be applied to a particular machine to detect a certain
type of fault.
7.4 I nsulation degr adation detection
It can be concluded from Sections 7.1–7.3 that insulation degradation can be moni-
tored chemically by detecting the presence of particulate matter in the coolant gas or
by detecting simple gases like carbon monoxide and ozone, or more complex hydro-
carbon gases like ethylene and acetylene. Let us consider these approaches in turn.
7.4.1 Parti culate detection: core monitor s
Detecting the smoke given off from degrading insulation appears the simplest and
most general of all techniques, since proprietary smoke detectors already exist using
an ion chamber to detect the smoke particles. An example is shown in Figure 7.3. As
the cooling gas of the machine enters the ion chamber it is ionised by a weak radio-
active source. The gas then flows through an electrode system to which a polarising
voltage is applied.
The free charges in the gas are collected on the electrode and flow through anexternal electrometer amplifier circuit, which produces an output voltage proportional
to the ion current. When heavy smoke particles enter the chamber they too are ionised
Outlet togenerator
Polarisingvoltage
Electrode
CollectorAlpha source
Solenoidvalve
Flowmeter
Test particlesource
Flow controlvalve
Particlefilter Ion chamber detector
Gain
Electrometer
Meter and/ or recorder
Alarm contacts
Input fromgenerator
Fi gure 7.3 D iagram of a basic core monitor. [ Taken from Skala [ 1] ]

8/20/2019 Condition Monitoring Knjiga
http://slidepdf.com/reader/full/condition-monitoring-knjiga 166/306
Chemical monitoring 143
and their greater mass implies a lower mobility compared to the gas molecules, so
as they enter the electrode system the ion current reduces. The smoke is therefore
detected by a reduction in the output voltage from the electrometer amplifier. Skala
[1] described an ion chamber specifically designed to detect the products of heated
insulation and this was applied to a large turbine generator by Carson et al . [2].
The primary impetus for this work was the need to provide early warning of core
faults referred to by Tavner et al . [3,4], which the larger sizes of turbine generators
started to experience in the early 1970s. A core fault can involve substantial quantities
of molten stator steel and, hitherto, the fault could only be detected when the melt
burnt through the stator winding insulation and caused an earth fault. It was hoped
that the core monitor could detect the degradation of the insulation between the steel
laminations at an earlier stage in the fault. The lifetime of pyrolised particles in
the closed hydrogen cooling circuit of a large generator is 15–30 min after which
time the particulates are deposited onto the exposed surfaces of the machine. So a
single instance of insulation overheating should lead to a reduction of core monitor
ion current for a period of time of this order. Figure 7.4 shows typical core monitor
responses. When a core fault is occurring the overheating continues over a longer
period and it has been shown by Carson et al . [2] that the core monitor does respond
to this and other forms of insulation overheating. Core monitors are available from
several manufacturers. The sensitivity of the device depends upon the ion chamber
design but experimental figures for the monitor described in Reference 2 show that
it will produce a response ranging from 85–95 per cent of full-scale deflection when
100 cm2 of lamination insulation is pyrolised, depending on the material. An area isquoted because the production of particulates is primarily a surface effect.
The device, however, does have some practical difficulties.
1. The monitor output fluctuates with cooling gas pressure and temperature.
2. The monitor responds to oil mist that may be present in the circuit of any
hydrogen-cooled machine due to faulty hydrogen seals [5].
3. The monitor is non-specific; that is, it cannot distinguish between the materials
being overheated.
Items (1) and (2) affect the background signal from the monitor, which any signal dueto damaging overheating must exceed. Figure 7.4(c) shows a typical core monitor
trace from a machine affected by oil mist. Item (3) affects the attitude of a machine
operator to an alarm from the core monitor, since there will be less confidence in the
monitor if it is not known from what part of the machine the detection originated.
A more advanced monitor, described by Ryder et al . [6], has been devised to
overcome problems (1) and (2) by using a differential technique, Fig. 7.5. Ryder’s
monitor consists of two identical ion chambers in series in the gas flow line with
an intermediate particulate filter between them. The monitor displays the difference
between the ion currents in the two chambers and thereby eliminates fluctuations dueto pressure and temperature.
The sensitivity of a core monitor to oil mist can be reduced if the ion chamber is
kept at an elevated temperature. It has been proposed that oil mist is only produced
by overheating, so that its detection may be useful. The use of heated ion chambers

8/20/2019 Condition Monitoring Knjiga
http://slidepdf.com/reader/full/condition-monitoring-knjiga 167/306
144 Conditi on monitor ing of rotati ng el ectri cal machines
Time, hours
Test filterchecks
Systemchecks
Trip
Test filtercheck
Trip
C o r e m o n i t o r d e f l e c t i o n % o
f s c a l e
Time, hours
C o r e m o n i t o r d e f l e c t i o n % o
f s c a l e
Time, hours
40
100(a)
(b)
(c)
10
0 C o r e m o n i t o r d e f l e c t i o n % o
f s c a l e
20
30
40
50
60
70
80
90
0 1 2
100
10
1 2
20
40
50
70
90
100
0
30
60
80
30
50
60
80
90
10
0
20
70
1 2 3 4 5 6 70
Fi gure 7.4 Typical core monitor responses. (a) M achine with overheating conductor bar. (b) M achine wi th a core fault . (c) M achine wi th no overheating but heavy oil contaminati on.
was not initially encouraged, however, current thinking is that heated ion chambersare essential for reliable detection. However, the amount of oil in a turbine generator
casing varies widely and can be particularly high. In this case it has been found that
there can be frequent false core monitor alarms, so the use of a heated ion cham-
ber gives a significant advantage. In order to completely vaporise an oil mist it is
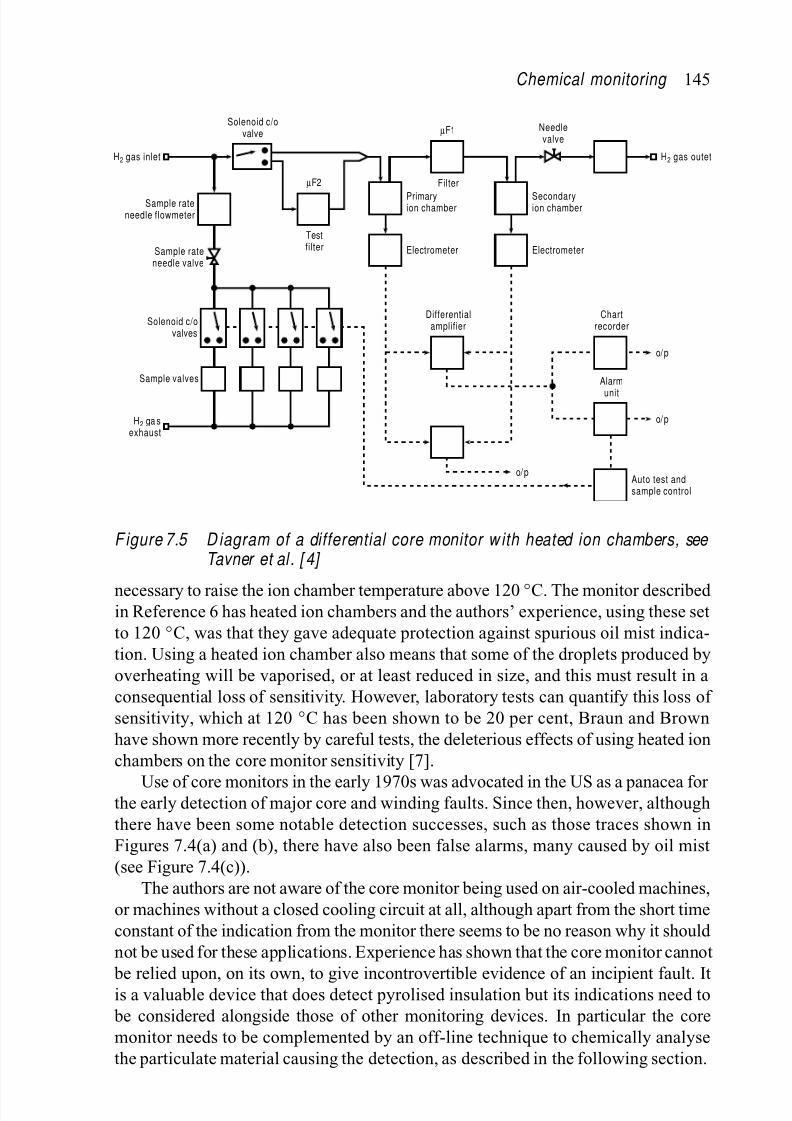
8/20/2019 Condition Monitoring Knjiga
http://slidepdf.com/reader/full/condition-monitoring-knjiga 168/306
Chemical monitoring 145
H2 gas inlet
Sample rateneedle flowmeter
Sample rateneedle valve
Solenoid c/ovalves
Sample valves
H2 ga sexhaust
Solenoid c/ovalve
µF2
Testfilter
µF1
Filter
Primaryion chamber
Secondaryion chamber
Electrometer Electrometer
H2 gas outet
Differentialamplifier
Chartrecorder
Alarm
unit
Auto test andsample control
o/p
o/p
o/p
Needlevalve
F igure 7.5 D iagram of a differential core monitor w ith heated ion chambers, see Tavner et al . [ 4]
necessary to raise the ion chamber temperature above 120 C. The monitor described in Reference 6 has heated ion chambers and the authors’ experience, using these set
to 120 C, was that they gave adequate protection against spurious oil mist indica-
tion. Using a heated ion chamber also means that some of the droplets produced by
overheating will be vaporised, or at least reduced in size, and this must result in a
consequential loss of sensitivity. However, laboratory tests can quantify this loss of
sensitivity, which at 120 C has been shown to be 20 per cent, Braun and Brown
have shown more recently by careful tests, the deleterious effects of using heated ion
chambers on the core monitor sensitivity [7].
Use of core monitors in the early 1970s was advocated in the US as a panacea for the early detection of major core and winding faults. Since then, however, although
there have been some notable detection successes, such as those traces shown in
Figures 7.4(a) and (b), there have also been false alarms, many caused by oil mist
(see Figure 7.4(c)).
The authors are not aware of the core monitor being used on air-cooled machines,
or machines without a closed cooling circuit at all, although apart from the short time
constant of the indication from the monitor there seems to be no reason why it should
not be used for these applications. Experience has shown that the core monitor cannot
be relied upon, on its own, to give incontrovertible evidence of an incipient fault. Itis a valuable device that does detect pyrolised insulation but its indications need to
be considered alongside those of other monitoring devices. In particular the core
monitor needs to be complemented by an off-line technique to chemically analyse
the particulate material causing the detection, as described in the following section.

8/20/2019 Condition Monitoring Knjiga
http://slidepdf.com/reader/full/condition-monitoring-knjiga 169/306
146 Conditi on monitor ing of rotati ng el ectri cal machines
7.4.2 Parti culate detection: chemical analysis
Many authors have advocated taking a sample of the particulate material when a core
monitor indicates an alarm [2]. In order to collect a detectable amount of particulate
matter within a short time, it is necessary to have a very large gas flow-rate throughthe filter. This is achieved by venting the pressurised casing of the machine through
the filter to the atmosphere. There is not such close agreement about the method
of analysis however. Carson et al . [2] described a method whereby the pyrolysis
products are collected upon a small charge of silica gel and are then released into a
gas chromatograph upon the application of strong heat. This technique is applicable
only when sampling is carried out immediately upon detection of local overheating.
This is because it is specially designed to collect the particulates and heaviest pyrolysis
products, which are present for only a limited time in the gas, sometimes for only a
few minutes. There is also a problem with the gas chromatographic analysis of the pyrolysis products as these products contain a very large number of different organic
compounds and the resultant chromatogram is difficult to interpret. Figure 7.6 taken
from Reference 8 gives an example. The most arduous test would be to distinguish
the products of pyrolised insulation from the overheated oil that is generally present
in any electrical machine. Further work on this from Dear et al . [8] on the gas released
24 2
Time, min
046810121416182022
1
2
3
4 5
6
7
8 10
11
12 13
14
15
1617
1819 2 0
2122
2324 2 5
26 27 28 29
1 C10H14 (aromatic)
2 C11H14
3 Methyl ethyl benzene
4 Methyl ethyl benzene
5 C10H20
6 C10H22
7 Xylene
8 C10H22
9 Xylene
10 C9H18
11 C8H20
12 C8H16
13 Toluene
14 C8H18
16 Benzene
17 C7H16
18 Trichloroethane
19 Butanone (mek)
20 Ethyl acetate
21 C6H12
22 C6H14
23 C5H8
24 Acetone
25 Propan-2-ol
26 C5H10
27 Ethanol
28 C4H8
29 Acetaldehyde
9
15 C7H14
Fi gure 7.6 Gas chromatogram of generator hydrogen impuriti es descri bed from a Tenax GC pr e-column. [ Taken from D ear et al . [ 8] ]

8/20/2019 Condition Monitoring Knjiga
http://slidepdf.com/reader/full/condition-monitoring-knjiga 170/306
Chemical monitoring 147
Time, min(a) main wall insulation
Time, min(b) epoxy coating
Time, min(c) alkyd enamel paint
Time, min(d) generator hydrogencoolant gas background
AB
C
D E
F
G
H
I
J
K
A
B
C
D
E
F
AB C
D
E
A B C
D
E
F
G
A
B
C
D
E
F
G
H
I
J
K
55.5
50.0
45.3
41.0
39.0
36.1
31.5
28.0
24.0
18.0
6.1
A
B
C
D
E
F
24.9
23.0
19.3
17.9
14.5
4.4
A
B
C
D
E
37.8
33.0
27.3
22.0
17.0
A
B
C
D
E
F
41.8
38.0
34.0
29.4
24.1
22.9
G 16.4
Fi gure 7.7 Compari son of gas chromatograms taken from pre-column samples from hydrogen-cooled gener ators wi th overheating of var ious insulation components. [ Taken from D ear et al. [ 8] © I EEE (1979)]
from pyrolisation is shown in Figure 7.7. Some have used a mass spectrometer inassociation with the gas chromatograph on the particulate matter, to obtain precise
identification of individual compounds. The problem then arises of how to distinguish
between the very large numbers of organic compounds that are obtained and how
to associate a pattern of compounds with the overheating of a particular insulation
material and as yet this has not proved practicable. We shall return to this in the
analysis of the gas released in pyrolisation.
An alternative is to reduce the amount of chemical information obtained from
the pyrolysis products by using detection techniques that are less sensitive or only
sensitive to pyrolysis products. One technique makes use of the fact that many organicmaterials fluoresce when irradiated with ultra-violet (UV) light. The resultant UV
spectrum is far less complex than the chromatogram produced by the same compounds
going through a gas chromatograph. Figure 7.8 gives an example taken from Ryder
et al . [6], which should be compared with Figure 7.6. The filter is illuminated by a

8/20/2019 Condition Monitoring Knjiga
http://slidepdf.com/reader/full/condition-monitoring-knjiga 171/306
148 Conditi on monitor ing of rotati ng el ectri cal machines
Wavelength, nanometer
330 340 350 360 370 380
I n t e n s i t y
Fi gure 7.8 Typical ultraviolet spectrum of hydrogen impuri ties due to pyrolised insulation. [Taken from Ryder et al. [6]. © IEEE (1979)]
UV lamp of a given wavelength, and the fluorescent light from the collected organic
particles can be viewed with a UV spectrometer. Although it has been claimed that
pyrolised insulation can be clearly distinguished from oil by this technique, to date acommercial version is not available.
It must be stressed that despite the various techniques described here, to the
authors’ knowledge there is as yet no definitive way to identify conclusively material
collected on a core monitor filter. A way out of this difficulty is being sought by
tagging components in the machine with compounds, which when overheated give
off material with easily identifiable chemical compositions. This technique has been
used in the US by Carson et al . [2].
7.4.3 Gas analysis off-line
An alternative to detecting and analysing the particulate matter is to detect the gaseous
products of pyrolysis, such as the hydrocarbon gases or carbon monoxide and carbon
dioxide in the cooling gas. There may be two advantages in doing this. First from
8/20/2019 Condition Monitoring Knjiga
http://slidepdf.com/reader/full/condition-monitoring-knjiga 172/306
Chemical monitoring 149
Section 7.2 it is clear that some gases are given off at lower temperatures, before
particulates, so an earlier warning of overheating may be given. Second, in a closed
cooling circuit, where particulates have a short lifetime of only 15–30 min, gaseous
products will have a much longer lifetime of many days, depending upon the coolant
gas leakage factor, 1/τ r , so it will not be necessary to detect simply a short-term
change. On the other hand, whereas the concentration of particulates will be zero in
the absence of burning insulation, there will always be a small and possibly variable
background concentration of gases due to impurities in the make-up, and this will
effectively determine the threshold for the detection of burning by this technique.
The gas analysis method, which has received attention for large hydrogen-cooled
generators, uses a gas chromatograph and flame ionisation detector to measure the
total hydrocarbon content in the hydrogen. Early work showed that most organic
compounds present in the cooling gas could not be detected without a concentration
technique. A number have been reported but the most widely used is a pre-column
method in which the impurities are absorbed on a gas chromatographic stationary
phase contained in the short tube.
Another off-line method of gas detection that has been used in modern, large,
air-cooled machines is to measure the ozone concentration to detect the onset and
progress of slot discharge erosion caused by partial discharge activity. Large epoxy
insulated windings in an air-cooled environment experience this problem, which can
lead to major insulation failure (see Chapters 2 and 10). The technique has been
successfully used on large hydro generators, which operate at stator voltages as high
as 24 kV in an air-cooled environment, where stator winding bars are subjected tohigh slot forces and partial discharge activity is consequent upon mechanical damage,
leading to the production of ozone gas. The ozone concentration in the coolant air
can be measured by taking a gas sample and using a Draeger tube.
7.4.4 Gas analysis on-li ne
The advantage of performing gas analysis continuously on-line is that, because of
the long residence times of gases due to overheating in the cooling system, it may
be possible to obtain earlier warning of incipient damage to the machine. The disad-vantages are the inherent complexity of continuous chemical gas analysis equipment
and the difficulty of translating the analysis into a single electrical signal.
Bearing in mind the experience of Kelley et al . [9], shown in Figure 7.9, a
continuous monitor was devised for application to hydrogen-cooled generators, using
a flame ionisation detector to measure the total organic content of the hydrogen. This
is the type of detector used in chromatography for the detection of organic species.
The generator hydrogen gas is introduced into a hydrogen/air flame. The flame forms
part of an electrical circuit and normally presents a very high resistance. When organic
species are introduced, organic ions containing carbon are formed and the resistanceof the flame decreases linearly with the amount of organic compound introduced. The
device is very sensitive and can detect increases as small as 0.2 parts per million by
volume (vpm). However, its usable sensitivity is reduced because of the presence of
background levels of organic compounds that can be 10–50 vpm with a variability

8/20/2019 Condition Monitoring Knjiga
http://slidepdf.com/reader/full/condition-monitoring-knjiga 173/306
150 Conditi on monitor ing of rotati ng el ectri cal machines
R e l a t i v e C O P ,
N
4
1
0
0 28
3
2
4 8 12 16 20 24
Time, days
a
b
c
e
d
d
b
a
c
e
Unit off line for inspection and maintenance
Significant increase in COP accompanied by a core monitor deflection
1N is equivalent to normal concentration of organic product (COP)
Core monitor alarm, load reduction initiated
Generator synchronized, COP back to normal
Fi gure 7.9 Plot of concentration of organic products duri ng and after a gener ator
overheating problem. [ Taken from K ell ey et al. [ 9] . © I EEE (1976)]
of ±20 per cent. However, one considerable advantage of the continuous monitor
over the core monitor is that it shows the trend of any increase in the products of
overheating, as shown in Figure 7.9. The total organic content is measured in vpm of
methane (CH4) equivalent. However, Figure 7.10 also shows the very considerable
background level against which faults need to be detected. The sensitivity of the
monitor has been calculated theoretically based upon the methane equivalent content
of typical insulation materials.This shows that the pyrolysing of 24 g of insulation would produce about 32 l
of methane-equivalent hydrocarbons, which on a large hydrogen-cooled generator
(500 MW) would give a concentration of about 15 vpm of methane equivalent on the
flame ionisation detector. The amount of hydrocarbons produced depends not only
on the temperature of the insulation but also on the part being overheated. The mass
of insulation per unit volume in the laminated core is relatively small, whereas on a
winding if overheating takes place, a very large proportion of the volume involved
will be insulation and this will give a correspondingly large indication on the flame
ionisation detector. Overheating would be considered to be serious if the rate of increase of total organics exceeded 20 vpm/h.
An alternative to the flame ionisation detector, for the detection of organic con-
tent in hydrogen, has been proposed using a commercial photo-ionisation detector
for flammable gases. The detector contains an ultraviolet lamp that ionises the gas

8/20/2019 Condition Monitoring Knjiga
http://slidepdf.com/reader/full/condition-monitoring-knjiga 174/306
Chemical monitoring 151
Load perturbation
100(a)
(b)
90
80
70
60
50
40
30
20
10
0
C o r e m o n i t o r d e f l e c t i o n % f u
l l s c a l e
Time, hours
700
600
100
0
T o
t a l o r g a n i c c o n t e n t v p m C
H 4 e q u i v a l e n t
Time, hours0 24 48
500
400
300
200
0 24 48
Fi gure 7.10 Compari son of the traces from a continuous gas monitor with the
response of a core monitor on a 500 MW alternator following an overheating i ncident. ( a) Core monitor response. (b) Continuous gas response.

8/20/2019 Condition Monitoring Knjiga
http://slidepdf.com/reader/full/condition-monitoring-knjiga 175/306
152 Conditi on monitor ing of rotati ng el ectri cal machines
stream as it passes through. A potential is applied across electrodes in the detec-
tor and the conductivity is measured as in the flame ionisation detector. The device
detects the heavier hydrocarbon compounds in the gas stream and it has been shown
that a fault involving overheating of about 2 g of organic material would produce
a deflection of 1–2 vpm on the device fitted to a large generator. Typical back-
ground levels of 7–10 vpm were measured. More recent work by Sorita et al . [10–12]
using a quadrupole mass-spectrometer on the gases evolved from faults has identified
methods for analysing and classifying faults from turbine generator faults.
On air-cooled machines an overheating incident will produce a large volume of
carbon monoxide and carbon dioxide as well as light hydrocarbon gases. An instru-
ment has been produced to detect overheating by measuring the carbon monoxide
concentration. The instrument contains an auxiliary pump that draws air through
tubes from a number of motors that are being sampled, to a commercial infra-red
detector. The detector measures the carbon monoxide content using the principle that
the vibration of the carbon monoxide molecule corresponds with a known wavelength
in the infra-red region, see Tavner et al . [4].
Within a totally sealed motor enclosure the air should recirculate with a long res-
idence time, τ r , but because of leaks in a practical enclosure, a substantial proportion
of the total volume of air is exchanged with the environment every minute. Thus
any carbon monoxide in the cooling stream produced by overheating will be diluted
fairly rapidly. This is in contrast with the detection problem in the sealed cooling sys-
tem of a hydrogen-cooled generator. However, the infra-red analyser was capable of
detecting concentrations of carbon monoxide down to less than 1 vpm. Calculationshave shown that 180 g of insulation heated to 300 C will introduce a 1.5 vpm rise in
the concentration of carbon monoxide in the cooling air. Therefore the analyser has
sufficient sensitivity to detect localised overheating on motor windings.
7.5 L ubrication oil and bearing degr adation
The shafts of smaller electrical machines are supported by ball or roller bearings
lubricated with grease, and faults in such bearings could be detected by shock pulsetechniques as described in Chapter 8. However, high-speed machines above about
300 kW and low-speed machines above about 50 kW use oil-lubricated rolling ele-
ment bearings and larger sizes need sleeve bearings with a continuous oil supply. A
number of authors including Evans [13] and Bowen et al . [14] have suggested that
the continuous monitoring of that oil supply could provide early warning of incipient
problems either in the oil itself or in the bearings.
The normal mode of failure of rolling element bearings is by fatigue cracking of
the rolling elements or their raceways, although other wear mechanisms like fretting,
scuffing and abrasion will also generate debris. White-metalled sleeve bearing failuresare not usually progressive. Debris is likely to be released in short bursts when
the bearing is transiently overloaded or if an oil film momentarily ruptures. Quite
substantial damage can be tolerated while the bearing continues to be fed a copious
supply of cooled lubricating oil.Nevertheless there are many potentially damaging
situations that could be diagnosed by analysing the lubricating oil including fatigue

8/20/2019 Condition Monitoring Knjiga
http://slidepdf.com/reader/full/condition-monitoring-knjiga 176/306
Chemical monitoring 153
failure or cavitation at the white metal surfaces and corrosion in the lubrication system.
Any incipient bearing failure is likely to lead to local heating and degradation of the
lubrication oil at the wear site.
A particular problem associated with electrical machines is the flow of currents
through bearings and oil films, which pit the bearing surface, producing metallic
debris and degrading the lubrication oil. This sort of activity is caused by magnetically
induced shaft voltages induced within the machine, whose causes and effects are
summarised very thoroughly by Verma and Girgis [15]. Photographs of this type of
damage are shown in a previous chapter (Figure 2.14). The two approaches that could
be used to detect these various types of incipient failure activity in the lubrication oil
are therefore (1) the detection of oil degradation products, and (2) the detection of
bearing degradation products or wear debris detection.
7.6 O il degr adation detection
The chemical detection of oil degradation has been used most effectively for the
condition monitoring of transformers [16], where the oil is used for insulating and
cooling purposes and is sealed within the transformer enclosure. However, in this
case the mechanisms of degradation are clearly defined, being distinguished by the
different temperatures reached. The technique is off-line gas-chromatograph analysis
of the transformer oil, done at regular intervals during the plant life. Such rigorous
analysis is necessary to distinguish between the complex products produced in the oil.The mechanisms involved in bearing oil degradation are not so clearly defined and the
analysis that would be necessary would be more complex and less easily prescribed.
However, standard off-line oil analysis procedures are available commercially but
the authors do not know of any programmes that have experienced particular success
with electrical machines. The typical parameters to be screened in bearing oil analysis
are given in the Neale Report [17].
7.7 W ear debris detection
7.7.1 General
The off-line monitoring of wear debris in lubricating oils has been widely used for
some time, particularly for rolling element bearings and gears, in the military and
aviation fields. This has made use of the ferromagnetic attraction of debris particles
in particular. In fact, passive magnetic plugs fitted to lubricating oil sumps have
been used for many years to collect ferromagnetic debris and regular inspection
gives an aid to indicate when full maintenance should be carried out on helicopter
gearboxes. These techniques have now advanced so that on-line detection of thedebris content in oil is possible. Work has also been done to extend the capabilities of
on-line detection so that other debris, produced for example from the soft material of
white-metal bearings, can be detected. These techniques are described in the following
two sections. When reading these sections it should be borne in mind that oil is
supplied to the bearing from a closed-loop lubrication system, which will contain oil
8/20/2019 Condition Monitoring Knjiga
http://slidepdf.com/reader/full/condition-monitoring-knjiga 177/306
154 Conditi on monitor ing of rotati ng el ectri cal machines
filtration equipment. This equipment will remove a proportion of any debris entrained
so that, following a wear incident, the concentration of debris will increase and then
decay away as the filters do their work. Thus the ability to detect wear debris is
dependent upon volume and residence time factors similar to those that control the
detectability of chemicals in cooling gas, as described in Section 7.3.
7.7.2 Ferr omagneti c techniques
The normal mode of failure of rolling element bearings is by fatigue cracking and
spalling of the rolling elements or raceways producing fragments up to a millimetre
or more in size in the oil. An on-line device has been developed that can be inserted
into the full-flow oil line from a bearing and count the number of ferromagnetic
particles present in the oil flow, with a certain size band. The detector is based on the
induction unbalance principle used in metal detectors. A pair of carefully screened
coils surround the oil line and form two arms of an AC bridge circuit. Magnetic or
conducting particles entrained in the flowing oil cause the bridge to unbalance, first
on one side of null, as the particle approaches the device, and second on the other
side of the null as the particle recedes. Figure 7.11 shows a section through the sensor
as described in Chapter 4 and by Whittington et al. [18]. The phase of the bridge
unbalance enables ferromagnetic particles to be discriminated from other conducting
particles. The sensitivity of the system varies according to the shape of the particles
but for approximately spherical particles the sensitivity can be adjusted to separately
record the passage of particles at two size levels, from 200 µm to 2 mm in diameter,in an oil flow velocity of 1–12 m/s; that is, an oil flow of up to 20 l/s. The output is in
the form of a counter reading in each of the two size ranges and the output could be
made available to a data acquisition system. This robust device has been widely used
on jet engine installations, where its performance in a high temperature, pressure and
vibration environment has been proved. There is no record, however, of this device
being used in an electrical machine.
A device that can produce a greater amount of information about ferromagnetic
wear debris is the instrumented magnetic drain plug. Conventional magnetic plugs
usually consist of a bar magnet with a pole projecting into the lubricating oil. Inan instrumented plug it is necessary to measure the change in field strength at the
magnet pole as debris is collected. Because of the difficulties of measuring those
changes a horseshoe magnet has been adopted instead of the bar magnet. As particles
are attracted to the gap between the poles of the magnet they increase the field within
the gap, while at the same time increasing the total flux in the magnetic circuit. Two
differentially connected matched field sensors, sampling each of these fields, can
thus give additive, particle-dependent signals, while cancelling out fluctuations due
to temperature and magnetic field strength. Figure 7.12 shows the arrangement of the
device. Another device, an instrumented oil drain plug, gives an analogue voltage proportional to the amount of debris deposited, the rate of accumulation of debris
and the temperature of the oil. The device can detect masses of ferromagnetic debris
attracted to the pole pieces ranging from 10 to 600 mg with a resolution of 10 mg in
an oil flow velocity of 0.1–0.5 m/s.

8/20/2019 Condition Monitoring Knjiga
http://slidepdf.com/reader/full/condition-monitoring-knjiga 178/306
Chemical monitoring 155
Output cable
Unobstructedoilway
Sensor coils
Main body tube
Sensor
Sensor
signal
Powersupplies
Oil flow
Airbourne integrated
data systems
OscillatorInductance
bridgeDemodulator Counter
AC DC
Amp
Oil flow
F igure 7.11 Structure of an inductive debri s detector
7.7.3 Other wear debr is detection techniques
The ferromagnetic techniques described in the previous section are appropriate for
rolling element bearings but not for the white-metalled sleeve bearings that are used
on larger electrical machines. Lloyd and Cox [19] have investigated the problem of
detecting wear in the bearings and hydrogen seals of large turbine generator sets. They
describe an investigation that characterised the debris circulating in the oil system of
a number of 60 MW turbine generators and correlated the results with plant condition.
A major feature in this correlation was the presence of white metal in the machine bearings that typically contain 85 per cent tin.
The results of their investigation showed that by determining the ratio of tin
to iron in the debris an operator could see how much bearing damage was occur-
ring, compared to normal running wear (see Figure 7.13). However, if information

8/20/2019 Condition Monitoring Knjiga
http://slidepdf.com/reader/full/condition-monitoring-knjiga 179/306
156 Conditi on monitor ing of rotati ng el ectri cal machines
Epoxy resin Brass sleeve
Pole piece
Permanent magnet
Permanent magnet
Hall effect sensor plustemperature
compensating sensor
Fi gure 7.12 An instrumented magnetic drain plug
0.2
0 1200
Cumulative running hours (from 3/9/78)
S n F e r a t i o
200 400 600 800 100
1.0
0.6
0.8
0.4
0.0
Set 8: accidental overload
Set 8: annual overhaul, a thrustbearing and a journal bearingfound to be damaged
Sets 1–7 Set 8
Fi gure 7.13 Ratio of tin to iron in the oil fi lter deposits from eight 60 M W turbine gener ator sets. [ Taken from L loyd and Cox [ 19] ]

8/20/2019 Condition Monitoring Knjiga
http://slidepdf.com/reader/full/condition-monitoring-knjiga 180/306
Chemical monitoring 157
was available about running time, monitoring of tin content alone would be
adequate.
Lloyd and Cox then proceeded to investigate how the oil system could be auto-
matically monitored to provide early warning of bearing damage. In particular they
considered x-ray fluorescence detection and the measurement of the electrical prop-
erties of the oil. Their investigation showed that x-ray fluorescence would be feasible
but would be prohibitively expensive as an on-line technique.
7.8 C onclusion
This chapter has shown that chemical and wear analysis have been demonstrated to
be effective global monitoring techniques for electrical machines which can produce
narrow bandwidth (<1 Hz) signals. Chemical degradation of insulating materialsand lubricants are detectable and can give bulk indications of the condition of an
electrical machine. This is particularly important when it is considered how central
insulation and lubrication integrity are to the long-term life of a machine. However, the
detectability criteria for these techniques are difficult, the chemical analysis processes
involved are complex and expensive, and the quantity of data generated by chemical
analysis currently confine their application to only the largest machines.
7.9 R eferences
1. Skala G.F. (1966). The ion chamber detector as a monitor of thermally produced
particulates. Journal de Research Atmospher i que 1966; April/Sept.
2. Carson C.C., Barton S.C. and Echeverria F.S. Immediate warning of local over-
heating in electrical machines by the detection of pyrolysis products. IEEE Transactions on P ower Appar atus and Systems 1973; PAS-92: 533–42.
3. Tavner, P.J. and Anderson A.F. Core faults in large generators. IEE Proceedings,Electri c Power Applications 2005; 152: 1427–39.
4. Tavner, P.J., Gaydon B.G. and Ward D.M. Monitoring generators and large
motors. IEE Proceedings, Part B, Electric Power Appli cations 1986; 133:169–80.
5. Carson C.C., Barton S.C. and Gill R.S. The occurrence and control of inter-
ference from oil-mist in the detection of overheating in a generator. IEEE Transactions on P ower Appar atus and Systems 1978; PAS-57: 1590–614.
6. Ryder D.M., Wood J.W. and Gallagher P.L. The detection and identification
of overheated insulation in turbo-generators. IEEE Tr ansactions on Power Apparatus and Systems 1979; PAS-98: 333–36.
7. Braun J.M. and Brown G. Operational performance of generator condition mon-
itors: comparison of heated and unheated ion chambers. I EEE Transactions on Energy Conversion 1990; EC-5: 344–49.
8. Dear D.J.A., Dillon A.F. and Freedman A.N. Determination of organic com-
pounds in the hydrogen used for cooling large electricity generators. Journal of Chromatography 1977; 137: 315–22.

8/20/2019 Condition Monitoring Knjiga
http://slidepdf.com/reader/full/condition-monitoring-knjiga 181/306
158 Conditi on monitor ing of rotati ng el ectri cal machines
9. Kelley J.K., Auld J.W., Herter V.J., Hutchinson, K.A. and Rugenstein, W.A.
Early detection and diagnosis of overheating problems in turbine generators by
instrumental chemical analysis. I EEE Tr ansactions on Power Apparatus and Systems 1976; PAS-95: 879–86.
10. Sorita T., Minami S., Adachi H., Takashima N. and Numata S. The detection
of degraded materials in turbine generators by chemical analysis. Proceedings of International Symposium on Electrical Insulating Materials , Toyohashi, Sep
1998. Piscataway: IEEE; 1998. pp. 751–754.
11. Sorita T., Enmanji K., Kato K., Takashima M. and Nakamura K. On-line
detection of overheating material in turbine generators using chemical analysis.
Proceedings of the Annual Conference on Electrical Insulation and Dielectric Phenomena , Austin, Oct 1999. Piscataway: IEEE; 1999. 2: pp. 533–6.
12. Sorita T., Enmanji K., Kato K., Takashima M. and Nakamura K. A novel on-line
method and equipment to detect local problems in turbine generators. Proceed- ings of the Annual Report Conference on Electri cal Insulation and D ielectri c Phenomena , Victoria, Oct 2000. Piscataway: IEEE; 2000. pp. 552–5.
13. Evans C. Wear debris analysis and condition monitoring. NDT International 1978; 11: 132–34.
14. Bowen R., Scott D, Seifert WW and Westcott VC. Ferrography. Tribology International 1976; 9: 109–15.
15. Verma S.P. and Girgis R.S. Shaft Potentials and Currents i n Large Tur- bogenerators . Report for the Canadian Electrical Association, 078 G 69
1981.16. Rogers R. Concepts used in the development of the IEEE and IEC codes for
the interpretation of incipient faults in power transformers by dissolved gas in
oil analysis. Presented at the IEEE Power Engineering Society Winter Power
Meeting, New York, 1978.
17. Neale N. and Associates. A Guide to the Condition Monitoring of Machinery .London: Her Majesty’s Stationary Office; 1979.
18. Whittington H.W., Flynn B.W. and Mills G.H. An on-line wear debris monitor.
M easurement Science Technology 1992; 3: 656–61.
19. Lloyd O. and Cox A.F. Monitoring debris in turbine generator oil. Wear 1981;71: 79–91.

8/20/2019 Condition Monitoring Knjiga
http://slidepdf.com/reader/full/condition-monitoring-knjiga 182/306
Chapter 8 V ibr ation monitor ing
8.1 I ntroduction
An electrical machine, its support structure and the load to which it is coupled, form a
complex electromechanical system. It can receive impulsive excitation that vibrates itat its own natural frequency, or it can be forced by the exciting airgap electromagnetic
field or torque spectrum of the driven or driving machine at many different frequen-
cies. These frequencies may cause the machine to emit an unacceptably high level
of acoustic noise, or cause progressive mechanical damage due to high cycle fatigue,
which ends in a machine failure mode. Consequently a great deal of effort has been
applied to try to determine the principal sources of vibration in electrical machines,
and a large literature spanning more than 80 years has accumulated. A representative
selection of papers and articles is included in the references.
The principal sources of vibration in electrical machines are:
• the response of the stator core to the attractive force developed magnetically
between rotor and stator;
• the dynamic behaviour of the rotor in the bearings as the machines rotates;
• the response of the shaft bearings, supported by the machine structure and
foundations, to vibration transmitted from the rotor;
• the response of the stator end windings to the electromagnetic forces on the
conductors.
These four areas are interrelated; for example, bearing misalignment or wear canresult in eccentric running, which will in turn stimulate the vibration modes of the
stator and the rotor. Before examining specific monitoring techniques we shall first
look at the characteristic features of the frequency responses of the machine elements
listed.
8.2 Stator core response
8.2.1 General
The stator and its support structure comprise a thick-walled cylinder, slotted at the
bore, resting inside a thin-walled structure, which may or may not be cylindrical.
A stator in its cylindrical support structure is illustrated schematically in Figure 8.1.
Analysis of a three-dimensional structure such as this, in response to the complex

8/20/2019 Condition Monitoring Knjiga
http://slidepdf.com/reader/full/condition-monitoring-knjiga 183/306
160 Conditi on monitor ing of rotati ng el ectri cal machines
Slotted region Stator core annulus
Support ribs Casing
Fi gure 8.1 A machine stator and its supporti ng structure
imposed force distribution, is a formidable problem even for powerful numerical
techniques. Fortunately the main features of the response can be developed using
simplified models.
Alger [1] and Jordan [2] considered the machine to be reducible to an infinitely
long, thin-walled cylinder representing the stator core. This simplification allows a
qualitative assessment of response to be made. A fuller treatment of the mechanicalsystem is provided by Erdelyi and Erie [3], and Yang [4] gives a detailed analysis
of the calculation of stator displacements, taking into account the higher frequency
effects due to slot passing.
The forces acting on the stator core are the result of the interaction between the
airgap flux wave and the currents flowing in the windings embedded in the stator
slots. The forces acting on the end winding are due to the interaction between the end
leakage flux and the winding currents. It is apparent, therefore, that the precise nature
of the applied force waves will be a function of the form of the current distribution,
and the geometry of the airgap and end regions. Disturbances to either, due to rotor eccentricity or damaged areas of the rotor or stator windings for example, will alter
the harmonic components of the force wave and initiate a different response from the
stator core, particularly if the applied forces stimulate any of the natural modes of the
system.

8/20/2019 Condition Monitoring Knjiga
http://slidepdf.com/reader/full/condition-monitoring-knjiga 184/306
Vibr ation monitori ng 161
8.2.2 Calculation of natural modes
For a simple thin-walled cylinder of infinite length the radial and peripheral displace-
ments, u r (θ , t ) and u θ (θ , t ), of the structure at a radius fixed at the mid-wall value,
may be written as
u r (θ , t ) =∞
n = even
a n (t ) cos(n θ) + b n (t ) sin(n θ) (8.1)
and
u θ (θ , t ) =∞
n = even
c n (t ) cos(n θ) + d n (t ) sin(n θ) (8.2)
If it is further assumed that the deformations are inextensible:∂u θ
∂θ = −u r (8.3)
then
c n = b n
n and d n = −a n
n
During deformation by the deflections in (8.1) and (8.2), the system accumulates
volumetric elastic strain potential energy, V , per unit length given by the expression
V = 1
2
π−π
EJ
(1 − v )2r 2
∂2u r
∂θ 2 − u r
d θ (8.4)
where E is Young’s modulus of the material, ν is Poisson’s ratio of the material and
J is the polar moment of inertia of the core cylinder.
Equation (8.4) reduces to
V = π
2
EJ
(1
− ν2)r
∞
n =
1
(1 − n 2)2
a 2n (t ) + b n
2(t )
(8.5)
Timoshenko [5] showed that the kinetic energy of the system, T , per unit length
will be given by
T = w
2g
π−π
(u 2r + u 2θ )d θ (8.6)
where w is the weight per unit length per unit circumferential angle of the cylinder
and g is the acceleration due to gravity. Substituting (8.1) and (8.2) into (8.6) gives
T = πw
2g
∞n −1
1 +
1
n 2 [a 2n (t ) + b 2n (t )] (8.7)
If it is necessary to include the vibration of the core, enclosure and frame building
bars of the machine, then these can also be incorporated. So for example the total

8/20/2019 Condition Monitoring Knjiga
http://slidepdf.com/reader/full/condition-monitoring-knjiga 185/306
162 Conditi on monitor ing of rotati ng el ectri cal machines
elastic strain energy, V , would be given by:
V = V E + V S + V F (8.8)
where the subscripts E , S and F refer to the enclosure, the stator core and the frame building bars respectively.
The total kinetic energy of the system would be given by
T = T E + T S + T F (8.9)
However, the calculation of these quantities for the enclosure and frame structures
will be complex. The equation of motion can now be formulated. It is given for free
vibration by the Euler–Lagrange equation:
∂
∂t
∂T
∂a n
− ∂V
∂ a n = 0 (8.10)
If the forced vibration response is required directly then the right hand side of (8.10)
becomes a forcing function. For example, if we are interested in the system response
to the m th harmonic of the radial force wave f (θ , t ), the forcing function becomes the
work function, W , given by
W
=
∞
m =1
f m (θ , t ) u r m (θ , t ) (8.11)
Generally, f m (θ , t ) has the form of travelling wave:
f m (θ , t ) = F m cos (ωm t − m θ ) (8.12)
Erdelyi and Erie [3] shows how the Rayleigh–Ritz method can be used to solve
(8.10) to yield the natural frequencies of the system, under the assumption that time
variations are harmonic. That is, the coefficients a n (t ) and b n (t ) are given by:
a n (t ) = A n sin ωn t and b n (t ) = B n sin ωn t (8.13)
Under this assumption, (8.10) becomes a polynomial in ωn whose roots give the
natural frequencies. Some of the natural circumferential mode shapes of the radial
vibration of the stator are shown in Figure 8.2.
Besides these circumferential modes it is also possible for the radial vibration of
the stator to vary as a function of machine length. The mode shapes for a cylinder
vibrating in this way are illustrated in Figure 8.3. In practice, however, only the k L = 0
case need be considered for machines of normal proportion. Very long machines may
exhibit vibrations at higher modes, but the most important mode shapes are thosedue to the circumferential radial vibrations. It is easily recognised that the cases for
k c = 0 and k L = 0 and are identical.
Approximate formulae for the natural frequencies of a simple single ring stator
have been reported by Yang [4] in the form given here. For k c = 0, the corresponding

8/20/2019 Condition Monitoring Knjiga
http://slidepdf.com/reader/full/condition-monitoring-knjiga 186/306
Vibr ation monitori ng 163
K c = 0 = 1 = 2
= 3 = 4
K c K c
K c K c
F igure 8.2 Radial mode shapes of a stator i n a cir cumferential dir ection
K L = 0 = 1
= 2 = 3
K L
K L K L
F igure 8.3 Radial mode shapes of a stator i n a longitudinal direction
natural frequency f 0 is given by
f 0 = 1
2π r mean
E
ρ
w y
w y + w t + w i + w w
1/2
(8.14)

8/20/2019 Condition Monitoring Knjiga
http://slidepdf.com/reader/full/condition-monitoring-knjiga 187/306
164 Conditi on monitor ing of rotati ng el ectri cal machines
where ρ is the density of the core, and w y , w t , w i and w w are the weights of the core
yoke, teeth, insulation and windings, respectively, r mean is the mean radius of the
core, excluding the teeth. For k c = 1, the natural frequency f 1 is given by
f 1 = f 0
2
1 + t 20 S
12 r mean2
w y
w y + w t + w i + w w
1/2
(8.15)
where t 0 is the radial thickness of the stator core annulus and S is a constant related
to the stiffness of the winding, insulation and slot components:
S = 1 + N s
2π J r mean
w t + w i + w w
w t
1
3+ t 0
2h t +
t 0
2h t
2a t h 3t (8.16)
where N s is the number of stator slots, J is the polar moment of inertia of the core, a t is the cross-section of area of the teeth, and h t is the tooth depth.
The higher natural frequencies, f m , may be calculated from
f m = f 0t 0m (m 2 − 1)G (m )
(2/3)r mean
(m 2 + 1)
(8.17)
where the function G (m ) is given by
G (m ) = 1 +
t 2012r 2mean
(m 2 − 1)
m 2
4 + w y M
w y +w t +w i +w w (m 2 + 1)
−1/2
(8.18)
It is clear that the calculation of the natural frequencies of complex mechanical
structures, as represented by the the stator core and frame of an electrical machine,
is a difficult matter. However, this could be resolved experimentally by carrying out
separate mobility tests of the stator and rotor components and then a mobility test of
the composite assembly. By these means it will be possible to determine the modes
of the structure.
8.2.3 Stator electromagneti c force wave
In order to anticipate changes in the stator core frame and winding vibrations due to
electrical or mechanical anomalies in the machine, it is important to determine the
exciting forces. The problem of calculating the forces exerted on the stator and rotor
reduces to calculating the flux density B in the airgap of the machine. This can be
achieved using numerical techniques, such as the finite-element method, and requires
that a solution be found to the following equation for the machine:
∇ × ∇ × B = σ
v × B − µ
∂ B
∂t
(8.19)
where σ is the electrical conductivity of the region, and v is the velocity of the rotor,
relative to the travelling flux wave produced by the stator. The solution of (8.19), even
in the two dimensions representing a cross-section in the radial and circumferential

8/20/2019 Condition Monitoring Knjiga
http://slidepdf.com/reader/full/condition-monitoring-knjiga 188/306
Vibr ation monitori ng 165
directions of the machine, requires significant computational effort if the slotting
of both rotor and stator are to be taken into account. If good accuracy is required,
however, it is the only suitable path to follow. Penman et al . [6] gave a detailed
explanation of the solution of (8.19) for a linear machine, using the finite-element
technique.
The finite-element method can be used to account for any distribution of wind-
ings and any radial or peripheral geometrical variations, simply by increasing the
complexity of the model. However, there are limits to the accuracy of finite-element
modelling determined by the accuracy of the precise manufacturing data. These meth-
ods are essentially numerical and therefore quantitative. A qualitative assessment
is often more valuable than a full analysis and this is readily achieved, in certain
circumstances, using simpler (although less accurate) methods.
If the rotor and stator surfaces are assumed to be smooth then it is possible to
solve (8.19) in the radial and circumferential plane analytically, provided the motion
term is neglected. This approach allows the effect of individual conductor currents to
be accounted for. Hague [7] and Stafl [8], both used separation of variable techniques
to calculate airgap flux densities for a variety of configurations.
Many authors have examined the important sources of unbalanced magnetic pull
(UMP) and the effect it has on vibration. In particular Binns and Dye [9] identify the
role of static eccentricity in the production of UMP. In addition, Swann [10] shows
how it is possible to calculate the harmonics introduced into the flux wave due to
rotor eccentricity. He does this by using a conformal transformation to re-centre the
rotor. A review of a considerable amount of previous work on UMP may be found inthe report by Rai [11].
Perhaps the simplest, generally useful method of gaining a qualitative assessment
of the flux waveform is that used by Yang [4]. Here the flux wave is calculated
by simply multiplying the stator magnetomotive force distribution (F 1) due to the
winding currents, by the permeance () of the airgap:
= F 1 (8.20)
Binns [12] suggested that this procedure had limited accuracy, but within the limita-
tions suggested by Lim [13] the technique is valuable, since it can easily accommodategeometrical effects and anomalies in winding arrangements. Williamson and Smith
[14] later proposed an analytical permeance-wave method for calculating the har-
monic impedances of a machine and, by use of harmonic equivalent circuits, it was
therefore possible to predict machine rotor torques. Williamson and other authors
have subsequently successfully used this method, sometimes incorporating finite-
element solutions, to allow for three-dimensional components that are not tractable
by the analytical method. Using such techniques it has been possible to analyse the
effects of winding faults and rotor eccentricity on the flux density in the airgap.
Vas made the point in his book [15] about the all-embracing nature of the elec-tromagnetic field in the energy conversion process, stressing the central importance
of the airgap flux density in monitoring electrical machines. This point relates to the
emphasis there has been to date in the published literature on the effect of the more
tractable faults on the airgap field, as mentioned in Chapter 3.

8/20/2019 Condition Monitoring Knjiga
http://slidepdf.com/reader/full/condition-monitoring-knjiga 189/306
166 Conditi on monitor ing of rotati ng el ectri cal machines
The permeance variation, taking into account the relative motion of the rotor with
respect to the stator, can be expressed in the form of an infinite series of harmonics.
If both the rotor and stator surfaces are slotted then the permeance wave has the form
(θ 1, t ) = ∞m =1
∞n =1
m ,n cos[mN r ωr m t − (mN r ± nN s )θ 1] (8.21)
with m ,n the peak amplitude of the permeance wave defined above, m and n are
integer slot harmonics, N s and N r are number of stator and rotor slots respectively,
and ωr m is the mechanical angular speed of the rotor.
Similarly the magetomotive force (MMF) of the stator, f 1, can be expressed as
an infinite series of space and time harmonics. The result, which can be found in
standard texts, is
f 1(t ) =∞=1
∞q =1
f s , , q cosωse t − qp θ 1 −
αs z
L
− φq
(8.22)
where f s , , q is the stator MMF wave components of the form NI with time harmonics
and q space harmonics, q is the order of the stator winding MMF space harmonic, is
the order of the supply time harmonics, ωse is the angular frequency of the electrical
supply, z is the longitudinal distance from the centre of the machine, L is the active
length of the core, αs is the skew angle of the stator, φq is the phase angle of the
stator MMF wave f s , , q , and p is the number of pole pairs.Similarly the rotor MMF, referred to the stator, can be expressed as
f 2(t ) =∞=1
∞q =1
f r , , q coss ωse t − kp θ 2 −
αr z
L
− φq
(8.23)
where s is the slip of the rotor with respect to the stator magnetic field, f r , , q is the
rotor MMF wave components of the form NI with time harmonics and k space
harmonics. The total MMF can be found by adding (8.22) and (8.23), and the flux
wave calculated by multiplying this sum by the result of (8.21).
Yang shows that the effect of eccentricity can be incorporated by modifying theexpression for the permeance wave (8.21). He proposes the following expressions for
dynamic and static eccentricity.
• Stator permeance variations, s ,ecc , due to static eccentricity:
s ,ecc =∞
n =1
0,ecc cos n θ 1 (8.24)
• Stator permeance variations, d ,ecc , due to dynamic eccentricity:
d ,ecc =∞
n =1
0,ecc cos(ωecc t − n θ 1) (8.25)
where ωecc is the angular velocity of the eccentricity.
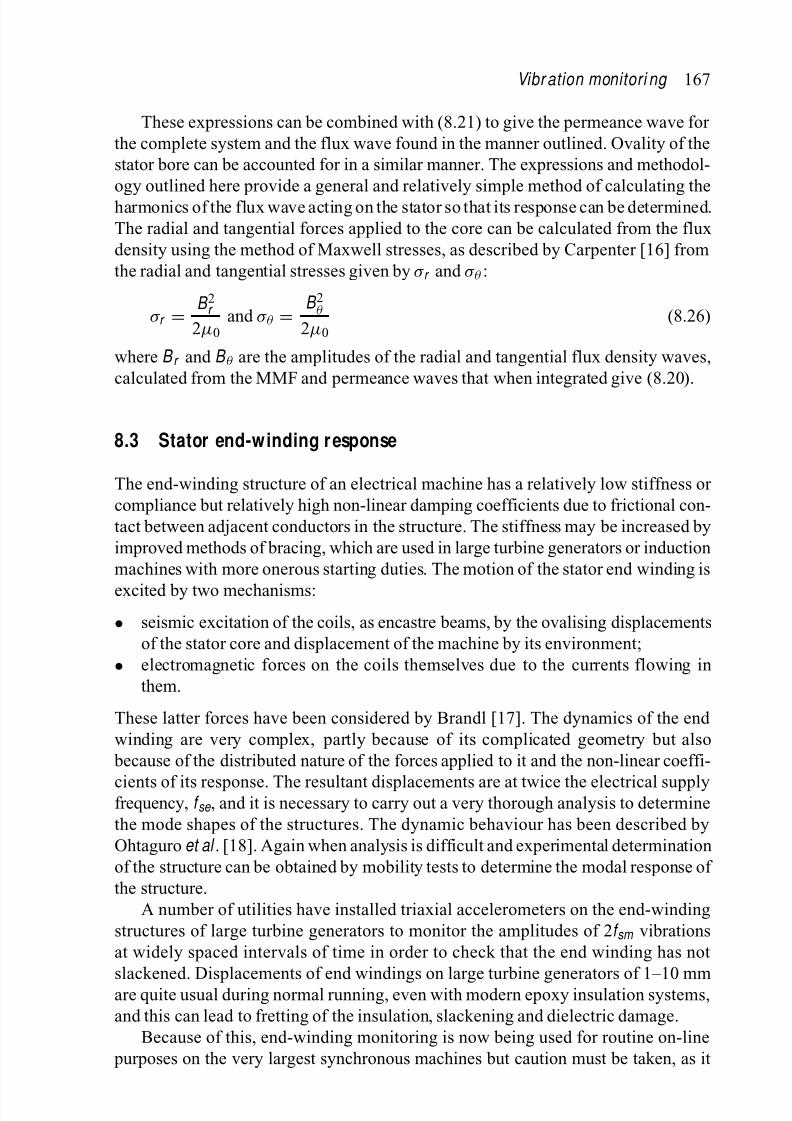
8/20/2019 Condition Monitoring Knjiga
http://slidepdf.com/reader/full/condition-monitoring-knjiga 190/306
Vibr ation monitori ng 167
These expressions can be combined with (8.21) to give the permeance wave for
the complete system and the flux wave found in the manner outlined. Ovality of the
stator bore can be accounted for in a similar manner. The expressions and methodol-
ogy outlined here provide a general and relatively simple method of calculating the
harmonics of the flux wave acting on the stator so that its response can be determined.
The radial and tangential forces applied to the core can be calculated from the flux
density using the method of Maxwell stresses, as described by Carpenter [16] from
the radial and tangential stresses given by σ r and σ θ :
σ r = B 2r 2µ0
and σ θ =B 2θ
2µ0(8.26)
where B r and B θ are the amplitudes of the radial and tangential flux density waves,
calculated from the MMF and permeance waves that when integrated give (8.20).
8.3 Stator end-winding r esponse
The end-winding structure of an electrical machine has a relatively low stiffness or
compliance but relatively high non-linear damping coefficients due to frictional con-
tact between adjacent conductors in the structure. The stiffness may be increased by
improved methods of bracing, which are used in large turbine generators or induction
machines with more onerous starting duties. The motion of the stator end winding is
excited by two mechanisms:
• seismic excitation of the coils, as encastre beams, by the ovalising displacements
of the stator core and displacement of the machine by its environment;
• electromagnetic forces on the coils themselves due to the currents flowing in
them.
These latter forces have been considered by Brandl [17]. The dynamics of the end
winding are very complex, partly because of its complicated geometry but also
because of the distributed nature of the forces applied to it and the non-linear coeffi-
cients of its response. The resultant displacements are at twice the electrical supplyfrequency, f se , and it is necessary to carry out a very thorough analysis to determine
the mode shapes of the structures. The dynamic behaviour has been described by
Ohtaguro et al . [18]. Again when analysis is difficult and experimental determination
of the structure can be obtained by mobility tests to determine the modal response of
the structure.
A number of utilities have installed triaxial accelerometers on the end-winding
structures of large turbine generators to monitor the amplitudes of 2f sm vibrations
at widely spaced intervals of time in order to check that the end winding has not
slackened. Displacements of end windings on large turbine generators of 1–10 mmare quite usual during normal running, even with modern epoxy insulation systems,
and this can lead to fretting of the insulation, slackening and dielectric damage.
Because of this, end-winding monitoring is now being used for routine on-line
purposes on the very largest synchronous machines but caution must be taken, as it

8/20/2019 Condition Monitoring Knjiga
http://slidepdf.com/reader/full/condition-monitoring-knjiga 191/306
168 Conditi on monitor ing of rotati ng el ectri cal machines
requires very specialist interpretation to determine from accelerometer signals where
end-winding slackening has occurred so that remedial action can take place. However,
on smaller machines, for example induction motors, the displacements are not so
large, but do require special techniques for prediction [19], and for measurement
[20], particularly during starting when winding currents are very large.
8.4 R otor r esponse
We now consider the motion of a rotor in response to:
• transverse force excitation, due to self-weight, mechanical unbalance, shaft
whirling, dynamic or static electromagnetic UMP due to eccentricity or a
combination of all four;• torsional torque excitation, due to the prime mover drive or electromagnetic torque
reaction.
Transverse forces are due to asymmetries in the machine, while torsion is primarily
due to the driving torque; however, both may be affected by electrical or mechanical
faults in the machine itself or electrical or mechanical system disturbances outside
the machine. An important issue is the response of the machine to these applied
excitations. There will also be a coupling between torsional and transverse effects
due to the transfer function or stiffness between these axes of the machine, so torsionaleffects, like current faults in rotor and stator windings, can cause transverse effects
like vibrations, and vice versa.
8.4.1 Tr ansver se response
8.4.1.1 R igid rotor s
In order to examine the response of a rotor to unbalanced forces a distinction must be
drawn between rigid and flexible rotors. Rigid or short rotors may be considered as
a single mass acting at the bearings, and Wort [21] showed that the displacement, u ,of the rotor and its bearings can be modelled by the differential following equation:
(M + M s )d 2u
dt 2 + c
du
dt + ku = mr w r m
2 (8.27)
where M is the mass of the rotating system, m is the equivalent unbalance mass on
the shaft, M s is the support system mass, r is the effective radius of the equivalent
unbalanced mass, c is the damping constant of the support system, and k is the stiffness
of the support system
For sinusoidal motion the peak displacement, ˆu , is given by the solution to (8.27),
and is
u = mr (ωr m /ω0)2
((M + M s )
(1 − (ωr m /ω0)2)2 + 4D 2(ωr m /ω0)2)(8.28)

8/20/2019 Condition Monitoring Knjiga
http://slidepdf.com/reader/full/condition-monitoring-knjiga 192/306
Vibr ation monitori ng 169
with ω0, the natural frequency of the rotor support system, and D , the damping factor,
given by
ω0 = k
(M + M s )
D = c
2√
k (M + M s
If the displacement is divided by the specific unbalance e , given by
e = mr
M (8.29)
then the behaviour of the displacement, u , as a function of frequency is as shown in
Figure 8.4. The degree of residual unbalance is denoted by the quantity G =
e ωr m
and the permissible limits are provided by international standard ISO1940-1:2003
[22] as shown in Figure 8.5.
1 w
w o
1
e
e
u
F igure 8.4 D isplacement per specifi c unbalance ver sus normal ised frequency
For electrical machinery the appropriate quality grades are towards the lower end
of the values shown in Figure 8.5. For example, G = 2.5 is generally applicable to
machines of all sizes, and G =
1.0 for special requirements.
8.4.1.2 Flexible r otor s
For long, slender rotors operating at higher speeds, as in two-pole machines, particu-
larly large turbine generators that have restricted rotor radii, the foregoing analysis is

8/20/2019 Condition Monitoring Knjiga
http://slidepdf.com/reader/full/condition-monitoring-knjiga 193/306
170 Conditi on monitor ing of rotati ng el ectri cal machines
0.1
30 30,000300 3000
Rotational frequency, Hz
R e s i d u a l u n b a l a n c e , µ m
1.0
10
100
G = 2.5
G = 1.0
Fi gure 8.5 Extract from ISO 1940-1:2003 per missibl e li mits to residual unbalance
insufficient and the distribution of unbalance must be considered. Again Reference
[21] shows how it is possible to calculate the natural frequencies of general problems
of a rotor with a flexural rigidity EJ , and mass per unit length m , which are both
functions of axial location z . The displacement u , for any z , is given by the solution of
∂2
∂z 2EJ (z )
∂2u
∂z 2− ω
r m
2m (z )u =
∞n =1
f n
(8.30)
where f n is the unbalance forcing function and
2π f n = ωn =
m (z )g 2n (z )dz (8.31)
with g n (z ) the n th solution of equation (8.30). The solution for coupled systems
comprising several rotors, consisting of the electrical machine and the machine it is
driving or driven by, is extremely complex. It is usual to assume that the stiffness of
couplings between rotors is low and rotors may be considered to be decoupled fromone another, allowing them to be considered individually as described earlier.
The mode shapes for the rotor shafts will also depend upon the nature of the
bearing supports for the shafts. For example Figure 8.6 shows the effect of hard and
soft bearings on the first and second modes for a single flexible rotor.

8/20/2019 Condition Monitoring Knjiga
http://slidepdf.com/reader/full/condition-monitoring-knjiga 194/306
Vibr ation monitori ng 171
Mode 1 Mode 1
Mode 2 Mode 2
Soft bearings Hard bearings
F igure 8.6 Rotor mode shapes for hard and soft beari ngs
The results for higher modes are readily deduced from these examples. For nearly
all electrical machine vibrations, for which monitoring would be appropriate, the bearings may be considered to be hard, although Smart et al . [23] have shown how
the influence of foundations can be taken into account when studying the transverse
vibration behaviour of a large machine.
The international standard limits shown in Figure 8.5 are applicable to rigid rotors
operating well below their critical speed. For flexible rotors it has been suggested
that the allowable eccentricity can be modified so that the same standard applies.
Dimentberg [24] uses the correction
e flexible < e r ig id
1 − ωr m
ω02
(8.32)
where ω0 is the first critical speed of the rotor. This, however, is only applicable for
rotors running at less than ω0; that is, a hypocritical machine. When the machine is
operating above ω0 it is a hypercritical machine.
8.4.2 Torsional response
The torsional oscillatory behaviour of a large rotating electrical machine and its driven
machine or prime mover can be complicated. For example, in a large turbine generator the electrical machine links a complex prime mover to a large interconnected electrical
network in which large quantities of energy are being transported. The possibility of
forced torsional oscillation in the rotor of a turbine generator is significant because
of its great length and relatively small radius. The nature of such oscillations will

8/20/2019 Condition Monitoring Knjiga
http://slidepdf.com/reader/full/condition-monitoring-knjiga 195/306
172 Conditi on monitor ing of rotati ng el ectri cal machines
depend upon the form of the disruptions that occur in the mechanical or the electrical
system. Disturbances in the electrical system are particularly important since it has
been reported that they can limit shaft life due to fatigue [25–27].
J 1
C 1
T i 1 T o 1
C 12
K 12
J 1
C 2
T i 2 T o 2
C 23
K 23
J 3
C 3
T i 3 T o 3
C 34
K 34
J 4
C 4
T i 4 T o 4
C 4−1
K 4−1,4
Fi gure 8.7 A lumped parameter model to deter mine tor sional response
Cudworth et al . [28] have developed a computational model for a turbine gen-
erator shaft that is very general, and allows a wide variety of fault conditions to be
investigated. The electrical system is represented in phase variables and takes into
account as many static and rotating electrical elements as may be required. For the
mechanical system the lumped parameter model illustrated in Figure 8.7 is used. The
shaft damping and steam damping effects on the turbine blades are represented by
variable viscous dampers and material damping is also included.The waveform shown in Figure 8.8 is representative of the results achievable using
a model such as the one described earlier. This shows the oscillations in shaft torque
0
LP2 – Generator shaft torque transient
S h a f t t o r q u e ,
p . u .
0.0 2.8
3.0
2.5
0.5
2.0
1.5
1.0
0.5
0.2 0.4 0.6 0.8 1.0 1.2 1.4 1.6 1.8 2.0 2.2 2.4 2.6Time, seconds
3.0
Fi gure 8.8 Cal culated shaft torque tr ansi ents using a l umped parameter model, the dots showing the per missibl e li mits of er ror in the calculati on

8/20/2019 Condition Monitoring Knjiga
http://slidepdf.com/reader/full/condition-monitoring-knjiga 196/306
Vibr ation monitori ng 173
of a 500 MW generator following a phase-to-phase short circuit on the transmission
system. The lower level oscillations persist for some considerable time after the major
transient has largely died away and this has obvious implications for the fatigue life
of the shaft. It may be advisable to monitor such events, and methods for doing so
will be discussed later in this chapter.
8.5 Bear ing response
8.5.1 General
Rotor vibration force is transmitted to the stator via the airgap magnetic field and the
bearings in parallel. It is therefore important to consider the response of the bearings
to that vibration force so that its effect is not confused with vibrations generated by
faults within the bearings themselves. Rotor vibration force will cause vibration of
the rotor relative to the housing and an absolute vibration of the bearing housing. This
action must be considered for both rolling element bearings and oil-lubricated sleeve
bearings.
8.5.2 Roll ing element beari ngs
A schematic view of a typical rolling element bearing is shown in Figure 8.9 and
these are fitted to machines generally below 300 kW in output, which constitute the
vast majority of electrical machines.
Housing
Inner race
Roller elements
Shaft
Outer race
Cage
Vibrationaccelerometer
Shock pulsetransducer
F igure 8.9 Roll ing element beari ng assembly

8/20/2019 Condition Monitoring Knjiga
http://slidepdf.com/reader/full/condition-monitoring-knjiga 197/306
174 Conditi on monitor ing of rotati ng el ectri cal machines
The failure of rolling element bearings is the most common failure mode associ-
ated with smaller machines. Because of their construction, rolling element bearings
generate precisely identifiable vibration frequencies. Also, since the oil or grease
film is very thin, the relative motion between the housing and the shaft is small. It
is therefore possible to detect on the stator side the vibrations associated with the
bearings using an accelerometer mounted directly on the bearing housing, ωsm .
The characteristic frequencies of rolling element bearings depend on the geomet-
rical size of the various elements, and can be found in many texts (see Collacott [29]
for example). Table 8.1 summarises these frequencies and their origins.
Besides the frequencies given in Table 8.1, there will also be higher frequencies
generated by elastic deformation of the rolling elements themselves, and the excita-
tion of the natural modes of the rings that comprise the inner and outer races. These
effects will, however, be secondary to the principal components defined here. The
magnitudes of the components given in Table 8.1 are often lost in the general back-
ground noise when the degree of damage is small, but because of their precise nature
they present an effective route for monitoring progressive bearing degradation. A
simple instrument can be devised using an accelerometer mounted on the bearing
housing to detect the amplitude of vibration at these characteristic frequencies. Once
the characteristic frequencies have been calculated it is possible to enhance the perfor-
mance of the instrument by the use of highly selective filters and weighting functions,
so as to be able to identify bearing faults at an earlier stage.
Table 8.1 Char acter i sti c transver se mechanical angular fr equencies produced by rol l ing element bear ings
Fault Stator transverse mechanical Comment
frequency, w sm , rad/s
Outer raceωsm
= n b
2
ωr m 1 − d b
D b
cosφ Rolling element passing
frequency on the outer race
Inner raceωsm = n b
2ωr m
1 + d b
D b cosφ
Rolling element passing
frequency on the inner
race
Rolling elementωsm =
D b
2d b ωr m
1 −
d b
D b
2cos2 φ
Rolling element spin
frequency
Train faultωsm
=
1
2
ωr m 1 −
d b
D b
cosφ Caused by an irregularity
in the train
Definitions: n b = number of rolling elements; ωr m = 2πN 60
mechanical rotational frequency,
Hz; w sm = mechanical vibration frequency on the stator side; N = rotational speed in rev/min; d b =rolling element diameter; D b = rolling element pitch; f = rolling element contact angle with races.

8/20/2019 Condition Monitoring Knjiga
http://slidepdf.com/reader/full/condition-monitoring-knjiga 198/306
Vibr ation monitori ng 175
When monitoring the vibration due to rolling element bearings it is prudent to
obtain a good vibration baseline. This is because once the bearing becomes worn
significantly the vibration spectrum it emits becomes more random again, although
at a higher baseline than for a good bearing. If no baseline is available, no history
has been built up and the background noise has risen, then it will be impossible to
detect specific faults. Machinery will also have a degree of unbalance, which will
modulate the characteristic frequencies of the bearings and produce side bands at
the rotational frequency. Vibration monitoring is highly suitable for rolling element
bearings, although it is complex but has gained wide acceptance throughout the
industry. Stack et al . [30] give a description of the process to classify rolling element
bearing faults.
8.5.3 Sleeve beari ngs In sleeve bearings, the shaft is supported by a fluid film pumped, by the motion of
the shaft, at high pressure into the space between the bearing liner and the shaft.
Because of the compliance of the oil film and the limited flexibility of the bearing
housing, vibrations measured at the housing may be of low amplitude. Also, because
the liners of the bearing will inevitably be a soft material such as white metal, small
faults are very difficult to identify by measuring the absolute vibration of the hous-
ing. These factors point to the use of displacement transducers as being the most
effective tool, but they will only be useful at lower frequencies. Higher frequen-
cies; for example multiples of the rotational frequency, are best measured with anaccelerometer mounted on the bearing housing. It is worth bearing in mind, however,
that as the bearing load increases due to an increase in rotor load, the oil film thick-
ness decreases with a commensurate decrease in bearing flexibility. This increases
the vibration detectable at the bearing housing and allows more information to be
derived from the measurement.
An important concern for sleeve bearings is the onset of instability in the oil film.
This can result in oil whirl and subsequently oil whip, in response to unusual loading
of the bearing. Figure 8.10 shows the forces acting upon the shaft in a sleeve bearing,
and illustrates that the shaft is supported by a wedge of oil just at the point of minimumclearance.
The oil film is circulating at a speed of approximately half the shaft speed, but
because of the pressure difference on either side of the minimum clearance point, the
shaft precesses at just below half speed. This motion is termed oil whirl and is a direct
result of the pressure difference mentioned earlier, which comes about due to viscous
loss in the lubricant. Instabilities occur when the whirl frequency corresponds to the
natural frequency of the shaft. Under such conditions the oil film may no longer be
able to support the weight of the shaft. Details of the mechanisms involved in oil
whirl and its development into the more serious instability called oil whip (whichoccurs when the shaft speed is twice its natural frequency) are given by Ehrich and
Childs [31]. Care must be taken, therefore, that either the machine does not operate
at a speed higher than twice the first critical speed of the rotor shaft, or if it must,

8/20/2019 Condition Monitoring Knjiga
http://slidepdf.com/reader/full/condition-monitoring-knjiga 199/306
176 Conditi on monitor ing of rotati ng el ectri cal machines
Low pressure fluid Shaft rotation
Minimum
clearance point
FP
R
W
High presure fluid
R React ion
F Destabil ising components
P Pressure
W Whir l force
Vibrationaccelerometer
Y-axisproximeter
axis axisX-axisproximeterroximeterproximeter
Fi gure 8.10 Forces acting upon a shaft in a sleeve beari ng
then oil whirl must be suppressed. The following frequency, ωsm , is identified in the
literature as caused by oil whirl:
ωsm = (0.43 to 0.48)ωr m (8.33)
8.6 M onitor ing techniques
Now that we have discussed the ways in which transverse and torsional vibration can
be produced in electrical machines, and we have outlined, in Chapter 3, the principal
analytical tools at our disposal to measure the effect of vibration, we can proceed to
show how vibration can be used to monitor the health of machines.
For electrical machine condition monitoring it is important to recognise that
mechanical and electrical faults excite the machine structure in different ways. For example:
• Mechanical faults like self-weight, mechanical unbalance and shaft whirling will
excite transverse motion in the machine frame, detectable by vibration sensors.

8/20/2019 Condition Monitoring Knjiga
http://slidepdf.com/reader/full/condition-monitoring-knjiga 200/306
Vibr ation monitori ng 177
• Dynamic or static electromagnetic UMP due to eccentricity, which may be
caused by bearing wear, will also excite transverse motion in the machine frame,
detectable by vibration sensors.
• Electrical faults in stator or rotor windings will excite torsional motion in the
shaft that will be detectable in the torque signal but not necessarily by vibration
sensors, unless the activity is coupled to transverse motion by asymmetries in the
machine frame.
Because many faults can be identified by more than one method, and because the
internationally agreed standards and limits relate not to specific items of plant, but to
the form of analysis to which measurement is subjected, we shall use the measurement
treatment as the generic identifier. We shall also be principally concerned with so
called on-line monitoring; that is, we are interested in techniques that can be applied
to machinery that is running and in the predictive power of the monitoring rather thansimply the ability to merely intercept faulty conditions when they become serious
enough to cause damage. There may often be some commonality between these
objectives.
8.6.1 Overal l level monitori ng
This simple form of monitoring is the most commonly used technique, although
as an aid to diagnosis of faults in electrical machines its efficacy is limited. The
measurement taken is simply the rms value of the vibration level on the stator sideof the machine over a selected bandwidth. The usual bandwidth is 0.01–1 kHz or
0.01–10 kHz, and in practice the measured parameter is usually vibration velocity
taken at the bearing cap of the machine under surveillance. The technique has found
favour because over the years a considerable experience has been built up to relate
overall vibration monitoring levels to machinery failure modes. This has resulted in
the publication of recommended vibration standards for running machinery. These
standards do not give diagnostic information, but simply indicate the overall health of
machinery at a given vibration level. Many operators use such information to develop
a strategy for maintenance scheduling.The guidance given in the past by the German Vibration Standard VDI 2056 [32]
is illustrated in Table 8.2; however, the relevant up-to-date standard is ISO 10816-
1:1995 [33]. These criteria are based solely on machine rating and support systems,
and utilise a 0.01–1 kHz bandwidth. Essentially it recommends that when vibration
levels change by 8 dB or more care must be exercised, and when the change exceeds
20 dB action should follow. These limits can be relaxed, however, if a subsequent
frequency analysis shows that the cause of the increase in level is due to a rise in the
higher frequency components. In such cases changes of 16 dB and 40 dB respectively
may be more appropriate. A section of the specification, as it relates to electricalmachines, is given in Table 8.3. Group K signifies smaller, quiet running plant, group
M is medium-sized plant and group G is the larger, noisier plant. This reflects that
electrical machines, when uncoupled from their prime mover or driven plant, are
generally low-noise, low-vibration machines.

8/20/2019 Condition Monitoring Knjiga
http://slidepdf.com/reader/full/condition-monitoring-knjiga 201/306
178 Conditi on monitor ing of rotati ng el ectri cal machines
Table 8.2 Vibr ation standard VD I 2056
Vibration Vibration Group K Group M Group G
velocity, velocity, dB,mm/s rms ref 10−6 mm/s
45 153 Not permissible Not permissible Not permissible
28 149 20 dB (×10)
18 145
11.2 141 Just tolerable
7.1 137 Just tolerable
4.5 133 Just tolerable Allowable
2.8 129 Allowable
1.8 125 Allowable Good large1.12 121 Good medium machines with
0.71 117 Good small machines rigid and heavy
0.45 119 machines up 15–75 kW or up foundations
0.28 109 to 15 kW to 300 kW on whose natural
0.18 105 special frequency
foundations exceeds machine
speed
Table 8.3 Vibr ation li mits for maintenance as given in CDA / MS / NVSH 107
Type of plant New machines Worn machines
(full-load operation)
100–1 000 1000–10 000 Service level, Immediate
hour life, mm/s hour life, mm/s mm/s overhaul∗, mm/s
Boiler auxiliaries 1.0 3.2 5.6 10.0
Large steam turbine 1.8 18.0 18.0 32.0
Motor-generator set 1.0 3.2 5.6 10.0
Pump drives 1.4 5.6 10.0 18.0
Fan drives 1.0 3.2 5.6 10.0
Motors in general 0.25 1.8 3.2 5.6
∗These levels must not be exceeded in any octave band
Another useful set of criteria was given in the Canadian Government Specifica-
tion CDA/MS/NVSH107 [34], which is no longer issued. This specification relates primarily to measurements taken on bearings, and it is here that overall level mea-
surement is most commonly employed. This specification has a broader bandwidth
than VDI 2056, namely 0.01–10 kHz, but still relies on overall velocity vibration
measurement.

8/20/2019 Condition Monitoring Knjiga
http://slidepdf.com/reader/full/condition-monitoring-knjiga 202/306
Vibr ation monitori ng 179
The strength of the overall vibration level technique is its simplicity. It requires
only the simplest of instrumentation applied to the stator side of the machine, and
because of this it is a common feature in many installations. It also provides an ideal
method for use with portable instruments, but it makes heavy demands upon technical
personnel. The sensitivity of the technique is also low, particularly when a fault is
at an early stage, and there is little help on offer to aid diagnosis without further
sophisticated techniques being employed.
The Neale Report [35] indicates that it may be possible to effect a limited diagnosis
by taking two overall level measurements: V a , the peak vibration velocity in mm/s;
and X , the peak to peak displacement in µm. These quantities are then used to define
the parameter F as follows:
F
= 0.52NX
V a
(8.34)
where N is the speed in rev/min of the machine. The interpretations in Table 8.4 are
then appropriate.
Table 8.4 Di agnosis using overall level measurements based on the Neale Repor t [ 35]
Value of F Trend Fault
<1 Decreasing Oil whirl
=1 Steady Unbalance, indicative of
eccentricity or perhaps
faulty rotor
>1 Increasing Misalignment, static
eccentricity
8.6.2 Fr equency spectrum monitor ing
The key to vibration monitoring diagnostics is the frequency spectrum of the signal,
and the past decade has seen a remarkable increase in the range and sophistication
of techniques and instrumentation available for spectral analysis. There are various
levels of spectral analysis commonly used, and these may be regarded as a continuum
extending from the overall level reading to the narrow band with constant frequency
bandwidth presentation, as shown in Figure 8.11.
In the octave band and third-octave band techniques the spectrum is split into
discrete bands, as defined by Figure 8.12. The bands are, by definition, such that when
the frequency is scaled logarithmically the bands are of equal width. The constant percentage band is one which is always the same percentage of the centre frequency,
while the constant frequency bandwidth is an absolutely fixed bandwidth form of
analysis that can give very high resolution, provided the instrumentation is of a
sufficiently high specification.

8/20/2019 Condition Monitoring Knjiga
http://slidepdf.com/reader/full/condition-monitoring-knjiga 203/306
180 Conditi on monitor ing of rotati ng el ectri cal machines
Wide band Narrow band
Overall
level
Octave
band
1 / 3 Octave
band
Narrowconstant
% of centre
frequency
Narrowconstant
frequency
bandwidth
Fi gure 8.11 Levels of spectral analysis
1 / 3
Octave
Octave
Frequency
1214
18
2836.5
5671
121141
224282
450560
8901120
17002240
35004000
7100
8900
22.5
45
90
180
365
710
1400
2000
5600
1120
Fi gure 8.12 Octave and third-octave bands
The effect that the change of bandwidth has on the processed signal output
highlights precisely why the narrow-band technique is superior to the overall level
technique as a diagnostic tool. For example, a certain transducer may provide an
output power spectral density output that may be interpreted in the ways shown in
Figure 8.13. It is apparent that the components around frequency f 1 dominate the
overall level reading, and the shape of the third octave result. Important changes,say at f 2 and f 3 or the presence of other components, could go largely unnoticed,
except by the use of narrow-band methods. This is crucial because the flexibility of
the mechanical system may be such that important components are masked by those
closer to resonances in the mechanical structure of the machine.

8/20/2019 Condition Monitoring Knjiga
http://slidepdf.com/reader/full/condition-monitoring-knjiga 204/306
Vibr ation monitori ng 181
V i b r a t i o n v e l o c i t y ,
w a v e f o r m ,
P S D
Overall level
Octave band
Narrow bandfrequency
f3Frequency, Hz
f1 f2
1 / 3
F igure 8.13 Effect of change in bandwi dth on spectral response
The narrow band spectrum also allows the operator to trend the condition of the
machine most effectively. This requires that an initial baseline spectrum is taken and
subsequent spectra are compared with it. The use of digitally derived spectra meansthat the results of such comparisons can be computed quickly since the spectra reduce
to a simple sequence of numbers at discrete frequencies, as closely spaced as required
within the limitations of the instrumentation. In this way criteria such as VDI 2056 can
be applied for each frequency. Because of the large amounts of data generated using
narrow-band methods, it is frequently convenient to predetermine the operational
limits, on the basis of one of the vibration standards, and to construct an operational
envelope around the baseline spectrum. This can take account of the wider limits
allowable at higher frequencies, and can be used to automatically flag warnings
when maintenance limits are reached. The basis of this technique is illustrated inFigure 8.14, where the baseline is set at the maximum value of vibration expected
and the operational envelope at which trips are initiated, is set above this.
The techniques described thus far in this section are relatively general. In order to
identify not just unsatisfactory overall performance, but to pinpoint specific problems,
it is necessary to examine discrete frequencies, or groups of frequencies, as indicated
earlier in this chapter. Induction motors in particularrequire a high degree of frequency
resolution applied to their vibration signals since the speed of rotation is close to the
electrical supply frequency. This tends to generate side bands spaced at s and 2s
around the harmonics of the supply frequency, where s is the slip frequency of themachine.
The application of vibration monitoring for fault diagnosis in large turbine gen-
erators has been described by Mayes [36] and computer analysis techniques that can
be applied off-line to vibration data collected on-line are described by Herbert [37].

8/20/2019 Condition Monitoring Knjiga
http://slidepdf.com/reader/full/condition-monitoring-knjiga 205/306
182 Conditi on monitor ing of rotati ng el ectri cal machines
V i b r a t i o n v e l o c i t y ,
w a v e f o r m P
S D
Operation limit
Monitored record
Base line
Frequency, HzHigher frequency limits usedLower frequency limits used
Fi gure 8.14 Oper ational envelope around a spectral response
Some of the detail of analysis and the effect of the foundation response to the machine
excitation is given by Smart et al . [38].
8.6.3 Faul ts detectable from the stator force wave
Using the techniques described in the previous section and verifying by measurement,
it has been shown that UMP can excite stator side vibration components at one, two
and four times the supply frequency. Dynamic unbalance and coupling misalignment
also produce this effect [11,39].
The last reference also suggests that even orders of the fundamental occur in
the frame vibration spectrum due to inter-turn winding faults on the stator [39]. The
authors use the principal slot harmonics as an indicator of eccentric running. They
also use the transverse mechanical angular frequency, ωsm , measured on the stator frame, excited by radial forces, given by Yang [4] and others as
ωsm = ωse
(nN r ± k e )
(1 − s )
p ± q
(8.35)
where n is an integer, q is the space harmonic of the stator winding MMF, 1, 3, 5, 7
…, k e is the so-called eccentricity order number, which is zero for static eccentricity
and a low integer value for dynamic eccentricity.
They report tests on a machine with a 51-slot rotor (N r ) and a four-pole, three-
phase stator, which exhibits an increase in frame vibration levels of 25 dB and 17 dBat the frequencies 1104 Hz and 1152 Hz due to the introduction of 50 per cent dynamic
eccentricity.
There are strong indications that frame vibration can be used to monitor a variety
of fault conditions, particularly in induction machines. Caution must be exercised,
8/20/2019 Condition Monitoring Knjiga
http://slidepdf.com/reader/full/condition-monitoring-knjiga 206/306
Vibr ation monitori ng 183
however, for vibration transmitted from adjacent or coupled plant may excite a natural
mode in the machine, while a forced component from a fault within the machine may
be sufficiently different from any natural frequency to cause only a slight response.
This effective signal-to-noise ratio for the detection of faults by frame-borne
vibration can be quantified using the notion of system flexibility or mobility, the
flexibility being regarded as the sum of the modal responses of the machine, and
the vibration experienced by the machine is the product of the exciting force wave
and this flexibility. Smart et al . [38] give an explanation of the interaction of the
foundation response of a turbine generator to the exciting effect of unbalance during
a rundown.
A number of authors have reported the identification of various vibrational fre-
quencies associated with faults in induction machines, including Rai [11], Dorrell
et al . [39], Hargis [40] and Nandi et al . [41]. It has been suggested by Rai [11] that,
on a machine supplied at f se = 50 Hz, vibration at or near 50, 100 and 200 Hz is
indicative of eccentricity, but the picture is confused because other anomalies also
manifest themselves by the production of such frequencies, for example misalign-
ment and dynamic unbalance. Dorrell et al . [39] showed that on a machine supplied
at f se = 50 Hz, the stator frame vibration will exhibit 100, 200 and 300 Hz com-
ponents due to an inter-turn winding fault or supply voltage unbalance, including
single phasing. They also show that higher-order harmonics occur in the stator frame
vibration due to eccentricity, as derived from (8.35). However, the exact arrangement
of the drive and the nature of the coupled load may be of critical importance, since
transmitted vibration may mask the frequency that one is hoping to measure.Vibration can occur in electrical machinery as a result of both electrical and
mechanical action. Finally, Trutt et al . [42] recently carried out a theoretical review
of the relationships that should exist between electrical winding parameters and the
mechanical vibration of AC machine elements under normal and faulted operating
conditions. Table 8.5 has been compiled to distil the information to be found in these
various references.
8.6.4 Torsional oscill ation monitori ng
As we have seen previously in Section 8.4.2, there may be a specific need to moni-
tor the torsional behaviour of a long, thin shaft such as on a turbine generator. The
direct approach to this problem would be to mount suitable strain gauges on the shaft,
together with suitable telemetry, to transmit the gauge output from the rotating refer-
ence frame. This has only been done for experimental purposes and is not appropriate
for long-term use owing to the harsh operational conditions the transducers would
need to withstand. An indirect method of monitoring the torsional responses of shafts
have been outlined by Walker et al . [26], in which the twist of the shaft system is
measured by comparing the angular displacement of the non-drive end of the high pressure turbine shaft with that of the non-drive end of the generator exciter, see
Fig. 8.15. The airgap torque produced by the machine is calculated directly from
the monitored electrical quantities. The monitor has a modular construction, the two
principal elements being concerned with the capture of the mechanical, or torque

8/20/2019 Condition Monitoring Knjiga
http://slidepdf.com/reader/full/condition-monitoring-knjiga 207/306
T a b l e 8 . 5
M e c h a n i c a l f r e q u e n c y c o m p
o n e n t s r e l a t e d t o s p e c i f i c m a c h i n e f a u l t s
R o t a t i o n a l a n g u l a r
f r e q u
e n c y o f t h e r o t o r ,
ω m ,
r a d / s
T r a n s v e r s e v i b r a t i o n a n g u l a r
f r e q u e n c y o n t h e s t a t o r , ω s m , r a d / s
C o m m e n t s
M e c h a n i c a l
f a u l t s
O i l w
h i r l a n d w
h i p
i n s l e e v e
b e a r i n g s
—
ω s m
= ( 0
. 4 3 t o 0 . 4 8 ) ω r m
E q u a t i o n
( 8 . 3 3 ) . P r e s s u r e - f e
d l u b r i c a t e d
b e a r i n g s o n l
D a m a g e
i n r o l l i n g
e l e m e n t
b e a r i n g s
—
ω s m
= n b
2
ω r m
1 −
d b D b
c o s φ
ω s m
= n b
2
ω r m
1 +
d b D b
c o s φ
ω s m
= D
b
2 d b
ω r m
1 −
d b D b
2
c o s 2 φ
ω s m
= 1 2 ω r m
1 −
d b D b
c o s φ
C o m m o n s o u r c e o f v i b r a t i o n .
A l s o f r e q u e n c i e s i n t h e r a n g
e 2 – 6 0 k H z
d u e t o e l e m e n t r e s o n a n c e .
R o l l i n g e l e m e n t
b e a r i n g f a u
l t s c a n a l s o
b e d i a g n o s e d b y s h o c k p u l s e m e t h o d
T a b l e
8 . 1
S t a t i c m
i s a l i g n m e n t
o f r o t o r s h a f t
i n a
s y n c h r o n o u s
m a c h i n e
ω r m
=
ω s e / p
ω s m
= 2 p ω r m
C a u s e s s t a t i c e c c e n t r i c i t y
U n b a l a n c e d m a s s
o n r o t o r o f a
s y n c h r o n o u s
m a c h i n e
ω r m
=
ω s e / p
ω s m
= ω
r m
V e r y c o m m o n .
U n b a l a n c e c a u s e s
d y n a m i c e c c e n t r i c i t y
o f t h e r o t o r
( s e e b e l o w )
D y n a m
i c
e c c e n t r i c i t y i n a
s y n c h r o n o u s
m a c h i n e
ω r m
=
ω s e / p
ω s m
= ω
r m
D y n a m
i c e c c e n t r i c i t y c a u s e s
U M P i n a n
e l e c t r i c a l m a c h i n e
( c o n t i n u e d )

8/20/2019 Condition Monitoring Knjiga
http://slidepdf.com/reader/full/condition-monitoring-knjiga 208/306
R o t a t i o n a l a n g u l a r
f r e q u
e n c y o f t h e r o t o r ,
ω m ,
r a d / s
T r a n s v e r s e v i b r a t i o n a n g u l a r
f r e q u e n c y o n t h e s t a t o r , ω s m , r a d / s
C o m m e n t s
D y n a m
i c
d i s p l a c e m e n t o f
s h a f t i n b e a r i n g
h o u s i n g i n a
s y n c h r o n o u s
m a c h i n e
ω r m
=
ω s e / p
ω s m
= ω
r m , 2 ω r m
. . .
C a u s e s
d y n a m i c e c c e n t r i c i t y .
G e n e r a t e s a c l i p p e d t i m e w a
v e f o r m ,
d u e t o s h a f t m o t i o n
b e i n g l i m
i t e d b y
b e a r i n g c o n s t r a i n t , t h e r e f o r e
p r o d u c e s a
h i g h n u m
b e r o f
h a r m o n i c s
G e n e r a l e x p r e s s i o n
f o r s t a t i c a n d
d y n a m i c
e c c e n t r i c i t y i n a n
i n d u c t i o n m a c h i n e
ω r m
=
( 1 −
s ) n ω s e / p
ω s m
= ω
r m [ ( n N r ±
k e ) ( 1 −
s ) ±
p k ]
E q u a t i o n
( 8 . 3 5 ) . S i d e b a n d s a t p l u s o r
m i n u s s l i p
f r e q u e n c y m a y o c c u r a n d
c o m p o n e n t s
d u e t o
U M P ( s e e a b o v e )
C o m m u t a t o r
f a u l t s
i n D C m a c h i n e
ω s m
= 2 p k c ω r m
f o r l a p w o u n d
ω s m
= 2 k c ω r m
f o r w a v e w o u n d
U n b a l a n c e d r o t o r c o m p o n e n
t s a l s o
g e n e r a t e d
E l e c t r i c a l
f a u l t s
B r o k e n r o t o r
b a r i n
a n i n d u c t i o n
m a c h i n e
ω r m
±
2 n s ω s e
p
ω s m
=
ω r m
±
2 n s ω s e
p
D i f f i c u l t t o
d e t e c t b e c a u s e o
f s m a l l
a m p l i t u d e .
C u r r e n t , s p e e d o r
l e a k a g e f i e l d
h a v e
b e t t e r d e t e c t i o n l e v e l s
S t a t o r w
i n d i n g
f a u l t s i n d u c t i o n a n d
s y n c h r o n o u s
m a c h i n e s
ω s m
= p ω r m , 2 p ω r m , 4 p ω r m
. . .
P r o b l e m s c a n
b e i d e n t i f i e d a s o f
e l e c t r i c a l o r i g i n
b y r e m o v i n g s u p p l y
a n d i d e n t i f y i n g c h a n g e .
C a n n o t
d i f f e r e n t i a t e w
i n d i n g
f a u l t t y p e s
o n v i b r a t i o n a l o n e , c u r r e n t m
o n i t o r i n g
a l s o n e c e s s a r y
D e f i n i t i o n s : ω s
m
=
m e c h a n i c a l v i b r a t i o n
f r e q u e n c y o n t h e s t a t o r s i d e ; ω s e =
e l e c t
r i c a l s u p p l y
f r e q u e n c y ; N r =
i n t e g e r n u m
b e r o f r o t o r s l o t s ; N
=
r o t a t i o n a l s p e e d
i n r e v / m
i n ; f ω r m
=
2 π N
6 0
m e c h a n i c a l r o t a t i o n a l
f r e q u e n c y , H z ; ω r m
=
ω s e / p f o r a s y n c h r o n o u s m a c h i n e ; ω r m
= ( 1 −
s ) ω s e / p f o r a n a s y n c h r o n o u s m a c h i n e s =
a s y n c h r o n o u s m a c h i n e r o t o r s p e e d s l i p ,
0 – 1 ; p =
p o l e p a i r s ; n =
a n i n t e g e r ; k e
=
e c c e n t r i c i t y o r d e r , z e r o
f o r s t a t i c e c c e n t r i c i t y ,
l o w i n t e g e r v a l u e
1 , 2 , 3
…
f o r
d y n a m i c e c c e n t r i c i t y ; k =
s p a c e h a r m o n i c o f t h e
s t a t o r w
i n d i n g M M F , 1 , 3 , 5 , 7 …
; n b =
n u m b e r o f r o l l i n g e l e m e n t s ; d b =
r o l l i n g e l e m e n t
d i a m e t e r ; D b =
r o l l i n g
e l e m e n t p i t c h ; φ
=
r o l l i n g e l e m e n t c o n t a c t a n g l e
w i t h r a c e s ; k c =
n u m b e r o f
f a u l t y
c o m m u t a t o r s e g m e n t s

8/20/2019 Condition Monitoring Knjiga
http://slidepdf.com/reader/full/condition-monitoring-knjiga 209/306
186 Conditi on monitor ing of rotati ng el ectri cal machines
transient and electrical transient. The torque transient capture unit is triggered by any
sudden increase in the airgap torque or by sudden changes in the shaft angular vibra-
tion velocities. Similarly, the electrical transient is captured in response to any sudden
change in the value of the line currents. The captured data can then be transmitted for
further analysis and evaluation. The software receives the captured data and deter-
mines the torsional response of the shaft and the associated impact on the fatigue life
of the set. The results obtained in this way can be used to plan maintenance intervals
on the basis of need, rather than risk catastrophic failure when there has been a high
level of system disturbances between fixed outages.
Data
processing and
analysis
Individual
shaft
torsional
responses
Fatigue life
extrapolation
Line voltage
signals
Line current
signals
Shaft velocity
signals
Maintenance
scheduling
Fi gure 8.15 Functional descri ption of torsional oscill ation monitori ng system
The monitoring of torsional oscillations can also be used to detect faults in induc-
tion motors. The speed of an induction motor driving an ideal load should be constant.
Perturbations in load and faults within the rotor circuit of the machine will cause the
speed to fluctuate. If the rotor is defective the speed fluctuation will occur at twice the
slip frequency. This is because the normally torque-producing slip frequency currents
that flow in the rotor winding are unable to flow through the defective part. In effect
the speed fluctuations complement the twice the slip frequency current fluctuation
described in Chapter 9. A defective induction machine with a rotor of infinite inertia
will have twice the slip frequency current fluctuations and no speed variation, whereasa low inertia rotor will exhibit speed fluctuations but no current fluctuation. Tavner
et al . reported this method [43] developed by Gaydon., which has been investigated
further as the ‘instantaneous angular speed’ method by Ben Sasi et al . [44,45], and a
typical measurement result is shown in Figure 8.16.

8/20/2019 Condition Monitoring Knjiga
http://slidepdf.com/reader/full/condition-monitoring-knjiga 210/306
Vibr ation monitori ng 187
S p e e d w a v e f o r m P
S D ,
d B
0
−20
−40
−601.75Hz
3.5 Hz
Pole pass speed
lower side bandat 27.7 Hz
Pole pass speed
upper side band
at 20.7 Hz
Rotor speed – 24.2 Hz
Frequency, Hz
0 5 10 15 20 25 30 35 40 45 50
−80
−100
−120
−140
−160
−180
F igure 8.16 Rotor speed spectrum from an induction motor with a rotor bar fault.[ Taken from Ben Sasi et al . [ 44] ]
8.6.5 Shock pulse monitor ing
The shock pulse method is used exclusively for detecting faults in rolling element bearings and is based on the principles described in Section 8.5.2. Since the largest
proportion of electrical machine failures are ascribable to bearing problems (see
Table 3.2) and the majority of machines are smaller than 300 kW, this technique
is important for a large number of machines. As a rolling element bearing deteri-
orates the moving surfaces develop small pits or imperfections and the interaction
between such surfaces generates mechanical stress waves or shock pulses in the bear-
ing material, which propagate into the frame and structure of the electrical machine.
These shock pulses are at ultrasonic frequencies and can be detected by piezoelectric
transducers with a strong resonant frequency characteristic tuned to the expected fre-quency of the pulses at around 32 kHz. To increase the sensitivity of the electronic
conditioning, the transducer is tuned to this resonant frequency. A peak hold circuit
enables the maximum value of the shock pulse to be recorded, which is taken to be a
measure of the condition of the rolling element bearing. This condition of the bearing
is assessed by defining a quantity known as the shock pulse value (SPV) defined as:
SPV = R
N 2F 2 (8.36)
where R is the shock pulse meter reading, N is the shaft speed in rev/min, and F is the factor relating to bearing geometry. Low values indicate bearings in good
condition. Generally the technique is best used in conjunction with overall vibration
level monitoring, and Table 8.6 can be used to give qualitative guidance on the bearing
condition.

8/20/2019 Condition Monitoring Knjiga
http://slidepdf.com/reader/full/condition-monitoring-knjiga 211/306
188 Conditi on monitor ing of rotati ng el ectri cal machines
Table 8.6 Shock pulse inter pretation
Overall vibration level
trend
Shock pulse value trend Comments
Low and rising Remains low No bearing damage
Low and rising Low but rising at the same
rate as the overall vibration
level
Bearing damage likely
Low and rising High value but constant Damaged bearing but another
problem is causing the rising
vibration
Tandon et al . [46,47] describe the development of rolling element bearing moni-
toring including vibration, acoustic and shock pulse methods. There is a technique for
assessing the thickness of the oil or grease film in the rolling element bearing, based on
the experimental evidence that the shock pulse value increases, in approximately the
manner shown in Figure 8.17, as a function of the percentage of dry contact time per
revolution. The dry contact time was measured by monitoring current flow between
the inner and outer races of a test bearing and current flow taken as an indication of
dry contact.
D r y r u n n i n g t i m e ,
%
0
50
100
Dry running value
Shock pulse value
0dB−10−20−30−40
Fi gure 8.17 Shock pulse value as a function of dry r unning time per revolution
8/20/2019 Condition Monitoring Knjiga
http://slidepdf.com/reader/full/condition-monitoring-knjiga 212/306
Vibr ation monitori ng 189
Stack et al . [30] classify motor bearing faults illustrating the unpredictable and
broadband nature of the effects produced, emphasising its significance, because a
successful bearing condition-monitoring scheme must be able to reliably detect all
classes of faults. The quantitative evaluation of bearings using the shock pulse method
therefore remains difficult.
8.7 C onclusion
Vibration measurement is at the heart of the monitoring of rotating machines.
Although electrical machines are generally low-vibration devices, they may be
coupled to high-vibration prime movers or driven plant via flexible couplings and
mounted on separate foundations via resilient mounts. The excitation of electrical
machine vibration is generally mechanical unbalance or harmonic electromagnetic
forces originating from the machine airgap. The response of the machine to these
exciting forces depends on the precise coupling and mounting of the machine.
Vibration monitoring and shock pulse analysis are non-invasive but use a number
of specialised sensors, broad bandwidth and complex analysis. The precise selection
and location of sensors is very important. However, because of its wide application
in other rotating machines vibration analysis has established itself as a reliable and
widely accepted technique for electrical machines and shock pulse analysis, and also
(particularly for bearings) because it is capable of differentiating between mechanical
and electromagnetic excitation forces, which is invaluable in detecting root causes before they develop into failure modes. Motor speed has been analysed using instan-
taneous angular speed to detect rotor electrical faults but has not been widely used by
operators. The following chapter will show the close relationship between vibration
and electrical monitoring of the machine.
8.8 R eferences
1. Alger P.L. The Nature of I nduction M achines . New York: Gordon and Beach;1965.
2. Jordan H. The Low Noi se Electri c M otor . Essen: Springer Verlag; 1950.
3. Erdelyi E. and Erie P.A. Vibration modes of states of induction motors. ASM E Transactions 1956; A-28: 39–45.
4. Yang S. Low Noi se Electri c M otors . Oxford, UK: Clarendon Press; 1981.
5. Timoshenko S. Vibration Problems in Engineeri ng . New York: John Wiley &
Sons, Van Nostrand Inc.; 1974.
6. Penman J., Chalmers B.J. et al (1981). The performance of solid steel secondary
linear induction machines. I EEE Tr ansactions on Power Apparatus and Systems 1981; PAS-100: 2927–35.
7. Hague B. Pr inci ples of El ectromagnetism Applied to Electri cal M achines . New
York: Dover; 1962.
8. Stafl M. Electrodynamics of El ectri cal M achines . Prague: Academia; 1967.

8/20/2019 Condition Monitoring Knjiga
http://slidepdf.com/reader/full/condition-monitoring-knjiga 213/306
190 Conditi on monitor ing of rotati ng el ectri cal machines
9. Binns K.J. and Dye M. Identification of principal factors affecting unbalanced
magnetic pull in cage induction motors. IE E Proceedings, Part B 1973; 120:
349–54.
10. Swann S.A. Effect of rotor eccentricity on the magnetic field of a non-salient
pole machine. I EE Proceedings 1963; 110: 903–15.
11. Rai R.B. Air gap Eccentri city in I nduction M otors . ERA Report, 1974: 1174–88.
12. Binns K.J. Cogging torques in induction machines. I EE P roceedings 1968; 115:
1783–90.
13. Lim C.Y. Characteristics of reluctance motors. IEEE Transactions on Power Apparatus and Systems 1951; PAS-70: 1971–8.
14. Williamson S. and Smith A.C. Field analysis for rotating induction machines
and its relationship to the equivalent circuit method. IEE Proceedings, Part B 1980; 127: 83–90.
15. Vas P. Parameter Estimation, Condition Monitoring and Diagnosisof Electrical Machines . Oxford, UK: Clarendon Press; 1996.
16. Carpenter C.J. Surface Integral Methods of Calculating Force on Magnetized Ir on Parts. IEE Monograph No. 342, 1959.
17. Brandl P. Forces on the end windings of AC machines. Brown Boveri Review 1980; 2: 128–34.
18. Ohtaguro M., Yagiuchi K. and Yamaguchi H. Mechanical behaviour of stator
endwindings. IEEE Transactions on Power A ppar atus and Systems 1980; PAS-99: 1181–5.
19. Williamson S. and Ellis M.R.E. Influence of rotor currents on end-winding forcesin cage motor. I EE Proceedings, Par t B, Electri c Power A ppli cations 1988; 135:
371–9.
20. Campbell J.J., Clark P.E., McShane I. E. and Wakeley K. Strains on motor
endwindings. IEEE Transactions on Industry Appli cations 1984; IA-20:
37–44.
21. Wort J.F.G. The fundamentals of industrial balancing machines and their
applications. Br uel and Kj aer Review 1981; 1: 3–31.
22. International Organization for Standardization. Mechanical vibration–balance
quality requirements for rotors in a constant (rigid) state. Part 1: Specificationand verification of balance tolerances. ISO 1940-1. International Organization
for Standardization, Geneva, 2003.
23. Smart M.G., Friswell M.I. and Lees A.W. Estimating turbogenerator foundation
parameters: model selection and regularization. Proceedingsof theRoyal Society A: M athematical, Physi cal and Engi neer ing Sciences 2000; 456: 1583–607.
24. Dimentberg F.M. Flexural Vibr ations of Rotating Shafts . London: Butterworths;
1961.
25. Walker D.N., Bowler C.E.J., Jackson R.L. and Hodges D.A. Results of subsyn-
chronous resonance test at Mohave. I EEE Transactions on Power Apparatus and Systems 1975; PAS-94: 1878–89.
26. Walker D.N., Adams S.L. and Placek R.J. Torsional vibration and fatigue of
turbine-generator shafts. IEEE Transactions on Power Apparatus and Systems 1981; PAS-100: 4373–80.

8/20/2019 Condition Monitoring Knjiga
http://slidepdf.com/reader/full/condition-monitoring-knjiga 214/306
Vibr ation monitori ng 191
27. Joyce J. S. and Lambrecht D. Status of evaluating the fatigue of large steam tur-
bine generation caused by electrical disturbances. I EEE Transactions on Power Apparatus and Systems 1980; PAS-99: 111–19.
28. Cudworth C.J., Smith J.R. and Mykura F. Mechanical damping of torsional
vibrations in turbogenerators due to network disturbances. Proceedings of the Institution of Mechanical Engineers 1984: 139–145.
29. Collacott R.A. Vibration Monitoring and Diagnostics . London: G. Godwin;
1979.
30. Stack J.R., Habetler T.G. and Harley, R.G. Fault classification and fault signature
production for rolling element bearings in electric machines. I EEE Transactions on Industry Applications 2004; I A-40: 735–9.
31. Ehrich F. and Childs D. Self-excited vibration in high-performance turboma-
chinery. Mechanical Engineering 1984; 106: 66–79.
32. Verein Deutscher Ingenieure. Beurteilungsmaßstäbe für mechanische Schwingun-
gen von Maschinen. VDI 2056. VDI Dusseldorf, Germany: Verein Deutscher
Ingenieure 1964.
33. International Organization for Standardization. Mechanical vibration – Eval-
uation of machine vibration by measurements on non-rotating parts – Part 1:
General guidelines. ISO 10816-1:1995. ISO, Geneva, 1995.
34. Canadian Government. Vibration Limits for Maintenance. Specification
CDA/MS/NVSH/107. Ohawa, Canada, Canadian Government.
35. Neale N. and Associates. A Guide to the Condition Monitoring of Machinery .
London: Her Majesty’s Stationary Office; 1979.36. Mayes I.W. Use of neutral networks for online vibration monitoring. Proceedings
of the I nstituti on of M echani cal Engineer s Par t A, Journal of Power and Energy 1994; 208: 267–74.
37. Herbert R.G. Computer techniques applied to the routine analysis of rundown
vibration data for condition monitoring of turbine-alternators. Br iti sh Journal of Non-D estr uctive Testi ng 1986; 28: 371–5.
38. Smart M.G., Friswell M.I. and Lees A.W. Estimating turbogenerator foundation
parameters: model selection and regularization. Proceedingsof theRoyal Society
A: M athematical, Physical and Engi neer i ng Sciences 2000; 456: 1583–607.39. Dorrell, D. G., W. T. Thomson and Roach S. Analysis of airgap flux, current,
and vibration signals as a function of the combination of static and dynamic
airgap eccentricity in 3-phase induction motors. I EEE Tr ansactions on I ndustr y Applications 1997; I A-33: 24–34.
40. Hargis C. Steady-state analysis of 3-phase cage motors with rotor-bar and end-
ring faults. IEE Proceedings, Part B, El ectri c Power Applications 1983; 130:
225.
41. Nandi S., Bharadwaj R.M., Toliyat H.A. and Parlos A.G. Performance analy-
sis of a three-phase induction motor under mixed eccentricity condition. IEEE Transactions on Energy Conversion 2002; EC -17: 392–9.
42. Trutt F.C., Sottile J. and Kohler J.L. Detection of AC machine winding dete-
rioration using electrically excited vibrations. I EEE Tr ansactions on Industry Applications 2001; I A-37: 10–14.

8/20/2019 Condition Monitoring Knjiga
http://slidepdf.com/reader/full/condition-monitoring-knjiga 215/306
192 Conditi on monitor ing of rotati ng el ectri cal machines
43. Tavner P.J., Gaydon B.G. and Ward D.M. (1986). Monitoring generators and
large motors. IEE Pr oceedings, Par t B, Electri c Power Appli cations 1986; 133:
169–80.
44. Ben Sasi A.Y., Gu F., Li. Y. and Ball A.D. A validated model for the prediction
of rotor bar failure in squirrel-cage motors using instantaneous angular speed.
Journal of Mechanical Systems and Signal Processing 2006; 20: 1572–89.
45. Ben Sasi A.Y., Gu F., Payne, B.S. and Ball A.D. Instantaneous angular speed
monitoring of electric motors. Journal of Quali ty i n M aintenance Engineer ing 2004; 10: 123–35.
46. Tandon N. and Nakra B.C. Comparison of vibration and acoustic measurement
techniques for the condition monitoring of rolling element bearings. Tribology International 1992; 25: 205–12.
47. Tandon N., Yadava G.S. and Ramakrishna K.M. A comparison of some condi-
tion monitoring techniques for the detection of defect in induction motor ball
bearings. Mechanical Systems and Signal Processing 2007; 21: 244–56.

8/20/2019 Condition Monitoring Knjiga
http://slidepdf.com/reader/full/condition-monitoring-knjiga 216/306
Chapter 9 Electrical techniques: current, flux and power
monitoring
9.1 I ntroduction
Chapter 1 explained that electromechanical protective relays were the earliest
electrical technique for monitoring motors. The technology of these devices is dated,
their purpose being exclusively to detect gross perturbations in the electrical quan-
tities at the terminals of the machine to protect against catastrophic damage. They
are now largely being replaced by digital protection devices detecting voltage and
current perturbations, as described in Chapter 1 (see Figure 1.2).
Within the machine the magnetic flux varies, circumferentially in the airgap,
periodically in space and, for an AC machine, periodically with time, as described in
Chapter 8. Under ideal conditions this magnetic flux waveform will be symmetrical
but electrical faults in the machine will distort it. Rotor faults could be detected by
electrical sensors fixed to the rotor, and stator faults could be detected by electrical
sensors fixed to the stator. Faults on either rotor or stator disrupt the radial and
circumferential patterns of flux in the machine causing changes to the power being
fed to the machine, which can be detected via its terminal quantities – voltage, current
and power – measured outside the machine to give an indication of its condition. In
effect, this is a more prolonged and detailed process than that conceived of in a
digital protection relay. In the following sections we describe a number of these new
techniques.
9.2 G ener ator and motor stator faults
9.2.1 Gener ator stator wi nding fault detection
The most significant technique in this area is on-line discharge detection, which is
dealt with in Chapter 10.
9.2.2 Stator current monitor ing for stator faults
This work, mostly concerned with motors, is connected with the earlier work
described in Chapter 8 on the effect of faults on vibrations, which also considered
rotor eccentricity but is now extended to consider stator winding faults, see work by

8/20/2019 Condition Monitoring Knjiga
http://slidepdf.com/reader/full/condition-monitoring-knjiga 217/306
194 Conditi on monitor ing of rotati ng el ectri cal machines
Rai [1], Dorrell et al . [2], Hargis [3] and Nandi et al . [4]. The work is also closely
associated with the detection of rotor winding faults described in Section 9.4.3. The
theoretical work, verified by laboratory experiments was started by Penman et al . [5]
and continued with Penman and Stavrou [6], who concentrated primarily on stator
winding faults. Thomson et al . [7–9] then took up the practical application of the work
to machines in industrial applications but with the particular intention of detecting
rotor eccentricity, which could indicate the deterioration of machine bearings, one of
the common failure modes of electrical machines as set out in Chapter 3.
9.2.3 Br ushgear fault detection
Brushgear, in those machines that use it, requires a steady maintenance commit-
ment if good performance with the minimum of sparking is to be maintained. Poor
performance can be detected by measuring brush or brush-holder temperature but amore direct method would be to detect the radiofrequency (RF) energy generated by
sparking, as described by Michiguchi et al . [10]. They used a wide-bandwidth dipole
antenna connected to an RF amplifier with a bandwidth of 10–100 MHz, the output of
which was rectified. The processing electronics measured the area under any pulses
of RF power that enter the monitor as a result of sparking activity at the brushes. The
monitor thereby produces a chart record showing the average area of sparking pulse
and Michiguchi relates this to a ‘spark number’ indicating an intensity of sparking.
Maintenance staff use this indication to decide when brushes should be changed.
9.2.4 Rotor-mounted search coil s
We have not found any techniques reported for detecting stator faults by search coils
mounted upon the rotor. No doubt the usefulness of this technique is affected by the
need to mount expensive instrument slip rings on the rotor and its effectiveness will
be limited by the reliability of the measurement brushgear, which, as will be described
in the section on shaft voltages, is notoriously poor.
9.3 G ener ator rotor faults
9.3.1 General
The rotors of large turbine generators are particularly highly rated because of the large
mechanical and electrical stresses placed upon them, in particular the high centrifugal
forces on the winding and the relatively high temperatures attained in the winding
insulation. Consequently that part of the machine is particularly prone to faults that,
as stated in Chapter 2, tend to develop over a long period of time. The rotor is also
relatively inaccessible both for obtaining signals during running and for removal for repair if a fault is detected. These facts, taken together with the high value of turbine
generator plant, have meant that monitoring techniques for generator rotors have been
developed to a high degree of sophistication. Some of the techniques described are
also applicable to smaller-output machines, but have yet to become fully accepted.

8/20/2019 Condition Monitoring Knjiga
http://slidepdf.com/reader/full/condition-monitoring-knjiga 218/306
Electrical techniques: current, flux and power monitoring 195
9.3.2 Earth leakage faults on-li ne
A single earth leakage fault on a generator rotor winding is not serious in itself, because
it cannot cause any damage as the earth leakage current is limited to leakage resistance
of the excitation supply. However, if two well-separated earth faults occur then largecurrents can flow, leading to significant damage to the winding, its insulation and the
rotor forging. The aim of a rotor earth fault detector is to apply a DC bias voltage to
the rotor winding and monitor the current flowing to the rotor body via an alarm relay
(see Warrington [11] and Figure 9.1(a)). If such an alarm occurs, many utilities would
consider that the machine should be shut down so that the rotor can be investigated.
However, operational pressures are such that this is often not possible, and it is
Rotor windingSlip ring Slip ring
Rotor body
R
R f
DC biasvoltage
Relay
Exiter
(a )
(b )
(c )
Rotor windingSlip ring Slip ring
Rotor body
M
R f
Meter
Exiter
Rotor windingSlip ring Slip ring
Rotor body
R f
R m
V 1 V 2
Open
AB
Switch R m i s a
measurementresistor
R f is leakageresistance toearth at fault site
F igure 9.1 D etecting rotor earth faults. (a) Use of an eart h leakage relay. (b) Mon- itoring of an existing earth fault using a potentiometer. (c) Monitoring for a second ear th faul t by measur ing resistance to ear th fr om each end of the winding.

8/20/2019 Condition Monitoring Knjiga
http://slidepdf.com/reader/full/condition-monitoring-knjiga 219/306
196 Conditi on monitor ing of rotati ng el ectri cal machines
necessary to continue running the unit. The next step then is to monitor the earth
leakage current and manually trip the unit if there is any further increase, indicative
of a second earth fault.
An alternative method is to use a potentiometer fed to earth via a sensitive
galvanometer making a bridge circuit, as shown in Figure 9.1(b). As the earth fault
location alters or a second fault occurs the bridge unbalances and an indication occurs
on the meter. The problem is that the second earth fault may arise close to the loca-
tion of the first fault and the resultant change in earth leakage current may not be
particularly large.
A more sensitive indicator of the onset of a second earth fault is the resistance
of the winding to earth, measured from either terminal. Such a technique has been
described using two voltmeters, V 1 and V 2, as shown in Figure 9.1(c). When the
switch is open the fault position, K , defined as the fractional position up the winding
from the negative slip ring, can be calculated:
K = V 1
V 1 + V 2(9.1)
When the switch is closed to A the voltages V 1 and V 2 will change by an amount
depending on the fault resistance, R f , and the current flowing through the fault, I f ,so that now the apparent position K is given by:
K =V 1
V 1 + V
2
(9.2)
From the apparent change in fault position K = K − K , the voltage across the
fault resistance can be calculated and finally the fault resistance itself. This procedure
can be repeated by connecting the voltmeters to the other terminal of the winding, by
closing the switch to B. The choice of terminal connection is governed by the initial
fault position, the object being to optimise the measurement of the fault resistance R f .The scheme can be implemented using a microprocessor-based unit, which makes
the measurement at each terminal of the winding at intervals of approximately 1 s,
processes the results and presents information for operating staff as well as initiating
relay indications if necessary.
9.3.3 Turn-to-turn faults on-li ne
9.3.3.1 A ir gap search coils
Turn-to-turn faults in a generator rotor winding may lead to local overheating and
eventually to rotor earth faults. In addition, the shorting of turns causes unequal
heating of the rotor leading to bending and an unbalanced pull, which together
cause increased vibration as described by Khudabashev [12]. Such faults can be
detected off-line by the method of recurrent surge oscillography, described inSection 9.3.4, but a way of detecting them on-line was first described by Albright
[13] using a stationary search coil fitted in the airgap of the machine. The search
coil, of diameter less than the tooth-width of the rotor, is fixed to the stator usu-
ally in the airgap, and detects either the radial or circumferential component of

8/20/2019 Condition Monitoring Knjiga
http://slidepdf.com/reader/full/condition-monitoring-knjiga 220/306
Electrical techniques: current, flux and power monitoring 197
(a)
(b)
F igure 9.2 Photographs of two typical search coil i nstallati ons in large gener ator s
magnetic flux. Examples of two types of airgap search coil installation are shown
in Figure 9.2.
Figure 9.3 shows typical waveforms obtained from a radial search coil in a two-
pole generator operating on load. A normal two-pole rotor will have an even number
of winding slots and will produce a radial flux wave, B , in the airgap as follows:
B =
n = 1,3,5 ...
B n sin n ωt +
m even
B m sin m ωt (9.3)
This is the normal MMF wave tooth ripple.

8/20/2019 Condition Monitoring Knjiga
http://slidepdf.com/reader/full/condition-monitoring-knjiga 221/306
198 Conditi on monitor ing of rotati ng el ectri cal machines
Time
Time
(a )
(b )
E M F ,
E
w a v e f o r m
F l u x w a v e f o r m
=
i n t e g r a l o f E
w r t t i m e
Fi gure 9.3 Typical voltage and fl ux waveforms obtained from a generator air gap search coil. (a) Search coil voltage waveform. (b) Flux waveform obtained by integrating (a).
The search coil normal EMF waveform per turn of the search coil will be:
e normal (t ) = AdB
dt
=
n = 1,3,5 ...An ω B n cos n ωt normal MMF wave
+
m even
Am ω B n cos m ωt normal tooth ripple MMF wave (9.4)

8/20/2019 Condition Monitoring Knjiga
http://slidepdf.com/reader/full/condition-monitoring-knjiga 222/306
Electrical techniques: current, flux and power monitoring 199
where A is the effective search coil area. The n odd harmonics are due to the wave
shape of the MMF wave in the airgap and are dependent upon the spread of winding
slots over the rotor pole pitch. The m even harmonics are due to the rotor tooth ripple
that is present in the voltage waveform.
When a shorted turn occurs two things happen. First it disturbs the MMF distri-
bution, causing low-order even harmonics or an asymmetry in the flux and search
coil voltage waveforms. Second it disrupts the n th order slot ripple harmonics. This
is shown in the search coil faulty waveform as follows:
e fault (t ) =
n = 1,3,5 ...
An ω B n cos n ωt normal MMF wave
+ =2,4,6 ... dependent on fault location
Aω B cos ωt fault assymmetric MMF wave
+
m = even
Am ω B m cos m ωt normal tooth ripple MMF wave
+
p = ±1,±3
A(m + p )ω B n cos(m + p )ωt fault tooth ripple MMF wave
(9.5)
The heights of the corresponding peaks and troughs in the ripple will change so
that the search coil voltage will no longer be symmetrical about zero. In principle,the changes in the heights of the peaks and troughs can be used to determine the
number and location of any shorted turns and this is what Albright did in his original
paper. He identified faults by measuring the peak heights of the ripple from stored
oscilloscope waveforms, recorded under open- and short-circuit test conditions. He
did not consider that waveforms obtained with the generator on-load could provide
the sensitivity required to detect shorted turns. Since that time a considerable number
of large steam turbine-driven generators have been fitted with airgap search coils
and a great deal more experience has been obtained of detecting shorted turns. The
detection techniques have therefore been refined to deal not only with the differenttypes and locations of search coils but also to detect shorted turns under both off-load
and on-load conditions.
New techniques have been developed utilising a digital storage oscilloscope con-
nected to the search coil to give an initial indication of the development of an inter-turn
fault. More detailed analysis techniques can then be performed off-line on the stored
and downloaded waveforms to positively identify and locate the faults. The on-line
method measures the sum of the first four even harmonics of the search coil wave-
form. The purpose is to identify any asymmetry in the MMF waveform caused by
shorted turns. The monitor produces an analogue signal on a chart recorder and themonitor can be adjusted so that any increase above a preset level gives an alarm,
which can be used to initiate a more detailed analysis. The setting of that preset level
depends upon the generator itself, its history and the type of search coil fitted. Again
one is faced with the problems of determining background levels.

8/20/2019 Condition Monitoring Knjiga
http://slidepdf.com/reader/full/condition-monitoring-knjiga 223/306
200 Conditi on monitor ing of rotati ng el ectri cal machines
The three main methods of detailed analysis of the search coil waveforms yield
the following:
• the difference between the search coil voltage waveform and a delayed version
of itself;
• the amplitude of the increments in the tooth ripple in the search coil voltage
waveform, using the method of Albright [13];
• the flux waveform by integrating the search coil voltage waveform.
Before these can be done the waveform is Fourier analysed into its real and imaginary
components. It has been shown that the waveform obtained from a search coil at one
radial position in the airgap can be modified to predict the waveform if the coil were
at another position closer to the rotor. This is particularly helpful for coils fitted close
to the stator surface, where the rotor tooth ripple may be very small. It also allowsresults from different sizes and designs of machines to be compared on a common
basis. The difference waveform can be calculated from the digitised components of
the search coil voltage and this waveform can be plotted out to show the presence of
a fault as shown in Figure 9.4.
The incremental voltages are calculated by measuring the voltage height between
the peaks and troughs of each tooth ripple associated with each pole of the winding
and the heights are measured on the side of the ripple furthest from the pole face.
These incremental voltages can be plotted out as a histogram over the rotor surface
together with a histogram of the differences between the voltages over one pole and the next as shown in Figure 9.5.
The flux waveform is found by integrating the voltage waveform. Distortions of
the flux waveform can be brought to light either by direct inspection or by carrying
out the difference procedure described above for the search coil waveform. Computer
simulations and the practical experience of measuring search coil voltage waveforms
suggest that the magnitude of the asymmetry in the search coil waveform produced
by a fault depends upon the load as well as the location and number of shorted turns.
This is because the degree of saturation affects the magnitude of the rotor tooth
ripple, which varies with load and with position around the rotor circumference.
In the absence of saturation the asymmetric component would be expected to be
proportional to rotor current. However, magnetic saturation of the shorted turn has a
significant effect, so that for some loads and locations of shorted turn the magnitude
of the asymmetry actually decreases with increasing rotor current.
9.3.3.2 C irculating cur rent measurement
An alternative way of monitoring for sorted turns, which is still under development,
uses the stator winding itself as the search coil. The principle of this technique, first
suggested by Kryukhin [14], has been developed and fitted to a number of generatorsin the UK. This technique makes use of the fact that in large two-pole generators,
each phase of the stator winding consists of two half-phase windings in parallel. Any
asymmetry in the rotor MMF will induce counter-MMF currents in the stator winding
with a twice fundamental frequency, which will circulate between the half-phases.

8/20/2019 Condition Monitoring Knjiga
http://slidepdf.com/reader/full/condition-monitoring-knjiga 224/306
Electrical techniques: current, flux and power monitoring 201
Faulted coil
Faulted coil
20 ms
b
a
20 ms
a
b b
b
(a)
(b )
E M F
d i f f e r e n c e w a v e f o r m
E M F
w a v e f o r m
F igure 9.4 Effect of delayi ng and adding the waveform from a search coil fi tted to a faulty machine. (a) Predicted search coil voltage close to rotor surface.(b) D iff erence wavefor m obtained by delayi ng a) hal f a cycle and adding
to i tself .
The presence of shorted turns is detected by measuring those even harmonic currents.
The size of the currents depends upon the severity of the shorted turns, the coupling
between rotor and stator and the impedance of the stator winding to the currents.
This approach has been developed by others with supporting analysis, for example
by Pöyhönen et al . [15], but has been subsumed into the more popular analysis of
induction motors.
It can be shown that the EMF, e (t ), induced across a stator half-phase winding
due to a single shorted turn, spanning an angle, 2β, on a two-pole rotor is given by:
e (t ) = 4µ0ω
πCg NI r airgap L
∞n = 1,3,5 ...
1
n k wn sin n β cos(n ωt ) (9.6)

8/20/2019 Condition Monitoring Knjiga
http://slidepdf.com/reader/full/condition-monitoring-knjiga 225/306
202 Conditi on monitor ing of rotati ng el ectri cal machines
Slot numbers showing a fault
1
64
1
1
64
1
−76
−76
(a)
(b )
E M F
i n c r e m e n t s
D i f f e r e n c
e i n E M F
i n c r e m e n t s
Fi gure 9.5 M ethod of incremental voltages proposed by Albr ight [ 13] . (a) Incre- mental voltages obtained from previous figure. (b) D ifferences in i ncremental vol tages between pol es obtained from F igure (a) above.
where NI is the ampere-turns of the short, ω is the rotational frequency, N is the
number of stator turns in series per half phase, r airgap is the mean radius of the airgap,
L is the active length of the rotor, C is the Carter factor to account for slotting, g is
the width of the airgap, β is the half angle subtended by the shorted turn, n is the
harmonic number, and k wn is the stator winding factor for the n th harmonic.
The EMF induced in the opposite half-phase winding, on the same phase, will
be of the same form but the term cos(n ωt ) will be replaced by one of the form
cos(n ωt −
n π). The odd harmonics of the EMFs in the two half-phases will therefore be of the same sign and so when the half-phases are connected in parallel they will
aid one another, forming the terminal voltage due to that shorted turn. The even
harmonics will be of the opposite sign and so will drive circulating currents between
the half phases. The currents are flowing in the stator winding, rotating at the same

8/20/2019 Condition Monitoring Knjiga
http://slidepdf.com/reader/full/condition-monitoring-knjiga 226/306
Electrical techniques: current, flux and power monitoring 203
speed as the rotor, effectively replacing the rotor shorted turn. The second harmonic
circulating current that flows in the stator, i 2C , can be related to the second harmonic
EMF, e 2, induced by the shorted turn, providing the second harmonic impedance, X 2,
of the winding is known. The impedance to second harmonic currents, X 2
, is given by
X 2 = X m 2 + X 2 (9.7)
where X m 2 is the second harmonic magnetising reactance and X 2 is the second
harmonic leakage reactance.
For a typical large machine it has been shown that X 2 = 0.516 pu. Therefore for a
single shorted turn spanning an angle of 2β on the rotor the second harmonic current
circulating in the stator winding is approximated by
i 2C =
e 2 sin 2β
0.516 (9.8)
The currents are detected using air-cored Rogowski coils wrapped around the winding
and a diagram of an on-line monitor for doing this is shown in Figure 9.6.
An advantage of this new technique, when compared to airgap search coils, is that
the current transducers can be installed without the need to remove the rotor from the
generator. For many generators the half-phase windings are joined within the cooling
pressure casing in a fairly restricted space that requires special arrangements to gain
access. However, on some machines the half-phase windings are joined outside the
casing, so fitting of the Rogowski coils becomes simpler. Care must of course be taken
to provide appropriate high-voltage insulation and electrostatic screening between the
Rogowski coil and the conductor. A disadvantage of the circulating current method,
however, is that it does not give information on the turn location, whereas the airgap
search coil method does.
Line end
One phase of generatorstator warning
Neutral end
Differentialamplifier
100 Hz bandpass filter Rectifier
Meter
Chart recorder
Integrators
F igure 9.6 Continuous monitor for use on circulating current Rogowski coil s

8/20/2019 Condition Monitoring Knjiga
http://slidepdf.com/reader/full/condition-monitoring-knjiga 227/306
204 Conditi on monitor ing of rotati ng el ectri cal machines
Neither the airgap search coil nor the Rogowski coil methods appear to have been
applied to multi-pole hydro-type generators or even four-pole turbine-type machines.
No doubt applications will evolve as operational circumstances demand them.
9.3.4 Turn-to-turn and earth leakage faults off-li ne
Surge techniques have been used for many years by transformer manufacturers for
locating faults in windings. More recently turbine generator manufacturers have used
similar techniques for pinpointing faults in their rotor windings, as a quality control
check immediately after a rotor has been assembled. Work in the former Central
Electricity Generating Board showed that such a technique can be used to detect both
earth leakage and turn-to-turn faults on generators during their service lives, which
used a mercury-wetted contact relay to develop recurrent, rapid rise time (circa 20 ns)
surges that were injected into the winding between the slip-ring and the earthed body
of the rotor. Figure 9.7(a) shows this recurrent surge generator, which is switched
on and off at a frequency of 50 Hz, while Figure 9.7(b) shows the connection of the
generator to the rotor winding. The winding approximates to a simple transmission
line where the propagation is dominated by the geometry and insulation of the winding
conductor in the rotor slot. Mutual coupling between turns of the winding will cause
dispersion but this effect has been found to be small in solid-steel rotors. When the
surge is injected at one end it has a magnitude determined by the source impedance,
R , of the recurrent surge generator and the surge impedance of the winding, Z 0. The
surge propagates to the far end of the winding in a time, t , determined by the lengthand propagation velocity of the winding. The surge is reflected at the far end, its
magnitude determined by the reflection coefficient, k r . For a winding with the far
end open-circuited, k r = 1 and with it short-circuited k r = −1. The reflected surge
returns to the source and if the source impedance equals the surge impedance of the
winding (k r = 0 at source), it is absorbed without further reflection. This is shown in
Figure 9.8(a).
When an insulation fault to earth or a turn-to-turn fault is encountered, this reflec-
tion pattern will be disrupted and may be observed on the oscilloscope. The pattern
on the oscilloscope is known as a recurrent surge oscillograph (RSO) and this has become the name of the technique. The rise time of the surge will affect the method’s
sensitivity and must be less than the propagation time of the surge-front through a
single winding turn for sharp reflection to occur.
Figure 9.7(b) shows results obtained from the practical application of this method.
The source impedance R was adjusted to be equal to the winding surge impedance
and a surge of between 10 and 100 V was applied with a rise time of 20 ns.
The surge was injected into each end of the winding, with the far-end open-
circuited, and two reflection traces were obtained as shown in parts (i) and (ii) of
Figure 9.8(b), either of which should be compared to the ideal response of part (i)of Figure 9.8(a). The results show the distortion of the trace as a result of disper-
sion and the lack of surge sharpness. Faults are indicated by superimposing the two
traces and observing any deviations between them, as shown in parts (ii) and (iii) of
Figure 9.8(b).

8/20/2019 Condition Monitoring Knjiga
http://slidepdf.com/reader/full/condition-monitoring-knjiga 228/306
Electrical techniques: current, flux and power monitoring 205
Rotor body
R1
2
Rotor winding
Recurrent surgegenerator see (a)
To oscilliscopeChannel 1Channel 2Frame
(a)
(b)
'S' is a mercury-wetted relaySource voltage and 'R' mustbe selected so that relayrating is not exceeded
To rotor body
To slip rings
RS10 k
10 k dischargegenerator
100 µF24 v(typical)
50 Hz multivibrator
drive circuit
Slip ring Slip ring
F igure 9.7 Ar r angements for obtaining a recurrent surge oscil lograph from a rotor
winding. (a) Recurrent surge generator. (b) Connection of the recurrent surge gener ator to a rotor wi nding.
Earth faults may be approximately located by taking the ratio of the times for
reflections from the fault and from the end of the winding. Similarly the electrical
length of the winding can be estimated by measuring the time for the surge to make
a single pass through the winding. This can be done by short-circuiting the far end of
the winding to obtain a trace like that in part (ii) of Figure 9.8(a). Any shortening of
the length indicates that shorted turns are present in the winding.The surge impedance of a rotor winding lies between 20 and 30 . A deviation
becomes observable on the RSO trace when the impedance to earth of the fault is
a significantly small multiple of the surge impedance. In general, the technique can
detect faults with impedances to earth of less than 500–600. Similarly the technique

8/20/2019 Condition Monitoring Knjiga
http://slidepdf.com/reader/full/condition-monitoring-knjiga 229/306
206 Conditi on monitor ing of rotati ng el ectri cal machines
V o l t a g
e
V o l t a g
e
Time
ResponseE
Voltage step
E
Voltage step
Response
(i) Open-circuit line
t - time to traverse one length of the windingE - start of reflection from winding end
0 t 2t 3t 4t 0 t 2t 3t 4t
Time
(ii) Short-circuited line
Y 1
0 2t
Y 2
0 2t
Y 3
0 2t
0 2t
0 2t
0 2t
E F E
0 2t
F E
(i) (ii) (iii)
X = 10 µs/div
Y 1 - slip ring 3 to earth
Y 2 - slip ring 4 to earth
Y 3 Y 1 & Y 2 superimposed
E - start of reflection from
winding end (open
circuited)F - start of reflection
from fault
Speed 0 rpm
Winding type: progressive
RSO for healthy rotor winding
X = 10 µs/div
Y 1 - slip ring 1 to earth
Y 2 - slip ring 2 to earth
Y 3 Y 1 & Y 2 superimposed
X = 5 µs/div
ditto
RSO for faulted rotor winding
0 2t
0 2t
(a)
(b)
Fi gure 9.8 Ideal and typical practical recurrent surge oscill ographs obtained from gener ator rotor windings. (a) Appli ed voltages to rotor winding.(b) Typical responses for rotor winding.
can detect a turn-to-turn fault that has a resistance significantly less than the surge
impedance, say of the order of 10 down to zero.
To carry out RSO measurements the generator must be isolated, the field de-
energised and the exciter connection disconnected. It is known that many rotor faults

8/20/2019 Condition Monitoring Knjiga
http://slidepdf.com/reader/full/condition-monitoring-knjiga 230/306
Electrical techniques: current, flux and power monitoring 207
are affected by both gravitational and centrifugal forces upon the conductors during
rotation, so it is common to carry out the tests stationary, at barring and at speed for
comparison purposes. The test has now been applied by many utilities as a routine
technique for assessing the operational state of machine windings, although it is clear
it cannot be used for brushless machines without the rotor being stationary.
The advantages of the technique are that with the oscillographs it provides a per-
manent record of the state of a rotor throughout its service life and it can detect both
earth and inter-turn faults before their resistance falls to a value where large fault cur-
rents flow. Experience has shown that the deterioration of a winding can be assessed
by a comparison between oscillographs obtained from the same rotor. It is not possi-
ble, however, to make comparisons between oscillographs from different rotors, even
if they are of the same design, because of the effects on the surge propagation of quite
small variations between the insulation and rotor body properties of different rotors.
The disadvantages are that it detects faults of high resistance and is unable to
differentiate between faults that are operationally significant and those that are not.
Also, it cannot be used on-line, testing the winding under truly operational mechanical
and thermal conditions. This is in contrast to the effectiveness of the airgap search coil
or circulating current method that can provide on-line information. There are a number
of modern references that cover this and other techniques including Ramirez-Nino
and Pascacio [16] and Streifel et al . [17].
9.4 M otor rotor faults
9.4.1 General
The rotors of other electrical machines can be highly stressed, though perhaps not
to the same degree as turbine generators. Table 2.4 from Chapter 2 shows that large
induction motors can have mechanical, electrical or magnetic loadings higher than
larger machines and squirrel cage or wound rotors have had problems, as the expe-
rience of Tavner et al . [18] shows. A number of both electrical and mechanical
techniques have developed to monitor these problems. This section deals with the
electrical techniques.
9.4.2 Airgap search coil s
The work on airgap search coils, described in Section 9.3.2, was all on turbine gen-
erators but there is no reason why such methods could not be successfully applied to
smaller machines. Indeed Kamerbeek [19] has successfully used the method exper-
imentally on small induction motors but for measuring torque rather than machine
faults. A paper by Seinsch [20] has applied this technique to induction motors using
a distributed coil on the stator.
9.4.3 Stator current monitori ng for rotor faults
Although the technique of using a stator search coil has not been widely used, it
is possible to use the stator winding itself as a search coil, in a somewhat similar

8/20/2019 Condition Monitoring Knjiga
http://slidepdf.com/reader/full/condition-monitoring-knjiga 231/306
208 Conditi on monitor ing of rotati ng el ectri cal machines
way to the method described for generators in Section 9.3.3. Any rotor fault in an
induction motor will cause a characteristic swing in the supply ammeter reading,
which maintenance staff have come to recognise as indicating that trouble is on its
way. Careful measurement of the stator current will therefore enable such a fault to
be monitored.
The current drawn by an ideal motor should have a single component of supply
frequency. Changes in load will modulate the amplitude of the current to produce side
bands. Faults in the rotor circuit will generate a side band below the supply frequency
and displaced from it by twice the slip frequency. This effect was described in the
references in Tavner et al . [18] and an explanation is given here. A motor winding
with p pole pairs and supply frequency ωse produces a fundamental stator radial
MMF wave, f 1, at mechanical angle θ 1 containing odd harmonics only. Consider the
fundamental MMF wave
f 1(t ) = N 1I 1 sin(ωse t − p θ 1) (9.9)
where N 1 is the number of stator turns and I 1 is the stator current.
The angle, θ 2, on the rotor is given by
θ 2 = θ 1 − ωr m t (9.10)
where ωr m is the angular speed of the rotor and the rotational speed N = 60ωr m /2π ,
so that for a p pole pair rotor the rotor sees the MMF:
f 1(t ) = N 1I 1 sin[(ωse − p ωr m )t − p θ 2] (9.11)
This MMF rotates forward with respect to the rotor at the slip speed; however,
under normal circumstances the rotor carries induced currents, which establish a
fundamental rotor MMF wave, f 2, to counter the stator MMF and move at the same
speed:
f 2(t ) = N 2I 2 sin[(ωse − p ωr m )t − p θ 2] (9.12)
If the rotor has a fault, such as a broken bar, the MMF due to the rotor current ismodulated by sin 2p θ 2 so that:
f 2(t ) = N 2I 2 sin[(ωse − p ωr m )t − p θ 2] sin 2p θ 2 (9.13)
Therefore for a p pole pair machine:
f 2(t ) = N 2I 2
2cos[(ωse − pw r m )t − 3p θ 2] − cos[(ωse − pw r m )t + p θ 2] (9.14)
Referring this MMF to the stator, as the counter to (9.11), using (9.10) gives
f 2(t ) = N 2I 2
2cos[(ωse + 2p ωr m )t − 3p θ 1] − cos[(ωse − 2p ωr m )t + p θ 1]
(9.15)

8/20/2019 Condition Monitoring Knjiga
http://slidepdf.com/reader/full/condition-monitoring-knjiga 232/306
Electrical techniques: current, flux and power monitoring 209
which if we use the fractional slip
s =
ωse − p ωr m
ωse
for a p pole pair induction machine gives
θ 2 = θ 1 − (1 − s )
p ωse t (9.16)
f 1(t ) = N 2I 2
2(cos(3 − 2s )ωse t − 3p θ 1) − (cos(1 − 2s )ωse t − p θ 1) (9.17)
Note that these fundamental MMF wave equations (9.11) and (9.17) echo equations
(8.22) and (8.23) in Chapter 8 where all harmonic MMFs were considered in the
excitation of stator core vibrations by the airgap MMF wave acting on the bore of
the core.
The first component of MMF in (9.17) induces zero-sequence EMFs in the three-
phase stator winding, because it contains 3ωse t and 3θ 1, and gives rise to no current
contribution from the supply. The second component of MMF, however, induces
a proper three-phase set of currents at the normal supply frequency but contains a
component, or side band, 2s ωse below that frequency.
This is twice the slip frequency modulation of the supply current that is seen as
the swing on the ammeter reading. Such a cyclic variation in the current reacts back
onto the rotor to produce a torque variation at twice the slip frequency that, if the rotor does not have an infinitely high inertia, gives rise to the 2sp ωr m variation in speed or
2s ωse variation in mechanical vibration, that can also be used for fault detection as
described in Chapter 8, Section 8.6.4. This speed effect reduces the lower side band,
(1 − 2s )ωse , current swing and produces an upper side band at (1 + 2s )ωse , enhanced
by modulation of the third harmonic flux in the stator and it can be shown that other
side bands at (1 ± 2ns )ωse are also found. The ratio of the lower side band amplitude
to the main supply frequency component gives a straightforward indication of the
extent of rotor damage, as described by Jufer and Abdulaziz. [21].
The supply current can be monitored very easily, without interfering with themachine, simply by fitting a clip-on current transformer around the supply cable to
the motor or around the cable of the protection current transformer used to monitor
the motor current, see Figure 9.9. The normal procedure is to use a spectrum analyser
package in a PC connected via an A/D converter to the current transformer. Surveys
of the supply currents to a number of motors can be taken at regular intervals, or
when a fault is suspected. Figure 9.10 shows the power spectral density (PSD) for
the current from two identical machines. The motor in Figure 9.10(a) had a rotor
fault corresponding to three fractured cage bars, shown by spectral components at
about 48, 49, 51 and 52 Hz; that is, a slip frequency of 0.5 Hz for n =
1 or 1 Hzfor n = 2 and a slip s of 1 per cent, with side bands described by (1 ± 2ns )f se .
The lower side band, due to the MMF modulation, can clearly be distinguished from
the supply frequency and an estimate of the fault severity can be made by taking the
ratio between the amplitudes of the lower side band and the fundamental frequency.

8/20/2019 Condition Monitoring Knjiga
http://slidepdf.com/reader/full/condition-monitoring-knjiga 233/306
210 Conditi on monitor ing of rotati ng el ectri cal machines
3 phase supply
Regular portable monitor
A
f
Load
Occasional monitorspectrum analyser
Motor
To alarm systemand control room
A to Dconverter
Digitalspectrumanalyser
Software todetect spectral
peaks
Fi gure 9.9 D etecting side bands in the supply current of an induction motor
Because the current measuring technique looks into the motor from the terminals it is
also possible to see beyond the electrical circuits and detect faults on the mechanical
load train such as worn gear teeth, which the motor is driving. Figure 9.10(a) shows a
wider frequency range current spectrum from the motor, with no (1 − 2s ) component,
indicating rotor damage, but other side bands due to the motor driving a load with a
damaged gearbox.
Interpretation of the current spectrum requires a relatively skilled operator to
carry out a survey of machines and it cannot be considered as continuous monitoring.
Normal practice would be to carry out a survey whenever ammeter swings indicatethat a problem is imminent. Where motors of high value are at risk, more frequent or
continuous monitoring may be necessary. Detection can be more difficult when the
motor speed is varying rhythmically because of the driven load, such as a belt or mill
drive, or if the frequency variation is significant, for example on a relatively small
power system.
The technique has stimulated a surge in investigations in the literature as analysts
seek to describe the precise conditions under which faults can be detected. Examples
include Menacer et al . [22] and Li and Mechefske [23], who make a comparison
between current, vibration and acoustic methods of detection.
9.4.4 Rotor curr ent monitori ng
The rotor circuits of wound rotor motors are usually poorly protected in most installa-
tions. Faults in brazed joints and slip-ring connections have sometimes caused severe

8/20/2019 Condition Monitoring Knjiga
http://slidepdf.com/reader/full/condition-monitoring-knjiga 234/306
Electrical techniques: current, flux and power monitoring 211
44 56Frequency, Hz
50
Gearbox in the drivecomponents due to
mechanical phenomenon
No ± 2 sf 1 Sidebands
f 1 = 50.156 Hz
Gearbox in the drivecomponents due to
mechanical phenomenon
44 56Frequency, Hz
50
3 6
. 2 d B
Components due to
mechanical phenomenon
Components due to
mechanical phenomenon
f 1 = 50.156Hz
−2 sf 1 (0.719 Hz) +2 sf 1 (0.719 Hz)
C u r r e n t w a v e f o r m
P S D
, d B
C u r r e n t w a v e f o r m
P S D
, d B
(a)
(b)
Fi gure 9.10 Supply current spectra from induction motor dri ve trains: (a) with a faul t in an attached gear box; (b) wi th a rotor cage defect. [ Taken from Thomson et al. [9]]
damage because they have not been detected promptly. Overheating of rotors can
also be caused by current imbalance in the external resistors or circuits connected
to the slip rings. The low frequency of these currents makes measurements withconventional current transformers inaccurate. Faults of these types were some of the
reasons that encouraged the development of proprietary leakage flux technique that is
described later in Section 9.5 [24]. However, low-frequency currents can be measured
accurately by Rogowski coils. These have been used to monitor the rotor resistance

8/20/2019 Condition Monitoring Knjiga
http://slidepdf.com/reader/full/condition-monitoring-knjiga 235/306
212 Conditi on monitor ing of rotati ng el ectri cal machines
3 phase supplyLoad
Motor
Slip rings
Rotorresistances
To alarm systemand control room
Integrators
Summer
Comparators Processingelectronics
Fi gure 9.11 Continuous monitor of rotor curr ent in a wound rotor induction motor
currents in variable speed wound rotor motors as shown in Figure 9.11. The signals
from the Rogowski coils are integrated to give a voltage proportional to rotor current.
These signals are summed to give the mean current in all three phases of the rotor and
are compared to the individual phase currents. Processing electronics then detects
whether severe unbalance is present and provides amplitude and alarm signals to the
control room. The approach described in Reference 24 is based upon a protection phi-
losophy, in that indications from the monitor are used to trip the machine. In practice,however, the instrument has been used to provide monitoring indications that assist
in determining when motors should be taken out of service for repair.
9.5 G ener ator and motor compr ehensive methods
9.5.1 General
The reader should be able to see, both from the introduction to this chapter and from the methods that have been described, that electrical techniques have much
in common. There would seem to be some advantage in devising a single electrical
technique that is capable of detecting all electrical faults, whether they are on the rotor
or stator. Trutt et al . [25], Kohler et al . [26] and Sottile et al . [27] have advocated

8/20/2019 Condition Monitoring Knjiga
http://slidepdf.com/reader/full/condition-monitoring-knjiga 236/306
Electrical techniques: current, flux and power monitoring 213
this generalised approach to the monitoring of the terminal quantities of induction
machines and Sottile et al . [28] have applied the same technique to three-phase
synchronous generators. We describe four techniques that detect faults by measuring
the effect they have on the machine terminal quantities.
9.5.2 Shaft flux
Shaft flux, or more generally axial leakage flux, occurs in all electrical machines. It
is produced because no machine can be constructed with perfect symmetry. There
will always be, for example, slight differences in the reluctance of magnetic circuits
due to building tolerances, core-plate anisotropy, and plate thickness variation [29].
This asymmetry is reflected in the impedances presented by the various phase groups,
or coils in the machine stator, and will cause slight variations between the currents
flowing in the coils. It is also the cause of homopolar fluxes in the machine shaft that
can lead to shaft voltages as described in a later section.
This asymmetry, together with small differences in the electrical properties of the
conductors and variations in the physical disposition of the conduction in both the
active length and end regions of machines, will give rise to a net difference between
the currents flowing in one section of the end winding when compared with the
corresponding section diametrically opposite. The imbalance leads naturally to a net
axial flux component. A similar argument can be applied to the rotor circuits; hence
one can expect to measure axial flux, even in machines that are in ‘perfect health’.
It is a simple extension of this to consider what happens when certain fault con-ditions arise in a machine. Faults, such as winding short circuits, voltage imbalance
and broken rotor bars, represent severe disruptions to the internal symmetry of the
machine. It is logical to conclude, therefore, that the effect on the production of axial
flux will be readily observable. Any gross change of magnetic circuit conditions, such
as the formation of an eccentric airgap due to bearing wear, will, by the same token,
be reflected with a corresponding change in axial leakage flux.
The purpose of axial flux monitoring is therefore to translate observed differences
in the nature of the axial leakage flux into an indication of fault condition. The
production of such fluxes in squirrel cage rotor induction machines was studied byJordan et al . [30,31] with particular emphasis on the changes occurring due to static
eccentricity. Erlicki et al . [32] showed that it is possible to detect the loss of a supply
phase through axial flux monitoring.
In the 1970s in the UK a large power station boiler auxiliary induction motor,
equipped with two stator windings for two-speed operation, was operating on one
winding with a shorted turn on the idle winding. Circulating currents in the faulty
idle winding, induced by the energised winding, caused degradation of the insula-
tion, charring and the generation of flammable gases (see Chapter 7, Section 7.2).
Eventually these gases entered the terminal box, ignited, bursting the terminal box and causing a fatality. This incident galvanised interest in the UK in motor monitoring,
because it was quickly realised that the faulted idle winding could have been detected
by monitoring the axial leakage flux of the machine, particularly by mounting a search
coil around the rotor shaft.

8/20/2019 Condition Monitoring Knjiga
http://slidepdf.com/reader/full/condition-monitoring-knjiga 237/306
214 Conditi on monitor ing of rotati ng el ectri cal machines
Rickson [24] developed a protection device based on this principal. Penman et al .[33] showed that more discrimination could be achieved between a variety of fault
conditions by carefully processing the axial flux signal and this initiated Penman’s
work on machine condition monitoring.
The technique relies upon examining the changes in the spectral components
of the axial flux. These components arise as described below. Since the fluxes are
produced by winding currents, the frequency of these flux components must be related
to the frequencies of the currents. Rotor currents are also induced by the airgap flux,
so the net airgap flux will be modified as a result. While the rotor is at rest the
airgap field results solely from the currents flowing in the stator; hence only the time
harmonics present in the line currents will appear in the axial flux. Once the rotor
moves, however, it does so with an angular speed, ωr m = (1 − s )ωse /p , with respect
to the stator, where p is the number of pole pairs in the machine. The airgap flux
components will consequently be frequency filtered. For example, in the normal
three-phase stator winding, the airgap field produced, b stator , can be approximated up
to the seventh harmonic by the form
b 1(t ) = B 1 cos(ωse t − p θ 1) + B 5 cos(ωse t + 5p θ 1)
− B 7 cos(ωse t − 7p θ 1) + · · · (9.18)
We can transform this expression into a frame of reference moving with the rotor
by considering Figure 9.12, which shows the relationships between a fixed point in
the stator and a fixed point on the rotor:θ 2 = θ 1 − ωr m t (9.10)
Stator
Rotor
Stator ref.
R o t o r
r e f.
Q2 = w rm t
Q
Q
2
Q1
Fi gure 9.12 Rotor and stator frames of reference

8/20/2019 Condition Monitoring Knjiga
http://slidepdf.com/reader/full/condition-monitoring-knjiga 238/306
Electrical techniques: current, flux and power monitoring 215
However, for an induction machine with p pole pairs:
φ2 = θ 1 − (1 − s )
p ωse t (9.16)
Using these expressions it can be shown that the n th term of the airgap field in the
stator frame is
b n 1(t ) = B n cos[(1 ± (1 − s )n ωse t ) ± np θ 1] (9.19)
The rotor frame expression corresponding to (9.18) is
b 2(t ) = B cos(s ωse t − p θ 2) + B 5 cos((6 − 5s )ωse t − 5p θ 2)
− B 7 cos((7s − 6)ωse t − p θ 2) + · · · (9.20)
The first airgap harmonic produces currents at s times the supply frequency; the fifth
airgap harmonic produces time frequencies of (6−5 s ) times and so on.
It is now apparent that the axial flux spectrum is rich in harmonics, even in a well-
constructed, healthy machine. Moreover, because fault conditions such as shorted
turns, loss of phase, eccentricity and so on, cause changes in the space harmonic
distributions in the airgap, such conditions will be accompanied by a corresponding
change in the time harmonic spectrum of axial flux. Furthermore, by effectively using
the stator winding as a search coil to detect rotor faults, and the rotor winding to detect
stator faults, it is possible to gain insight into the harmonic changes to be expected for a given fault condition.
Let us follow a typical fault condition through the diagnostic procedure. If we
assume that an inter-turn short circuit exists in the stator winding then this condition
can be represented as a single pulse of MMF, similar to that shown in Figure 9.13.
/22 Θ Π 3Π /22 2Π
Θ
H(Θ)
P /2 Q P 3 P /2 2 P
Q
H(Q)
Fi gure 9.13 M M F due to a single fully pitched coil

8/20/2019 Condition Monitoring Knjiga
http://slidepdf.com/reader/full/condition-monitoring-knjiga 239/306
216 Conditi on monitor ing of rotati ng el ectri cal machines
The components of the stator airgap field b stator generated by this distribution are
b 1(t ) =
n =1,3,5 ...
B n cos(ωse t ± n θ) (9.21)
The n th component in the rotor frame will therefore be
b n ,2(t ) = B n cos
1 ± (1 − s )
n
p
ωse t ± n θ 2
(9.22)
These harmonics will induce currents in the rotor circuits, and because there are
asymmetries in the rotor magnetic and electric circuits, they will appear as addi-
tional components in the spectrum of axial flux. Table 9.1 at the end of the chapter
summarises the angular frequency components arising in the axial flux. Figure 9.14
A x i a l c o i l e m f a m p l i t u d e
0 500
Frequency, Hz
(a )
100 200 300 400
A x i a l c o i l e m f a m p l i t u d e
0 500
Frequency, Hz
(b )
100 200 300 400
A x i a l c o i l e m f a m p l i t u d e
0 500
Frequency, Hz
(c)
100 200 300 400
A x i a l c o i l e m f a m p l i t u d e
0 500
Frequency, Hz
(d )
100 200 300 400
0
500
0
2000
0
2500
0
500
Fi gure 9.14 Typical spectra taken at identical gains from an axial fl ux search coil fitted to an experimental motor. (a) Good rotor, no faults, no load; (b) Broken rotor bar, no other faults; (c) Good r otor, l arge stator shorted turn 1 amp, no load; (d) Good rotor, small stator negative phase sequence, no load.
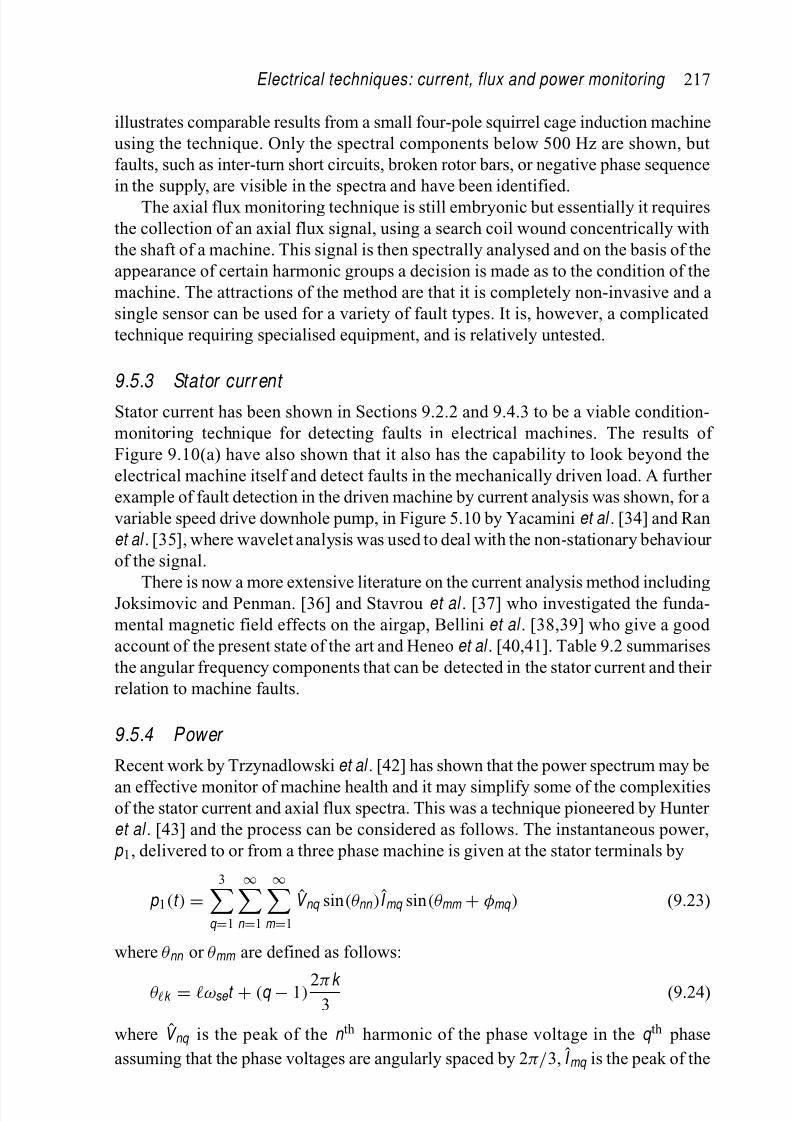
8/20/2019 Condition Monitoring Knjiga
http://slidepdf.com/reader/full/condition-monitoring-knjiga 240/306
Electrical techniques: current, flux and power monitoring 217
illustrates comparable results from a small four-pole squirrel cage induction machine
using the technique. Only the spectral components below 500 Hz are shown, but
faults, such as inter-turn short circuits, broken rotor bars, or negative phase sequence
in the supply, are visible in the spectra and have been identified.
The axial flux monitoring technique is still embryonic but essentially it requires
the collection of an axial flux signal, using a search coil wound concentrically with
the shaft of a machine. This signal is then spectrally analysed and on the basis of the
appearance of certain harmonic groups a decision is made as to the condition of the
machine. The attractions of the method are that it is completely non-invasive and a
single sensor can be used for a variety of fault types. It is, however, a complicated
technique requiring specialised equipment, and is relatively untested.
9.5.3 Stator curr ent
Stator current has been shown in Sections 9.2.2 and 9.4.3 to be a viable condition-
monitoring technique for detecting faults in electrical machines. The results of
Figure 9.10(a) have also shown that it also has the capability to look beyond the
electrical machine itself and detect faults in the mechanically driven load. A further
example of fault detection in the driven machine by current analysis was shown, for a
variable speed drive downhole pump, in Figure 5.10 by Yacamini et al . [34] and Ran
et al . [35], where wavelet analysis was used to deal with the non-stationary behaviour
of the signal.
There is now a more extensive literature on the current analysis method includingJoksimovic and Penman. [36] and Stavrou et al . [37] who investigated the funda-
mental magnetic field effects on the airgap, Bellini et al . [38,39] who give a good
account of the present state of the art and Heneo et al . [40,41]. Table 9.2 summarises
the angular frequency components that can be detected in the stator current and their
relation to machine faults.
9.5.4 Power
Recent work by Trzynadlowski et al . [42] has shown that the power spectrum may be
an effective monitor of machine health and it may simplify some of the complexitiesof the stator current and axial flux spectra. This was a technique pioneered by Hunter
et al . [43] and the process can be considered as follows. The instantaneous power,
p 1, delivered to or from a three phase machine is given at the stator terminals by
p 1(t ) =
3q =1
∞n =1
∞m =1
V nq sin(θ nn )I mq sin(θ mm + φmq ) (9.23)
where θ nn or θ mm are defined as follows:
θ k = ωse t + (q − 1)2πk 3
(9.24)
where V nq is the peak of the n th harmonic of the phase voltage in the q th phase
assuming that the phase voltages are angularly spaced by 2π/3, I mq is the peak of the

8/20/2019 Condition Monitoring Knjiga
http://slidepdf.com/reader/full/condition-monitoring-knjiga 241/306
218 Conditi on monitor ing of rotati ng el ectri cal machines
m th harmonic of the phase current in the q th phase assuming that the phase currents are
angularly spaced by 2π/3, q is the phase number, n is the voltage harmonic number, m is the current harmonic number, and φnq is the phase angle between the phase current,
I nq , and the phase voltage, V nq .If the load on the machine is perfectly balanced between the three phases and
the voltages and currents contain no harmonics then the expression for instantaneous
power reduces to
p 1(t ) = V 1 I 1
3q =1
sin (θ 11 + φ) (9.25)
p 1(t ) =V 1 I 1
2
3
q =1
cosφ − cos(θ 2,2 + φ) (9.26)
The second term in brackets sums to zero because the three phase components are
spaced in phase at 4π/3 radians. The net balanced power delivered to or from the
stator of the machine is therefore as expected:
P 1 = 3
2V I cos φ (9.27)
Consider the case where the peak phase voltages are balanced and include harmon-
ics, V n
, but the phase currents are unbalanced and also include harmonics. Equation
(9.25) can be rewritten in terms of the peak positive, negative and zero sequence
harmonic currents, I +m , I −m and I 0m respectively, as follows:
p 1(t ) =
∞n =1
∞m =1
V n sin(θ n )I +m sin(θ +m + φ+m )
+ I −m sin(θ −m + φ−m ) + I 0m sin(θ 0m + φ0m ) (9.28)
where in this case:
θ n = n ωse t
θ +m = +m ωse t
Equation (9.28) reduces to
p 1(t ) =
∞
n =1
∞
m =1
V n I +m
2
cos(θ (m −n )(m −n ) + φ+m ) − cos(θ (m +n )(m +n ) + φ+m )
+V n I −m
2 cos(θ −(m −n )(m −n ) + φ−m )
− cos(θ −(m +n )(m +n ) + φ−m )
+V n I 0m
2
cos(θ (m −n )−n + φ0m ) − cos(θ (m +n )+n + φ0m )
(9.29)

8/20/2019 Condition Monitoring Knjiga
http://slidepdf.com/reader/full/condition-monitoring-knjiga 242/306
Electrical techniques: current, flux and power monitoring 219
When m = n a DC contribution is made to the power in each phase as shown in
(9.27). For harmonic components of power, however, because of the presence of the
phase factor, (q − 1)2π/3, a contribution to the power only occurs when (m − n ) or
(m + n ) are multiples of 3, or are triplens. These contributions will be at ±(m − n )ωse
t or ±(m + n )ωse t , depending on whether the positive or negative sequence currents
are contributing to the power.
From inspection of the last term in (9.29) it can be seen that there will be no zero
sequence contribution to the ripple in instantaneous power. This is because for all
values of n the term in (q − 1)2π/3 in θ ensures that the summation over three phases
always comes to zero.
An application of these equations to the power condition monitoring of an electri-
cal machine would be a three-phase induction motor with a broken cage. We already
know from Table 9.1 that at a fundamental supply voltage angular frequency of ωse
the fundamental supply current will contain components at (1 ± 2s )ωse .
Therefore for the first and (1−2s )th harmonics of voltage and current respectively
±(m − n )ωse = ±2s ωse
±(m + n )ωse = ±2(1 − s )ωse
So the power spectrum due to the fundamental supply voltage will contain components
at 2s ωse and 2(1 − s )ωse .
An example of this was simulated by Trzynadlowski et al . [42], as shown in
Figure 9.15, for a six-pole induction motor with a damaged rotor fed at f se = 60 Hz
with a very large slip at this operating condition of 15.8 per cent, therefore the side
bands on the current PSD spectrum due to damage are positioned above and below
the 60 Hz fundamental, at 41 Hz and 79 Hz, whereas on the power PSD spectrum the
damage side band is positioned at 19 Hz.
9.5.5 Shaft voltage or current
Many electrical power utilities have attempted to monitor the voltages induced along
the shafts of electrical machines in the hope that they may be a useful indicator of
machine core or winding degradation and because they can give rise to large shaftcurrents, which are damaging to bearings. Figure 9.16 shows how a voltage can be
induced between contacts sliding on a rotating machine shaft whenever fluxes in
the machine are distorted, either from the normal radial and circumferential pattern,
or from the normal axial pattern. These sliding contacts may be the result of rubs
on defective bearings or seals or could be brushes placed to detect flux distortion.
The brushes would normally be placed at either end of the machine to embrace the
complete shaft flux circuit. If a fault, such as a rotor winding shorted turn, produces
a rotating distortion of the field in the radial and circumferential plane then an AC
or pulsating shaft voltage results. If a fault produces a distortion of the field in theaxial direction then this gives rise in effect to a homopolar flux that produces a DC
shaft voltage. In steam turbine-driven machines, shaft voltages can also be produced
by electrostatic action, where the impingement of water droplets on turbine blades
charges the shaft. Verma and Girgis [44] have given a full report on the mechanisms for

8/20/2019 Condition Monitoring Knjiga
http://slidepdf.com/reader/full/condition-monitoring-knjiga 243/306
220 Conditi on monitor ing of rotati ng el ectri cal machines
C u r r e n t w a v e f o r m
P S D ,
d B
0
−
100 0 250
−20
−80
50
Frequency, Hz
200100 150
−40
−60
P o w e r w a v e f o r m
P S D ,
d B
0 25050
Frequency, Hz
200100 150
(a)
(b )0
−100
−20
−80
−40
−60
Fi gure 9.15 Spectra from a simulation of an induction motor wi th broken rotor bars. The upper curve shows the current spectrum with the typical fault side bands. The lower graph shows the power spectrum with the fault side band shifted down to D C. (a) Cur rent spectrum w ith typical fault sidebands; (b) power spectrum with fault sideband shifted down to DC. [Taken from Trzynadlowski et al. [42]. © IEEE (1999)]
the production of shaft voltages and currents and the faults they may indicate. Methods
of monitoring shaft voltages usually include making AC and DC measurements of
the voltage and sometimes analysing the harmonic content of the waveform. Verma proposed a comprehensive shaft voltage monitor in [44] and Nippes a more up-to-date
version in [45].
Our experience, however, is that shaft voltage has not proved to be a useful
parameter for continuous monitoring. The voltage is difficult to measure continuously,
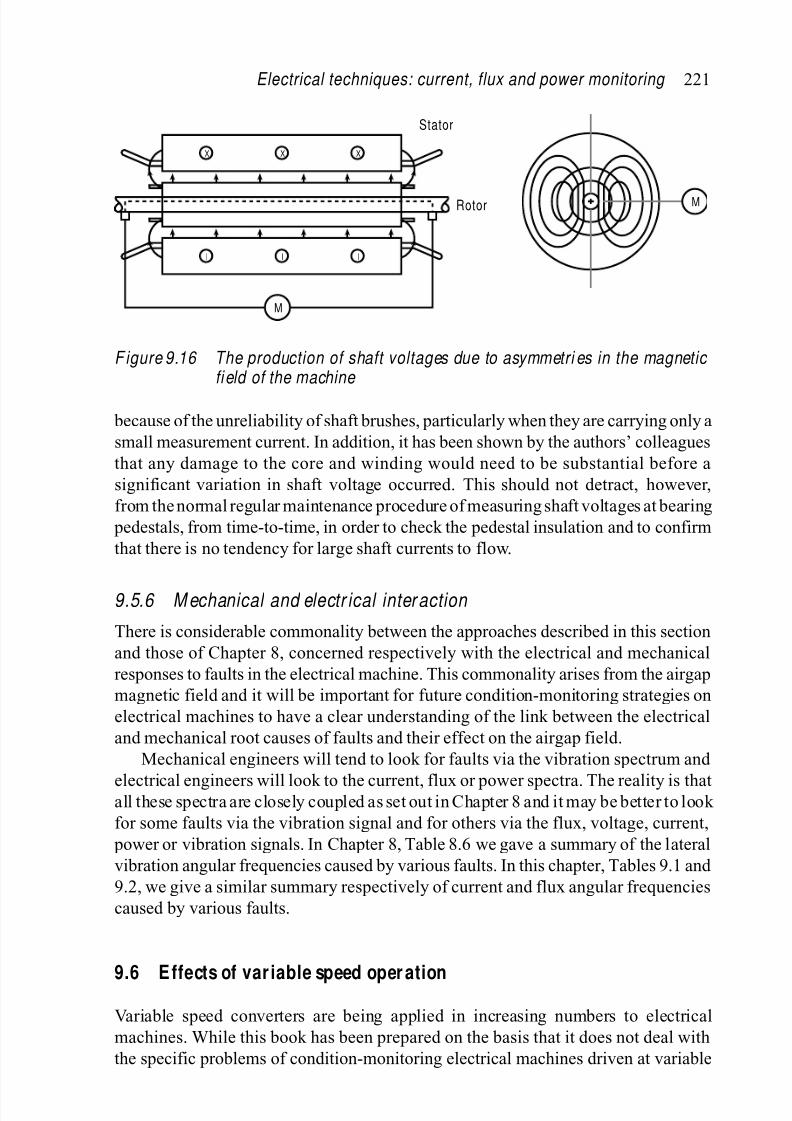
8/20/2019 Condition Monitoring Knjiga
http://slidepdf.com/reader/full/condition-monitoring-knjiga 244/306
Electrical techniques: current, flux and power monitoring 221
M
M
II I
XX X
Stator
Rotor
F igure 9.16 The production of shaft voltages due to asymmetri es in the magnetic fi eld of the machine
because of the unreliability of shaft brushes, particularly when they are carrying only a
small measurement current. In addition, it has been shown by the authors’ colleagues
that any damage to the core and winding would need to be substantial before a
significant variation in shaft voltage occurred. This should not detract, however,
from the normal regular maintenance procedure of measuring shaft voltages at bearing
pedestals, from time-to-time, in order to check the pedestal insulation and to confirm
that there is no tendency for large shaft currents to flow.
9.5.6 M echanical and electr ical inter action
There is considerable commonality between the approaches described in this section
and those of Chapter 8, concerned respectively with the electrical and mechanical
responses to faults in the electrical machine. This commonality arises from the airgap
magnetic field and it will be important for future condition-monitoring strategies on
electrical machines to have a clear understanding of the link between the electrical
and mechanical root causes of faults and their effect on the airgap field.
Mechanical engineers will tend to look for faults via the vibration spectrum and
electrical engineers will look to the current, flux or power spectra. The reality is thatall these spectra are closely coupled as set out in Chapter 8 and it may be better to look
for some faults via the vibration signal and for others via the flux, voltage, current,
power or vibration signals. In Chapter 8, Table 8.6 we gave a summary of the lateral
vibration angular frequencies caused by various faults. In this chapter, Tables 9.1 and
9.2, we give a similar summary respectively of current and flux angular frequencies
caused by various faults.
9.6 E ffects of var iable speed oper ation
Variable speed converters are being applied in increasing numbers to electrical
machines. While this book has been prepared on the basis that it does not deal with
the specific problems of condition-monitoring electrical machines driven at variable

8/20/2019 Condition Monitoring Knjiga
http://slidepdf.com/reader/full/condition-monitoring-knjiga 245/306
222 Conditi on monitor ing of rotati ng el ectri cal machines
speed, it will be useful here to identify the key problems that may arise from condition
monitoring such drives.
• If the speed of the drive remains constant for substantial periods of time then
the spectral analysis of flux, voltage, current, power or vibration as described in
Chapters 8 and 9 can still be done provided that the results are interpreted for the
speed and base frequency when the measurements were made.
• However, if the speed is varying then non-stationary techniques, such as spectro-
grams over short time intervals, wavelets or Wigner–Ville techniques, dependent
on the rate of change of speed, will need to be used with the monitoring signals
because the spectra will not be stationary.
• If speed is varying under control loop action then the frequency content of the
monitoring signals will be affected by the bandwidth of the controller, as described
by Bellini et al . [46]. In this case it is possible for the drive controller to suppressfault harmonic signals in the flux, voltage, current, power or vibration. However,
Bellini has shown that it is still possible to extract condition-monitoring infor-
mation from signals derived inside the controller; in Bellini’s example, this was
done from the direct axis current, i d .
• When supplied from a variable speed drive all terminal quantities of the electrical
machine, axial flux, current and power, will be polluted by harmonics generated
by the drive and filtering this pollution will be essential to obtaining a good
signal-to-noise ratio with condition-monitoring signals from such a machine.
Chen et al . [47] has demonstrated a condition-monitoring system for variable
speed induction motors using the power line as his communication channel. This is a
brave attempt to achieve universal monitoring and wisely the author has avoided
monitoring the electrical signals but concentrated upon monitoring the winding
temperature.
Table 9.1 Axial flux angular frequency components related to specific induction
machine assymmetr ies equation (9.22). [ Taken fr om Vas [ 48] ]
Space harmonic of the stator winding MMF
k = 1 k = 3 k = 5 k = 7
Angular frequency components, rad/s
Stator s ωse (3s − 2)ωse (5s − 4)ωse (7s − 6)ωse
asymmetry (2 − s )ωse
(4 − 3s )ωse
(6 − 5s )ωse
(8 − 7s )ωse
Rotor s ωse (3 − 2s )ωse (5 − 4s )ωse (7 − 6s )ωse
asymmetry (2s − 1)ωse (4s − 3)ωse (6s − 5)ωse (8s − 7)ωse

8/20/2019 Condition Monitoring Knjiga
http://slidepdf.com/reader/full/condition-monitoring-knjiga 246/306
T a b l e 9 . 2
E l e c t r i c a l a n g u l a r f r e q u e n c y c o m p o n e n t s r e l a t e d t o s p e c i f i c e l e c t r i c a l m a c h i n e f a u l
t s
A n g u l a r f r e q u e n
c y c o m p o n e n t s , r a d / s
C u r r e n t
F
l u x
P o w e r
M e c h a n i c a l f a u l t s
O i l w h i r l a n d w h i p i n s l e e v e
b e a r i n g s
( 0 . 4 3
t o 0 . 4
8 ) ω s e / p
U n b a l a n c e d m a s s o n r o t o r o f a
s y n c h r o n o u s m a c h
i n e
ω s e /
p
ω
s e / p
D y n a m i c e c c e n t r i c i t y i n a
s y n c h r o n o u s m a c h
i n e
2 ω s e
p
2 ω s e / p
D y n a m i c d i s p l a c e m e n t o f s h a f t i n
b e a r i n g h o u s i n g o f a s y n c h r o n o u s
m a c h i n e
ω s e /
p , 2 ω s e / p . . .
ω
s e / p , 2 ω s e / p . . .
S t a t i c m i s a l i g n m e n t o f r o t o r s h a f t i n
a s y n c h r o n o u s m a c h i n e
ω s e /
p , 2 ω s e / p ,
3 ω s e
/ p . . .
ω
s e / p , 2 ω s e / p ,
3 ω s e / p . . .
S t a t i c a n d d y n a m i c e c c e n t r i c i t y i n
i n d u c t i o n m a c h i n e
ω s e
( n N r ±
k e )
( 1 − s )
p
±
k
ω
s e
k e
( 1 − s )
p
±
k
E l e c t r i c a l f a u
l t s
B r o k e n r o t o r b a r i n i n d u c t i o n
m a c h i n e
( 1 ±
2 n s ) ω s e / p
s ω s e
. . .
( 2 s −
1 ) ω s e
. . .
2 n s ω
s e / p
2 n ( 1
−
s ) ω s e / p
S t a t o r w i n d i n g f a u
l t s i n a
s y n c h r o n o u s m a c h
i n e
2 ω s e
, 4 ω s e
. . .
ω
s e
ω s e ,
3 ω s e
S t a t o r w i n d i n g f a u
l t s i n a n i n d u c t i o n
m a c h i n e
s ω s e
. . .
( 2 −
s ) ω s e
. . .
D e f i n i t i o n s : ω s
m
=
m e c h a n i c a l v i b r a t i o n f r e q u e n c y o n t h e s t a t o r s i d e ; ω s e =
e l e c t
r i c a l s u p p l y f r e q u e n c y ; N r =
i n t e g e r n u m b e r o f r o t o r s l o t s ; N
=
r o t a t i o n a l s p e e d
i n r e v / m i n ; f ω r m
=
2 π N
6 0
m e c h a n i c a l r o t a t i o n a l f r e q u e n c y ,
H z ; ω r m
=
ω s e / p f o r a s y n c h r o n o u s m a c h i n e ; ω r m
=
( 1
−
s ) ω s e / p f o r a n a s y n c h r o n o u s m
a c h i n e ; s =
a s y n c h r o n o u s m a c h i n e r o t o r s p e e d s l i p ,
0 −
1 ; p
=
p o l e p a i r s ; n =
a n i n t e g e r ; k e
=
e c c e n t r i c i t y o r d e r , z e r o f o r s t a t i c e c c e n t r i c i t y , l o w i n t e g e r v a l u e
1 ,
2 ,
3 …
f o r
d y n a m i c e c c e n t r i c i t y ; k =
s p a c e h a r m o n i c o f t h e
s t a t o r w i n d i n g M M F ,
1 ,
3 ,
5 ,
7 …

8/20/2019 Condition Monitoring Knjiga
http://slidepdf.com/reader/full/condition-monitoring-knjiga 247/306
224 Conditi on monitor ing of rotati ng el ectri cal machines
9.7 C onclusion
This chapter has shown that electrical techniques are powerful tools for the condi-
tion monitoring of electrical machines, particularly axial leakage flux, current and
power, offering the potential to provide a general condition-monitoring signal for the
machine.
The availability of high-quality, digitally sampled mechanical vibration and
electrical terminal data from electrical machines opens the possibility for more
comprehensive monitoring of the machine and prime mover or driven machine com-
binations. However, these signals generally require broad bandwidth (>50 kHz) and
a high data rate for adequate analysis. Therefore the principal difficulty of applying
these techniques is the complexity of the necessary spectral analysis and interpretation
of their content.
This situation is made more difficult if variable speed drives are involved because
time domain signals may no longer be stationary and will also be polluted by
harmonics from the power electronic drive.
Comprehensive monitoring of an electrical machine can be achieved by mea-
suring shaft flux, current, power and electrical discharge activity. These are broad
bandwidth (generally >50 kHz) signals requiring complex analysis. Shaft flux, cur-
rent and power signals are capable of detecting faults in both the electrical and
mechanical parts of a drive train. Shaft voltage or current is an ineffective condition-
monitoring technique for electrical machines. Shaft flux monitoring is non-invasive
and uses a single sensor but it is complex to analyse and untested in the field. Cur-rent monitoring is also non-invasive, but uses existing sensors and has established
itself as motor current spectral analysis, a reliable and widely accepted technique for
machine monitoring. Power monitoring is also non-invasive, uses existing sensors
but requires less bandwidth (<10 kHz) and less complex spectral interpretation to
detect faults but is not yet widely accepted, so it deserves investigation for future
development.
9.8 R eferences
1. Rai R.B. Airgap Eccentricity in Induction M otors . ERA Report, 1974:
1174–88.
2. Dorrell D.G., Thomson W.T. and Roach S. Analysis of airgap flux, current,
and vibration signals as a function of the combination of static and dynamic
airgap eccentricity in 3-phase induction motors. I EEE Tr ansactions on I ndustr y Applications 1997; I A-33: 24–34.
3. Hargis C. Steady-state analysis of 3-phase cage motors with rotor-bar and
end-ring faults. IEE Proceedings, Part B, Electric Power Applications 1983;130: 225.
4. Nandi S., Bharadwaj R.M., Toliyat H.A. and Parlos A.G. Performance analy-
sis of a three-phase induction motor under mixed eccentricity condition. IEEE Transactions on Energy Conversion 2002; EC -17: 392–9.

8/20/2019 Condition Monitoring Knjiga
http://slidepdf.com/reader/full/condition-monitoring-knjiga 248/306
Electrical techniques: current, flux and power monitoring 225
5. Penman J., Sedding H.G., Lloyd B.A. and Fin W.T. Detection and location
of interturn short circuits in the stator windings of operating motors. IEEE Transactions on Energy Conversion 1994; EC-9: 652–8.
6. Penman J. and Stavrou A. Broken rotor bars: their effect on the transient per-
formance of induction machines. IEE Proceedings, Part B, Electric Power Applications 1996; 143: 449–57.
7. Thomson W.T. and Fenger M. Current signature analysis to detect induction
motor faults. I EEE Industry Applications Magazine 2001; 7: 26–34.
8. Thomson W.T. and Barbour A. On-line current monitoring and application
of a finite element method to predict the level of static airgap eccentricity in
three-phase induction motors. I EEE Transactions on Energy Conver si on 1998;
EC-13: 347–57.
9. Thomson W.T., Rankin D. and Dorrell D.G. On-line current monitoring to diag-
nose airgap eccentricity in large three-phase induction motors-industrial case
histories verify the predictions. I EEE Transactions on Energy Conver sion 1999;
EC-14: 1372–8.
10. Michiguchi Y., Tonisaka S., Izumi S., Watanabe T. and Miyashita I. Develop-
ment of a collector ring monitor for sparking detection on generators. IEEE Transactions of Power Appar atus and Systems 1983; PAS-102: 928–33.
11. Warrington A.W.V.C. Protective Relays, their Theory and Pr actice , Vol. 1.
London: Chapman and Hall; 1982.
12. Khudabashev, K.A. Effect of turn short-circuits in a turbo generator rotor on its
state of vibration. Elekt Stantsii USSR 1961; 7: 40–5.13. Albright D.R. Inter-turn short circuit detector for turbine generator rotor
windings. I EEE Tr ansactions Power Apparatus and Systems 1971; PAS-50:
478–83.
14. Kryukhin S.S. A new principle for synchronous machine protection from rotor
winding inter-turn and double earth faults. El ect. Technol. U SSR 1972; 2: 47–59.
15. Pöyhönen S., Negrea M., Jover P., Arkkio A. and Hyötyniemi H. Numerical
magnetic field analysis and signal processing for fault diagnostics of elec-
trical machines. COMPEL: The International Journal for Computation and
Mathematics in Electrical and Electronic Engineering 2003; 22: 969–81.16. Ramirez-Nino J. and Pascacio A. (2001). Detecting interturn short circuits in
rotor windings. IEEE Transactions on Computer Applications in Power 2001;
CAP-14: 39–42.
17. Streifel R.J., Marks II R.J., El-Sharkawi M.A. and Kerszenbaum I. Detection
of shorted-turns in the field winding of turbine-generator rotors using novelty
detectors – development and field test. IE EE Tr ansactions on Energy Conver sion 1996; EC -11: 312–17.
18. Tavner P.J., Gaydon B.G. and Ward D.M. Monitoring generators and large
motors. IEE Proceedings, Part B, Electric Power Appli cations 1986; 133:169–80.
19. Kamerbeek E.M.H. Torque measurements on induction motors using Hall
generators or measuring windings. Phil ips Technical Review 1974; 34:
152–62.
8/20/2019 Condition Monitoring Knjiga
http://slidepdf.com/reader/full/condition-monitoring-knjiga 249/306
226 Conditi on monitor ing of rotati ng el ectri cal machines
20. Seinsch H.O. Detection and diagnosis of abnormal operating conditions and/or
faults in rotating electrical machines. Schorch Berichte 1986.
21. Jufer M. and Abdulaziz M. Influence d’une rupture de barre ou d’un anneau
sur les characteristiques externes d’un moteur asynchrone a cage. Bulletin
SEV/VSE, Switzerland, 1978; 69.
22. Menacer A., Nat-Said M.S., Benakcha A.H. and Drid S. Stator current anal-
ysis of incipient fault into induction machine rotor bars. Journal of Electrical Engineering 2004; 55: 122–30.
23. Li W.D. and Mechefske C.K. Detection of induction motor faults: A compari-
son of stator current, vibration and acoustic methods. Journal of Vibr ation and Control 2006; 12: 165–88.
24. Rickson C.D. Protecting motors from overload due to asymmetrical fault
conditions. El ectri cal Review 1983: 778–80.
25. Trutt F.C., Sottile J. and Kohler J.L. Online condition monitoring of induction
motors. IEEE Transactions on Industry Applications 2002; I A-38: 1627–32.
26. Kohler J.L., Sottile J. and Trutt F.C. Condition monitoring of stator windings
in induction motors. I. Experimental investigation of the effective negative-
sequence impedance detector. IEEE Transactions on Industry Applications 2002;
IA-38: 1447–53.
27. Sottile J., Trutt F.C. and Kohler J.L. Condition monitoring of stator windings in
induction motors. II. Experimental investigation of voltage mismatch detectors.
IEEE Transactions on Industry Applications 2002; I A-38: 1454–59.
28. Sottile J., Trutt F.C. and Leedy A.W. Condition monitoring of brushless three- phase synchronous generators with stator winding or rotor circuit deterioration.
IEEE Transactions on Industry Applications 2006; I A-42: 1209–15.
29. Tavner P.J. Permeabilitatsschwankungen auf Grund von Walzeffekten in
Kernplatten ohne Valenzrichtung. Elektrotechnik und Maschinenbau 1980; 97:
383–6.
30. Jordan H. and Tagen F. Wellenflusse infolge con schwankungen des luftapal-
teitwertes. El ektrotechnik und Zeitschri ft 1964; 85: 865–7.
31. Jordan H., Kovacs K. and Roder P. Messungen des schlupfes von asyn-
chronmaschinen mit einer spule. El ektrotechnik und Zeitschri ft 1965; 86:294–6.
32. Erlicki M.S., Porat Y. and Alexandrovitz A. (1971). Leakage field changes of
an induction motor as indication of non-symmetric supply. IEEE Transactions on General Applications 1971; G A - 7: 713–7.
33. Penman J., Hadwick G. and Stronach A.F. Protection strategy against faults in
electrical machines. Presented at the International Conference on Developments
in Power System Protection, London, 1980.
34. Yacamini R., Smith K.S. and Ran L. Monitoring torsional vibrations of elec-
tromechanical systems using stator currents. Journal of Vi brati on and Acousti cs 1998; 120: 72–9.
35. Ran L., Yacamini R. and Smith K.S. Torsional vibrations in electrical induction
motor drives during start up. Journal of Vibration and Acoustics 1996; 118:
242–51.

8/20/2019 Condition Monitoring Knjiga
http://slidepdf.com/reader/full/condition-monitoring-knjiga 250/306
Electrical techniques: current, flux and power monitoring 227
36. Joksimovic G.M. and Penman J. The detection of inter-turn short circuits in the
stator windings of operating motors. IEEE Tr ansactions on Industri al El ectronics 2000; I A-47: 1078–84.
37. Stavrou A., Sedding H.G. and Penman H. Current monitoring for detecting inter-
turn short circuits in induction motors. I EEE Tr ansactions on Energy Conver si on 2001; EC -16: 32–7.
38. Bellini A., Filippetti F. et al. Quantitative evaluation of induction motor broken
bars by means of electrical signature analysis. IEEE Transactions on Industry Applications 2001; I A-37: 1248–55.
39. Bellini A., Filippetti F., Franceschini G., Tassoni C. and Kliman G.B. On-field
experience with online diagnosis of large induction motors cage failures using
MCSA. IE EE Transactions on I ndustr y Appli cations 2001; I A-38: 1045–53.
40. Henao H., Demian C. and Capolino G.A. A frequency-domain detection of
stator winding faults in induction machines using an external flux sensor. IEEE Transactions on Industr y Appl icati ons 2003; I A-39: 1272–9.
41. Henao H., Razik H. and Capolino G.A. Analytical approach of the stator cur-
rent frequency harmonics computation for detection of induction machine rotor
faults. IEE E Transactions on I ndustr y Appli cations 2005; I A-41: 801–7.
42. Trzynadlowski A.M., Ghassemzadeh M. and Legowski S.F. Diagnostics of
mechanical abnormalities in induction motors using instantaneous electric
power. I EEE Tr ansactions on Energy C onver sion 1999; EC -14: 1417–23.
43. Hunter D.J., Tavner P.J., Ward D.M. and Benaragma D.. Measurements of
the harmonic components of the instantaneous electrical power delivered atthe terminals of a 500 MW turbogenerator. Presented at the 3rd International
Conference on Sources and Effects of Power System Disturbances, London,
1982.
44. Verma S.P. and Girgis R.S. Shaft Potentials and Currents in Large Turbogener- ators . Report for the Canadian Electrical Association, 1981.
45. Nippes P.I. Early warning of developing problems in rotating machinery as pro-
vided by monitoring shaft voltages and grounding currents. IEEE Transactions on Energy Conversion 2004; EC -19: 340–45.
46. Bellini A., Filippetti F., Franceschini G. and Tassoni C. Closed-loop controlimpact on the diagnosis of induction motors faults. IEEE Transactions on Industry Applications 2000; I A-36: 1318–29.
47. Chen S., Zhong E. and Lipo T.I. A new approach to motor condition monitoring
in induction motor drives. I EEE Transactions on Industry Applications 1994;
IA-30: 905–11.
48. Vas P. Parameter Estimation Condition Monitoring and Diagnosis of Electrical Machines . Oxford, UK: Clarendon Press; 1996.

8/20/2019 Condition Monitoring Knjiga
http://slidepdf.com/reader/full/condition-monitoring-knjiga 251/306

8/20/2019 Condition Monitoring Knjiga
http://slidepdf.com/reader/full/condition-monitoring-knjiga 252/306
Chapter 10 E lectr ical techniques: dischar ge monitor ing
10.1 I ntroduction
Chapter 9 concentrated on the perturbations to current, flux and power at the terminals
due to faults in the machine. However, there is another effect at work in high-voltageelectrical machines and that is perturbations to the voltage and current wave fed to the
machine as a result of electrical disturbances or discharges in the insulation system.
This chapter deals with a more specialised terminal analysis than considered in
Chapter 9, which has the potential to detect those discharge activities present in the
machine winding insulation, particularly in high voltage machines. One of the reasons
this technique has received so much attention is because the insulation system lies at
the heart of every electrical machine, as described in Chapter 2, and its deterioration
can be relatively slow, as described in Chapter 3. Therefore it should be a good target
for condition monitoring.
10.2 Background to dischar ge detection
Discharge behaviour is complex and can be categorised in ascending order of energy
and damage as
• corona discharge,
• partial discharge,
• spark discharge,
• arc discharge.
A well-made insulation system will exhibit low-level corona discharge on the
surface of the insulation at AC voltages above 4 kV rms to ground. If there are voids
inside the body of the insulation system those voids will also exhibit partial discharges
at the points in the voltage cycle when the local electric field strength exceeds the
Paschen curve level for the gas in the void at that temperature. Neither that surface or
body activity is necessarily damaging unless the activity is sufficiently powerful to
degrade the insulation system, as described in Chapter 7 Section 7.2. This activity can
progressively worsen depending on the quality of the insulation, the local strength
of the field and the mechanical and electrical conditions to which the material is
subjected. There are certain parts of high-voltage winding insulation systems that are
particularly vulnerable to discharge activity, namely:
• the stator slot wall where partial discharge activity can erode and damage the main
wall insulation;

8/20/2019 Condition Monitoring Knjiga
http://slidepdf.com/reader/full/condition-monitoring-knjiga 253/306
230 Conditi on monitor ing of rotati ng el ectri cal machines
• the slot emergence where coils emerge from the earth protection of the slot and
the insulation system is exposed to surface discharge activity;
• the end-winding surfaces, which can be subjected to damaging discharge activity,
particularly at the phase separation regions, when the surface is wet or dirty or
both.
A study of the failure mechanisms in Chapter 2 shows that electrical discharge
activity is an early indicator of many electrical faults in machine stators and the
activity is also related to the remaining life of the insulation system. The accurate
detection of discharge activity could therefore give valuable early warning of failure
and could provide information about the remaining life of the insulation.
Electrical discharges are transitory, low-energy disturbances that radiate elec-
tromagnetic, acoustic and thermal energy from the discharge site. That conducted
energy causes perturbations to the waveforms of the voltage and current both within
the machine and at the machine terminals. The earliest applications of partial dis-
charge detection were to isolated insulation components, such as transformer and
high voltage machine bushings or most successfully to the stop joints in oil-cooled
EHV cables [1], where the insulation under inspection is close to the coupling circuit
and is energised solely at the phase voltage of the cable. After successful application
on cable stop joints the method was then applied to the windings of high-voltage
turbine and hydro generators. However, an electrical machine winding represents a
much more complex insulation system than a stop joint, see Figure 10.1.
HV terminals
Inducedcurrents
R
Windings
Stator core
Currenttransformer
Neutral earthconnection
Dischargesite
Y B
Couplingcapacitors
Dischargecurrents
a
b
a
a
Fi gure 10.1 The complex structure of a typical turbi ne gener ator stator winding and it s ar r angement [ Taken from Tavner and Jackson [ 2] ]

8/20/2019 Condition Monitoring Knjiga
http://slidepdf.com/reader/full/condition-monitoring-knjiga 254/306
El ectri cal techniques: discharge monitor i ng 231
For example
• The insulation is distributed throughout the length of the winding, which may
represent many hundreds of meters in length.
• It is energised with a distributed potential, applying full line voltage between thewinding ends but zero voltage at the neutral point.
• The winding is complex from a propagation point of view:
• Containing propagation path bifurcations
• at coil connections,
• where sections of the winding are connected between phases,
• where individual phases consist of parallel paths.
• It also contains many surge impedance transitions throughout its length (see
Figure 10.2)
• as it enters and emerges from the slot,• as the coupling varies between winding components, in slot and end-
winding portions,
• as it connects to the main terminals of the machine.
The following description traces the development of electrical machine wind-
ing partial discharge detection up to the present day and demonstrates the value of
discharge detection techniques.
10.3 E ar ly dischar ge detection methods
10.3.1 RF coupli ng method
The earliest work, summarised by Harrold et al . [3], describes a technique developed
by Westinghouse in the US to detect on-line the presence of subconductor arcing
in the stator windings of large steam turbine generators, by measuring perturbations
in the winding current. Arcing activity produces very wide-band electromagnetic
energy, some of which propagates into the neutral connection of the star-connected
winding. Emery used a ferrite-cored RF current transformer (RFCT) wrapped around
the neutral cable to couple to this activity, which he detected using a quasi-peak, radiointerference field intensity (RIFI) meter, as shown in Figure 10.3. The neutral cable
was chosen as a good measurement location because it has a low potential with respect
to ground and because arcing at any location in the generator causes RF current to
flow into the neutral lead.
The RFCT has a frequency response from 30 Hz to 30 MHz and the RIFI meter
has a narrow bandwidth of ∼10 kHz centred at about 1 MHz. The centre frequency is
nominally tuned to matchresonances in the winding that the arcing activity excites; the
RIFI meter effectively measures the average peak energy received by the instrument.
The RFCT and RIFI meters are proprietary items and a simple monitoring systemcan be assembled using these components. Westinghouse have also developed a
specialised RF monitor based on this technique [4]. The monitor interfaces with a
remote panel located in the machine control room and provides a permanent record of
arcing activity, with alarm indications to the operator when a severe increase occurs.
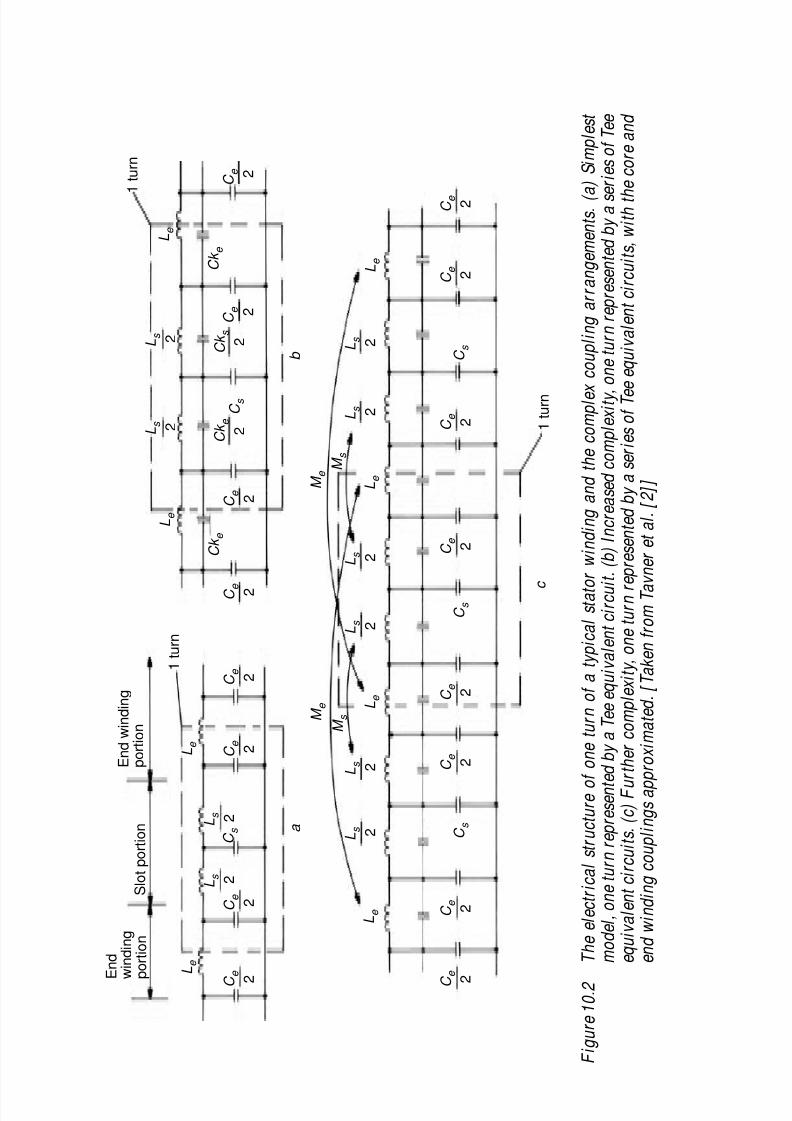
8/20/2019 Condition Monitoring Knjiga
http://slidepdf.com/reader/full/condition-monitoring-knjiga 255/306
E n d
w i n d i n g
p o r t i o n
L e
L e
C
e
2 C
e
2
C e 2
C e 2
C e 2
C e
C s
C s
C s
2
C e 2
C e 2
C e 2
C e 2
L s 2
L s 2
L s
L e
M e
M s
M s
M e
2
L s 2
L s
L e
2
L s 2
L s
L e
2
L s 2
C e 2
C e
C s
2
C e
C k e
L e
2
C e
C s
2
L s 2
L s
L e
1 t u r n
1 t u r n
2
C k e 2
C e 2
C e 2
C k s
b
c
a
C k e
2
L e
E n d w i n d i n g
p o r t i o n
1 t u r n
S l o t p o r t i o n
F i g u r e 1 0
. 2
T h e e l e c t r i c a l s t r u c t u r e o
f o n e t u r n o f a t y p i c a l s t a t o r w i n d i n g a n d t h e c o m p l e x
c o u p l i n g a r r a n g e m e n t s
. ( a ) S i m p l e s t
m o d e l , o n e t u r n r e p r e s e n t e d b y a T e e e q u i v a l e n t c i r c u i t . ( b ) I n c r e a s e d c o m p l e x i t y ,
o n e t u r n r e p r e s e n t e d b y a s e r i e s o f T e e
e q u i v a l e n t c i r c u i t s
. ( c ) F u
r t h e r c o m p l e x i t y
, o n e t u r n r
e p r e s e n t e d b y a s e r i e s o f T e e e q u i v a l e n t c i r c u i t s
, w i t h t h
e c o r e a n d
e n d w i n d i n g c o u p l i n g s a p
p r o x i m a t e d
. [ T a k e n f r o m T a
v n e r e t a l . [ 2 ] ]

8/20/2019 Condition Monitoring Knjiga
http://slidepdf.com/reader/full/condition-monitoring-knjiga 256/306
El ectri cal techniques: discharge monitor i ng 233
Chart recorder
Electricalmachinestator
Neutral resistorif fitted
RI-FI meter
High frequency CT
F igure 10.3 D etection of discharge activi ty in a gener ator [ Taken from Emer y et al.[ 4] . © IEEE (1981)]
Harrold et al . had shown in [3], with further details by Emery et al . [4] and Harrold
and Emery [5], positive proof of the detection, not only of subconductor arcing,
but also of sparking in other parts of steam-turbine-driven generators. However, the
change in signal level when arcing occurs, from the RIFI meter tuned to 1 MHz, is
not dramatic. An increase of less than 50 per cent of the unfaulted indication is typical
and this makes the setting of alarm levels for such a monitor difficult.
Timperley [6] has used this technique and applied it not only to steam turbine
generators but also to hydroelectric machines in the American Electric Power service.
He appears to have used wider bandwidth quasi-peak RIFI instruments connected tothe neutral RFCT because he analyses the received signal in both the frequency and
time domains. Using the technique he has shown some evidence of the detection
of slot discharge activity on hydroelectric machines and other forms of unexpected
corona activity.
10.3.2 Earth loop tr ansient method
Wilson et al . [1], in the UK, devised a similar technique to that of Emery as a cheap
method of detecting discharge activity on-line in a wide range of high-voltage plant.Initially it was applied to a relatively small, identifiable section of insulation, such as
a stop joint in an oil-insulated EHV cable, and was known as an earth loop transient
monitor. It has since been applied to the insulation of generator and motor stator
windings and aims to look for partial discharge activity in the bulk of the winding.

8/20/2019 Condition Monitoring Knjiga
http://slidepdf.com/reader/full/condition-monitoring-knjiga 257/306
234 Conditi on monitor ing of rotati ng el ectri cal machines
Chart recorder
Electricalmachinestator
Neutral resistorif fitted
Peak holdcircuit
High frequency CTor Rogowski coil
Detector
Alarmcircuit
To alarm
circuit
Logarithmicamplifier
Fi gure 10.4 Continuous monitor of discharge activi ty using an earth loop transient
monitor [Taken from Wilson et al. [1]]
It uses a Rogowski coil, wrapped around the neutral cable of the machine winding,
and the detector is a narrow-band instrument that measures the average peak energy
received by the instrument as shown in Figure 10.4. The Rogowski coil is an air-cored
solenoidal search coil that is closed on itself round a current-carrying conductor. The
manufacture of these coils has been patented in the UK by Ward and Exon [7] and
they are called Rogowski coils to distinguish them from their ancestor, the Chattock
potentiometer, which is not a wraparound coil as needed for current measurements.
The frequency response of the Rogowski coil is relatively wide but the detector has anarrow bandwidth of ∼15 kHz centred at a value determined by the application and
the background radio noise, but usually for a generator or motor winding this would
be 1 MHz.
The monitor is calibrated in picocoulombs and is provided with alarm circuits,
so that when the discharge level exceeds a warning threshold an alarm signal can be
transmitted to the plant control room. Wilson has explained that when applying this
technique to a distributed insulation system, such as a machine winding, care must be
taken in the calibration, because energy may be propagated to the instrument from a
number of different discharge sites in the insulation simultaneously. Geary et al . [8] provide a theoretical model for the manner in which energy, in the frequency band
detected by the instrument, is propagated from the discharge site in to the winding
neutral and he has shown how this propagation depends critically on the configuration
of the winding and the size of the stator core, as described in Section 10.2.

8/20/2019 Condition Monitoring Knjiga
http://slidepdf.com/reader/full/condition-monitoring-knjiga 258/306
El ectri cal techniques: discharge monitor i ng 235
10.3.3 Capaciti ve coupli ng method
An alternative technique, where perturbations in voltage waveforms are detected at the
machine terminals, has been described by Kurtz and Stone [9] and applied primarily to
hydroelectric alternators in Canada aimed at detecting the slot discharge activity withwhich these high-voltage air-cooled windings are afflicted. Connection to the winding
is made through coupling capacitors connected to the line terminals of the machine
as shown in Figure 10.5. Discharge pulses are coupled through these capacitors to
a specialised pulse height analyser, which characterises, in the electronics in the
analyser is 80 MHz and this is considered sufficient to capture partial discharge
pulses with rise times of the order of 1–10 ns. In the early days of this technique
the coupling capacitors had to be connected to the machine during an outage but
in a later publication Kurtz et al. [10] describe how capacitative couplers can be
permanently built into the phase rings of the machine so that the measurements can be made without service interruptions. In addition these permanent couplers are also
intended to ensure that discharge activity from the electrical supply system, to which
the machine is connected, is rejected. However, the pulse height analysis of discharges
by this method is still carried out at intervals during the life of the machine rather than
continuously on-line. Kurtz has not shown how the electromagnetic energy from a
discharge site is propagated through the winding to the coupling capacitors but has
Neutral resistorif fitted
Lowerthreshold
UpperthresholdPermanentcouplingcapacitor
MonostableB
MonostableA
MonostableC
Q
Q To pulse
counter
F igure 10.5 D etection of discharge activi ty using a coupli ng capacitor [ Taken from Kur tz et al. [ 10] ]

8/20/2019 Condition Monitoring Knjiga
http://slidepdf.com/reader/full/condition-monitoring-knjiga 259/306
236 Conditi on monitor ing of rotati ng el ectri cal machines
shown empirically that the method is capable of detecting slot discharges and the
steady deterioration of winding insulation with time.
10.3.4 Wideband RF method All the techniques described earlier operate at relatively low frequencies (1–80 MHz)
and detect the electromagnetic energy propagated along the winding to the neutral or
line end connections [2].
In any healthy machine there will be a background of corona and partial discharge
activity that will vary from machine to machine and also vary with time. Malik
et al . [11] showed that damaging discharge pulses, such as serious partial discharges,
sparking or arcing, have faster rise-times than the background corona and partial
discharge activity and therefore produce a much higher frequency of electromagnetic
energy (350 MHz). Malik et al . showed that if this energy is detected, at as high a
frequency as possible, the ratio of damaging discharge signals to background activity
is increased. Frequencies of electromagnetic energy >4 MHz propagate from the
discharge site by radiation from the winding, not by propagation along the winding
as in the case with the lower-frequency techniques. This radiation can be detected by
an RF aerial located either inside the enclosure of the machine or outside, close to
an aperture in it. This technique is very similar to that proposed by Michiguchi et al .[12] for detecting faults in brushgear.
Malik et al. [11] described a monitor for detecting damaging discharge activity
in a turbine generator stator winding based on this idea, as is shown in Figure 10.6.It receives the energy from the aerial and amplifies it before detection. The monitor
contains a band-pass filter that is tuned above the cut-off frequency of background
activity (∼350 MHz), avoiding any interference from nearby radio or radar stations,
to the part of the spectrum that is of interest. The output of the monitor is a chart
record that shows the instants in time at which the energy due to damaging discharge
activity exceeded a threshold value. This threshold can be set according to the level
of background activity in the machine.
The monitor has been used successfully on large operational steam turbine-driven
generators, where the aerial is relatively easy to fit outside the casing by mountingit close to the neutral point connection. The instrument has positively identified
proven subconductor arcing and has been shown to detect other forms of damaging
discharge activity. Its advantage over the other techniques is that by detecting at higher
frequencies the signal-to-noise ratio of damaging activity to background is much
larger and this makes it much easier to determine alarm settings for the instrument,
as is shown in Figure 10.7. On the other hand the received signal cannot be related
directly to discharge magnitudes in picocoulombs and all timing information about
the discharge is lost.
10.3.5 Insulation remanent li fe
Besides identifying specific faults, partial discharge detection and measurement have
also held out the possibility of determining the remanent life of insulation systems

8/20/2019 Condition Monitoring Knjiga
http://slidepdf.com/reader/full/condition-monitoring-knjiga 260/306
El ectri cal techniques: discharge monitor i ng 237
Recorder
RF aerial
DetectorRF amplifierAttenuator Turnablebandpass
filter
Signal processingelectronics
F igure 10.6 D etection of damaging discharge activi ty using r adiofrequency energy [ Taken from M ali k et al. [ 11] ]
10 100 1000Frequency, MHz
Damaging dischargeactivity
Background activity inackground activity inBackground activity ina healthy environment healthy environmenta healthy environment
Bandwidth of higherandwidth of higherBandwidth of higherfrequency devicerequency devicefrequency device
R
F
P
S
D
d
B
R
F
P
S
D
d
B
R F P S D , d B
Bandwidth of lowerandwidth of lowerBandwidth of lowerfrequency devicesrequency devicesfrequency devices
F igure 10.7 Radiofrequency energy from background and damaging discharge activity

8/20/2019 Condition Monitoring Knjiga
http://slidepdf.com/reader/full/condition-monitoring-knjiga 261/306
238 Conditi on monitor ing of rotati ng el ectri cal machines
and this has occupied a considerable amount of the literature as described by Stone
et al . [13,14]. This process requires measurements of insulation resistance, polari-
sation index, capacitance, dissipation factor tip-up, partial discharge magnitude, and
discharge inception voltage as well as on-line partial discharge activity and is an
elusive and difficult objective.
10.4 D etection problems
Lower–frequency work (1–80 MHz), involving propagation along a homogeneous
conductor, suggests that a discharge site can be located by timing the arrival of
discharge pulses received at a number of different sensors. This has now been demon-
strated, as shown in the next section on modern techniques, but reflections at each
discontinuity in the winding or variation in its insulation and connection make the
identification of pulses at the terminals extremely difficult.
The low-frequency RFCT devices produced an output calibrated in picocoulombs
of discharge activity, because the response can be related directly to the amplitude
of a discharge calibration pulse. This allows the user to see the measured activity
in discharge terms so that he can decide what level of activity he considers to be
damaging. Although the Rogowski coil is easier to fit than the RFCT it has suffered
from its very low sensitivity and is now rarely used.
Various other partial discharge detectors have been investigated, including the
portable Tennessee Valley Authority (TVA) probe and Discharge Locator (DL) [15],and the Stator Slot Coupler (SSC) [16], which can be mounted above the stator con-
ductor in the slot beneath the wedge (see Figure 2.4). These confer some advantages
in enabling the operator to locate discharge activity.
More recently, partial discharge measurement has been made using a standardised
capacitive coupler, based on the Canadian experience, which is a robust power engi-
neering component of capacitance C that can easily be calibrated in Q m , the discharge
value in millivolts across the coupler, where Q m in millivoltsQ /C , where Q is the
discharge value.
The higher signal-to-noise potential of wideband RF techniques at frequencies(100 MHz–1 GHz) described in Section 10.3.4 has been investigated further by Stone
et al . [17] and from this work there would appear to be the potential for discharge
site location by the use of a directional aerial. However, at the frequencies involved
the dimensions of such an aerial, diameter from 0.6 to 6 m, would be impracticably
large and in any case the complex machine structure will cause reflections and local
resonances that will disrupt location. However, this method has been used successfully
in transformers using three or more RF sensors located in positions on the surface of
the transformer tank to triangulate the location of defects.
Ultrasonic detection of the noise emitted from discharges has also been demon-strated on transformers to be much more effective at fault location than electrical
methods in rotating electrical machines. So despite the potential of wideband RF
techniques their lack of location ability means that the technique has now largely
been superseded.

8/20/2019 Condition Monitoring Knjiga
http://slidepdf.com/reader/full/condition-monitoring-knjiga 262/306
El ectri cal techniques: discharge monitor i ng 239
It must be made clear at this stage that there is less value in being able to detect
discharge activity if, when the machine is taken out of service, that activity is imposs-
ible to locate. It would be preferable to allow damaging discharge activity to continue
until it had reached such a pitch that the damage was observable. This highlights the
problem of what constitutes a significant level discharge activity.
In all partial discharge detection systems it is necessary to shield the desired
partial discharge activity signal from external noise, either due to partial discharge
activity in the connections and switchgear of the electrical machine or due to sparking
in brushgear or harmonic activity due to nearby power electronics. In some cases,
the electrical machine is connected to the system via a lengthy, low-discharge cross-
linked polyethylene cable, that provides the necessary filter, but it is not always so.
These noise and calibration issues are dealt with by Geary et al . [8], Wood et al . [18],
Campbell et al . [19], Stone and Sedding [20] and Kemp et al . [21].
Another fundamental problem for all partial discharge detection systems is that the
discharge activity of identical windings in different machines exhibit large variations
in background activity, due to variations in ambient conditions, small changes in
the insulation homogeneity and noise conditions. Therefore one cannot say with any
certainty what the background discharge activity for a winding should be, and this
activity will vary naturally with time regardless of whether any damaging activity is
taking place. An example of partial discharge detection results taken from a database
from a number of 13.8 kV turbine generators in the US, measured using capacitive
couplers [22], are shown in Table 10.1, where the variations with voltage and between
machines can be seen.
Table 10.1 q m i n mill ivolts from a database of r esults on a set of 13.8 kV turbine gener ators, measured using 80 pf capaciti ve coupler s. [ Taken from Stone et al. [ 13] ]
Rated V 2–4 kV 6–8 kV 10–12 kV 13–15 kV 16–18 kV >19 kV
25% 2 6 27 9 145 120
50% 15 29 63 79 269 208
75% 57 68 124 180 498 41190% 120 247 236 362 1 024 912
Average 89 88 121 168 457 401
Maximum 2 461 1 900 3 410 3 396 3 548 3 552
10.5 M oder n dischar ge detection methods
Modern on-line discharge detection methods for rotating electrical machines have
developed from the early work described in Section 10.3, improved to resolve someof the problems described in Section 10.4 and can now be divided into two techniques.
• The hydro generator partial discharge analyser (PDA), based on Section 10.3.3
(p. 235) (see Figure 10.8 and Lyles and Goodeve [23]).

8/20/2019 Condition Monitoring Knjiga
http://slidepdf.com/reader/full/condition-monitoring-knjiga 263/306
240 Conditi on monitor ing of rotati ng el ectri cal machines
B1 B2
B2 + L2
B1 + L1
L22L2
Neutral
80 pF80 pF
mv
ns
LL1
Ring bus
Circuit parallel
To cancel noise:
B2 + L2 = B1 + L1
(travel time in
nanoseconds)
Fault
External noisepulse
PDA
PT cubicle
Generator
Grid
Fault pulse
Fi gure 10.8 D iagram of the coupler connections and electronics for the partial dis- charge analyser (PD A) [ Taken from Stone et al. [ 22] . © I EEE (2004)]
FaultGenerator
Fault pulseExternal
noise pulsePT cubicle
Delay
Samelength
L1 L22L2
80pF 80pF
TGA
Grid
Fi gure 10.9 D iagram of the connections and electronics for the tur bine generator analyser (TGA) [ Taken from Stone et al. [ 22] . © I EEE (2004)]
• The motor or turbine generator analayser (TGA), based on Sections 10.3.1 and
10.3.2 (p. 235), which adopts a variant of the PDA to improve the signal-to-noise
ratio of partial discharge detection on windings of the types found in motors and
turbine generators (see Figure 10.9). Experience with this technique is described in Stone et al . [24].
An IEEE standard has also now been devised [25] to standardise the measurement of
partial discharge on rotating machines.

8/20/2019 Condition Monitoring Knjiga
http://slidepdf.com/reader/full/condition-monitoring-knjiga 264/306
El ectri cal techniques: discharge monitor i ng 241
Work is continuing on partial discharge detection methods, including work on
lower-voltage, 4 kV motors by Tetrault et al . [26], work on large machines Kheirmand
et al . [27] and an example of an insulation monitoring system that detects insulation
leakage currents by measuring machine terminal voltages on an induction motor by
Lee et al . [28].
10.6 C onclusion
Discharge measurement has shown itself to be the most problematic electrical method
of condition monitoring. It requires special sensors, wide bandwidth (>100 kHz) and
very complex analysis for fault detection and can only be recommended where a
specific high-voltage failure mode is being searched for in a known location on a
large machine. It addresses one of the most vital parts of the electrical machine, it candetect global effects, including possibly remanent life of the machine insulation, and
it does give a long warning before failure occurs. Yet the analysis of Chapter 3 shows
that, with modern materials, the proportion of machine failures due to insulation
faults are now less than one-third. Furthermore the detection method relies on the
most advanced signal processing to extract useful indications, which are then open to
interpretation by partial discharge measurement experts. This has made it extremely
difficult to increase the confidence of machine operators in the value of this type of
monitoring because of their need to refer to differing expert opinion.
Partial discharge monitoring was first applied to isolated insulated components
such as bushings and cable stop joints where it has a vital role to play and has been
successfully extended to conventional and gas-insulated switchgear. However, when
applied to the distributed, multi-path, multi-connection, variably stressed insulation
system of an electrical machine winding, as shown in Figures 10.1 and 10.2, it has a
much more difficult task and its greatest impact has been on applications such as hydro
generators, where a specific failure mode is being searched for in known locations,
which allow the precise location of couplers and the tailoring of the signal processing
to that failure mode. Work still continues to develop this method, including the use
of artificial intelligence (see Chapter 11) to determine the overall deterioration of a
winding insulation system but this objective has not yet been reached.
10.7 R eferences
1. Wilson A., Nye A.E.T. and Hopgood D. On line detection of partial discharges
in HV plant. Presented at the 4th BEAMA International Electrical Insulation
Conference, Brighton 1982.
2. Tavner P.J. and Jackson R.J. Coupling of discharge currents between conductors
of electrical machines owing to laminated steel core. IEE Proceedings Part B,Electri c Power Applications 1988; 135: 295–307.
3. Harrold R.T., Emery F.T., Murphy F.J. and Drinkut S.A. Radio frequency sensing
of incipient arcing faults within large turbine generators. I EEE Transactions on Power Appar atus and Systems 1979; PAS-98: 1167–73.

8/20/2019 Condition Monitoring Knjiga
http://slidepdf.com/reader/full/condition-monitoring-knjiga 265/306
242 Conditi on monitor ing of rotati ng el ectri cal machines
4. Emery F.T., Lenderking B.N. and Couch R.D. Turbine-generator on-line diag-
nostics using RF monitoring. IEEE Transactions on Power Appar atus and Systems 1981; PAS-100: 4974–82.
5. Harrold R.T. and Emery F.T. Radio frequency diagnostic monitoring of electrical
machines. IEEE Electri cal Insulation M agazine 1986; 2: 18–24.
6. Timperley J.E. Incipient fault detection through neutral RF monitoring of large
rotating machines. IEEE Transactions on Power Apparatus and Systems 1983;
PAS-102: 693–8.
7. Ward D.A. and Exon J.L.T. Using Rogowski coils for transient cur-
rent measurements. Engineer ing Science and Education Journal 1993; 2:
105–13.
8. Geary R., Kemp I.J., Wilson A. and Wood J.W. Towards improved calibration in
the measurement of partial discharges in rotating machinery. IEEE International
Conference on Electrical Insulation, Toronto, 1990.
9. Kurtz M. and Stone G.C. In-service partial discharge testing of generator
insulation. IEEE Transactions of Electrical Insulation 1979; EI -14: 94–100.
10. Kurtz M., Stone G.C., Freeman D., Mulhall V.R. and Lonseth P. Diagnos-
tic testing of generator insulation without service interruption. CIGRE, Paris,
1980.
11. Malik A.K., Cook R.F. and Tavner P.J. The detection of discharges in alternators
using wideband radio frequency techniques. Presented at the IEE International
Conference on Electrical Machines Design & Applications, London, 1985.
12. Michiguchi Y., Tonisaka S., Izumi S., Watanabe T. and Miyashita I. Develop-ment of a collector ring monitor for sparking detection on generators. IEEE Transactions of Power Appar atus and Systems 1983; PAS-102: 928–33.
13. Stone G.C., Boulter E.A., Culbert I. and Dhirani H. Electrical Insulation for Rotating Machines, Design, Evaluation, Aging, Testing, and Repair . New York:
Wiley–IEEE Press, 2004.
14. Stone G.C., Sedding H.G., Lloyd B.A. and Gupta B.K. The ability of diagnostic
tests to estimate the remaining life of stator insulation. IEEE Transactions on Energy Conversion 1988; EC-3: 833–41.
15. Sedding H.G. and Stone G.C. A discharge locating probe for rotating machines.IEEE Electri cal I nsulation M agazine 1989; 5: 14–17.
16. Sedding H.G., Campbell S.R., Stone G.C. and Klempner G.S. A new sensor for
detecting partial discharges in operating turbine generators. IEE E Transactions on Energy Conversion 1991; EC-6: 700–6.
17. Stone G.C., Sedding H.G., Fujimoto, N. and Braun J.M. Practical imple-
mentation of ultrawideband partial discharge detectors. IEEE Transactions on Electri cal I nsulation 1992; EI -27: 70–81.
18. Wood J. W., Sedding H. G., Hogg W.K., Kemp I.J. and Zhu H. Partial discharges
in HV machines; initial considerations for a PD specification. IEE Proceedings,Part A, Science, Measurement and Technology 1993; 140: 409–16.
19. Campbell S.R., Stone G.C., Sedding H.G., Klempner G.S., McDermid W. and
Bussey R.G. Practical on-line partial discharge tests for turbine generators and
motors. I EEE Tr ansactions on Energy C onver sion 1994; EC-9: 281–7.

8/20/2019 Condition Monitoring Knjiga
http://slidepdf.com/reader/full/condition-monitoring-knjiga 266/306
El ectri cal techniques: discharge monitor i ng 243
20. Stone G.C. and Sedding H.G. In-service evaluation of motor and generator
stator windings using partial discharge tests. IEEE Transactions on Industry Applications 1995; I A-31: 299–303.
21. Kemp I.J., Zhu H., Sedding H.G., Wood J.W. and Hogg W.K. Towards a new par-
tial discharge calibration strategy based on the transfer function of machine stator
windings. IEE Proceedings, Part A, Science, Measurement and Technology 1996; 143: 57–62.
22. Stone G.C., Boulter E.A., Culbert I. and Dhirani H. Electrical Insulation for Rotating Machines, Design, Evaluation, Aging, Testing, and Repair . New York:
Wiley–IEEE Press; 2004.
23. Lyles J.F. and Goodeve T.E. Using diagnostic technology for identifying
generator winding needs. Hydro Review 1993; June: 58–67.
24. Stone G.C., Sedding H.G. and Costello M. Application of partial discharge
testing to motor and generator stator winding maintenance. IEEE Transactions on Industry Applications 1996; I A-32: 459–64.
25. IEEE Standard. Trial use guide to the measurements of partial discharges in
rotating machines. IEEE 1434. IEEE, 2000.
26. Tetrault S.M., Stone G.C. and Stedding H.G. Monitoring partial discharges on
4-kV motor windings. IEEE Transactionson Industry Applications 1999; IA-35:
682–8.
27. Kheirmand A., Leijon M. and Gubanski S.M. Advances in online monitoring and
localization of partial discharges in large rotating machines. IEE E Transactions
on Energy Conversion 2004; EC -19: 53–9.28. Lee S.B., Younsi K. and Kilman G.B. An online technique for monitoring the
insulation condition of AC machine stator windings. IEEE Transactions on Energy Conversion 2005; EC -20: 737–45.

8/20/2019 Condition Monitoring Knjiga
http://slidepdf.com/reader/full/condition-monitoring-knjiga 267/306

8/20/2019 Condition Monitoring Knjiga
http://slidepdf.com/reader/full/condition-monitoring-knjiga 268/306
Chapter 11A pplication of ar tificial intelligence techniques
11.1 I ntroduction
In earlier chapters of the book we have presented various techniques for condition
monitoring. It was seen that most faults do have predictable symptoms during their development, from root cause to failure mode, which can be detected by mechanical,
electromagnetic, optical or chemical sensors.
Condition monitoring has to establish a map between input signals and output
indications of the machine condition. Classifying machine condition and determining
the severity of faults from the input signals have never been easy tasks and they are
affected by many factors.
Return to our simple analogy in Chapter 4 of an engineer collecting data and acting
upon it. It is in this final, diagnostic stage that experienced engineers still outperform
most computerised condition-monitoring systems. Experience and intelligence areextremely important in this interpretative stage when information from different sen-
sors is sifted and condition precisely indicated by tracing the probabilities of different
root causes. In recent years, there has been considerable effort to develop artificial
intelligence systems that can play the roles currently performed by humans. This is
important for at least two reasons.
1. Electrical machines, both motors and generators, are increasingly used as ele-
ments in bigger systems where operators are not necessarily experienced in their
design.
2. A human expert can be subject to influences that make quick and consistent judgement impossible, particularly when there are many machines in the plant.
Correct judgement may also depend on the knowledge and the experience of
many experts who are not all available at the same time.
In order to design a computerised system that mimics human intelligence, we
should be clear about the response that we expect from experts. They must have a
certain amount of knowledge about the relationship between the machine condition
and the symptoms. This is the knowledge developed by researchers and engineers,
which is what we have been trying to document in this book for rotating electricalmachines.
We further expect the experts to apply such knowledge by performing heuristic
reasoning upon receiving condition data from the machine being monitored. Devel-
opment of expert systems in artificial intelligence allows such heuristic reasoning,

8/20/2019 Condition Monitoring Knjiga
http://slidepdf.com/reader/full/condition-monitoring-knjiga 269/306
246 Conditi on monitor ing of rotati ng el ectri cal machines
a feature of human intelligence, to be reproduced in a computerised system. The
experts must be able to handle uncertain information and find ways to increase the
confidence in their final judgement. Crucial information may come in linguistic for-
mat rather than being quantified; for example, ‘the water coolant flow of this machine
is decreasing much faster than before’. Methods based on fuzzy logic can be used
to deal with such situations. Expert systems including fuzzy logic have been used
by both machine manufacturers and utilities for condition monitoring, as we will
describe in this chapter (see e.g. References 1 and 2).
Manufacturers are adding more functionality to new machines, while the utilities
are more focused on aged, existing machines to extend theirusable lifetime. It has been
realised that human experts facing a condition-monitoring task will receive a large
amount of data, some of which may be trivial while others important. The human man-
ner of processing such data features parallelism. Artificial neural networks (ANN),
which try to emulate that feature of human intelligence and the learning capability, are
particularly attractive in reproducing this parallelism in condition-monitoring tasks.
This is being actively researched and we will outline some basic concepts.
Condition monitoring based on fuzzy logic and ANN expert systems can be com-
bined with other methods such as simulated annealing and genetic algorithms, which
also emulate human intelligence. A genetic algorithm, for example, does not of itself
perform the mapping from input data to an output of machine condition. Instead, it
is a stochastic optimisation technique that can be used in the training process of an
ANN. Combinations of the techniques and such numerical algorithms will not be
described in this book. Interested readers can refer to Filippetti et al . [3] for further information. We must point out that it is increasingly recognised that most individual
artificial intelligence techniques suffer from specific drawbacks, and that a hybrid
approach is needed in most practical situations.
11.2 E xper t systems
An expert system treats the condition monitoring of an electric machine like a med-
ical doctor diagnosing a patient. Some initial and superficial information is used toform hypotheses about the machine condition, which are then tested to identify pos-
sible faults. Then further evidence is searched for to refine the diagnosis, increase
confidence and then make a specific diagnosis. When engineers do this they apply
their knowledge, which must be presented to an expert system in a way that can be
interpreted by a computer or digital signal processing system. This is not an easy
task because such knowledge is usually heuristic in nature, based on ‘rule of thumb’
rather than absolute certainties. Furthermore human knowledge consists of complex
linguistic structures rather than numerical precision, and most of it is almost embed-
ded at a subconscious level. There is no doubt that we need to obtain a substantialamount of knowledge in order to build an expert system that provides quality mon-
itoring functionality. Close interaction between machine and software engineers is
necessary, and in order for the final product to be useful, the end user’s requirement
must also be taken into account.

8/20/2019 Condition Monitoring Knjiga
http://slidepdf.com/reader/full/condition-monitoring-knjiga 270/306
Application of artificial intelligence techniques 247
Knowledge can be presented in a number of ways to the computer or digital signal
processing system.
• Frame-based systems represent knowledge in data structures called frames that
describe the typical situations or instances of entities.• Semantic networks represent the knowledge in a graphical structure where nodes
represent concepts and beliefs about the system while arcs represent relationships
between these concepts and beliefs.
• Rule-based systems represent the knowledge as ‘if–then’ rules in the computer
memory [4].
Typically the rules will not provide certainty in conclusions; rather there will
be degrees of certainty in them that will hold for given input conditions. Statistical
methods are used to determine these degrees of certainties [5]. Many different repre-
sentations have been employed in developing expert systems for condition monitoring
but the rule-based knowledge scheme is probably the most widely used in practice.
Figure 11.1 shows the general architecture of a rule-based expert system.
There is declarative knowledge and imperative knowledge, either of which can
be represented as rules.
• Declarative knowledge tells the expert system what it could believe, with a degree
of certainty. For example, a negative sequence component above a certain level
in the input current of an induction machine implies a stator winding shorted turn
fault, or an unbalanced supply.• On the other hand, imperative knowledge tells the expert system what to do next;
for example, looking into other data that may indicate that supply imbalance is
not in fact present.
This gives the impression of an ability to apply heuristic reasoning. Human experts
are distinguished not only by the quantity of knowledge that they possess but also by
the way that the knowledge is applied skilfully. For reasons described at the beginning
of this section, an expert system for condition monitoring needs to perform both
forward and backward reasoning.
Explanationsystem
Inferenceengine
Knowledgebase editor
Userinterface
Case-specificdata
Knowledgebase
Expert system shell
F igure 11.1 Expert system architecture

8/20/2019 Condition Monitoring Knjiga
http://slidepdf.com/reader/full/condition-monitoring-knjiga 271/306
248 Conditi on monitor ing of rotati ng el ectri cal machines
A feature of the architecture shown in Figure 11.1 is that case-specific data and
the general knowledge base are separated. This allows the expert system to be used
in different cases provided that the rules in the knowledge base are adequate. They
are both separated from a more general part of the architecture called expert system
shell. Commercial software shells with the appropriate characteristics to develop
the expert system by programming the rules into it and setting the user interface
are now available. The shell shown here has an explanation subsystem that allows
the expert system to explain its reasoning to the user. The knowledge base editor
allows the rules to be modified when necessary and hence makes the expert system
so developed maintainable and adaptive. It should be noted that although commercial
shells are available, it is the expert knowledge that will determine the quality of the
expert system.
Stone and Kapler [1] describe an expert system developed for monitoring stator
insulation in turbine generators. Stator windings rated at 4 kV or above experience
gradual deterioration of electrical insulation. We have described in Chapter 2 the
dominant mechanisms leading to stator winding insulation failure. It can be seen that
several interacting factors, including vibration, overheating and moisture contami-
nation, are involved in the degradation process and insulation failure can occur in
different parts of the winding. As such factors cause voids in the insulation structure,
partial discharge activity occurs leading to further insulation damage. Partial discharge
activity can be monitored from the generator or neutral terminals as described in
Chapter 10. The main measurement techniques have been described in Sections 10.3–
10.5. Partial discharge signals are generally high-frequency spikes, in the 100 MHzrange, which can be easily confused with noise from adjacent machines, or arcing
or corona activities in the switchyard and switchgear. Expert knowledge is impor-
tant to ensure the reliability of the partial discharge measurement data, by checking
for example the dv/dt rate. Stephan and Laird [2] also confirm this by showing that
the measurement data can be contaminated by loose contact of the shaft grounding
brushgear. They also show that the data reliability can be improved by considering
the correlation of the partial discharge event with the phase angle of the generator
terminal voltage. Given the reliability of the acquired partial discharge data, conclu-
sions can only be drawn based on trend analysis, comparison with other generators,maintenance records, earlier off-line test results, present operating point, vibration
and temperature measurement, visual inspection and fleet experience. Such aspects
are best taken into account using human expert knowledge, represented in rules, as it
is extremely hard to establish algorithmic solutions to such problems.
Taken from Reference 1, Figure 11.2 shows an example of the output screen of
an expert system monitoring stator winding insulation. It shows the overall risk of
winding insulation failure as an ‘overall condition assessment’, expressed as a relative
position between good and bad. This can be used, in comparison with other machines,
to determine the machine that is most in need of maintenance. The expert system also provides a list of failure mechanisms that might be occurring in the winding. The
probabilities of such mechanisms are indicated and these are estimated statistically
using expert experience and knowledge. Other auxiliary information is also displayed

8/20/2019 Condition Monitoring Knjiga
http://slidepdf.com/reader/full/condition-monitoring-knjiga 272/306
Application of artificial intelligence techniques 249
Fi gure 11.2 Il lustration of the output of an expert system used to monitor the integrity of stator winding insulation. [Taken from Stone and Kapler [ 1] . © IEEE (1997)]
on screen that further aids the operator. About 20 human experts were consulted in
developing this expert system.
In practice, expert systems can be made modular with each module focusing on oneaspect of the machine condition. All modules are then integratedto provide monitoring
over the entire machine. Figure 11.3 shows the architecture of a system developed
for steam turbine synchronous generators to look at stator and rotor winding issues.
Interactions between different modules are taken into account and these modules may
overlap in their functionalities. For example, the condition of shaft grounding gear
can affect partial discharge, as mentioned earlier. High end-winding vibration may
indicate looseness in the end-winding support, which among other things can cause
cracks in the end-winding corona protection, leading to partial discharge in this region.
The inclusion of an end-winding vibration monitoring module provides additionalinformation. Combining information from all the modules in a synchronised manner
allows for correlation, and the ability to check plausibility of different diagnoses, as
described by Stephan and Laird [2].

8/20/2019 Condition Monitoring Knjiga
http://slidepdf.com/reader/full/condition-monitoring-knjiga 273/306
250 Conditi on monitor ing of rotati ng el ectri cal machines
Partialdischargefor statorwindinginsulation
Statorend-windingvibration
Statorwatertempera-ture
Shaftvoltage/currentfor rotorassess-ment
Rotor fluxfor rotorwindingshortdetection
Operating condition,historical data, etc.Remote access
Local platform
Fi gure 11.3 Configuration of a modular system
11.3 Fuzzy logic
The range and form of condition-monitoring signatures described in the previ-
ous chapters of this book could lead one to the conclusion that interpretation of
condition-monitoring signals may be achieved in an unambiguous manner, but this
is unfortunately not usually realistic. Taking a stator winding shorted turn fault in aninduction motor as an example, an obvious signature would be the negative sequence
component in the input current, or acoustic vibration measured on the motor frame.
Assuming a balanced voltage supply and perfect manufacture of the machine, such
signals can be confidently associated with the stator winding fault as described in
Chapter 9. However, supply imbalance and manufacturing imperfections always
exist; even a brand new machine would allow the measurement of some negative
sequence current and vibration. Unless we can define a threshold value, the informa-
tion we measure could better be described as ‘the negative sequence current is quite
large’. The condition of the machine being monitored could also be described in sucha linguistic manner, for example the machine condition is not necessarily ‘good’ or
‘bad’, but may fall into some intermediate range.
Fuzzy logic is particularly suitable in such circumstances, where the input signals
that are to be used for condition monitoring can be associated with certain member-
ship functions. A membership function allows a quantity, such as a negative sequence
current, to be associated with a linguistic variable with certain degrees of truth or
confidence. For example, Figure 11.4 shows membership functions for the negative
sequence current measured on an induction motor that is running in the steady state.
The horizontal axis is the negative sequence current normalised to the rated current.
The vertical axis indicates how the negative sequence current is associated to four lin-
guistic variables denoted as ‘negligible’ (N), ‘small’ (S), ‘medium’ (M) or ‘large’ (L).
Therefore four membership functions are used. In Boolean logic, the current would be
judged either ‘true’ or ‘false’ with respect to any of the four linguistic variables. But
in fuzzy logic, such a concept is extended to allow the current to be associated with

8/20/2019 Condition Monitoring Knjiga
http://slidepdf.com/reader/full/condition-monitoring-knjiga 274/306
Application of artificial intelligence techniques 251
N S M L m
Normalised negativesequence current
0
1
1
F igure 11.4 I ll ustr ation of member ship functions for the negative sequence curr ent in a faulted induction motor
these linguistic variables to any degree between 0 (fully false) and 1 (fully true). Thesame input value can indicate more than one membership function value, implying
that different statements can be simultaneously true but to different degrees of truth.
For example, a negative sequence current may be judged as ‘medium’ by a degree of
0.6 while at the same time as ‘large’ by a degree of 0.3. It is also considered being
not ‘negligible’ or ‘small’ if the corresponding membership function values are zero.
Other input signatures, for example, negative sequence supply voltage, can also be
represented in this way, as fuzzy sets by means of membership functions.
Different shapes of membership functions can be chosen for a given applica-
tion. Construction of the membership functions requires significant insight into the
physical meaning of the signals and the linguistic variables to be used. Practical
experience and experiments in the laboratory, or the industrial environment is usu-
ally the only sure way to gain such insight; the hard work cannot be bypassed, as
illustrated by Benbouzid and Nejjari [6]. Nevertheless, there is no doubt that fuzzy
logic does provide an alternative and powerful tool of information representation and
processing.
Associating input signals with membership functions is called fuzzification. The
power of fuzzy logic is more evident in the operation and inference stages of the
process, which derive new results that then provide progressively more precise infor-
mation about the actual condition of the machine. As in Boolean logic, basic fuzzylogic operations could include ‘AND’, ‘OR’ and ‘NOT’, but instead of producing
‘true’ or ‘false’ as an outcome, fuzzy logic operations result in a degree value (between
0 and 1) for which the combined statement of the logic operation is true. For example,
consider the two statements.
• A: motor negative sequence current is small with membership function of 0.7;
• B: negative sequence supply voltage is negligible with membership function value
of 0.5.
One way to define a fuzzy logic ‘AND’ operation is to use the smaller value of thetwo involved membership function values. Therefore the degree of the following
statement being true is 0.5.
• (A) AND (B): (negative sequence current is small) and (negative sequence voltage
is negligible).

8/20/2019 Condition Monitoring Knjiga
http://slidepdf.com/reader/full/condition-monitoring-knjiga 275/306
252 Conditi on monitor ing of rotati ng el ectri cal machines
Fuzzy logic ‘OR’ may be similarly defined by using the maximum membership
function value, while fuzzy logic ‘NOT’ may be defined as 1 – u where u is the
membership function value of the operand involved.
Fuzzy inference is applied to the statements, with or without fuzzy logic operators,
to imply the degree to which a consequent statement is supportable. This usually takes
the form of ‘if–then’ rules. For example, one of the many rules that could be used in
a condition-monitoring system for stator winding shorted turn fault detection could
be expressed as:
Rule (i): If [(negative sequence current is small) and (negative sequence voltage is
negligible)] then (shorted turn fault is present)
Because the condition or antecedent of this rule is not 100 per cent true, the output
statement, which is also linguistic, is not 100 per cent true either. For the output
statement, we are not particularly interested in to what extent it is true. What it means
to the actual machine condition is of more importance. We apply a procedure called
fuzzy implication for this purpose. This whole process is illustrated in Figure 11.5. In
the final plot of Figure 11.5, the horizontal axis is fault severity and the shaded area
represents a probabilistic distribution of the fault severity.
N S
Fault severityFault severity
Just present
-sequence voltage -sequence current
AND
Implication
Fi gure 11.5 Il lustration of theapplication of fuzzy inferenceto thenegativesequence curr ent as a result of a wi nding faul t on an i nducti on motor
There may be several rules associated with the same output statement, or con-sequence, and a condition-monitoring system may have several output statements
regarding the machine condition. For instance, another rule output statement could
be ‘shorted turn fault is serious’.
All rules are then scanned by a fuzzy logic inference engine, generating the
corresponding output implications, which are then aggregated to form a single overall
fuzzy set regarding the shorted turn fault severity. The order of all the rules being
executed does not matter in any way since the aggregation procedure should always
be commutative. Three ways of aggregation are commonly applied to the outputs of
the rules: maximum selection, probabilistic OR; that is, a +
b −
ab , and summation.Weighting factors can be introduced to reflect the relative importance of each rule.
A defuzzification procedure can then be used to obtain a single normalised index for
the particular fault that is being monitored. One way is to calculate the centroid of
the aggregated overall distribution.

8/20/2019 Condition Monitoring Knjiga
http://slidepdf.com/reader/full/condition-monitoring-knjiga 276/306
Application of artificial intelligence techniques 253
Expertknowledge Historicaldata Analyticalknowledge
Knowledge
acquisition
Rule base Membership
functions
Fuzzy
inference
Data
acquisition &
processing
Condition
information
Plant under
diagnosis
Knowledge source
Knowledge base
F igure 11.6 Bl ock diagr am of a fuzzy diagnostic system
Caldara et al . [7] describe an early fuzzy diagnostic system for a linear induction
motor drive. The system has the configuration outlined in Figure 11.6. There are
similarities between an expert system and a fuzzy diagnostic system in that they
are both knowledge-based. The added feature of a fuzzy diagnostic system is in
the representation of knowledge as membership functions and the fuzzy inference
methodology.
11.4 Ar tificial neural network s
11.4.1 Gener al
Artificial neural networks (ANN) have been used for many different applications.
The feature that is most attractive in condition monitoring is their ability to represent
complicated, non-linear relationships and to self-learn in pattern recognition tasks.
In monitoring broken rotor bars in cage induction motors for example, a key step
is to establish the correlation between the current components and perhaps other signals, and the fault severity. However, a quantitative relationship is complicated
and many factors, such as operating point, load characteristic and inherent magnetic
or electrical asymmetries in the machine, have effects on the relationship. Such factors
are difficult to take into account in any analytical way. A neural network can, however,

8/20/2019 Condition Monitoring Knjiga
http://slidepdf.com/reader/full/condition-monitoring-knjiga 277/306
254 Conditi on monitor ing of rotati ng el ectri cal machines
be trained to represent the desired target relationship. In a neural network approach,
the electrical machine is treated essentially as a black box with only the input and
output signals used to train the network. The input and output signals are chosen to
be those most relevant to the condition-monitoring task, which often requires expert
knowledge of the machine. Time domain signals are usually pre-processed by a fast
Fourier transform (FFT) and the inputs to the neural network are the FFT components
and their derivatives [8]. A neural network properly trained can be used for both
fault and fault severity classification, which is the ultimate objective of condition
monitoring.
11.4.2 Super vised learning
Of all neural network structures, the multilayered perceptron, trained using the back-
propagation algorithm, is perhaps the most widely used. Multilayered perceptron
(MLP) training can also be viewed as a gradient descent technique and therefore, to
analysts, it possesses a high degree of credibility although the local minimum problem
needs to be dealt with in the training process [9].
Figure 11.7 shows an MLP network that was developed by Filippetti et al . [10] to
detect broken rotor bar faults in induction motors. The network consists of an input
layer that accepts six input signals including:
• slip s ;
• slip as a ratio of the rated slip s /s r ;• a quantity dependent on the current component, I comp , at frequency (1−2 s )f se ,
NI comp /N m I where N is the number of rotor bars and is normalised to the
fundamental current, I , and the maximum bar number N m , say N m = 100;
1 2 3 4 5 6
1 2 3
Bias s s/s r NI comp /NI m I/I r P a /P r P r /P b
Bias
15 16
7
1n/n m Output layer
Weighted connection
Weighted connection
Hidden layer
Input layer
Fi gure 11.7 A neural network structure for broken rotor bar detection
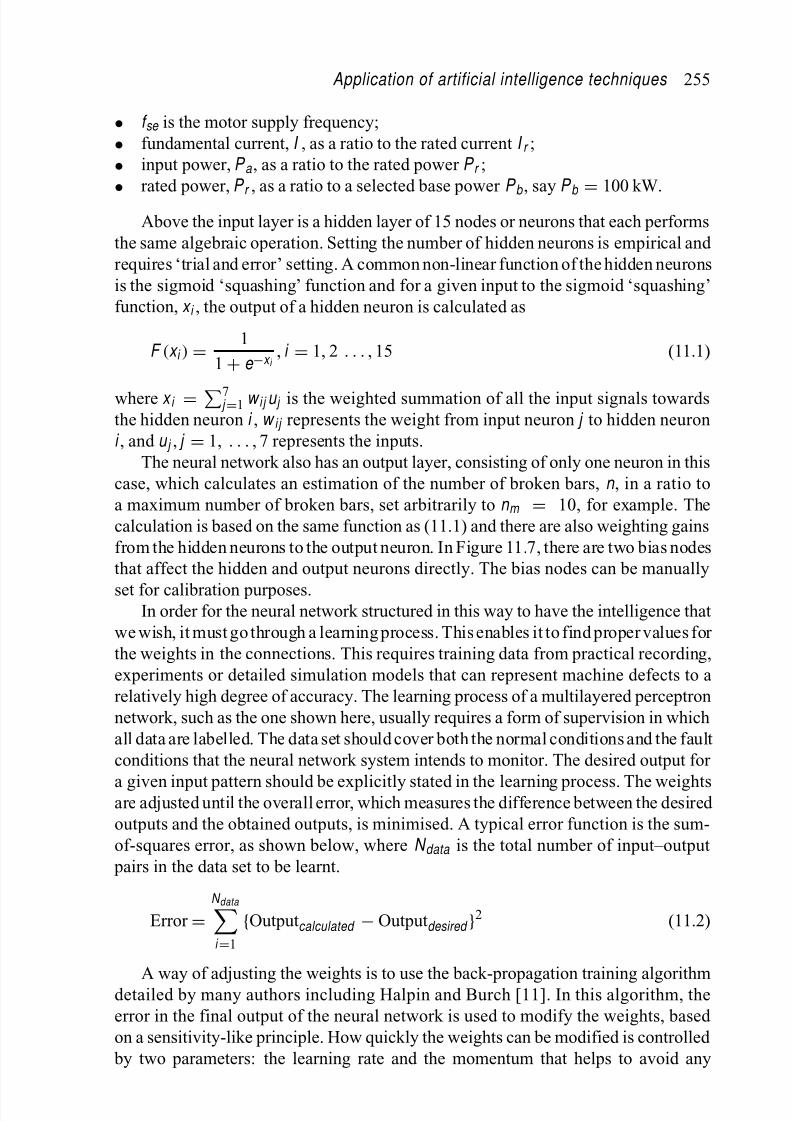
8/20/2019 Condition Monitoring Knjiga
http://slidepdf.com/reader/full/condition-monitoring-knjiga 278/306
Application of artificial intelligence techniques 255
• f se is the motor supply frequency;
• fundamental current, I , as a ratio to the rated current I r ;• input power, P a , as a ratio to the rated power P r ;• rated power, P
r , as a ratio to a selected base power P
b , say P
b = 100 kW.
Above the input layer is a hidden layer of 15 nodes or neurons that each performs
the same algebraic operation. Setting the number of hidden neurons is empirical and
requires ‘trial and error’ setting. A common non-linear function of the hidden neurons
is the sigmoid ‘squashing’ function and for a given input to the sigmoid ‘squashing’
function, x i , the output of a hidden neuron is calculated as
F (x i ) =1
1 + e −x i , i = 1, 2 . . . , 15 (11.1)
where x i =
7 j =1 w i j u j is the weighted summation of all the input signals towards
the hidden neuron i , w i j represents the weight from input neuron j to hidden neuron
i , and u j , j = 1, . . . , 7 represents the inputs.
The neural network also has an output layer, consisting of only one neuron in this
case, which calculates an estimation of the number of broken bars, n , in a ratio to
a maximum number of broken bars, set arbitrarily to n m = 10, for example. The
calculation is based on the same function as (11.1) and there are also weighting gains
from the hidden neurons to the output neuron. In Figure 11.7, there are two bias nodes
that affect the hidden and output neurons directly. The bias nodes can be manually
set for calibration purposes.In order for the neural network structured in this way to have the intelligence that
we wish, it must go through a learning process. This enables it to find proper values for
the weights in the connections. This requires training data from practical recording,
experiments or detailed simulation models that can represent machine defects to a
relatively high degree of accuracy. The learning process of a multilayered perceptron
network, such as the one shown here, usually requires a form of supervision in which
all data are labelled. The data set should cover both the normal conditions and the fault
conditions that the neural network system intends to monitor. The desired output for
a given input pattern should be explicitly stated in the learning process. The weightsare adjusted until the overall error, which measures the difference between the desired
outputs and the obtained outputs, is minimised. A typical error function is the sum-
of-squares error, as shown below, where N data is the total number of input–output
pairs in the data set to be learnt.
Error =
N data i =1
Outputcalculated − Outputdesired 2 (11.2)
A way of adjusting the weights is to use the back-propagation training algorithmdetailed by many authors including Halpin and Burch [11]. In this algorithm, the
error in the final output of the neural network is used to modify the weights, based
on a sensitivity-like principle. How quickly the weights can be modified is controlled
by two parameters: the learning rate and the momentum that helps to avoid any

8/20/2019 Condition Monitoring Knjiga
http://slidepdf.com/reader/full/condition-monitoring-knjiga 279/306
256 Conditi on monitor ing of rotati ng el ectri cal machines
local minimum and assists convergence. The weights closest to the output layer are
modified first and the error is gradually propagated back towards to the input layer
to modify other weights. The procedure is iterated until the overall error defined in
(11.2) is minimised.
Table 11.1 shows the trained weights that were used in the neural network shown
in Figure 11.7 [10]. For instance, the third column is the weights from the third input to
the 15 hidden neurons. This input is proportional to the side-band current component
at frequency (1−2 s )f se . The corresponding weights have the highest values showing
that this input is indeed an important signature for monitoring broken rotor bar faults.
Other inputs were used in this network to account for the effects of the operating point
of the motor and other inherent asymmetries.
The output of the neural network is proportional to the number of broken rotor
bars, as shown in Table 11.2, in a series of cases that were tested using the trained
neural network. The actual output value is affected by the setting of n m = 10 in
this particular case and the desired output used in the training process. For example,
the desired output with one broken rotor bar is 0.1 corresponding to 1/10 = 0.1.
The neural network output should ideally be the same disregarding the operating
point of the motor. Table 11.2 shows that in the tests carried out, the obtained output
of the trained multilayered perceptron network is very close to the targeted val-
ues and the effect of changes to the operating point, with different slips, has been
compensated.
11.4.3 U nsuper vised learning
A neural network can also learn unsupervised [9]. Compared with supervised learning,
an unsupervised system provides a significantly different neural network approach
to the identification of abnormal operation and the learning can be more protracted.
The system can proceed through the learning stage without provision of correct clas-
sifications for each input set of data whereas the connection weight adaptation in
the multilayered perceptron is driven precisely by just such knowledge. The pos-
sibility of training a network on a set of data, with no labelled inputs or only a
fraction of which are labelled clearly, offers significant advantages. However tointerpret the outputs so formed and to use them for classification, knowledge of
the training data set is still required. Nevertheless, unsupervised networks require
fewer iterations in training, since they do not require exact optimisation for their
decision-making.
The unsupervised network implementation described here is based on the well-
known Kohonen feature map. This feature map approach, presented by Kohonen
in the 1980s, derives from the observation that the fine structure of the cerebral
cortex in the human brain may be created during learning by algorithms that pro-
mote self-organisation. Kohonen’s algorithm mimics such processes. It creates avector quantiser by adjusting the weights from common input nodes to the out-
put nodes, which are arranged in a two-dimensional grid-like network, as shown
in Figure 11.8. Such a mapping is usually from a higher-dimensional input space into
a low-dimensional output space.

8/20/2019 Condition Monitoring Knjiga
http://slidepdf.com/reader/full/condition-monitoring-knjiga 280/306
T a b l e 1 1 . 1
W e i g h t m a t r i x f o r a t r a i n e d
m u l t i - l e v e l p e r c e p t r o n n e t w
o r k [ 1 0 ]
I n p u t t o
h i d d e n c o n n e c t i o n
H i d d e
n t o o u t p u t
I n p u
t l a y e r n e u r o n s
c o n
n e c t i o n
H i d d e n l a y e r
1 ( s )
2 ( s / s r )
3 (
N l c o m p
/ N m I )
4 ( I / I r )
5 ( P a
/ P r
)
6 ( P r
/ P b )
7 ( b
i a s )
H i d d e n l a y e r
O u t p
u t n e u r o n
n e u r o n s
n e u r o n s
( n / n m a x
)
1
0 . 1
2 9 7 6 4
0 . 2
8 9 6 4
1 . 1
5 7 7 5
− 0 . 4
0 3 7 4
−
0 . 7
5 3 2 0
− 0 . 0
2 8 3 8
− 0 . 3
4 8 5 7 4
1
1 . 0
0 5 4 5
2
− 0 . 0
2 7 8 6
0 . 3
0 3 4 1
1 . 0
3 7 3 8
− 0 . 3
6 9 6 5
−
0 . 7
2 4 5 1
− 0 . 1
8 4 5 7
− 0 . 2 7 8 0 1
2
0 . 9
7 6 9 5
3
1 . 7
4 8 1 3
2 . 5
0 9 7 0
− 1 . 8
7 5 8 9
2 . 5
1 2 5 7
4 . 8
6 8 9 0
1 . 4
7 3 8 3
− 0 . 1 7 4 0 6
3
− 3 . 9
9 7 3 3
4
0 . 9
9 5 5 9
2 . 9
9 4 8 6
5 . 9
8 6 0 8
1 . 9
5 8 2 3
1 . 1
9 3 1 6
0 . 7
5 4 9 4
0 . 3 7 9 6 1
4
4 . 4
7 2 1 1
5
− 1 . 6
2 9 5 5
− 2 . 8
0 1 1 0
1 . 8
3 4 4 0
− 2 . 3
3 8 9 5
−
3 . 9
2 4 4 5
− 1 . 8
2 8 4 9 8
− 0 . 1 1 6 2 7
5
3 . 4
4 3 2 7
6
0 . 4
3 7 4 3
0 . 3
9 5 9 0
− 1 . 3
9 1 4 3
− 0 . 4
7 0 8 4
0 . 2
6 6 6 6
0 . 2
6 0 2 7
− 0 . 6 0 8 1 0
6
− 1 . 3
9 6 3 5
7
− 0 . 4
9 2 6 8
0 . 2
7 7 0 8
− 0 . 0
4 3 2 6
− 0 . 1
5 6 1 1
- 0 . 2
5 0 5 4
0 . 2
1 1 7 6
− 0 . 4 2 6 0 8
7
− 0 . 0
6 1 8 9
8
0 . 3
5 0 8 7
− 0 . 2
6 8 9 6
− 0 . 4
7 8 9 2
− 0 . 4
4 5 2 2
0 . 5
0 4 6 2
0 . 5
3 9 4 6
0 . 2 1 0 1 8
8
− 0 . 8
9 7 3 9
9
0 . 3
4 1 8 7
0 . 1
1 6 2 7 9
− 0 . 5
2 4 1 7
0 . 2
7 9 3 4
0 . 2
8 1 6 1
0 . 3
1 2 6 3
− 0 . 6 5 6 4 1
9
− 0 . 3
2 9 2 8
1 0
0 . 2
0 3 2 2
− 0 . 0
4 3 5 7
− 0 . 2
2 0 0 8
0 . 3
8 8 7 8
−
0 . 0
2 7 6 2
− 0 . 4
9 0 4 5
− 0 . 3 2 3 0 4
1 0
− 0 . 0
3 2 8 5
1 1
− 0 . 3
5 4 8 0
− 0 . 1
3 3 1 0
− 1 . 3
3 1 4 6
− 0 . 7
1 9 8 6
0 . 8
0 9 2 5
0 . 1
9 9 4 7
− 0 . 2 3 9 2 7
1 1
− 1 . 5
1 6 9 0
1 2
0 . 0
0 6 1 3
0 . 6
4 9 9 5
1 . 2
4 1 9 9
− 0 . 6
5 0 5 6
−
1 . 7
1 7 8 7
0 . 0
5 5 4 0
− 0 . 3 9 3 8 4
1 2
1 . 7
7 1 2 2
1 3
0 . 3
3 7 6 6
0 . 4
7 1 5 5
1 . 5
7 5 2 9
0 . 7
0 2 0 8
0 . 0
4 7 5 1
− 0 . 1
8 0 1 7
− 0 . 2 2 1 5 7
1 3
1 . 4
7 9 7 7
1 4
− 0 . 6
4 1 8 7
0 . 6
8 8 5 8
− 1 4 . 7
9 2 0 6
0 . 9
6 8 7 9
−
1 . 5
8 8 8 1
− 0 . 5
4 3 2 3
− 1 . 6 4 8 4 1
1 4
− 9 . 1
9 3 9 0
1 5
− 0 . 0
2 8 0 7
− 0 . 0
9 2 6 4
− 1 . 2
5 6 1 3
− 0 . 3
0 0 7 3
0 . 2
9 8 5 4
0 . 2
7 4 0 5
− 0 . 3 9 0 7 3
1 5
− 1 . 2
6 9 0 9
1 6
( B i a s )
− 0 . 8
5 7 0 4

8/20/2019 Condition Monitoring Knjiga
http://slidepdf.com/reader/full/condition-monitoring-knjiga 281/306
258 Conditi on monitor ing of rotati ng el ectri cal machines
Table 11.2 Test of a tr ained multi -l evel perceptron networ k [10]
Slip (%) Number of broken Targeted Obtained rotor bars, n output, n /n m output, n /n m
0.1 0 0.1 0.10031
0.4 0 0.1 0.10017
0.6 0 0.1 0.10020
0.4 1 0.2 0.20200
0.6 1 0.2 0.20000
0.4 2 0.3 0.30500
x 1 x 2
...x N
Inputnodes i
Outputnodes j
Connectionweights w ij
Fi gure 11.8 Structure of a self-organising feature map
As shown in Figure 11.8, N inputs X 1, X 2, . . . , X N , are mapped onto M output
nodes Y 1, Y 2, Y M which have been arranged in a matrix; for example, dimensioned
20 × 20 shown as 5 × 5 only in figure 11.8. Each input unit i is connected to an
output unit j through weight W i j . The continuous valued input patterns and connection
weights will give the output node j continuous valued activation value A j :
A j =
N i =1
W i j X i = W j X (11.3)
where X = [X 1, X 2, . . . , X N ] is the input vector and W j = [W 1 j , W 2 j , . . . , W Nj ]T is
the connection vector for output node j .
A competitive learning rule is used, choosing the winner c as the output node withweight vector closest to the present input pattern vector
X − W c = min j
X − W j (11.4)

8/20/2019 Condition Monitoring Knjiga
http://slidepdf.com/reader/full/condition-monitoring-knjiga 282/306
Application of artificial intelligence techniques 259
where denotes the Euclidean distance, or norm, between the two vectors. Both the
input and connection vectors are normalised.
It is noted that the data presented for the learning purpose consist of only inputs, not
outputs. When an input pattern is presented to the neural network without specifying
the desired output, the learning process will find a winning output node c according
to (11.4), and subsequently updates the weights associated with the winning node
and its adjacent nodes. The weights are updated in such a way so that if the same
input is presented to the network again immediately, the winning output node will
still fall into the same neighbourhood of the output node picked up last time, and
with an even greater winning margin when (11.4) is used to select the winning node
this time. In other words, the feature of the input pattern is enhanced by updating the
corresponding weights. A typical learning rule is
W (k )
i j = α (k )
X (k )i − W
(k )i j
W (k +1)i j = W
(k )i j + W
(k )i j
, j ∈ N c (11.5)
where superscript k denotes the number of input pattern presented for learning. N c
denotes the neighbourhood around the winning node c with respect to the present
input pattern. α(k ) is the learning rate that is used in this step of learning.
As more input patterns are presented for the network to learn, the learning rate
gradually decreases to guarantee convergence. The initial weights can be randomly
set, but normalised, and the input patterns can be iteratively used with several rep-
etitions until convergence is reached [12]. After the training, each output node isassociated with a fixed set of weights; that is, W j = [W 1 j , W 2 j , . . . , W Nj ]
T . Each
input pattern can then be measured for its distance to all the output nodes. If an input
pattern is similar to those that contributed to the determination of the weights asso-
ciated with a particular output node, then the distance between these two input and
output nodes will be small. The feature of this input pattern is consequently identified.
The structure and the learning scheme of the neural network give rise to its ability of
self-organising mapping (SOM).
Penman and Yin [9] describes the details of the construction and learning process
of such networks for condition monitoring of induction motors. Figure 11.9 showsthe vibration signal feature maps for three machine conditions
• normal,
• unbalanced supply,
• mechanical looseness of frame mounting.
In each case, the input to the neural network is a large number of vibration
components obtained from a fast Fourier transform of an accelerometer output. These
components are then used to calculate the distances from this input pattern to all of
the 20 ×
20 output nodes and the results are shown in Figure 11.9. The ground plane in Figure 11.9 represents the 20 × 20 output nodes (space), and the vertical
axis indicates the distance calculated. It can be seen that the three conditions give
distinctively different feature maps. Of course, the physical meanings of such maps
depend on the further knowledge that has been embedded in the training process.

8/20/2019 Condition Monitoring Knjiga
http://slidepdf.com/reader/full/condition-monitoring-knjiga 283/306
260 Conditi on monitor ing of rotati ng el ectri cal machines
5
4
3
2
1
5
4
3
21
18 16 14 12 10 8 6 4 2 0
(a)
Normal
4
3
2
1
4
3
21
18 16 14 12 10 8 6 4 2 0
(b)
Unbalanced supply
18
10
10
8
6
29
6
4
2
16 14 12 10 8 6 4 2 0
(c)
Mechanical looseness
Fi gure 11.9 Kohonen feature map of machine conditi ons
11.5 C onclusion
The techniques of artificial intelligence have been seen as potentially valuable for
the condition monitoring of electrical machines because the underlying physics of machine operation and dynamics, as shown in Chapters 8 and 9, is so rich in
fundamental rules, and these could be exploited by an expert system.
This chapter has shown that these techniques can be used to improve the signal-to-
noise ratio in a fault situation, particularly in the complex area of monitoring terminal
conditions and the difficult subset of that, the detection and measurement of partial
discharge activity. However, the development of artificial intelligence for electrical
machine condition monitoring is still in its infancy and despite the considerable work
that has been done in this area, much more is required to bring such techniques into
the mainstream of condition monitoring.An abiding lesson from this chapter is to understand the importance in condi-
tion monitoring of relating various monitoring signals with one another, what was
described in the first edition of this text as multi-parameter monitoring. It is clear,
however, that the future of machine condition monitoring will be heavily affected

8/20/2019 Condition Monitoring Knjiga
http://slidepdf.com/reader/full/condition-monitoring-knjiga 284/306
Application of artificial intelligence techniques 261
by multi-parameter monitoring and by the application of artificial intelligence to that
process.
11.6 R eferences
1. Stone G.C. and Kapler J. Condition based maintenance for the electricalwindings
of large motor and generators. Proceedings of the I EEE Pulp and Paper I ndustr y Conference , Cincinnati, Jun 1997. Piscataway: IEEE; pp. 57–63.
2. Stephan C.E. and Laird T. Condition based maintenance of turbine generators:
what makes it real? Proceedings of the IEEE Electric Machines and Drives Conference , Madison, Wisconsin, Jun 2003. Piscataway: IEEE. 2: pp. 895–9.
3. Filippetti F., Franceschini G., Tassoni C. and Vas P. Recent developments of
induction motor drives fault diagnosis using AI techniques. IEEE Transactions on Industrial Electronics 2000; I E-47: 994–1004.
4. Birmingham W., Joobbani R. and Kim J. Knowledge-based expert systems and
their applications. Proceedings of the ACM/IEEE 23rd Conference on Design Automation , Las Vegas, Jun 1986. Piscataway: IEEE. pp. 531–539.
5. Cawsey A. Essence of Ar ti fici al I ntell i gence . New York: Prentice-Hall; 1997.
6. Benbouzid M.E.H. and Nejjari H. A simple fuzzy logic approach for induc-
tion motors stator condition monitoring. Proceedings of the IEEE Electric Machines and Drives Conference , Cambridge, MA, Jun 2001. Piscataway:
IEEE. pp. 634–9.7. Caldara S., Nuccio S., Ricco Galluzzo G. and Trapanese M. A fuzzy diagnostic
system: application to linear induction motor drives. Proceedings of the IE EE I nstr umentati on and M easurement Technology Conference , Ottawa, May 1997.
Piscataway: IEEE. 1: 257–62.
8. Murray A. and Penman J. Extracting useful higher order features for condi-
tion monitoring using artificial neural networks. IEEE Transactions on Signal Processing 1997; SP-45: 2821–28.
9. Penman J. and Yin C.M. Feasibility of using unsupervised learning, artifi-
cial neural networks for the condition monitoring of electrical machines. I EE Proceedings Part B, Electric Power Applications 1994; 141: 317–22.
10. Filippetti F., Franceschini G. and Tassoni C. Neural networks aided on-line
diagnostics of induction motor rotor faults. IEEE Transactions on Industry Applications 1995; 31: 892–9.
11. Halpin S.M. and Burch R.F. Applicability of neural networks to industrial and
commercial power systems: a tutorial overview. I EEE Transactions on I ndustr y Applications 1997; 33: 1355–61.
12. Wu S. and Chow T.W.S. Induction machine fault detection using SOM-based
RBF neural networks. I EEE Tr ansactions on I ndustri al Electronics 2004; 51:183–94.

8/20/2019 Condition Monitoring Knjiga
http://slidepdf.com/reader/full/condition-monitoring-knjiga 285/306

8/20/2019 Condition Monitoring Knjiga
http://slidepdf.com/reader/full/condition-monitoring-knjiga 286/306
Chapter 12 Condition-based maintenance and asset
management
12.1 I ntroduction
The first objective of condition monitoring is to give early detection of a fault so that
avoiding action can be taken, either by shutting the machine down before catastrophic
failure occurs, or by taking preventative action that returns the plant to full operational
functionality as soon as possible.
So far this book has been concerned with the process of early detection but greater
benefits could be achieved from condition monitoring if the information from moni-
toring is used to schedule maintenance, allowing planned shut-downs so that the life
of plant, of which the electrical machine forms a part, can be extended. This is the
process of condition-based maintenance, first described in Chapter 1.
However, further benefits could be realised from condition monitoring if the
total life-cycle costs of the machine and the plant it serves could be reduced by
its application. This in turn requires an estimate of the running costs of plant and
forecasts of its variation throughout its life. In the light of this knowledge the plant
or asset owner can operate, maintain, renew or dispose of that asset on the basis of
the information made available through these processes. This is asset management.
This chapter describes how these techniques could be applied to rotating electrical
machines.
12.2 C ondition-based maintenance
Condition-based maintenance (CBM), is a process of planning plant maintenance
action on the basis of condition information obtained from the plant. CBM requires
the application of specifically designed software, to be applied to a specific piece
of plant, where the plant structure is defined and the software receives condition
data from the plant. The CBM software then collates and presents that information
in a way that assists maintenance engineers to plan shutdowns. Rao has given a
description of CBM applied to electrical machines but this is an enumeration of thecondition-monitoring techniques applicable to them [1].
The data which CBM software needs to record when monitoring rotating electri-
cal machines to enable maintenance decisions to be made will be signals of global
significance to the machine such as

8/20/2019 Condition Monitoring Knjiga
http://slidepdf.com/reader/full/condition-monitoring-knjiga 287/306
264 Conditi on monitor ing of rotati ng el ectri cal machines
• running hours,
• number of starts and stops, particularly important for induction motors and
standby generators,
• accumulated kWh consumed or produced against time,
• winding and coolant temperatures and in particular temperature rise,
• bearing condition at selected intervals via current measurement and/or
vibration,
• for high-voltage machines winding discharge level at selected intervals.
Long-term deteriorating faults that could be avoided by condition-based mainte-
nance are the
• consequences of overheating,
• consequences of overspeed,• consequences of excessive vibration,
• consequences of shock loads or overloads,
• consequences of corrosion.
An example of the improvement that can be made by the use of CBM in extending
the preventive maintenance threshold to plant operators is shown in Figure 12.1.
Breakdown level Breakdown level
Breakdown level
Condition threshold
Preventativemaintenance
interval
Preventativemaintenance
interval
Preventativemaintenance
interval
Average deterioration
Condition threshold
Condition threshold
Fast deterioration
Slow deterioration
Time t1 t2 t3 Time t4
Time t8 t9 t10
t5 t6 t7
V i b r a t i o n
V i b r a t i o n
V i b r a t i o n
Fi gure 12.1 The advantage of condition-based maintenance, which can extend the preventive maintenance threshold avail able to plant oper ators by expanding the fault-warning period

8/20/2019 Condition Monitoring Knjiga
http://slidepdf.com/reader/full/condition-monitoring-knjiga 288/306
Condition-based maintenance and asset management 265
12.3 L ife-cycle costing
Life-cycle costing, also called whole-life costing, is a technique to establish the total
cost of ownership, including the capital cost of plant, its installation and monitoring
equipment and the cost of maintaining the plant throughout its life. It is a structured
management approach that addresses all cost elements and can be used to produce
a spend profile on the plant over its anticipated life. The subject was previously
hampered by a lack of international standardisation but a standard IEC 60300-3-
3:2005 [2] now exists.
The results of a life-cycle costing analysis can be used to assist managers to make
decisions where there is a choice of maintenance options; for example, between break-
down, planned or condition-based maintenance. The accuracy of life-cycle costing
analysis diminishes as it projects further into the future, so it is most valuable as a
comparative tool when the same long-term assumptions are applied to all the options
and consequently have the same impact.
Life-cycle costing is an innovation of the last 25 years, reflecting a desire from
plant owners to get the maximum value from their investments by sweating their
assets. It is born of an operational environment where the costs of capital invest-
ment and operations and maintenance labour are high. It is used in developed
countries as they attempt to compete with developing countries with lower labour
costs. It is also used in privatised national utilities, like railways, electricity, water
and gas, as private operators attempt to deliver profitability in a highly regulated
environment.Life-cycle costing raises the incentive of a measurable extension to plant life,
reducing overall cost, by investing a proportion of the original plant capital in mon-
itoring and using CBM techniques to reduce through life costs. life-cycle costing
has also developed in other industries, for example defence, where high weapon
programme costs force governments to demand better field performance, and also
aerospace, where the costs of failure due to loss-of-business and litigation can be
terminal for private companies.
In order to achieve life-cycle benefits it is necessary to
• understand the life-cycle costs and devise a management system to control them,
• monitor machine condition,
• maintain the machine on the basis of condition where possible,
• assess long-term plant condition on the basis of monitoring signals and manage
that plant accordingly.
12.4 A sset management
The final part of the previous section is the process of asset management. This isa business process and forecasting framework for decision-making, based on the
behaviour of an asset, which draws from economic and engineering data. Asset
management incorporates an economic assessment of trade-offs between alternative
investment options, using this information to help make cost-effective investment

8/20/2019 Condition Monitoring Knjiga
http://slidepdf.com/reader/full/condition-monitoring-knjiga 289/306
266 Conditi on monitor ing of rotati ng el ectri cal machines
1
10
100
1000
10000
100000
Comparativestate of
maintenancedevelopment
1851–1900,
Corrective
maintenance
1901–1950,
Routine
overhauls
1951–1970,
Condition
monitoring and
preventative
maintenance
1971–1990,
Condition
based
maintenance
1991–2000, Life
Cycle costing
2001 onwards,
Asset
management
towards
terotechnology
Period
Fi gure 12.2 D evelopment of maintenance, conditi on monitori ng, conditi on-based maintenance, l i fe-cycl e costi ng and ful ly integr ated asset management.
[ Based on H odges [ 3] ]
decisions and is described by Hodges [3], who gives an interesting time graphic of
the evolution of maintenance into what he calls terotechnology (see Figure 12.2).
Proactive asset management exploits condition monitoring to assess the condition
of assets, to control their operation, plan maintenance, replacement or disposal. It
ensures that maintenance work is carried out only when needed but before assets
deteriorate, to avoid costly failures. Asset management has come of age in the last 10
years because of
• changes in the economic environment, as described earlier;
• changes in public expectations;
• advances in instrumentation and computer technology.
Asset management again requires the application of specifically designed soft-
ware that builds upon that used for CBM, extending it to a network of assets or plant,
incorporating life-cycle costing and management information and presents the col-
lated information in a way that assists managers in planning maintenance, replacement
or disposal of the assets.Asset management reflects a level of long-term care for engineering plant that is
closer to the health care of human beings by a general practitioner. It is a long way
from breakdown maintenance and requires a significant management and resource
commitment.

8/20/2019 Condition Monitoring Knjiga
http://slidepdf.com/reader/full/condition-monitoring-knjiga 290/306
Condition-based maintenance and asset management 267
In electrical engineering the greatest advances in asset management have been
made with transmission assets with some work going on distribution assets and Brown
and Humphrey have given an overview [4] as has Morton [5].
However, the most progress on asset management, in relation to condition
monitoring, has been achieved on
• transformers, by the use of transformer gas-in-oil analysis [6],
• transformer winding partial discharge data [7],
• transmission lines by the use of monitoring [8].
One advantage of transformer is that there are no moving parts and the transformer
is completely contained within its tank. Therefore condition-monitoring techniques
of global significance to the transformer, like gas-in-oil analysis and partial discharge
detection, are very effective for asset management and these techniques are par-
ticularly applicable to an life-cycle and CBM approach. The asset management of
distribution systems has also been considered, as described by Fangxing and Brown
[9] and Sonderegger et al . [10].
To date, the authors are only aware of the application of asset management tech-
niques to electrical machines in large power stations where key components, such as
turbine generator rotors, can be monitored and spares held to be installed in faulty
machines when condition-monitoring signals suggest that precautionary measures
need to be taken, Kohler et al . [11] have given a description of what could be possible.
12.5 C onclusion
The era of condition-based maintenance, life-cycle costing and asset management is
relatively new, exemplified by Figure 12.2, and as yet there appear to be no published
results to confirm the efficacy of these techniques specifically to rotating electrical
machines. However, it is clear from the experience with transmission plant that the
techniques can and will be applied to rotating electrical machine, particularly in
large installations. Electrical machines are of greatest importance where they are
integrated into a large prime mover or drive system, the great benefit of condition-monitoring electrical machine is that by analysing the machine it will be possible to
detect deterioration both in the machine and the components attached to it.
Therefore the monitoring techniques that are likely to have the most signifi-
cance for the assessment of condition for the purposes of maintenance planning are
techniques of global significance to the machine such as:
• winding and coolant temperature rise;
• rotor dynamics and bearing condition via power, current, speed and vibration
measurement;
• for high-voltage windings partial discharge monitoring.
It is likely that the most effective techniques will in future consider the failure
modes and root causes of failure in machines and adopt artificial intelligence tech-
niques, based upon the tables of physical rules exemplified in Chapters 8 and 9,

8/20/2019 Condition Monitoring Knjiga
http://slidepdf.com/reader/full/condition-monitoring-knjiga 291/306
268 Conditi on monitor ing of rotati ng el ectri cal machines
relating various monitoring signals with one another in a multi-parameter approach
to give the earliest warning of deteriorating condition. The comprehensive analysis
of condition-monitoring signals must take account of the inter-relationship between
electrical and mechanical signals.
12.6 R eferences
1. Rao B.K.N. Handbook of Condition M onitori ng . Oxford, UK: Elsevier, 1996.
2. International Electrotechnical Commission. Dependability management. Part
3-3: Application guide – life cycle costing. IEC 60300-3-3. IEC, 2005.
3. Hodges N.W. The Economic M anagement of Physi cal Assets . London: Mechan-
ical Engineering Publications; 1996.
4. Brown R.E. and Humphrey B.G. Asset management for transmission and
distribution. IEEE Power and Energy Magazine 2005; 3: 39–45.
5. Morton K. Asset management in the electricity supply industry. Power Engi- neer ing Journal 1999; 13: 233–40.
6. Dominelli N., Rao A. and Kundur P. Life extension and condition assessment:
techniques for an aging utility infrastructure. I EEE Power and Energy M agazine 2006; 4: 24–35.
7. Judd M.D., McArthur S.D.J., McDonald J.R. and Farish O. Intelligent condi-
tion monitoring and asset management. Partial discharge monitoring for power
transformers. IEE Power Engineering Journal 2002; 16: 297–304.8. Beehler M.E. Reliability centered maintenance for transmission systems. IEEE
Tr ansactions on Power D eli ver y 1997; PD-12: 1023–28.
9. Fangxing L. and Brown R.E. A cost-effective approach of prioritizing distri-
bution maintenance based on system reliability. IEEE Transactions on Power Delivery 2004; 19: 439–41.
10. Sonderegger R.C., Henderson D., Bubb S. and Steury J. Distributed asset insight.
IEEE Power and Energy Magazine , 2004; 2: 32–9.
11. Kohler J.L., Sottile J. and Trutt F.C. Condition based maintenance of electrical
machines. Pr oceedings of the IEEE Industry Applications Conference , 34th IASAnnual Meeting, Phoenix, 1999. Piscataway: IEEE. pp. 205–211.

8/20/2019 Condition Monitoring Knjiga
http://slidepdf.com/reader/full/condition-monitoring-knjiga 292/306
Appendix F ailure modes and r oot causes in r otating
electrical machines
Based on the machine structure shown in Figures 2.10 and 3.7.
Table 1.
Subassembly Component Failure mode Root cause Early indicators of
the fault
Enclosure Heat
exchanger
Failure of
heat
exchanger
pipework
Failure of
heat
exchanger
tubes
Defective material
Defective
installation
Corrosion
Vibration
Shock
Defective material
Defective
installation
Corrosion
Vibration
Shock
Higher winding
temperature
Higher coolant
temperature
Moisture and lowered
insulation resistance
Increased winding
discharge activity
Vibration
Electrical
connections
Insulation
failure of
connector
Defective material
Defective
installation
Excessive dielectric
stress
Excessive
temperature
Increased connector
discharge activity
Mechanical
failure of
connector
Defective material
Defective
installationVibration
Shock
Higher winding
temperature
VibrationAltered machine
performance
Continued

8/20/2019 Condition Monitoring Knjiga
http://slidepdf.com/reader/full/condition-monitoring-knjiga 293/306
Table 1. Continued
Subassembly Component Failure mode Root cause Early indicators of
the fault
Bushings Insulation
failure of
bushing
Defective material
Defective
installation
Excessive dielectric
stress
Excessive
temperature
Vibration
Shock
Increased bushing
discharge activity
Mechanical
failure of
bushing
Defective material
Defective
installation
Vibration
Shock
Bearings and
seals
Loss of
lubrication,
grease or oil
Lubrication system
failure
Lack of
maintenance
Failure of seals
Higher bearing
temperature
Bearing vibration
Bearing noise
Mechanical
failure of
bearing
element
Loss of lubrication
Vibration
Shock
Overload
Excessive
wear
Loss of lubrication
Vibration
Shock
Overload
Electrically
provoked
failure of
bearing
element
Shaft voltage
Vibration
Shock
Electrical fault
Higher bearing
temperature
Bearing vibration
Bearing noise
Shaft current

8/20/2019 Condition Monitoring Knjiga
http://slidepdf.com/reader/full/condition-monitoring-knjiga 294/306
Table 2.
Subassembly Component Failure mode Root cause Early indicators of the
fault
Stator
winding
Conductors Failure of
conductor
cooling
hoses
Defective design
Defective
manufacture
Excessive vibration
Excessive
temperature
Vibration
Failure of
subconduc-
tors
Excessive vibration
Shock
Component failure
Vibration
Increased winding
discharge activityIncreased winding
arcing activity
Failure of
conductor
bar
Excessive vibration
Shock
Component failure
Vibration
Increased winding
discharge activity
Insulation Insulation
failure of
main wall
insulation
Defective design
Defective
manufacture
Overtemperature
Excessive dielectricstress due to
overvoltage
Excessive vibration
Excessive
temperature
Increased winding
discharge activity
Insulation
failure of
subconduc-
tor
insulation
Defective design
Defective
manufacture
Overtemperature
Excessive dielectricstress, due to high
dv/dt
Excessive vibration
Excessive
temperature
Continued

8/20/2019 Condition Monitoring Knjiga
http://slidepdf.com/reader/full/condition-monitoring-knjiga 295/306
Table 2. Continued
Subassembly Component Failure mode Root cause Early indicators of the
fault
End winding End winding
insulation
failure
Defective design
Defective
manufacture
Excessive
temperature
Excessive dielectric
stress due to
overvoltage
Excessive dielectricstress, due to high
dv/dt
Excessive vibration
Contamination or
debris
Vibration
Increased winding
discharge activity
End winding
movement or
fretting
Defective design
Defective
manufacture
Excessive vibration
Contamination or debris
End winding
contamina-
tion
Oil in enclosure
Moisture in
enclosure
Contamination or
debris

8/20/2019 Condition Monitoring Knjiga
http://slidepdf.com/reader/full/condition-monitoring-knjiga 296/306
Table 3.
Subassembly Component Failure mode Root cause Early indicators
of the fault
Rotor
winding
Conductors Failure of
subconduc-
tors
Excessive vibration
Shock
Component failure
Excessive temperature
Vibration
Increased winding
discharge activity
Increased winding
arcing activity
Failure of
conductor
bar
Excessive vibration
Shock
Component failure
Excessive temperature
Vibration
Increased winding
discharge activity
Insulation Insulation
failure of
main wall
insulation
Defective design
Defective manufacture
Overtemperature
Excessive dielectric
stress due to
overvoltage
Excessive vibration
Excessive temperature
Increased winding
discharge activity
Insulation
failure of subconduc-
tor
insulation
Defective design
Defective manufactureOvertemperature
Excessive dielectric
stress, due to high
dv/dt
Excessive vibration
Excessive temperature
End winding End winding
insulation
failure
Defective design
Defective manufacture
Overtemperature
Excessive dielectricstress due to
overvoltage
Excessive dielectric
stress, due to high
dv/dt
Excessive vibration
Excessive temperature
Contamination or
debris
Vibration
Increased winding
discharge activity
End windingmovement or
fretting
Defective designDefective manufacture
Excessive vibration
Contamination or
debris
Continued

8/20/2019 Condition Monitoring Knjiga
http://slidepdf.com/reader/full/condition-monitoring-knjiga 297/306
Table 3. Continued
Subassembly Component Failure mode Root cause Early indicators
of the fault
End winding
banding
failure
Defective design
Defective manufacture
Overspeed
Overload
Excessive vibration
Excessive temperature
Contamination or
debris

8/20/2019 Condition Monitoring Knjiga
http://slidepdf.com/reader/full/condition-monitoring-knjiga 298/306
Table 4.
Subassembly Component Failure mode Root cause Early indicators
of the fault
Rotor body Shaft Shaft failure Torsional vibration
Shock loading
Overload
Cracks located by
non-destructive
testing or run
down tests
Vibration
Rotor core
and body
Core hot spot Defective design
Defective manufacture
Debris in core
Excessive vibrationCirculating current
Excessive temperature
Higher core
temperature
Core
slackening
Defective design
Defective
manufacture, faulty
assembly
Excessive vibration
Core clamp failure
Vibration
Integrity
failure of body or
wedges
Defective design
Defective manufactureExcessive vibration
Cracks located by
non-destructivetesting or run
down tests
Vibration
Slip Rings Sparking
Overheating
Damaged
slip rings
Defective maintenance
Defective brushes
Excessive temperature
Increased
brushgear arcing
activity
Increased brush
wear
Increased
brushgear temperature
Commutator Sparking
Overheating
Damaged
commutator
Defective maintenance
Defective brushes
Excessive temperature
Brushgear Overheating
Damaged
brushgear
Defective maintenance
Defective brushes
Excessive temperature

8/20/2019 Condition Monitoring Knjiga
http://slidepdf.com/reader/full/condition-monitoring-knjiga 299/306

8/20/2019 Condition Monitoring Knjiga
http://slidepdf.com/reader/full/condition-monitoring-knjiga 300/306
I ndex
accelerometers 92–4, 167–8
AC commutator motors 32
AC reluctance motors 32
ageing of insulation 35–9
aggregate failure rate 68–9
aliasing 113–15
amplifier circuits 102–3
analogue-to-digital conversion 105
artificial intelligence techniques 245–61
artificial neural networks (ANN) 253–60
expert systems 246–9
fuzzy logic 250–3
artificial neural networks (ANN) 253–60
assembly structure 69–71
distribution of failures 73–5asset management 265–7
auto-correlation function 116
availability, definition 62
axial leakage flux monitoring 113–17,
214–17, 223
bearings
damage caused by shaft voltages 57–8
failure modes and root causes 270
failure rates 73, 74
lubrication oil analysis 152–7
selection criteria 57
temperature measurement 128–9
types 16–18
vibration response 173–6
bitumen-based insulation 40
brushgear 26
failure modes and root causes 275
fault detection 194
materials 27 busbars 26
bushings
failure modes and root causes 270
insulation failures 54–6
cabling, instrumentation 103
cause-and-effect diagram 70
cepstrum analysis 118–20
chemical monitoring 137–57
detectability 138–42
gas analysis 148–52
insulation degradation
detection 142–52
mechanisms 137–8
lubrication oil analysis 152–7
particulate detection
chemical analysis 146–8
core monitors 142–5
circulating current measurement 200
commutators 26failure modes and root causes 275
mechanical frequency components 185
condition-based maintenance (CBM)
263–4
condition monitoring
breakdown of tasks 79–81
definition of terms 61–3
connections: see electrical connections
construction of electrical machines 17–33
connections 26
enclosures 20–5
materials used 27
rotors 18
stator core and frame 18
typical sizes and properties 28–9
windings 18–20
contamination 35
insulation 38, 43
coolant systems
blocking 49–50, 56
chemical monitoring 139–41, 142–52heat exchangers 26, 269
leaks 48–50, 56
temperature measurement 132, 134
core monitors 142–5

8/20/2019 Condition Monitoring Knjiga
http://slidepdf.com/reader/full/condition-monitoring-knjiga 301/306
278 Conditi on monitor ing of rotati ng el ectri cal machines
corona discharge 229
correlation analysis 116–17
coupled systems 170
misalignment 182, 183
cross correlation function 116–17current densities, typical 29
current imbalance, rotor windings 52,
211–12
current measurement 99, 100
current monitoring 207–12
data acquisition 104–6
data sampling 105–6
aliasing 113–15
discrete Fourier transform 111time averaging 120–1
data storage 110
DC generators 32
DC motors
construction 18, 23
root causes of faults 32
rotor winding faults 54
debris measurement
debris sensitive detectors 100–2
lubrication oil analysis 152–3, 153–7definition of terms 61–3
delamination of insulation 38, 40–1
discharge monitoring 229–41
capacitive coupling method 234–6, 238
detection problems 238, 239
earth loop transient method 233
insulation remanent life determination
236, 238
other methods 238
RF coupling method 231, 238
wideband RF method 236, 237, 238discrete Fourier transform 111
displacement transducers 89–91
duration of the failure sequence 62, 63–5
earth leakage fault detection 195–6
earth loop transient monitors 233
electrical ageing, insulation 36–7
electrical connections 26
failure modes and root causes 269
faults 54–6electrical insulation
contamination 38, 43
degradation 137–8
ageing mechanisms 35–9
detectability 138–42
detection methods 142–52
discharge monitoring 229–41
to determine remanent life 236, 238
failure modes 39–54, 271–2, 273 bushings 54–6
expert systems for monitoring 248–9
rotor windings 50–4
stator windings 40–50
root causes of faults 45–54, 271–2, 273
rotor windings 18
stator windings 20
thermal properties 14–15
electrical measurements 99–100
comprehensive methods 212–21
discharge monitoring 229–41
mechanical and electrical interaction 221
related to specific faults 223
electrical noise, precautions 104, 239
electric loading, typical 29
electromagnetic velocity probes 91–2
embedded temperature measurement 127–31
enclosures 20–5, 26
failure modes and root causes 269–70
materials 27
end windings 20, 21 bracing 20
failure modes and root causes 48, 272,
273–4
insulation 42–3
materials 27
stress grading 43
vibration response 167–8
engine-driven generators 30
environmental ageing 38
environmental conditions 34, 35
insulation contamination 38, 43
expert systems 246–9
failure, definition 61
failure mechanism, definition 61–2
failure mode and effects analysis (FMEA)
62–3
failure modes
bearing faults 56
connection faults 54–6
definition 61electrical insulation 39–58
probability density function 66–9
rotor windings 50–4
shaft voltages 56–8
8/20/2019 Condition Monitoring Knjiga
http://slidepdf.com/reader/full/condition-monitoring-knjiga 302/306
Index 279
stator core faults 54
stator winding faults 45–50
stator winding insulation 40–5
summary tables 269–75
types 66water coolant faults 56
failure rate 66–9
aggregate 68–9
definition 62
life-cycle variation 68–9
typical 71–3
failure sequence 63–5
fast Fourier transform 111–12
ferromagnetic techniques, lubrication oil
analysis 153–4
fibre-optic proximetry 91
fibre-optic temperature sensing 87–8, 131,
134
fibre-optic torque transducers 96, 97
flame ionisation detectors 149–50
fluidic load cells 97
force measurement 94–7
fuzzy logic 250–3
gas analysis 148–52
gas chromatography 146–7
off-line analysis 149
oil degradation detection 153
gearboxes, vibration analysis 118–20
generator exciters 27–8
Hall-effect devices
current measurement 99
magnetic flux density measurement 97,
98–9
voltage measurement 100
harmonics, converter 113–15
hazard function 62
heat exchangers 26, 269
high-order spectral analysis 115–16
hot-spot measurement 132
hydro generators
partial discharge analyser (PDA) 239–40
root causes of faults 30
typical sizes and properties 29
induction generators 31
induction motors
construction 18, 23, 24, 25, 28
failure rates 72, 73, 74
fault detection
airgap search coils 207
power spectrum analysis 219
rotor current monitoring 210–12
stator current monitoring 207–10root causes of faults 31
rotor faults 50–2, 185, 223
thermal imaging 133
typical sizes and properties 29
variable speed operation 221
vibration monitoring 181, 183, 186
inductive debris detectors 101, 153–4
inductive torque transducers 96
infra-red gas analyser 152
infra-red thermography 87insulation: see electrical insulation
integrated circuit temperature sensors 87
ionising radiation, insulation ageing 38
key phasors 90
Kohonen feature map 256, 258–60
leakage flux monitoring 113–17, 214–17, 223
life-cycle costing 265
life-cycle variation in failure rates 68–9
lubrication oil analysis 152–7
magnetic drain plugs 154, 156
magnetic flux density measurement 97–9,
196–200
magnetic loading, typical 29
magneto-elastic torque transducers 97
maintenance regimes 75–6, 263–4
material properties 14–16
electrical steel 18
stator core and frame 18
materials, types for various components 27
mean time between failure (MTBF) 62, 71–3
mean time to failure (MTTF) 62
mean time to repair (MTTR) 62
mechanical ageing, insulation 37–8
mechanical loading, typical 29
mechanical properties 14
metal foil-type strain gauge 94–5
misalignment, coupled systems 182, 183moisture absorption by insulation 37, 38, 49
multilayered perceptron (MLP) training
254–6
multiplexers 104–5

8/20/2019 Condition Monitoring Knjiga
http://slidepdf.com/reader/full/condition-monitoring-knjiga 303/306
280 Conditi on monitor ing of rotati ng el ectri cal machines
Nyquist frequency 106
oil whirl 175–6
frequency components 184, 223operational conditions 33
operational issues 81
optical debris sensors 101–2
optical encoders
torque measurement 97
vibration measurement 91
ozone detection 149
partial discharge analyser (PDA), hydro
generators 239–40 partial discharges 37
insulation degradation 138
internal void discharge 40–1
slot discharge 41–2
see al so discharge monitoring
particulate detection and analysis 142–8
permanent magnet synchronous machines 31
permeance-wave method 165–7
photo-ionisation detectors 150, 152
‘picket fence’ effect 112–13
piezoelectric accelerometers 92–4 power (electrical)
spectrum analysis 217–19
related to specific faults 223
typical 29
power spectral density 115
power spectrum 118–20
probability density function 66–9
proximity probes 89–91
quartz thermometers 87
recurrent surge oscillograph (RSO) 204–7
redundancy 70–1
reliability, definition 62
reliability analysis 66–9
reliability function 62, 66
resistance temperature detector (RTD) 82
RF monitors 231, 236, 238
Roebel technique 46–7
Rogowski coils 100, 211–12, 234rolling element bearings
mechanical frequency components 184
vibration monitoring 187–9
vibration response 173–5
root cause analysis (RCA) 62, 65
root causes
definition 61
summary tables 269–75
types 65rotational speeds, typical 29
rotors
airgap eccentricity 56, 75
detection 183, 213
producing UMP 165–7, 182
bearing types 16–18
cooling 18, 29
coupled systems 170
misalignment 182, 183
electrical angular frequency components of
faults 223
failure modes and root causes 275
materials 27
mechanical design 18
mechanical frequency components of
faults 184, 185
shaft
dynamic displacement of 185, 223
eccentricity measurement 90
static misalignment 184, 223
shaft voltages
bearing and lubricating oil degradation
56–8, 153
monitoring 219–21
temperature measurement 131
typical diameters 29
unbalanced mass 168–71
vibration response 168–73
torsional oscillation monitoring 183,
186torsional response 171–3
transverse response 168–71
rotor windings 18
broken rotor bars 51
detection 115–16, 122, 216, 220,
254–5
mechanical and electrical frequency
components 185, 223
current imbalance 52, 211–12
failure modes 50–3, 273–4
failure rates 73, 74fault detection
circulating current measurement 200
earth leakage 195–6
fault detection 196–204

8/20/2019 Condition Monitoring Knjiga
http://slidepdf.com/reader/full/condition-monitoring-knjiga 304/306
Index 281
inter-turn faults 196–204, 204–7
recurrent surge oscillograph (RSO)
204–7
rotor current monitoring 210–12
stator current monitoring 207–10materials 27
root causes of faults 50–4, 273–4
sampling rate 105–6
seals, failure modes and root causes 270
search coils
discharge monitoring 234
magnetic flux density measurement 97–8
rotor turn-to-turn fault detection 196–200
stator winding fault detection 194
self-organising mapping (SOM) 259
semiconductor temperature transducers 87
sequence of failure 63–5
shaft
dynamic displacement of 185, 223
eccentricity measurement 90
static misalignment 184, 223
shaft flux monitoring 113–17, 214–17, 223
shaft voltages
damage caused to bearings 57–8, 153monitoring 219–21
Shannon sampling theorem 105–6
shock pulse monitoring 187–9
shock pulse value (SPV) 187
signal conditioning 102–3
signal processing 109–25
correlation analysis 116–17
spectral analysis 110–16
time averaging 120–1
vibration measurement 118–21
sleeve bearings 175–6
sliprings 26
failure modes and root causes 275
materials 27
slot discharge 41–2
smoke detection 142–5
spectral analysis
aliasing 113–15
basic theory 110–11
correlation analysis 116–17
high-order analysis 115–16‘picket fence’ effect 112–13
shaft flux monitoring 214–17
vibration measurement 118–21, 179–82
wavelet analysis 121–5
window functions 111–12
standards
partial discharge measurement 240
permissible limits to residual unbalance
170vibration 177–8
stator core and frame 18, 20
coolant systems 29
core faults 54
materials 27
typical core length 29
vibration 159–67
electromagnetic force wave 164–7,
182–3
monitoring 182–3natural frequencies 161–4
stator windings 18–20
coolant systems 29, 48–50
current monitoring 193–4, 217, 223
discharge monitoring 233–4, 236
electrical angular frequency components of
faults 223
electrical structure 230, 232
end windings 20, 21
bracing 20
faults 48insulation failure modes 42–3
stress grading 43
vibration response 167–8
failure modes 271–2
failure rates 73, 74
insulation failure modes 40–5
delamination and voids 40–1
end windings 42–3
expert systems for monitoring
248–9inter-turn faults 44
repetitive transients 44–5
slot discharge 41–2
transient voltages 44–5
inter-turn fault detection 182, 183
materials 27
mechanical frequency components of
faults 185
root causes of faults 45–50, 271–2
end winding faults 48
winding conductor faults 46–8winding coolant system faults
48–50
temperature measurement 127–31
strain gauges 94–6
8/20/2019 Condition Monitoring Knjiga
http://slidepdf.com/reader/full/condition-monitoring-knjiga 305/306
282 Conditi on monitor ing of rotati ng el ectri cal machines
structural design 69–71
subassemblies 70–1
distribution of failures 73–5
supply voltage unbalance 33, 158–60, 183
surface tracking 37, 54–6survivor function 62
synergism between ageing stresses 39
telemetry systems 96
temperature measurement 81–8, 127–34
bulk measurement 132, 134
coolant systems 132, 134
embedded 127–31
fibre-optic sensing 87–8, 131, 134
hot-spot measurement 132stator windings 127–31
thermal images 132
vapour pressure method 131
thermal ageing, electrical insulation 36,
137–8
thermal images 132
thermal properties 14–16
thermal stress 35
thermistors 86–7
thermocouples 83–6
time averaging 120–1time between failure (TBF) 62
time to failure (TTF) 62
time to repair (TTR) 62
torque measurement 96–7
torsional oscillation monitoring 183, 186
torsional response 171–3
transient voltages 33, 35, 37, 44–5
trend analysis 120–1
turbine generator analyser (TGA) 240
turbine generators
construction 16–26
discharge monitoring 236, 239
failure rates 72
off-line fault detection 204–7
on-line fault detection 195–204
partial discharge detection 233
rotor winding faults 52–3
stator windings 230
typical sizes and properties 29
vibration monitoring 181–2, 183, 186
winding insulation failure, expert systems249
ultrasonic discharge detection 236
ultra-violet techniques, chemical analysis
147–8
unbalanced magnetic pull (UMP) 52, 56, 165,
182unbalanced rotor mass 168–71
vapour pressure method of temperature
measurement 129, 131
variable speed motors 221
velocity transducers 91
vibration measurement 88–94, 176–86
monitoring techniques 176–86
faults detectable from the stator force
wave 182–3frequency spectrum monitoring
179–82
overall level monitoring 177–9
torsional oscillation monitoring 183,
186
related to specific machine faults 184–5
signal processing 118–21
types for various applications 94
vibration response 159–76
bearings 173–6end windings 167–8
rotors 168–73
stator core 159–67
vibration standards 177–8, 181
voids, insulation 40–1, 43
voltage measurement 100
wavelet analysis 121–5
wear measurement
debris sensitive detectors 100–2lubrication oil analysis 152–3, 153–7
weights, typical 29
windings 18–20
materials 27
see al so rotor windings; stator windings
window functions 111–12
wind turbine generators
cause-and-effect diagram 70
failure rates 72
x-ray fluorescence detection 157

8/20/2019 Condition Monitoring Knjiga
http://slidepdf.com/reader/full/condition-monitoring-knjiga 306/306