
Wind Turbine Drivetrain Condition Monitoring During GRC ... · Condition Monitoring During ... CBM...
58
NREL is a national laboratory of the U.S. Department of Energy, Office of Energy Efficiency & Renewable Energy, operated by the Alliance for Sustainable Energy, LLC. Contract No. DE-AC36-08GO28308 Wind Turbine Drivetrain Condition Monitoring During GRC Phase 1 and Phase 2 Testing S. Sheng, H. Link, W. LaCava, J. van Dam, B. McNiff, P. Veers, and J. Keller National Renewable Energy Laboratory S. Butterfield and F. Oyague Boulder Wind Power Technical Report NREL/TP-5000-52748 October 2011
Transcript of Wind Turbine Drivetrain Condition Monitoring During GRC ... · Condition Monitoring During ... CBM...

NREL is a national laboratory of the U.S. Department of Energy, Office of Energy Efficiency & Renewable Energy, operated by the Alliance for Sustainable Energy, LLC.
Contract No. DE-AC36-08GO28308
Wind Turbine Drivetrain Condition Monitoring During GRC Phase 1 and Phase 2 Testing S. Sheng, H. Link, W. LaCava, J. van Dam, B. McNiff, P. Veers, and J. Keller National Renewable Energy Laboratory
S. Butterfield and F. Oyague Boulder Wind Power
Technical Report NREL/TP-5000-52748 October 2011
NREL is a national laboratory of the U.S. Department of Energy, Office of Energy Efficiency & Renewable Energy, operated by the Alliance for Sustainable Energy, LLC.
National Renewable Energy Laboratory 1617 Cole Boulevard Golden, Colorado 80401 303-275-3000 • www.nrel.gov
Contract No. DE-AC36-08GO28308
Wind Turbine Drivetrain Condition Monitoring During GRC Phase 1 and Phase 2 Testing S. Sheng, H. Link, W. LaCava, J. van Dam, B. McNiff, P. Veers, and J. Keller National Renewable Energy Laboratory
S. Butterfield and F. Oyague Boulder Wind Power
Prepared under Task No. WE11.0305
Technical Report NREL/TP-5000-52748 October 2011

NOTICE
This report was prepared as an account of work sponsored by an agency of the United States government. Neither the United States government nor any agency thereof, nor any of their employees, makes any warranty, express or implied, or assumes any legal liability or responsibility for the accuracy, completeness, or usefulness of any information, apparatus, product, or process disclosed, or represents that its use would not infringe privately owned rights. Reference herein to any specific commercial product, process, or service by trade name, trademark, manufacturer, or otherwise does not necessarily constitute or imply its endorsement, recommendation, or favoring by the United States government or any agency thereof. The views and opinions of authors expressed herein do not necessarily state or reflect those of the United States government or any agency thereof.
Available electronically at http://www.osti.gov/bridge
Available for a processing fee to U.S. Department of Energy and its contractors, in paper, from:
U.S. Department of Energy Office of Scientific and Technical Information P.O. Box 62 Oak Ridge, TN 37831-0062 phone: 865.576.8401 fax: 865.576.5728 email: mailto:[email protected]
Available for sale to the public, in paper, from:
U.S. Department of Commerce National Technical Information Service 5285 Port Royal Road Springfield, VA 22161 phone: 800.553.6847 fax: 703.605.6900 email: [email protected] online ordering: http://www.ntis.gov/help/ordermethods.aspx
Cover Photos: (left to right) PIX 16416, PIX 17423, PIX 16560, PIX 17613, PIX 17436, PIX 17721
Printed on paper containing at least 50% wastepaper, including 10% post consumer waste.

iii
Acknowledgements
The National Renewable Energy Laboratory’s contributions to this report were funded by the Wind and Water Power Program, Office of Energy Efficiency and Renewable Energy of the U.S. Department of Energy, under contract No. DE-AC02-05CH11231. The authors are solely responsible for any omission or errors contained herein. NREL wishes to acknowledge and thank the Office of Energy Efficiency and Renewable Energy and its staff who have supported this work from its inception. Specifically, NREL would like to thank Mark Higgins and Michael Derby for their support and guidance. NREL also appreciates the support from the drivetrain condition monitoring research partners.

iv
Abstract
Wind turbines have historically had reliability issues, which subsequently increase the overall cost of energy. The majority of these issues are caused by faults in the drivetrain, led by the main gearbox. These issues are widespread, existing across all turbine sizes and manufacturers. One means to mitigate the detrimental effect of reliability issues is through condition monitoring. Condition monitoring is a method to assess a system’s health; enabling proactive maintenance planning, reducing downtime, reducing operations and maintenance costs and, to some extent, increasing safety. In this report, vibration, acoustic emission (specifically stress wave), electrical signature, oil cleanliness, oil debris, and oil sample analysis condition monitoring techniques were investigated for two identical 750 kW wind turbine gearboxes, in both a dynamometer test cell and field installation. The two test gearboxes are referred to as Gearboxes 1 and 2 in this report. The strengths and weaknesses of the different techniques were assessed. The feasibility of using oil cleanliness monitoring to determine the length of the run-in procedure was investigated on both gearboxes. Both demonstrated that, to make the run-in process sufficient, longer run-in durations at each torque level may be needed as compared to the current standard run-in procedure of prescribed durations at each torque level. Without fully completing the run-in, surface roughness remains excessive leading to increased contact stresses when the gearbox is placed into service and potentially leading to premature failures. Gearbox 1 was installed in a turbine at the Ponnequin Wind Farm and, after 300 hours of operation, it experienced two oil loss events and excessive temperatures that caused damage to some of its internal components. The gearbox was subsequently removed and inspected. Since the damage to the teeth was not severe, gearbox 1 also was installed and retested in the National Wind Technology Center's (NWTC) dynamometer before it was disassembled. Gearbox 2 was tested only in the dynamometer and was undamaged. The results were compared between gearboxes for each monitoring technique and the technique itself was evaluated for its detection capability. Vibration, acoustic emission, and oil debris monitoring all demonstrated the capability of distinguishing between the healthy and damaged gearbox components. It was possible to identify which stage of the gearbox was damaged, but not exactly which component was damaged for some gears and bearings inside the gearbox. Electrical signature analysis did not show any indication of the gear teeth damage, most likely because the damage to the teeth was not severe. To detect dominant failure modes in a gearbox, a combination of vibration or acoustic emission and oil debris monitoring techniques is recommended. Each technique is sensitive to sensor location and even orientation, and maintenance alerts are specific to each component and damaged part.

v
Table of Contents Acknowledgements ...................................................................................................... iii Abstract ......................................................................................................................... iv Table of Contents .......................................................................................................... v List of Tables ............................................................................................................... vii Acronym List .............................................................................................................. viii Introduction ................................................................................................................... 1
The Gearbox Reliability Collaborative (GRC) .............................................................. 3 Condition Monitoring (CM) .......................................................................................... 3 GRC CM Partnerships and Documents ...................................................................... 4 GRC CM Phase 1 and Phase 2 .................................................................................. 4
Drivetrain CM Approach and Rationale ....................................................................... 5 CM Systems Investigated ............................................................................................. 8
SKF WindCon ............................................................................................................. 8 SwanTech SwanWind ................................................................................................. 8 Kittiwake Online Sensor Suite and Particle Content Sensor ....................................... 8 Macom TechAlert 10 ................................................................................................... 9 GasTOPS MetalScan 3000 ......................................................................................... 9 Hydac CSM 1220 ........................................................................................................ 9 SKF Baker EXP 4000 ............................................................................................... 10 Eaton Motor CM System ........................................................................................... 10 NREL Customized Vibration-based CM System ....................................................... 10
Tests and CM System Configurations ....................................................................... 12 Test Articles .............................................................................................................. 12 Tests Conducted ....................................................................................................... 16 CM System Configurations ....................................................................................... 19
Test Results and Discussions ................................................................................... 25 Vibration Analysis ..................................................................................................... 25 Stress Wave Analysis ............................................................................................... 28 Oil Monitoring ............................................................................................................ 29 Oil Cleanliness Level Monitoring ............................................................................... 30 Oil Debris Monitoring ................................................................................................ 31 Oil Condition Monitoring ............................................................................................ 35 Oil Sample Analysis .................................................................................................. 36 Electrical Signature Analysis ..................................................................................... 37 Summary of Results .................................................................................................. 37
Challenges in Wind Turbine Drivetrain CM and Future R&D Areas ........................ 39 Challenges to Implementation of Wind Turbine Drivetrain CM ................................. 39 Future R&D areas in Wind Turbine Drivetrain CM .................................................... 41
Conclusions ................................................................................................................. 42 References ................................................................................................................... 43 Appendix A – Project Partners ................................................................................... 46 Appendix B – Other Activities .................................................................................... 47
Workshop .................................................................................................................. 47 Round Robin Project ................................................................................................. 47
Appendix C – Publications and Presentations ......................................................... 48
vi
List of Figures Figure 1. Downtime caused by turbine subsystems ........................................................................ 1 Figure 2. Annual failure frequency of turbine subsystems ............................................................. 2 Figure 3. Typical utility-scale wind turbine drivetrain ................................................................. 12 Figure 4. Exploded view of the GRC test gearbox ....................................................................... 13 Figure 5. GRC gearbox layout and bearing nomenclatureTest Platforms .................................... 13 Figure 6. Diagram of NREL 2.5-MW dynamometer test facility ................................................. 14 Figure 7. NREL dynamometer test stand with the test article installed. PIX #16913. ................ 15 Figure 8. GRC test turbine at Xcel Energy's Ponnequin wind farm. PIX #19257. ...................... 16 Figure 9. CM system configuration in Phase 2 Gearbox 1 Dynamometer Retest ....................... 20 Figure 10. NREL customized vibration-based CM system sensor locations ................................ 21 Figure 11. Accelerometer installation on NREL's customized vibration-based CM system ........ 22 Figure 12. Lubrication system schematics for Phase 2 Gearbox 1 Dynamometer Retest ............ 23 Figure 13. Gearbox 1 high speed stage (taken in field after second oil loss event). PIX #19600. 25 Figure 14. Gearbox 1 high speed stage gear damage (during Gearbox 1 disassembly). PIX #19599........................................................................................................................................... 25 Figure 15. Results from a vibration-based CM system (healthy gearbox) ................................... 27 Figure 16. Results from a vibration-based CM system (damaged gearbox) ................................. 27 Figure 17. Stress Wave Amplitude Histogram (healthy gearbox) ................................................ 28 Figure 18. Stress Wave Amplitude Histogram (damaged gearbox) ............................................. 29 Figure 19. Oil cleanliness level (run-in) ....................................................................................... 31 Figure 20. Cumulative particle counts obtained by sensor K1 (run-in) ........................................ 32 Figure 21. Cumulative particle counts obtained by sensor K2 (run-in) ........................................ 32 Figure 22. Cumulative particle counts obtained by sensor K3 (run-in) ........................................ 33 Figure 23. Cumulative particle counts obtained by sensor K1 (damaged gearbox) ..................... 33 Figure 24. Ferrous particle counts by sensor K2 categorized into five size bins (run-in) ............ 34 Figure 25. Ferrous particle counts by sensor K3 categorized into five size bins (run-in) ............ 34 Figure 26. Oil condition sensor readings (field test)..................................................................... 35 Figure 27. Oil condition sensor readings (dynamometer retest) ................................................... 36 Figure 28. Oil sample analysis (run-in) ........................................................................................ 37

vii
List of Tables
Table 1. Advantages and limitations of lubricant and vibration CM techniques ............................ 5 Table 2. GRC CM-related testing ................................................................................................. 17 Table 3. CM system implementation at different stages of the GRC tests ................................... 19 Table 4. Sensor notations and descriptions ................................................................................... 21

viii
Acronym List
Acronym Definition
AE acoustic emission
CBM condition-based maintenance
CM condition monitoring
COE cost of energy
CRB cylindrical roller bearing
DAS data acquisition system
DOE Department Of Energy
fcCRB full complement cylindrical roller bearing
FFT Fast Fourier Transform
GRC Gearbox Reliability Collaborative
GMF gear meshing frequency
HS high speed
HSS high-speed shaft
ISO International Organization for Standardization
ISS intermediate-speed shaft
LSS low-speed shaft
NREL National Renewable Energy Laboratory
O&M operation and maintenance
PLC planet carrier
R&D research and development
RPM revolutions per minute
SCADA supervisory control and data acquisition
SEE spectral emitted energy
SEM scanning electron microscope
SRB spherical roller bearing
TRB tapered roller bearing

1
Introduction
Wind energy is currently the fastest growing energy source among various renewable energy options in the world [1]. By the end of 2010, the global cumulative installed wind power had reached more than 197 gigawatts (GW) [2]. However, the industry still experiences premature turbine component failures. A summary of the downtime of turbine components is plotted in Figure 1. The data represent about 27,000 turbines, ranging from 500 kW to 5 MW, for both onshore and offshore applications [3]. Three elements that comprise the wind turbine drivetrain - the gearbox, generator, and main shaft/bearing – together cause the majority of the total turbine downtime. The gearbox is the leading contributor to total turbine downtime.
Figure 1. Downtime caused by turbine subsystems

2
Figure 2 illustrates the annual failure frequency of turbine subsystems based on the 2009 Wind Stats Newsletter data. The top three most frequently failed subsystems are electric systems, the gearbox, and the generator. The highest rate, at approximately 27%, is equivalent to about 0.6 failures for each turbine subsystem annually, based on data reported by Reliawind [4].
Figure 2. Annual failure frequency of turbine subsystems
These premature turbine subsystem failures lead to increases in operation and maintenance (O&M) costs, and subsequently, the cost of energy (COE) for wind power. As more turbines are installed offshore and as turbines increase in size, these failures will become even more costly. To make wind power more competitive, there is a need for the industry to reduce turbine downtime and improve reliability.
When crane cost is taken into consideration, maintenance events for the gearbox, generator, rotor, and main shaft/bearing are the most costly. Among the aforementioned subsystems, the gearbox stands out as causing the most downtime as shown in Figure 1, failing second most frequently, as shown in Figure 2, and costing the most to maintain throughout a turbine’s 20 years of design life [5]. Therefore, if only one subsystem can be targeted for a reliability

3
improvement, the gearbox is the obvious choice. Other subsystems are typically easier and cheaper to fix, although they may fail more frequently.
The Gearbox Reliability Collaborative (GRC) Improving reliability of wind turbine gearboxes has been challenging for the industry. Despite reasonable adherence to accepted gearbox design standards and practices, wind turbine gearboxes sometimes do not achieve their design life goals of 20 years [6]. The problem of premature wind turbine gearbox failures is widespread; it affects most original equipment manufacturers, and exists in spite of improved gearbox manufacturing processes [7]. Institutional barriers among entities in the wind turbine supply chain hinder communication and feedback during the design, and operation and maintenance of wind turbine gearboxes, making it difficult for a single entity to find the best solutions to the gearbox reliability problem [6]. Collaborative efforts involving all entities from throughout the gearbox supply chain can work together to identify shortcomings and offer recommended improvements for wind turbine gearboxes.
To meet this need, the National Renewable Energy Laboratory-led Gearbox Reliability Collaborative (GRC) project was established. Simply put, the GRC is a consortium that engages key representatives in the wind turbine gearbox supply chain, including turbine owners, operators, gearbox manufacturers, bearing manufacturers, lubrication companies, and wind turbine manufacturers. Its goal is to improve gearbox reliability and increase turbine uptime. To achieve these, the GRC takes a multi-track approach [8], which includes modeling and analysis, dynamometer testing, field testing, condition monitoring, and developing a gearbox failure database [6]. This report focuses on condition monitoring, which will be discussed in detail.
Condition Monitoring (CM) Condition Monitoring (CM) is defined as the process of monitoring a parameter of condition in the machinery, such that a significant change is indicative of a developing failure [9].The benefits of CM include [10]: 1) detecting incipient failures early, thereby reducing the chances of catastrophic failures; 2) accurately evaluating component health conditions, which has the potential to enable more cost-effective O&M; and 3) analyzing root causes, which may provide the inputs for improved turbine operation, control strategy, and component design. Although the economics of deploying CM for a wind park are case dependent [11], some studies have shown the estimated return on assumed cost being better than 10:1 [12], with total return on investment achieved in less than three years [13]. These benefits will be even more dramatic if turbines are installed offshore where accessibility is a huge challenge. In a broad sense, CM of an onshore utility-scale wind turbine can target almost all of its major subsystems, including the blades, nacelle, drivetrain, tower, and foundation. However, the CM discussed in this report is focused solely on the wind turbine drivetrain.
There are many reasons to conduct drivetrain CM research within the GRC. Today, as when the GRC was started in 2007, wind plant owner/operators primarily practice reactive or time interval-based maintenance. A paradigm shift to condition-based maintenance (CBM), enabled by various CM techniques, can help wind plant owner/operators reduce their O&M cost, which is an important piece in the overall energy cost for wind power. In addition, CM can capture the condition of individual turbines and supplement improved gearbox design practices. Lastly, the GRC's dynamometer and field tests provide the opportunity to investigate the strengths and

4
limitations of different CM techniques and recommend CM practices to the industry. Because it is funded by the U.S. Department of Energy, the GRC has the unique capability to establish public domain CM datasets
GRC CM Partnerships and Documents Since the inception of this research, the number of GRC CM partners has grown to 27 organizations. Appendix A lists all of the members who wish to be acknowledged in this report. Eleven of these 27 partners contributed to the work reported here, and they typically loaned CM equipment or provided CM services for this research. Various CM equipment provided by the partners represents a range of CM techniques. The 16 partners listed in Appendix B are involved in the wind turbine gearbox condition monitoring round robin project, which will be discussed in a report to be issued in the spring of 2012. Three partners, C.C. Jensen, Lubrizol, and Castrol, will not be mentioned in the latter stage of this report as they are not CM equipment suppliers or service providers. C.C. Jensen contributed some lubricant conditioning systems, while Lubrizol and Castrol supported the research with lubrication oil and technical advice on lubricant testing.
Findings obtained through the CM research have been reported at various papers at conferences, in presentations at workshops, and in NREL technical reports. As of September 2011, about 15 presentations, papers, or reports have been published and are listed in Appendix C.
GRC CM Phase 1 and Phase 2 This report is a summary of Phases 1 and 2 of the GRC CM testing. It begins with a discussion of the GRC CM approach and rationale, and is followed by a discussion of the various CM technologies investigated. The subsequent section introduces the test articles, test platforms, tests conducted, and CM system configurations. Test results and observations are presented, with a focus on the CM of test gearboxes. The next section touches on recommended practices for conducting wind turbine drivetrain CM. Finally, the report concludes with a discussion of challenges facing wind turbine drivetrain CM and potential areas for future Research and Development (R&D) work.

5
Drivetrain CM Approach and Rationale
A wind turbine is a complex system with various subsystems that can fail in dramatically different modes. Accordingly, drivetrain CM takes an integrated approach because no single technique can provide a comprehensive and reliable solution to cover all possible wind turbine failure modes. For example, lubricant CM (such as oil debris particle counts) will not detect a machine imbalance, misalignment, shaft cracks, and resonances that are detectable by vibration CM. Conversely, vibration CM will not detect water or particles in the lubricant offered by lubricant CM. Several advantages and limitations of lubricant CM and vibration CM are listed in Table 1 [14].
Table 1. Advantages and limitations of lubricant and vibration CM techniques
Condition Lubricant CM Vibration CM Correlation
Machine Unbalance Not Applicable Strength
Vibration program can detect an unbalance condition. Lube analysis will eventually see the effect of increased bearing load.
Water in Oil Strength Not Applicable
Water can lead to a rapid failure. It is unlikely that a random vibration scan would detect the anomaly.
Gear Wear Strength Strength
Vibration techniques can predict which gear. Lube analysis can predict the type of failure mode.
Alignment Not Applicable Strength
Vibration program can detect a misalignment condition. Lube analysis will eventually see the effect of increased / improper bearing load.
Lubricant Condition Strength Not Applicable The lubricant can be a significant cause of failure.
Resonance Not Applicable Strength
Vibration program can detect a resonance condition. Lube analysis will eventually see the effect.
When GRC testing began, four CM techniques were initially applied:
1. Acoustic emission (AE), specifically stress wave
2. Vibration
3. Offline filter loop (or kidney loop) oil debris and condition monitoring
4. Offsite oil sample analysis.

6
The offline filter loop oil condition monitoring is specifically referred to the measurement of oil total ferrous debris, oil quality and oil moisture. As the GRC tests progressed, inline filter loop (or main loop) oil debris monitoring and electrical signature-based techniques were added.
By combining AE and vibration CM, the measurable dynamic frequency range can be extended to above 20 kHz. Vibration can typically be measured in terms of displacement by proximity probes, or in terms of acceleration, by accelerometers. The proximity probe was not considered, as it is typically used for shaft displacement measurements. The wind turbine main shaft is not a commonly failed component in the drivetrain and is not included in this research. In addition, AE or stress wave monitoring has the potential to detect abnormal lubricant film thickness [15]. The main considerations in adding oil debris and condition monitoring, and offsite oil sample analysis techniques is to combine the early active machine wear detection capability of oil monitoring techniques with AE and vibration CM’s crack location ability [16]. The combination of the three techniques may provide the earliest possible detection of component failure or structural deterioration.
There were two options to set up the CM systems for the three adopted techniques: 1) have NREL customize the needed sensors, data acquisition systems (DAS), and signal processing algorithms; or 2) choose a commercial package under each CM technique and have NREL do a minimal amount of DAS customization and signal processing algorithm development. The second option was chosen because it required less time to implement and allowed the GRC to meet its planned gearbox test schedule.
There are several commercial packages available for each CM technique. To decide which package to use for this CM project, the GRC used the following criteria: 1) use only one CM system for each technique. (There is no plan to evaluate different CM packages under the GRC.); 2) choose the best possible package (in terms of performance) among interested CM system suppliers; and 3) research previous wind industry experience with each particular package. Based on these criteria and through study and communication with interested CM package suppliers, the systems selected to start the drivetrain CM project include: SKF WindCon for vibration; Swantech SWANwind for AE; and Kittiwake Online Sensor Suite, Macom TechAlert 10, and Hydac CSM 1220 for oil. (The reasons for this are explained below.) All but the Hydac package, which was bought by NREL as laboratory test equipment, are on loan to NREL for conducting drivetrain CM research. For oil sample analysis, Herguth Laboratories Inc. agreed to become a project partner and support the CM research.
Although the selection of multiple lubricant CM packages appears contradictory to the criterion, each package provides a different aspect of information on the monitored lubricant and their results do not overlap. Specifically, the Kittiwake Online Sensor Suite is a compact unit capable of measuring three lubricant parameters: total ferrous debris in ppm, relative humidity in percentage, and oil quality (changes in the level of contaminants such as soot, oxidation products, glycol, and water) on a customized scale. The outputs provided by this suite will be referred to as offline oil condition monitoring results in this report. The Macom TechAlert 10 counts oil debris, both ferrous and non-ferrous, particles and divides each particle type into five bins. The minimum detectable ferrous particle size is 50 µm and non-ferrous particle size is 150 µm. The Hydac CSM 1220 was purchased by NREL as a laboratory unit to measure the lubricant cleanliness level according to ISO 4406:1999 [17]. This level basically reflects the amount of
7
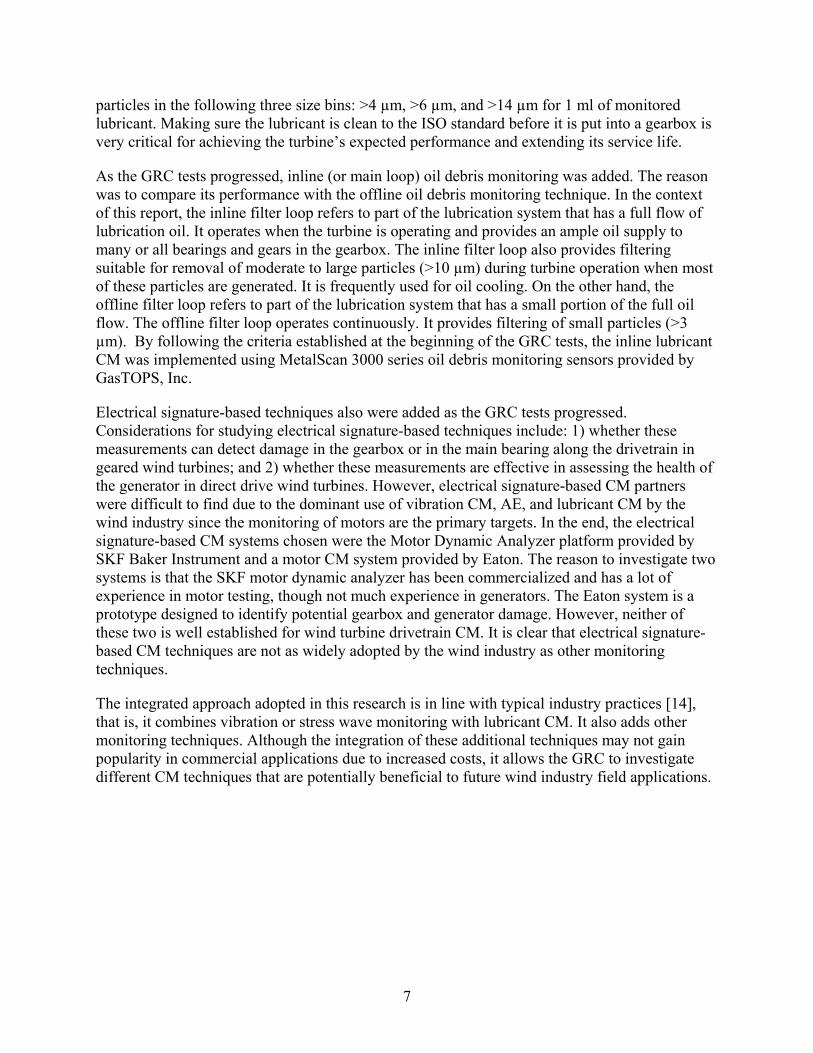
particles in the following three size bins: >4 µm, >6 µm, and >14 µm for 1 ml of monitored lubricant. Making sure the lubricant is clean to the ISO standard before it is put into a gearbox is very critical for achieving the turbine’s expected performance and extending its service life.
As the GRC tests progressed, inline (or main loop) oil debris monitoring was added. The reason was to compare its performance with the offline oil debris monitoring technique. In the context of this report, the inline filter loop refers to part of the lubrication system that has a full flow of lubrication oil. It operates when the turbine is operating and provides an ample oil supply to many or all bearings and gears in the gearbox. The inline filter loop also provides filtering suitable for removal of moderate to large particles (>10 µm) during turbine operation when most of these particles are generated. It is frequently used for oil cooling. On the other hand, the offline filter loop refers to part of the lubrication system that has a small portion of the full oil flow. The offline filter loop operates continuously. It provides filtering of small particles (>3 µm). By following the criteria established at the beginning of the GRC tests, the inline lubricant CM was implemented using MetalScan 3000 series oil debris monitoring sensors provided by GasTOPS, Inc.
Electrical signature-based techniques also were added as the GRC tests progressed. Considerations for studying electrical signature-based techniques include: 1) whether these measurements can detect damage in the gearbox or in the main bearing along the drivetrain in geared wind turbines; and 2) whether these measurements are effective in assessing the health of the generator in direct drive wind turbines. However, electrical signature-based CM partners were difficult to find due to the dominant use of vibration CM, AE, and lubricant CM by the wind industry since the monitoring of motors are the primary targets. In the end, the electrical signature-based CM systems chosen were the Motor Dynamic Analyzer platform provided by SKF Baker Instrument and a motor CM system provided by Eaton. The reason to investigate two systems is that the SKF motor dynamic analyzer has been commercialized and has a lot of experience in motor testing, though not much experience in generators. The Eaton system is a prototype designed to identify potential gearbox and generator damage. However, neither of these two is well established for wind turbine drivetrain CM. It is clear that electrical signature-based CM techniques are not as widely adopted by the wind industry as other monitoring techniques.
The integrated approach adopted in this research is in line with typical industry practices [14], that is, it combines vibration or stress wave monitoring with lubricant CM. It also adds other monitoring techniques. Although the integration of these additional techniques may not gain popularity in commercial applications due to increased costs, it allows the GRC to investigate different CM techniques that are potentially beneficial to future wind industry field applications.
8
CM Systems Investigated
Based on the different types of CM techniques and systems chosen in the previous section, a detailed description of these CM systems is presented in the next section.
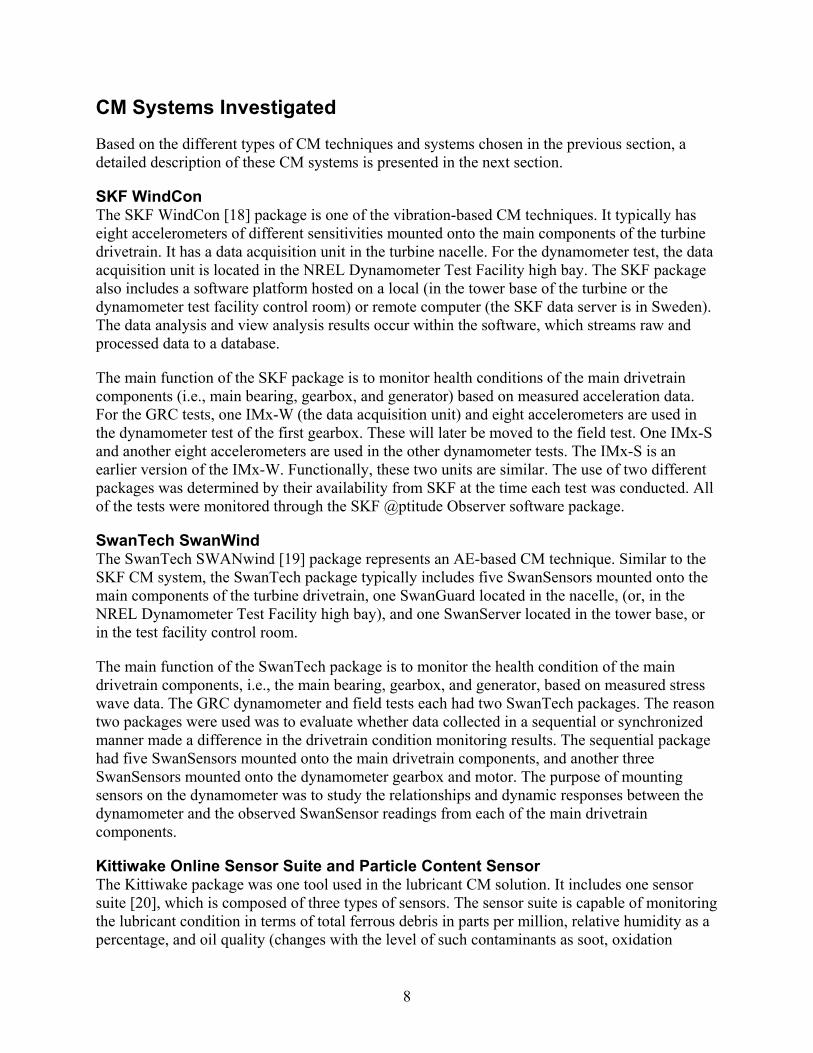
SKF WindCon The SKF WindCon [18] package is one of the vibration-based CM techniques. It typically has eight accelerometers of different sensitivities mounted onto the main components of the turbine drivetrain. It has a data acquisition unit in the turbine nacelle. For the dynamometer test, the data acquisition unit is located in the NREL Dynamometer Test Facility high bay. The SKF package also includes a software platform hosted on a local (in the tower base of the turbine or the dynamometer test facility control room) or remote computer (the SKF data server is in Sweden). The data analysis and view analysis results occur within the software, which streams raw and processed data to a database.
The main function of the SKF package is to monitor health conditions of the main drivetrain components (i.e., main bearing, gearbox, and generator) based on measured acceleration data. For the GRC tests, one IMx-W (the data acquisition unit) and eight accelerometers are used in the dynamometer test of the first gearbox. These will later be moved to the field test. One IMx-S and another eight accelerometers are used in the other dynamometer tests. The IMx-S is an earlier version of the IMx-W. Functionally, these two units are similar. The use of two different packages was determined by their availability from SKF at the time each test was conducted. All of the tests were monitored through the SKF @ptitude Observer software package.
SwanTech SwanWind The SwanTech SWANwind [19] package represents an AE-based CM technique. Similar to the SKF CM system, the SwanTech package typically includes five SwanSensors mounted onto the main components of the turbine drivetrain, one SwanGuard located in the nacelle, (or, in the NREL Dynamometer Test Facility high bay), and one SwanServer located in the tower base, or in the test facility control room.
The main function of the SwanTech package is to monitor the health condition of the main drivetrain components, i.e., the main bearing, gearbox, and generator, based on measured stress wave data. The GRC dynamometer and field tests each had two SwanTech packages. The reason two packages were used was to evaluate whether data collected in a sequential or synchronized manner made a difference in the drivetrain condition monitoring results. The sequential package had five SwanSensors mounted onto the main drivetrain components, and another three SwanSensors mounted onto the dynamometer gearbox and motor. The purpose of mounting sensors on the dynamometer was to study the relationships and dynamic responses between the dynamometer and the observed SwanSensor readings from each of the main drivetrain components.
Kittiwake Online Sensor Suite and Particle Content Sensor The Kittiwake package was one tool used in the lubricant CM solution. It includes one sensor suite [20], which is composed of three types of sensors. The sensor suite is capable of monitoring the lubricant condition in terms of total ferrous debris in parts per million, relative humidity as a percentage, and oil quality (changes with the level of such contaminants as soot, oxidation
9
products, glycol, and water) on a customized scale. As mentioned earlier, its outputs will be referred to as offline oil condition monitoring results in this report. Another unit from Kittiwake was the particle content sensor [21], which was used to count oil debris, both ferrous and nonferrous, particles and divide each particle type into five bins. The minimum detectable ferrous particle size is 40 µm and the minimum nonferrous particle size is 135 µm. The data collected by the sensor suite and particle content sensor are wirelessly transmitted through a cellular modem to a server located in the United Kingdom and can be viewed through a web browser.
For the GRC tests, one sensor suite was used in the dynamometer test of the first gearbox and later transmitted to the field test. The other sensor suite and particle content sensor were used in the other dynamometer tests. The main function of the Kittiwake sensor suite was to monitor the change in lubricant condition in terms of total ferrous debris, relative humidity level, and oil quality. The particle content sensor was added in the dynamometer tests to investigate the influences of the sensor mounting location on oil debris counting results.
Macom TechAlert 10 The Macom package was another tool used for the lubricant CM solution. It is composed of one TechAlert 10 [22] particle counting sensor and one software package for recording and storing the collected data. Similar to the Kittiwake particle content sensor, the Macom TechAlert 10 count oil debris, both ferrous and nonferrous particles, and divides each type of particle into five bins. The minimum detectable ferrous particle size is 50 µm and the minimum nonferrous particle size is 150 µm. The TechAlert 10 sensor also can be integrated with the SKF WindCon or SwanTech SWANWind package.
The main function of the TechAlert 10 was to monitor oil debris particle counts. For the GRC tests, one TechAlert 10 was used in the dynamometer test of the first gearbox, which was later moved for use in the field test. It was the only oil debris monitoring package tested on the first gearbox. Another TechAlert 10 was used in the other dynamometer tests.
GasTOPS MetalScan 3000 The GasTOPS system was another tool tested for the lubricant CM solution. It is composed of one MetalScan 3000 [23] oil debris particle-counting sensor and an Excel spreadsheet for recording and storing the collected data. Different from the Kittiwake particle content sensor and the Macom TechAlert 10, which are usually placed in a kidney loop on the lubrication system, the MetalScan sensor is placed in the main lubrication loop. There is a much higher flow rate in the main loop than in the kidney loop. The MetalScan monitors the oil debris particle generation in the main lubrication loop and allows the study of various influences from both inline and offline filter loops on oil debris particle counting results. For the GRC tests, one MetalScan 3000 sensor was used in the dynamometer test of the second gearbox and later dynamometer tests. It was not used in tests on the first gearbox since there was no plan to investigate differences that might be caused by the offline and inline filter loops on the first gearbox.
Hydac CSM 1220 The Hydac CSM 1220 [24] is another tool used in the lubricant CM solution. NREL purchased it as a laboratory unit to measure lubricant cleanliness levels according to ISO 4406:1999. Its readings basically reflect the amount of particles in three bins: >4 micrometers (µm), >6 µm, and
10
>14 µm in 1-milliliter of monitored lubricant. Its purpose is to first ensure that the lubricant is clean before it is put into the gearbox and then, to evaluate whether the ISO cleanliness level is useful for controlling and monitoring wind turbine gearbox run-in.
SKF Baker EXP 4000 The SKF Baker Dynamic Motor Analyzer EXP 4000 [25] represents a commercialized electronic signature-based motor performance monitoring system. It measures three-phase current and voltage from the monitored motor. By feeding these signals to a portable data acquisition unit, with an integrated laptop, the package is capable of identifying degrading motor performance and overheating in motor operation, examining overall motor power conditions and motor performance, and monitoring the load, rotor cage condition, and torque ripples. The package also includes software hosted on an integrated laptop that is used to conduct data recording and analysis, view analysis results, and to export data.
For the dynamometer test, the SKF Dynamic Analyzer was located in the NREL Dynamometer Test Facility high bay. For the field test, it was located at the turbine tower base. The entire package includes one EXP4000, including the portable data acquisition unit and its integrated laptop, one EP1000, including the interface box between the current transducers and the analyzer, and three current transducers.
Eaton Motor CM System The Eaton Motor Condition Monitoring System represents a prototype effort for electronic signature-based motor health monitoring systems. It measures three-phase current and voltage from the monitored motor. The three-phase current is measured using three current transducers and the three-phase voltage is measured using a custom built data acquisition unit. The system digitizes the voltage and current information and transmits the data via Ethernet to a host laptop computer for storage and remote access purposes. The three-phase voltage and current data can be analyzed to determine the effectiveness of extracting gearbox failure signatures from the generator's electrical information. The data also will be processed to evaluate steady-state and transient power quality, drivetrain misalignment, and unbalance conditions, as well as potential generator issues, such as stator, rotor, and bearing degradation.
For the dynamometer test, the Eaton Motor Condition Monitoring System was located in the NREL Dynamometer Test Facility high bay. The entire package included one data acquisition box, one laptop, and three LEM LT 2005-S current transducers.
NREL Customized Vibration-based CM System As the GRC project progressed, it became clear that in order to release some CM test data before the GRC projects ends, a CM system was needed in the public domain. As a result, a vibration-based CM system was customized by NREL. It is composed of twelve accelerometers. To simplify the customization task, data was collected at 40 kHz per channel using a National Instruments PXI -4472B high speed DAS. Low speed shaft (LSS) torque and generator speed were recorded, in addition to the accelerometer data. It is this system that made the wind turbine gearbox condition monitoring round robin project possible (see Appendix B).

11
For the dynamometer test, the NREL CM System was located in the NREL Dynamometer Test Facility high bay. The DAS software interface, hosted on a desktop computer, was located in the NREL Dynamometer Test Facility control room.

12
Tests and CM System Configurations
The aforementioned CM systems were evaluated in various GRC tests. This section provides a brief description of the test gearboxes, test platforms, tests conducted, and CM system configurations.
Test Articles To make the GRC research more valuable to the industry, a 750-kW rated gearbox was selected and redesigned to be representative of MW-sized fleet turbines. A 750-kW rating was chosen, because it is large enough to represent common wind turbines currently in use, yet small enough that it would be reasonably inexpensive to procure, modify, and test in the NREL 2.5 MW dynamometer. Two procured test gearboxes were identical aside from manufacturing variance. More details on the test gearboxes can be found in [6], and briefly described below.
The drivetrain of a typical utility-scale wind turbine is illustrated in Figure 3. The test gearbox was installed in a 3-point suspension drivetrain configuration, which is a typical configuration for MW class turbines. One suspension point is at the main bearing and the other two points are on the gearbox torque arm supports.
GeneratorMain shaft GearboxHub
Generator shaft Bed plateMain bearing
Brake
Figure 3. Typical utility-scale wind turbine drivetrain
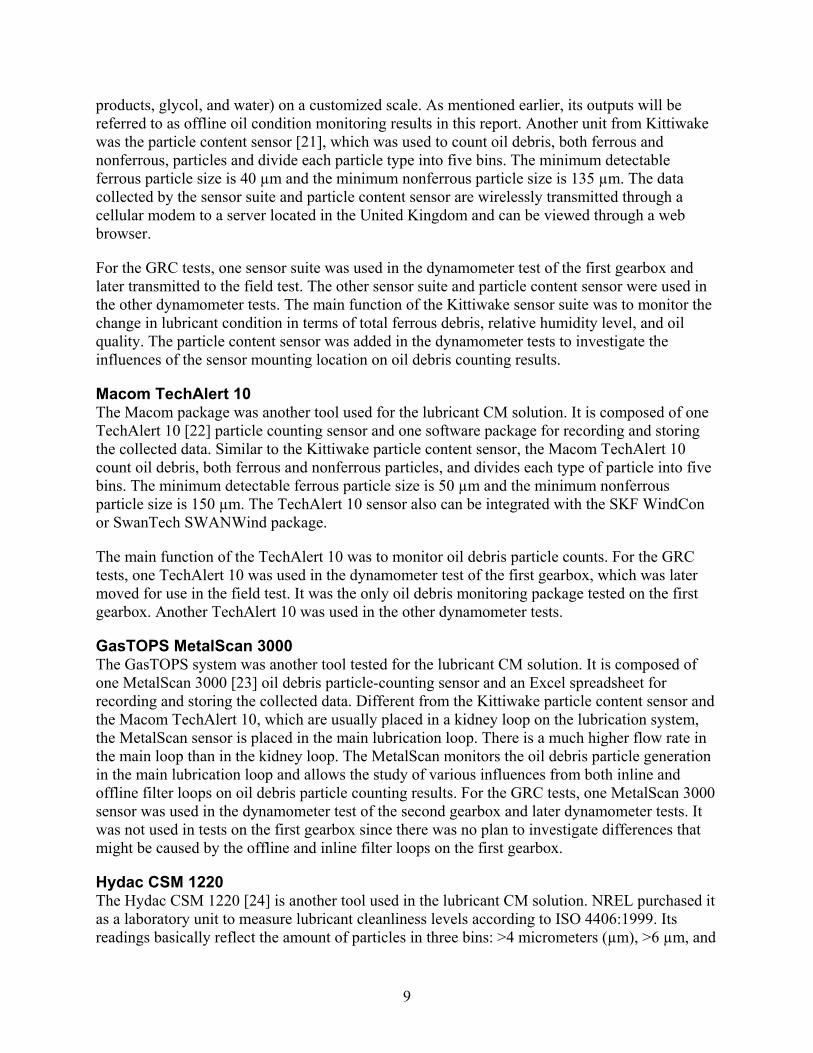
The test gearbox uses three stages to obtain an overall gear ratio of 1:81.491. As shown in Figure 4 , it is composed of one low-speed planetary stage and two parallel shaft stages. The planetary stage accommodates three planet gears. The annulus gear of this stage also serves as part of the gearbox housing. The sun gear is set in a floating configuration, which improves the load distribution among the planets. To accommodate the floating sun arrangement, the low-speed shaft is hollow and has an internal spline that transfers the torsional loads to the parallel shaft stages. The low-speed planetary gears have a helix angle of approximately 7.5 degrees, and the intermediate speed and high speed gear sets have a helix angle of 14 degrees.
13
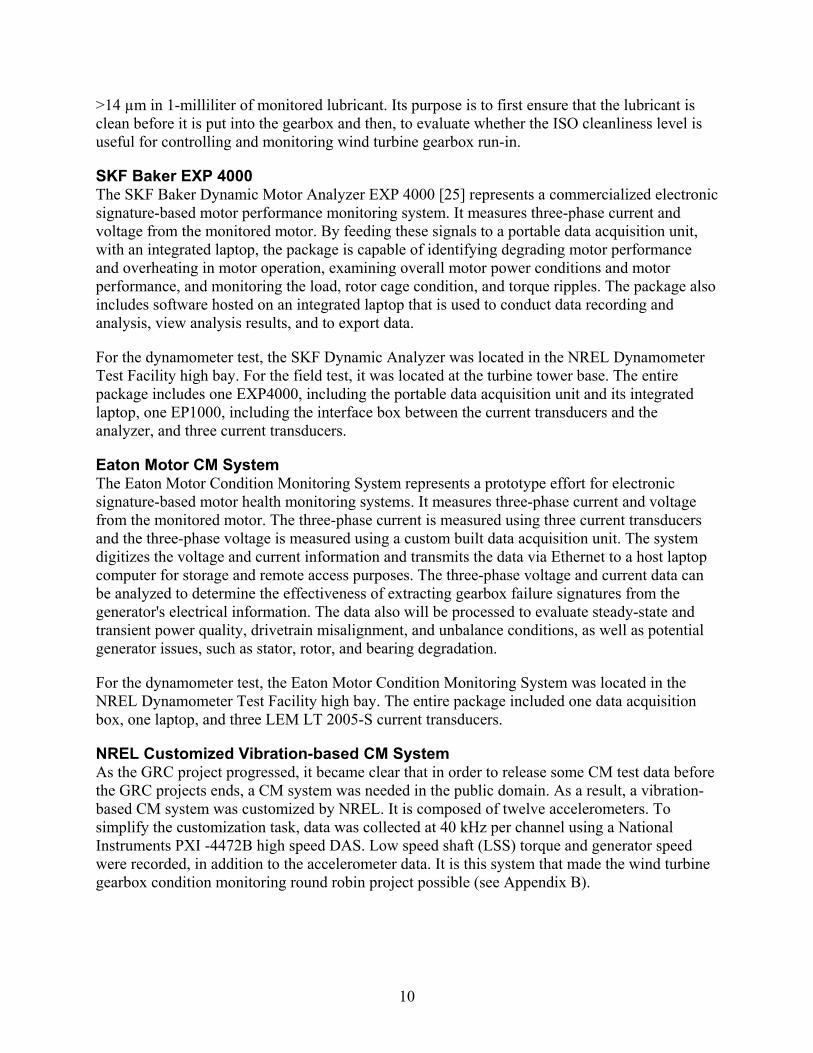
Figure 5 shows a schematic of the internal components of the test gearbox, with nomenclature used to describe them. Other than gears, several types of bearings are employed in the test gearbox, according to the loading conditions and gearbox life requirements. The planet carrier (PLC) is supported by two full-complement cylindrical roller bearings (fcCRB). Each planet gear is supported by two identical cylindrical roller bearings (CRB). Each parallel shaft (i.e., low, intermediate, and high speed) in the gearbox is supported by a CRB on the upwind (rotor) side of the assembly, and by two back-to-back mounted, tapered roller bearings (TRB) on the downwind (generator) side. Lubrication oil is another important component in the test gearbox, although it is not shown in either Figure 4 or Figure 5. The main functions of lubricant are to [26]: 1) provide a lubricating film to reduce friction and wear between moving parts; 2) cooling to dissipate heat away from the critical parts of the equipment; 3) cleaning and suspending products, such as carbon, sludge and varnish, to facilitate smooth operation of equipment; and 4) protection to prevent metal damage due to oxidation and corrosion.
Figure 4. Exploded view of the GRC test gearbox
Figure 5. GRC gearbox layout and bearing nomenclatureTest Platforms
PLC-A PLC-B
LSS-A LSS-B LSS-C
PL-A PL-B
ISS-A ISS-B
ISS-C
HSS-A HSS-B HSS-C Annulus
Planet
Sun Gear
Gear Pinion
Pinion

14
There are two test platforms used in the GRC. One is the NREL 2.5 MW dynamometer test facility, where all dynamometer tests are conducted. The other is a field turbine located at Xcel Energy’s Ponnequin wind farm.
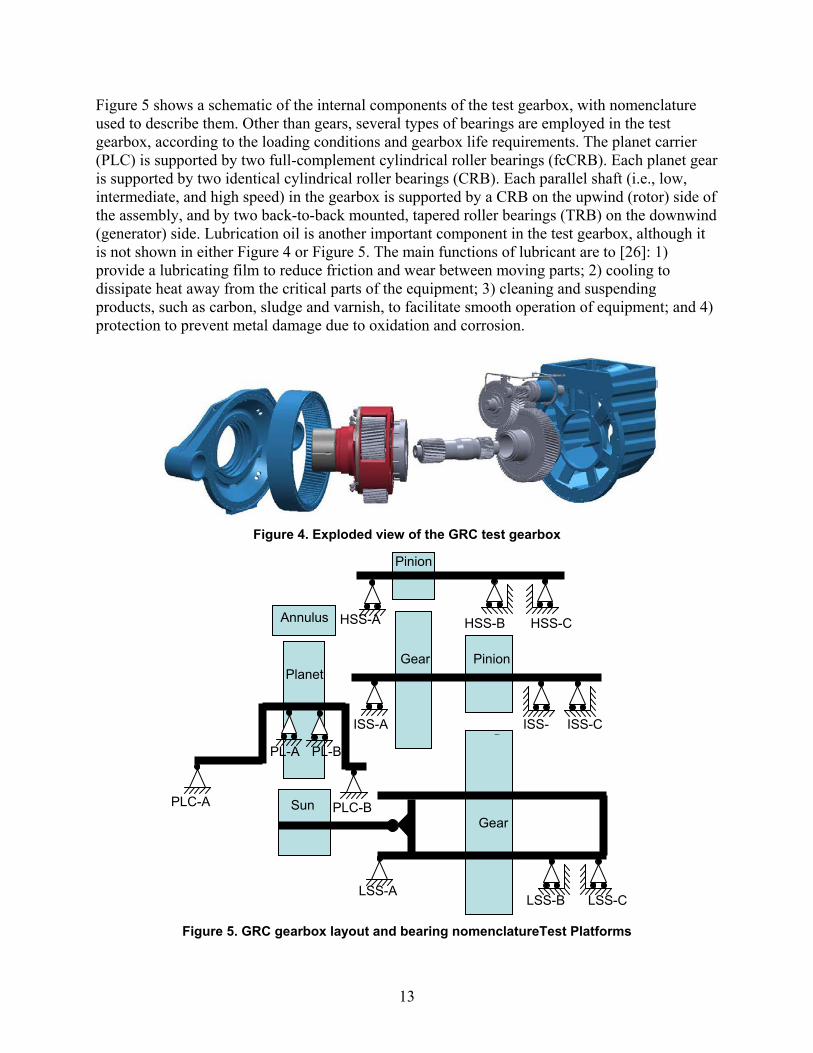
The NREL 2.5-MW dynamometer test facility was developed to conduct performance and reliability tests on wind turbine drivetrain prototypes and commercial machines [27, 28]. The facility is capable of providing static, highly accelerated life and model-in-the-loop tests. The prime movers of the dynamometer are a 2.5-MW induction motor, a three-stage epicyclical reducer, and a variable-frequency drive, with full regeneration capacity. The rated torque provided by the dynamometer to a test article can be up to 1.4 meganewton meters (MNm), with speeds varying from 0 rpm to 16.7 rpm. Non-torque loading actuators, rated up to 440 kilonewtons (kN) for radial load and 156kN for thrust load, also can be utilized in the dynamometer to apply thrust, bending, and shear loads similar to those typically generated by a wind turbine rotor. Figure 6 provides a diagram of the test facility. Figure 7 is a photo of the test implementation, with the test article installed.
Figure 6. Diagram of NREL 2.5-MW dynamometer test facility
15
Figure 7. NREL dynamometer test stand with the test article installed. PIX #16913.
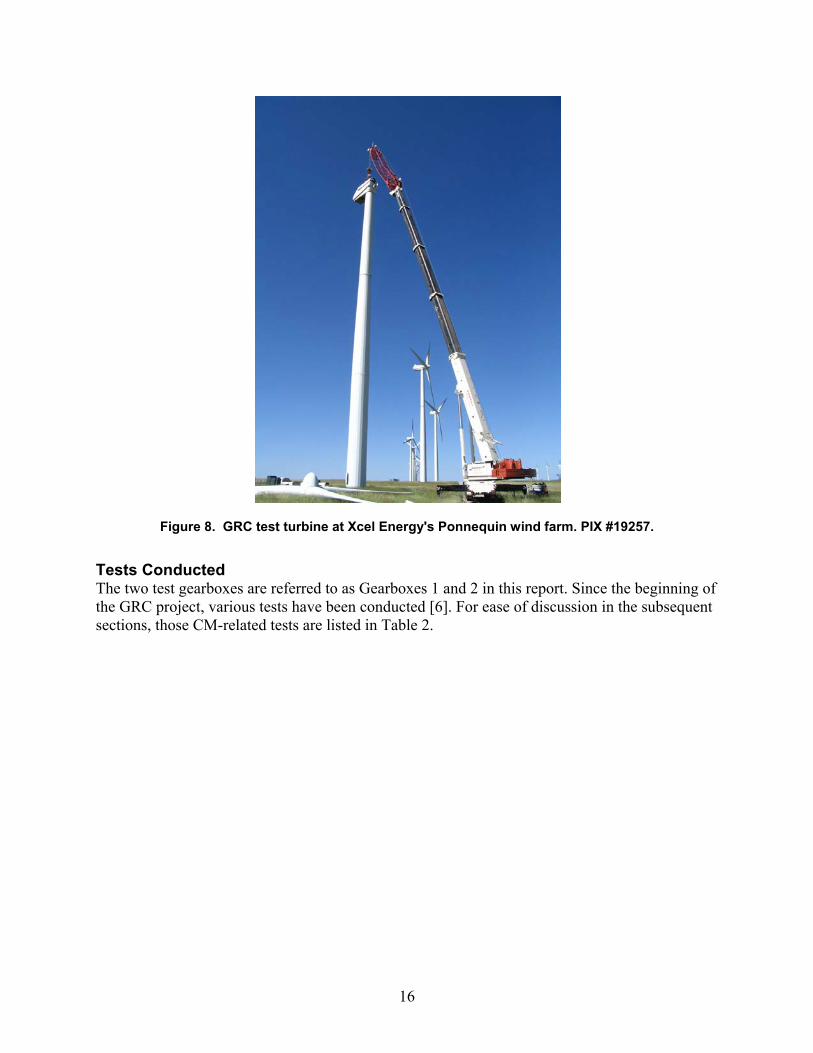
The GRC test turbine (Figure 8) is a three bladed, up-wind, stall controlled turbine, with a rated power of 750kW. The generator has two sets of poles, which allow it to operate at two speeds. The turbine rotor operates at 22.4 rpm (1,810 rpm on the HSS) and 14.9 rpm (1,208 rpm on the HSS). The turbine has "pitchable" tip brakes and a high-speed shaft brake. For a normal shutdown, the tip brakes deploy first. Once the rotor has been slowed down enough, the high-speed shaft brake engages. For an emergency stop, tip brakes and high-speed shaft brakes are applied at the same time. For the transition from low speed to high speed, the turbine drops off-line, the rotor speeds up, and the turbine comes on line when the generator shaft reaches 1,800 rpm. For the transition from high speed to low speed windings, the turbine comes off-line and deploys the tip brakes to slow the rotor. Once the rotor is below the synchronous speed, the tips are returned to their un-deployed position and the rotor can accelerate again. The turbine comes online when the generator shaft reaches 1,200 rpm.
16
Figure 8. GRC test turbine at Xcel Energy's Ponnequin wind farm. PIX #19257.
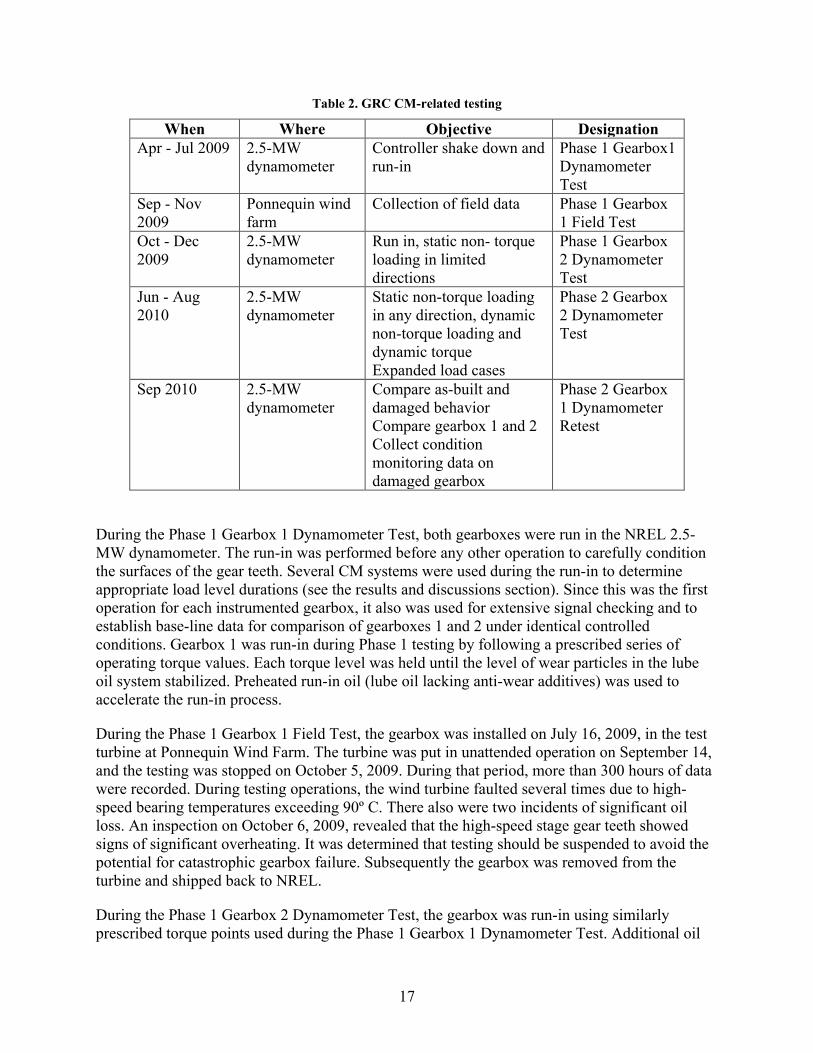
Tests Conducted The two test gearboxes are referred to as Gearboxes 1 and 2 in this report. Since the beginning of the GRC project, various tests have been conducted [6]. For ease of discussion in the subsequent sections, those CM-related tests are listed in Table 2.
17
Table 2. GRC CM-related testing
When Where Objective Designation Apr - Jul 2009 2.5-MW
dynamometer Controller shake down and run-in
Phase 1 Gearbox1 Dynamometer Test
Sep - Nov 2009
Ponnequin wind farm
Collection of field data Phase 1 Gearbox 1 Field Test
Oct - Dec 2009
2.5-MW dynamometer
Run in, static non- torque loading in limited directions
Phase 1 Gearbox 2 Dynamometer Test
Jun - Aug 2010
2.5-MW dynamometer
Static non-torque loading in any direction, dynamic non-torque loading and dynamic torque Expanded load cases
Phase 2 Gearbox 2 Dynamometer Test
Sep 2010 2.5-MW dynamometer
Compare as-built and damaged behavior Compare gearbox 1 and 2 Collect condition monitoring data on damaged gearbox
Phase 2 Gearbox 1 Dynamometer Retest
During the Phase 1 Gearbox 1 Dynamometer Test, both gearboxes were run in the NREL 2.5-MW dynamometer. The run-in was performed before any other operation to carefully condition the surfaces of the gear teeth. Several CM systems were used during the run-in to determine appropriate load level durations (see the results and discussions section). Since this was the first operation for each instrumented gearbox, it also was used for extensive signal checking and to establish base-line data for comparison of gearboxes 1 and 2 under identical controlled conditions. Gearbox 1 was run-in during Phase 1 testing by following a prescribed series of operating torque values. Each torque level was held until the level of wear particles in the lube oil system stabilized. Preheated run-in oil (lube oil lacking anti-wear additives) was used to accelerate the run-in process.
During the Phase 1 Gearbox 1 Field Test, the gearbox was installed on July 16, 2009, in the test turbine at Ponnequin Wind Farm. The turbine was put in unattended operation on September 14, and the testing was stopped on October 5, 2009. During that period, more than 300 hours of data were recorded. During testing operations, the wind turbine faulted several times due to high-speed bearing temperatures exceeding 90º C. There also were two incidents of significant oil loss. An inspection on October 6, 2009, revealed that the high-speed stage gear teeth showed signs of significant overheating. It was determined that testing should be suspended to avoid the potential for catastrophic gearbox failure. Subsequently the gearbox was removed from the turbine and shipped back to NREL.
During the Phase 1 Gearbox 2 Dynamometer Test, the gearbox was run-in using similarly prescribed torque points used during the Phase 1 Gearbox 1 Dynamometer Test. Additional oil
18
particle sensors were added to the CM system. Dyechem was not used during the run-in to prevent false wear particle readings. Non-torque load testing was performed to provide input data for modeling efforts. The test series consisted of a range of non-torque loads applied at fixed azimuths. Test article torque was varied for each case. The static non-torque load system was used due to lengthy component lead times on the dynamic non-torque system.
During the Phase 2 Gearbox 2 Dynamometer Test, a series of tests was conducted, including a generator misalignment test, a non-torque loading test, and a static and cyclic thrust test. In addition, based on the torque time history obtained from the Phase 1 Gearbox 1 Field Test, the field torque time series was reproduced in the dynamometer and tested. By manipulating the trunnion mounts in a certain way, a carrier bearing clearance removal and fixed trunnion blocks test also were conducted.
During the Phase 2 Gearbox 1 Dynamometer Retest, the damaged gearbox that was removed from the Ponnequin Wind Farm was retested in the NREL 2.5-MW dynamometer. NREL's customized, vibration-based CM system was added to capture the vibration signature resulting from damage that occurred during the field testing. After conducting a limited set of CM tests in the NREL dynamometer, the gearbox was sent to a repair shop for disassembly and inspection.
19
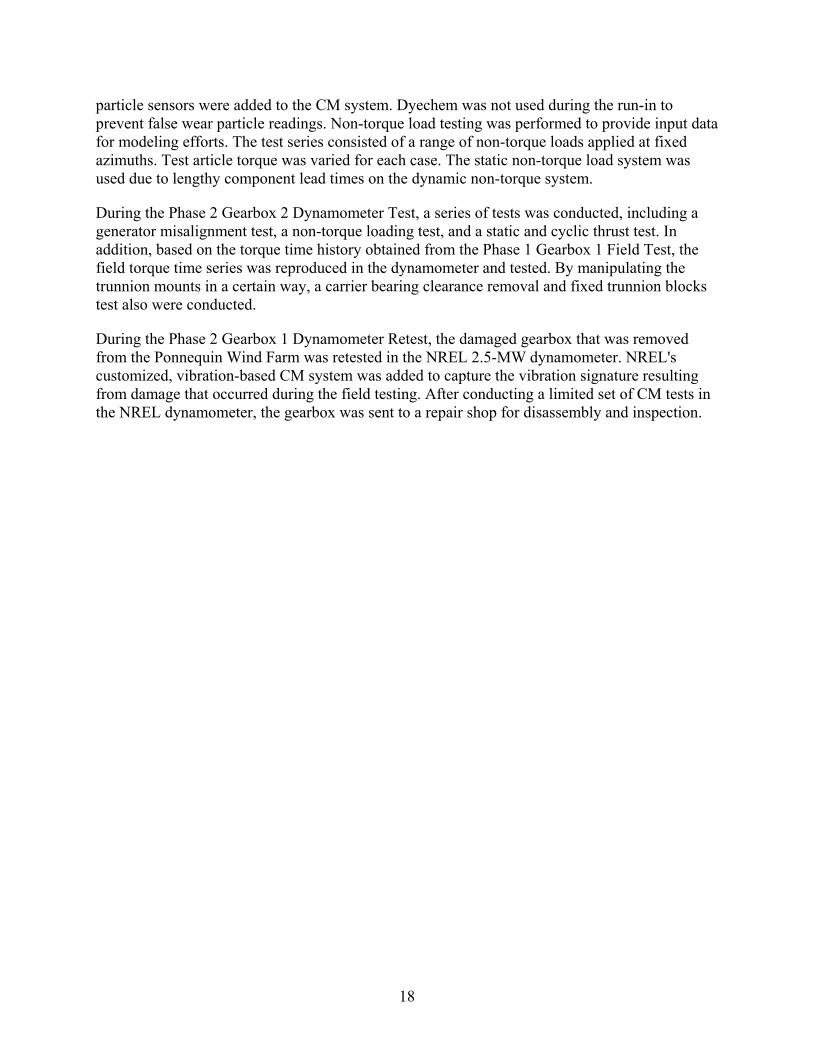
CM System Configurations At the different stages of the GRC tests, various CM systems were deployed. Table 3 gives a brief summary of the CM system configurations at different stages of the GRC tests. For more details on these packages, please check the CM Systems Investigated section.
Table 3. CM system implementation at different stages of the GRC tests
Maker Model Phase 1
Gearbox 1 Dynamometer
Phase 1 Gearbox 1
Field
Phase 1 Gearbox 2
Dynamometer
Phase 2 Gearbox 2
Dynamometer
Phase 2 Gearbox 1
Dynamometer
SKF
WindCon X X X X X
Dynamic Motor Analyzer X X
SwanTech SWANwind X X X X X
Kittiwake
Online Sensor Suite X X X X X
Particle Content Sensor X X X
Macom TechAlert10 X X X X X
GasTOPS MetalScan 3000 X X X
Hydac CSM 1220 X X X X
Eaton Motor Condition Monitoring System
X X
NREL Vibration-based CM System X
For tests conducted in the dynamometer, the major change in the CM system configuration was the addition of new packages. The CM system configuration for Phase 2 Gearbox 1 Dynamometer Retest is illustrated in Figure 9, where the different types of monitoring techniques that these packages represent are indicated. It is worth noting that both inline and offline particle counts are referred to as oil debris monitoring; offline oil condition measurement refers to total ferrous debris, oil quality and moisture.

20
Figure 9. CM system configuration in Phase 2 Gearbox 1 Dynamometer Retest
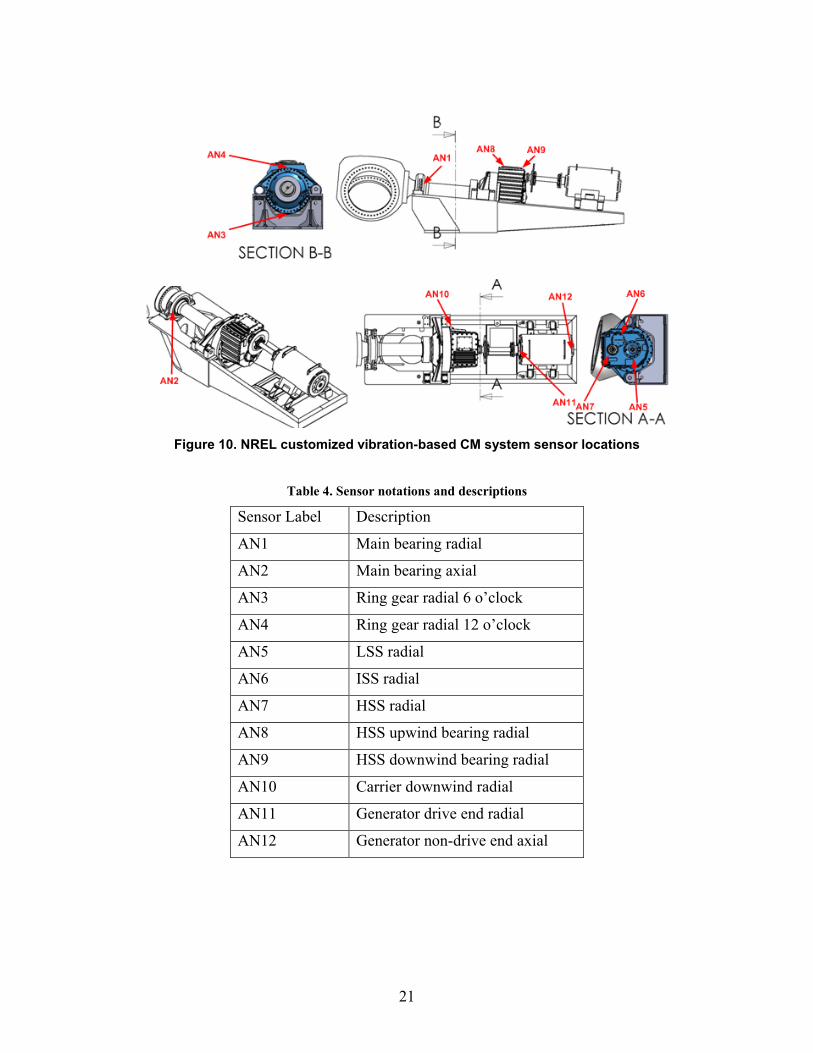
Due to intellectual property constraints, detailed sensor locations for the commercial Stress Wave and Vibration-based monitoring systems cannot be disclosed. As a result, the setup used in NREL's customized vibration-based CM system is illustrated in Figure 10. It illustrates most of the typical accelerometer mounting locations for vibration-based CM systems seen in the wind industry today. The sensor notations are given in Table 4 and their physical installations are illustrated in Figure 11. It is worth noting that a typical commercial CM system uses only a portion of the 12 sensors listed in Table 4. One typical configuration consists of eight accelerometers: two on the main bearing, including one in the radial direction (AN1), and the other in the axial direction (AN2); four on the gearbox, including one for the planetary section in the radial direction (AN3 or AN4) and one for each stage of the gearbox, i.e. LSS (AN5), ISS (AN6), and HSS (AN7), all in the radial direction; and two on the generator, including one on the drive end (AN11) and the other on the non-drive end (AN12), both in the radial direction. The other typical configuration also consists of eight accelerometers and differs from the first by replacing AN5 through 7 with AN8 through 10.
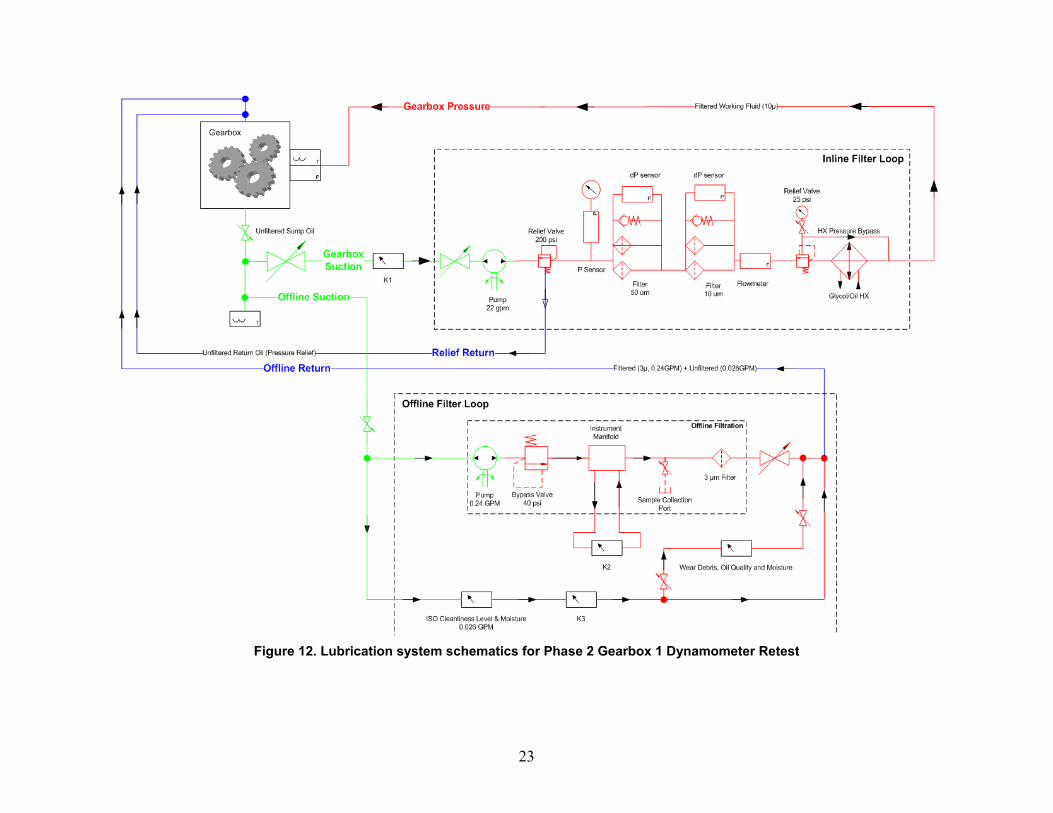
For real-time lubricant CM systems, where sensors are installed in both inline and offline filter loops, it is necessary to have a clear schematic of the filtration system to better understand their results. Figure 12 illustrates the schematics for the filtration system used during the Phase 2 Gearbox 1 Dynamometer Retest, including the real-time lubricant CM sensors K1 to K3 (model information removed to avoid disclosing specific sensor suppliers), ISO cleanliness level
21
Figure 10. NREL customized vibration-based CM system sensor locations
Table 4. Sensor notations and descriptions
Sensor Label Description
AN1 Main bearing radial
AN2 Main bearing axial
AN3 Ring gear radial 6 o’clock
AN4 Ring gear radial 12 o’clock
AN5 LSS radial
AN6 ISS radial
AN7 HSS radial
AN8 HSS upwind bearing radial
AN9 HSS downwind bearing radial
AN10 Carrier downwind radial
AN11 Generator drive end radial
AN12 Generator non-drive end axial
22
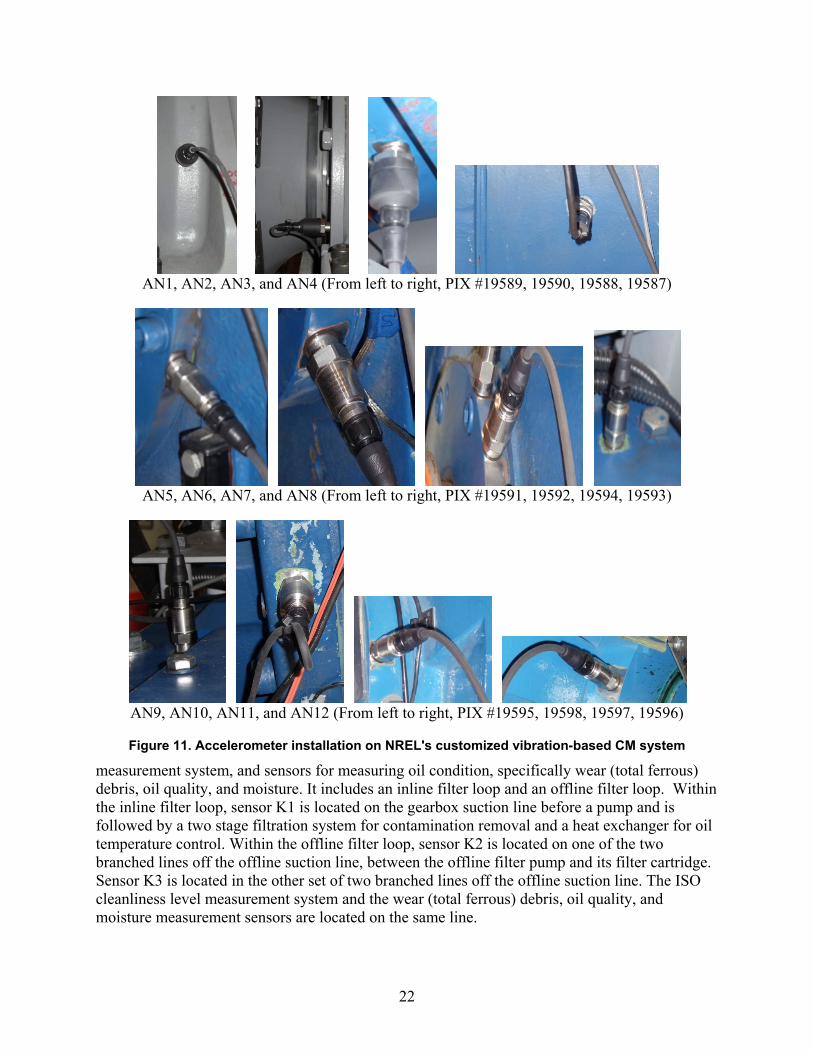
AN1, AN2, AN3, and AN4 (From left to right, PIX #19589, 19590, 19588, 19587)
AN5, AN6, AN7, and AN8 (From left to right, PIX #19591, 19592, 19594, 19593)
AN9, AN10, AN11, and AN12 (From left to right, PIX #19595, 19598, 19597, 19596)
Figure 11. Accelerometer installation on NREL's customized vibration-based CM system
measurement system, and sensors for measuring oil condition, specifically wear (total ferrous) debris, oil quality, and moisture. It includes an inline filter loop and an offline filter loop. Within the inline filter loop, sensor K1 is located on the gearbox suction line before a pump and is followed by a two stage filtration system for contamination removal and a heat exchanger for oil temperature control. Within the offline filter loop, sensor K2 is located on one of the two branched lines off the offline suction line, between the offline filter pump and its filter cartridge. Sensor K3 is located in the other set of two branched lines off the offline suction line. The ISO cleanliness level measurement system and the wear (total ferrous) debris, oil quality, and moisture measurement sensors are located on the same line.
23
Figure 12. Lubrication system schematics for Phase 2 Gearbox 1 Dynamometer Retest

24
For the Phase 1 Gearbox 1 Field Test, it should be noted that only the commercial Stress Wave, Vibration-based CM system, sensor K2, and sensors for measuring wear (total ferrous) debris, oil quality, and moisture were deployed. Also, the filtration system schematic is different from what is shown in Figure 12, as the inline filter loop was from the field test turbine. The offline filtration loop is similar to what is shown in Figure 12.

25
Test Results and Discussions
CM data was collected during both phases of testing. This section presents some of these diagnostic results, according to various investigated CM techniques. As the majority of the results to be presented were obtained during the Phase 2 Gearbox 1 Dynamometer Retest, the damage incurred by Gearbox 1 is highlighted here. Figure 13. shows a picture of the high speed stage taken while the gearbox was in the field after the second oil loss. Figure 14, which was obtained during its later disassembly, illustrates the high speed stage gear damage. The main cause for such damage was the two oil loss events experienced by the test gearbox in the field, as mentioned previously.
Figure 13. Gearbox 1 high speed stage (taken in field after second oil loss event). PIX #19600.
Figure 14. Gearbox 1 high speed stage gear damage (during Gearbox 1 disassembly). PIX #19599.
The test results are presented with a focus on the diagnosis of the damage to test Gearbox 1 compared to the healthy Gearbox 2.
Vibration Analysis One key element in various commercial vibration-based CM systems is data analysis algorithms. The commonly used algorithms can be classified into two categories: time and frequency domains. For time domain techniques, the monitored parameters may include peak, root mean square (RMS), crest factor (i.e., the ratio between the amplitude and RMS within a defined time window), peak-to-peak interval, mean, standard deviation, skew, and kurtosis [29, 30]. For
26
frequency domain techniques, the common practices are standard fast Fourier transform (or spectrum), order analysis, envelope analysis (or amplitude demodulation), and side band analysis [29]. The time domain parameters are normally used to monitor the trend of overall vibration level over time, at a specific measurement location. Time interval-based or vibration level-based triggering mechanisms can be set up based on the time domain parameter that reflects overall vibration trending. Once triggered, a discrete frequency analysis snapshot can be taken. Based on these snapshots, detailed examinations of gearbox health can be conducted. Also, the amplitude of characteristic frequencies for gears (e.g., meshing frequency) and bearings (e.g., ball passing frequency) can be trended over time to detect potential failures [13].
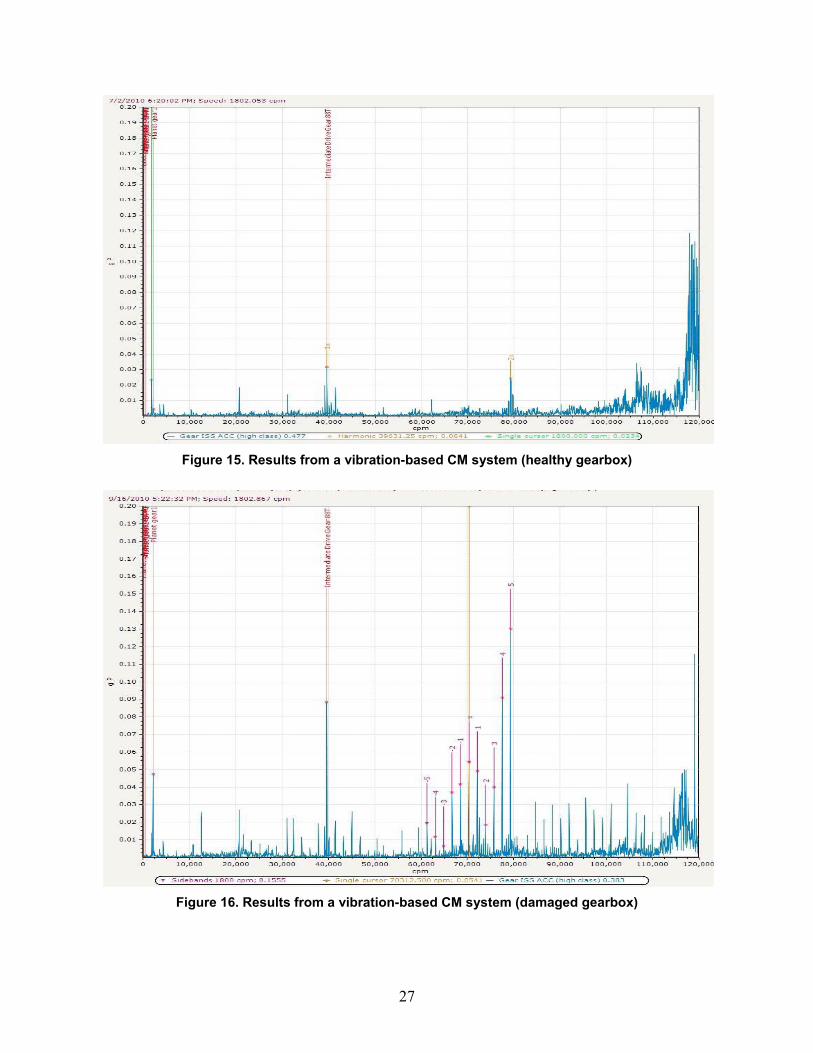
Figure 15 and Figure 16 show sample results obtained by the investigated vibration-based CM system from the GRC tests [31]. Figure 15 results were obtained during the Phase 1 Gearbox 2 Dynamometer Test. Figure 16 results were obtained during the Phase 2 Gearbox 1 Dynamometer Retest. They are spectra of vibration data collected by one accelerometer mounted to the Intermediate Speed Shaft on the back cover of the test gearbox. Figure 15 shows measurements from the healthy gearbox, while Figure 16 shows data collected from the damaged gearbox. For both figures, the horizontal axis shows frequency in counts per minute (60 cpm = 1 Hz) and the vertical axis shows acceleration in g (1 g=9.8 m/s^2). The fundamental high speed stage gear meshing frequency (GMF) of 39,600 cpm or 660 Hz, and its second harmonic are labeled in the figures. When comparing the figures, the damaged gearbox clearly has more frequency components and elevated amplitude for GMF sidebands. For illustration purposes, the ten sideband frequencies (five below and five above) of the second harmonic in the high speed stage GMF are labeled in Figure 16. The spectrum pattern illustrated in Figure 16 typically represents abnormal gear set behaviors. When the sideband frequencies are around 39,600 cpm, it is clear that the problem occurs during the high speed stage. In addition, the amplitude of the fundamental high speed stage GMF increased from 0.0325 g in the healthy gearbox to 0.0875 g in the damaged gearbox. Such an increase in GMF amplitude is another indication of abnormal gear set behavior. Even without a detailed calculation, it is obvious that the energy contained in the frequency spikes from the damaged gearbox is much higher than that of the healthy gearbox. This is a result of both increased amplitude of those frequencies already contained in the healthy gearbox and the additional energy caused by new frequency components in the damaged gearbox. Based on these findings, it is reasonable to conclude that the vibration-based monitoring technique can successfully diagnose such gear set damage.
27
Figure 15. Results from a vibration-based CM system (healthy gearbox)
Figure 16. Results from a vibration-based CM system (damaged gearbox)
28
Stress Wave Analysis Another popular CM technique used by the wind industry is called stress wave analysis [32]. It uses specially designed stress wave sensors to pick up the stress waves (acoustic emissions) generated by the frictional and strike events in a monitored structure. Most of the vibration analysis algorithms mentioned earlier also are applicable to the analysis of stress wave time series. One unique result provided by the stress wave technique is called a stress wave amplitude histogram, which is discussed below.
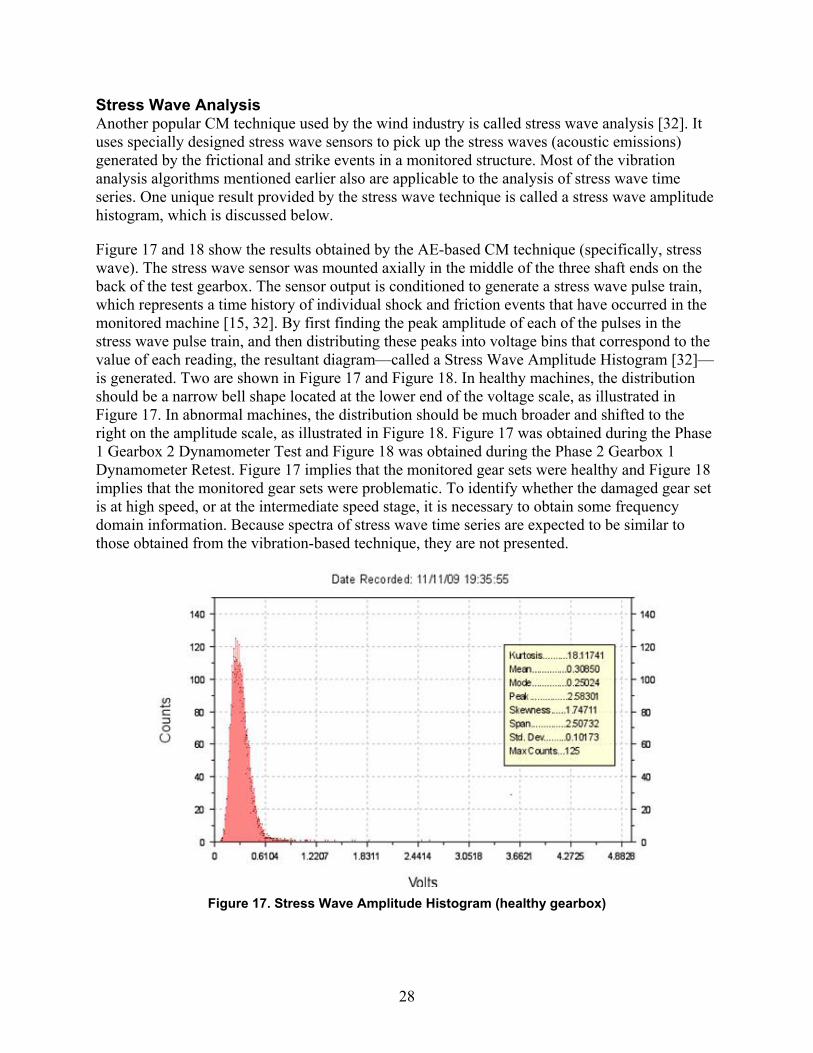
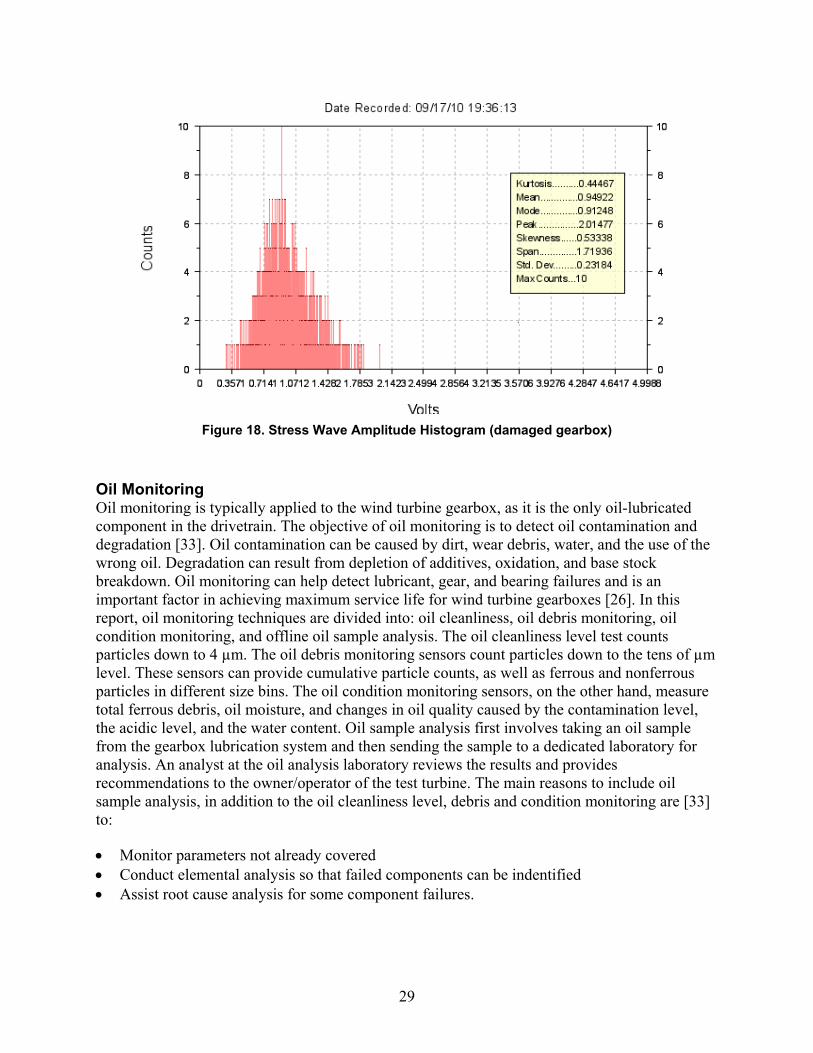
Figure 17 and 18 show the results obtained by the AE-based CM technique (specifically, stress wave). The stress wave sensor was mounted axially in the middle of the three shaft ends on the back of the test gearbox. The sensor output is conditioned to generate a stress wave pulse train, which represents a time history of individual shock and friction events that have occurred in the monitored machine [15, 32]. By first finding the peak amplitude of each of the pulses in the stress wave pulse train, and then distributing these peaks into voltage bins that correspond to the value of each reading, the resultant diagram—called a Stress Wave Amplitude Histogram [32]—is generated. Two are shown in Figure 17 and Figure 18. In healthy machines, the distribution should be a narrow bell shape located at the lower end of the voltage scale, as illustrated in Figure 17. In abnormal machines, the distribution should be much broader and shifted to the right on the amplitude scale, as illustrated in Figure 18. Figure 17 was obtained during the Phase 1 Gearbox 2 Dynamometer Test and Figure 18 was obtained during the Phase 2 Gearbox 1 Dynamometer Retest. Figure 17 implies that the monitored gear sets were healthy and Figure 18 implies that the monitored gear sets were problematic. To identify whether the damaged gear set is at high speed, or at the intermediate speed stage, it is necessary to obtain some frequency domain information. Because spectra of stress wave time series are expected to be similar to those obtained from the vibration-based technique, they are not presented.
Figure 17. Stress Wave Amplitude Histogram (healthy gearbox)
29
Figure 18. Stress Wave Amplitude Histogram (damaged gearbox)
Oil Monitoring Oil monitoring is typically applied to the wind turbine gearbox, as it is the only oil-lubricated component in the drivetrain. The objective of oil monitoring is to detect oil contamination and degradation [33]. Oil contamination can be caused by dirt, wear debris, water, and the use of the wrong oil. Degradation can result from depletion of additives, oxidation, and base stock breakdown. Oil monitoring can help detect lubricant, gear, and bearing failures and is an important factor in achieving maximum service life for wind turbine gearboxes [26]. In this report, oil monitoring techniques are divided into: oil cleanliness, oil debris monitoring, oil condition monitoring, and offline oil sample analysis. The oil cleanliness level test counts particles down to 4 µm. The oil debris monitoring sensors count particles down to the tens of µm level. These sensors can provide cumulative particle counts, as well as ferrous and nonferrous particles in different size bins. The oil condition monitoring sensors, on the other hand, measure total ferrous debris, oil moisture, and changes in oil quality caused by the contamination level, the acidic level, and the water content. Oil sample analysis first involves taking an oil sample from the gearbox lubrication system and then sending the sample to a dedicated laboratory for analysis. An analyst at the oil analysis laboratory reviews the results and provides recommendations to the owner/operator of the test turbine. The main reasons to include oil sample analysis, in addition to the oil cleanliness level, debris and condition monitoring are [33] to:
• Monitor parameters not already covered • Conduct elemental analysis so that failed components can be indentified • Assist root cause analysis for some component failures.
30
The typical parameters sought in an oil sample analysis include [34] particle counts, water content, total acid number, viscosity, and particle element identification. The recommended interval for oil analysis, as stated by wind turbine manufacturers, is typically one sample every six months. However, if the oil cleanliness, debris, or condition sensors reveal abnormal conditions, it is better to conduct a spot oil sample analyses, which may help in identifying component failures in progress. The results obtained during various stages of the GRC tests by these four oil monitoring techniques are presented below.
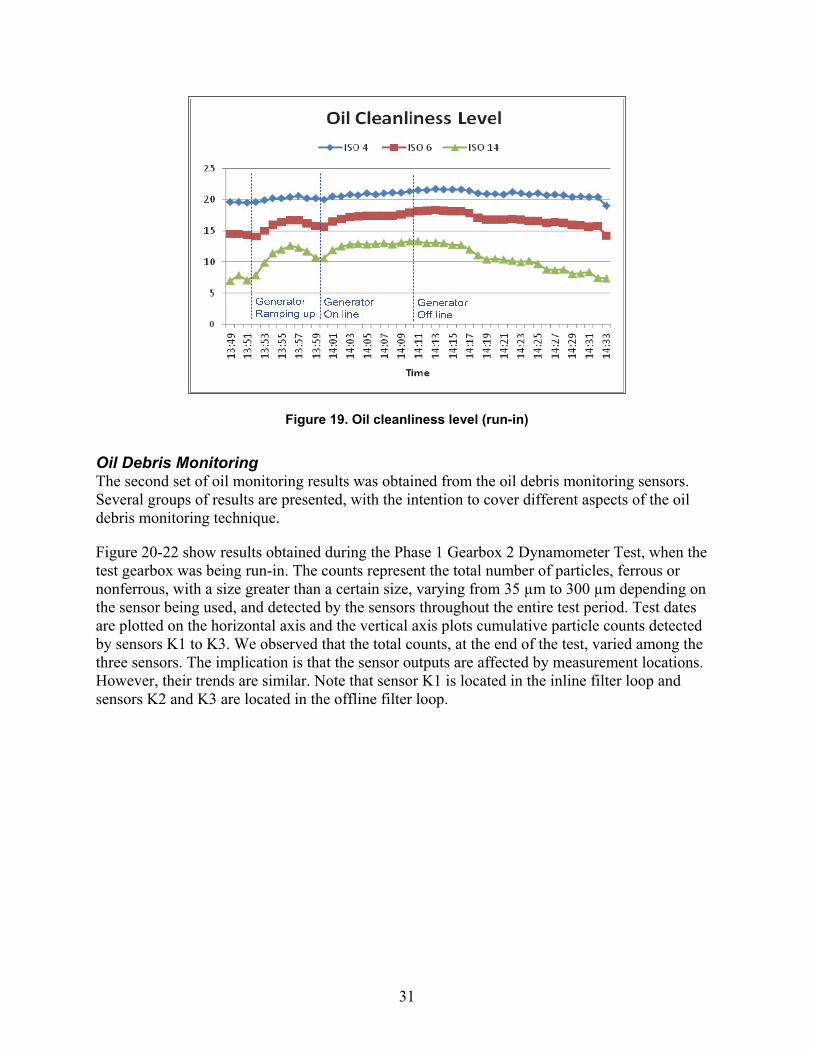
Oil Cleanliness Level Monitoring The first subset of oil monitoring results was the oil cleanliness level measured during the Phase 1 Gearbox 1 Dynamometer Test, when the test gearbox was run-in at 25% of rated load level. The generator status is shown in Figure 19. The figure's horizontal axis is time and the vertical axis is the ISO 4406:1999 cleanliness code [17]. It is divided into three stages: around 13:51, the generator speed started ramping up; around 13:59, the generator was connected to the grid; and around 14:10, the generator went off the grid, but the lubricant CM system was left running. At around 14:34, the power supply to all CM systems shut off and all oil cleanliness level readings dropped to zero. This is not shown in the figure. As shown in Figure 19, a broad range of particle sizes were generated throughout the gearbox operational process, which is demonstrated by the increased oil cleanliness level in all three bins (> 4 µm, > 6 µm, and > 14 µm). This test verified that wind turbine gearboxes always emit particles. It is worth noting that the larger the number, the more contaminated the oil. The oil cleanliness level decreased when the generator speed was ramped up and increased when the generator was shut down and the offline filter loop filtration system was left running. Based on this observation, it can be inferred that the oil cleanliness level has the potential to be used to monitor and control the run-in of wind turbine gearboxes. The rationale is that the oil cleanliness level will increase when the run-in begins at a certain load level. As the run-in continues, the measured cleanliness level will gradually stabilize because contacted surfaces are smoothed through run-in and the continuously functional lubricant filtration system. These results can be used to determine when run-in of wind turbine gearbox may occur under a certain load level.
Oil cleanliness level results similar to Figure 19 also were obtained during the Phase 1 Gearbox 2 Dynamometer Test, when the test gearbox was run-in. Test data from both test gearboxes indicate that the cleanliness readings did, in fact, fall off at the 1+ hour range, depending on load and temperature. The industry has recognized that using cleanliness is a better approach than the time-at-load level since it verifies that run-in has actually occurred, and these results are good evidence to support that assumption.
31
Figure 19. Oil cleanliness level (run-in)
Oil Debris Monitoring The second set of oil monitoring results was obtained from the oil debris monitoring sensors. Several groups of results are presented, with the intention to cover different aspects of the oil debris monitoring technique.
Figure 20-22 show results obtained during the Phase 1 Gearbox 2 Dynamometer Test, when the test gearbox was being run-in. The counts represent the total number of particles, ferrous or nonferrous, with a size greater than a certain size, varying from 35 µm to 300 µm depending on the sensor being used, and detected by the sensors throughout the entire test period. Test dates are plotted on the horizontal axis and the vertical axis plots cumulative particle counts detected by sensors K1 to K3. We observed that the total counts, at the end of the test, varied among the three sensors. The implication is that the sensor outputs are affected by measurement locations. However, their trends are similar. Note that sensor K1 is located in the inline filter loop and sensors K2 and K3 are located in the offline filter loop.

32
Figure 20. Cumulative particle counts obtained by sensor K1 (run-in)
Figure 21. Cumulative particle counts obtained by sensor K2 (run-in)
0
100
200
300
400
500
600
700
800
900
1000
11/2
11/4
11/6
11/8
11/1
0
11/1
2
11/1
4
11/1
6
11/1
8
11/2
0
11/2
2
11/2
4
11/2
6
11/2
8
11/3
0
12/2
12/4
Date
0
50
100
150
200
250
300
11/2
11
/4
11/6
11
/8
11/1
0 11
/12
11/1
4 11
/16
11/1
8 11
/20
11/2
2 11
/24
11/2
6 11
/28
11/3
0 12
/2
12/4
Date

33
Figure 22. Cumulative particle counts obtained by sensor K3 (run-in)
Figure 23 shows the oil debris particle counts obtained during the Phase 2 Gearbox 1 Dynamometer Retest by sensor K1. The horizontal axis shows the date and the vertical axis lists the cumulative particle counts. Within three calendar days, the counts were increased from 0 to about 680. More specifically, the particle generation rate reached about 70 particles per hour on September 16. In comparison, about 11 particles were generated over a period of four hours from a healthy gearbox [35]. It is, therefore, reasonable to conclude that under similar environmental conditions, such as oil temperature, shaft rotational speed, and driven torque, a damaged gearbox has higher particle-generation rates than a healthy gearbox. It is worth noting that the lubricant used in this test is different from the oil used during the run-in, which does not have anti-wear additives. However, due to the lack of frequency information from the oil debris monitoring technique, it is difficult to tell where the damage occurred.
Figure 23. Cumulative particle counts obtained by sensor K1 (damaged gearbox)
0
100
200
300
400
500
600
700
800
9/15 9/16 9/17 9/18 Date
34
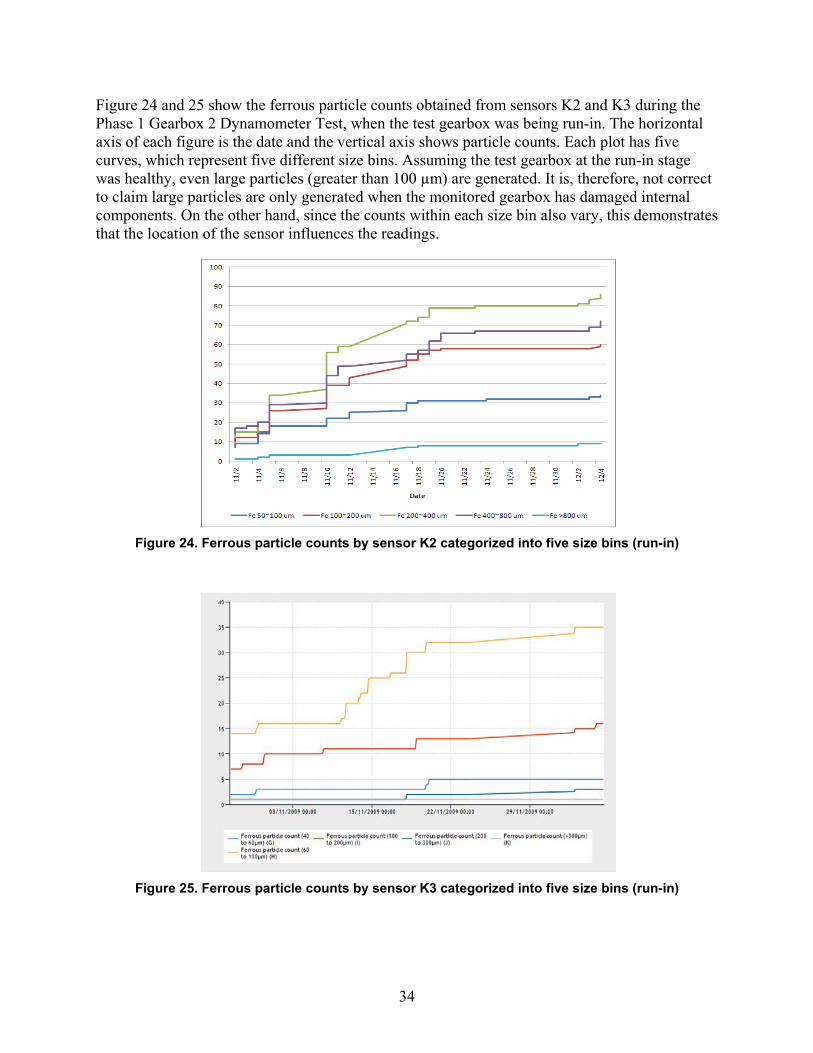
Figure 24 and 25 show the ferrous particle counts obtained from sensors K2 and K3 during the Phase 1 Gearbox 2 Dynamometer Test, when the test gearbox was being run-in. The horizontal axis of each figure is the date and the vertical axis shows particle counts. Each plot has five curves, which represent five different size bins. Assuming the test gearbox at the run-in stage was healthy, even large particles (greater than 100 µm) are generated. It is, therefore, not correct to claim large particles are only generated when the monitored gearbox has damaged internal components. On the other hand, since the counts within each size bin also vary, this demonstrates that the location of the sensor influences the readings.
Figure 24. Ferrous particle counts by sensor K2 categorized into five size bins (run-in)
Figure 25. Ferrous particle counts by sensor K3 categorized into five size bins (run-in)

35
Oil Condition Monitoring The third sub set of oil monitoring results was obtained from the oil condition monitoring sensors, specifically total ferrous debris, oil quality, and moisture. The measurement was made in the offline filter loop. Figure 26 shows the results obtained during the Phase 1 Gearbox 1 Field Test. Figure 27 shows the results obtained during the Phase 2 Gearbox 1 Dynamometer Retest. The horizontal axis for both figures is the test date. The units for four monitored variables are:
• Oil Temperature – Celsius
• Box (i.e. sensor package) Temperature – Celsius
• Oil Moisture – %
• Oil Total ferrous debris – parts per million (ppm)
There was another channel on oil quality, but it is not shown in these two figures as no significant changes were observed. In addition, it should be pointed out that the test experiences on the oil condition sensors, from both the field test and the dynamometer retest of Gearbox 1, are inconclusive. However, there are still several points worth mentioning.
Figure 26 shows that total ferrous debris has several spikes, which may be an indication of possible gearbox damage. The moisture was decreasing, which was reasonable since oil loss should have led to elevated oil temperature making the oil drier. However, wind speed information is needed to confirm whether the two temperature channels match the turbine operational conditions. Assuming a match, the data has demonstrated the complex dynamics that wind turbines may experience in the field.
Figure 26. Oil condition sensor readings (field test)
36
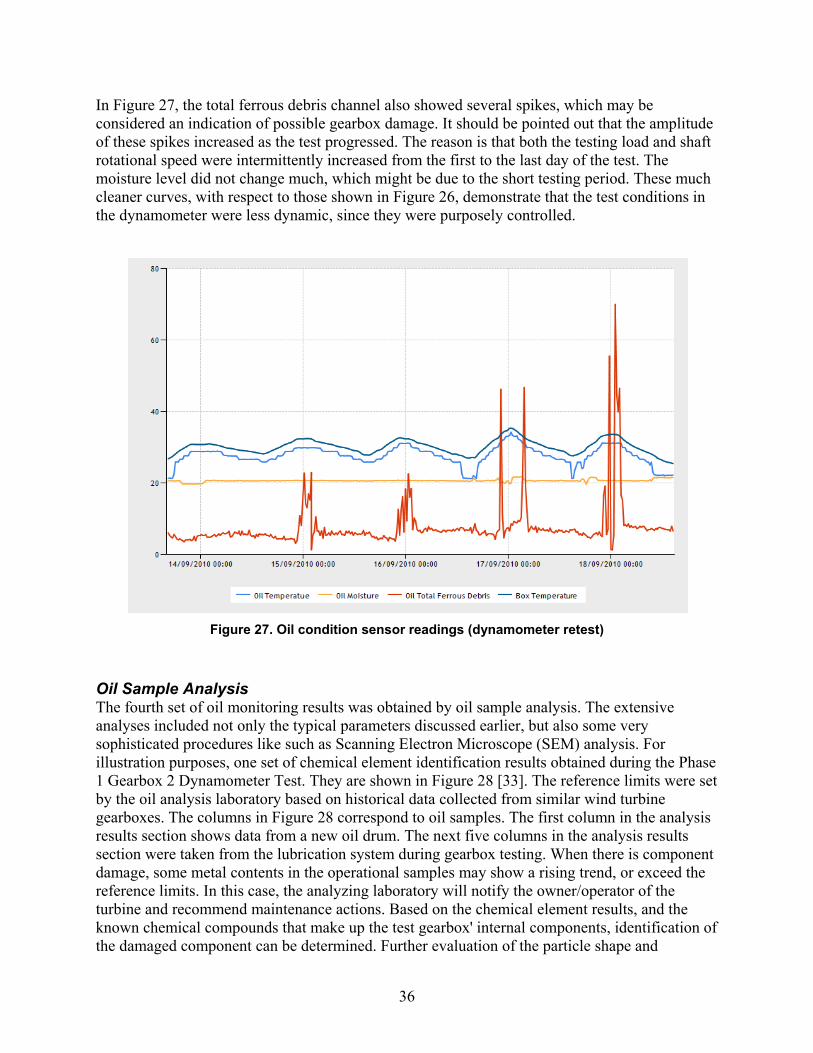
In Figure 27, the total ferrous debris channel also showed several spikes, which may be considered an indication of possible gearbox damage. It should be pointed out that the amplitude of these spikes increased as the test progressed. The reason is that both the testing load and shaft rotational speed were intermittently increased from the first to the last day of the test. The moisture level did not change much, which might be due to the short testing period. These much cleaner curves, with respect to those shown in Figure 26, demonstrate that the test conditions in the dynamometer were less dynamic, since they were purposely controlled.
Figure 27. Oil condition sensor readings (dynamometer retest)
Oil Sample Analysis The fourth set of oil monitoring results was obtained by oil sample analysis. The extensive analyses included not only the typical parameters discussed earlier, but also some very sophisticated procedures like such as Scanning Electron Microscope (SEM) analysis. For illustration purposes, one set of chemical element identification results obtained during the Phase 1 Gearbox 2 Dynamometer Test. They are shown in Figure 28 [33]. The reference limits were set by the oil analysis laboratory based on historical data collected from similar wind turbine gearboxes. The columns in Figure 28 correspond to oil samples. The first column in the analysis results section shows data from a new oil drum. The next five columns in the analysis results section were taken from the lubrication system during gearbox testing. When there is component damage, some metal contents in the operational samples may show a rising trend, or exceed the reference limits. In this case, the analyzing laboratory will notify the owner/operator of the turbine and recommend maintenance actions. Based on the chemical element results, and the known chemical compounds that make up the test gearbox' internal components, identification of the damaged component can be determined. Further evaluation of the particle shape and
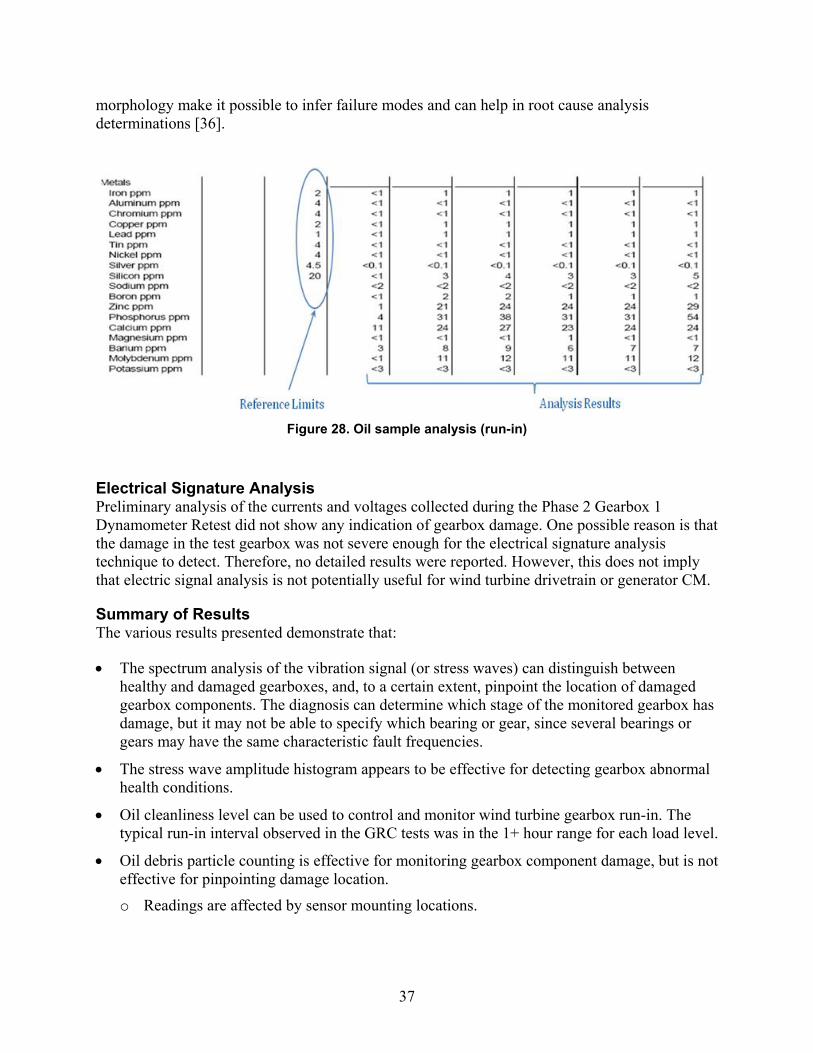
37
morphology make it possible to infer failure modes and can help in root cause analysis determinations [36].
Figure 28. Oil sample analysis (run-in)
Electrical Signature Analysis Preliminary analysis of the currents and voltages collected during the Phase 2 Gearbox 1 Dynamometer Retest did not show any indication of gearbox damage. One possible reason is that the damage in the test gearbox was not severe enough for the electrical signature analysis technique to detect. Therefore, no detailed results were reported. However, this does not imply that electric signal analysis is not potentially useful for wind turbine drivetrain or generator CM.
Summary of Results The various results presented demonstrate that:
• The spectrum analysis of the vibration signal (or stress waves) can distinguish between healthy and damaged gearboxes, and, to a certain extent, pinpoint the location of damaged gearbox components. The diagnosis can determine which stage of the monitored gearbox has damage, but it may not be able to specify which bearing or gear, since several bearings or gears may have the same characteristic fault frequencies.
• The stress wave amplitude histogram appears to be effective for detecting gearbox abnormal health conditions.
• Oil cleanliness level can be used to control and monitor wind turbine gearbox run-in. The typical run-in interval observed in the GRC tests was in the 1+ hour range for each load level.
• Oil debris particle counting is effective for monitoring gearbox component damage, but is not effective for pinpointing damage location.
o Readings are affected by sensor mounting locations.

38
o Similar particle counting trends can be obtained between the inline filter (main) and the offline filter (kidney or side stream) loops.
• A damaged gearbox releases particles at increased rates.
• Oil condition monitoring results, specifically moisture, total ferrous debris, and oil quality, indicate that oil total ferrous debris appears indicative of gearbox component damage. More data is required to evaluate the measurements of oil moisture and quality.
• Periodic oil sample analysis may help pinpoint a failed component and support root cause analysis.
• Electrical signature-based techniques so far have not distinguished between the healthy and damaged gearboxes.
39
Challenges in Wind Turbine Drivetrain CM and Future R&D Areas
Based on the drivetrain CM research conducted so far under the GRC, it is clear that there is room to improve typical O&M practices adopted by wind plant owner/operators. CM is one enabling technique for such improvements to help reduce O&M costs and, subsequently, the COE for the wind industry. When turbines are installed offshore, the improvements in CM techniques used broadly in O&M practices will become even more important.
Among the various CM techniques investigated in this research, vibration or stress wave analysis and oil monitoring CM techniques have been successfully applied, and are increasingly deployed, in the wind industry. However, there are still challenges facing these monitoring techniques, which must be addressed. The first challenge for wind turbine CM, as a whole, is the justification of cost benefits. Relative to other traditional power generation industries where CM is widely adopted, the revenue stream from each wind turbine may be an order of magnitude lower.
Challenges to Implementation of Wind Turbine Drivetrain CM For vibration, or stress wave-based CM technique, the following list can be used as a starting point for understanding the challenges [9, 37]:
• Accessibility. Limited machine accessibility makes it challenging to retrofit wind turbine CM systems.
• Measurement strategy. The type, number, and location of sensors will affect the measurement, and subsequently, the analysis results. In addition, the configuration of complex gearboxes varies, making it difficult to determine a cost-effective and universal solution.
• Diagnostics. Changing wind direction and speed cause variable speed and load conditions when collecting vibration data. Compared to stall-regulated wind turbines, variable speed wind turbines have additional complexities. In addition, it can be challenging to directly apply vibration-based CM systems used in other industries to the wind industry due to low rotor speeds.
• Data interpretation. Currently, a vibration-based CM system normally generates an extensive amount of vibration data, which typically requires expert assistance to interpret and provide recommendations for maintenance.
• Condition-based maintenance (CBM). Online drivetrain vibration monitoring is not yet ready for CBM because there is still uncertainty about severity levels and prognostics of degradation.
40
Some recommendations for best practices to address these challenges are:
• An individual vibration-based CM system setup for each turbine is recommended to handle the variations caused by a number of factors, including sensor location, gearbox configuration, and blade condition [38].
• To handle the variation in wind and turbine operational speeds, it is important to have an accurate shaft rotational speed measurement [12].
In addition, new areas of research have to be conducted, such as developing:
• New sensing technologies, such as Spectral Emitted Energy (SEE) sensors [38]
• New diagnostic algorithms, such as the synthesized synchronous sampling method [39].
For oil monitoring, consideration must be given to the many factors affecting oil debris, condition sensor readings, and oil sample analyses [40]. Some of these factors also can be considered as challenges. For oil debris and condition monitoring, the challenge is to correctly interpret the sensor readings (e.g., oil quality and moisture), as operational conditions have significant impacts. These include temperature changes that occur from stop to start in day-to-day turbine operations and also cross-seasonal operations. To mitigate this challenge, speed and temperature information can be integrated when interpreting the oil debris and condition monitoring sensor readings [40]. For oil sample analysis, there is no single standard for all wind turbines [40]. Different turbine manufacturers, or lubrication oil suppliers, may require a unique set of analyses to obtain credible results. Other challenges include:
• Obtaining a representative sample. There is no access to the gearbox when a turbine is in operation.
• Inconsistent sampling practices. Oil samples might be taken at different ports and oil settling conditions may vary in the same gearbox.
• Incomplete information in samples sent for analysis. Some missed information may include oil time, gearbox model, and oil change records.
Standardized tests of lubrication oil, if possible, should be specified to address these challenges. In addition, education and training are needed for practices such as taking representative oil samples and proper labeling.
41
Future R&D areas in Wind Turbine Drivetrain CM Although the CM technologies face various challenges in wind turbine applications, they are still valuable and beneficial to the entire wind industry.
Below are opportunities for improvements identified for advancing wind turbine CM: • Determine the most cost-effective measurement or monitoring strategy
• Improve the accuracy and reliability of diagnostic decisions, including severity level evaluations
• Automate the “expert” in data interpretation to make actionable recommendations automatic
• Develop reliable and accurate prognostics techniques.
Additional opportunities of improvement include:
• Improved use of Supervisory Control and Data Acquisition (SCADA) system data, which is normally only stored at 10-minute intervals
• Performance monitoring, usage monitoring, and load estimation [41] to help prognostics
• Fleet-wide condition monitoring and asset management [5]
• Root cause analysis to help improve the turbine operation, control strategy, and component design.
When turbines are installed offshore, the scope of CM must be expanded from the baseline onshore turbine studied here to include additional subsystems, such as undersea transmission lines. The influences of water on turbine component health need to be examined. The load estimation becomes more complex, as both wave and wind influences are involved. As a result, novel sensing or sensor integration strategies may need to be developed [42]. Maintenance strategies also may need to be enhanced by integrating them with improved forecasting [42].

42
Conclusions
A fixed duration at-load approach has been traditionally used for conducting the run-in tests of wind turbine gearboxes. The GRC run-in tests have shown that ISO cleanliness measurements should be used to monitor and control the run-in of wind turbine gearboxes. The ISO cleanliness levels, especially the readings from the 14 µm bin, increased with the start up of the run-in at a certain load level and the readings gradually leveled off at a longer duration than standard run-in procedures. This data can be used to determine when to stop the run-in at each load level, thereby achieving a complete run-in of the gearbox. If the run-in is not fully completed, surface roughness remains excessive and contact stresses are increased when the gearbox is placed into service. Increased contact stresses can result in premature failures of the gearbox.
Wind plant owner/operators may be under the misconception that one CM system can detect more problems in wind turbines than is possible. The GRC tests have demonstrated that different monitoring techniques can reveal different details of the drivetrain components. As a result, an integrated approach is recommended for the best possible results.
Both damaged and healthy gearboxes were tested in controlled dynamometer tests and vibration, acoustic emission, electrical signature analysis, and oil monitoring data were acquired. The damage to the gearbox consisted of severe scuffing to the high speed stage gear and pinion. The data from each technique was evaluated in order to determine if the damaged gearbox could be clearly distinguished from the healthy gearbox.
Vibration, acoustic emission, and oil debris monitoring all demonstrated the capability of distinguishing between the healthy and damaged gearbox components. Electrical signature analysis did not show any indication of the gear teeth damage, most likely because the damage to the gear teeth was not severe enough to significantly affect the generator currents.
For oil debris monitoring, different vendors have different claims on the effectiveness of mounted sensors, in either the inline or offline filtration loops. The GRC test results indicate that the wear debris count appears effective for monitoring the gearbox, but measurements are affected by sensor mounting locations. If the sensor mounting location is appropriate, similar trends in wear debris counts, between the offline filter loop and the inline filter loop, can be obtained.
To the authors’ knowledge, there are limited results for wind turbine CM testing that are publicly available to the industry. This research is one of the first attempts to provide this information and the research results demonstrate the value of a project being funded by a U.S. government agency and the benefits of collaboration with industry partners.

43
References
1. Motavalli, J. (2004). “Catching the wind.” The Environmental Magazine, Dec, 2004. http://www.emagazine.com/archive/2176
2. Global Energy Research Council, Global Wind Report, 2010. [Online] http://www.gwec.net/fileadmin/images/Publications/GWEC_annual_market_update_2010_-_2nd_edition_April_2011.pdf
3. Wind Stats Newsletter, 2003–2009, Vol. 16, No. 1 to Vol. 22, No. 4, Haymarket Business Media, London, UK.
4. Tavner, P. Reliability & Availability of Wind Turbine Electrical & Electronic Components. [Online] www.reliawind.eu/files/publications/pdf_13.pdf
5. Veers, P. (2009) Databases for Use in Wind Plant Reliability Improvement, 2009 Wind Turbine Condition Monitoring Workshop, October 8–9, 2009, Broomfield, CO.
6. Link, L.; LaCava, W.; van Dam, Jeroen.; McNiff, B.; Sheng, S.; Wallen, R.; McDade, M.; Lambert, S.; Butterfield, S.; Oyague, Francisco. (2011) Gearbox Reliability Collaborative Project Report: Findings from Phase 1 and Phase 2 Testing. NREL Report No. TP-5000-51885. Golden, CO: NREL.
7. Sheng, S.; Oyague, F.; Errichello, R. (2010). “Investigation of Oil Conditioning and Monitoring Techniques for Wind Turbine Gearboxes.” Presented Society of Tribologists and Lubrication Engineers (STLE) 65th Annual Meeting and Exhibition, Las Vegas, NV, May 16-20, 2010. NREL Report No. PR-500--48289. Golden, CO: NREL.
8. Oyague, F.; Sheng S.; Butterfield. S. (2009). “NREL Gearbox Reliability Collaborative Analysis Round Robin,” presented at the 2009 Wind Power Conference, May 4-7, 2009.
9. T. W. Verbruggen, Condition Monitoring: Theory and Practice, 2009, Wind Turbine Condition Monitoring Workshop, October 8–9, 2009, Broomfield, CO.
10. Electric Power Research Institute. 2006. “Condition Monitoring of Wind Turbines: Technology Overview, Seeded-Fault Testing, and Cost-Benefit Analysis”, Palo Alto, CA: 1010419.
11. C. Walford, Estimating the Benefits of CM for Wind Turbines, 2009, Wind Turbine Condition Monitoring Workshop, October 8–9, 2009, Broomfield, CO.
12. T. Francisco, Wind Farm Remote Monitoring, 2009, Wind Turbine Condition Monitoring Workshop, October 8–9, 2009, Broomfield, CO.
13. R. Kewitsch, Optimizing Life Cycle Costs (LCC) for Wind Turbines by Implementing Remote Condition Monitoring Service, 2011, AWEA Project Performance and Reliability Workshop, January 12–13, 2011, San Diego, CA.
14. Kessissoglou, N. J. and Z. Peng. March 2003. “Integrating Vibration and Oil Analysis for Machine Condition Monitoring,” Practicing Oil Analysis Magazine.
15. Board, D. B. July 2003. “Stress Wave Analysis Provides Early Detection of Lubrication Problems,” Practicing Oil Analysis Magazine.

44
16. Barnes, M. March 2008. “Oil Analysis: 5 Things You Didn't Know,” Reliable Plant Magazine.
17. International Organization for Standardization. 1999. “ISO 4406: 1999 Hydraulic Fluid Power - Fluids - Method for Coding the Level of Contamination by Solid Particles.”
18. SKF, WindCon by SKF Condition Monitoring for Wind Turbine Systems, http://www.skf.com/files/190928.pdf
19. Scientech – StressWave Systems (formerly SwanTech), Monitoring Wind Turbine Drivetrains, http://scientech.cwfc.com/products/PDFs/SWAN/MonitoringWindTurbinesDrivetrains.pdf
20. Kittiwake, Kittiwake Online Sensor Suite, http://www.kittiwake.com/online_sensor_suite.htm
21. Kittiwake, Kittiwake Particle Content Sensor, http://www.kittiwake.com/particle_content_sensor.htm
22. Macom Condition Monitoring, Macom TechAlert 10 Brochure, http://www.macom.co.uk/images/stories/brochures/ta10.pdf
23. GasTOPS, Metalscan On-line Oil Debris Monitor for Wind Turbines, http://www.gastops.com/pdf/MetalSCAN_3000_GasTOPS.pdf
24. Hydac USA, Hydac CSM 1000 Seriese Brochure, www.hydacusa.com/literature/fluid_service/csm1000.pdf
25. SKF, SKF Dynamic Motor Analyzer EXP 4000 Brochure, http://www.skf.com/files/883421.pdf
26. M. Graf, Wind Turbine Gearbox Lubrication: Performance, Selection and Cleanliness, 2009, Wind Turbine Condition Monitoring Workshop, October 8–9, 2009, Broomfield, CO.
27. Musial W, McNiff B. Wind turbine testing in the NREL dynamometer test bed. WindPower 2000 Conference, April 30 to May 4, 2000; Palm Springs, CA.
28. National Renewable Energy Laboratory. 2.5 MW Dynamometer Testing Facility Fact Sheet [Online]. Available: http://www.nrel.gov/docs/fy11osti/45649.pdf.
29. J. Giebhardt, “State of the Art” Report Condition Monitoring for Wind Turbines, 2007, Upwind. [Online] http://www.upwind.eu/Shared%20Documents/WP7%20-%20Publications/UpWind-WP7_SOTA_CMS.pdf
30. Jardine, D. Lin, and D. Banjevac, A Review on Machinery Diagnostics and Prognostics Implementing Condition-based Maintenance, 2006, Mechanical Systems and Signal Processing, Vol. 20, Pages: 1483–1510.
31. Ziegler, G. 2011. “General Observations SKF Condition Monitoring System Update,” presented at the NREL GRC All Member Meeting, February 16-17.
32. D. Board, Stress Wave Analysis Provides Early Detection of Lubrication Problems, 2003, Machinery Lubrication. [Online] http://www.machinerylubrication.com/Read/501/stress-wave-analysis

45
33. S. Sheng, Investigation of Oil Conditioning, Real-time Monitoring and Oil Sample Analysis for Wind Turbine Gearboxes, 2011, AWEA Project Performance and Reliability Workshop, January 12–13, 2011, San Diego, CA.
34. D. Troyer and J. Fitch, Oil Analysis Basics, 2001, Noria Corporation, Tulsa, OK.
35. Dempsey, P. and S. Sheng. 2011. “Investigation of Data Fusion Applied to Health Monitoring of Wind Turbine Drivetrain Components,” presented at the 2011 Wind Power Conference, May 22-25.
36. Sheng, S.; Herguth, W.; Drake, T. (2011). “Investigation of Image-Based Particle Shape and Size Analysis Techniques for Wind Turbine Gearbox Lubricants.” Presented Society of Tribologists and Lubrication Engineers (STLE) 66th Annual Meeting and Exhibition, Atlanta, GA, May 15-19, 2011. NREL Report No. AB-5000-51073. Golden, CO: NREL.
37. J. Tranter, Vibration Analysis of Wind Turbines, ReliabilityWeb, [Online] http://reliabilityweb.com/index.php/articles/vibration_analysis_of_wind_turbines/
38. Smulders, Challenges of Condition Monitoring for Wind Turbines and Successful Techniques, 2009, Wind Turbine Condition Monitoring Workshop, October 8–9, 2009, Broomfield, CO.
39. H. Luo , R. Hedeen, D. Hallman, D. Richter, and M. Sirak, 2009, Synchronous Sampling in Wind Turbine Gearbox Condition Monitoring, 2009, Wind Turbine Condition Monitoring Workshop, October 8–9, 2009, Broomfield, CO.
40. D. Clark, What to expect from oil sensors and sampling, 2010, Wind Power Engineering. [Online] http://www.windpowerengineering.com/design/mechanical/lubricants/what-to-expect-from-oil-sensors-and-sampling/
41. S. Butterfield, Vision for Advanced Wind Plant Health Monitoring: Beyond Gearboxes, 2009, Wind Turbine Condition Monitoring Workshop, October 8–9, 2009, Broomfield, CO.
42. W. Musial, Offshore Wind O&M Challenges, 2009, Wind Turbine Condition Monitoring Workshop, October 8–9, 2009, Broomfield, CO.

46
Appendix A – Project Partners
Brüel & Kjær Vibro A/S
Castrol Industrial North America Inc.
CC Jensen Inc.
Colorado School of Mines
Eaton Corp.
GasTOPS
GE Bently Nevada
Herguth Laboratories, Inc.
Impact Technologies
IVC Technologies
Kittiwake Americas
The Lubrizol Corporation
Macom Condition Monitoring
National Instruments
NRG Systems Inc.
Purdue University
Schenck Corporation
Sentient Corporations
SKF
SKF Baker Instrument
STC Consultants (SKF)
Scientech (formerly SwanTech)
University of Cincinnati
University of Connecticut
University of Iowa
University of New South Wales in Australia
Wichita State University

47
Appendix B – Other Activities
Workshop In response to the industry’s growing interest in CM, NREL held a wind turbine condition monitoring workshop on October 8-9, 2009, in Broomfield, CO. The workshop covered a broad range of topics: economic benefits, current CM practices, drivetrain monitoring, lubricant conditioning and monitoring, structural health monitoring, research and development efforts, and CM practices in other industries. Thirty-three experts in the field of CM were invited to moderate and present at the workshop, which was attended by 225 people. An overview paper (Sheng & Veers 2011) was written based on selected presentations given at the workshop. To better serve the industry, NREL plans to host a CM workshop every other year.
Round Robin Project Another activity launched along the line of CM is a wind turbine gearbox CM round robin project. In the field test, the GRC Gearbox 1 experienced a loss of oil on two separate occasions that resulted in damage to internal bearings and gear elements. It was determined that further tests of this gearbox in the field would cause more harm than benefit to the GRC project and tests on the gearbox were terminated. However, from the CM point of view, the damaged gearbox provided a unique opportunity to evaluate different CM technologies. The NREL GRC team successfully completed the retest of this gearbox under Phase 2 in the NREL 2.5-MW dynamometer. Various CM techniques were applied during the retest. The data collected by a customized vibration-based data acquisition system enabled NREL to launch a GRC Condition Monitoring Round Robin Project, which is currently underway. The main objective of this project is to evaluate different vibration analysis algorithms used for vibration-based wind turbine CM and determine the best practices. Another objective is to assess the capability of vibration-based CM and to establish a baseline from which improvements can be measured. The study includes 16 participating partners from three continents. They represent seven universities and 9industry partners. The project is unique in that it is a blind study, meaning the participants will not see the real damage information until their analysis results are submitted to NREL. At the date of this publication, the results submission period has ended. NREL has also completed the analysis results comparison and a further analysis by partners has begun.

48
Appendix C – Publications and Presentations
Sheng, S. (2011). “Investigation of Various Condition Monitoring Techniques Based on a Damaged Wind Turbine Gearbox.” Eighth International Workshop on Structural Health Monitoring 2011. Stanford, CA, USA, September 13-15, 2011.
Sheng, S. (2011). “Wind Turbine Drivetrain Condition Monitoring.” Keynote Speech Presented at Pennsylvania State University Ben Franklin Center of Excellence in Structural Health Monitoring Annual Meeting, University Park, PA, August 4, 2011.
Sheng, S. (2011). “Investigation of Various Wind Turbine Drivetrain Condition Monitoring Techniques.” Presented at Sandia Reliability Workshop, Albuquerque, NM, August 2-3, 2011. Report No. PR-5000-52352.
Dempsey, P.; Sheng, S. (2011). Investigation of Data Fusion Applied to Health Monitoring of Wind Turbine Drivetrain Components. Report No. PR-5000-51467. Golden, CO: NREL.
Sheng, S.; Herguth, W.; Drake, T. (2011). “Investigation of Image-Based Particle Shape and Size Analysis Techniques for Wind Turbine Gearbox Lubricants.” Presented Society of Tribologists and Lubrication Engineers (STLE) 66th Annual Meeting and Exhibition, Atlanta, GA, May 15-19, 2011. NREL Report No. AB-5000-51073. Golden, CO: NREL.
Sheng, S.; Veers, P. “Wind Turbine Drivetrain Condition Monitoring – An Overview.” Machinery Failure Prevention Technology (MFPT): The Applied Systems Health Management Conference 2011. Virginia Beach, VA, USA, May 10-12, 2011.
Sheng, S. (2011). “GRC Condition Monitoring Overview and Some Preliminary Results.” Presented at GRC All Member Meeting, Golden, CO, February 16-17, 2011.
Sheng, S. (2011). “Investigation of Oil Conditioning, Real-time Monitoring and Oil Sample Analysis for Wind Turbine Gearboxes.” The American Wind Energy Association (AWEA) Project Performance and Reliability Workshop. San Diego, CA, USA, January 12-13, 2011. Report No. PR-5000-50301. Golden, CO: NREL.
Sheng, S. (2010). “Investigation of Oil Conditioning and Monitoring Techniques for Wind Turbine Gearboxes.” The Society of Tribologists and Lubrication Engineers (STLE) 65th Annual Meeting and Exhibition. Las Vegas, NV, USA, May 16-20, 2010.
Sheng, S. (2010). “GRC Condition Monitoring Overview and Preliminary Results from Oil Condition Monitoring.” Presented at GRC All Member Meeting, Golden, CO, February 2-3, 2010.
Sheng, S.; Butterfield, S.; Oyague, F. (2009). “Investigation of Various Wind Turbine Drivetrain Condition Monitoring Techniques.” Presented at the 7th International Workshop on Structural Health Monitoring 2009, Stanford, CA, September 9-11, 2009. NREL Report No. CP-500-46160. Golden, CO: NREL. http://www.nrel.gov/docs/fy10osti/46160.pdf.

49
Butterfield, S.; Sheng, S.; Oyague, F. (2009). “Wind Energy's New Role in Supplying the World's Energy: What Role Will Structural Health Monitoring Play?” Presented at the 7th International Workshop on Structural Health Monitoring 2009. Stanford, CA, September 9-11. NREL Report No. CP-500-46180. http://www.nrel.gov/docs/fy10osti/46180.pdf.
Sheng, S. (2009). “Investigation of Various Wind Turbine Drivetrain Condition Monitoring Techniques.” Presented at 2009 Wind Turbine Condition Monitoring Workshop, Broomfield, CO, October 8-9, 2009.
Sheng, S. (2009). “Overview of GRC Condition Monitoring.” Presented at Sandia Reliability Workshop, Albuquerque, NM, June 17-18, 2009. http://www.sandia.gov/wind/2009Reliability/PDFs/Day2-06-ShawnSheng.pdf.
Sheng, S. (2009). “GRC Condition Monitoring.” Presented at GRC All Member Meeting, Golden, CO, January 22, 2009.