Compressor Tech 01 2015
76
JANUARY-FEBRUARY 2015 MAINTAINING BOIL-OFF EVOLUTION OF EPA TOUGHENS GAS COMPRESSORS LNG PLANTS METHANE LEAK REPORTING
-
Upload
tiffany-johnson -
Category
Documents
-
view
125 -
download
18
description
Compresor
Transcript of Compressor Tech 01 2015

january-february 2015
MAINTAINING BOIL-OFF EVOLUTION OF EPA TOUGHENSGAS COMPRESSORS LNG PLANTS METHANE LEAK REPORTING
CT_JanFeb_Cover.indd 1 1/26/15 11:29 AM
n Customer: LNG producers throughout the world.
n Challenge: Select a compression partner to ensure years of efficient, reliable production.
n Result: Elliott refrigeration compressors and unmatched experience have been central to successful LNG projects for decades.
They turned to Elliottfor leadership in LNG compression.
From the first commercial LNG baseload plants to today’s mega-plants in Russia, the Middle East and Asia, LNG producers have chosen Elliott for efficient, reliable compressors and matchless expertise. Elliott’s proven experience with different processes and drivers is supported by manufacturing centers in the US and Japan, and a global network of service centers. Who will you turn to?
C O M P R E S S O R S n T U R B I N E S n G L O B A L S E R V I C Ewww.elliott-turbo.com
The world turns to Elliott.
Elliott.indd 1 9/15/14 2:23 PM
They say American-Madeused to mean something.
We say it still does.
For more information about Ariel Compressors – visit www.arielcorp.com
Having shipped over 50,000 units, Ariel is the world’s largest manufacturer
of reciprocating gas compressors. Every Ariel compressor represents
the pinnacle of what an American-Made product should be: engineered,
machined, and built to be the best. Ariel Equals Compression.
Ariel_JanFeb.indd 1 12/4/14 2:34 PM

TechTransfer_Rebuilt.indd 1 10/3/14 1:07 PM

TechTransfer_Rebuilt.indd 2 10/3/14 1:07 PM
Page4CT2 Founder .......................... Joseph M. Kane
PUBLICATION STAFFPublisher ..................................... Brent HaightAssociate Publisher ..............Roberto ChelliniManaging Editor ....................... Angela JarrellExecutive Editor .............................. DJ SlaterDeputy Editor .............................. Mark ThayerSenior Editor ................. Michael J. BrezonickAssociate Editor ............................... Jack BurkeAssociate Editor ............................Chad ElmoreAssociate Editor ...................................Art AielloCopy Editor ............................... Jerry Karpowicz
Digital Content Manager ...........Catrina Boettner
Advertising Manager ...................Sarah YildizCirculation Manager ..................Sheila LizdasProduction Manager ............ Marisa J. RobertsGraphic Artist .......................Brenda L. BurbachGraphic Artist ............................Carla D. LemkeGraphic Artist .......................... Amanda J. RyanGraphic Artist ............................... Alyssa Loope
PUBLICATION HEADQUARTERS20855 Watertown Road, Suite 220Waukesha, Wisconsin 53186-1873
Telephone: (262) 754-4100 Fax: (262) 754-4175
CONTRIBUTING EDITORSNorm Shade – Cambridge, Ohio
Mauro Belo Schneider – Rio Grande du Sul, BrazilPatrick Crow – Austin, Texas
HOUSTON, U.S.A.Brent Haight, Publisher
Angela Jarrell, Managing EditorMark Thayer, Deputy Editor
12777 Jones Road, Suite 225Houston, Texas 77070
Telephone: (281) 890-5310 Fax: (281) 890-4805
GERMANYLisa Hochkofler, Advertising ManagerGabriele Dinsel, Advertising Manager
Niemöllerstr. 973760 Ostfildern, Germany
Telephone: +49 711 3416 74 0 Fax: +49 711 3416 74 74
UNITED KINGDOMIan Cameron, Regional Manager/EditorLinda Cameron, Advertising Manager
40 Premier Avenue Ashbourne, Derbyshire,
DE6 1LH, United Kingdom Telephone: +44 20 31 79 29 79 Fax: +44 20 31 79 29 70
ITALYRoberto Chellini, Associate Publisher
44, Via Delle ForbiciI-50133 Firenze, Italy
Telephone: +39 055 50 59 861 Fax: +39 055 57 11 55
Roberta Prandi Via Fitta, 21a
I-38062 Arco, ItalyTelephone: +39 0464 014421 Fax: +39 0464 244529
SWEDENBo Svensson, Field Editor/Business Manager
Dunderbacksvagen 20612-46 Finspong, Sweden
Telephone: +46 70 2405369 Fax: +46 122 14787
JAPANAkiyoshi Ojima, Branch Manager
51-16-301 Honmoku Sannotani, Naka-kuYokohama, 231-0824 Japan
Telephone: +81 45 624 3502 Fax: +81 45 624 3503
CHINAS.H. Mok, Branch Manager
Rm 1903A, 19/F, Sunbeam Commercial Building469-471 Nathan RoadKowloon, Hong Kong
Telephone: +852 31187930 Fax : +852 23321565
KOREAMyung-Shin Lee, Sales Manager
191-1, Pyungchang-dong, Chongno-kuSeoul, Korea 100-648
Telephone: +82 2 391 4254 Fax: +82 2 391 4255
DIESEL & GAS TURBINE PUBLICATIONSPresident & CEO .................... Michael J. OsengaExecutive Vice President ...Michael J. Brezonick
COMPRESSORA Member of the Diesel & Gas Turbine Publications Group
Brent Haight, [email protected]
Prepare For The New Norm
Oil prices continue to drop. The degree of panic setting in depends largely on where
you live and how much of your in-come is derived from the oil and gas industry. In Houston, using a Saffir-Simpson-inspired scale, folks are reaching category-three panic.
Fueling the panic are “preemptive measures” by industry-leading com-panies looking to protect their profit margins.
Schlumberger, the world’s larg-est oil-services company by market cap, announced in mid-January that it would cut 9000 jobs, citing “lower commodity pricing and anticipated lower exploration and production spending in 2015.”
Shortly thereafter, Baker Hughes announced plans to cut 7000 jobs in the first quarter of 2015 amid a crude oil price slump and drilling slowdown it expects to deepen.
Not to be left out, Halliburton has anted up 1000 layoffs in the Eastern Hemisphere.
More layoffs will follow, as low oil prices are here for the foreseeable future thanks to a standoff between OPEC and non-OPEC nations over who will curb production first.
A leading contributor to falling oil prices has been increased production in non-OPEC countries such as the United States and Canada. New tech-nologies have allowed these countries to access previously untapped shale oil and gas that has led to a steady rise in production. In the U.S., for example, crude oil production surpassed 8.5 MMbbl/d in 2014, up from 7.46 million last year, according to Energy Informa-tion Administration reports. Output is
projected to climb to 9.42 MMbbl/d in 2015, the most since 1972.
As a result, OPEC’s share of the global oil market has fallen, negatively impacting nations such as Saudi Ara-bia. Production cuts by Saudi Arabia to shore up prices would only result in losing more market share. Supported by OPEC, that’s not going to happen.
The laws of supply and demand have done the rest, bringing oil prices to historic lows.
So what’s next?Saudi Arabia is giving up billions of
dollars of revenues in the short term in an effort to retain market share in the long term. It is betting that a period of low prices will break some high-cost producers and is willing to run up a US$39 billion budget deficit in 2015.
The low price of oil will definitely impact high-cost producers, which will ultimately affect the entire oil and gas industry. Some big firms are already cutting capital budgets, in addition to jobs, in response to lower oil prices.
In Canada, analysts report that spending on conventional oil and gas will fall nearly 25% in 2015 and ex-penditure on oil-sands projects will decline by 40%. The total number of wells drilled in Western Canada is projected to drop 30% to 7350.
Ours is a boom and bust industry. The market will stabilize eventually, but prepare for a new norm. The days of US$100 bbl oil may be long gone. CT2
CT515.indd 1 1/23/15 8:46 AM

CPI.indd 1 10/15/14 2:57 PM

Featured Articles 16 Two-Shaft Microturbine Introduced
20 Evolution Of Liquid Natural Gas (LNG) Plants
24 Hicor Technologies’ New Compressor Ready For Field Trials
28 Upscale For Shale
30 Challenges With Surge Control Studies
38 The Impact Of Natural Gas Engine Oil
42 Lubrication Rate Reduction In Engines And Compressors
48 Monitoring System Keeps Small Fault From Becoming Catastrophic
60 Avoiding Liquid Carryover Problems In Recip Compressors
66 Maintaining Boil-Off Gas Compressors
TECHCorner 54 A Wear Map For Reciprocating Compressors
Departments 4 Page 4 — Prepare For The New Norm
8 Global Perspective — Middle East Bucks Supply And Demand
10 Meetings & Events
12 About The Business — Compression Market Slowing Just As Feds Plan More Regulations
14 Monitoring Government — EPA Toughens Methane Leak Reporting
46 Prime Movers
64 Featured Products
68 Scheduled Downtime
69 Marketplace
70 Advertisers’ Index
72 Cornerstones Of Compression — Cooper-Bessemer GMX Integral Gas Engine Compressor
January-February 2015
Follow Us @Compressortech2
Cover Designed By Amanda Ryan
MEMBER OF BPA WORLDWIDE®PRINTED IN THE U.S.A.
MEMBER OF …
Compressortech 2 ( ISSN 1085-2468) Volume 20, No. 1 — Published 10 issues/year (January-February, March, April, May, June, July, August-September, October, November, December) by Diesel & Gas Turbine Publications, 20855 Watertown Road, Waukesha, WI 53186-1873, U.S.A. Subscription rates are $85.00 per year/$10.00 per copy worldwide. Periodicals post-age paid at Waukesha, WI 53186 and at addi-tional mailing offices. Copyright © 2015 Diesel & Gas Turbine Publications. All Rights Reserved. Materials protected by U.S. and international copy-right laws and treaties. Unauthorized duplication and publication is expressly prohibited. Canadian Publication Mail Agreement # 40035419. Return Undeliverable Canadian Addresses to: P.O. Box 456, Niagara Falls, ON L2E 6V2, Canada. E-mail: [email protected]. POSTMASTER: Send address changes to: Circulation Man ager, COMPRESSORtech2, 20855 Watertown Road, Suite 220, Waukesha, WI 53186-1873 U.S.A.
www.compressortech2.com
80celebrating
years
CT_JanFeb_TOC.indd 1 1/23/15 8:55 AM

DCL has long been obsessed with every detail of the research, design, engineering, manufacture and service of our emissions control products. Such vertical integration means we can also excel at the design and fabrication of unique, custom catalytic converters – more than 2,000 designs in a year, and each one a perfect fit, a result made possible by the use of advanced laser technology to cut raw steel by computer, instead of traditional, less accurate, methods. DCL technology puts us ahead of the pack so that our products can keep you in compliance. For longer, with less frequent replacement, less maintenance, fewer downtimes, and lower operating costs. DCL International produces advanced emissions control products which work superbly well in the real, industrial world – your world.
IN OUR FIELD, IT TAKES OBSESSIVE ATTENTION
TO DETAIL TO STAY AHEAD OF THE PACK.
AND DCL IS LIGHT YEARS AHEAD.
U N I T E D S T A T E S • C A N A D A • E U R O P E
1-877-965-8989 www.dcl-inc.com
DCL.indd 1 1/5/15 8:55 AM
JANUARY-FEBRUARY 2015 8 CompREssoRtech2
According to Business Monitor International (BMI), oil and gas production is forecasted to grow in the Middle East region, with oil output increasing from
an estimated 26.9 x 10⁶ bbl/d in 2014 to 29.9 x 10⁶ bbl/d by 2023. The 13% increase comes despite the precipitous fall in oil prices over the second half of 2014 and the expected new era of lower oil prices. In fact, many of the producers able to increase output, such as Saudi Arabia and Iraq, are doing so in the short term to support falling revenues from oil.
Over the longer term many of the big producers in the Middle East are sticking to their production development plans. Kuwait has reaffirmed its US$40 billion investment in the oil sector and is committed to increasing its production capacity to 4 million bbl/d by 2020. The UAE has not held back its efforts to reach its 3.5 x 10⁷ bbl/d target by 2019, while Saudi Arabia continues to pump at near-record levels.
BMI has downgraded Iraq’s long-term oil output based on curbed enthusiasm about the operating environment and profitability of the developments in Southern Iraq. Expansion phases on major oil fields are expected to be delayed at least until the security situation and price en-vironment improve. However, Iraq has restarted exports through Turkey via a pipeline link through the region of Kurdistan. This could add as much as 500,000 bbl/d in new exports from 2015 and opens up the potential to export even more.
Iran remains a wildcard, with increased gas output boost-ing its condensate production, raising liquids exports. Low-er oil prices could also put added pressure on Iran to broker a deal regarding its alleged nuclear program. A lifting of sanctions on oil exports after the next meeting in mid-2015 could quickly add around 300,000 to 500,000 bbl/d of oil to international markets, with an increase of as much as 1 mil-lion bbl/d over the next four to five years.
However, it should also be noted that some of these growth targets might be delayed or curtailed if OPEC de-cides to cut its production quotas over the coming years.
On the natural gas side, the Middle East gas production is set for growth, as the region looks to substitute the more costly and less efficient use of oil with gas. This is intended
to free up more oil for export. However, progress with gas projects has been slow and lower oil prices could see even less incentive to invest in gas.
Much of the gas in the Middle East is associated with oil, and few countries have developed sufficient infrastructure to collect and transport this resource to demand centers. Flaring continues to be used heavily to deal with associ-ated gas and is particularly abundant in Iran, Iraq and Saudi Arabia. Many countries in the Middle East do not have sep-arate regulations governing associated gas production, a major constraint on gas production growth, because of the lack of a clear reward for monetizing gas.
Non-associated gas will be the largest contributor to new gas output, particularly in Iran, and to a lesser extent Is-rael and Iraq. Despite the hindrance of sanctions on Iran’s oil and gas sector, Phase 12 development of the South Pars field was successfully brought online in 2014. Phases 15 and 16 are expected in 2015/2016 with further stages planned over the next six years, adding as much as 3.5 x 10¹⁰ cu.ft. (1 x 10¹¹ m3) of new output by 2023.
Israel is close to beginning development on its vast Levia-than field, which could produce in excess of 5.6 x 10⁸ cu.ft. (1.6 x 10¹⁰ m3) per year by 2020. The Kurdistan region of Iraq is progressing with a number of gas projects, which could see exports to Turkey by 2017. BMI forecasts natural gas production in the Middle East to increase 36% from 2014 to 2023, rising from 2.1 x 10¹⁰ cu.ft. (58.6 x 10¹¹ m3) to 2.8 x 10¹⁰ cu.ft. (79.8 x 10¹¹ m3).
While a strong growth in gas production is expected, BMI forecasts gas consumption to increase at an even stron-ger rate. Driving consumption growth will be the region’s burgeoning downstream sector and reorientation of the Middle East power sector toward gas-fired generation. Oil continues to be used in some dual-fuel power plants due to insufficient gas production, while some gas power facilities are idle or working at low capacity due to undersupply. Gas reinjection is also increasing to boost production from de-clining oil fields. BMI forecasts gas consumption to increase from an estimated 1.9 x 10¹⁰ cu.ft. (5.26 x 10⁸ m3) in 2014 to around 2.6 x 10¹⁰ cu.ft. (7.5 x 10¹¹ m3) by 2023, to support these developments. CT2
Middle East Bucks Supply And Demand >By ROBERTO CHELLINI
ASSOCIATE PUBLISHER
Global Perspective
Oil, gas production increasing despite low prices
CT506.indd 1 1/26/15 12:02 PM

THINK GERMAN, ACT LOCAL.OFFSHORE EXPERTISE NEEDED WHEN THE PRESSURE IS ON?
WE SUPPLY HIGH PRESSURE PROCESS GAS BELOW AND ABOVE THE SURFACE.We have a full range of reciprocating compressor systems that support beyond fit-for-offshore applications. Customized engineering and service expertise for seismic survey, oil exploration, LNG andFLNG or vent gas recovery on a rig are our strengths.We provide innovative solutions where others give up. Worldwide.
NEUMAN & ESSER GROUPwww.neuman-esser.comContact me for requests worldwide:Arno ThomasProduct [email protected] line: +49 2451-481-446
NEA GROUP Headquarters in Germany
COMPRESSOR SYSTEMSBLUESTROKE
Untitled-4 1 1/20/15 10:50 AM

Meetings & Events*Indicates shows and conferences in which Compressortech2 is participating
January-february 2015 10 Compressortech2
March 25-27*Offshore Mediterranean ConferenceRavenna, Italy+39 0544 219418www.omc.it
March 25-26Georgian International Oil, Gas, Infrastructure & Energy ConferenceTbilisi, Georgia+ 44 207 596 5000www.giogie.com
March 26-28*China International Offshore Oil & Gas ExhibitionBeijing+86 10 5823 6555www.ciooe.com.cn/2014/en/
March 31-April 2Offshore Asia Conference & Exhibition Kuala Lumpur, Malaysia+44 (0) 1992 656 651http://10times.com/offshore-asia
APRILApril 12-15*Gas Processors Association Annual Convention
FEBRUARYFeb. 15-18*Middle East Turbomachinery SymposiumDoha, Qatar+1 (979) 845-7417http://middleeastturbo.tamu.edu
Feb. 18-19*Gas/Electric Partnership ConferenceCypress, Texas+1 (713) 529-3216www.gaselectricpartnership.com
Feb. 22-25Laurance Reid Gas Conditioning ConferenceNorman, Oklahoma+1 (405) 325-3891www.ou.edu/outreach/engr/lrgcc_home.html
Feb. 23-24Kazakhstan Oil & Gas SummitAlmaty, Kazakhstan+44 207 127 4501www.kazakhstanogs.com
MARCHMarch 11-13Australasian Oil & Gas Conference
Perth, Western Australia+61 3 9261 4500www.aogexpo.com.au
March 16-19Nigeria Oil & Gas ConferenceAbuja, Nigeria+234 706 911 7347www.cwcnog.com
March 18-19Turkish International Oil and Gas ConferenceAnkara, Turkey44 020 7596 5000www.turoge.com
March 22-26*Sour Oil & Gas Advanced TechnologyAbu Dhabi, U.A.E.Tel: +971 2 674 4040Web: www.sogat.org
March 23-24*European Gas Transport & Storage SummitMunich+44 20 7202 7690www.gtsevent.com
possible.XperSEAL - the unique pressure packing for reciprocating compressors offers you:
� Compliance with environmental legislation � Increased reliability � Reduced operating costs
www.hoerbiger.com
E missionim
Hoerbiger.indd 1 1/20/15 10:24 AM
CT_JanFeb_m&e.indd 1 1/23/15 10:41 Am

January-february 2015 11 Compressortech2
San Antonio+1 (918) 493-3872www.gpaglobal.org
April 20-22*Gas Compressor Association Expo & ConferenceGalveston, Texas+1 (972) 518-0019www.gascompressor.org
April 27-30*Gulf South Rotating Machinery SymposiumBaton Rouge, Louisiana+1 (225) 578-4853www.gsrms.org
April 28-30 *Southwest Energy InstituteLiberal, Kansas+1 (620) 417-1170www.swenergyinstitute.org/
MAYMay 4-7*Offshore Technology Conference Houston+1 (972) 952-9494www.otcnet.org
MAY 12-14Oil & Gas UzbekistanTashkent, Uzbekistan+44 207 596 5144www.oguzbekistan.com
May 19-21*Eastern Gas Compression RoundtablePittsburgh+1 (412) 372-4301www.egcr.org
May 19-21*Sensor+TestNuremberg, Germany+49 5033 9639-0www.sensor-test.de
JUNEJune 1-5*WGC World Gas Conference 2015 Pariswww.wgc-paris2015.com/
June 2-5Caspian Oil & GasBaku, Azerbaijan+44 207 596 5000www.caspianoil-gas.com
June 9-11*Power-Gen EuropeAmsterdam+44 1992 656 617www.powergeneurope.com
June 9-11*Global Petroleum ShowCalgary, Alberta, Canada+1 (403) 209-3555http://globalpetroleumshow.com
June 9-11Sensors Expo & ConferenceLong Beach, California+1 (617) 219-8375www.sensorsmag.com/sensors-expo
June 15-19*Achema 2015Frankfurt am Main, Germany+49 69 7564-100www.achema.de
June 15-19*ASME Turbo ExpoMontreal+1 (404) 847-0072http://www.asmeconferences.org/TE2015/
For a complete listing of upcoming events, please visit our website at www.compressortech2.com/events/
possible.XperSEAL - the unique pressure packing for reciprocating compressors offers you:
� Compliance with environmental legislation � Increased reliability � Reduced operating costs
www.hoerbiger.com
E missionim
Hoerbiger.indd 2 1/20/15 10:24 AM
CT_JanFeb_M&E.indd 2 1/23/15 10:41 AM
january-february 2015 12 Compressortech2
Production of domestic oil, gas and natural gas liq-uids grew much faster than demand throughout 2014. Now, the oil and gas industry is suffering from
its outstanding success in developing shale resources as prices plummet. Does this mean that the demand for gas compression will fall off the cliff?
None of the indicators are encouraging. Crude oil prices, which affect the demand for gas lift compressors, are down more than 50% in the last six months, to the lowest level in six years. Natural gas prices are down 36% in the same period, dipping below US$3/MMBtu, the lowest price in two years. And gas storage levels, which had been tracking well below average for more than a year, caught up with the five-year average in early January. Production of natural gas liquids is also below demand levels, as average daily field condensate output has grown 166% since 2009.
Some drillers have already reduced budgets for 2015, while others have borrowed for expansion, but are losing money, said an early January report by Bloomberg. Drilling was slowing down even before prices fell to US$70/bbl. One report showed new well permits on 12 major shale plays fell by 15% in October, with Eagle Ford down 22%. The most current Texas Railroad Commission report showed new drilling permits in November were down 46% for gas and 57% for oil from October. In December, a Wood Mackenzie report said that new exploration and production initiatives will be cut by at least 37% compared to 2014. With current prices below US$50/bbl in mid-January, most analysts are now predicting oil prices will stay below US$60/bbl through most of 2015. This comes just as Gulf of Mexico production was beginning to recover.
The industry enters 2015 with more uncertainty than it has experienced since 2009. The low prices will reduce demand for compressors for upstream wellhead and some midstream gas processing applications; however, it may not affect the demand for pipeline compressors unless pric-es stay low for an extended period.
Adding to the angst, The Wall Street Journal reported at year-end that at least nine federal regulations governing the oil and natural gas industry are expected to be issued by the Obama administration in the coming months. The im-pending rules would regulate methane emissions, hydraulic fracturing, Arctic drilling, oil-by-rail transportation and off-shore drilling technology, among other things. One that will directly impact the gas compression industry is the initiative to increase compressor efficiency. By the end of 2014, the U.S. Department of Energy (DOE) was to determine what, if any, regulations should be recommended.
The Energy Policy and Conservation Act of 1975 estab-lished an energy conservation program for certain com-mercial and industrial equipment. The DOE maintains that this program authorizes them to issue standards, test pro-cedures and labeling requirements for gas compressors. Accordingly, DOE is exploring the energy-savings oppor-tunities for natural gas compressors and is trying to estab-lish which, if any, compressors could be regulated. It is also investigating energy-saving opportunities throughout the natural gas supply chain — gathering, processing, trans-mission and storage.
If standards are adopted, manufacturers must use a DOE-prescribed test procedure to establish compliance and make representations of energy efficiency for gas compres-sors. DOE would also use the established test procedure to subsequently verify the performance of covered equipment.
Moving quickly but without wide publicity within the gas compression industry, DOE issued a request of information on Aug. 5, 2014, and received comments from interested parties (who were aware of the request). On Nov. 12-13, the DOE held a Workshop on Natural Gas Infrastructure R&D and Methane Emissions Mitigation, much of which focused on compressors. Just before the holidays on Dec. 17, DOE held a public meeting on the potential Energy Conservation Program for Gas Compressors. At that meeting, further com-ments were invited by a Jan. 12, 2015, deadline.
The DOE initiative is progressing rapidly, and it could significantly change the way the compression industry op-erates. Improving efficiency is a commendable objective, but the industry needs to stay engaged to ensure that any regulations are practical and not cost-prohibitive. CT2
Compression Market Slowing Just As Feds Plan More Regulations > By NORM ShADE
About The Business
Depressed oil, gas and liquids prices and potential new regulations dampen 2015 outlook
Norm Shade is senior consultant and president emeritus of ACI Services Inc. of Cambridge, Ohio. A 45-year veteran of the gas compression industry, he has written numerous papers and is active in the major industry associations.
CT505.indd 1 1/26/15 12:11 PM

Make it faster. Make it smaller. Make it better.
Make it yours.
Bringing energy and the environment into harmony.®
Rotating equipment solutions that generate the results you want.When you have a challenge out there in the fi eld, you want your solution, not someone else’s. And that’s precisely what you get with Dresser-Rand. That’s because our experts will work hand in hand with your experts to create a solution that’s exclusively yours. One that not only makes sense, but makes a diff erence for your business. To see how we’ve helped some of the biggest names in the industry achieve their goals, visit dresser-rand.com/yours
DresserRand.indd 1 1/20/15 11:14 AM
JANUARY-FEBRUARY 2015 14 CompREssoRtech2
New rules would improve data on greenhouse gas emissions
BY PATRICK CROW
EPA Toughens Methane Leak Reporting >
Both the U.S. Environmental Protection Agency (EPA) and the Department of Energy (DOE) have initiatives underway that would impact the compression sector.
As part of an effort to cut greenhouse emissions, EPA has been exploring how it could reduce methane emissions by requiring improved vapor recovery and the periodic replace-ment of piston rod packings (COMPRESSORtech2, July 2014, p. 12).
The DOE is planning a regulation to establish energy effi-ciency standards for new gas compressors and mandate the upgrading of inefficient ones (COMPRESSORtech2, October 2014, p. 12).
Now the EPA has attacked the methane leak issue from another angle, ordering tighter compliance in the reporting of emissions.
Under the Greenhouse Gas Reporting Program (GHGRP), companies must detail their emissions. EPA just effectuated a rule that revises 40 C.F.R. 98, subpart W. It requires com-panies to use more standardized monitoring methods and retires the use of some “best available monitoring methods” that critics had claimed were unreliable.
Rather than just report their cumulative greenhouse gas emissions in carbon dioxide equivalent units, companies now must also prepare separate reports for methane, carbon di-oxide and nitrous oxide.
The reportable emissions would include those from en-gines, boilers, heaters, flares and separation and process-ing equipment. The revisions would allow the use of optical gas imaging to detect compressor leaks.
The agency said the revisions, which it depicted as techni-cal or clarifying, not only would provide greater flexibility but also reduce the reporting burden on industry — while improv-ing the clarity of the calculation and reporting requirements.
Separately, EPA disclosed a proposed rule that would mandate the reporting of even more GHGRP data. For the first time, companies would report methane leaks from gas gathering and boosting systems that move gas from the wellhead to a pipeline or processing plant, and emissions from pipeline blowdowns between compressor stations.
The agency will consider public comments on the planned regulation and issue a final rule on Jan. 1, 2016.
The Interstate Natural Gas Association of America (INGAA)
noted that its members have made great strides in reducing methane releases, citing a study showing that the transmis-sion industry had reduced the number of leaks 94% over the past three decades.
INGAA President and CEO Don Santa stressed that blowdowns are a critical and necessary component of pipe-line construction and maintenance activities. He said the Pipeline and Hazardous Materials Safety Administration should reduce the number of occasions when pipeline in-spection requirements necessitate blowdowns.
“We believe it’s important for EPA and all parties to get a better idea of both the volume of methane being released in the atmosphere and the sources of those releases, and these additions to the subpart W reporting program could help, depending on the methodology by which EPA collects that information,” Santa said.
The American Petroleum Institute (API) said GHGRP data show that methane emissions from gas systems fell 17% from 1990 to 2012 while gas production grew 37%.
API said methane emissions requirements should not be changed until existing rules can be fully implemented and measurements can reflect tighter standards. “If any chang-es are made, they need to ensure they do not compromise safety and can be achieved cost effectively with adequate lead times,” API said.
Energy in Depth — a public outreach campaign spon-sored by the Independent Petroleum Association of America — said GHGRP data show that methane emissions from some of the most prolific shale plays plunged between 2011 and 2013.
“For example, in the basins that include the Utica and Marcellus shales, methane emissions fell by 55 and 10%, re-spectively. The San Juan Basin — an area that anti-fracking activists have claimed has rising emissions — actually re-duced methane emissions by 6%,” it said.
“In the Anadarko Basin — which includes portions of western Oklahoma, one of the top oil and gas producing states — methane emissions decreased by 34%. Substan-tial reductions have also been achieved in Texas, which is leading the United States in oil and gas production. In the Permian and Gulf Coast basins, methane emissions de-creased by 9 and 18% respectively.” CT2
Monitoring Government
CT503.indd 1 1/22/15 3:12 PM
MACHINERY ANALYS IS
Keeping it running smoothly since 1967BETAMACHINERY.COM
BETA.indd 1 9/18/13 11:16 AM
Historically, compressor and pump units in the oil and gas industry have been driven by reciprocating internal combustion engines of many types. In the
last 50 years, gas turbines have become more common in these markets.
In recent years, the microturbine has gained a toehold as an electrical generator. This paper describes the advantages of the two-shaft microturbine for direct-drive applications.
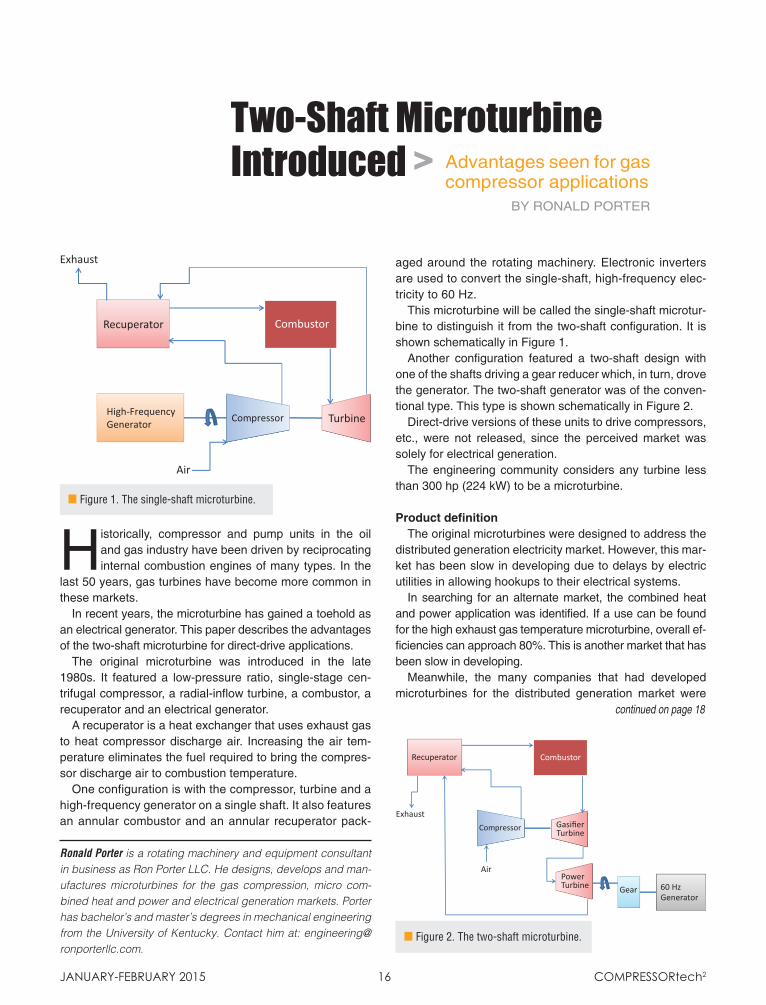
The original microturbine was introduced in the late 1980s. It featured a low-pressure ratio, single-stage cen-trifugal compressor, a radial-inflow turbine, a combustor, a recuperator and an electrical generator.
A recuperator is a heat exchanger that uses exhaust gas to heat compressor discharge air. Increasing the air tem-perature eliminates the fuel required to bring the compres-sor discharge air to combustion temperature.
One configuration is with the compressor, turbine and a high-frequency generator on a single shaft. It also features an annular combustor and an annular recuperator pack-
aged around the rotating machinery. Electronic inverters are used to convert the single-shaft, high-frequency elec-tricity to 60 Hz.
This microturbine will be called the single-shaft microtur-bine to distinguish it from the two-shaft configuration. It is shown schematically in Figure 1.
Another configuration featured a two-shaft design with one of the shafts driving a gear reducer which, in turn, drove the generator. The two-shaft generator was of the conven-tional type. This type is shown schematically in Figure 2.
Direct-drive versions of these units to drive compressors, etc., were not released, since the perceived market was solely for electrical generation.
The engineering community considers any turbine less than 300 hp (224 kW) to be a microturbine.
Product definitionThe original microturbines were designed to address the
distributed generation electricity market. However, this mar-ket has been slow in developing due to delays by electric utilities in allowing hookups to their electrical systems.
In searching for an alternate market, the combined heat and power application was identified. If a use can be found for the high exhaust gas temperature microturbine, overall ef-ficiencies can approach 80%. This is another market that has been slow in developing.
Meanwhile, the many companies that had developed microturbines for the distributed generation market were
Two-Shaft Microturbine Introduced > Advantages seen for gas
compressor applicationsBy ROnAlD PORTER
n Figure 1. The single-shaft microturbine.
Ronald Porter is a rotating machinery and equipment consultant in business as Ron Porter LLC. He designs, develops and man-ufactures microturbines for the gas compression, micro com-bined heat and power and electrical generation markets. Porter has bachelor’s and master’s degrees in mechanical engineering from the University of Kentucky. Contact him at: [email protected].
january-february 2015 16 Compressortech2
n Figure 2. The two-shaft microturbine.
Air
Compressor
Turbine
High-Frequency Generator
Combustor
Recuperator
Exhaust
Air
Compressor
Gasifier Turbine
Combustor
Recuperator
Exhaust
Power Turbine
60 Hz Generator
Gear
continued on page 18
CT502.indd 1 1/22/15 3:15 PM
www.cookcompression.com
See What’s Happening at Cook Now
It’s time to make cylinder repair better and simpler. To assure quality. Streamline procurement. Shorten schedules.And seize maximum value. It’s time to call Cook.
Cook Compression Service Centers give you turnkeycylinder support. We reline, re-size and perform all related repairs. For unlined cylinders, we offer incredibly durable PlasKote50+®
coating. Plus much more.
From hydro testing and recertification to clearance tuning andadvanced sealing component technologies, you get everythingyou need to not only restore, but improve performance.
One Sourcefor Cylinder
Service
Cook.indd 1 1/23/15 11:28 AM
foundering due to lack of sales. As a result, the industry has consolidated to just a handful of manufacturers worldwide.
In recent years, with the advent of fracking and increased natural gas production, the microturbine has found a home as a source of electricity in the oil and gas industry. How-ever, the current equipment cannot drive the equipment di-rectly per historical practice.
An electrical system is required to connect the current mi-croturbines to the driven equipment. This requires addition-al expense for the equipment user in the form of an electric motor to drive the load and wiring to connect the generator and the load. In addition, some losses are incurred in con-verting mechanical power to electrical power and then back to mechanical power.
There is an apparent need for a two-shaft, direct-drive microturbine for the oil and gas market. This unit is similar to that shown in Figure 2, except the generator is replaced with a directly driven load. The load can be a compressor, pump or any other device requiring shaft power.
The two-shaft arrangement has a key advantage for compression, pump and other direct-drive applications. It develops its peak torque when the power turbine is at rest whereas the single-shaft arrangement does not develop its peak torque until rated speed is reached.
On a single-shaft generator the load is not applied until the unit is at full speed. This is why the two-shaft arrange-ment dominates the machinery drives whereas the single-shaft arrangement is used primarily for electrical generation.
The explanation is that the first of the two shafts sole responsibility is to generate hot gas. Therefore, it only in-cludes the compressor and the turbine required to drive the compressor. The second of the two shafts is solely respon-sible for producing power to drive a load. These two shafts are called the gasifier turbine shaft and the power turbine shaft, respectively.
DescriptionThe two-shaft, direct-drive microturbine described here is
available from 30 to 150 hp (22.4 to 112 kW) with plans to grow the unit to 300 hp (224 kW) as the need arises.
january-february 2015 18 Compressortech2
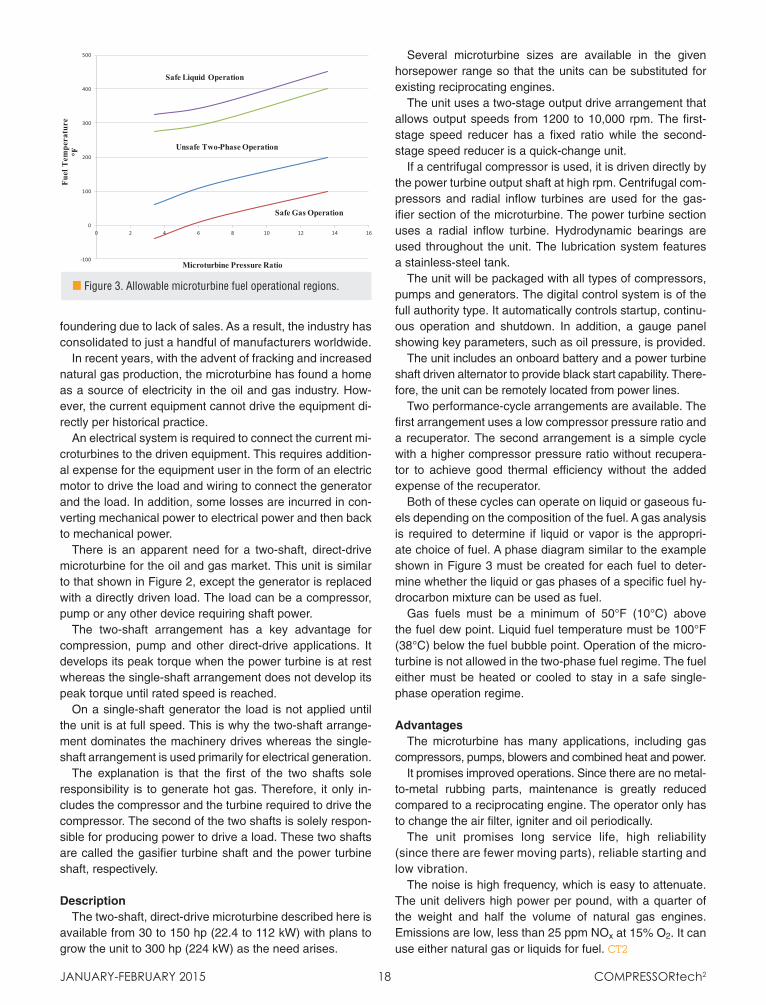
n Figure 3. Allowable microturbine fuel operational regions.
Several microturbine sizes are available in the given horsepower range so that the units can be substituted for existing reciprocating engines.
The unit uses a two-stage output drive arrangement that allows output speeds from 1200 to 10,000 rpm. The first-stage speed reducer has a fixed ratio while the second-stage speed reducer is a quick-change unit.
If a centrifugal compressor is used, it is driven directly by the power turbine output shaft at high rpm. Centrifugal com-pressors and radial inflow turbines are used for the gas-ifier section of the microturbine. The power turbine section uses a radial inflow turbine. Hydrodynamic bearings are used throughout the unit. The lubrication system features a stainless-steel tank.
The unit will be packaged with all types of compressors, pumps and generators. The digital control system is of the full authority type. It automatically controls startup, continu-ous operation and shutdown. In addition, a gauge panel showing key parameters, such as oil pressure, is provided.
The unit includes an onboard battery and a power turbine shaft driven alternator to provide black start capability. There-fore, the unit can be remotely located from power lines.
Two performance-cycle arrangements are available. The first arrangement uses a low compressor pressure ratio and a recuperator. The second arrangement is a simple cycle with a higher compressor pressure ratio without recupera-tor to achieve good thermal efficiency without the added expense of the recuperator.
Both of these cycles can operate on liquid or gaseous fu-els depending on the composition of the fuel. A gas analysis is required to determine if liquid or vapor is the appropri-ate choice of fuel. A phase diagram similar to the example shown in Figure 3 must be created for each fuel to deter-mine whether the liquid or gas phases of a specific fuel hy-drocarbon mixture can be used as fuel.
Gas fuels must be a minimum of 50°F (10°C) above the fuel dew point. Liquid fuel temperature must be 100°F (38°C) below the fuel bubble point. Operation of the micro-turbine is not allowed in the two-phase fuel regime. The fuel either must be heated or cooled to stay in a safe single-phase operation regime.
Advantages The microturbine has many applications, including gas
compressors, pumps, blowers and combined heat and power.It promises improved operations. Since there are no metal-
to-metal rubbing parts, maintenance is greatly reduced compared to a reciprocating engine. The operator only has to change the air filter, igniter and oil periodically.
The unit promises long service life, high reliability (since there are fewer moving parts), reliable starting and low vibration.
The noise is high frequency, which is easy to attenuate. The unit delivers high power per pound, with a quarter of the weight and half the volume of natural gas engines. Emissions are low, less than 25 ppm NOx at 15% O2. It can use either natural gas or liquids for fuel. CT2
-100
0
100
200
300
400
500
0 2 4 6 8 10 12 14 16
Microturbine Pressure Ratio
Bubble Point Bubble Point Margin Dew Point Dew Point Margin
Safe Liquid Operation
Safe Gas Operation
Unsafe Two-Phase Operation
Fuel
Tem
pera
ture
°F
CT502.indd 2 1/26/15 12:12 PM

ACTIVEMAGNETICBEARING
A magnetic bearing system as individual as your applicationsThe bearing supports used in complex machine designs demand highly-dynamic solutions, and that is where the FAG Active Magnetic Bearing’s robustness and reliability make it the number one choice.
One feature more than any other makes it unique worldwide: The standardized power control systems and power electronics from the drive technology sector.
The system also includes perfectly matched magnetic and back-up bearings and provides a solution that allows individual applications to be implemented with maximum variability. We additionally provide comprehensive support after installation with a range of service modules such as remote monitoring via condition monitoring.
Contact us to fi nd out more about our bearing and system solutions [email protected] · www.schaeffler.com
9160
01
Schaeffler.indd 1 1/15/15 9:31 AM
Traditionally, large liquid natural gas (LNG) plants feature gas turbine-driven refrigerating com-
pressor trains. The only plant in opera-tion pioneering the electric solution is at Hammerfest on the Norwegian Isle of Melkøya, near the Arctic Circle.
However, a shift toward the electri-cal solution, for both offshore (float-ing liquefied natural gas [FLNG]) and land-based plants is to be expected.
The selection of gas turbine drives, at the beginning of the heavy-duty type then paralleled with aeroderivative units, was mainly dictated by the lack of a referenced alternative solution due to the unitary power requested by the refrigerating compressor trains.
Now, with the development of reli-able high-power/high-speed variable-speed drive systems (VSDSs), the bottleneck toward the all-electrical solution has vanished. These VS-DSs are composed of large variable-frequency drives (VFDs) that allow speed variation of high-power/high-speed motors (up to 134,102 hp [100 MW]) directly coupled to the main refrigerant compressors.
Gas turbines dictate an LNG plants’ capacity, since only certain sizes are available on the market. However, electric motors can be built to match any power requirement, and they have more flexibility and can be se-lected according to plant needs.
Gas turbines have to be operated at rated speed (±5%), whereas VFD electric motors allow a wider speed variation than that required by the driven compressors. A gas turbine’s efficiency seldom reaches 40%, but VFDs can go over 90% with conse-quent pollution reduction. Consider-ing the whole LNG plant, including the power generation, a traditional gas turbine-driven cycle performs at 25 to 30% of efficiency, while an eLNG (electric LNG) operates at about 40%.
The electrical solution has the addi-tional environmental advantage of hav-ing no NOx emissions. Also, by adopt-ing the gas turbines in generation mode
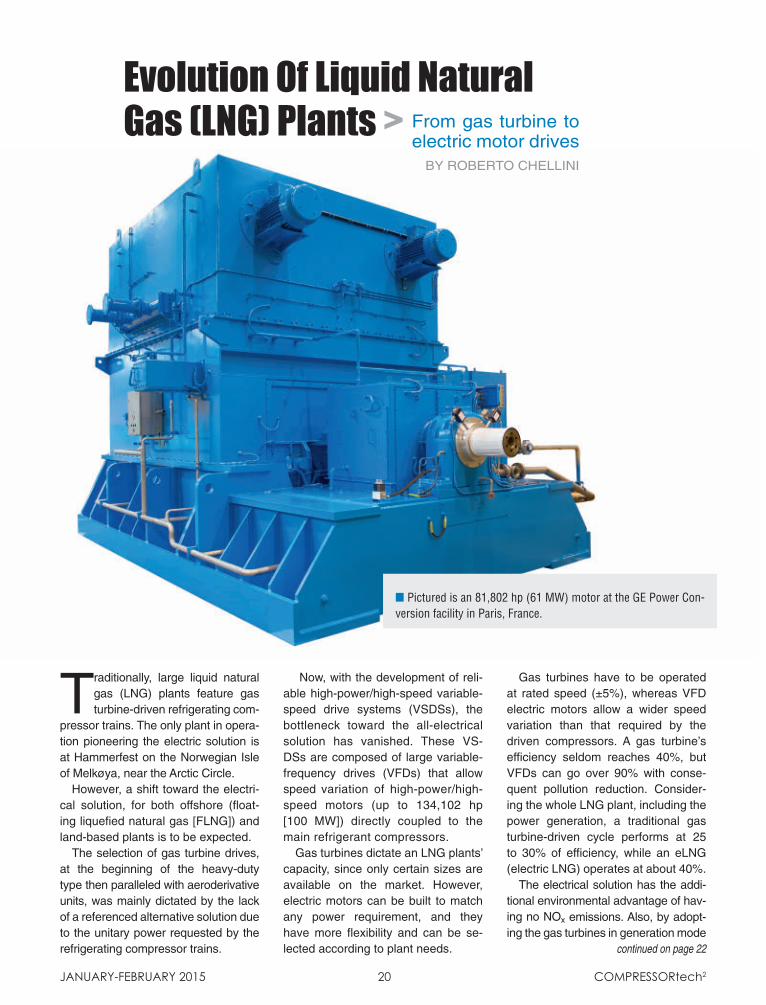
Evolution Of Liquid Natural Gas (LNG) Plants > From gas turbine to
electric motor drivesBy ROBeRTO CHeLLINI
n Pictured is an 81,802 hp (61 MW) motor at the GE Power Con-version facility in Paris, France.
January-February 2015 20 Compressortech2
continued on page 22
CT514.indd 1 1/26/15 12:17 PM

Harsco Air-X-Changers: Look familiar? Small wonder. A long list of industry standards started out as
Air-X-Changers fi rsts. But don’t be fooled by appearances. In performance and reliability, look-alikes don’t
measure up. Spec the original. Spec the best. Call 918-619-8000 (USA) today. Or visit harscoaxc.com
Insight onsite.™
Harsco.indd 1 1/20/15 1:38 PM
(fixed speed, close to the full power level), it is the most effective in terms of pollution reduction.
Gas turbines have to be stopped for maintenance at well-defined intervals (every two years) while an electric mo-tor can run continuously for five to six years. Maintenance cost of a gas tur-bine is at least 10 times greater than a variable speed electric motor. Also operability, flexibility and reliability are greater in an eLNG than in a conven-tional gas turbine-driven LNG plant.
Controls of an eLNG are simplified and operating flexibility is increased.
In round figures, if a gas turbine-driven LNG plant of 5 MTA can pro-duce down to 4.8 MTA with the speed variation allowed by the motor-driven compressors, it is possible to operate the plant down to at least 4.2 MTA.
Another important feature is the start/stop sequence. The all-electric solution eliminates the use of a starting/helper motor. The refrigerating trains can also be started up at the settling out pres-sure without any addition to the plant blowout preventer (BOP).
Development of the electric hardware
GE Oil & Gas has been involved in the Freeport eLNG project with its power conversion division, which has implemented the electric part,
as well as its oil and gas division, which has tailored its refrigerating compressors to better match the vari-able speed motors.
From the motor design point of view the solution was very easy. Construc-tion of a motor is derived from the construction of a turbogenerator of the same size. What appears to be the real breakthrough is the development of high-power drives (VFDs), which, assembled in a parallel arrangement, allow electric motors to be powered up to 134,102 hp (100 MW).
These high-power VFDs can be assembled in a so-called E-house formed by a cabinet containing the switchgear and the motor control cen-ter (MCC). Such a package can be transported fully assembled and can be installed easily on site.
The 100,576 hp (75 MW) electric motors and VFDs built for the Free-port eLNG are the largest built to date in the oil and gas industry, claims GE Oil and Gas.
Development of the refrigerating compressors
Main refrigerant compression trains developed by GE Oil & Gas have been designed by making use of the very large experience gained in the last 35 years done with all existing liq-uefaction processes and drivers: from
gas turbines to steam turbines and electric motors.
The key to success for these LNG plants is the integration of the differ-ent components and the capability to predict how each of them is going to interact mutually. Through the years, GE Oil & Gas has developed and tuned its codes to predict the dynamic behavior of these trains both on the gas side and with mechanical interac-tion. This is particularly important for electric motor-driven compressors (ei-ther as main drivers or as helpers) for the well-known interharmonic effects generated by the motor and the pos-sible mechanical excitations resulting on the train (subsynchronous interac-tion [SSI], subsynchronous torsional interaction [SSTI]).
On the compressor side, GE Oil & Gas has leveraged the huge experi-ence gained along these 35 years. Key elements for the success of these machines are as follows:
• Aerodynamic design and top per-formance are provided even in the presence of very large side streams (and associated flow dis-torsions) and high Mach numbers.
• Very large performance curves guarantee a high level of operabil-ity, even in the presence of very limited speed variation (like with heavy duty gas turbines).
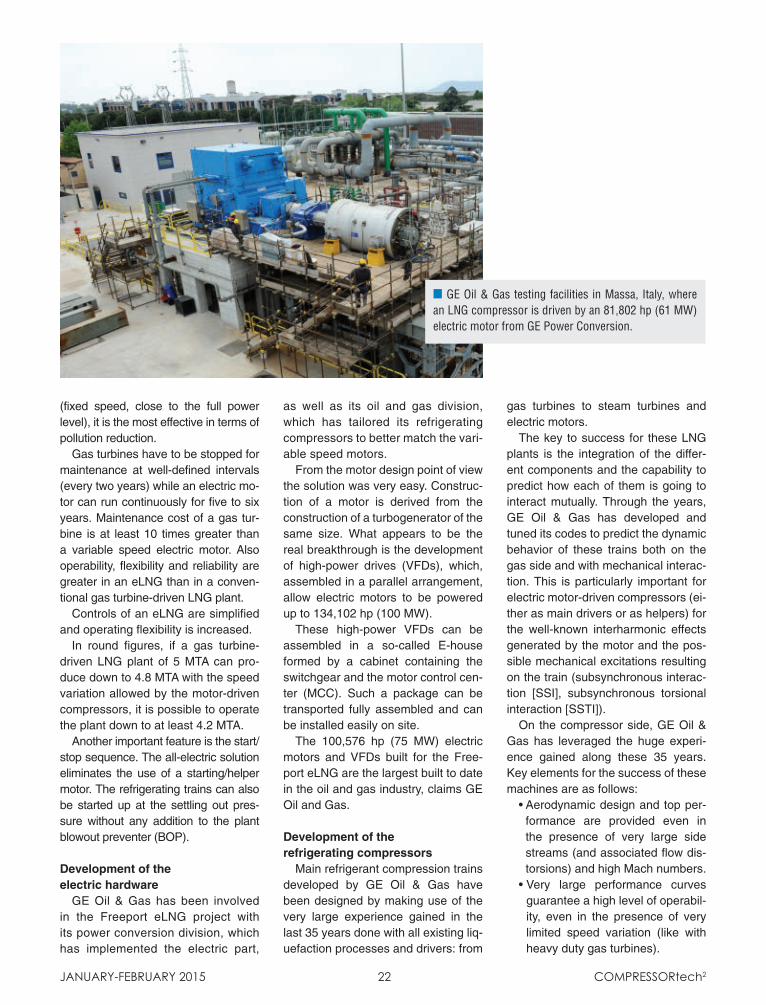
January-February 2015 22 Compressortech2
n GE Oil & Gas testing facilities in Massa, Italy, where an LNG compressor is driven by an 81,802 hp (61 MW) electric motor from GE Power Conversion.
CT514.indd 2 1/23/15 11:05 AM
• Top predictability of performance has been continuously tuned for 35 years, leveraging either string tests or field data.
• Robust rotordynamics are provided by a long shaft and very large pow-ers (above 134,102 hp [100 MW]).
• Large impellers, diaphragms and casings are well designed and man-ufactured (either horizontally split or barrel type), with proven experience at impeller diameters close to 78 in. (2000 mm) and casing diameters up to 141 in. (3600 mm).
• No leakage is ensured from cas-ings even on horizontally split con-figurations and with no gaskets.
• There is full agreement between drawings and manufactured piec-es: single piece numerically con-trolled processes.
• Unique testing capability provides performance at type one string tests above 147,512 hp (110 MW).
Freeport eLNGFor the earlier-mentioned reasons
and the presence of adequate electric
infrastructure, the Freeport LNG Ex-pansion LP (Freeport LNG) site has been selected as the eLNG solution for its three Freeport 4.64 MTA LNG lines.
Freeport LNG awarded contracts to a joint venture between CB&I and Zachry Industrial to construct the initial two trains of the liquefaction project. Air Products and Chemicals Inc. will pro-vide the process license as well as two main coil wound heat exchangers and the associated equipment and technol-ogy. GE Power Conversion will provide the whole electrical equipment includ-ing the motors, the variable frequency drives and all the control systems. GE Oil & Gas have been awarded with the supply of the propane and mixed re-frigerant centrifugal compressor trains. The two GE businesses are working in close cooperation to obtain the best match between the two main compo-nents of the refrigerating trains.
The Freeport plant is located near a petrochemical complex and not far from a nuclear power plant. The electric power is sourced from the grid. GE Power Conversion has con-
sulted GE Power & Water to analyze grid properties and suppression of all harmonics produced by the VFD that otherwise could create serious issues to the surrounding plants. The risk assessment was done in con-junction with the customer in a very transparent way, and the customer considered the analysis of the grid stability issue as an added value to the supply. In particular, the integra-tion of the eLNG plant with the grid, the evaluation and mitigation of the pollution and the SSTI risk of the en-tire electromechanical system were assessed. A full torsional analysis of the shaft lines was also performed. All these were done to ensure that the production schedule of the eLNG plants would not be interfered.
The whole production capacity of the three liquefaction trains has been contracted under use-or-pay liquefac-tion tolling agreements with Osaka Gas Co. Ltd., Chubu Electric Power Co., BP Energy Co., Toshiba Corp. and SK E&S LNG LLC (a subsidiary of SK Holdings Co. Ltd.). CT2
ACI Services, Inc. • Cambridge, Ohio • www.ACIServicesInc.com • (740) 435-0240
Radial Valves
Radial Deactivator
Rotavator™
Single Deck Valves
Higher efficiency means dollars saved. The ACI team of Compression Experts developed new, radial poppet valve and capacity control technology to manage capacity, reduce fuel consumption, lower emissions and increase overall revenue. Call the ACI Compression Experts today for more information on the next generation valve technology.
ACI.indd 1 6/11/12 3:00 PMCT514.indd 3 1/23/15 11:05 AM
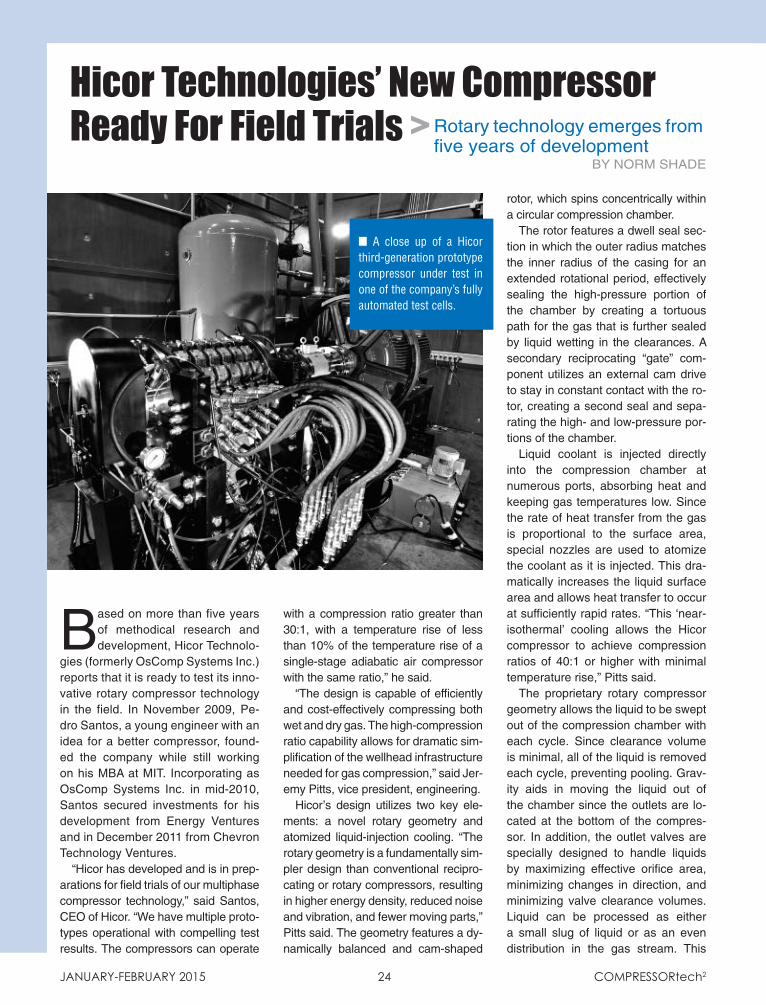
Based on more than five years of methodical research and development, Hicor Technolo-
gies (formerly OsComp Systems Inc.) reports that it is ready to test its inno-vative rotary compressor technology in the field. In November 2009, Pe-dro Santos, a young engineer with an idea for a better compressor, found-ed the company while still working on his MBA at MIT. Incorporating as OsComp Systems Inc. in mid-2010, Santos secured investments for his development from Energy Ventures and in December 2011 from Chevron Technology Ventures.
“Hicor has developed and is in prep-arations for field trials of our multiphase compressor technology,” said Santos, CEO of Hicor. “We have multiple proto-types operational with compelling test results. The compressors can operate
Hicor Technologies’ New Compressor Ready For Field Trials > Rotary technology emerges from
five years of development
january-february 2015 24 Compressortech2
n A close up of a Hicor third-generation prototype compressor under test in one of the company’s fully automated test cells.
rotor, which spins concentrically within a circular compression chamber.
The rotor features a dwell seal sec-tion in which the outer radius matches the inner radius of the casing for an extended rotational period, effectively sealing the high-pressure portion of the chamber by creating a tortuous path for the gas that is further sealed by liquid wetting in the clearances. A secondary reciprocating “gate” com-ponent utilizes an external cam drive to stay in constant contact with the ro-tor, creating a second seal and sepa-rating the high- and low-pressure por-tions of the chamber.
Liquid coolant is injected directly into the compression chamber at numerous ports, absorbing heat and keeping gas temperatures low. Since the rate of heat transfer from the gas is proportional to the surface area, special nozzles are used to atomize the coolant as it is injected. This dra-matically increases the liquid surface area and allows heat transfer to occur at sufficiently rapid rates. “This ‘near-isothermal’ cooling allows the Hicor compressor to achieve compression ratios of 40:1 or higher with minimal temperature rise,” Pitts said.
The proprietary rotary compressor geometry allows the liquid to be swept out of the compression chamber with each cycle. Since clearance volume is minimal, all of the liquid is removed each cycle, preventing pooling. Grav-ity aids in moving the liquid out of the chamber since the outlets are lo-cated at the bottom of the compres-sor. In addition, the outlet valves are specially designed to handle liquids by maximizing effective orifice area, minimizing changes in direction, and minimizing valve clearance volumes. Liquid can be processed as either a small slug of liquid or as an even distribution in the gas stream. This
By NORM SHADE
with a compression ratio greater than 30:1, with a temperature rise of less than 10% of the temperature rise of a single-stage adiabatic air compressor with the same ratio,” he said.
“The design is capable of efficiently and cost-effectively compressing both wet and dry gas. The high-compression ratio capability allows for dramatic sim-plification of the wellhead infrastructure needed for gas compression,” said Jer-emy Pitts, vice president, engineering.
Hicor’s design utilizes two key ele-ments: a novel rotary geometry and atomized liquid-injection cooling. “The rotary geometry is a fundamentally sim-pler design than conventional recipro-cating or rotary compressors, resulting in higher energy density, reduced noise and vibration, and fewer moving parts,” Pitts said. The geometry features a dy-namically balanced and cam-shaped
CT504_New.indd 1 1/22/15 3:32 PM
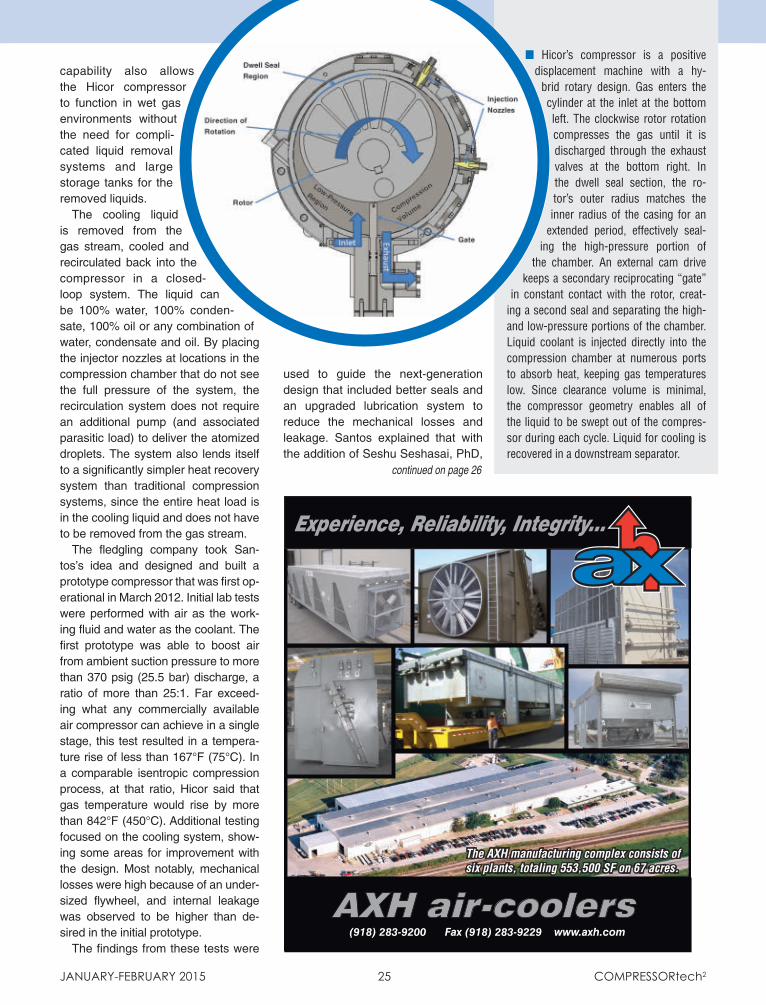
n Hicor’s compressor is a positive displacement machine with a hy-
brid rotary design. Gas enters the cylinder at the inlet at the bottom left. The clockwise rotor rotation compresses the gas until it is discharged through the exhaust valves at the bottom right. In the dwell seal section, the ro-tor’s outer radius matches the inner radius of the casing for an
extended period, effectively seal-ing the high-pressure portion of
the chamber. An external cam drive keeps a secondary reciprocating “gate”
in constant contact with the rotor, creat-ing a second seal and separating the high- and low-pressure portions of the chamber. Liquid coolant is injected directly into the compression chamber at numerous ports to absorb heat, keeping gas temperatures low. Since clearance volume is minimal, the compressor geometry enables all of the liquid to be swept out of the compres-sor during each cycle. Liquid for cooling is recovered in a downstream separator.
capability also allows the Hicor compressor to function in wet gas environments without the need for compli-cated liquid removal systems and large storage tanks for the removed liquids.
The cooling liquid is removed from the gas stream, cooled and recirculated back into the compressor in a closed-loop system. The liquid can be 100% water, 100% conden-sate, 100% oil or any combination of water, condensate and oil. By placing the injector nozzles at locations in the compression chamber that do not see the full pressure of the system, the recirculation system does not require an additional pump (and associated parasitic load) to deliver the atomized droplets. The system also lends itself to a significantly simpler heat recovery system than traditional compression systems, since the entire heat load is in the cooling liquid and does not have to be removed from the gas stream.
The fledgling company took San-tos’s idea and designed and built a prototype compressor that was first op-erational in March 2012. Initial lab tests were performed with air as the work-ing fluid and water as the coolant. The first prototype was able to boost air from ambient suction pressure to more than 370 psig (25.5 bar) discharge, a ratio of more than 25:1. Far exceed-ing what any commercially available air compressor can achieve in a single stage, this test resulted in a tempera-ture rise of less than 167°F (75°C). In a comparable isentropic compression process, at that ratio, Hicor said that gas temperature would rise by more than 842°F (450°C). Additional testing focused on the cooling system, show-ing some areas for improvement with the design. Most notably, mechanical losses were high because of an under-sized flywheel, and internal leakage was observed to be higher than de-sired in the initial prototype.
The findings from these tests were
used to guide the next-generation design that included better seals and an upgraded lubrication system to reduce the mechanical losses and leakage. Santos explained that with the addition of Seshu Seshasai, PhD,
january-february 2015 25 Compressortech2
(918) 283-9200 Fax (918) 283-9229 www.axh.com
Experience, Reliability, Integrity...
The AXH manufacturing complex consists of six plants, totaling 553,500 SF on 67 acres.
AXH.indd 1 12/3/14 9:42 AM
continued on page 26
CT504_New.indd 2 1/22/15 3:32 PM
chief technology officer, in mid-2012, the team’s manufacturing and testing competencies were upgraded. Having previously led engineering and tech-nology at several firms, including Tex-tron, with subsidiaries Bell Helicopter and Cessna Aircraft, Seshasai led the development of the next-generation Hicor compressor design.
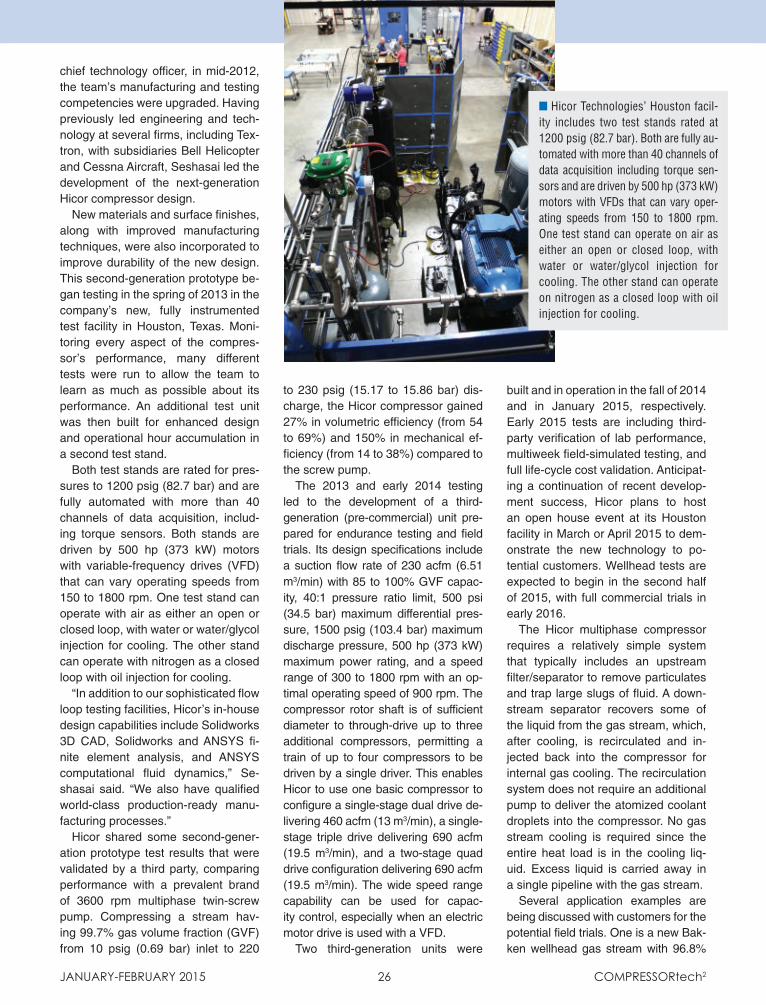
New materials and surface finishes, along with improved manufacturing techniques, were also incorporated to improve durability of the new design. This second-generation prototype be-gan testing in the spring of 2013 in the company’s new, fully instrumented test facility in Houston, Texas. Moni-toring every aspect of the compres-sor’s performance, many different tests were run to allow the team to learn as much as possible about its performance. An additional test unit was then built for enhanced design and operational hour accumulation in a second test stand.
Both test stands are rated for pres-sures to 1200 psig (82.7 bar) and are fully automated with more than 40 channels of data acquisition, includ-ing torque sensors. Both stands are driven by 500 hp (373 kW) motors with variable-frequency drives (VFD) that can vary operating speeds from 150 to 1800 rpm. One test stand can operate with air as either an open or closed loop, with water or water/glycol injection for cooling. The other stand can operate with nitrogen as a closed loop with oil injection for cooling.
“In addition to our sophisticated flow loop testing facilities, Hicor’s in-house design capabilities include Solidworks 3D CAD, Solidworks and ANSYS fi-nite element analysis, and ANSYS computational fluid dynamics,” Se-shasai said. “We also have qualified world-class production-ready manu-facturing processes.”
Hicor shared some second-gener-ation prototype test results that were validated by a third party, comparing performance with a prevalent brand of 3600 rpm multiphase twin-screw pump. Compressing a stream hav-ing 99.7% gas volume fraction (GVF) from 10 psig (0.69 bar) inlet to 220
to 230 psig (15.17 to 15.86 bar) dis-charge, the Hicor compressor gained 27% in volumetric efficiency (from 54 to 69%) and 150% in mechanical ef-ficiency (from 14 to 38%) compared to the screw pump.
The 2013 and early 2014 testing led to the development of a third-generation (pre-commercial) unit pre-pared for endurance testing and field trials. Its design specifications include a suction flow rate of 230 acfm (6.51 m3/min) with 85 to 100% GVF capac-ity, 40:1 pressure ratio limit, 500 psi (34.5 bar) maximum differential pres-sure, 1500 psig (103.4 bar) maximum discharge pressure, 500 hp (373 kW) maximum power rating, and a speed range of 300 to 1800 rpm with an op-timal operating speed of 900 rpm. The compressor rotor shaft is of sufficient diameter to through-drive up to three additional compressors, permitting a train of up to four compressors to be driven by a single driver. This enables Hicor to use one basic compressor to configure a single-stage dual drive de-livering 460 acfm (13 m3/min), a single-stage triple drive delivering 690 acfm (19.5 m3/min), and a two-stage quad drive configuration delivering 690 acfm (19.5 m3/min). The wide speed range capability can be used for capac-ity control, especially when an electric motor drive is used with a VFD.
Two third-generation units were
january-february 2015 26 Compressortech2
n Hicor Technologies’ Houston facil-ity includes two test stands rated at 1200 psig (82.7 bar). Both are fully au-tomated with more than 40 channels of data acquisition in clud ing torque sen-sors and are driven by 500 hp (373 kW) motors with VFDs that can vary oper-ating speeds from 150 to 1800 rpm. One test stand can operate on air as either an open or closed loop, with water or water/glycol injection for cooling. The other stand can operate on nitrogen as a closed loop with oil injection for cooling.
built and in operation in the fall of 2014 and in January 2015, respectively. Early 2015 tests are including third-party verification of lab performance, multiweek field-simulated testing, and full life-cycle cost validation. Anticipat-ing a continuation of recent develop-ment success, Hicor plans to host an open house event at its Houston facility in March or April 2015 to dem-onstrate the new technology to po-tential customers. Wellhead tests are expected to begin in the second half of 2015, with full commercial trials in early 2016.
The Hicor multiphase compressor requires a relatively simple system that typically includes an upstream filter/separator to remove particulates and trap large slugs of fluid. A down-stream separator recovers some of the liquid from the gas stream, which, after cooling, is recirculated and in-jected back into the compressor for internal gas cooling. The recirculation system does not require an additional pump to deliver the atomized coolant droplets into the compressor. No gas stream cooling is required since the entire heat load is in the cooling liq-uid. Excess liquid is carried away in a single pipeline with the gas stream.
Several application examples are being discussed with customers for the potential field trials. One is a new Bak-ken wellhead gas stream with 96.8%
CT504_New.indd 3 1/26/15 12:32 PM
flaring and increases the downstream recovery of valuable liquids.”
The technology is currently being developed for wellhead compression applications; however, the company indicated that future applications of the technology could potentially cover the entire natural gas value chain — including wellhead, pipe-line, and refinery, as well as subsea, offshore, and even transportation
january-february 2015 27 Compressortech2
GVF compressed from an inlet of 100 psig (6.9 bar) to an outlet of 950 psig (65.5 bar), producing 2 MMscfd (5.66 x 10⁴ m3/d) of gas and 1500 bbl/d of liquid. Another is a new Marcellus well pad gas stream with 99.0% GVF com-pressed from an inlet of 200 psig (13.8 bar) to an outlet of 1200 psig (82.7 bar), producing 12 MMscfd (3.4 x 10⁵ m3/d) of gas and 1500 bbl/d of liquid. Yet another is an existing Eagle Ford wellhead gas stream with 99.8% GVF compressed from 5 to 400 psig (0.3 to 27.6 bar), pro-ducing 400 Mscfd (1.13 x 10⁴ m3/d) and 90 bbl/d of liquid.
Hicor has received several awards and grants for its innovation includ-ing U.S Department of Energy Na-tional Energy Technology Labora-tory Stripper Well Consortium (SWC) grants in 2010 and 2012. Company officials explained that the balanced and concentric motion of its rotor design results in a compressor with extremely low vibration, which gener-ates very little noise. The compact ro-tary design necessitates significantly fewer moving parts than reciprocat-ing machines, reducing complexity and potentially improving the reli-ability of the machine. Incorporation of reed-type outlet valves allows for variable outlet pressures, eliminat-ing the built-in pressure ratio that is common in other types of rotary com-pressors, which often leads to over- or under-compression and wasted energy. The absence of inlet valves also minimizes any inlet losses, lead-ing to higher suction efficiency.
“Hicor Technologies has developed a breakthrough new compression tech nology that has the ability to revo-lutionize the way natural gas is pro-duced and transported,” said Santos. “It promises enormous improve ments in efficiency, reliability and capital costs. A single, small-diameter Hi-cor compressor, requiring no storage tanks, pumps, etc., can be quickly in-stalled to flow a complete well stream through a single pipeline, retaining all natural gas, liquids, and volatile organ-ic compounds (VOCs) in one stream without field processing or separation. This eliminates the need for wellhead
#1 for Engine TestingTesto Portable Emission Analyzers#1 dependable & accurate especially high CO!#1 calibration stability (time & temperature)#1 network for training & support#1 long-distance wireless connectivity
Find out at testo350.com
800-227-0729 • [email protected]
Testo.indd 1 1/22/15 8:33 AM
and fueling. The technology is also relevant to other compression ap-plications such as compressed air, carbon dioxide (CO2), and other process gases. “With strong finan-cial backing now in place, the Hicor team is well-positioned to develop this technology into a reliable, com-mercial product that will impact the natural gas industry for many years to come,” Santos said. CT2
CT504_New.indd 4 1/26/15 12:42 PM

With shale gas still playing such a prominent role in the compression industry,
Caterpillar Oil & Gas has launched an updated version of its G3600 engine series, which includes the G3606. G3608, G3612 and G3616, for natural gas applications.
According to Caterpillar, the up-dated model provides expanded fuel flexibility, greater altitude and ambi-ent temperature capabilities and a 5.6% power increase. It also incor-porates the ADEM A4 engine control unit. Caterpillar will be ready to ac-cept orders for the upgraded engine in March 2015.
“The underlying reason for this up-date was to expand the fuel flexibility,” said Greg Carpenter, Caterpillar Oil & Gas gas compression marketing man-ager. “This engine is able to use hotter fuels without any pretreatment or con-ditioning. It’s got a much broader fuel tolerance and can run on a wide array of fuels.”
The Cat G3600 was first introduced in 1990 for natural gas applications. Twenty-five years later, the upgraded models are available in power ratings ranging from 1875 bhp (1398 bkW) at 1000 rpm to 5350 bhp (3990 bkW)
at 1000 rpm and 0.5 g/bhp-hr NOx emissions.
“We’ll have a 0.3 NOx rating later in 2015 as well, giving us a 40% re-duction in the NOx output from the en-gine,” Carpenter said.
The engine platforms also feature improved power at higher altitudes and elevated ambient temperatures, with ratings at 90°F (32°C) and 110°F (43°C) aftercooler water tempera-tures in addition to the standard 130°F (54°C) rating. Additional design im-provements include a lower compres-sion ratio, a two-stage aftercooler and a new turbocharger, Caterpillar said.
“We increased the engine’s ability to work in higher elevations,” Carpenter said. “The prior generation would have de-rated at 2000 ft. (610 m). We have a full rating up to 5000 ft. (1524 m).
“The ambient-based rating allows for higher power in cooler ambient temperatures,” Carpenter said. “As ambient temperature decreases sea-sonally or daily, the engine will adjust itself and customer can take action to increase compressor load. The en-gine will be able to function at a higher power level. It’s an important feature that lets users get more out of their compression assets.”
The engine design also simplifies packaging as it includes standard compressor oil cooler ports, standard JW heater ports, standard coolant and oil sample ports, as well as en-gine-mounted thermostats. The new exhaust insulation system features a stainless-steel, sheet-metal structure with grab handles and an inner insula-tion layer, according to Caterpillar.
The ADEM A4 engine control mod-ule (ECM) provides two options for the operator interface — OCP 4.3 and Cat HMI. The OCP 4.3 has a 5.5 in. (140 mm) monochrome display, allow-ing access to engine controls, ADEM A4 ECM parameters and includes Modbus and Ethernet interface ca-pabilities. It also comes with configu-rable analog and digital I/O.
The Cat HMI system features a 15 in. (381 mm) color touchscreen with the same capabilities as the OCP 4.3. When the Cat HMI system is inte-grated into the package control sys-tem through development software, it can be an operator’s single interface for the entire compressor package, Caterpillar said.
“I’m excited for this product,” Car-penter said. “It’s timed well to match what’s happening in the industry.” CT2
Upscale For Shale > Caterpillar Oil & Gas releases enhanced Cat G3600 series gas compression engine
By DJ SlATEr
n Caterpillar Oil & Gas has launched an updated ver-sion of its Cat G3600 engine series to better handle gas compression tasks. Pictured is the G3616.
january-february 2015 28 Compressortech2
CT477.indd 1 1/26/15 12:48 PM

innovative compressor valve performance
this changes everything
• Replaceable modules with straight gas flow
• Quick and easy to service
• Energy efficient and reliable
• Minimizes - costs, downtime and inventory
• Maximizes - productivity and revenue
• Reduces environmental impact
• Worldwide patents pending
The Straightflo valve is a revolutionary and unique
valve. Designed for easy service and as a direct
replacement sized to an existing valve, the SF valve
delivers performance improvements never before
seen in the compressor industry.
straight flowpath
module technology
sf valve
redefining the compressor valve
www.zahroofvalves.com
ZVi-CT2 ad-aug/sept14+flash.indd 1 17/09/2014 11:43Zahroof.indd 1 1/16/15 11:34 AM

It is widely known that in certain situations, a centrifugal compres-sor system could go into surge.
What is less widely known is why specific surge control valves and pip-ing characteristics still allow severe surge events to occur, and how to ensure these situations are properly addressed in a surge control design.
This article provides an example of how incomplete analysis could result in costly surge events and the best way to prevent them.
Vibrations createdCompression systems are designed
and operated to eliminate or minimize the potential for compressor surge, a dynamic instability detrimental to the integrity of the unit.
Compressor surge can occur when compressors are subjected to rapid transients, such as an emergency shut-down (ESD) or power failure. To pre-vent surge, compressor stations and their associated piping and equipment ought to be designed in a way to avoid surge, or to bring the unit out of surge quickly if it occurs. The problem is par-ticularly accentuated when a large vol-ume of high-pressure gas is retained in the yard piping, including gas coolers.
Once unstable, the unit will experi-ence large flow reversals and pres-sure transients that cause violent vibration of the compressor rotor, bearings, seals and casing.
Thus, a surge event is harmful to the compressor system and should be avoided at all costs. Figure 1 illus-trates a compressor rotor first-stage failure, one of many compressor prob-lems that the authors have investi-gated. In this case, the compressor damage was extensive and caused considerable downtime.
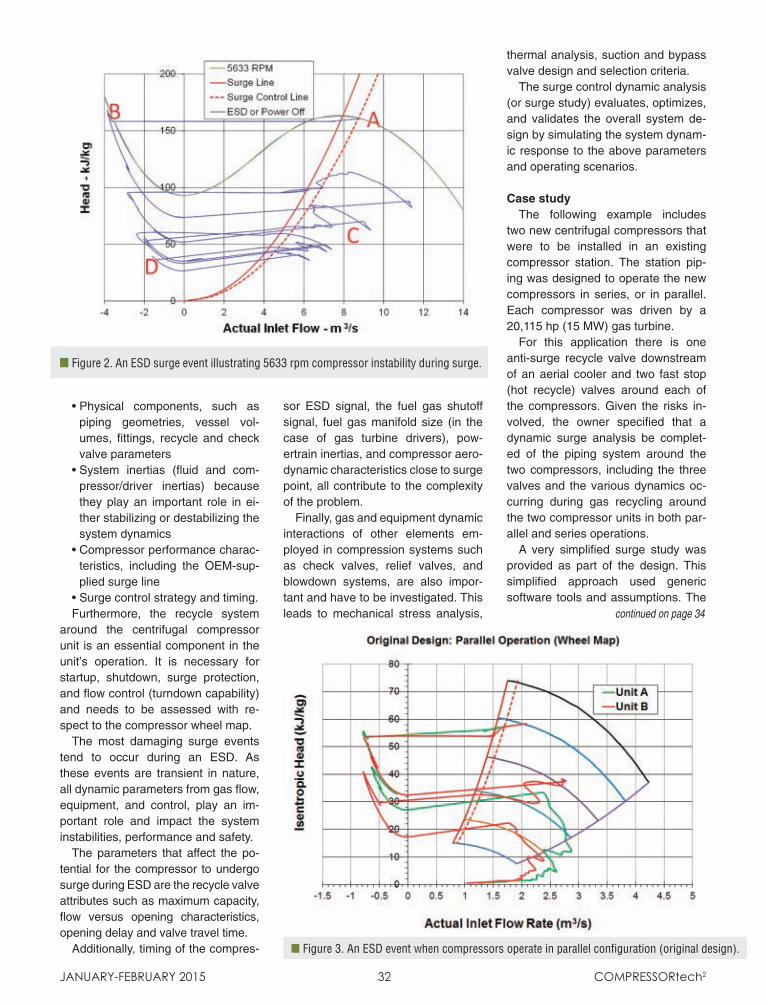
Figure 2 illustrates results from a dynamic simulation of a centrifugal compressor system that experienced surge cycles during operation. The figure shows the unit operating at point A, near the surge control line. Af-ter the ESD process was initiated the unit’s performance followed the path toward point B.
Notice that the flow reversed sig-nifying deep surge due to the effect of high perturbation energy travel-
ing back towards the compressor on the discharge side. The unit’s per-formance followed the line back and forth many times (from point C to D).
As shown in the chart, the gas flowed forward (positive x axis), and changed direction to reverse flow (negative x axis), and back again to forward, resulting in violent motion of the compressor. This cycle repeated until the pressure equalized across the compressor with no flow through it.
While this event only lasts a few sec-onds, it generates violent and poten-tially disastrous shaking and vibration on the compressor and components.
To avoid damage occurring from upset events such as ESD, a dynamic analysis is performed. In this example, the recommended modifications were implemented and the customer has reported successful results with no surge-related problems with the unit.
Influencing factorsThe compressor “system” param-
eters will determine the dynamic re-sponse to compressor instability. The likelihood and magnitude of a surge event is based on the compressor’s in-teractions with the following four factors:
Challenges With Surge Control Studies > Dynamic analysis recommended
during design phaseBy Dr. KAmAl BOTrOS
AND KElly EBErlE
january-february 2015 30 Compressortech2
Dr. Kamal Botros is a research fellow with NOVA Chemicals and an advisor to the surge control team at Beta Machinery Analysis. Dr. Botros is an authority on surge control de-sign and analysis, and has focused his research on transient flow problems in complex systems including centrifugal compressor surge phenomenon, pressure relief system dynamics, and transients of two phase stratified flows. He is the author of more than 170 technical papers. Contact him at: [email protected]. Kelly Eberle is a princi-pal engineer in the Beta design group. He leads acoustical (pulsation) and mechanical vibration analysis projects on compressor packages and pump installations. He also leads many dynamic analysis projects involving machines, foundations, offshore struc-tures, piping, and transients. Contact him at: [email protected].
n Figure 1. This centrifugal compressor rotor was dam-aged during a surge event.
continued on page 32
CT485.indd 1 1/23/15 8:59 Am

geoilandgas/lufkin.com
Failure is not an optionYou need a precision-engineered product that delivers power, performance and reliability. With Lufkin as your partner, our highly experienced and trained teams will provide you solutions manufactured with the quality, durability and precision that is essential for your critical gearing application.
Contact us at +1 (936) 634 2211 or [email protected]
Expertise that powers possible.
Lufkin.indd 1 1/14/15 11:02 AM
• Physical components, such as piping geometries, vessel vol-umes, fittings, recycle and check valve parameters
• System inertias (fluid and com-pressor/driver inertias) because they play an important role in ei-ther stabilizing or destabilizing the system dynamics
• Compressor performance charac-teristics, including the OEM-sup-plied surge line
• Surge control strategy and timing.Furthermore, the recycle system
around the centrifugal compressor unit is an essential component in the unit’s operation. It is necessary for startup, shutdown, surge protection, and flow control (turndown capability) and needs to be assessed with re-spect to the compressor wheel map.
The most damaging surge events tend to occur during an ESD. As these events are transient in nature, all dynamic parameters from gas flow, equipment, and control, play an im-portant role and impact the system instabilities, performance and safety.
The parameters that affect the po-tential for the compressor to undergo surge during ESD are the recycle valve attributes such as maximum capacity, flow versus opening characteristics, opening delay and valve travel time.
Additionally, timing of the compres-
sor ESD signal, the fuel gas shutoff signal, fuel gas manifold size (in the case of gas turbine drivers), pow-ertrain inertias, and compressor aero-dynamic characteristics close to surge point, all contribute to the complexity of the problem.
Finally, gas and equipment dynamic interactions of other elements em-ployed in compression systems such as check valves, relief valves, and blowdown systems, are also impor-tant and have to be investigated. This leads to mechanical stress analysis,
thermal analysis, suction and bypass valve design and selection criteria.
The surge control dynamic analysis (or surge study) evaluates, optimizes, and validates the overall system de-sign by simulating the system dynam-ic response to the above parameters and operating scenarios.
Case studyThe following example includes
two new centrifugal compressors that were to be installed in an existing compressor station. The station pip-ing was designed to operate the new compressors in series, or in parallel. Each compressor was driven by a 20,115 hp (15 MW) gas turbine.
For this application there is one anti-surge recycle valve downstream of an aerial cooler and two fast stop (hot recycle) valves around each of the compressors. Given the risks in-volved, the owner specified that a dynamic surge analysis be complet-ed of the piping system around the two compressors, including the three valves and the various dynamics oc-curring during gas recycling around the two compressor units in both par-allel and series operations.
A very simplified surge study was provided as part of the design. This simplified approach used generic software tools and assumptions. The
n Figure 2. An ESD surge event illustrating 5633 rpm compressor instability during surge.
january-february 2015 32 Compressortech2
n Figure 3. An ESD event when compressors operate in parallel configuration (original design).
continued on page 34
CT485.indd 2 1/23/15 11:17 AM

www.nidec-asi .com
Sanjay dreams of a time when all of the homes in Mumbai will have
access to safe and clean natural gas.
Nidec ASI, turning dreams into results.
Nidec ASI
Gas processing expansion Project,
India
Our customer’s dream was to double production through a major expansion project and
to do so on-time to maintain their perfect track record.
Nidec delivered.
The motors were delivered on schedule and were up
and running in record time. Rigorous full-load testing
in the factory meant therewere no surprises in the field.
Variable Speed Electric Drive Systems
Nidec.indd 1 1/13/15 10:20 AM
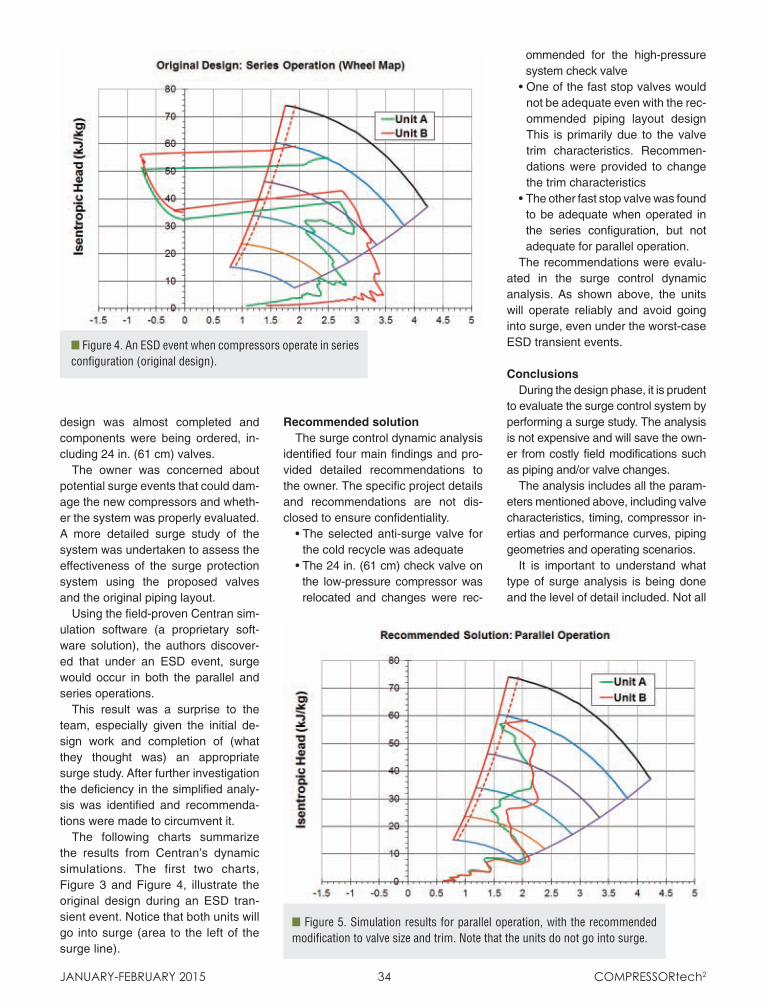
n Figure 3. An ESD event when compressors operate in parallel configuration (original design).
design was almost completed and components were being ordered, in-cluding 24 in. (61 cm) valves.
The owner was concerned about potential surge events that could dam-age the new compressors and wheth-er the system was properly evaluated. A more detailed surge study of the system was undertaken to assess the effectiveness of the surge protection system using the proposed valves and the original piping layout.
Using the field-proven Centran sim-ulation software (a proprietary soft-ware solution), the authors discover-ed that under an ESD event, surge would occur in both the parallel and series operations.
This result was a surprise to the team, especially given the initial de-sign work and completion of (what they thought was) an appropriate surge study. After further investigation the deficiency in the simplified analy-sis was identified and recommenda-tions were made to circumvent it.
The following charts summarize the results from Centran’s dynamic simulations. The first two charts, Figure 3 and Figure 4, illustrate the original design during an ESD tran-sient event. Notice that both units will go into surge (area to the left of the surge line).
Recommended solutionThe surge control dynamic analysis
identified four main findings and pro-vided detailed recommendations to the owner. The specific project details and recommendations are not dis-closed to ensure confidentiality.
• The selected anti-surge valve for the cold recycle was adequate
• The 24 in. (61 cm) check valve on the low-pressure compressor was relocated and changes were rec-
ommended for the high-pressure system check valve
• One of the fast stop valves would not be adequate even with the rec-ommended piping layout design This is primarily due to the valve trim characteristics. Recommen-dations were provided to change the trim characteristics
• The other fast stop valve was found to be adequate when operated in the series configuration, but not adequate for parallel operation.
The recommendations were evalu-ated in the surge control dynamic analysis. As shown above, the units will operate reliably and avoid going into surge, even under the worst-case ESD transient events.
Conclusions During the design phase, it is prudent
to evaluate the surge control system by performing a surge study. The analysis is not expensive and will save the own-er from costly field modifications such as piping and/or valve changes.
The analysis includes all the param-eters mentioned above, including valve characteristics, timing, compressor in-ertias and performance curves, piping geometries and operating scenarios.
It is important to understand what type of surge analysis is being done and the level of detail included. Not all
n Figure 4. An ESD event when compressors operate in series configuration (original design).
n Figure 5. Simulation results for parallel operation, with the recommended modification to valve size and trim. Note that the units do not go into surge.
january-february 2015 34 Compressortech2
CT485.indd 3 1/23/15 9:00 AM

surge studies accurately predict surge events such as fast-stop scenarios. Some firms use commercially avail-able process analysis software for this dynamic application, but, as this ex-
ample illustrates, designs based upon simplified surge calculations are inad-equate in preventing surge events. It is important to recognize the (poten-tially costly) limitations and errors as-
sociated with using generic software and assumptions.
For more critical applications, in-cluding multiple compressors in par-allel or series, the correct scope and approach is important for transient surge analysis. As always, “The devil is in the details.”
Valve and piping details become critical when simulating fast transients. Consult experts in dynamics who have the applicable field-proven modeling techniques, experience and tools to accurately assess the surge dynamics.
It is up to the owners to specify a surge control dynamic analysis. Oth-erwise, there is uncertainty about how the surge control system will be-have under fast transient conditions. For sample specifications, contact the authors.
It is recommended that the analysis occur during the front-end engineering and design stage to highlight detailed constraints, or at least early in the de-tailed design stage. This provides suf-ficient time to review the design and provide recommended modifications to the EPC and owner. CT2
n Figure 6. Simulation results for series operation with the recommended modifications. As noted earlier, the units do not go into surge.
Motortech.indd 1 1/8/15 2:37 PMCT485.indd 4 1/23/15 9:00 AM

KB_Delta_Spreads.indd 1 11/13/14 9:23 AM

KB_Delta_Spreads.indd 2 11/13/14 9:24 AM
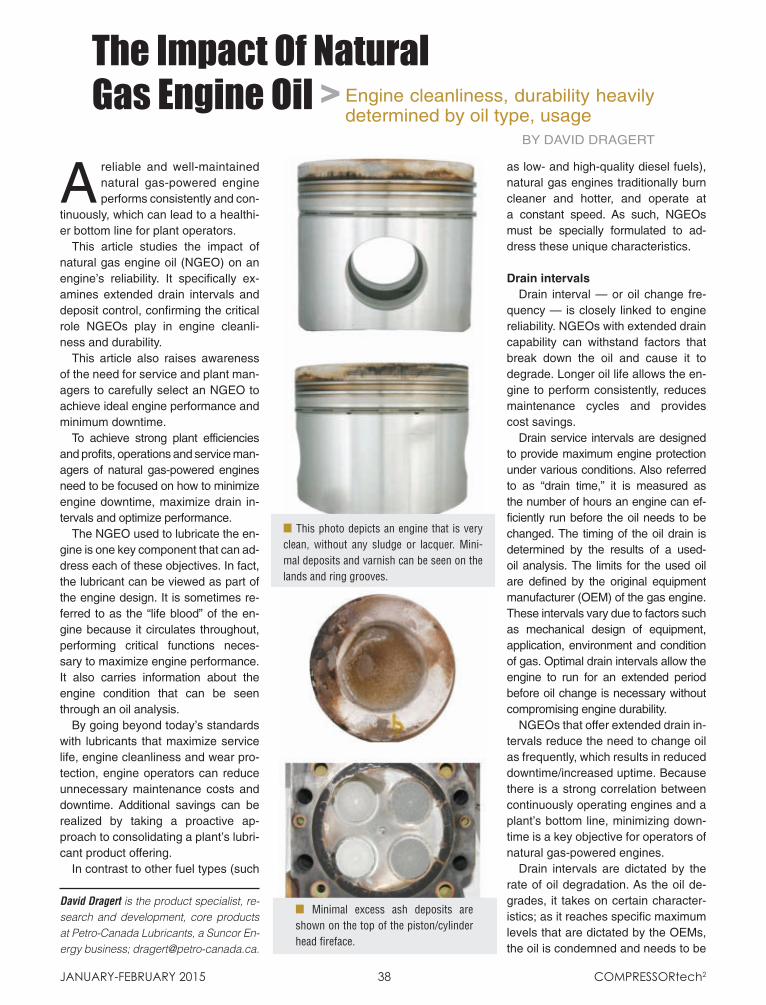
A reliable and well-maintained natural gas-powered engine per forms consistently and con-
tinuously, which can lead to a healthi-er bottom line for plant operators.
This article studies the impact of natural gas engine oil (NGEO) on an engine’s reliability. It specifically ex-amines extended drain intervals and deposit control, confirming the critical role NGEOs play in engine cleanli-ness and durability.
This article also raises awareness of the need for service and plant man-agers to carefully select an NGEO to achieve ideal engine performance and minimum downtime.
To achieve strong plant efficiencies and profits, operations and service man-agers of natural gas-powered engines need to be focused on how to minimize engine downtime, maximize drain in -tervals and optimize performance.
The NGEO used to lubricate the en-gine is one key component that can ad-dress each of these objectives. In fact, the lubricant can be viewed as part of the engine design. It is sometimes re-ferred to as the “life blood” of the en-gine because it circulates throughout, performing critical functions neces-sary to maximize engine performance. It also carries information about the engine condition that can be seen through an oil analysis.
By going beyond today’s standards with lubricants that maximize service life, engine cleanliness and wear pro-tection, engine operators can reduce unnecessary maintenance costs and downtime. Additional savings can be realized by taking a proactive ap-proach to consolidating a plant’s lubri-cant product offering.
In contrast to other fuel types (such
as low- and high-quality diesel fuels), natural gas engines traditionally burn cleaner and hotter, and operate at a constant speed. As such, NGEOs must be specially formulated to ad-dress these unique characteristics.
Drain intervalsDrain interval — or oil change fre-
quency — is closely linked to engine reliability. NGEOs with extended drain capability can withstand factors that break down the oil and cause it to degrade. Longer oil life allows the en-gine to perform consistently, reduces maintenance cycles and provides cost savings.
Drain service intervals are designed to provide maximum engine protection under various conditions. Also referred to as “drain time,” it is measured as the number of hours an engine can ef-ficiently run before the oil needs to be changed. The timing of the oil drain is determined by the results of a used-oil analysis. The limits for the used oil are defined by the original equipment manufacturer (OEM) of the gas engine. These intervals vary due to factors such as mechanical design of equipment, application, environment and condition of gas. Optimal drain intervals allow the engine to run for an extended period before oil change is necessary without compromising engine durability.
NGEOs that offer extended drain in-tervals reduce the need to change oil as frequently, which results in reduced downtime/increased uptime. Because there is a strong correlation between continuously operating engines and a plant’s bottom line, minimizing down-time is a key objective for operators of natural gas-powered engines.
Drain intervals are dictated by the rate of oil degradation. As the oil de-grades, it takes on certain character-istics; as it reaches specific maximum levels that are dictated by the OEMs, the oil is condemned and needs to be
The Impact Of Natural Gas Engine Oil > Engine cleanliness, durability heavily
determined by oil type, usageBy DAvID DrAGErT
David Dragert is the product specialist, re-search and development, core products at Petro-Canada Lubricants, a Suncor En-ergy business; [email protected].
JANUARY-FEBRUARY 2015 38 CompREssoRtech2
n Minimal excess ash deposits are shown on the top of the piston/cylinder head fireface.
n This photo depicts an engine that is very clean, without any sludge or lacquer. Mini-mal deposits and varnish can be seen on the lands and ring grooves.
CT507.indd 1 1/26/15 1:05 PM
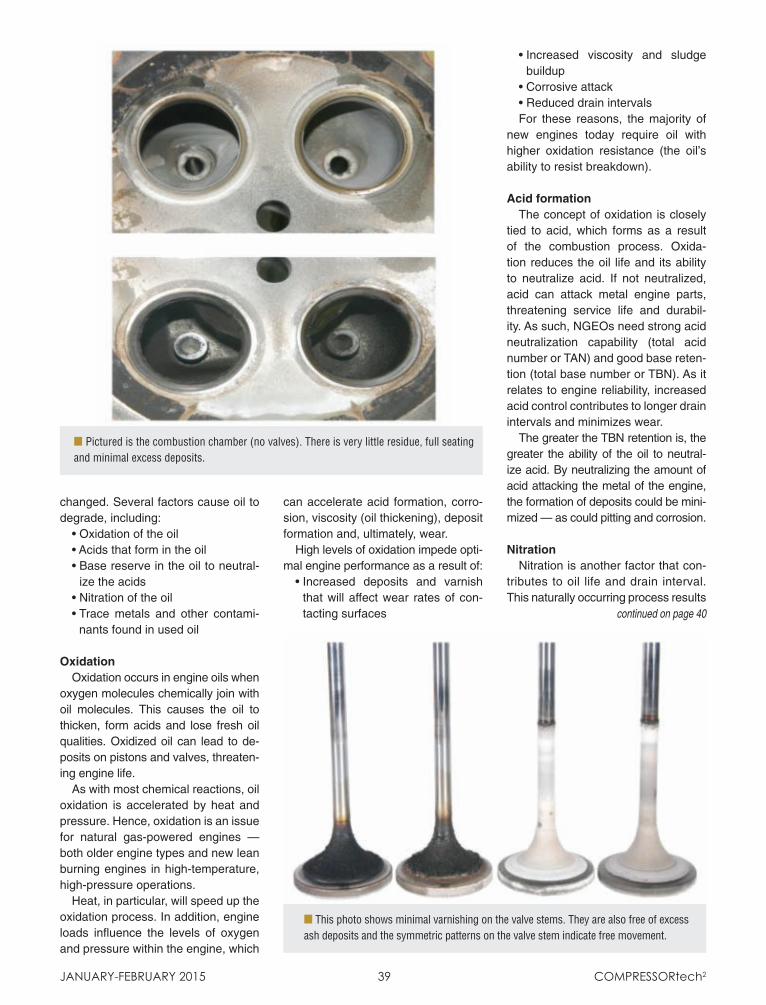
changed. Several factors cause oil to degrade, including:
• Oxidation of the oil• Acids that form in the oil• Base reserve in the oil to neutral-
ize the acids• Nitration of the oil• Trace metals and other contami-
nants found in used oil
OxidationOxidation occurs in engine oils when
oxygen molecules chemically join with oil molecules. This causes the oil to thicken, form acids and lose fresh oil qualities. Oxidized oil can lead to de-posits on pistons and valves, threaten-ing engine life.
As with most chemical reactions, oil oxidation is accelerated by heat and pressure. Hence, oxidation is an issue for natural gas-powered engines — both older engine types and new lean burning engines in high-temperature, high-pressure operations.
Heat, in particular, will speed up the oxidation process. In addition, engine loads influence the levels of oxygen and pressure within the engine, which
can accelerate acid formation, corro-sion, viscosity (oil thickening), deposit formation and, ultimately, wear.
High levels of oxidation impede opti-mal engine performance as a result of:
• Increased deposits and varnish that will affect wear rates of con-tacting surfaces
• Increased viscosity and sludge buildup
• Corrosive attack• Reduced drain intervalsFor these reasons, the majority of
new engines today require oil with higher oxidation resistance (the oil’s ability to resist breakdown).
Acid formationThe concept of oxidation is closely
tied to acid, which forms as a result of the combustion process. Oxida-tion reduces the oil life and its ability to neutralize acid. If not neutralized, acid can attack metal engine parts, threatening service life and durabil-ity. As such, NGEOs need strong acid neutralization capability (total acid number or TAN) and good base reten-tion (total base number or TBN). As it relates to engine reliability, increased acid control contributes to longer drain intervals and minimizes wear.
The greater the TBN retention is, the greater the ability of the oil to neutral-ize acid. By neutralizing the amount of acid attacking the metal of the engine, the formation of deposits could be mini-mized — as could pitting and corrosion.
NitrationNitration is another factor that con -
tributes to oil life and drain interval. This naturally occurring process results
JANUARY-FEBRUARY 2015 39 CompREssoRtech2
n Pictured is the combustion chamber (no valves). There is very little residue, full seating and minimal excess deposits.
n This photo shows minimal varnishing on the valve stems. They are also free of excess ash deposits and the symmetric patterns on the valve stem indicate free movement.
continued on page 40
CT507.indd 2 1/22/15 4:19 PM
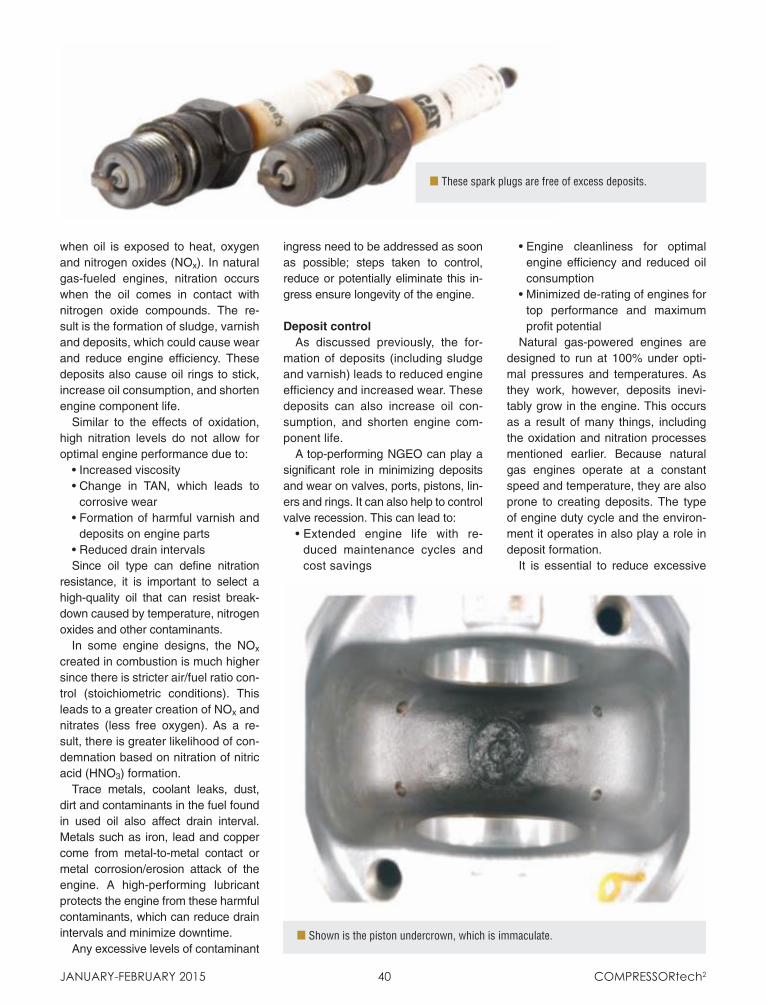
when oil is exposed to heat, oxygen and nitrogen oxides (NOx). In natural gas-fueled engines, nitration occurs when the oil comes in contact with nitrogen oxide compounds. The re-sult is the formation of sludge, varnish and deposits, which could cause wear and reduce engine efficiency. These deposits also cause oil rings to stick, increase oil consumption, and shorten engine component life.
Similar to the effects of oxidation, high nitration levels do not allow for optimal engine performance due to:
• Increased viscosity• Change in TAN, which leads to
corrosive wear• Formation of harmful varnish and
deposits on engine parts• Reduced drain intervalsSince oil type can define nitration
resistance, it is important to select a high-quality oil that can resist break-down caused by temperature, nitrogen oxides and other contaminants.
In some engine designs, the NOx created in combustion is much higher since there is stricter air/fuel ratio con-trol (stoichiometric conditions). This leads to a greater creation of NOx and nitrates (less free oxygen). As a re-sult, there is greater likelihood of con-demnation based on nitration of nitric acid (HNO3) formation.
Trace metals, coolant leaks, dust, dirt and contaminants in the fuel found in used oil also affect drain interval. Metals such as iron, lead and copper come from metal-to-metal contact or metal corrosion/erosion attack of the engine. A high-performing lubricant protects the engine from these harmful contaminants, which can reduce drain intervals and minimize downtime.
Any excessive levels of contaminant
ingress need to be addressed as soon as possible; steps taken to control, reduce or potentially eliminate this in-gress ensure longevity of the engine.
Deposit controlAs discussed previously, the for-
mation of deposits (including sludge and varnish) leads to reduced engine efficiency and increased wear. These deposits can also increase oil con-sumption, and shorten engine com-ponent life.
A top-performing NGEO can play a significant role in minimizing deposits and wear on valves, ports, pistons, lin-ers and rings. It can also help to control valve recession. This can lead to:
• Extended engine life with re-duced maintenance cycles and cost savings
• Engine cleanliness for optimal engine efficiency and reduced oil consumption
• Minimized de-rating of engines for top performance and maximum profit potential
Natural gas-powered engines are designed to run at 100% under opti-mal pressures and temperatures. As they work, however, deposits inevi-tably grow in the engine. This occurs as a result of many things, including the oxidation and nitration processes mentioned earlier. Because natural gas engines operate at a constant speed and temperature, they are also prone to creating deposits. The type of engine duty cycle and the environ-ment it operates in also play a role in deposit formation.
It is essential to reduce excessive
JANUARY-FEBRUARY 2015 40 CompREssoRtech2
n These spark plugs are free of excess deposits.
n Shown is the piston undercrown, which is immaculate.
CT507.indd 3 1/22/15 4:20 PM

deposit formation to operate at the highest efficiency and gain minimal downtime and maximum profit. When engines are burdened with depos-its, engine efficiencies are impacted, which could result in:
• Even higher engine temperatures• Loss of energy to either create
power or compress gas• Pre-detonation• Engine damageBecause of this potential engine
damage, operations de-rate the en-gine and reduce loads. This reduction of load will reduce engine outputs and may affect the bottom line. Deposits can also lead to higher wear when they form in the groove rings so that the rings can no longer move.
Deposits can cause pre-combustion, which creates instability in the engine. This robs an engine of its efficiency. For example, if pistons cannot move up and down freely, more energy is utilized. The result is that the engine has to work harder to achieve the same result, consuming more energy in the process, which could add to op-erating costs.
When an engine is de-rated, it is not performing at optimal levels. This is often because of the presence of deposits. As a result, there is addi-tional stress on the engine and output is reduced. As an engine is de-rated, temperatures are lower, resulting in incomplete combustion and more formation of deposits onto the metal surface that remain on the engine. An NGEO that contributes to engine cleanliness can help to minimize en-gine de-rating and maximize engine performance.
JANUARY-FEBRUARY 2015 41 CompREssoRtech2
n Shown is the cylinder liner, which has negligible bore polish with cross-hatching intact.
EnginEEring AnAlysis to mEEt your
dEmAnding schEdulE
Compression Dynamics Consulting, LLC6130 S Maplewood Ave, Suite CTulsa, OK 74136
Call Now (918) [email protected]
www.cdconsulting.com
We Are Your engineering resourCe for:• APi 618 5th edition Pulsation & Mechanical• rotor Dynamics• field Vibration Analysis• Dynamic structural skid finite element Analysis
Smooth Compression is incorporated in the early design stages. Compression Dynamics will work with your designers to ensure acceptable vibration and extend reliability.
Whether it’s mechanical, acoustic, torsional, or FEA, we can help you through the process to find the right solution for you. Call us today and experience the difference.
CompDynamics.indd 1 1/15/15 9:10 AM
Not all deposits are unwanted and harmful. Some de-posits, in the form of ash, are needed to protect valves and prevent valve recession (the premature compression and wear of the valve seat in the cylinder head and valve tulip). Ash residue, which remains after the oil is burned during operation, helps to prevent premature valve reces-sion by forming a protective, sacrificial layer on the valve seat and valve tulip to absorb the impact of the two coming into contact.
In summary, the severe operating conditions common to natural gas-fueled engines demand an NGEO that delivers performance and extended oil life while helping maintain excellent control of engine deposits. CT2
CT507.indd 4 1/26/15 1:13 PM

Increasing environmental and economical pressures de-mand that the conscientious engine and/or compressor operator look carefully at lubricant consumption. Proper
volumetric delivery ensures maximum equipment life, mini-mizes waste, provides efficient operation and causes mini-mal impact on the environment.
Many gas transmission, distribution, refinery and chemi-cal processing operations using reciprocating engines and compressors are finding that their lubrication rates to com-pressor cylinders, rods, power cylinders and valves can and should be drastically reduced.
In the past, reciprocating machinery has been over- lubricated because of inefficiencies in oil delivery systems, lack of proper attention, or even the user’s inability to cal-culate actual lube rate requirements. The “more is better” theory was always considered the preferred choice over “not enough.”
Possible reductions in lubricant delivery today and the subsequent cost savings that can be realized are made possible by any or all of the following factors:
• Vastly improved quality and various types of today’s lu-bricating oils and additives
• Similar improvements in wear surface materials used in rider and compression bands, rings, packing glands, valve guides, cylinder liners, etc.
• Increased accuracy and reliability of lubricating system hydraulic components and monitoring systems
• Greater emphasis at the management and operations levels on responsibility for cost-efficiency and environ-mental compatibility
This paper deals with lube rate reduction from the lube system’s perspective and what must be addressed to guar-antee accurate and reliable lubrication, even at ever-de-creasing rates of delivery.
HistoryA brief review from a historical perspective provides a
better understanding of where and when the industry start-ed with engine and compressor lubrication, what equipment was used, and how it has been improved over the years.
The typical integral reciprocating engine-driven compres-sor used in the gas transmission industry may have been
installed before or during the early 1960s. The standard for lubrication system design at that time was the pump-to-point mechanical lubricator, which required constant at-tention to filling and adjustment. Each feed point had its own adjustable stroke pump, and protection or monitoring of delivery was impossible. Each pump had a practical mini-mum stroke adjustment and could not be adjusted to the lower desired flow rates. Many smaller compressors with these types of systems are still in operation today, so there is much room for improvement.
Units installed in the mid-to-late 1960s, older units more recently equipped with newer systems, and newer high-speed, shaft-driven compressors commonly used the more
Lubrication Rate Reduction In Engines And Compressors > History delivers evidence for
reduction programBy Walter Sloan
Walter Sloan is the president and CEO of Sloan Lubrication Systems, based in Freeport, Pennsylvania. He has more than 40 years of experience in the design, manufacturing, and main-tenance of lubrication systems, specifically for compressors and engines in the energy industry.
January-february 2015 42 Compressortech2
n A Cooper GMWA 10-3 gas transmission en-gine/compressor with the dual zone lubrication system installed on the end. This provides the operator easy access to monitor and adjust the lubrication system as needed during rounds.
CT516.indd 1 1/23/15 10:13 AM
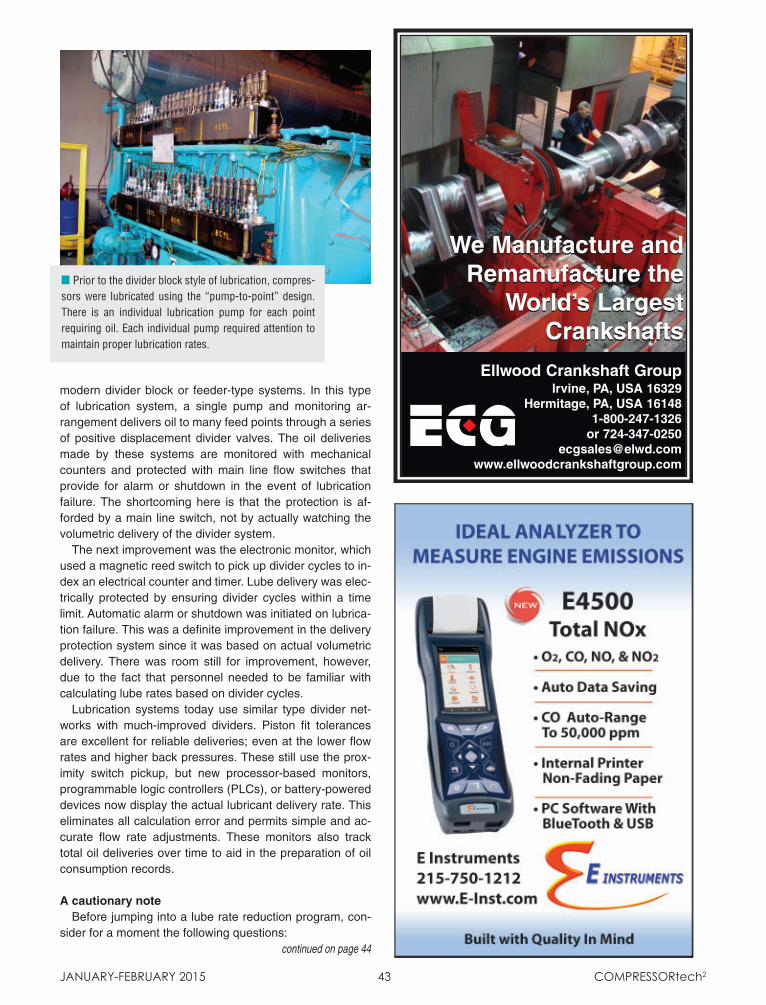
modern divider block or feeder-type systems. In this type of lubrication system, a single pump and monitoring ar-rangement delivers oil to many feed points through a series of positive displacement divider valves. The oil deliveries made by these systems are monitored with mechanical counters and protected with main line flow switches that provide for alarm or shutdown in the event of lubrication failure. The shortcoming here is that the protection is af-forded by a main line switch, not by actually watching the volumetric delivery of the divider system.
The next improvement was the electronic monitor, which used a magnetic reed switch to pick up divider cycles to in-dex an electrical counter and timer. Lube delivery was elec-trically protected by ensuring divider cycles within a time limit. Automatic alarm or shutdown was initiated on lubrica-tion failure. This was a definite improvement in the delivery protection system since it was based on actual volumetric delivery. There was room still for improvement, however, due to the fact that personnel needed to be familiar with calculating lube rates based on divider cycles.
Lubrication systems today use similar type divider net-works with much-improved dividers. Piston fit tolerances are excellent for reliable deliveries; even at the lower flow rates and higher back pressures. These still use the prox-imity switch pickup, but new processor-based monitors, programmable logic controllers (PLCs), or battery-powered devices now display the actual lubricant delivery rate. This eliminates all calculation error and permits simple and ac-curate flow rate adjustments. These monitors also track total oil deliveries over time to aid in the preparation of oil consumption records.
A cautionary noteBefore jumping into a lube rate reduction program, con-
sider for a moment the following questions:
January-february 2015 43 Compressortech2
n Prior to the divider block style of lubrication, compres-sors were lubricated using the “pump-to-point” design. There is an individual lubrication pump for each point requiring oil. Each individual pump required attention to maintain proper lubrication rates.
continued on page 44
We Manufacture andRemanufacture the
World’s LargestCrankshafts
Ellwood Crankshaft GroupIrvine, PA, USA 16329
Hermitage, PA, USA 161481-800-247-1326
www.ellwoodcrankshaftgroup.com
We Manufacture andRemanufacture the
World’s LargestCrankshafts
Ellwood.qxp 1/27/10 11:51 AM Page 1
E-Instruments.indd 1 11/19/14 3:24 PMCT516.indd 2 1/23/15 10:13 AM
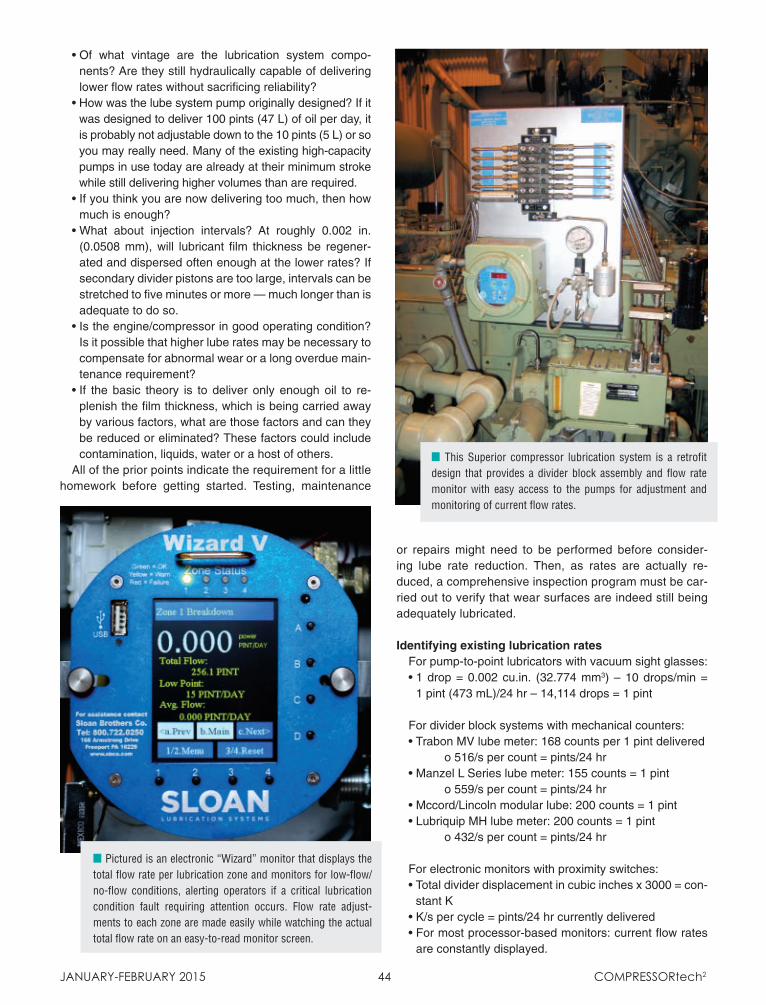
• Of what vintage are the lubrication system compo-nents? Are they still hydraulically capable of delivering lower flow rates without sacrificing reliability?
• How was the lube system pump originally designed? If it was designed to deliver 100 pints (47 L) of oil per day, it is probably not adjustable down to the 10 pints (5 L) or so you may really need. Many of the existing high-capacity pumps in use today are already at their minimum stroke while still delivering higher volumes than are required.
• If you think you are now delivering too much, then how much is enough?
• What about injection intervals? At roughly 0.002 in. (0.0508 mm), will lubricant film thickness be regener-ated and dispersed often enough at the lower rates? If secondary divider pistons are too large, intervals can be stretched to five minutes or more — much longer than is adequate to do so.
• Is the engine/compressor in good operating condition? Is it possible that higher lube rates may be necessary to compensate for abnormal wear or a long overdue main-tenance requirement?
• If the basic theory is to deliver only enough oil to re-plenish the film thickness, which is being carried away by various factors, what are those factors and can they be reduced or eliminated? These factors could include contamination, liquids, water or a host of others.
All of the prior points indicate the requirement for a little homework before getting started. Testing, maintenance
or repairs might need to be performed before consider-ing lube rate reduction. Then, as rates are actually re-duced, a comprehensive inspection program must be car-ried out to verify that wear surfaces are indeed still being adequately lubricated.
Identifying existing lubrication ratesFor pump-to-point lubricators with vacuum sight glasses:• 1 drop = 0.002 cu.in. (32.774 mm3) – 10 drops/min =
1 pint (473 mL)/24 hr – 14,114 drops = 1 pint
For divider block systems with mechanical counters:• Trabon MV lube meter: 168 counts per 1 pint delivered o 516/s per count = pints/24 hr• Manzel L Series lube meter: 155 counts = 1 pint o 559/s per count = pints/24 hr• Mccord/Lincoln modular lube: 200 counts = 1 pint• Lubriquip MH lube meter: 200 counts = 1 pint o 432/s per count = pints/24 hr
For electronic monitors with proximity switches:• Total divider displacement in cubic inches x 3000 = con-
stant K• K/s per cycle = pints/24 hr currently delivered• For most processor-based monitors: current flow rates
are constantly displayed.
January-february 2015 44 Compressortech2
n Pictured is an electronic “Wizard” monitor that displays the total flow rate per lubrication zone and monitors for low-flow/no-flow conditions, alerting operators if a critical lubrication condition fault requiring attention occurs. Flow rate adjust-ments to each zone are made easily while watching the actual total flow rate on an easy-to-read monitor screen.
n This Superior compressor lubrication system is a retrofit design that provides a divider block assembly and flow rate monitor with easy access to the pumps for adjustment and monitoring of current flow rates.
CT516.indd 3 1/23/15 10:13 AM

January-february 2015 45 Compressortech2
Calculating required lubrication ratesPower cylinder requirements for two-cycle engines:• Engine horsepower x 8 x 24/brake hp hr/gal. = pints per
24 hr required to ALL power cylindersUse the following brake horsepower h/gal. that matches
the engine type. These values should be considered as the maximum amount of oil required. Consider reducing lube rates down toward the target value.
COOPER Maximum Target
GMW 7500 10,000 12,000
GMWA & C 7000 10,000 - 12,000
All other Cooper 10,000 12,000 - 15,000
CLARK
HSRA and HRA-T 4500 7000 - 9000
HMA, HMB, TMB, RA 5000 7000 - 9000
HRA, TRA, TCV, BA 6000 8000 - 10,000
HBA, HLA, TLA, TCV 7000 9000 - 11,000
Scavenging air cylinders start at 2-3 pints (946-1420 mL)/24 hr and reduce by one-half.
Power valve requirements: four stroke engines:• Each valve guide requires 0.05 pints (24 mL) per 24 hr
period.
Compressor cylinder requirements based on swept area calculations:
Stroke x Bore x rpm = pints/24 hr required to cylinder wall K • For 1 pint/2 mil. sq.ft., K = 32,000• For 1 pint/3 mil. sq.ft., K = 48,000• For 1 pint/4 mil. sq.ft., K = 64,000• For 1 pint/5 mil. sq.ft., K = 80,000• For 1 pint/6 mil. sq.ft., K = 96,000
• Use 1 pint/2 mil. sq.ft. as maximum lube rate required.• Use 1 pint/5 mil. sq.ft. as target rate.
Lubrication reduction — a success storyA mainline gas compressor station in the northeastern
United States has reported great operational savings by re-ducing lubrication rates. Fourteen integral engine/compres-sors in operation provide 34,600 hp (25.8 MW). They are all Clark 2 cycle engines — BA, TLA and TCV units. The lubricant being used is a high-quality popular mineral oil for-mulated especially for two-cycle engines.
The primary attention has been focused on lube rate reduction to the power cylinders, though the smaller units have single-zone lubrication systems, so compressor lube rates are reduced proportionately with the power.
Engine manufacturer-recommended power lube rates continued on page 46
Recognized Leader
Innovator in State-of-the-ArtPipe Supports & Clamps Inventor of Flywheel Lock
Leaders in Field Machine WorkPioneers in Casting Rapair
PRODUCTS:n Pipe Supports & Clampsn Epoxy Groutn Anchor Boltsn Flywheel Locksn Temperature & Vibration Sensorsn Spark Plugs
SERVICES:n Field Machiningn Casting Repairn Crankshaft Machining n Machine Shopn Broken Bolt Removaln Frame Reinforcementn Alignment Services
Tulsa, OK
ReynoldsFrench.indd 1 7/8/13 2:07 PM
CT516.indd 4 1/23/15 10:14 AM
January-february 2015 46 Compressortech2
cylinder ports and oil carryover to the downstream pipeline.
SolutionAll lubrication system components,
particularly the divider blocks, were pressure- and volume-tested to verify that they were in good condition. The divider blocks are metering devices that must make extremely specific and accurate lube deliveries at lower volumes. Many older blocks were re-placed, ensuring the most accurate deliveries possible. Terminal check valves were replaced with positive sealing types. Then, the pump adjust-ments were checked to verify current lube rates were 55 pints (26 L) per 24 hr to all power cylinders, and 14 pints (7 L) per 24 hours to compressor cyl-inders and rod packing.
ResultOil deliveries were reduced to 38
pints (18 L) per day to power and 6 pints (3 L) per day to compressor, resulting in yearly oil savings of US$3707. Origi-nally designed in 1964, recommended lubrication rates were 64 pints (30 L) per 24 hr. to the power cylinders, and 24 pints (11 L) per 24 hr to the com-pressor throws. Compared with to-day’s lube rates, lube rate reductions are saving just this one station more than 5 gal. (19 L) of oil each day — oil that is not burned and spewed out the exhaust stack as smoke or sent down the pipeline as hazardous waste. In addition, as a result of the protection of accurate lubrication, all cylinder liners, rings, riders and various other wear components now last much longer between overhauls, reducing system maintenance cost and time.
ConclusionsThe two examples were from one
and two decades ago. Even today, those principles apply, though rarely pursued. Lubricating oil costs for both purchase and disposal are often considered fixed, rather than look-ing at those reduced costs positively affecting the bottom line. Consider implementing a lube rate reduction program as soon as possible. It will be good for you, your customers and the environment. CT2
are at 7000 or 7500 brake horsepow-er hours per gallon, and the above units have been operated for several years at between 10,000 and 12,000. Along with persistent attention to crankcase leaks and consumption, the station reported a lube oil savings of 24,000 gal. (90,850 L) per year.
Operating hours between major overhauls used to be estimated at 40,000 hr. With these lower lube rates, this is projected to be extended to be-tween 80,000 and 120,000 hr. This is attributed primarily to significant re-duction of carbon buildup in the ring and port areas. Visual inspection of power cylinder walls shows no cuts or scratches, just a bright, smooth polish.
How much lubrication is enough? A simple, low-tech approach requires removal of a cylinder head with a pis-ton at the bottom travel. A quick wipe of the finger on the wall is all that is required. If oil is visible on the finger, lube rates are still too high. If it feels dry to the touch, but oil still barely ap-pears when wiped with a tissue, the lube rates are improving. If persistent stuck rings are still a problem, rates can be reduced even further, very small amounts at a time.
Here are some recommendations by the station personnel for conduct-ing a responsible lube rate reduction program:
• Consistency is the key: the same person must inspect the cylinder condition each time. Take pictures for comparison at each inspection.
• Use only good quality oil, formu-lated and recommended for your engine service.
• Reduce rates by small amounts only. Operate under normal con-ditions for several weeks before next inspection.
Another storyAt another mainline gas compres-
sion station, there are four Cooper Bessemer GMWA8-2 engine-driven compressors. These eight-cylinder units each develop 2000 hp (1.49 MW) at 250 rpm and drive two 18 in. (457 mm) bore x 20 in. (508 mm) stroke compressor cylinders. Man-agement’s primary concern was re-garding carbon buildup in the power
MoversPRIME
SwRISouthwest Research Institute (SwRI)
has opened a high-horsepower en-gine dynamometer facility, allowing it to improve its engine research and evaluation services to industries that use engines up to 7000 hp (5220 kW) for applications in transportation, pipe-lines and power generation.
SwRI performs large-engine services including alternative fuel evaluations, emissions research, control system development, engine performance im -provement, engine and component design services, fuel injection system development, standardized testing, modeling and noise evaluation.
The facility’s centerpiece is a Froude Hofmann model F63RE dyna-mometer rated to 8985 hp (6700 kW) and a maximum speed of 2500 rpm. The test cell’s support equipment (conditioned combustion air, cooling system, fuel mass-flow measurement and exhaust system) was designed to comfortably support 7000 hp (5220 kW) engines.
The first cell was completed in Sep-tember and the second cell is to be available in early 2015. All cells ac-commodate engines that use a variety of fuels, including natural gas, diesel and biodiesel, liquefied petroleum gas, dimethyl ether or Fischer-Tropsch gas-to-liquid fuels.
PrüftechnikDr. Thomas Rohe joined Prüf-
technik Dieter Busch AG as a mem-ber of the management board and has been named chief operating
officer with re-sponsibility for development, production and supply chain divisions.
Before join-ing Prüftechnik — located close to Munich, Ger-
many — Rohe held several executive positions in organizations in the fields of research and industry.
Dr. T. Rohe
CT516.indd 5 1/23/15 10:14 AM
JANUARY-FEBRUARY 2015 47 CompREssoRtech2
CumminsCummins Inc. has named Tracy Em-
bree president of its Components Group, effective Jan 1. Embree is a member of the Cummins Leadership Team, reporting to Chief Operating Officer Rich Freeland.
Embree succeeded Anant Talaulicar, who was serving as both both president of the Components Group while leading the company’s India Area Business Or-ganization. Talaulicar now serves solely as chairman and managing director of the India Area Business Organization.
Prior to serving as president of CTT, Embree worked in the midrange engine business where she was re-sponsible for the on-highway line of business. She has also held market-ing and sales positions in Cummins’ Emission Solutions and Filtration busi-nesses and was executive director of the Chrysler business. Embree also spent two years in the power genera-tion business as general manager for Cummins’ Energy Solutions Business in Kent, U.K.
MotortechMotortech has opened a training and
technical center at its headquarters in Celle, Germany.
The company, which makes ignition components, air/fuel ratio controllers and engine management systems for stationary gas engines, also is con-structing a research and development (R&D) center at the Celle factory.
The training center has workbench-es equipped with tools for working on gas regulation systems, including the company’s VariFuel2, and simulating the functions of the VariFuel2 and the EmCon5. There is also an engine sim-ulator and pickup tester.
The R&D building will provide ex-tra space and equipment for various departments, including electronic and software development, mechatronics and construction. It will have a sepa-rate laboratory for ignition tests.
ExterranExterran Holdings Inc. is separating its
international contract operations, inter-national aftermarket services and global fabrication businesses into a freestand-ing, publicly traded company (SpinCo).
Upon completion of the transaction, Exterran Holdings will be a pure-play U.S. compression services business named RemainCo. It will retain the sole general partner interest and cer-
tain limited partner interests that to-gether represent a 37% ownership in-terest in Exterran Partners, as well as all of the incentive distribution rights in Exterran Partners.
RemainCo will own and operate the remaining U.S. contract operations and U.S. aftermarket services businesses
MoversPRIME
SummitIndustrial Products
RELIABLESynthetic LubricantsCarryover Problem?
If you’re experiencing elevated carryover rates,it’s time to switch your compressors to Summit’sNGL and PGS Series synthetic lubricants. PGSlubricants result in lower make-up rates for oilflooded compressors. Switch to Summit’s NGLSeries in high pressure CO2 applications to eliminate cleaning of downstream piping, injectors and the formation in EOR applications.All NGL lubricants are UOP approved and can be used in refinery applications where catalystpoisoning is a concern. The carryover rate forSummit’s PGS and NGL lubricants is typically 1/6 the rate for petroleum oils.
Call us for Free Technical Support...we can help!
800.749.5823www.klsummit.com
Carryover Reliable Lube_Layout 1 1/21/2014 3:50 PM Page 1
Summit.indd 1 1/21/14 4:04 PM
continued on page 65
JanFeb_PrimeMovers.indd 1 1/23/15 10:15 AM
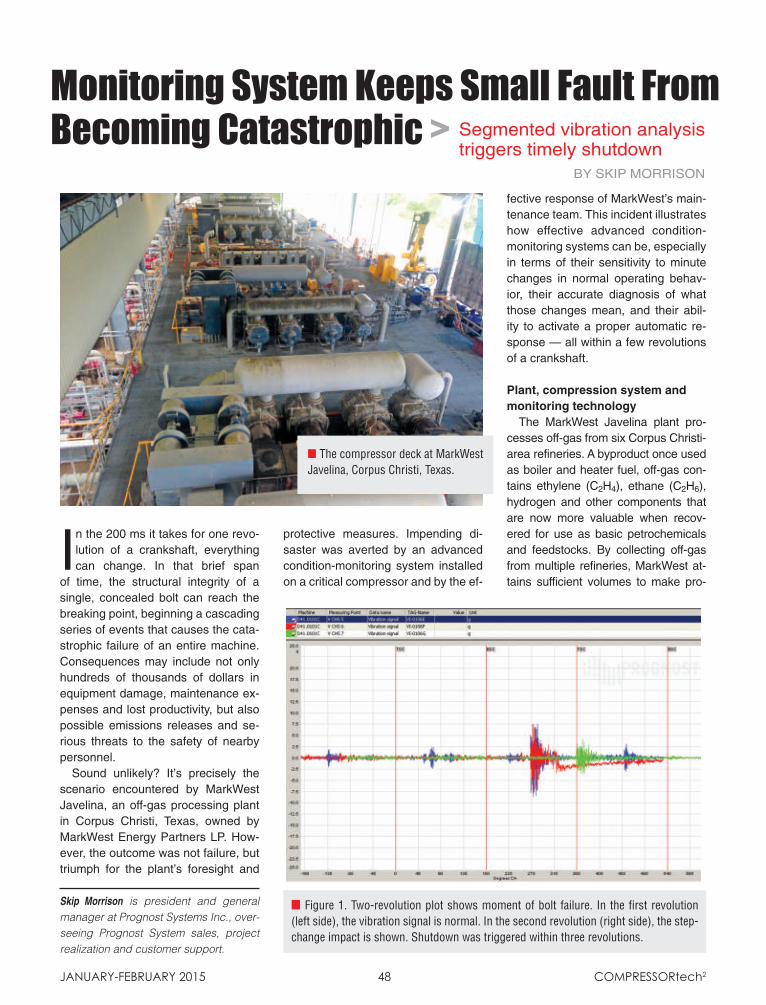
In the 200 ms it takes for one revo-lution of a crankshaft, everything can change. In that brief span
of time, the structural integrity of a single, concealed bolt can reach the breaking point, beginning a cascading series of events that causes the cata-strophic failure of an entire machine. Consequences may include not only hundreds of thousands of dollars in equipment damage, maintenance ex-penses and lost productivity, but also possible emissions releases and se-rious threats to the safety of nearby personnel.
Sound unlikely? It’s precisely the scenario encountered by MarkWest Javelina, an off-gas processing plant in Corpus Christi, Texas, owned by MarkWest Energy Partners LP. How-ever, the outcome was not failure, but triumph for the plant’s foresight and
protective measures. Impending di-saster was averted by an advanced condition-monitoring system installed on a critical compressor and by the ef-
fective response of MarkWest’s main-tenance team. This incident illustrat es how effective advanced condition-monitoring systems can be, especially in terms of their sensitivity to minute changes in normal operating behav-ior, their accurate diagnosis of what those changes mean, and their abil-ity to activate a proper automatic re-sponse — all within a few revolutions of a crankshaft.
Plant, compression system and monitoring technology
The MarkWest Javelina plant pro -cess es off-gas from six Corpus Christi-area refineries. A byproduct once used as boiler and heater fuel, off-gas con-tains ethylene (C2H4), ethane (C2H6), hydrogen and other components that are now more valuable when recov-ered for use as basic petrochemicals and feedstocks. By collecting off-gas from multiple refineries, MarkWest at-tains sufficient volumes to make pro-
Monitoring System Keeps Small Fault From Becoming Catastrophic > Segmented vibration analysis
triggers timely shutdownBy SkIP MorrISon
n The compressor deck at MarkWest Javelina, Corpus Christi, Texas.
JANUARY-FEBRUARY 2015 48 CompREssoRtech2
Skip Morrison is president and general manager at Prognost Systems Inc., over-seeing Prognost System sales, project realization and customer support.
n Figure 1. Two-revolution plot shows moment of bolt failure. In the first revolution (left side), the vibration signal is normal. In the second revolution (right side), the step-change impact is shown. Shutdown was triggered within three revolutions.
CT508.indd 1 1/23/15 9:06 AM

Monitoring System Keeps Small Fault From Becoming Catastrophic >
cessing and separating these compo-nents economically viable. With all six refineries online, MarkWest Javelina can process roughly 1.38 x 10⁸ scfd (3 x 10⁶ Nm3/d) of off-gas. From this supply, the plant generates more than 28,000 bbl/d of liquid hy drocarbons, including ethylene, eth ane, propylene (C3H6), propane (C3H8), butane (C4H10) and natural gasoline, as well as 3 x 10⁷ scfd (849,000 Nm3/d) of hydrogen.
The process at MarkWest Javelina begins by running off-gas through an amine unit and Sulferox unit to scrub hydrogen sulfide (H2S) and carbon di-oxide (CO2). Then, an inlet gas com-pression system boosts gas pressure to send it to a dehydrator unit and cryo -genic plant for separation into each hy -drocarbon component.
The massive gas compression sys-tem consists of four Cooper-Bessemer LM-8 reciprocating compressors, each with eight throws and two stages. A synchronous electric drive operates at a maximum speed of 257 rpm and 8173 hp (6010 kW). Inlet pressure is 60 psia (4 bar) and discharge pres-sure is 575 psia (39 bar).
Off-gas is a notoriously unpredict-able and challenging application for a compressor. The presence of incom-pressible substances and the com-position and molecular weight of gas received by MarkWest Javelina can change significantly from hour to hour depending upon operating conditions at each of the six refineries. Neverthe-less, the reliability of the compression system is crucial to operations.
When the plant first opened in 1990, the compressors were protected by simple mechanical vibration switches (“earthquake switches”), which met American Petroleum Institute (API) [1] standards at the time. Although these switches provided some basic shutdown protection, they offered no indication of the source or severity of a problem. With large, eight-throw machines, finding the cause of a trip was often time-consuming and costly. The reliability of the switches was also questioned as plant personnel expe-rienced frequent “nuisance” (false) trips, as well as some switches that failed to activate when needed.
flywheel, acceleration sensors on all crosshead guides, velocity sensors on all rear pedestal bearings, and eddy- current piston rod position sensors on the first-stage cylinders.
The Prognost-NT system uses a unique segmented crank angle (root mean square [RMS]) vibration analysis for extreme precision. This capability subdivides each time waveform into 36 individual, 10-degree segments, treating
JANUARY-FEBRUARY 2015 49 CompREssoRtech2
YOUR BEST SOURCE FOR LUBRICATION SYSTEMS SINCE 1922.
1.800.722.0250 | [email protected]
www.SloanLubrication.com
Sloan Lubrication puts extraordinary attention and expertise into designing and applying the ideal components. We do the legwork and you get the results you need: the most accurate, dependable and protected lubrication solution for your reciprocating and rotary equipment.
We focus on one thing and one thing only ― providing you with the highest quality lubrication systems and service.
Contact Sloan today to ensure your systems are optimally protected.
Untitled-5 1 1/14/15 3:48 PM
The critical importance of the com-pressor units led to a decision in 2005 to improve protection and add predic-tive maintenance capabilities with an advanced condition-monitoring sys-tem. The technology selected was a Prognost-NT system providing safety protection, early failure detection, wear monitoring (for first-stage cylinders) and process data integration. Sen-sor hardware on the compressors in-cluded a phase-angle trigger on the continued on page 50
CT508.indd 2 1/23/15 9:06 AM
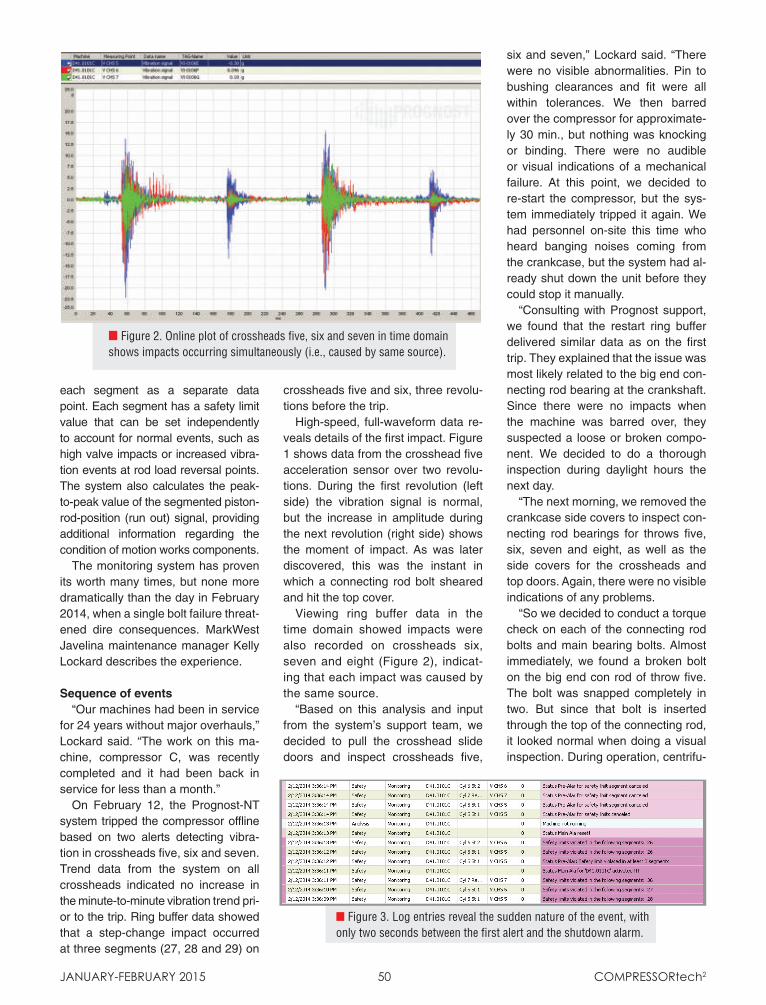
each segment as a separate data point. Each segment has a safety limit value that can be set independently to account for normal events, such as high valve impacts or increased vibra-tion events at rod load reversal points. The system also calculates the peak-to-peak value of the segmented piston-rod-position (run out) signal, providing additional information regarding the condition of motion works components.
The monitoring system has proven its worth many times, but none more dramatically than the day in February 2014, when a single bolt failure threat-ened dire consequences. MarkWest Javelina maintenance manager Kelly Lockard describes the experience.
Sequence of events“Our machines had been in service
for 24 years without major overhauls,” Lockard said. “The work on this ma-chine, compressor C, was recently completed and it had been back in service for less than a month.”
On February 12, the Prognost-NT system tripped the compressor offline based on two alerts detecting vibra-tion in crossheads five, six and seven. Trend data from the system on all crossheads indicated no increase in the minute-to-minute vibration trend pri-or to the trip. Ring buffer data showed that a step-change impact occurred at three segments (27, 28 and 29) on
crossheads five and six, three revolu-tions before the trip.
High-speed, full-waveform data re-veals details of the first impact. Figure 1 shows data from the crosshead five acceleration sensor over two revolu-tions. During the first revolution (left side) the vibration signal is normal, but the increase in amplitude during the next revolution (right side) shows the moment of impact. As was later discovered, this was the instant in which a connecting rod bolt sheared and hit the top cover.
Viewing ring buffer data in the time domain showed impacts were also recorded on crossheads six, seven and eight (Figure 2), indicat-ing that each impact was caused by the same source.
“Based on this analysis and input from the system’s support team, we decided to pull the crosshead slide doors and inspect crossheads five,
six and seven,” Lockard said. “There were no visible abnormalities. Pin to bushing clearances and fit were all within tolerances. We then barred over the compressor for approximate-ly 30 min., but nothing was knocking or binding. There were no audible or visual indications of a mechanical failure. At this point, we decided to re-start the compressor, but the sys-tem immediately tripped it again. We had personnel on-site this time who heard banging noises coming from the crankcase, but the system had al-ready shut down the unit before they could stop it manually.
“Consulting with Prognost support, we found that the restart ring buffer delivered similar data as on the first trip. They explained that the issue was most likely related to the big end con-necting rod bearing at the crankshaft. Since there were no impacts when the machine was barred over, they suspected a loose or broken compo-nent. We decided to do a thorough inspection during daylight hours the next day.
“The next morning, we removed the crankcase side covers to inspect con-necting rod bearings for throws five, six, seven and eight, as well as the side covers for the crossheads and top doors. Again, there were no visible indications of any problems.
“So we decided to conduct a torque check on each of the connecting rod bolts and main bearing bolts. Almost immediately, we found a broken bolt on the big end con rod of throw five. The bolt was snapped completely in two. But since that bolt is inserted through the top of the connecting rod, it looked normal when doing a visual inspection. During operation, centrifu-
n Figure 3. Log entries reveal the sudden nature of the event, with only two seconds between the first alert and the shutdown alarm.
JANUARY-FEBRUARY 2015 50 CompREssoRtech2
n Figure 2. Online plot of crossheads five, six and seven in time domain shows impacts occurring simultaneously (i.e., caused by same source).
CT508.indd 3 1/26/15 1:29 PM
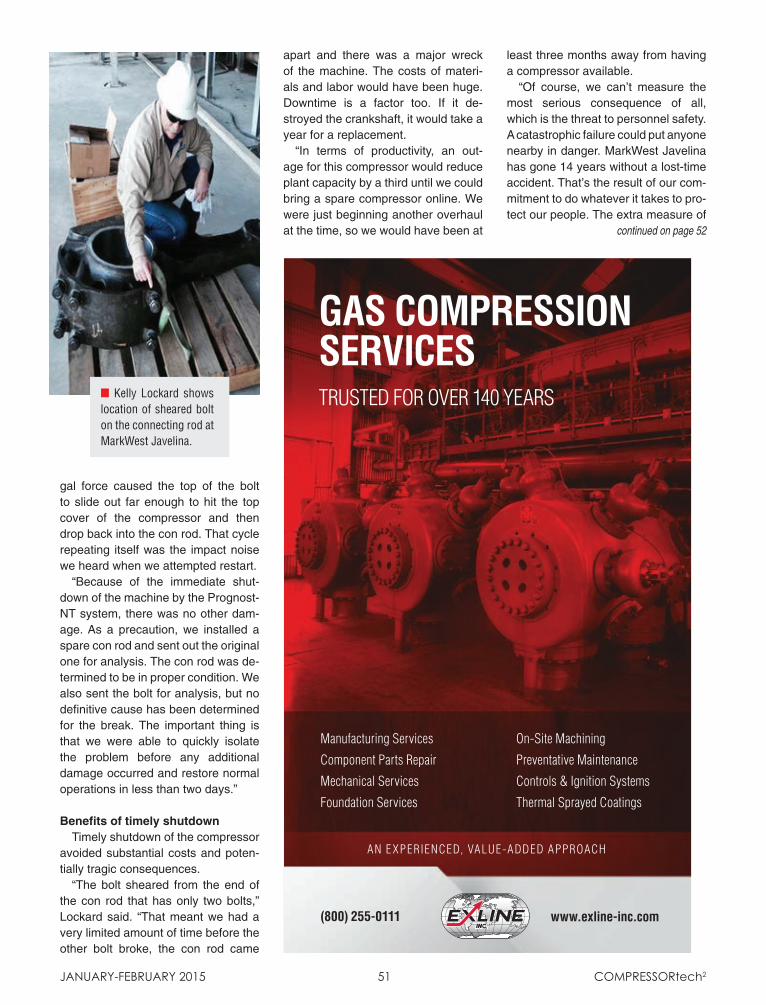
n Kelly Lockard shows location of sheared bolt on the connecting rod at MarkWest Javelina.
gal force caused the top of the bolt to slide out far enough to hit the top cover of the compressor and then drop back into the con rod. That cycle repeating itself was the impact noise we heard when we attempted restart.
“Because of the immediate shut-down of the machine by the Prognost-NT system, there was no other dam-age. As a precaution, we installed a spare con rod and sent out the original one for analysis. The con rod was de-termined to be in proper condition. We also sent the bolt for analysis, but no definitive cause has been determined for the break. The important thing is that we were able to quickly isolate the problem before any additional damage occurred and restore normal operations in less than two days.”
Benefits of timely shutdownTimely shutdown of the compressor
avoided substantial costs and poten-tially tragic consequences.
“The bolt sheared from the end of the con rod that has only two bolts,” Lockard said. “That meant we had a very limited amount of time before the other bolt broke, the con rod came
JANUARY-FEBRUARY 2015 51 CompREssoRtech2
least three months away from having a compressor available.
“Of course, we can’t measure the most serious consequence of all, which is the threat to personnel safety. A catastrophic failure could put anyone nearby in danger. MarkWest Javelina has gone 14 years without a lost-time accident. That’s the result of our com-mitment to do whatever it takes to pro-tect our people. The extra measure of
GAS COMPRESSIONSERVICESTRUSTED FOR OVER 140 YEARS
Manufacturing Services
Component Parts Repair
Mechanical Services
Foundation Services
On-Site Machining
Preventative Maintenance
Controls & Ignition Systems
Thermal Sprayed Coatings
A N E XPERIENCED, VALUE-ADDED APPROACH
(800) 255-0111 www.exline-inc.com
Exline.indd 1 8/15/14 3:23 PM
apart and there was a major wreck of the machine. The costs of materi-als and labor would have been huge. Downtime is a factor too. If it de-stroyed the crankshaft, it would take a year for a replacement.
“In terms of productivity, an out-age for this compressor would reduce plant capacity by a third until we could bring a spare compressor online. We were just beginning another overhaul at the time, so we would have been at continued on page 52
CT508.indd 4 1/26/15 1:31 PM
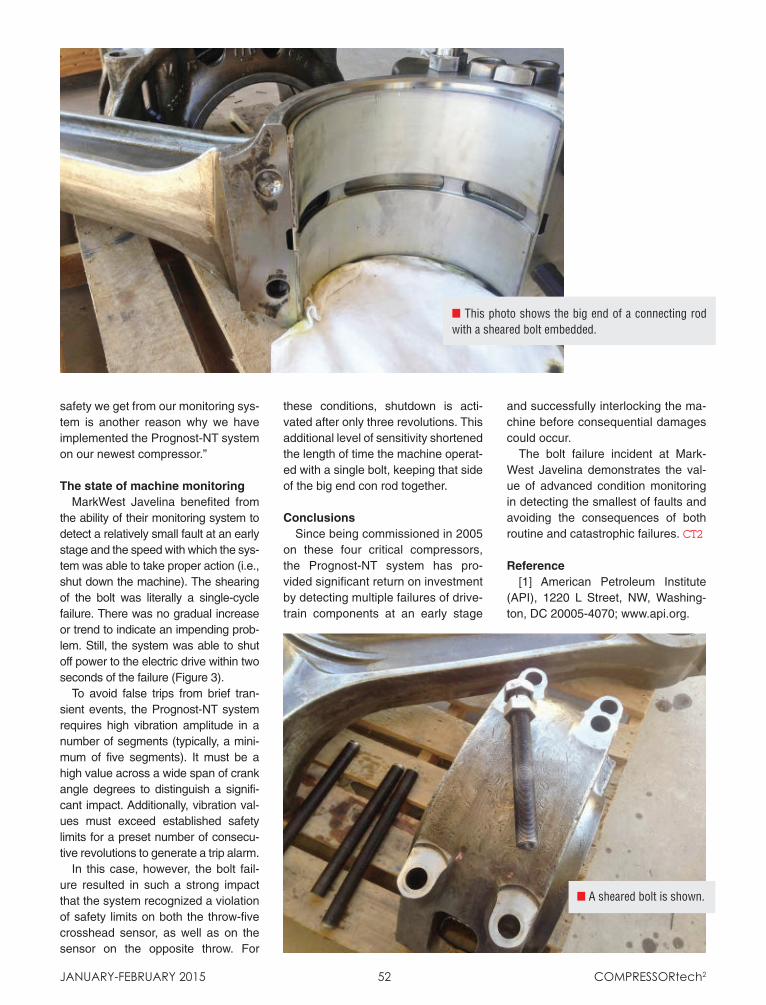
safety we get from our monitoring sys-tem is another reason why we have implemented the Prognost-NT system on our newest compressor.”
The state of machine monitoringMarkWest Javelina benefited from
the ability of their monitoring system to detect a relatively small fault at an early stage and the speed with which the sys-tem was able to take proper action (i.e., shut down the machine). The shearing of the bolt was literally a single-cycle failure. There was no gradual increase or trend to indicate an impending prob-lem. Still, the system was able to shut off power to the electric drive within two seconds of the failure (Figure 3).
To avoid false trips from brief tran-sient events, the Prognost-NT system requires high vibration amplitude in a number of segments (typically, a mini-mum of five segments). It must be a high value across a wide span of crank angle degrees to distinguish a signifi-cant impact. Additionally, vibration val-ues must exceed established safety limits for a preset number of consecu-tive revolutions to generate a trip alarm.
In this case, however, the bolt fail-ure resulted in such a strong impact that the system recognized a violation of safety limits on both the throw-five crosshead sensor, as well as on the sensor on the opposite throw. For
these conditions, shutdown is acti-vated after only three revolutions. This additional level of sensitivity shortened the length of time the machine operat-ed with a single bolt, keeping that side of the big end con rod together.
ConclusionsSince being commissioned in 2005
on these four critical compressors, the Prognost-NT system has pro-vided significant return on investment by detecting multiple failures of drive-train components at an early stage
and successfully interlocking the ma-chine before consequential damages could occur.
The bolt failure incident at Mark-West Javelina demonstrates the val-ue of advanced condition monitoring in detecting the smallest of faults and avoiding the consequences of both routine and catastrophic failures. CT2
Reference[1] American Petroleum Institute
(API), 1220 L Street, NW, Washing-ton, DC 20005-4070; www.api.org.
JANUARY-FEBRUARY 2015 52 CompREssoRtech2
n This photo shows the big end of a connecting rod with a sheared bolt embedded.
n A sheared bolt is shown.
CT508.indd 5 1/26/15 1:34 PM

Put our experience to work for you.Call 918-317-2611 or visit www.fwmurphy.com/ct2centurion
It takes years of application knowledge and experience with leading controls and instrumentation to develop the best solutions. Murphy by Enovation Controls has 75 years of experience putting quality panels in the �eld and keeping them running.
AUTOMATIONIS NOT AUTOMATIC
As a natural gas certi�ed hazardous area provider, our team provides superior, reliable panel systems tailored for the market. We integrate Murphy’s rugged products as well as the leading PLC brands to create a solution to �t your application.
INNOVATIVE SOLUTIONS
LIFETIME SUPPORTService after the sale is our priority. With personnel dedicated to start-up assistance, in-�eld application support and 24-hour technical support, you have a partner to rely on for the life of your Murphy panel.
•Rockwell •GE •Siemens
01/15 1511621
PLCS SUPPORTED
Murphy.indd 1 1/21/15 8:40 AM
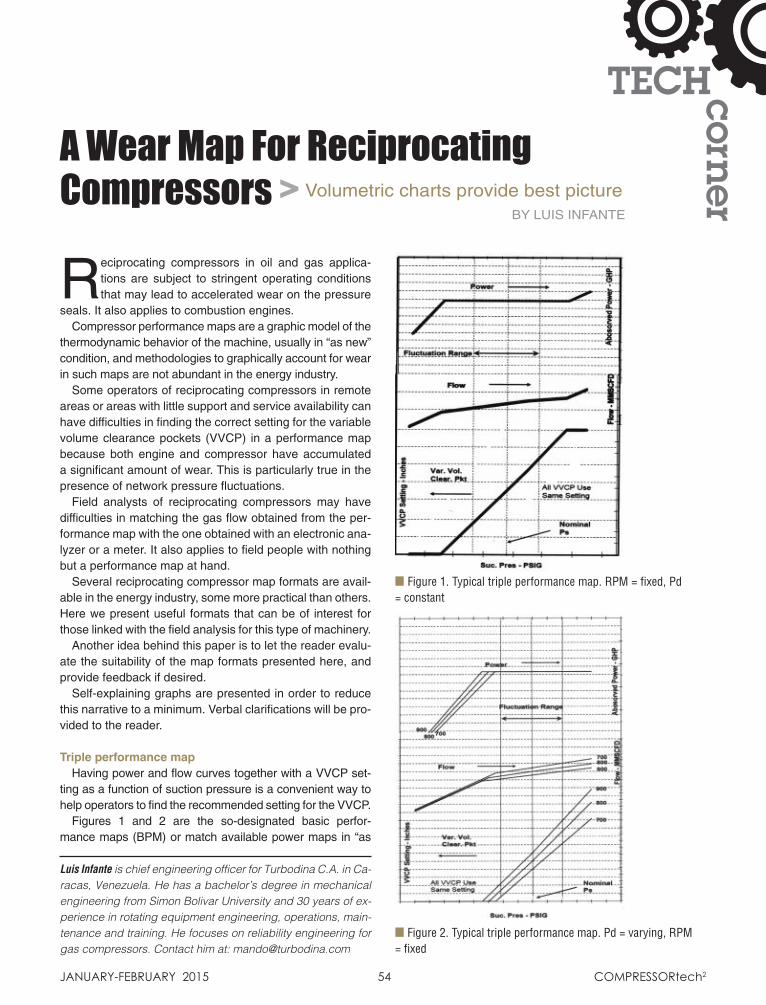
Luis Infante is chief engineering officer for Turbodina C.A. in Ca-racas, Venezuela. He has a bachelor’s degree in mechanical engineering from Simon Bolivar University and 30 years of ex-perience in rotating equipment engineering, operations, main-tenance and training. He focuses on reliability engineering for gas compressors. Contact him at: [email protected]
A Wear Map For Reciprocating Compressors >
Reciprocating compressors in oil and gas applica-tions are subject to stringent operating conditions that may lead to accelerated wear on the pressure
seals. It also applies to combustion engines.Compressor performance maps are a graphic model of the
thermodynamic behavior of the machine, usually in “as new” condition, and methodologies to graphically account for wear in such maps are not abundant in the energy industry.
Some operators of reciprocating compressors in remote areas or areas with little support and service availability can have difficulties in finding the correct setting for the variable volume clearance pockets (VVCP) in a performance map because both engine and compressor have accumulated a significant amount of wear. This is particularly true in the presence of network pressure fluctuations.
Field analysts of reciprocating compressors may have difficulties in matching the gas flow obtained from the per-formance map with the one obtained with an electronic ana-lyzer or a meter. It also applies to field people with nothing but a performance map at hand.
Several reciprocating compressor map formats are avail-able in the energy industry, some more practical than others. Here we present useful formats that can be of interest for those linked with the field analysis for this type of machinery.
Another idea behind this paper is to let the reader evalu-ate the suitability of the map formats presented here, and provide feedback if desired.
Self-explaining graphs are presented in order to reduce this narrative to a minimum. Verbal clarifications will be pro-vided to the reader.
Triple performance mapHaving power and flow curves together with a VVCP set-
ting as a function of suction pressure is a convenient way to help operators to find the recommended setting for the VVCP.
Figures 1 and 2 are the so-designated basic perfor-mance maps (BPM) or match available power maps in “as
TECHcorner
january-february 2015 54 Compressortech2
Volumetric charts provide best pictureBy LuIS InFAnTe
n Figure 1. Typical triple performance map. RPM = fixed, Pd = constant
n Figure 2. Typical triple performance map. Pd = varying, RPM = fixed
CT495.indd 1 1/23/15 10:26 AM

Sogat.indd 1 1/13/15 10:13 AM
new” condition. The key points for the three curves are the vertices where the curves break. Of course the three curves break at the same Ps where the driver becomes overloaded.
Operation outside performance map
Figures 3 and 4 help an operator in the field to estimate the performance for an arbitrary VVCP setting.
Let’s suppose the operator sets the VVCP in the S (sensitive) set-ting shown in Figure 3. Resultant flow can be estimated by linear ex-trapolation based upon the dotted flow line extending from the vertice. X, Y and X’ can be determined from the vertical axes scales or with a measuring tape on the graph. Y’ flow change can be cleared from the pro-portionality relationship:
X/X’ = Y/Y’
Use the same approach for power. In such a way one can skip the use of a PC on the field.
line, the result of suction pressure fluctuations, is between the slopes of the lines at vertices. At its own, the slope of the brown flow line is fairly parallel to the lines at vertices.
n Figure 3. Sensitive operating-point estimation.
n Figure 4. “What if?” performance map. Variations in Ps and VVCP setting.
A sensitive (S) setting can be either a result of an incorrect adjustment from the operator or a result from a pressure fluctuation.
Figure 4 illustrates how to deal with S settings. The slope of the brown power continued on page 56
CT495.indd 2 1/23/15 10:26 AM
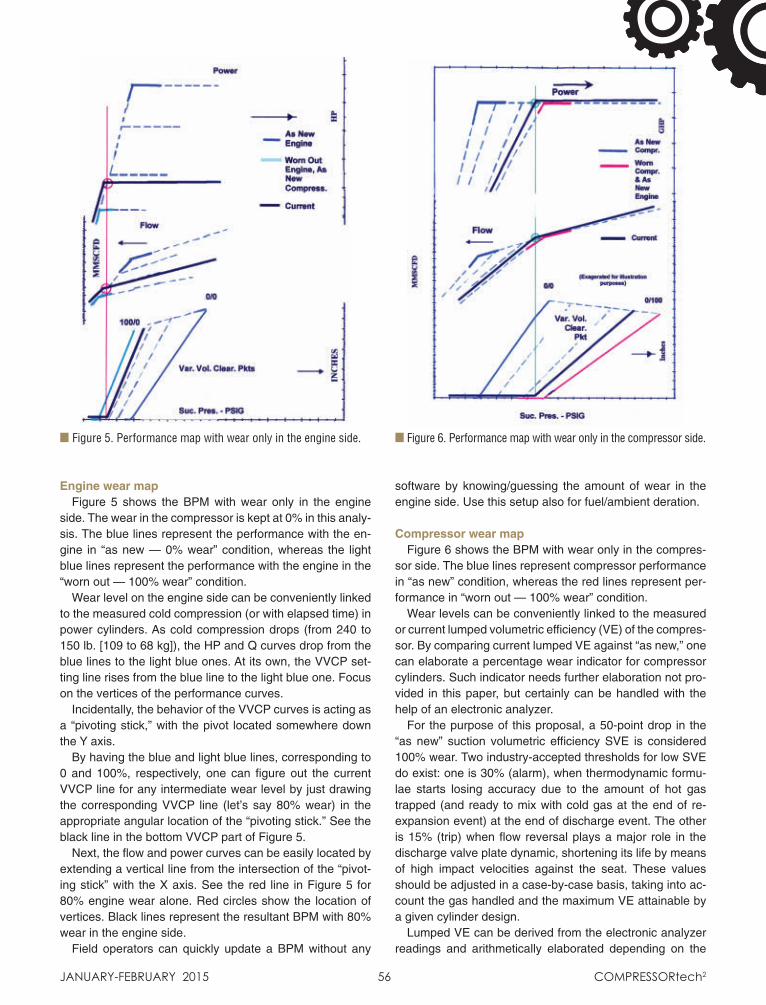
january-february 2015 56 Compressortech2
Engine wear mapFigure 5 shows the BPM with wear only in the engine
side. The wear in the compressor is kept at 0% in this analy-sis. The blue lines represent the performance with the en-gine in “as new — 0% wear” condition, whereas the light blue lines represent the performance with the engine in the “worn out — 100% wear” condition.
Wear level on the engine side can be conveniently linked to the measured cold compression (or with elapsed time) in power cylinders. As cold compression drops (from 240 to 150 lb. [109 to 68 kg]), the HP and Q curves drop from the blue lines to the light blue ones. At its own, the VVCP set-ting line rises from the blue line to the light blue one. Focus on the vertices of the performance curves.
Incidentally, the behavior of the VVCP curves is acting as a “pivoting stick,” with the pivot located somewhere down the Y axis.
By having the blue and light blue lines, corresponding to 0 and 100%, respectively, one can figure out the current VVCP line for any intermediate wear level by just drawing the corresponding VVCP line (let’s say 80% wear) in the appropriate angular location of the “pivoting stick.” See the black line in the bottom VVCP part of Figure 5.
Next, the flow and power curves can be easily located by extending a vertical line from the intersection of the “pivot-ing stick” with the X axis. See the red line in Figure 5 for 80% engine wear alone. Red circles show the location of vertices. Black lines represent the resultant BPM with 80% wear in the engine side.
Field operators can quickly update a BPM without any
software by knowing/guessing the amount of wear in the engine side. Use this setup also for fuel/ambient deration.
Compressor wear mapFigure 6 shows the BPM with wear only in the compres-
sor side. The blue lines represent compressor performance in “as new” condition, whereas the red lines represent per-formance in “worn out — 100% wear” condition.
Wear levels can be conveniently linked to the measured or current lumped volumetric efficiency (VE) of the compres-sor. By comparing current lumped VE against “as new,” one can elaborate a percentage wear indicator for compressor cylinders. Such indicator needs further elaboration not pro-vided in this paper, but certainly can be handled with the help of an electronic analyzer.
For the purpose of this proposal, a 50-point drop in the “as new” suction volumetric efficiency SVE is considered 100% wear. Two industry-accepted thresholds for low SVE do exist: one is 30% (alarm), when thermodynamic formu-lae starts losing accuracy due to the amount of hot gas trapped (and ready to mix with cold gas at the end of re-expansion event) at the end of discharge event. The other is 15% (trip) when flow reversal plays a major role in the discharge valve plate dynamic, shortening its life by means of high impact velocities against the seat. These values should be adjusted in a case-by-case basis, taking into ac-count the gas handled and the maximum VE attainable by a given cylinder design.
Lumped VE can be derived from the electronic analyzer readings and arithmetically elaborated depending on the
n Figure 5. Performance map with wear only in the engine side. n Figure 6. Performance map with wear only in the compressor side.
CT495.indd 3 1/23/15 10:26 AM
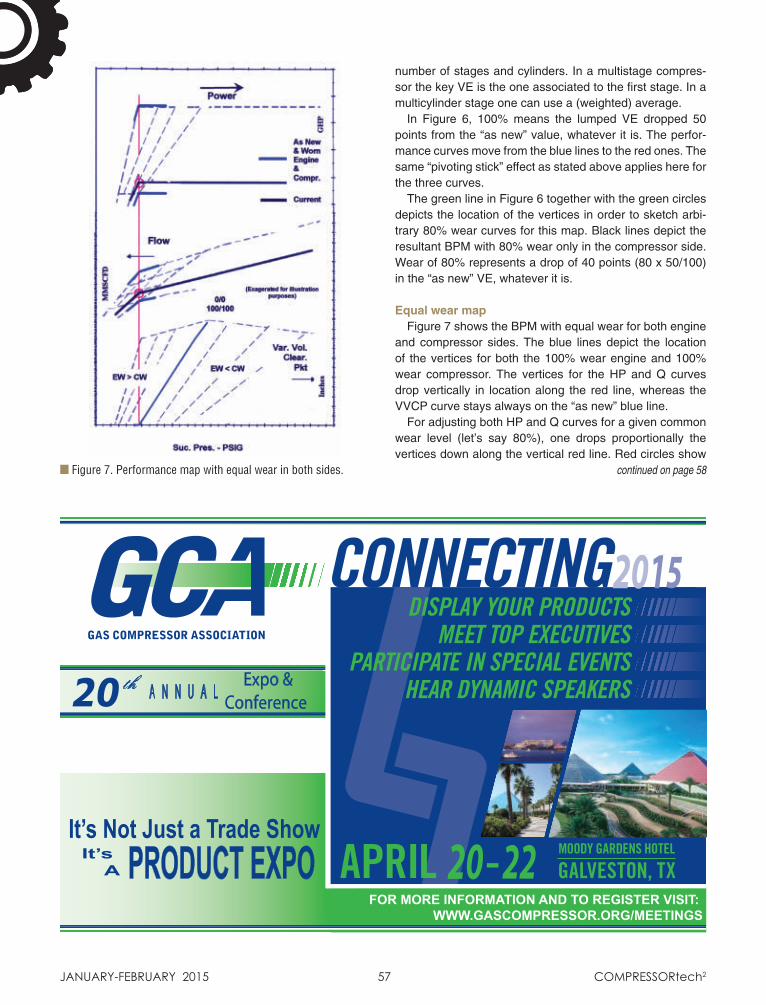
FOR MORE INFORMATION AND TO REGISTER VISIT: WWW.GASCOMPRESSOR.ORG/MEETINGS
GCA.indd 1 1/21/15 8:27 AMjanuary-february 2015 57 Compressortech2
number of stages and cylinders. In a multistage compres-sor the key VE is the one associated to the first stage. In a multicylinder stage one can use a (weighted) average.
In Figure 6, 100% means the lumped VE dropped 50 points from the “as new” value, whatever it is. The perfor-mance curves move from the blue lines to the red ones. The same “pivoting stick” effect as stated above applies here for the three curves.
The green line in Figure 6 together with the green circles depicts the location of the vertices in order to sketch arbi-trary 80% wear curves for this map. Black lines depict the resultant BPM with 80% wear only in the compressor side. Wear of 80% represents a drop of 40 points (80 x 50/100) in the “as new” VE, whatever it is.
Equal wear mapFigure 7 shows the BPM with equal wear for both engine
and compressor sides. The blue lines depict the location of the vertices for both the 100% wear engine and 100% wear compressor. The vertices for the HP and Q curves drop vertically in location along the red line, whereas the VVCP curve stays always on the “as new” blue line.
For adjusting both HP and Q curves for a given common wear level (let’s say 80%), one drops proportionally the vertices down along the vertical red line. Red circles show
continued on page 58n Figure 7. Performance map with equal wear in both sides.
CT495.indd 4 1/23/15 10:26 AM
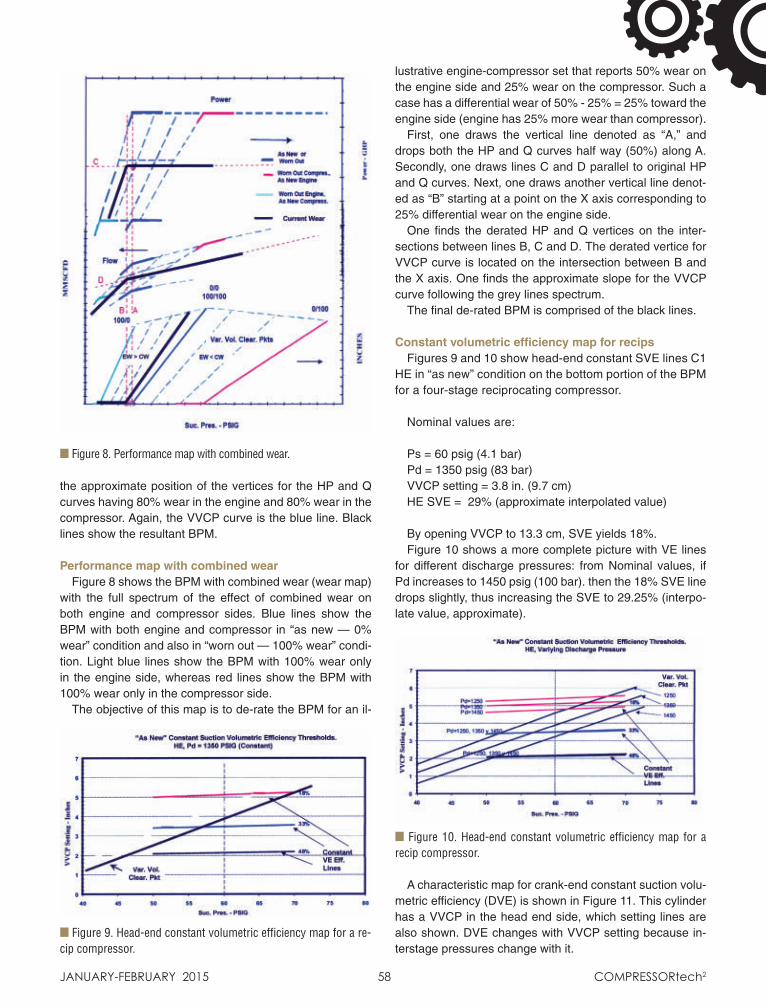
january-february 2015 58 Compressortech2
the approximate position of the vertices for the HP and Q curves having 80% wear in the engine and 80% wear in the compressor. Again, the VVCP curve is the blue line. Black lines show the resultant BPM.
Performance map with combined wearFigure 8 shows the BPM with combined wear (wear map)
with the full spectrum of the effect of combined wear on both engine and compressor sides. Blue lines show the BPM with both engine and compressor in “as new — 0% wear” condition and also in “worn out — 100% wear” condi-tion. Light blue lines show the BPM with 100% wear only in the engine side, whereas red lines show the BPM with 100% wear only in the compressor side.
The objective of this map is to de-rate the BPM for an il-
lustrative engine-compressor set that reports 50% wear on the engine side and 25% wear on the compressor. Such a case has a differential wear of 50% - 25% = 25% toward the engine side (engine has 25% more wear than compressor).
First, one draws the vertical line denoted as “A,” and drops both the HP and Q curves half way (50%) along A. Secondly, one draws lines C and D parallel to original HP and Q curves. Next, one draws another vertical line denot-ed as “B” starting at a point on the X axis corresponding to 25% differential wear on the engine side.
One finds the derated HP and Q vertices on the inter-sections between lines B, C and D. The derated vertice for VVCP curve is located on the intersection between B and the X axis. One finds the approximate slope for the VVCP curve following the grey lines spectrum.
The final de-rated BPM is comprised of the black lines.
Constant volumetric efficiency map for recipsFigures 9 and 10 show head-end constant SVE lines C1
HE in “as new” condition on the bottom portion of the BPM for a four-stage reciprocating compressor.
Nominal values are:
Ps = 60 psig (4.1 bar)Pd = 1350 psig (83 bar)VVCP setting = 3.8 in. (9.7 cm)HE SVE = 29% (approximate interpolated value)
By opening VVCP to 13.3 cm, SVE yields 18%. Figure 10 shows a more complete picture with VE lines
for different discharge pressures: from Nominal values, if Pd increases to 1450 psig (100 bar). then the 18% SVE line drops slightly, thus increasing the SVE to 29.25% (interpo-late value, approximate).
A characteristic map for crank-end constant suction volu-metric efficiency (DVE) is shown in Figure 11. This cylinder has a VVCP in the head end side, which setting lines are also shown. DVE changes with VVCP setting because in-terstage pressures change with it.
n Figure 8. Performance map with combined wear.
n Figure 9. Head-end constant volumetric efficiency map for a re-cip compressor.
n Figure 10. Head-end constant volumetric efficiency map for a recip compressor.
CT495.indd 5 1/23/15 10:27 AM
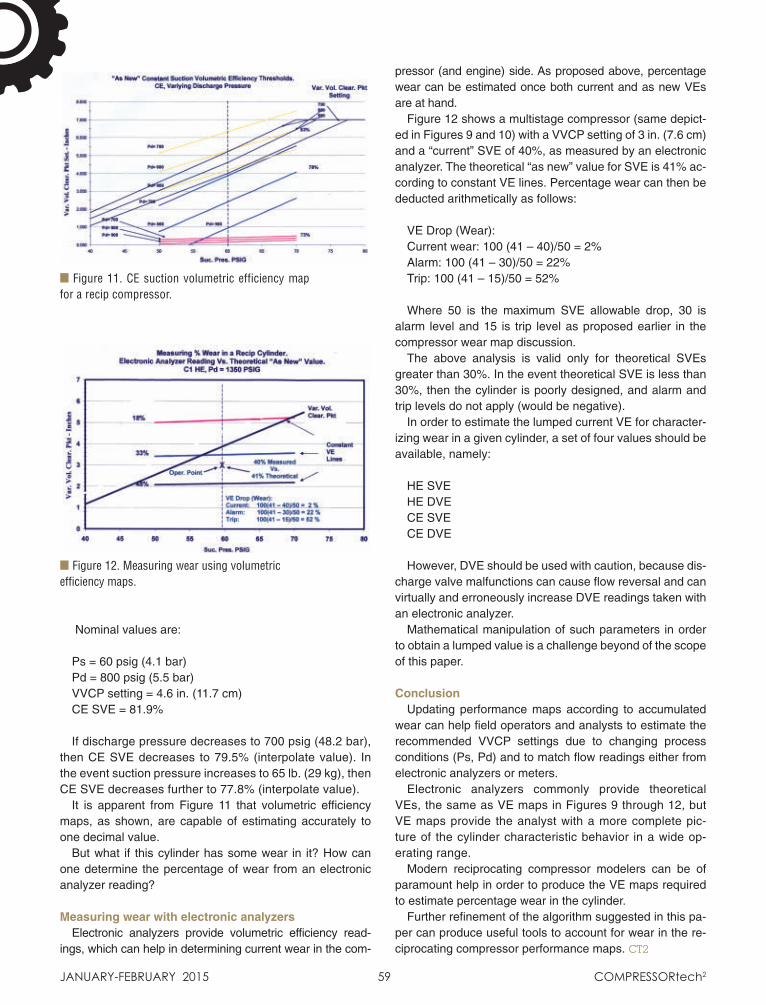
Nominal values are:
Ps = 60 psig (4.1 bar)Pd = 800 psig (5.5 bar)VVCP setting = 4.6 in. (11.7 cm)CE SVE = 81.9%
If discharge pressure decreases to 700 psig (48.2 bar), then CE SVE decreases to 79.5% (interpolate value). In the event suction pressure increases to 65 lb. (29 kg), then CE SVE decreases further to 77.8% (interpolate value).
It is apparent from Figure 11 that volumetric efficiency maps, as shown, are capable of estimating accurately to one decimal value.
But what if this cylinder has some wear in it? How can one determine the percentage of wear from an electronic analyzer reading?
Measuring wear with electronic analyzersElectronic analyzers provide volumetric efficiency read-
ings, which can help in determining current wear in the com-
pressor (and engine) side. As proposed above, percentage wear can be estimated once both current and as new VEs are at hand.
Figure 12 shows a multistage compressor (same depict-ed in Figures 9 and 10) with a VVCP setting of 3 in. (7.6 cm) and a “current” SVE of 40%, as measured by an electronic analyzer. The theoretical “as new” value for SVE is 41% ac-cording to constant VE lines. Percentage wear can then be deducted arithmetically as follows:
VE Drop (Wear):Current wear: 100 (41 – 40)/50 = 2%Alarm: 100 (41 – 30)/50 = 22%Trip: 100 (41 – 15)/50 = 52%
Where 50 is the maximum SVE allowable drop, 30 is alarm level and 15 is trip level as proposed earlier in the compressor wear map discussion.
The above analysis is valid only for theoretical SVEs greater than 30%. In the event theoretical SVE is less than 30%, then the cylinder is poorly designed, and alarm and trip levels do not apply (would be negative).
In order to estimate the lumped current VE for character-izing wear in a given cylinder, a set of four values should be available, namely:
HE SVEHE DVECE SVECE DVE
However, DVE should be used with caution, because dis-charge valve malfunctions can cause flow reversal and can virtually and erroneously increase DVE readings taken with an electronic analyzer.
Mathematical manipulation of such parameters in order to obtain a lumped value is a challenge beyond of the scope of this paper.
ConclusionUpdating performance maps according to accumulated
wear can help field operators and analysts to estimate the recommended VVCP settings due to changing process conditions (Ps, Pd) and to match flow readings either from electronic analyzers or meters.
Electronic analyzers commonly provide theoretical VEs, the same as VE maps in Figures 9 through 12, but VE maps provide the analyst with a more complete pic-ture of the cylinder characteristic behavior in a wide op-erating range.
Modern reciprocating compressor modelers can be of paramount help in order to produce the VE maps required to estimate percentage wear in the cylinder.
Further refinement of the algorithm suggested in this pa-per can produce useful tools to account for wear in the re-ciprocating compressor performance maps. CT2
january-february 2015 59 Compressortech2
n Figure 11. CE suction volumetric efficiency map for a recip compressor.
n Figure 12. Measuring wear using volumetric efficiency maps.
CT495.indd 6 1/23/15 10:27 AM

Editor’s Note: This paper summa-rizes a presentation that P.S. Omrani and Andre Eijk, both with TNO, made at the Ninth Conference of the Europe-an Forum for Reciprocating Compres-sors on Sept. 12 in Vienna. Contact the authors at: [email protected] or [email protected].
The working principle of a reciprocating compressor is based on the compression of gas.
Due to incompressibility of the liquid phase, the compressor is incapable of handling the liquid carryover inside the compressor cylinders.
Liquid is harmful to a compressor not only because it imposes significant hydraulic forces, which may result in loss of containment (typically head cover dislodged), but it also literally “washes away” any protective and lubricating effects of compressor oil and rider materials.
Thus, it is desired to design and operate a reciprocating compressor system
to prevent liquid problems in the system.This was also concluded from a reli
ability survey conducted by the R&D group of the European Forum for Reciprocating Compressors (EFRC).
For these reasons, EFRC decided to start an R&D project on the development of guidelines on how to avoid liquid problems in reciprocating compressor systems.
Liquid carryover to compressor cy l inders could be due to inefficient sep aration, condensation in upstream com ponents or excessive cylinder lubrication for the lubricated machine.
Additionally, the amount and the form of liquid entering the compressor cylinder have an effect on the extent of the damage, which can ultimately be a catastrophic failure and loss of process containment.
Until now, there were no standard and detailed guidelines on how to prevent liquid problems in compressor systems, especially for reciprocating compressors.
There are some design rules indicated in section 7.7.1.4, API Standard 618, Fifth Edition, which are summarized as follows:
• Liquid separator shall be as close as possible to the compressor suction side
• Separator efficiency over the operating flow rates shall be maintained
• Sufficient separator volume to handle incoming slugs
• Sufficient gas velocity in the line from the separator to the cylinder to minimize liquid dropout
• Elimination of low points between the separator and cylinder
• Sloping of the piping system• Insulation to minimize heat losses• Heat tracing to maintain the gas tem
perature at or above the dew point.It is of general opinion that the API
618 guidelines on preventing liquid carryover problems give too little information and guidance for this specific problem.
Avoiding Liquid Carryover Problems In Recip Compressors > EFRC guidelines offer solutions
n Table 1. Comparison of the characteristics of gas/liquid separators. Explanation of used symbols: -- is very low, - is low, 0 is moderate, + is high, ++ is very high.
JANUARY-FEBRUARY 2015 60 CompREssoRtech2
Type Of SeparatorsSlug
Handlingc
Droplet Handling
Turndown Ratiod
Pressure Dropd Fouling Tolerance
Vertical KnockoutDrums + ++ ++
Horizontal Knockout-Drums ++ ++ ++
Cyclone With Tangential Inlet + + 0 + ++
Cyclone With Straight Line And Swirler ++ + 0 + 0
Horizontal Vane-Typea + + 0 /e
Vertical VaneType (Inline)a 0 0 /e
Vertical VaneType (Vertical)a + + 0 /e
Horizontal Wire Mesha ++ ++ /e
Vertical Wire Mesha 0 ++ /e
Cyclone Packs With Wire Mesha ++ ++ + 0 0/
Cyclone Packs With Vane Packa ++ ++ 0 0 0/
Coalescers ++ ++b ++ a These demisters are combined with a knockout drum. b Limited by droplet size and entrainment onset. c Slug handling of each device can be improved with a suitable inlet device. d See Annex A in the full presentation for values of turndown ratio and approximated pressure drop. e Depends on the type of wire mesh or vane pack.
continued on page 62
CT484.indd 1 1/26/15 2:51 PM

Where information meets operationIntroducing Production Asset Reliability from GE’s Bently Nevada* product line and Meridium. We’ve integrated two of today’s most trusted software solutions to optimize performance, minimize risk, and ultimately, strengthen the connection between machines, people and processes.
Imagination at work
GE Measurement & Control
productionassetreliability.com*A registered trademark of General Electric Company.
GE.indd 1 1/21/15 9:04 AM
The EFRC R&D team conducted a number of interviews and decided that API 618, together with some in-ternal guidelines from the interviewed companies, could be used to prevent liquid carryover problems.
The team also concluded that during the design of a complete compressor system, components such as dampers and piping are not chosen with respect to avoiding liquid problems. For that reason, more detailed and quantitative rules and guidelines are required for the basic design and operation of recipro-cating compressor systems to ensure a safe, reliable and efficient operation of the complete system for the long term with respect to liquid carryover.
For instance, guidelines in choos-ing an appropriate type of a separator, pipe layout with an adequate sloping, etc., should be addressed and ex-plained in the guidelines. Thus, de-veloping guidelines on how to prevent liquid carryover is essential.
Scope of guidelinesThe EFRC guidelines are divided
into two main parts.The first part focuses on the design
of compressor components with re-spect to liquid carryover prevention. The second part details the operation of the reciprocating compressor system.
In these guidelines, each compo-nent in the system is discussed in or-der to decrease the chance of liquid related problems. Engineering rules are given to increase the awareness on the design and operation of differ-ent compressor system’s components.
It is recommended that the EFRC guidelines be used in conjunction with the more detailed guidelines, which are specifically developed for each component of the reciprocating com-pressor system, such as separator, pulsation damper, etc.
The system components which are covered by these guidelines are:
• Separators and their auxiliaries, such as demisters, level control, etc.
• Pulsation dampers• Upstream, downstream and inter-
stage piping• Miscellaneous.The guidelines can be applied to
various reciprocating compressor sys-tems including:
• Horizontal, vertical, V-, W- and L-type compressor systems
• Constant and variable speed com-pressors
• Compressors driven by electric motors, gas and diesel engines, steam turbines, with or without a gearbox, flexible or rigid coupling
• Dry running and lubricated recip-rocating compressors
• Compressor systems for all types of gases
• Diaphragm compressors• Labyrinth compressors.
SeparatorThis section of the guidelines fo-
cuses on the design check and op-eration of separators with respect to liquid carryover prevention and is one of the most important chapters. The following topics are discussed in the separator section:
• Engineering guidelines for pre-se-lection of separators and demisters
• Rules on how to check the ven-dor’s design of a separator and its auxiliaries
• Additional engineering rules for the design and operation of separators.
Table1 compares the different char-acteristics of gas/liquid separators.
Pulsation dampersThis section of the guidelines focus-
es on the design considerations of pul-sation dampers with respect to liquid carryover prevention.
The main function of pulsation damp-ers is to reduce the pulsations in the system to acceptable levels. Thus, the pulsation dampers are not designed to work as a separator. However, these devices are ideal spots for liquid to ac-cumulate and lead to liquid carryover.
PipingIn this section, rules on the design
of different parts of the piping are de-tailed to avoid liquid problems.
The design of the suction piping up and downstream of the inlet separator is critical. It should always be sloped toward the separator, and low points or pockets should be avoided.
Process gas dew point should be calculated accurately at each com-pression stage and a dew point margin should be considered to account for possible uncertainties in the models and process gas sampling accuracies.
Heat tracing, including insulation of the suction piping, should be con-sidered to ensure the process gas temperature always will be avoid the dew point.
The design of the discharge piping with respect to liquid problems is less crucial, but it also must be consid-ered. In general, the pipe configuration should be designed in such a way to avoid liquid accumulation in low points and blocked points (dead end).
MiscellaneousIn this part, some design and op-
erational guidelines on other system’s components are given to mitigate liq-uid carryover problems.
Different topics such as compres-sor valves, cylinder lubrication, valve unloaders, coolers and compressor recycle operation are discussed.
OperationsSince most of the liquid carryover
problems are initiated during the start-up or cold restart of the com-pressor, a procedure was developed to give a step-by-step approach to pre vent liquid carryover problems during these conditions.
ConclusionsPreviously, there were no engineer-
ing guidelines and standards on how to prevent liquid carryover problems in reciprocating compressor systems.
That prompted EFRC’s research and development group to develop such guidelines to ensure the long-term reliability, safety and efficiency of reciprocating compressors. It is believed that applying these recom-mendations will considerably reduce the chances of liquid problems in re-ciprocating compressor systems. CT2
The guidelines can be downloaded from the
EFRC website: www.recip.org.
JANUARY-FEBRUARY 2015 62 CompREssoRtech2
CT484.indd 2 1/23/15 9:07 AM

COMPRESSION TECHNOLOGY SOURCING SUPPLEMENTCTSSnet.net COMPRESSION
TECHNOLOGYSOURCINGSUPPLEMENT
The industry’s reference tool
for packagers, purchasers and training providers!
Visit Us At CTSSnet.net
#1 +
COMPRESSION TECHNOLOGY SOURCING SUPPLEMENTCTSSnet.net
CTSS_HouseAd2015.indd 1 12/5/14 2:06 PM
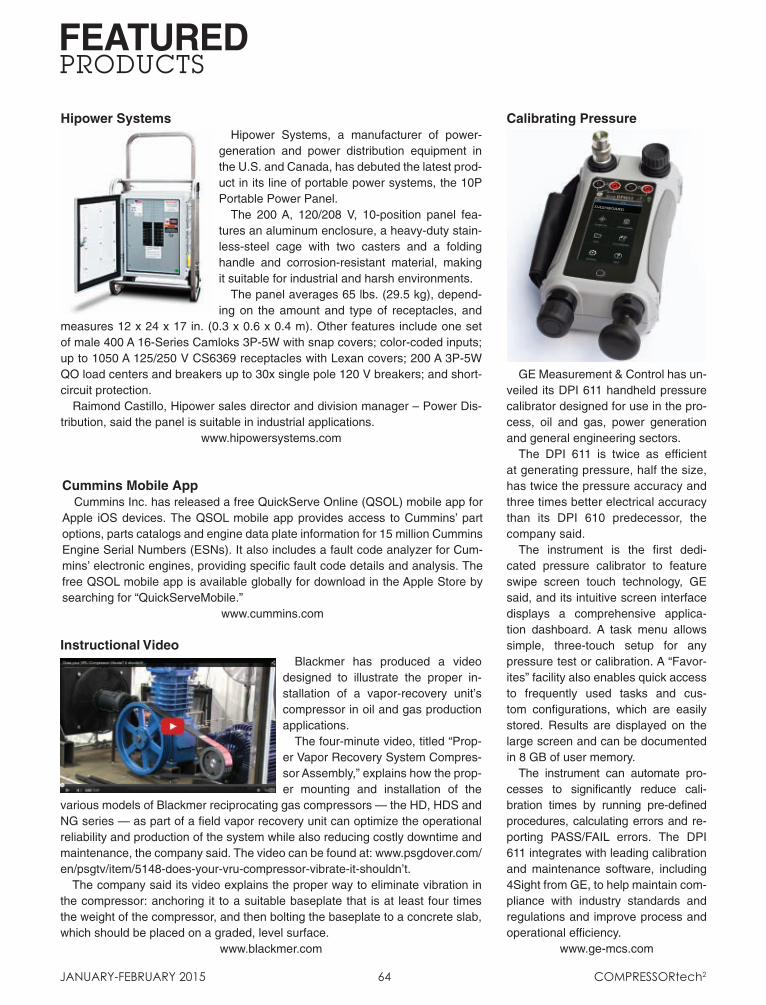
PRODUCTSFEATURED
JANUARY-FEBRUARY 2015 64 CompREssoRtech2
Hipower SystemsHipower Systems, a manufacturer of power-
generation and power distribution equipment in the U.S. and Canada, has debuted the latest prod-uct in its line of portable power systems, the 10P Portable Power Panel.
The 200 A, 120/208 V, 10-position panel fea-tures an aluminum enclosure, a heavy-duty stain-less-steel cage with two casters and a folding handle and corrosion-resistant material, making it suitable for industrial and harsh environments.
The panel averages 65 lbs. (29.5 kg), depend-ing on the amount and type of receptacles, and
measures 12 x 24 x 17 in. (0.3 x 0.6 x 0.4 m). Other features include one set of male 400 A 16-Series Camloks 3P-5W with snap covers; color-coded inputs; up to 1050 A 125/250 V CS6369 receptacles with Lexan covers; 200 A 3P-5W QO load centers and breakers up to 30x single pole 120 V breakers; and short-circuit protection.
Raimond Castillo, Hipower sales director and division manager – Power Dis-tribution, said the panel is suitable in industrial applications.
www.hipowersystems.com
Instructional VideoBlackmer has produced a video
designed to illustrate the proper in-stallation of a vapor-recovery unit’s compressor in oil and gas production applications.
The four-minute video, titled “Prop-er Vapor Recovery System Compres-sor Assembly,” explains how the prop-er mounting and installation of the
various models of Blackmer reciprocating gas compressors — the HD, HDS and NG series — as part of a field vapor recovery unit can optimize the operational reliability and production of the system while also reducing costly downtime and maintenance, the company said. The video can be found at: www.psgdover.com/en/psgtv/item/5148-does-your-vru-compressor-vibrate-it-shouldn’t.
The company said its video explains the proper way to eliminate vibration in the compressor: anchoring it to a suitable baseplate that is at least four times the weight of the compressor, and then bolting the baseplate to a concrete slab, which should be placed on a graded, level surface.
www.blackmer.com
Calibrating Pressure
GE Measurement & Control has un-veiled its DPI 611 handheld pressure calibrator designed for use in the pro-cess, oil and gas, power generation and general engineering sectors.
The DPI 611 is twice as efficient at generating pressure, half the size, has twice the pressure accuracy and three times better electrical accuracy than its DPI 610 predecessor, the company said.
The instrument is the first dedi-cated pressure calibrator to feature swipe screen touch technology, GE said, and its intuitive screen interface displays a comprehensive applica-tion dashboard. A task menu allows simple, three-touch setup for any pressure test or calibration. A “Favor-ites” facility also enables quick access to frequently used tasks and cus-tom configurations, which are easily stored. Results are displayed on the large screen and can be documented in 8 GB of user memory.
The instrument can automate pro-cesses to significantly reduce cali-bration times by running pre-defined procedures, calculating errors and re -porting PASS/FAIL errors. The DPI 611 integrates with leading calibration and maintenance software, including 4Sight from GE, to help maintain com-pliance with industry standards and regulations and improve process and operational efficiency.
www.ge-mcs.com
Cummins Mobile AppCummins Inc. has released a free QuickServe Online (QSOL) mobile app for
Apple iOS devices. The QSOL mobile app provides access to Cummins’ part options, parts catalogs and engine data plate information for 15 million Cummins Engine Serial Numbers (ESNs). It also includes a fault code analyzer for Cum-mins’ electronic engines, providing specific fault code details and analysis. The free QSOL mobile app is available globally for download in the Apple Store by searching for “QuickServeMobile.”
www.cummins.com
JanFeb_Products.indd 1 1/23/15 10:19 AM
currently owned by Exterran Holdings. The operations of Exterran Partners will not be affected by the transaction.
SpinCo’s businesses will consist of Ex terran Holdings’ current internation-al con tract operations and aftermarket services businesses, with operations in Latin America and parts of the East-ern Hemisphere, and its global fabrica-tion business.
Caterpillar/Solar Turbines Caterpillar Inc. has named Pablo
Koziner as vice president and presi-dent of San Diego, California-based Solar Turbines, effective Jan. 1. Koziner previously served as vice president with responsibility for Cat’s Americas Distri-bution Serv ices Division.
Tom Pellette, cur rently a Cat vice president and the president of Solar Tur-bines, was named group president for Cat’s Construction Industries group, ef-fective Jan. 1.
Koziner, a native of Buenos Aires, joined Caterpillar’s Legal Services di -vision in 2001 with in the organization’s Latin American Commercial division. In 2005, he became Power Systems re-
gional manager in Monterey, Mexico, and was respon-sible for Caterpil-lar’s electric power, petroleum, marine and industrial en-gine businesses.
In 2013, Koziner was named vice
president with responsibility for the Americas Distribution Services division.
T.F. HudginsT.F. Hudgins Inc. has completed
the acquisition of Jamison Products, a Houston-based provider of engi-neered pipeline and filtration prod-ucts used in a wide range of gas and
fluid-handling applications including strainers, separators, filter vessels, pig launchers and closures.
The addition of Jamison is T.F. Hudgins’ first acquisition and adds complementary engineered products and broadens the company’s customer base, the company said.
Founded in 1947 and headquar-tered in Houston, T.F. Hudgins pro-vides engineered products and serv ice solutions that improve the reliabil-ity, efficiency and performance of compressors, engines and other in-dustrial machinery. T.F. Hudgins has lo ca tions in Houston, New Orleans and Venezuela, as well as a sales office in Australia.
“The acquisition of Jamison contin-ues our multifaceted growth strategy and diversifies our customer base as we expand further into adjacent end markets and product categories,” T.F. Hudgins CEO Ted Edwards said.
MoversPRIME
JANUARY-FEBRUARY 2015 65 CompREssoRtech2
From new systems and maintenance to training and repairs,
get everything you need for automatic machine lubrication from one resource
with 67 years of experience.
Visit www.tfhudgins.com/lube
Everything Lubrication
©2015 T.F. Hudgins, Incorporated
Technology. Expertise. Results.
OIL MIST SYSTEMS
COMPRESSORLUBE SYSTEMS
TRAININGSERVICEGREASE SYSTEMS
TF_Hudgins.indd 1 1/22/15 8:20 AM
continued from page 47
P. Koziner
JanFeb_PrimeMovers.indd 2 1/23/15 10:18 AM
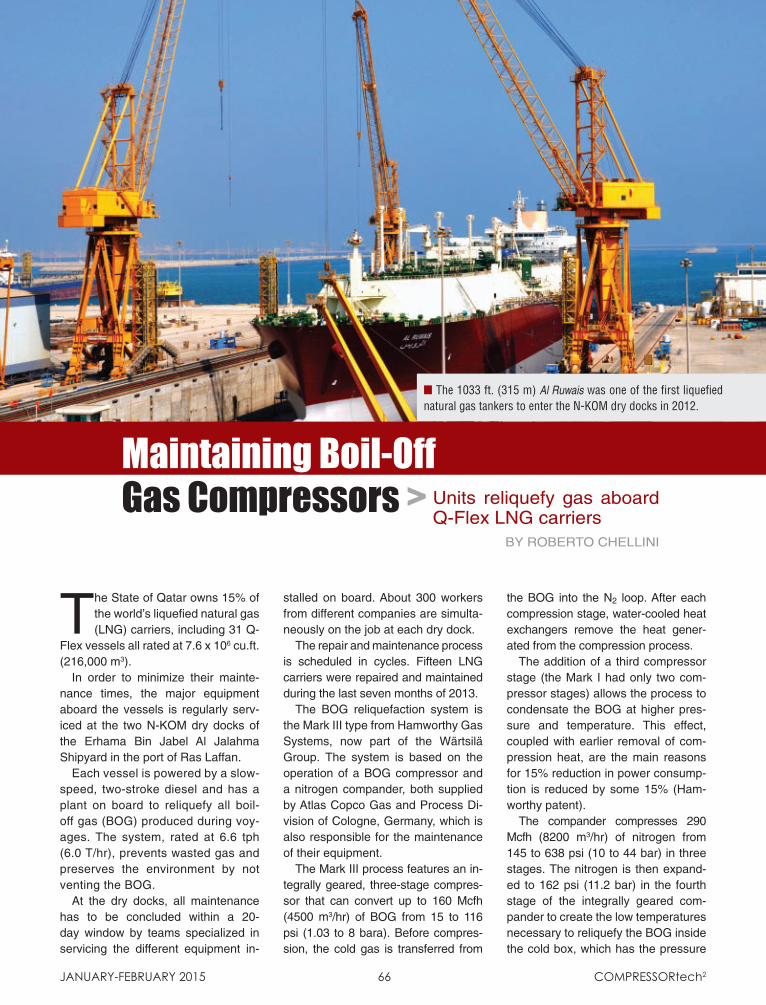
The State of Qatar owns 15% of the world’s liquefied natural gas (LNG) carriers, including 31 Q-
Flex vessels all rated at 7.6 x 10⁶ cu.ft. (216,000 m3).
In order to minimize their mainte-nance times, the major equipment aboard the vessels is regularly serv-iced at the two N-KOM dry docks of the Erhama Bin Jabel Al Jalahma Shipyard in the port of Ras Laffan.
Each vessel is powered by a slow-speed, two-stroke diesel and has a plant on board to reliquefy all boil-off gas (BOG) produced during voy-ages. The system, rated at 6.6 tph (6.0 T/hr), prevents wasted gas and preserves the environment by not venting the BOG.
At the dry docks, all maintenance has to be concluded within a 20-day window by teams specialized in servicing the different equipment in-
stalled on board. About 300 workers from different companies are simulta-neously on the job at each dry dock.
The repair and maintenance process is scheduled in cycles. Fifteen LNG carriers were repaired and maintained during the last seven months of 2013.
The BOG reliquefaction system is the Mark III type from Hamworthy Gas Systems, now part of the Wärtsilä Group. The system is based on the operation of a BOG compressor and a nitrogen compander, both supplied by Atlas Copco Gas and Process Di-vision of Cologne, Germany, which is also responsible for the maintenance of their equipment.
The Mark III process features an in-tegrally geared, three-stage compres-sor that can convert up to 160 Mcfh (4500 m3/hr) of BOG from 15 to 116 psi (1.03 to 8 bara). Before compres-sion, the cold gas is transferred from
the BOG into the N2 loop. After each compression stage, water-cooled heat exchangers remove the heat gener-ated from the compression process.
The addition of a third compressor stage (the Mark I had only two com-pressor stages) allows the process to condensate the BOG at higher pres-sure and temperature. This effect, coupled with earlier removal of com-pression heat, are the main reasons for 15% reduction in power consump-tion is reduced by some 15% (Ham-worthy patent).
The compander compresses 290 Mcfh (8200 m3/hr) of nitrogen from 145 to 638 psi (10 to 44 bar) in three stages. The nitrogen is then expand-ed to 162 psi (11.2 bar) in the fourth stage of the integrally geared com-pander to create the low temperatures necessary to reliquefy the BOG inside the cold box, which has the pressure
Units reliquefy gas aboard Q-Flex LNG carriers
By ROBERTO CHELLINI
n The 1033 ft. (315 m) Al Ruwais was one of the first liquefied natural gas tankers to enter the N-KOM dry docks in 2012.
january-february 2015 66 Compressortech2
Maintaining Boil-Off Gas Compressors >
CT483.indd 1 1/26/15 2:57 PM
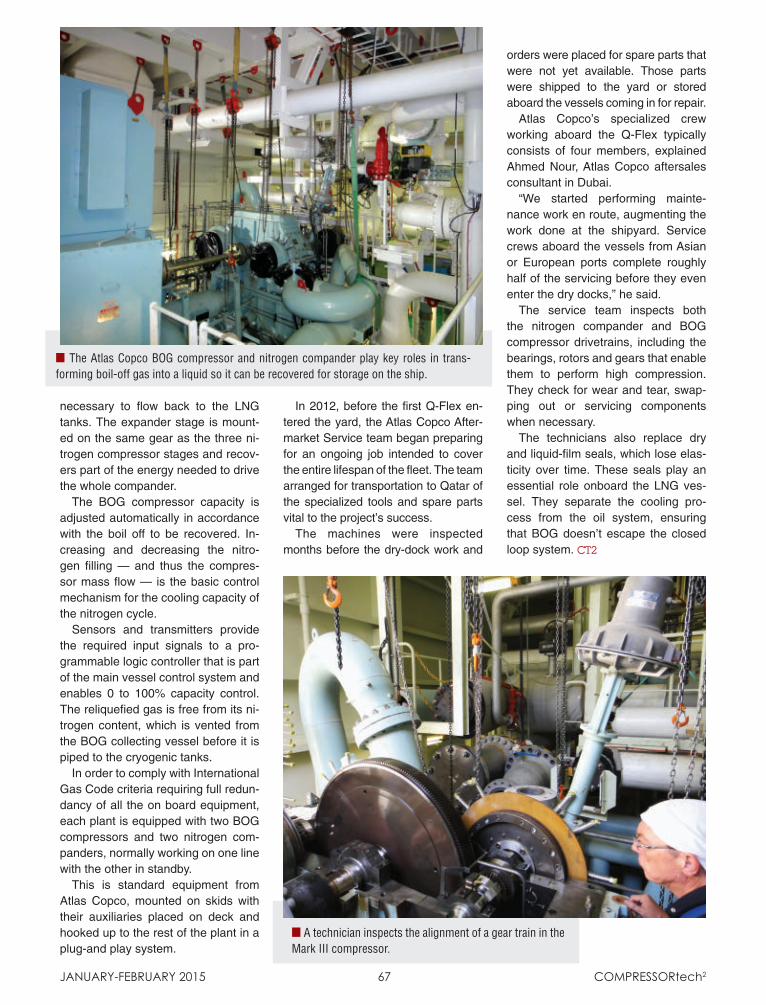
necessary to flow back to the LNG tanks. The expander stage is mount-ed on the same gear as the three ni-trogen compressor stages and recov-ers part of the energy needed to drive the whole compander.
The BOG compressor capacity is adjusted automatically in accordance with the boil off to be recovered. In-creasing and decreasing the nitro-gen filling — and thus the compres-sor mass flow — is the basic control mechanism for the cooling capacity of the nitrogen cycle.
Sensors and transmitters provide the required input signals to a pro-grammable logic controller that is part of the main vessel control system and enables 0 to 100% capacity control. The reliquefied gas is free from its ni-trogen content, which is vented from the BOG collecting vessel before it is piped to the cryogenic tanks.
In order to comply with International Gas Code criteria requiring full redun-dancy of all the on board equipment, each plant is equipped with two BOG compressors and two nitrogen com-panders, normally working on one line with the other in standby.
This is standard equipment from Atlas Copco, mounted on skids with their auxiliaries placed on deck and hooked up to the rest of the plant in a plug-and play system.
In 2012, before the first Q-Flex en-tered the yard, the Atlas Copco After-market Service team began preparing for an ongoing job intended to cover the entire lifespan of the fleet. The team arranged for transportation to Qatar of the specialized tools and spare parts vital to the project’s success.
The machines were inspected months before the dry-dock work and
orders were placed for spare parts that were not yet available. Those parts were shipped to the yard or stored aboard the vessels coming in for repair.
Atlas Copco’s specialized crew working aboard the Q-Flex typically consists of four members, explained Ahmed Nour, Atlas Copco aftersales consultant in Dubai.
“We started performing mainte-nance work en route, augmenting the work done at the shipyard. Service crews aboard the vessels from Asian or European ports complete roughly half of the servicing before they even enter the dry docks,” he said.
The service team inspects both the nitrogen compander and BOG compressor drivetrains, including the bearings, rotors and gears that enable them to perform high compression. They check for wear and tear, swap-ping out or servicing components when necessary.
The technicians also replace dry and liquid-film seals, which lose elas-ticity over time. These seals play an essential role onboard the LNG ves-sel. They separate the cooling pro-cess from the oil system, ensuring that BOG doesn’t escape the closed loop system. CT2
n The Atlas Copco BOG compressor and nitrogen compander play key roles in trans-forming boil-off gas into a liquid so it can be recovered for storage on the ship.
january-february 2015 67 Compressortech2
n A technician inspects the alignment of a gear train in the Mark III compressor.
CT483.indd 2 1/23/15 9:10 AM

2014_Third_SpanishAd.indd 1 1/23/15 8:52 AM
3
2
457
6
F Z P K G N V G Y F H T X U B P G B D QK I I D Q R E S T O R E F R E S H K A CN R E N E W F E R A L T C F L L D Q W TP A R E N O V A T E J A O A O O I X N CO P G C A O A S E P K M T N F K C E I NE E R S C E V L T M U I I E S R C A O EG Z C A T R Y A Y T B N N M S E U I C KR I I N I T I A T E C A Y D R T T S K AA G A L V A N I Z E T A R A L I H X E WH R E V A M P F P C W A A K D E C A H AC E I A T T C T O W S E R N L T Q S I TE N W S E Z I M I V C N O U K A I X J HR E U T E O M V N N J C P E G L U G D XU H S I N E L P E R E A M T B U L N E MV S D I N V I G O R A T E A M M A I C AX B G C B O R I G I N A T E N I V N W HT E E I Z U P D A T E S N R N T I E I KB Y R H S I B R U F E R O C U S R P L AG T N E S E R P I J R E C O V E R O K RH N R E D O M B R E P R E V I V A L A B
Starting AnewActivateAnimateAriseArrivalAscendAwakenBirthBeginCommenceContemporaryCreateDawnEmbarkEnergizeEstablishExhilarateFreshGalvanizeInaugurateInceptionInitiateInnovateInvigorateKickoffLatestLaunch
ModernOnsetOpeningOriginatePresentRecentRechargeReconditionRecoverRefreshRefurbishRekindleRenewRenovateReplenishRestoreResurgenceRevampRevitalizeRevivalStartStimulateSurfaceUpdate
Visit www.compressortech2.com/scheduled-downtime/ for answers
Scheduled Downtime DJ SLAtER, PUzzLEMAStER
Ct2_JanFeb15_Puzzle.indd 1 1/23/15 10:20 AM

REGISTER NOW FOR THE GAS/ELECTRIC PARTNERSHIP CONFERENCE XXIII
Infrastructure & Equipment Advances for
Unconventional Gas/Light Oil & Offshore Production, and Pipelines SESSION TOPICS• Oil and Gas Futures & Drivers of Change• Environmental Drivers of Change • Shale Gas & Tight Oil Facilities • Unlocking the Value of Stranded Gas • Offshore Power & Rotating Equipment• Pipeline Systems Transitions • Compressors & Drivers • Tech Updates
Register and/or obtain agenda on www.GasElectricPartnership.comFor further info, call 505.490.9119 or email [email protected]
February 17-19, 2015Conference: February 18-19
Compression Tutorial: February 17
Northwest Forest Conference CenterCypress (Houston), Texas
Source: Energy Information Administration
GasElectric_Trade.indd 1 1/5/15 1:58 PM
MarketplaceMarketplace
ARLA Engineering Service
to Simulate Vibrations in Drive Systems• torsional and lateral vibration analysis• rotordynamics & bearing analysis (fluid-film)• considering complete drivelines with motors, engines, compressors, gears, couplings• steady-state and time-transient simulation• simulation software (ARMD 5.8)
Int’l Seminar ROTOR DYNAMICS & BEARINGS Cologne, Germany: November 2-5, 2015
ARLA Maschinentechnik GmbH,GERMANYInternet: www.arla-online.com
EXPLOSION PROOFAC&DC ENGINE STARTING SYSTEMS• STARTER MOTORS • ALTERNATORS
• SWITCHES • CLASS I, DIV. 1&2, GROUP D
UNITED STATES ENERGY CORPORATION1600 MISSILE WAY, ANAHEIM, CA 92801
(714) 871-8185 • (714) 871-9229 FAXWWW.USENERGYCORPORATION.COM
U.S. Energy Corp 1k x 1" 3/11/03 11:06 AM Page 1
Custom Reprints AvailableArticles in COMPRESSORtech2 can be re printed at a very reasonable cost and used for effective direct mail purposes, answering inquiries, trade show distribution and many other sales development activities. These reprints can be produced to your specifi cations in one or multicolor formats on selected paper in standard 8 x 10 1/2 or DIN A4 sizes. Layout and production services are also available. Contact Reprint Manager for information.
Mary Graesing • [email protected]
Phone: 262-754-4147 • Fax: 262-754-4177
2015 CLASSIFIED AD RATESDisplay or non-display classified advertising accepted. Rate is $130.00 per column inch, one inch minimum.
Photographs not accepted. No charge for typesetting.
Payment must accompany order.
For an immediate price quote fax or e-mail your ad copy to:
Sarah YildizE-mail: [email protected]
Fax: (262) 754-4175Phone: (262) 754-4146
For Marketplace Rates Contact
Sarah Yildiz at [email protected]
JANUARY-FEBRUARY 2014 69 CompREssoRtech2
CT_JanFeb15_Mktplc.indd 1 1/23/15 9:11 AM
Advertisers’ Index*Further information on this company’s products can be found in the 2014 Edition of the Diesel & Gas Turbine Sourcing Guide (at www.Dieselandgasturbineguide.net) and/or 2014 Compression Technology Sourcing Supplement (at CTSSnet.net).
“SEAL LIFE”
Because ...
has nothing to do with the killer-whale population.
Paperback, 204 pages US$24.95
The Illustrated Dictionary Of Essential Process Machinery Terms
Why struggle through useless Internet search results for technical terms?
Order your copy today:http://storefront.dieselpub.com
1.800.558.4322
SealLife.indd 1 6/9/14 9:03 AM
ACI Services Inc. ....................................................................................23
*ARIEL CORPORATION ............................................................................1
Air-Cooled Heat Exchangers ................................................................25
BETA Machinery Analysis .....................................................................15
Compression Dynamics ........................................................................41
*Compressor Products International .......................................................5
Cook Compression ................................................................................17
DCL International Inc. ..............................................................................7
Dragon Products – Production Equipment .........................Third Cover
*Dresser-Rand ..........................................................................................13
E Instruments International ..................................................................43
*Elliott Group .......................................................................Second Cover
*Ellwood Crankshaft Group ....................................................................43
Exline, Inc. ..............................................................................................51
Gas Compressor Association ...............................................................57
Gas/Electric Partnership .......................................................................69
GE Measurement & Control ..................................................................61
Harsco Industrial Air-X-Changers ........................................................21
*HOERBIGER ......................................................................................10-11
*KB Delta Compressor Valve Parts, Mfg. .........................................36-37
Lufkin Industries LLC ............................................................................31
MOTORTECH GmbH ..............................................................................35
Murphy by Enovation Controls ................53, Fourth Cover, Belly Band
Neuman & Esser Group ...........................................................................9
Nidec ASI S.p.A. .....................................................................................33
Reynolds French ....................................................................................45
Schaeffler Technologies GmbH & Co. KG ...........................................19
*Sloan Lubrication Systems ...................................................................49
SOGAT 2015 ...........................................................................................55
Summit Industrial Products ..................................................................47
*Tech Transfer Inc. .................................................................................2-3
*Testo, Inc. ...............................................................................................27
T.F. Hudgins, Incorporated ...................................................................65
Zahroof Valves Inc. ................................................................................29
CT2_JanFeb15_AdIndx.indd 1 1/26/15 2:01 PM
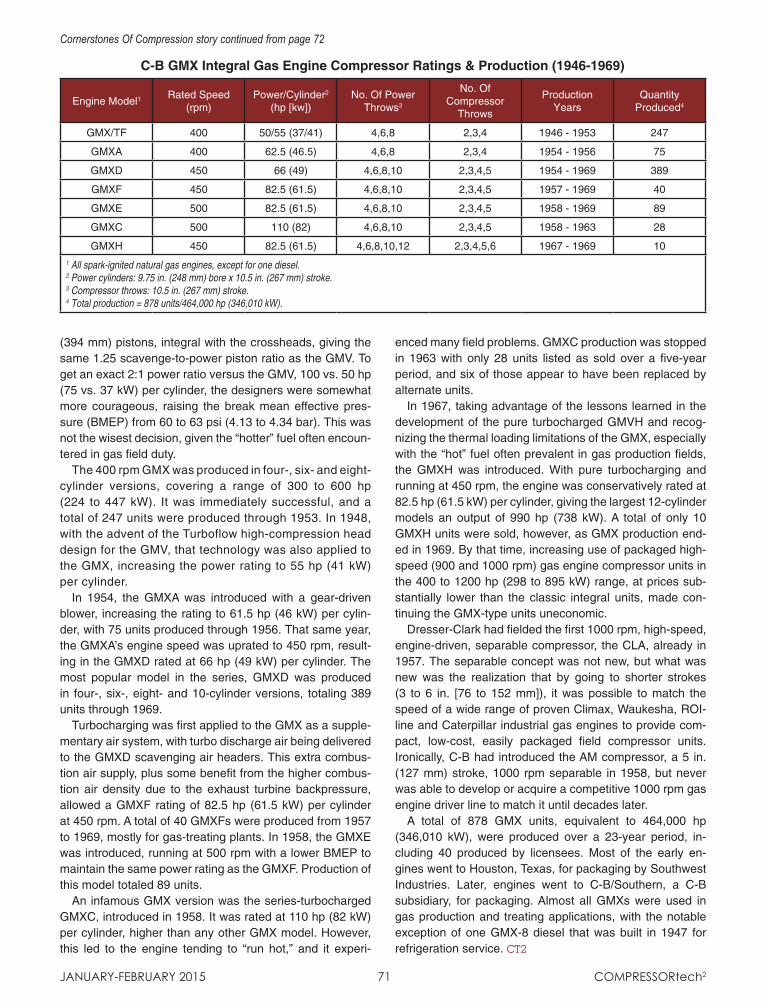
JANUARY-FEBRUARY 2015 71 CompREssoRtech2
(394 mm) pistons, integral with the crossheads, giving the same 1.25 scavenge-to-power piston ratio as the GMV. To get an exact 2:1 power ratio versus the GMV, 100 vs. 50 hp (75 vs. 37 kW) per cylinder, the designers were somewhat more courageous, raising the break mean effective pres-sure (BMEP) from 60 to 63 psi (4.13 to 4.34 bar). This was not the wisest decision, given the “hotter” fuel often encoun-tered in gas field duty.
The 400 rpm GMX was produced in four-, six- and eight- cylinder versions, covering a range of 300 to 600 hp (224 to 447 kW). It was immediately successful, and a total of 247 units were produced through 1953. In 1948, with the advent of the Turboflow high-compression head design for the GMV, that technology was also applied to the GMX, increasing the power rating to 55 hp (41 kW) per cylinder.
In 1954, the GMXA was introduced with a gear-driven blower, increasing the rating to 61.5 hp (46 kW) per cylin-der, with 75 units produced through 1956. That same year, the GMXA’s engine speed was uprated to 450 rpm, result-ing in the GMXD rated at 66 hp (49 kW) per cylinder. The most popular model in the series, GMXD was produced in four-, six-, eight- and 10-cylinder versions, totaling 389 units through 1969.
Turbocharging was first applied to the GMX as a supple-mentary air system, with turbo discharge air being delivered to the GMXD scavenging air headers. This extra combus-tion air supply, plus some benefit from the higher combus-tion air density due to the exhaust turbine backpressure, allowed a GMXF rating of 82.5 hp (61.5 kW) per cylinder at 450 rpm. A total of 40 GMXFs were produced from 1957 to 1969, mostly for gas-treating plants. In 1958, the GMXE was introduced, running at 500 rpm with a lower BMEP to maintain the same power rating as the GMXF. Production of this model totaled 89 units.
An infamous GMX version was the series-turbocharged GMXC, introduced in 1958. It was rated at 110 hp (82 kW) per cylinder, higher than any other GMX model. However, this led to the engine tending to “run hot,” and it experi-
enced many field problems. GMXC production was stopped in 1963 with only 28 units listed as sold over a five-year period, and six of those appear to have been replaced by alternate units.
In 1967, taking advantage of the lessons learned in the development of the pure turbocharged GMVH and recog-nizing the thermal loading limitations of the GMX, especially with the “hot” fuel often prevalent in gas production fields, the GMXH was introduced. With pure turbocharging and running at 450 rpm, the engine was conservatively rated at 82.5 hp (61.5 kW) per cylinder, giving the largest 12-cylinder models an output of 990 hp (738 kW). A total of only 10 GMXH units were sold, however, as GMX production end-ed in 1969. By that time, increasing use of packaged high-speed (900 and 1000 rpm) gas engine compressor units in the 400 to 1200 hp (298 to 895 kW) range, at prices sub-stantially lower than the classic integral units, made con-tinuing the GMX-type units uneconomic.
Dresser-Clark had fielded the first 1000 rpm, high-speed, engine-driven, separable compressor, the CLA, already in 1957. The separable concept was not new, but what was new was the realization that by going to shorter strokes (3 to 6 in. [76 to 152 mm]), it was possible to match the speed of a wide range of proven Climax, Waukesha, ROI-line and Caterpillar industrial gas engines to provide com-pact, low-cost, easily packaged field compressor units. Ironically, C-B had introduced the AM compressor, a 5 in. (127 mm) stroke, 1000 rpm separable in 1958, but never was able to develop or acquire a competitive 1000 rpm gas engine driver line to match it until decades later.
A total of 878 GMX units, equivalent to 464,000 hp (346,010 kW), were produced over a 23-year period, in-cluding 40 produced by licensees. Most of the early en-gines went to Houston, Texas, for packaging by Southwest Industries. Later, engines went to C-B/Southern, a C-B subsidiary, for packaging. Almost all GMXs were used in gas production and treating applications, with the notable exception of one GMX-8 diesel that was built in 1947 for refrigeration service. CT2
Cornerstones Of Compression story continued from page 72
Engine Model1Rated Speed
(rpm)Power/Cylinder2
(hp [kw])No. Of Power
Throws3
No. Of Compressor
Throws
ProductionYears
QuantityProduced4
GMX/TF 400 50/55 (37/41) 4,6,8 2,3,4 1946 - 1953 247
GMXA 400 62.5 (46.5) 4,6,8 2,3,4 1954 - 1956 75
GMXD 450 66 (49) 4,6,8,10 2,3,4,5 1954 - 1969 389
GMXF 450 82.5 (61.5) 4,6,8,10 2,3,4,5 1957 - 1969 40
GMXE 500 82.5 (61.5) 4,6,8,10 2,3,4,5 1958 - 1969 89
GMXC 500 110 (82) 4,6,8,10 2,3,4,5 1958 - 1963 28
GMXH 450 82.5 (61.5) 4,6,8,10,12 2,3,4,5,6 1967 - 1969 101 All spark-ignited natural gas engines, except for one diesel.2 Power cylinders: 9.75 in. (248 mm) bore x 10.5 in. (267 mm) stroke.3 Compressor throws: 10.5 in. (267 mm) stroke.4 Total production = 878 units/464,000 hp (346,010 kW).
C-B GMX Integral Gas Engine Compressor Ratings & Production (1946-1969)
CT512.indd 2 1/26/15 2:36 PM
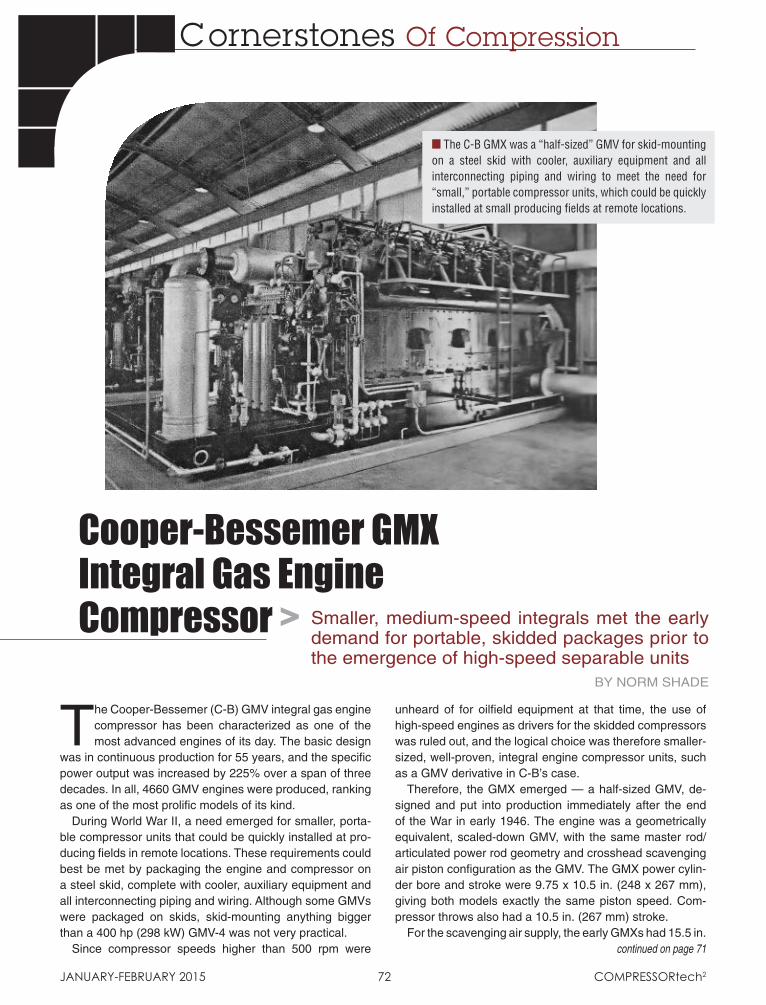
C ornerstones Of Compression
The Cooper-Bessemer (C-B) GMV integral gas engine compressor has been characterized as one of the most advanced engines of its day. The basic design
was in continuous production for 55 years, and the specific power output was increased by 225% over a span of three decades. In all, 4660 GMV engines were produced, ranking as one of the most prolific models of its kind.
During World War II, a need emerged for smaller, porta-ble compressor units that could be quickly installed at pro-ducing fields in remote locations. These requirements could best be met by packaging the engine and compressor on a steel skid, complete with cooler, auxiliary equipment and all interconnecting piping and wiring. Although some GMVs were packaged on skids, skid-mounting anything bigger than a 400 hp (298 kW) GMV-4 was not very practical.
Since compressor speeds higher than 500 rpm were
Cooper-Bessemer GMX Integral Gas Engine Compressor > Smaller, medium-speed integrals met the early
demand for portable, skidded packages prior to the emergence of high-speed separable units
By NorM ShADe
JANUARY-FEBRUARY 2015 72 CompREssoRtech2
unheard of for oilfield equipment at that time, the use of high-speed engines as drivers for the skidded compressors was ruled out, and the logical choice was therefore smaller-sized, well-proven, integral engine compressor units, such as a GMV derivative in C-B’s case.
Therefore, the GMX emerged — a half-sized GMV, de-signed and put into production immediately after the end of the War in early 1946. The engine was a geometrically equivalent, scaled-down GMV, with the same master rod/articulated power rod geometry and crosshead scavenging air piston configuration as the GMV. The GMX power cylin-der bore and stroke were 9.75 x 10.5 in. (248 x 267 mm), giving both models exactly the same piston speed. Com-pressor throws also had a 10.5 in. (267 mm) stroke.
For the scavenging air supply, the early GMXs had 15.5 in.
n The C-B GMX was a “half-sized” GMV for skid-mounting on a steel skid with cooler, auxiliary equipment and all interconnecting piping and wiring to meet the need for “small,” portable compressor units, which could be quickly installed at small producing fields at remote locations.
continued on page 71
CT512.indd 1 1/23/15 9:14 AM

© Copyright 2015 Modern Group Inc. All rights reserved.
Top-quality gas lift compressors. Priced right and available. Since you need to get busy compressing gas, allow us to compress this message. Our
compressors are severe-duty engineered and built in-house for exceptional durability and
reliability, just as we’ve done with all our equipment for 50 years. We offer 200HP and
380HP units featuring the best components, including Ariel compressors with Caterpillar or
Cummins engines. They’re part of our full line of surface production equipment, from tanks
to separators to VRTs. And you can
count on our people as much as
our equipment. Make it happen.
Gas compression operations can’t wait and can’t stop. With Dragon they don’t.
U.S. owned and operated for over 50 years.
www.dragonproductsltd.com — 1-800-231-8198
Dragon-Comp14-CompTECH.indd 1 1/21/15 9:41 AMDragonProducts.indd 1 1/22/15 8:40 AM

With an extensive list of engines already mapped, even more are on the way. Install Murphy’s turnkey Engine Integration Control System on your engine for a productive year of increased performance.
Tell us what engine you want mapped next. Go to: www.fwmurphy.com/MapMyEngine to add it to our list
1411
584
01
-15
Learn more about EICS at www.fwmurphy.com/ct2EICS
G3304 NA G3304B NA G3306 NA G3306B NA G3306 TA
G3306B TA G3306 TAA G3306B TAA G3406 NA G3406 TA
KTA19 G8.3 G5.9 – (Coming Soon)
VRG 330 VRG 330-CF – (Coming Soon)
All trademarks are property of their respective owners.
Murphy_EICS.indd 1 1/26/15 11:28 AM