
Comparison of new characterized bandpass and wavelengths ... · Comparison of new characterized...
36
Comparison of new characterized bandpass and wavelengths of Dobsons Alberto Redondas, 1 1 Iza˜ na Atmospheric Research Center, AEMET, Tenerife, Canary Islands, Spain. October 29, 2015 Redondas (AEMET) ATMOZ Meeting Prage 2014 October 29, 2015 1 / 35
Transcript of Comparison of new characterized bandpass and wavelengths ... · Comparison of new characterized...

Comparison of new characterized bandpass andwavelengths of Dobsons
Alberto Redondas, 1
1Izana Atmospheric Research Center, AEMET, Tenerife, Canary Islands, Spain.
October 29, 2015
Redondas (AEMET) ATMOZ Meeting Prage 2014 October 29, 2015 1 / 35

Outline
1 IntroductionBrewer Dobson Spectrophotometers
2 Brewer & Dobson AlgorithmBasicAlgortithm Asumptions
3 Dobson slits measurementOzone Absortion Coefficient CalculationATMOZ Dobson Measurements
Results
4 Conclusions
Redondas (AEMET) ATMOZ Meeting Prage 2014 October 29, 2015 2 / 35

Brewer Dobson Spectrophotometers
The primary ground-based instruments used to report total column ozone(TOC) are Brewer and Dobson Spectrometers, in separate networks. Theseinstruments make measurements of the UV irradiances, and through awell-defined process a TOC value is produced. Inherent in the algorithm isthe use of a laboratory determined cross-section data set.
The routine measurement of TOC started in the mid-1920s with a prototypeof the Dobson instrument. A world-wide network grew up after theinstrument re-design in 1947 and the International Geophysical Year in 1957.
The Brewer Ozone Spectrometer was developed in Canada during the 1970s,and a commercial, automated version became available in the early 1980s.
As observing organizations purchased these instruments and placed them inservice alongside the Dobson instrument for long term measurements, theseasonal and offset differences in the results became evident.
The Initial differences of 4% were removed with the adoption of Bass & Paurabsorption coefficients. As measurements continued, a seasonal and offsetdifference was still evident
Redondas (AEMET) ATMOZ Meeting Prage 2014 October 29, 2015 3 / 35

Introduction
Redondas (AEMET) ATMOZ Meeting Prage 2014 October 29, 2015 4 / 35

Introduction
Measurements by both types of instruments are based on sun photometry andthe TO3 is derived from the absorption of solar light in the Huggins band.
The Dobson spectrophotometer is based on the measurements of the ratiosof two wavelength pairs, while the Brewer spectrophotometer measuresphoton counts at 5 wavelengths allowing the simultaneous measurement ofozone and of SO2 column amount.
For the separation of the wavelengths the Dobson instruments use 2 and theBrewer 5 slits.
The field of view is 8o for Dobson and 3o for Brewer instruments.
Dobson instruments have two prisms to separate the respective wavelengths,while Brewer instruments use one or two dispersive elements (holographicgratings).
The Dobson assumes all the instrument have the same wavelengths and slitswhere the Brewer instruments are slightly different from instrument toinstrument and determined during calibration.
Redondas (AEMET) ATMOZ Meeting Prage 2014 October 29, 2015 5 / 35
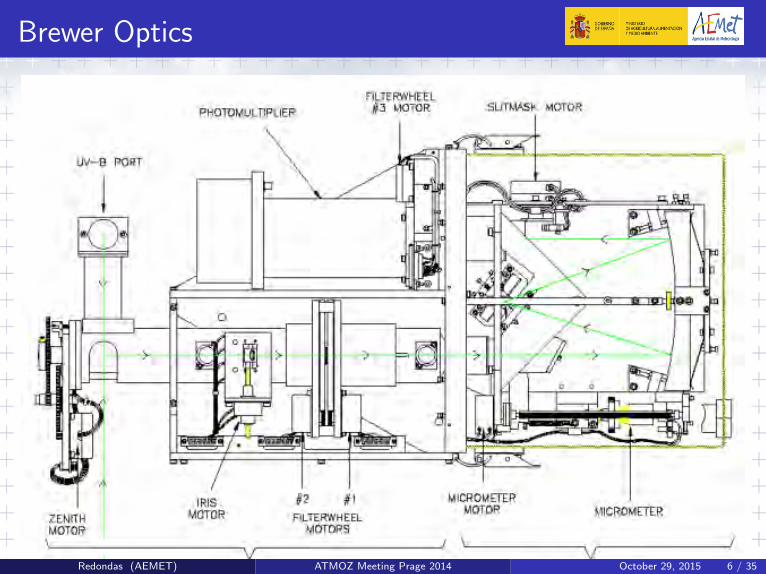
Brewer Optics
Redondas (AEMET) ATMOZ Meeting Prage 2014 October 29, 2015 6 / 35
Dobson & Brewer Algorithm
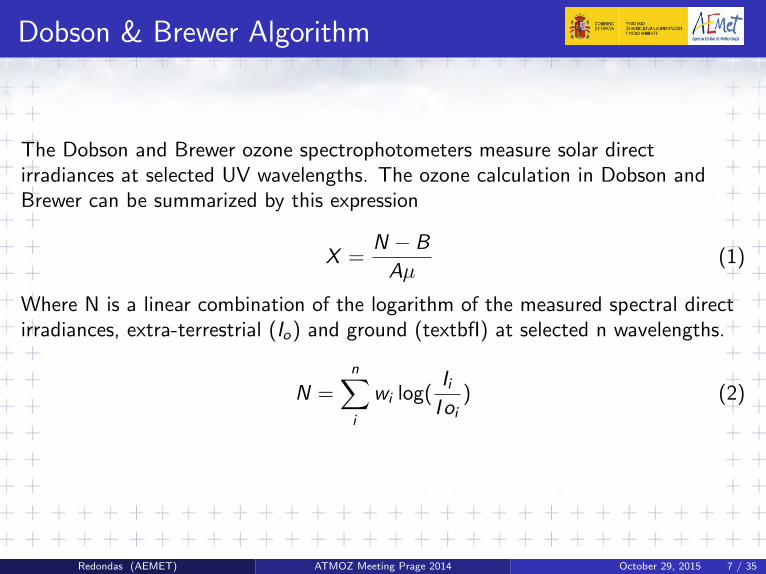
The Dobson and Brewer ozone spectrophotometers measure solar directirradiances at selected UV wavelengths. The ozone calculation in Dobson andBrewer can be summarized by this expression
X =N − B
Aµ(1)
Where N is a linear combination of the logarithm of the measured spectral directirradiances, extra-terrestrial (Io) and ground (textbfI) at selected n wavelengths.
N =n∑i
wi log(Ii
I oi) (2)
Redondas (AEMET) ATMOZ Meeting Prage 2014 October 29, 2015 7 / 35

Dobson & Brewer Algorithm
A are the ozone absorption coefficient or Differential Cross Section (DXS) and Bthe Rayleigh coefficient, which are linear combinations of the ozone absorption (α)and Rayleigh molecular scattering (β), respectively, at corresponding wavelengths.
A =n∑
i=1
wiαi (3)
B = νp
po
n∑i=1
wiβi (4)
All the instruments have a certain bandpass or slit function, the measuredirradiances I , αi and βi are the convolution of the instrument slit function (S)with the corresponding cross sections (xs) or spectral irradiances.
αi =
∫σ(λ) Si (λ, λ
′) dλ∫Si (λ, λ′)dλ
(5)
∫Si (λ, λ
′)dλ = 1 (6)
Redondas (AEMET) ATMOZ Meeting Prage 2014 October 29, 2015 8 / 35

Finally the airmass is defined on the standard algorithm:
µx = sec
{arcsin
[R
R + hx· sin(θ)
]}(7)
R : Earth Radius (6370km)
hx : is the effective height set to hsca = 5km and hO3 = 22km )
θ : Solar zenith angle
µx = sec
{arcsin
[R
R + hx· sin(θ)
]}(8)
(9)
Calibration Constants
Io : Extraterrestrial constant: Langley or transferred
B,A, : Are calculated and depend of the wavelength calibration
I : Solar irradiance are measured and depend of the instrumentalcalibration
µ : Are calculated
Redondas (AEMET) ATMOZ Meeting Prage 2014 October 29, 2015 9 / 35

Introduction
Table 1: Wavelengths and weighting coefficients used in the Dobson and Breweroperative algorithms.
Brewer W SD FW SD wi Dobson W FW wi wi
slits slits0 303.001 0 A1 305.5 0.9 1 02 306.301 0.014 0.548 0.016 0 C1 311.5 0.9 0 13 310.051 0.014 0.539 0.015 1 D1 317.5 0.9 1 14 313.501 0.015 0.555 0.012 −0.5 A2 325.0 2.9 −1 05 316.801 0.017 0.545 0.012 −2.2 C2 332.4 2.9 0 16 320.002 0.019 0.538 0.012 1.7 D2 339.9 2.9 −1 1
Redondas (AEMET) ATMOZ Meeting Prage 2014 October 29, 2015 10 / 35

Algorithm asumptions
Diffuse radiation is not considered Imeasured = Idirect + Idiffuse
Slits are parametrized, ( no wings , no out-bands)
Temperature in ozone cross section is set to constant value. (-44C / -45CBrewer)
Height in the ozone layer is constant in Brewer /latitude dependent inDobson.
Rayleigh molecular scattering are fixed for all instruments (Bates 1984)
Absorber profile is considered a delta at h effective.
Additional absorvers are not considered (SO2,NO2,HCLO)
Redondas (AEMET) ATMOZ Meeting Prage 2014 October 29, 2015 11 / 35

Ozone cross section asumptions
The temperature dependence of the cross section is not considered ( commontemperature is assumed )
Effective Temeperature
TeffO3 =
ToA∫Det
nO3(h)T (h) · dh
ToA∫Det
nO3(h) · dh
. 200202.5205207.5
210
210
212.5
212.
5
215
215217.5
217.
5
220
220
220
222.5
222.5
222.5
222.5
225
225
225
225
227.5227.5
227.5
227.5
227.5
227.5
230
230
230
230
230
232.5
230
232.5
232.5
230
230
235
235
235
lati
tud
e
SBUV Ozone effective temperature
Jan Feb Mar Apr May Jun Jul Aug Sep Oct Nov Dic-80
-60
-40
-20
0
20
40
60
80
200
205
210
215
220
225
230
235
240
Redondas (AEMET) ATMOZ Meeting Prage 2014 October 29, 2015 12 / 35
Ozone cross section asumptions
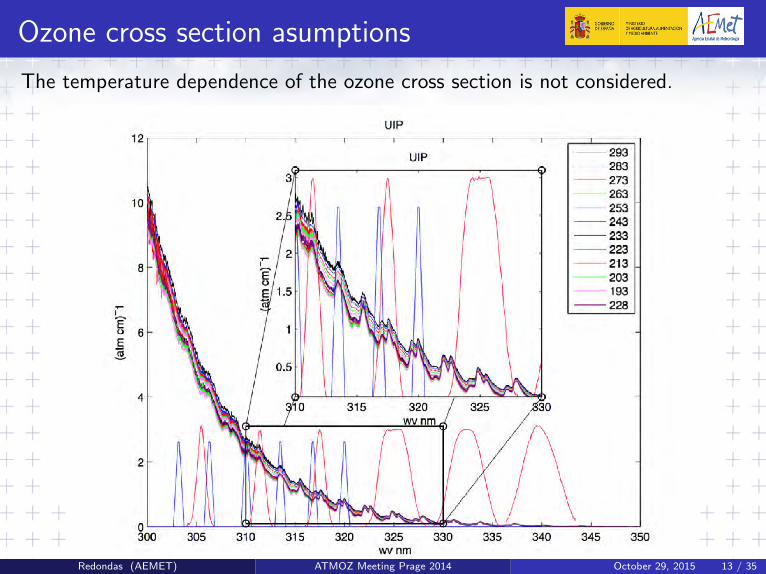
The temperature dependence of the ozone cross section is not considered.
Redondas (AEMET) ATMOZ Meeting Prage 2014 October 29, 2015 13 / 35
Ozone cross section asumptions
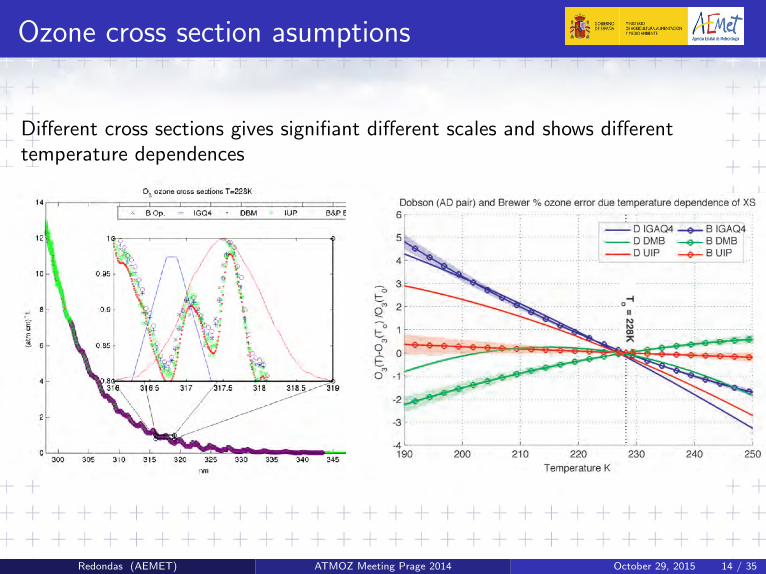
Different cross sections gives signifiant different scales and shows differenttemperature dependences
Redondas (AEMET) ATMOZ Meeting Prage 2014 October 29, 2015 14 / 35
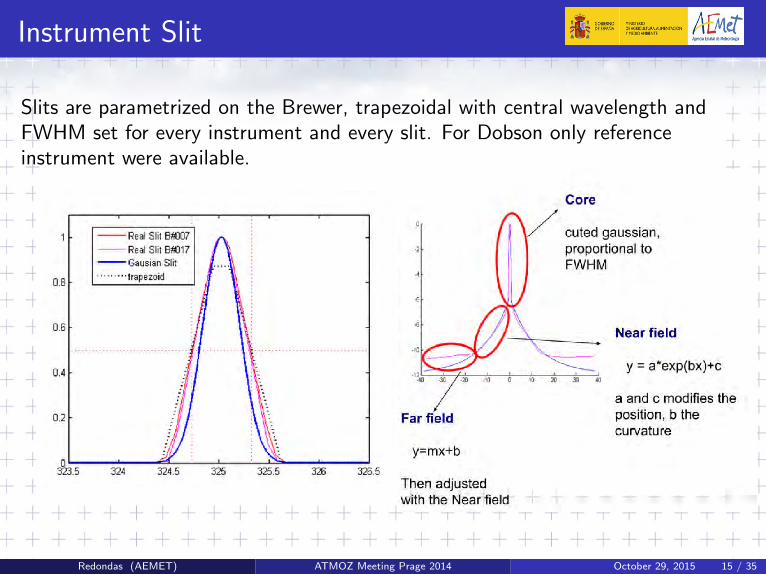
Instrument Slit
Slits are parametrized on the Brewer, trapezoidal with central wavelength andFWHM set for every instrument and every slit. For Dobson only referenceinstrument were available.
Redondas (AEMET) ATMOZ Meeting Prage 2014 October 29, 2015 15 / 35
Comparison of new characterized bandpass andwavelengths of Dobsons
Alberto Redondas, 1
1Izana Atmospheric Research Center, AEMET, Tenerife, Canary Islands, Spain.
October 29, 2015
Redondas (AEMET) ATMOZ Meeting Prage 2014 October 29, 2015 16 / 35
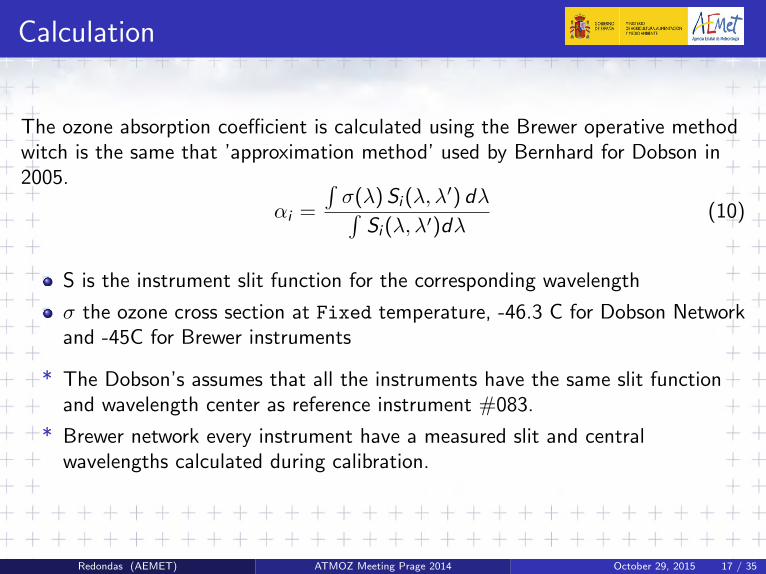
Calculation
The ozone absorption coefficient is calculated using the Brewer operative methodwitch is the same that ’approximation method’ used by Bernhard for Dobson in2005.
αi =
∫σ(λ) Si (λ, λ
′) dλ∫Si (λ, λ′)dλ
(10)
S is the instrument slit function for the corresponding wavelength
σ the ozone cross section at Fixed temperature, -46.3 C for Dobson Networkand -45C for Brewer instruments
* The Dobson’s assumes that all the instruments have the same slit functionand wavelength center as reference instrument #083.
* Brewer network every instrument have a measured slit and centralwavelengths calculated during calibration.
Redondas (AEMET) ATMOZ Meeting Prage 2014 October 29, 2015 17 / 35

Dobson #083 Slit measurement
Dobson Manual :
Redondas (AEMET) ATMOZ Meeting Prage 2014 October 29, 2015 18 / 35

Dobson #083 Slit measurement
Dobson Slit Measurements :- Bell Brothers Digitalised 1992, (Komhyr 1898) Dobson #083- Evans et all 2012 (Avaspec) Dobson #083
QOS 2012 Determination of Dobson Instrument Spectral Characteristics a newmethodRedondas (AEMET) ATMOZ Meeting Prage 2014 October 29, 2015 19 / 35

Dobson #083 Slit measurement
- Bernhard 2005 , use a new parametrisation.
Redondas (AEMET) ATMOZ Meeting Prage 2014 October 29, 2015 20 / 35
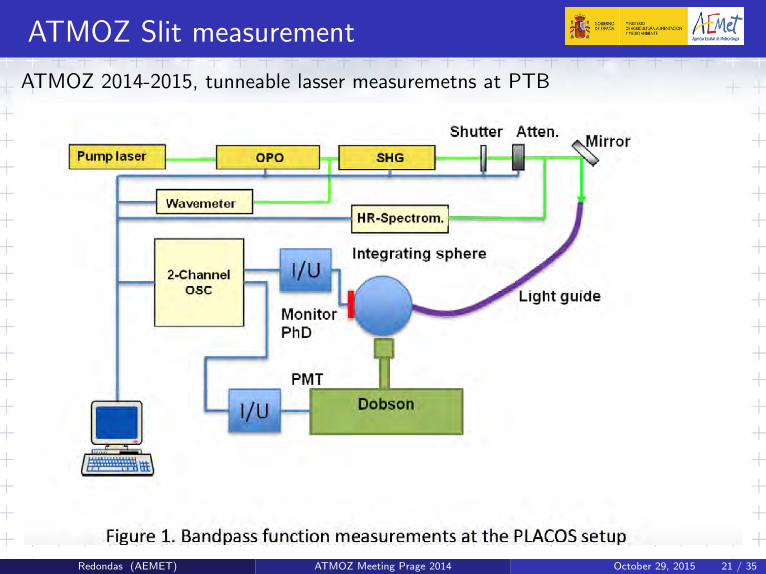
ATMOZ Slit measurement
ATMOZ 2014-2015, tunneable lasser measuremetns at PTB
Redondas (AEMET) ATMOZ Meeting Prage 2014 October 29, 2015 21 / 35
ATMOZ Slit measurement
ATMOZ 2014-2015, tunneable lasser measuremetns at PTB
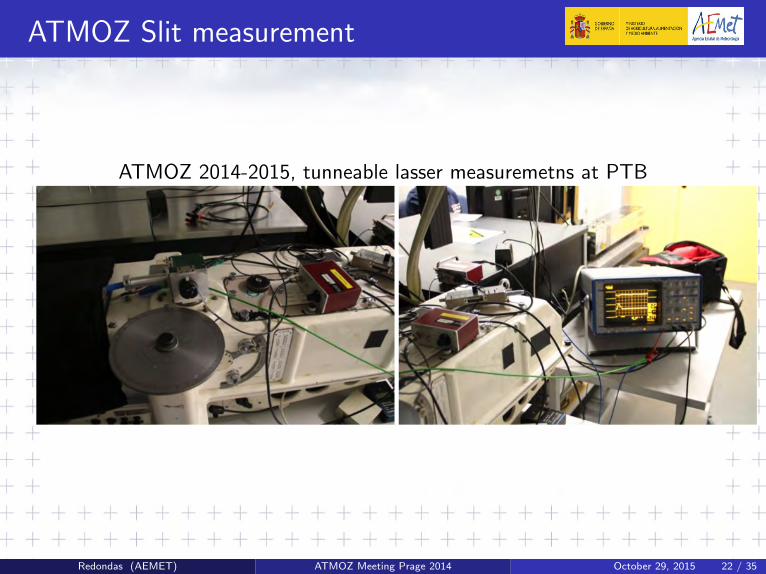
Redondas (AEMET) ATMOZ Meeting Prage 2014 October 29, 2015 22 / 35
ATMOZ Slit measurement
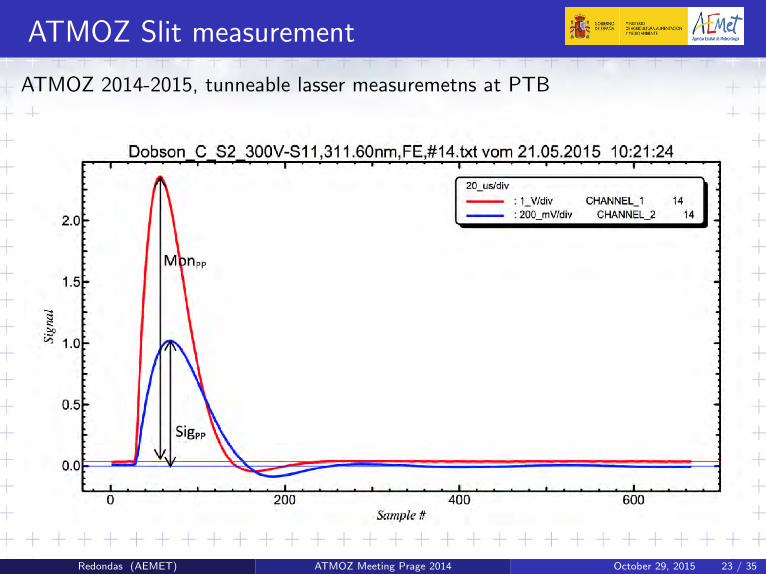
ATMOZ 2014-2015, tunneable lasser measuremetns at PTB
Redondas (AEMET) ATMOZ Meeting Prage 2014 October 29, 2015 23 / 35

ATMOZ 2014-2015, tunneable lasser measuremetns at PTB
Redondas (AEMET) ATMOZ Meeting Prage 2014 October 29, 2015 24 / 35

ATMOZ 2014-2015, tunneable lasser measuremetns at PTB
Redondas (AEMET) ATMOZ Meeting Prage 2014 October 29, 2015 25 / 35

ATMOZ 2014-2015, tunneable lasser measuremetns at PTB
Redondas (AEMET) ATMOZ Meeting Prage 2014 October 29, 2015 26 / 35
ATMOZ 2014-2015, tunneable lasser measuremetns at PTB
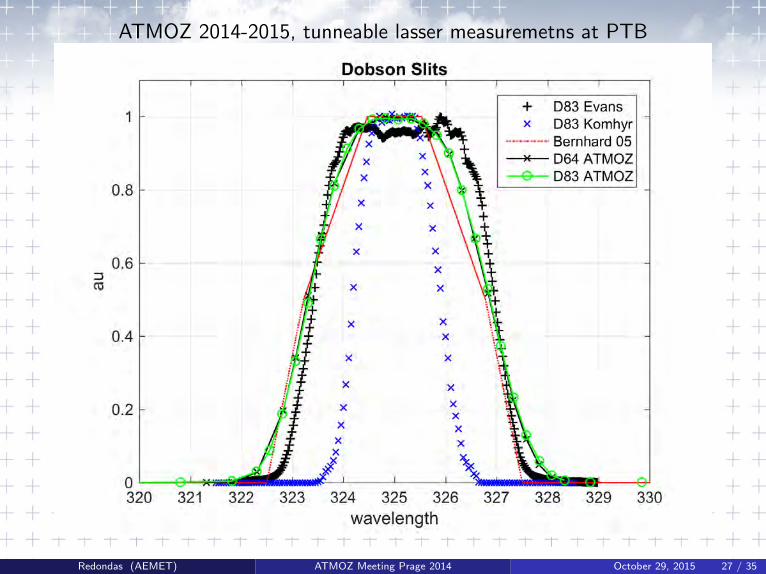
Redondas (AEMET) ATMOZ Meeting Prage 2014 October 29, 2015 27 / 35

ATMOZ 2014-2015, tunneable lasser measuremetns at PTB
Redondas (AEMET) ATMOZ Meeting Prage 2014 October 29, 2015 28 / 35

Slits & Cross Sections used
Figure 1: Studied XS at 228K and slit functions of Dobson
Redondas (AEMET) ATMOZ Meeting Prage 2014 October 29, 2015 29 / 35
Ozone Cross Sections Analyzed
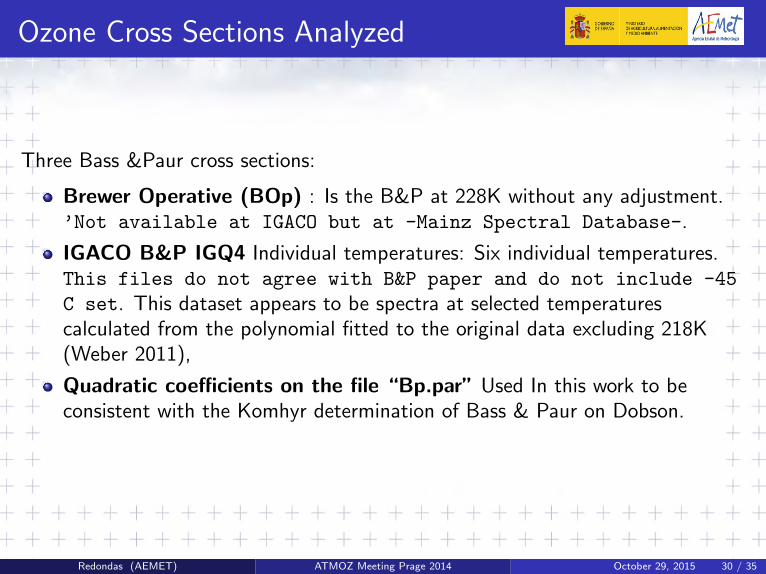
Three Bass &Paur cross sections:
Brewer Operative (BOp) : Is the B&P at 228K without any adjustment.’Not available at IGACO but at -Mainz Spectral Database-.
IGACO B&P IGQ4 Individual temperatures: Six individual temperatures.This files do not agree with B&P paper and do not include -45
C set. This dataset appears to be spectra at selected temperaturescalculated from the polynomial fitted to the original data excluding 218K(Weber 2011),
Quadratic coefficients on the file “Bp.par” Used In this work to beconsistent with the Komhyr determination of Bass & Paur on Dobson.
Redondas (AEMET) ATMOZ Meeting Prage 2014 October 29, 2015 30 / 35

Ozone Cross Sections Analyzed
Berhard 2005 (B05), B&P corrected by temperature dependence andextended with Molina & Molina cross section. Includes dynamical effectsconvolving the XS with temperature profile and ozone profile and top of theatmosphere solar spectrum.
Daumont, Brion & Malicet (DBM), Measured at 5 temperatures,including 228K also we use the quadratic fit for the temperature dependencestudies. We also use the Liu 2007 quadratic fit excluded the 273◦K set .
HARMONICS :Serdyuchenco et all (IUP), The newly determined dataset from Bremen University, Institute for e Enviromental Physics (IUP) arealso available at IGACO with ten temperatures files and the quadratic fit(IUPQ).
Redondas (AEMET) ATMOZ Meeting Prage 2014 October 29, 2015 31 / 35

305 310 315 320 325 3300.94
0.95
0.96
0.97
0.98
0.99
1
1.01
1.02
wavelength (nm)
Ratio
Ratio to IGACO Bass & Paur at T=228K
BOp B05 DBM IUP IUPQ
Figure 2: Ratio of the cross-sections of this study to the IGACO Bass & Paur (IGQ4) ,the cross section are interpolated to a common resolution (0.1 nm) and smoothed to theBrewer resolution
Redondas (AEMET) ATMOZ Meeting Prage 2014 October 29, 2015 32 / 35

Central Wavelengths Dobson 064
Redondas (AEMET) ATMOZ Meeting Prage 2014 October 29, 2015 32 / 35
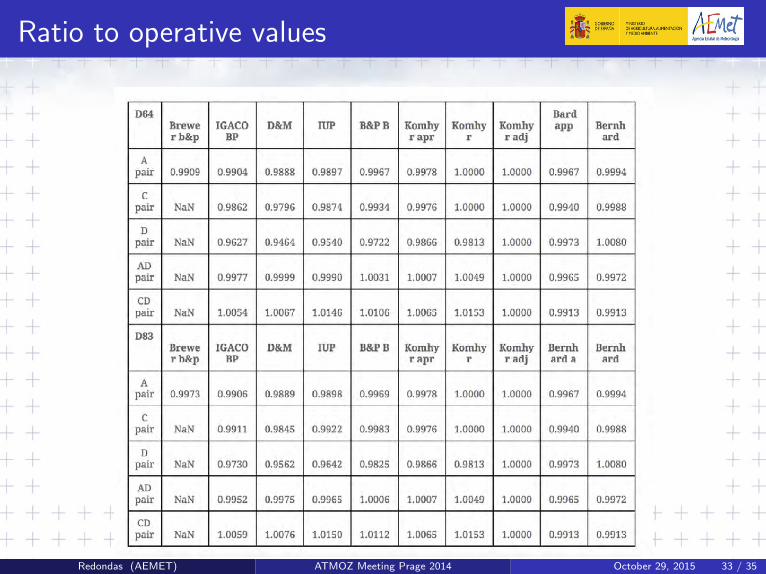
Ratio to operative values
Redondas (AEMET) ATMOZ Meeting Prage 2014 October 29, 2015 33 / 35

Ratio to operative values
Redondas (AEMET) ATMOZ Meeting Prage 2014 October 29, 2015 34 / 35

Conclusions
The ATMOZ measurements replicates the Komhyr one (but 325 nm) withsmall differences, 0.1nm in the worst case.
The cross section ratio to the operational value is directly the change on thecalculated ozone. There are minimal changes in AD pair (the most used) 0.3% in the worst case and something slightly larger on CD 1% pair, this valuesslightly change depending of the cross section used.
Redondas (AEMET) ATMOZ Meeting Prage 2014 October 29, 2015 35 / 35