Comparison Of AHP and BWM Methods Based on Geographic ... · Comparison Of AHP and BWM Methods...
5
Comparison Of AHP and BWM Methods Based on Geographic Information System For Determining Potential Zone of Pasir Batu Mining Adiba Sabilla Ajrina 1 Department of Information Technology Management, Faculty of Magister of Technology Management Institut Teknologi Sepuluh Nopember Surabaya, Indonesia adiba.asabilla@gmail,com Riyanarto Sarno 2 Department of Informatics, Faculty of Information Technology and Communication Institut Teknologi Sepuluh Nopember Surabaya, Indonesia [email protected] R.V. Hari Ginardi 3 Department of Information Technology Management, Faculty of Magister of Technology Management Institut Teknologi Sepuluh Nopember Surabaya, Indonesia [email protected] Abstract- Infrastructure development is increasing in order to fulfill the principle of sustainable development. This has influenced the need for building materials, one of which is Pasir Batu. Kediri Regency is one of the districts that produces the largest Pasir Batu in East Java Province. This is due to the existence of several rivers which is the area of lava flow resedimentation from Mount Kelud. Currently there are already some mining activities in Kediri Regency conducted at several potential points of Pasir Batu. This observe aims to map the region of mining areas assessed as probably the usage of Geographic Information System (GIS) and Multi Criteria Decision Making (MCDM) using Analitycal Hierarchy Process (AHP) and Best Worst Method (BWM) methods. GIS is used for records integration in order that zoning dedication may be visual, less difficult and more powerful. Whilst MCDM is used to decide the significance and weighting criteria. The criteria used are distance from main road, distance from nearest settlement, population density, lithology condition and morphological situation. The final result shows that the weight rank of two methods are different. In the calculation by the AHP method, we get the percentage weight as it follows : C4 (55,32%), C1 (26,72%), C5 (6,61%), C3 (6,10%) and the last is C2 (5,24%). Otherwise, in the calculation by the BWM method, we get the percentage weight as it follows : C4 (43,10%), C1 (24,60%), C2 (15,40%), C3 (12,30%) and the last is C5 (4,60%).The choice of criteria and deliberate hierarchy, additionally expert judgment to determine the level of significance of every criterion on AHP and BWM methods is very influential at the decision. Keywords: SIG, MCDM, AHP, BWM, potential zone of mining I. INTRODUCTION Natural Resources are everything that comes from nature that can be used to meet the needs of human life. Based on its physical, natural resource classification consists of: (1) limited natural resources; (2) renewable natural resources; (3) Non- renewable natural resources; and (4) potential sources that are not currently a resource [1]. The natural resources of Pasir Batu in Gunung Kelud is a product of active volcanic activity. Pasir Batu from Gunung Kelud in Kediri Regency is used by the people as a mining business. Therefore, the current type of resources in this location is a renewable natural resource. In practice, there are several mining sites that are less potential after mining activities. To minimize it, it is necessary to zoning the potential of Pasir Batu mining in Kediri Regency. No research in Indonesia has determined the potential zones of mining by using the proposed method of MCDM using AHP (Analytical Hierarchy Process) and BWM (Best Worst Method) until now. This observe aims to decide the potential zone rank of mining in Kediri Regency based on predetermined criteria. This can be used as one of the considerations by investors to determine the mining area with the desired potential. In addition, the determination of potential zones from Pasir Batu mining can be used as a basis for the government to evaluate the determination of mining areas. The scope of this research is to determine the potential zone of mining in Kediri Regency with predetermined criteria. This study is conducted by the following study methods: spatial criteria determination, secondary data collection, analysis, calculation, and reporting. II. PREVIOUS WORK Over the last few years there has been a lot of research on GIS-based location selection. The research is about site selection on solar farm, wind farm, and PV site. This research is about the determination of potential zone of Pasir Batu mining that has never been done before in Indonesia. Research on site selection is always associated with Multi Criteria Decision Making. This means it needs to be determined first about the method used. Wiguna (2016) conducted a study to optimize the selection of solar farm location using Fuzzy AHP and PROMETHEE methods. The study used two methods for weighting and ranking. This is in line with the research objectives, but at the conclusion it was revealed that the study was intended to integrate MCDM methods directly into the ArcGIS Toolbox. This integration stage is not yet clearly written on the experiment method. The method used in this research is BWM (Best Worst Method) that is a brand new method created by means of Rezaei (2015). This method compares all criteria with the best and worst criteria. The research has been written down its calculation steps. But in the stage of determining the optimal weight is not explained how to solve it. This is quite difficult to follow the paper. III. LITERATURE REVIEW A. Geographic Information System GIS is a system this is related to each other [2]. GIS as an prepared data set of pc hardware, software, geographic facts and employees designed to accumulate, save, restore, manage, examine, and show all types of environmental and geographical facts [3]. As a consequence, the analytical foundation of GIS is spatial records in virtual shape acquired through satellite data or different data digitized [4]. 2018 International Seminar on Application for Technology of Information and Communication (iSemantic) 453
Transcript of Comparison Of AHP and BWM Methods Based on Geographic ... · Comparison Of AHP and BWM Methods...
Comparison Of AHP and BWM Methods Based on Geographic Information System For Determining Potential Zone of Pasir Batu Mining
Adiba Sabilla Ajrina1
Department of Information Technology Management, Faculty of Magister of
Technology Management Institut Teknologi Sepuluh Nopember
Surabaya, Indonesia adiba.asabilla@gmail,com
Riyanarto Sarno2 Department of Informatics, Faculty of
Information Technology and Communication
Institut Teknologi Sepuluh Nopember Surabaya, Indonesia [email protected]
R.V. Hari Ginardi3 Department of Information Technology
Management, Faculty of Magister of Technology Management
Institut Teknologi Sepuluh Nopember Surabaya, Indonesia
Abstract- Infrastructure development is increasing in order to fulfill the principle of sustainable development. This has influenced the need for building materials, one of which is Pasir Batu. Kediri Regency is one of the districts that produces the largest Pasir Batu in East Java Province. This is due to the existence of several rivers which is the area of lava flow resedimentation from Mount Kelud. Currently there are already some mining activities in Kediri Regency conducted at several potential points of Pasir Batu.
This observe aims to map the region of mining areas assessed as probably the usage of Geographic Information System (GIS) and Multi Criteria Decision Making (MCDM) using Analitycal Hierarchy Process (AHP) and Best Worst Method (BWM) methods. GIS is used for records integration in order that zoning dedication may be visual, less difficult and more powerful. Whilst MCDM is used to decide the significance and weighting criteria. The criteria used are distance from main road, distance from nearest settlement, population density, lithology condition and morphological situation.
The final result shows that the weight rank of two methods are different. In the calculation by the AHP method, we get the percentage weight as it follows : C4 (55,32%), C1 (26,72%), C5 (6,61%), C3 (6,10%) and the last is C2 (5,24%). Otherwise, in the calculation by the BWM method, we get the percentage weight as it follows : C4 (43,10%), C1 (24,60%), C2 (15,40%), C3 (12,30%) and the last is C5 (4,60%).The choice of criteria and deliberate hierarchy, additionally expert judgment to determine the level of significance of every criterion on AHP and BWM methods is very influential at the decision.
Keywords: SIG, MCDM, AHP, BWM, potential zone of mining
I. INTRODUCTION Natural Resources are everything that comes from nature
that can be used to meet the needs of human life. Based on its physical, natural resource classification consists of: (1) limited natural resources; (2) renewable natural resources; (3) Non-renewable natural resources; and (4) potential sources that are not currently a resource [1].
The natural resources of Pasir Batu in Gunung Kelud is a product of active volcanic activity. Pasir Batu from Gunung Kelud in Kediri Regency is used by the people as a mining business. Therefore, the current type of resources in this location is a renewable natural resource. In practice, there are several mining sites that are less potential after mining activities. To minimize it, it is necessary to zoning the potential of Pasir Batu mining in Kediri Regency.
No research in Indonesia has determined the potential zones of mining by using the proposed method of MCDM using AHP (Analytical Hierarchy Process) and BWM (Best Worst Method)
until now. This observe aims to decide the potential zone rank of mining in Kediri Regency based on predetermined criteria. This can be used as one of the considerations by investors to determine the mining area with the desired potential. In addition, the determination of potential zones from Pasir Batu mining can be used as a basis for the government to evaluate the determination of mining areas.
The scope of this research is to determine the potential zone of mining in Kediri Regency with predetermined criteria. This study is conducted by the following study methods: spatial criteria determination, secondary data collection, analysis, calculation, and reporting.
II. PREVIOUS WORK Over the last few years there has been a lot of research on
GIS-based location selection. The research is about site selection on solar farm, wind farm, and PV site. This research is about the determination of potential zone of Pasir Batu mining that has never been done before in Indonesia.
Research on site selection is always associated with Multi Criteria Decision Making. This means it needs to be determined first about the method used. Wiguna (2016) conducted a study to optimize the selection of solar farm location using Fuzzy AHP and PROMETHEE methods. The study used two methods for weighting and ranking. This is in line with the research objectives, but at the conclusion it was revealed that the study was intended to integrate MCDM methods directly into the ArcGIS Toolbox. This integration stage is not yet clearly written on the experiment method.
The method used in this research is BWM (Best Worst Method) that is a brand new method created by means of Rezaei (2015). This method compares all criteria with the best and worst criteria. The research has been written down its calculation steps. But in the stage of determining the optimal weight is not explained how to solve it. This is quite difficult to follow the paper.
III. LITERATURE REVIEW
A. Geographic Information System GIS is a system this is related to each other [2]. GIS as an
prepared data set of pc hardware, software, geographic facts and employees designed to accumulate, save, restore, manage, examine, and show all types of environmental and geographical facts [3]. As a consequence, the analytical foundation of GIS is spatial records in virtual shape acquired through satellite data or different data digitized [4].
2018 International Seminar on Application for Technology of Information and Communication (iSemantic)
453

As previously described, Geographic Information Systems (GIS) has the ability to answer both spatial and non-spatial questions and their combinations in order to provide solutions to spatial problems [5]. This means that the system is designed to support various analyzes of geographic information, such as engineering techniques used to investigate and discover data from a spatial angle, to expand and take a look at models, and to offer data to improve knowledge [6]. It is this function or analytical technique that in Geographic Information Systems (GIS) is referred to as spatial analysis [7].
B. Analytical Hierarchy Process (AHP) Analitycal Hierarchy Process (AHP) is a technique to resolve
an unstructured complicated scenario into numerous components in a hierarchical arrangement, giving subjective values about the relative significance of every variable, and specifying which variable has the very best priority to persuade the final results of the scenario [8].
The selection-making technique is largely selecting the first-rate alternative. the principle system of Analitycal Hierarchy process (AHP) is to have a purposeful hierarchy with the primary enter of human belief [9]. With the hierarchy, a complicated and unstructured problem is solved into its clusters and prepared into a hierarchical shape [10].
C. Best Worst Method (BWM) Best-worst method (BWM) is proposed to remedy the hassle
of multi-criteria decision-making (MCDM). Some of alternatives are evaluated when it comes to some of standards for selecting the pleasant alternative [11].
In line with BWM, the best (eg maximum suitable, maximum critical) and worst (eg least suitable, least critical) criteria are recognized first through the selection maker. A pairwise assessment is then carried out among every of those criteria (best and worst) and other criteria. The maximin hassle is then formulated and solved to decide the weight of various criteria. Alternative weights with reference to distinctive criteria are received using the same technique. The very last rating of the opportunity is acquired by using combining the weights of different units of criteria and options, primarily based on which great alternative is chosen. A consistency ratio is proposed for BWM to test for assessment reliability [12].
IV. METHOD The methodology of this research is arranged systematically
as a research framework. Here are the steps of the research:
Fig. 1. Research Methodology
A. Spatial Data Analysis 1) Defining the Allowed Area by Regulation
a) Mining Area Based on Keputusan Menteri ESDM No. 3672
K/30/MEM/2017 tentang Wilayah Pertambangan (WP) Pulau Jawa dan Bali, Wilayah Pertambangan (WP) is divided into Wilayah Usaha Pertambangan (WUP), Wilayah Pertambangan Rakyat (WPR) and Wilayah Pencadangan Negara (WPN). WUP is a part of WP that already has data availability, potential, and / or geological information. WPR is a part of WP where people's mining business activities are conducted. While WPN is part of WP reserved for national strategic importance.
Based on the following WP Map of Kediri Regency, almost the entire area of Kediri is WUP area, except for a small part of the easternmost area. This means that almost all areas of Kediri Regency can be proposed for mining business based on the regulation.
Fig. 2. Mining Area Map of Kediri Regency
b) Spatial and Region Plan Based on Peraturan Daerah Kabupaten Kediri Nomor 14
Tahun 2011 and Peraturan Bupati Kediri Nomor 57 Tahun 2015 which regulate any area that can be mined based on Spatial and Region Plan of Kediri Regency.
Based on the Spatial and Region Plan Map of Kediri Regency, most of the permitted areas are located in the West region. The eastern region permitted is along the resedimentation area of Mount Kelud’s sand which is the flow of the Ngobo and Srinjing Rivers. This is intended for mining activities to assist the government in terms of normalization of the river. However, the white areas are not permitted as a mining area.
Fig. 3. Spatial and Region Plan Map of Kediri Regency
c) Forest Area Based on Peraturan Menteri Kehutanan Republik
Indonesia Nomor : P. 50/Menhut-Ii/2009 Tentang Penegasan Status Dan Fungsi Kawasan Hutan, there are 3 types of forests. They are Hutan Produksi, Hutan Lindung and Kawasan Suaka Alam. Only Hutan Produksi that can be allowed as a mining area with certain requirements. The white areas are not included in the forest map. Here is the map of Forest Area of Kediri Regency:
Spatial Criteria Determination
Spatial Analysis with GIS
Weighing criteria using AHP
Weighing criteria using BWM
Compare AHP and BWM weightings
2018 International Seminar on Application for Technology of Information and Communication (iSemantic)
454
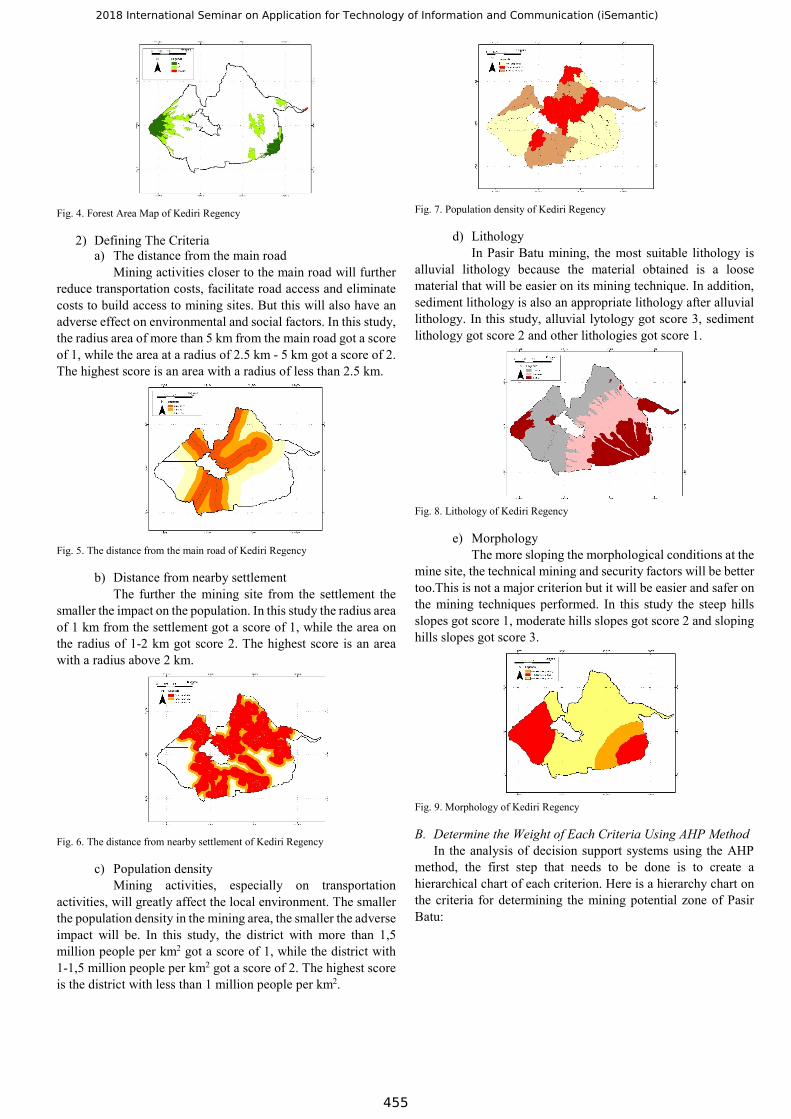
Fig. 4. Forest Area Map of Kediri Regency
2) Defining The Criteria a) The distance from the main road
Mining activities closer to the main road will further reduce transportation costs, facilitate road access and eliminate costs to build access to mining sites. But this will also have an adverse effect on environmental and social factors. In this study, the radius area of more than 5 km from the main road got a score of 1, while the area at a radius of 2.5 km - 5 km got a score of 2. The highest score is an area with a radius of less than 2.5 km.
Fig. 5. The distance from the main road of Kediri Regency
b) Distance from nearby settlement The further the mining site from the settlement the
smaller the impact on the population. In this study the radius area of 1 km from the settlement got a score of 1, while the area on the radius of 1-2 km got score 2. The highest score is an area with a radius above 2 km.
Fig. 6. The distance from nearby settlement of Kediri Regency
c) Population density Mining activities, especially on transportation
activities, will greatly affect the local environment. The smaller the population density in the mining area, the smaller the adverse impact will be. In this study, the district with more than 1,5 million people per km2 got a score of 1, while the district with 1-1,5 million people per km2 got a score of 2. The highest score is the district with less than 1 million people per km2.
Fig. 7. Population density of Kediri Regency
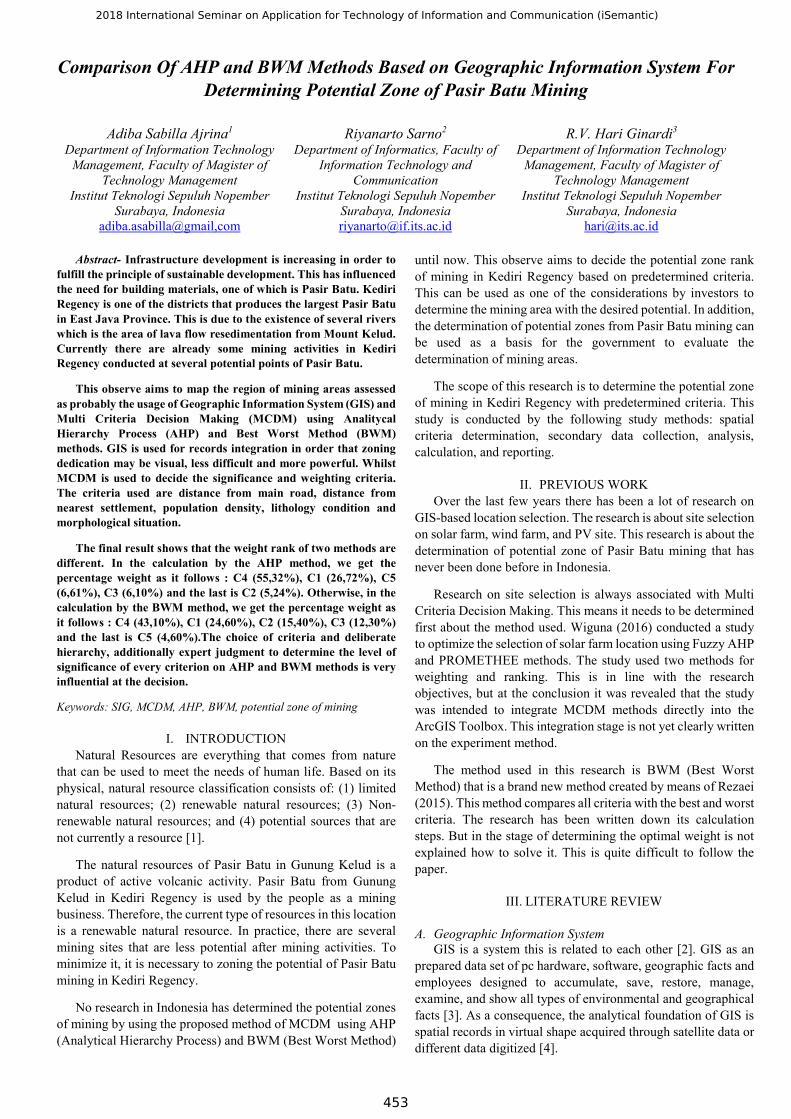
d) Lithology In Pasir Batu mining, the most suitable lithology is
alluvial lithology because the material obtained is a loose material that will be easier on its mining technique. In addition, sediment lithology is also an appropriate lithology after alluvial lithology. In this study, alluvial lytology got score 3, sediment lithology got score 2 and other lithologies got score 1.
Fig. 8. Lithology of Kediri Regency
e) Morphology The more sloping the morphological conditions at the
mine site, the technical mining and security factors will be better too.This is not a major criterion but it will be easier and safer on the mining techniques performed. In this study the steep hills slopes got score 1, moderate hills slopes got score 2 and sloping hills slopes got score 3.
Fig. 9. Morphology of Kediri Regency
B. Determine the Weight of Each Criteria Using AHP Method In the analysis of decision support systems using the AHP
method, the first step that needs to be done is to create a hierarchical chart of each criterion. Here is a hierarchy chart on the criteria for determining the mining potential zone of Pasir Batu:
2018 International Seminar on Application for Technology of Information and Communication (iSemantic)
455

Fig. 10. Hierarchy Research Chart
To determine the priority then we must do a pairwise comparison that is comparing all the criteria for each hierarchy. The comparative assessment in this study used 9 scaled values [8]. In this study there are 5 criteria so that the results of the comparison of each criterion will produce a 5x5 matrix as in Table 1.
TABLE I. PAIRWISE COMPARISON MATRIX OF AHP
Based on the matrix of pairwise comparison, it is normalized by the following steps: summing the weight of each column, then the value of each column divided by the total column value, then calculating the relative priority vector of each criterion by averaging the already normalized weight. To calculate the weight of the average value (eigenvector) is by dividing a number of criteria (5). The end result of the priority weight calculation (eigenvector value) is a decimal number under one with total priorities for the criteria in one group equal to one (1). Here are the results of a normalized matrix:
TABLE II. NORMALIZED MATRIX
Once the weights can be determined, it is necessary to calculate the consistency of the matrix. The calculation is accomplished by means of summing all of the values of every column inside the matrix, dividing every value of the column by the overall of the corresponding columns to achieve the
normalization of the matrix, and summing the values of every row and dividing by the wide variety of factors to get the average. To test the consistency of the hierarchy as measured in AHP is the consistency ratio by searching on the consistency index. Consistency is predicted to be close to perfect to provide a selection that is near legitimate. Even though it is hard to obtain best, the consistency ratio is anticipated to be much less than or same to 10%. With those calculations obtained CI 0.1085 and CR 9.69% then the weighting desire is consistent.
C. Determine the Weight of Each Criteria Using BWM Method BWM technique is used to decide the weight of every
criterion. In this way, according to experts, the best criterion for determining the potential zonation of Pasir Batu mining is the condition of lithology, and the worst criterion, is the morphological condition.
TABLE III. PAIRWISE COMPARISON MATRIX OF BWM
j Criteria BEST WORST
Lithology Morphology a Bj a jW
j1 Main Road 2,5 6,7 j2 Settlement area 3,6 5,2 j3 Population density 6,4 2,3 j4 Lithology 1 8,5 j5 Morphology 8,5 1
Thus, the best criterion (a Bj) and the worst criterion (a jW), are compared with other criteria with a scale of 1-10. The comparison values obtained are given in Table III. min
Subject to − 2,5 ≤ , − 3,6 ≤ , ...., , − 8,5 ≤
− 6,7 ≤ , − 5,2 ≤ , ..... , − 1 ≤ + + + + = 1 , , , , ≥ 0 (1)
where: : the weight of 1-5 criterion
: the weight of the best criterion : the weight of the worst criterion
The resulted model given in Eq. (1) is solved using MATLAB optimization toolbox, and weight of each criteria in Determining Potential Zone of Pasir Batu Mining were determined. Table IV shows the weights of every criterion.
TABLE IV. WEIGHT OF CRITERION USING BWM
Determination of Potential Zone of pasir BatuMining in Kediri Regency
Distance
C1 - Main Road
C2 - Settlement
Social
C3 - Population Density
Geographic
C4 - Lithology
C5 - MorphologyM
ain
Roa
d
Sett
lem
ent
Pop
ulat
ion
Den
sity
Lit
holo
gy
Mor
phol
ogy
C1 Main Road 1,00 5,50 6,00 0,17 7,00
C2 Settlement 0,18 1,00 0,67 0,15 0,67
C3Population Density
0,17 1,50 1,00 0,14 0,67
C4 Lithology 6,00 6,50 7,00 1,00 9,00
C5 Morphology 0,14 1,50 1,50 0,11 1,00
7,49 16,00 16,17 1,57 18,33Amount
Criteria
Mai
n R
oad
Sett
lem
ent
Pop
ulat
ion
Den
sity
Lit
holo
gy
Mor
phol
ogy
Wei
ght
C1 Main Road 0,133 0,344 0,371 0,106 0,382 26,72%
C2 Settlement 0,024 0,063 0,041 0,098 0,036 5,24%
C3Population Density
0,022 0,094 0,062 0,091 0,036 6,10%
C4 Lithology 0,801 0,406 0,433 0,635 0,491 55,32%
C5 Morphology 0,019 0,094 0,093 0,071 0,055 6,61%
Criteria
Criteria Weightj1 Main Road 24,60%j2 Settlement area 15,40%j3 Population density 12,30%j4 Lithology 43,10%j5 Morphology 4,60%
2018 International Seminar on Application for Technology of Information and Communication (iSemantic)
456

V. CONCLUSION To support the development of increasing
infrastructure, it should be supported also by appropriate resources. Resources include human and natural resources. Pasir Batu is one of the most needed commodities to support infrastructure development. Kediri Regency, as one of the sand granary of East Java Province, must know the potential points of mining area. This can be used as a basis for local governments to evaluate the determination of mining areas.
Research on location determination using MCDM method has been done but never been done to determine the potential location of Pasir Batu mining. This study uses 5 criteria as the basis for determining the potential zone of Pasir Batu mining. In the calculation by the AHP method, we get the percentage weight as it follows : C4 (55,32%), C1 (26,72%), C5 (6,61%), C3 (6,10%) and the last is C2 (5,24%). Otherwise, in the calculation by the BWM method, we get the percentage weight as it follows : C4 (43,10%), C1 (24,60%), C2 (15,40%), C3 (12,30%) and the last is C5 (4,60%). Based on the comparison of the two methods, the highest criterion is the lithology then the next criterion is the distance from the main road. In the next criteria, the two methods do not have the same sequence. The BWM Method makes the comparisons in a more structured way, which makes it easier and more understandable, and leads to more consistent comparisons, hence more reliable weights.
The selection of criteria and planned hierarchy, also expert judgment to determine the level of importance of each criterion on AHP and BWM methods is very influential on the decision. Giving weight to the priority builder is very influential on the outcome. If the range of differences between each criterion is greater then the calculation results will also be different. The level of dominance on each criterion will also differ depending on the priority value.
REFERENCES
[1] K. Wiguna, R. Sarno dan N. Ariyani, “Optimization Solar Farm Site Selection Using Multi Criteria Decision Making Fuzzy AHP and Promethee: Case Study in Bali,” International Conference on Information & Communication Technology and Systems (ICTS), pp. 237-243, 2016.
[2] M.Sánchez-Lozano, J. Teruel-Solano, P. Soto-Elvira dan M. García-Cascales, “Geographical Information Systems (GIS) and Multi-Criteria Decision Making (MCDM) methods for the evaluation of solar farms locations: Case study in south-eastern Spain,” Renewable and Sustainable Energy Reviews, pp. 544-556, 2013.
[3] M. Uyan, “GIS-based solar farms site selection using analytic hierarchy process,” Renewable and Sustainable Energy Reviews, pp. 11-17, 2013.
[4] Y. Charabi dan G. A, “PV site suitability analysis using GIS-based spatial fuzzy multi-criteria evaluation,” Renewable Energy, pp. 2554-2561, 2010.
[5] T. M., H. M. dan a. M. M., “The evaluation of solar farm locations applying Geographic Information System and Multi-Criteria Decision-Making methods: Case study in southern Morocco,” Renewable and Sustainable Energy Reviews, pp. 1353-1362, 2015.
[6] P. Ghusti, R. Sarno dan R. H. Ginardi, “Substation Placement Optimization Method Using Delaunay Triangulation Algorithm and Voronoi Diagram In East Java Case Study,” International Conference on Information & Communication Technology and Systems (ICTS), p. 208 – 213, 2016.
[7] J. Sánchez-Lozano, M. García-Cascales dan M. Lamata, “GIS based onshore wind farm site selection using Fuzzy Multi-Criteria Decision Making methods. Evaluating the case of Southeastern Spain,” Applied Energy, pp. 86-102, 2016.
[8] Saaty, “How to make decision: The Analytical Hierarchy Process,” European Journal of Operational Research 48, pp. 9-26, 1990.
[9] A. Apriliana, R. Sarno dan Y. Effendi, “Risk Analysis of IT Applications Using FMEA and AHP SAW Method With COBIT 5,” 2018 International Conference on Information and Communications Technology (ICOIACT), pp. 373 - 378, 2018.
[10] G. Kabir dan R. Sumi, “Power substation location selection using fuzzy analytic hierarchy process and PROMETHEE: A case study from Bangladesh,” Energy, pp. 717-730, 2014.
[11] C. A. dan R. Sarno, “Application of Analytic Hierarchy Process (AHP) and Simple Additive Weighting (SAW) methods in singer selection process,” 2018 International Conference on Information and Communications Technology (ICOIACT), pp. 234-239, 2018.
[12] J. Rezaei, “Best-Worst Multi-Criteria Decision-Making Method,” Omega, pp. 49-57, 2015.
[13] J. Rezaei, “Best-worst multi-criteria decision-making method: Some properties and a linear model,” Omega, pp. 126-130, 2016.
2018 International Seminar on Application for Technology of Information and Communication (iSemantic)
457