Comparative performance monitoring report 21st …...4 Foreword The Labour Ministers’ Council...
47
Transcript of Comparative performance monitoring report 21st …...4 Foreword The Labour Ministers’ Council...


2
Disclaimer
Safe Work Australia provides the information in this publication to raise awareness of work health and safety.
While Safe Work Australia makes every effort to ensure information is accurate and up-to-date, Safe Work Australia does not provide any
warranty regarding the accuracy, currency or completeness of the information contained in this publication and will not be held liable for any
loss, damage, cost or expense incurred or arising by reason of any person using or relying on the information in this publication.
This publication may incorporate views or information from third parties, which do not necessarily reflect the views of Safe Work Australia. The
inclusion of such material does not indicate an endorsement of that material or a commitment to any particular course of action. The views in
this publication should not be taken to represent the views of Safe Work Australia unless otherwise expressly stated.
ISSN 2209-9182
Creative Commons
This copyright report is licensed under a Creative Commons Attribution-Noncommercial 4.0 International licence. To view a copy of this licence, visit https://creativecommons.org/licenses/by-nc/4.0/. In essence, you are free to copy, communicate and adapt the work for non-commercial purposes, as long as you attribute the work to Safe Work Australia and abide by the other licence terms.
Enquiries regarding the licence and any use of the report are welcome at:
Copyright Officer
Safe Work Australia
GPO Box 641 Canberra ACT 2601
Email: [email protected]
Important Notice
Safe Work Australia provides the information given in this document to improve public access to information about work health and safety
information generally. The vision of Safe Work Australia is Australian workplaces free from injury and disease. Its mission is to lead and
coordinate national efforts to prevent workplace death, injury and disease in Australia.

3
Contents
Foreword ............................................................................................................................................ 4
1. Workers’ compensation premiums ............................................................................................ 8
1.1 Standardised average premium rates by jurisdiction ............................................................. 8
1.2 Standardised average premium rates by industry ................................................................. 9
2. Entitlements under workers’ compensation ........................................................................... 22
2.1 Temporary impairment ......................................................................................................... 22
2.2 Permanent impairment ......................................................................................................... 24
2.3 Workplace fatality ................................................................................................................. 25
3. Workers’ compensation scheme performance ....................................................................... 27
3.1 Assets to liabilities ratio ........................................................................................................ 27
3.2 Scheme expenditure ............................................................................................................ 29
3.3 Current return to work .......................................................................................................... 32
3.4 Disputation rate .................................................................................................................... 33
3.5 Dispute resolution ................................................................................................................. 34
Appendix 1 — Explanatory notes .................................................................................................. 37
Premium rates and entitlements .................................................................................................... 37
Return to work data ....................................................................................................................... 40
Assets to liabilities ratio (funding ratio) data .................................................................................. 41
Scheme expenditure data ............................................................................................................. 42
Appendix 2 — Key features of Australian workers’ compensation schemes .......................... 44
Appendix 3 – Jurisdictional contact information ........................................................................ 47

4
Foreword
The Labour Ministers’ Council released the first Comparative Performance Monitoring (CPM) report in December 1998. The CPM project was transferred to Safe Work Australia when it was established in 2009. The CPM reports provide trend analysis on the work health and safety and workers’ compensation schemes operating in Australia and New Zealand. This is the 21st annual report of the CPM project.
The CPM is complemented by the Australian Workers’ Compensation Statistics report, which provides more detailed analysis of national workers’ compensation data using key variables such as occupation, industry, age and sex with supporting information on the circumstances surrounding work-related injury and disease occurrences. The Comparison of Workers’ Compensation Arrangements in Australia and New Zealand provides more detailed information on each scheme including coverage, benefits, self-insurance, access to common law and dispute resolution. These publications can be found at the Safe Work Australia website.
Statement of purpose
The role of the CPM report is to facilitate improvement of work health and safety, workers’ compensation and related service outcomes in Australian and New Zealand schemes through an accessible report that:
(a) monitors the comparative performance of jurisdictions over time, and
(b) enables benchmarking across jurisdictions and the identification of best practice to support policy making.
Data
The data used in this report were supplied by jurisdictions for the 2017–18 financial year plus updates back to 2013–14.
Readers should be aware that the data presented here may differ from jurisdictional annual reports due to the use of different definitions and the application of adjustment factors to aid in the comparability of data. Explanatory commentary on the data items is contained within each chapter with additional information included in Appendix 1 – Explanatory Notes, at the end of this publication.
The data in this report were collected from:
workers’ compensation schemes and work health and safety authorities as follows:
o New South Wales — State Insurance Regulatory Authority; SafeWork NSW; icare; NSW Workers’ Compensation Commission.
o Victoria — WorkSafe Victoria
o Queensland — Office of Industrial Relations
o Western Australia — WorkCover Western Australia
o South Australia — Return to Work South Australia and SafeWork SA
o Tasmania — WorkSafe Tasmania and WorkCover Tasmania
o Northern Territory — NT WorkSafe, Department of Attorney-General and Justice
o Australian Capital Territory — Access Canberra, Worksafe ACT within Chief Minister Treasury and Economic Development Directorate
o Australian Government — Comcare
5
o Seacare — Seacare Authority (Seafarers Safety, Rehabilitation and Compensation Authority), and
o New Zealand — Accident Compensation Corporation and WorkSafe New Zealand
the National Data Set for Compensation-based Statistics and the Work-related Traumatic Injury Fatalities data set compiled by Safe Work Australia. Further information on these data sets can be found on the Safe Work Australia website
the Return to Work Survey that replaced the Return to Work Monitor previously published by the Heads of Workers’ Compensation Authorities. The full results can be accessed at the Safe Work Australia website, and
the Australian Bureau of Statistics (ABS) which provides estimates of the number of employees and hours worked based on the Labour Force Survey, the Survey of Employment and Earnings and data provided by Comcare. Further adjustments are made using data from the Census, the Forms of Employment Survey and the Survey of Employment Arrangements, Retirement and Superannuation.
Coordination
This report has been compiled and coordinated by Safe Work Australia with assistance from representatives of all work health and safety and workers’ compensation authorities in Australia and New Zealand. As agreed with Comcare in this report the name ‘Australian Government’ is used for indicators relating to scheme funding ratios and expenditure, while ‘Comcare’ is used for the all other indicators, including premium rates, entitlements, return to work and disputation.
Through a partnership of governments, employers and employees, Safe Work Australia leads the development of national policy to improve work health and safety and workers’ compensation arrangements across Australia.

6

7

8
1. Workers’ compensation premiums
Workers’ compensation is a compulsory form of insurance for all employers in Australia. It provides
protection to employees if they suffer a work-related injury or disease. Workers’ compensation premiums
are paid by employers for this insurance, with the premium generally determined based on the amount of
wages paid, as well as the industry and claim history of the employer.
The rates in this chapter are for policies that provided coverage during the financial years 2013–14 to
2017–18. The premium rates reported are ‘earned premium’. Earned premium is defined as the amount
allocated for cover in a financial year from premiums collected during the previous and current financial
years, while written premium is defined as the amount of premium recorded for a policy at the time it is
issued. The premiums reported are allocated for defined periods of risk, irrespective of when they were
actually paid, enabling rates to be compared for each financial year. Goods and Services Tax charged on
premiums is not included in the reported rates as most Australian employers recoup part or all of this tax
through input tax credits.
1.1 Standardised average premium rates by jurisdiction
Readers should be aware that the historic standardised average premium rates reported here are slightly different to the rates published in previous CPM reports. This difference results from concording remuneration and premium figures provided by the Australian and New Zealand Standard Industrial Classification (ANZSIC) 2006 back to ANZSIC 1993. Also, some jurisdictions provide updated data for previous years resulting in premium rates different to what was published in previous CPM reports.
Indicator 13 shows that the standardised Australian average premium rate was 1.31 per cent of payroll in
2017−18, a 2 per cent decrease from the previous financial year.
Indicator 13 – Standardised average premium rates (including insured and self-insured sectors) by
jurisdiction
The South Australian scheme recorded the highest premium rate in 2017–18 (1.89 per cent of payroll). This
was followed by the Australian Capital Territory (1.72 per cent of payroll) and the Northern Territory
(1.46 per cent of payroll). Comcare recorded an 18 per cent decrease in their premium rate in 2017–18
compared with previous year. Adjusted remuneration and premium data for 2015–16 and 2016–17 was
supplied by South Australia for CPM 21. As a result, data for South Australia may not be comparable with
CPM 20 data for these two years.

9
Comcare recorded the lowest premium rate among all Australian jurisdictions at 0.84 per cent of payroll.
The Queensland scheme recorded the second lowest premium rate at 1.15 per cent of payroll in 2017–18,
followed closely by Western Australia at 1.16 per cent of payroll.
To be consistent with the Australian jurisdictions, the New Zealand premium information includes the levy
on employers to fund the workers’ compensation portion of the ‘Residual Claims Account’. This account
relates to workers’ compensation claims incurred prior to 1 July 1999 but excludes the liability for pre-1992
non-work injuries for earners. The New Zealand standardised average premium rate was 0.54 per cent of
payroll, a 10 per cent decrease from the previous financial year. This rate continues to be substantially
lower than the rate recorded for Australia. One reason for the lower rate in New Zealand is that the New
Zealand scheme does not provide coverage for the same range of mental health conditions as the
Australian schemes.
It should be noted that these data will be different to premium rates published directly by the jurisdictions
due to the adjustments made to the data to enable more accurate jurisdictional comparisons. The principal
regulatory differences that affect comparability for which adjustments have been applied in this indicator
are: the exclusion of provision for coverage of journey claims; the inclusion of self-insurers; the inclusion of
superannuation as part of remuneration; and the standardisation of non-compensable excesses imposed
by each scheme. The effect of each of these adjustments is shown in Appendix 1 – Table 2: Effect of
adjustment factors on premium rates in 2017–18, in the Explanatory Notes. Further information on
published rates is outlined in the publication, Comparison of Workers’ Compensation Arrangements in
Australia and New Zealand that can be found on the Safe Work Australia website.
1.2 Standardised average premium rates by industry
Premium rates data are still shown using ANZIC 1993 as some jurisdictions are unable to supply premium
data based on ANZSIC 2006. Indicator 14 shows average premium rates by industry in Australia for the
period from 2013–14 to 2017–18. These data show that the Agriculture, forestry and fishing industry
recorded the highest average premium rate at 3.33 per cent of payroll in 2017–18. The lowest premium
rate was recorded by the Finance and insurance industry at 0.24 per cent of payroll.
Premium rates of 15 out of the 17 industries have decreased since 2013–14. The largest percentage
decrease was recorded by the Property and business services industry (down 19 per cent), followed by
Government administration and defence and Accommodation, cafes and restaurants (down 17 per cent
each).

10
Indicator 14 – Australian average premium rates by industry

11
1.2.1 Standardised average premium rates by industry and jurisdiction
This section contains supplementary information to Indicator 14 – Australian average premium rates by
industry. Presented below is a comparison of standardised average premium rates across the Australian
jurisdictions for each of the 17 different industry groups. Not all jurisdictions are included under each
industry, as some industries will not be relevant for particular jurisdictions, particularly Comcare.
Agriculture, forestry and fishing
Indicator 14a shows that in 2017–18 the standardised Australian average premium rate for Agriculture,
forestry and fishing was 3.33 per cent of payroll and was average premium rate recorded across all
industries. Three out of eight Australian jurisdictions showed a decrease in premium rates in this industry
in 2017−18 compared to the previous financial year, with the largest decrease observed in the Queensland
scheme (down 6 per cent each), followed by South Australia (down 4 per cent). Queensland recorded the
lowest premium rate for the industry in 2017-18 (2.65 per cent of payroll), followed closely by Victoria
(2.66 per cent). The largest increase in premium rate for this industry in 2017−18 compared to the previous
year was recorded by Tasmania (up 16 per cent), followed by Western Australia (up 10 per cent).
The New Zealand premium rate for this industry (1.55 per cent of payroll) was less than half the rate recorded for Australia (3.33 per cent of payroll) in 2017–18.
Indicator 14a – Standardised premium rates for Agriculture, forestry and fishing by jurisdiction
Mining
Standardised average premium rates across jurisdictions for the Mining industry are shown in Indicator 14b.
Six out of eight Australian jurisdictions showed an increase in premium rates in this industry in 2017−18
compared to the previous financial year. The largest increase in was observed in the Australian Capital
Territory (up 163 per cent), followed by Tasmania (up by 64 per cent) and the Northern Territory (up by
22 per cent). The substantial increase in the Australian Capital Territory premium rate for Mining in 2017−18
has been driven up by the burner policy issued by QBE with adjustable terms, pushing the premium rate
up. South Australia and Queensland were the only jurisdictions to record a decrease in their premium rates
(down 8 per cent and 5 per cent respectively) in 2017–18 compared to the previous year. Western Australia
had the lowest premium rate (0.74 per cent of payroll) for this industry in 2017–18.
The New Zealand premium rate for mining was 0.65 per cent of payroll in 2017–18, which is substantially
lower than the Australian average mining premium rate (1.36 per cent of payroll).

12
Indicator 14b – Standardised premium rates for Mining by jurisdiction
Manufacturing
As shown in Indicator 14c, five out of the nine Australian jurisdictions showed an increase in their premium
rate for the Manufacturing industry in 2017–18 compared to the previous year. Comcare had the largest
increase in its premium rate (up 56 per cent) in 2017–18 compared to 2016–17, followed by Tasmania
(up by 10 per cent). The largest decrease in premium rate was recorded by Queensland (down by
8 per cent), followed by South Australia (down by 4 per cent). Comcare recorded the lowest premium rate
(0.14 per cent of payroll) of all Australian jurisdictions.
The New Zealand standardised average premium rate in the Manufacturing industry was 0.62 per cent of
payroll in 2017–18, a 14 per cent decrease from the previous year.
Indicator 14c – Standardised premium rates for Manufacturing by jurisdiction
13
Electricity, gas and water supply
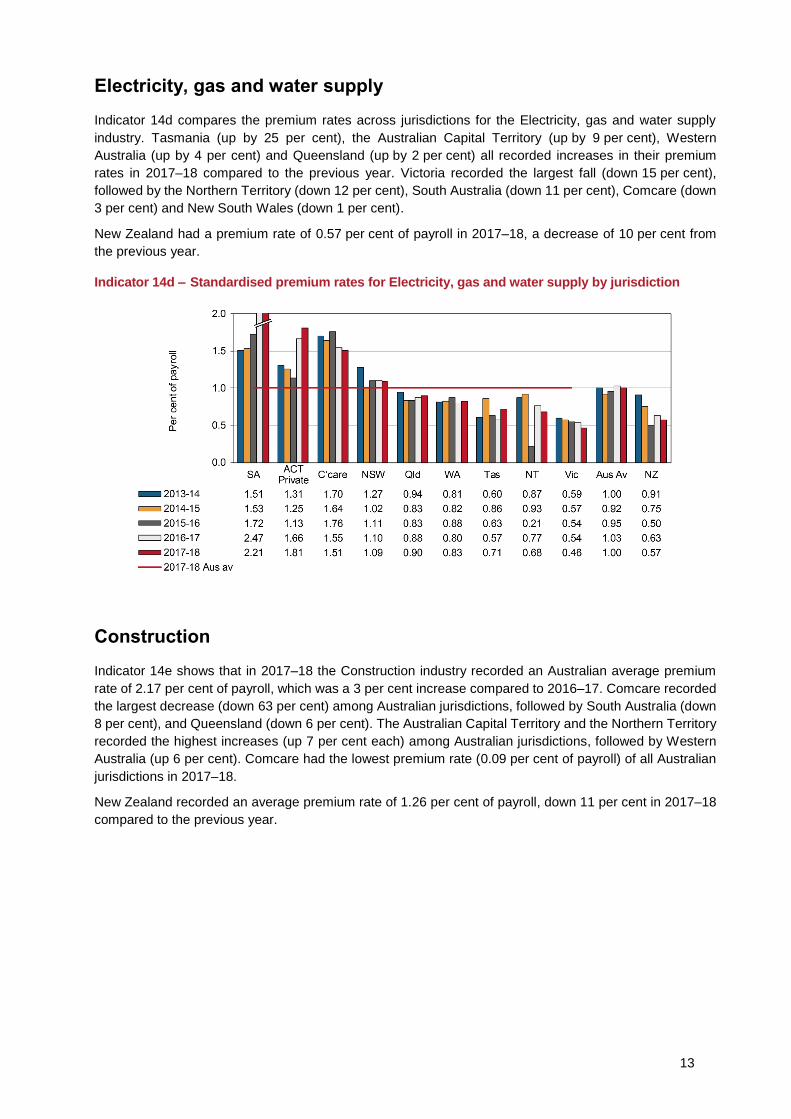
Indicator 14d compares the premium rates across jurisdictions for the Electricity, gas and water supply
industry. Tasmania (up by 25 per cent), the Australian Capital Territory (up by 9 per cent), Western
Australia (up by 4 per cent) and Queensland (up by 2 per cent) all recorded increases in their premium
rates in 2017–18 compared to the previous year. Victoria recorded the largest fall (down 15 per cent),
followed by the Northern Territory (down 12 per cent), South Australia (down 11 per cent), Comcare (down
3 per cent) and New South Wales (down 1 per cent).
New Zealand had a premium rate of 0.57 per cent of payroll in 2017–18, a decrease of 10 per cent from
the previous year.
Indicator 14d – Standardised premium rates for Electricity, gas and water supply by jurisdiction
Construction
Indicator 14e shows that in 2017–18 the Construction industry recorded an Australian average premium
rate of 2.17 per cent of payroll, which was a 3 per cent increase compared to 2016–17. Comcare recorded
the largest decrease (down 63 per cent) among Australian jurisdictions, followed by South Australia (down
8 per cent), and Queensland (down 6 per cent). The Australian Capital Territory and the Northern Territory
recorded the highest increases (up 7 per cent each) among Australian jurisdictions, followed by Western
Australia (up 6 per cent). Comcare had the lowest premium rate (0.09 per cent of payroll) of all Australian
jurisdictions in 2017–18.
New Zealand recorded an average premium rate of 1.26 per cent of payroll, down 11 per cent in 2017–18
compared to the previous year.

14
Indicator 14e – Standardised premium rates for Construction by jurisdiction
Wholesale trade
Indicator 14f shows a slight increase in the Australian average premium rate in the Wholesale trade industry
in 2017–18 compared to the previous year. South Australia, Tasmania and the Northern Territory all
recorded a 3 per cent decrease in the premium rate for this industry. Queensland, Western Australia and
the Australian Capital Territory, all recorded a 5 per cent increase in their premium rates. Queensland had
the lowest premium rate of all Australian jurisdictions (1.00 per cent of payroll) in 2017–18.
New Zealand recorded an 11 per cent decrease in the premium rate for this industry in 2017–18, down to
0.40 per cent of payroll.
Indicator 14f – Standardised premium rates for Wholesale trade by jurisdiction

15
Retail trade
Indicator 14g shows that the Australian average premium rate for the Retail trade industry was 1.48 per
cent of payroll in 2017–18, a 1 per cent drop from the previous year. South Australia and the Australian
Capital Territory recorded the largest decrease in premium rate (down 4 per cent each) compared to the
previous year, followed by Queensland (down 2 per cent). Tasmania recorded a standardized premium rate
of 0.93 per cent of payroll in 2017–18, the lowest among all Australian jurisdictions.
In 2017–18, New Zealand had a premium rate of 0.49 per cent of payroll for the Retail trade industry, a
decrease of 9 per cent compared to 2016–17.
Indicator 14g – Standardised premium rates for Retail trade by jurisdiction
Accommodation, cafes and restaurants
Indicator 14h shows that the Australian average premium rate for Accommodation, cafes and restaurants
was 1.64 per cent of payroll in 2017–18, a 1 per cent reduction compared to the previous year.
All jurisdictions, except the Northern Territory (up 9 per cent) and New South Wales (up 3 per cent),
recorded a fall in their premium rates in 2017–18 compared to 2016–17. Comcare recorded the largest
reduction (down 53 per cent), followed by South Australia (down 8 per cent).
The New Zealand average premium rate was 0.55 per cent of payroll in 2017–18, down by 8 per cent
compared to the previous year.
Indicator 14h – Standardised premium rates for Accommodation, cafes and restaurants by
jurisdiction

16
Transport and storage
The standardised average premium rates for the Transport and storage industry are shown in Indicator 14i.
The Australian Capital Territory had the highest premium rate (3.67 per cent of payroll) of all Australian
jurisdictions, while Comcare recorded the lowest (1.49 per cent of payroll) in 2017–18. Tasmania showed
the largest decrease (down 15 per cent) in its premium rate in 2017–18 compared to the previous year,
followed by the Australian Capital Territory (down 8 per cent) and South Australia (down 3 per cent). The
Northern Territory recorded the highest increase in its premium rate (up 13 per cent) over the year, followed
by Comcare (up by 6 per cent).
The New Zealand premium rate for Transport and storage (0.91 per cent of payroll) was less than half that
of the Australian average for the industry (2.15 per cent of payroll) in 2017–18.
Indicator 14i – Standardised premium rates for Transport and storage by jurisdiction
Communication services
Indicator 14j shows that the Australian average premium rate for the Communication services industry was
0.70 per cent of payroll in 2017–18, a 4 per cent increase from the previous year. Victoria recorded the
largest decrease (down 25 per cent) in the premium rate in 2017–18, followed by South Australia (down
3 per cent). Tasmania recorded the largest increase compared to the previous year (up by 33 per cent),
followed by the Northern Territory (up by 14 per cent) and the Australian Capital Territory (up by 10 per
cent).
New Zealand’s premium rate was 0.46 per cent of payroll in 2017–18, decreasing by 4 per cent since
2016– 17.

17
Indicator 14j – Standardised premium rates for Communication services by jurisdiction
Finance and insurance
Indicator 14k shows that in 2017–18, the Finance and insurance industry had an average premium rate of
0.24 per cent of payroll, a 4 per cent increase from the previous year. Two jurisdictions recorded decreases
in their premium rates compared to the previous year. Tasmania recorded a 7 per cent decrease in their
premium rate of this industry compared to the previous year, while Victoria recorded the second largest
decrease (down 4 per cent). Comcare recorded a 71 per cent increase in the premium rates in 2017– 18,
followed the Northern Territory (up by 18 per cent).
New Zealand reported a premium rate of 0.14 per cent of payroll for this industry, which is about half that
of the Australian average (0.24 per cent of payroll).
Indicator 14k – Standardised premium rates for Finance and insurance by jurisdiction
18
Property and business services
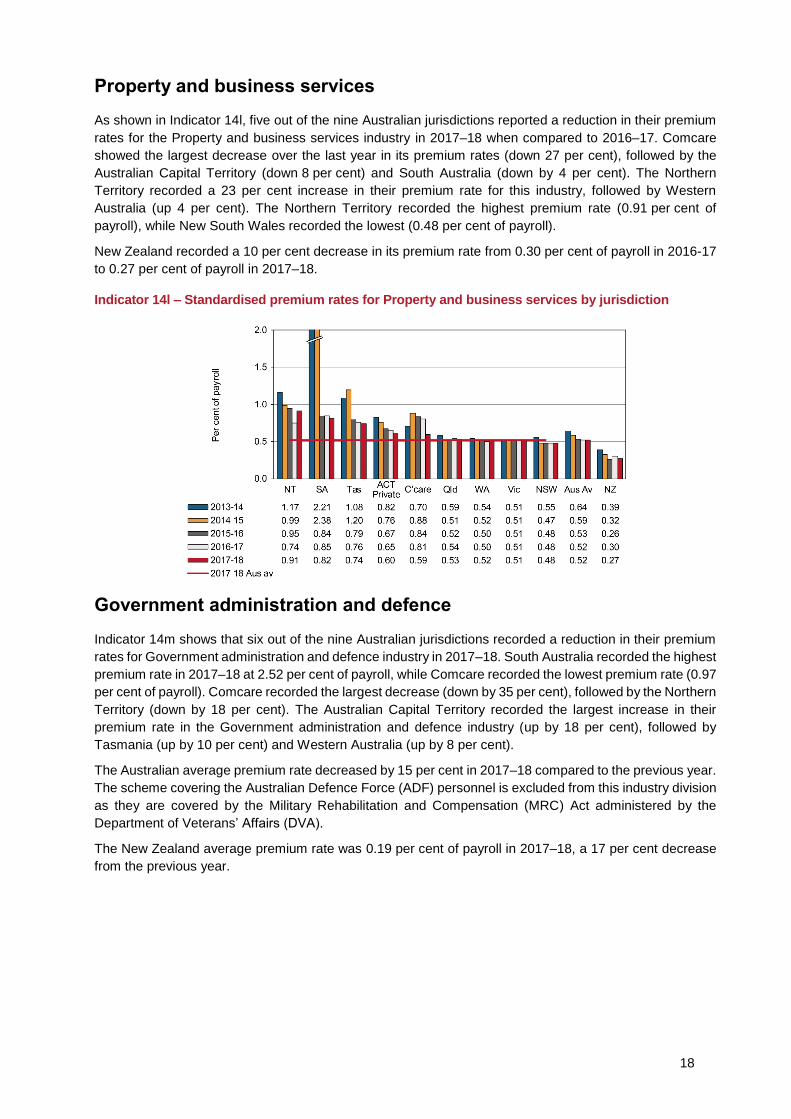
As shown in Indicator 14l, five out of the nine Australian jurisdictions reported a reduction in their premium
rates for the Property and business services industry in 2017–18 when compared to 2016–17. Comcare
showed the largest decrease over the last year in its premium rates (down 27 per cent), followed by the
Australian Capital Territory (down 8 per cent) and South Australia (down by 4 per cent). The Northern
Territory recorded a 23 per cent increase in their premium rate for this industry, followed by Western
Australia (up 4 per cent). The Northern Territory recorded the highest premium rate (0.91 per cent of
payroll), while New South Wales recorded the lowest (0.48 per cent of payroll).
New Zealand recorded a 10 per cent decrease in its premium rate from 0.30 per cent of payroll in 2016-17
to 0.27 per cent of payroll in 2017–18.
Indicator 14l – Standardised premium rates for Property and business services by jurisdiction
Government administration and defence
Indicator 14m shows that six out of the nine Australian jurisdictions recorded a reduction in their premium
rates for Government administration and defence industry in 2017–18. South Australia recorded the highest
premium rate in 2017–18 at 2.52 per cent of payroll, while Comcare recorded the lowest premium rate (0.97
per cent of payroll). Comcare recorded the largest decrease (down by 35 per cent), followed by the Northern
Territory (down by 18 per cent). The Australian Capital Territory recorded the largest increase in their
premium rate in the Government administration and defence industry (up by 18 per cent), followed by
Tasmania (up by 10 per cent) and Western Australia (up by 8 per cent).
The Australian average premium rate decreased by 15 per cent in 2017–18 compared to the previous year.
The scheme covering the Australian Defence Force (ADF) personnel is excluded from this industry division
as they are covered by the Military Rehabilitation and Compensation (MRC) Act administered by the
Department of Veterans’ Affairs (DVA).
The New Zealand average premium rate was 0.19 per cent of payroll in 2017–18, a 17 per cent decrease
from the previous year.

19
Indicator 14m – Standardised premium rates for Government administration and defence by
jurisdiction
Education
As shown in Indicator 14n, the Australian average premium rate for the Education industry fell by 1 per cent
in 2017–18 compared to the previous year. Comcare recorded the largest decrease (down 62 per cent),
followed by the Northern Territory (down 18 per cent). The Australian Capital Territory recorded the largest
increase (up by 6 per cent), followed by Victoria (up by 1 per cent). The premium rate for Comcare was the
lowest (0.52 per cent of payroll) among Australian jurisdictions, closely followed by Queensland
(0.66 per cent of payroll) and New South Wales (0.67 per cent of payroll).
New Zealand showed a 4 per cent decrease, from 0.28 per cent of payroll in 2016–17 to 0.27 per cent of
payroll in 2017–18.
Indicator 14n – Standardised premium rates for Education by jurisdiction

20
Health and community services
Indicator 14o shows that the average Australian premium rate for the Health and community services
industry has fallen by 2 per cent since 2016–17 to 1.38 per cent of payroll in 2017–18. Four out of the nine
Australian jurisdictions recorded reductions in their average premium rates in 2017–18 compared to the
year before. The largest reduction in premium rate in was recorded by Comcare (down 20 per cent),
followed by New South Wales and Western Australia (down 5 per cent each). The Northern Territory
recorded the largest increase (up 11 per cent) in its premium rate for this industry in 2017–18.
New Zealand recorded a 3 per cent decrease in the 2017–18 premium rates compared to 2016–17.
Indicator 14o – Standardised premium rates for Health and community services by jurisdiction
Cultural and recreational services
Indicator 14p shows that in 2017–18, the Australian average premium rate for the Cultural and recreational
services industry was 1.24 per cent of payroll, unchanged from the previous year. Comcare recorded the
largest decrease in their premium rate for this industry in 2017–18 (down by 40 per cent), followed by the
Northern Territory (down by 30 per cent) and Tasmania (down by 9 per cent).
New Zealand recorded a decrease in their premium rate from 0.54 per cent of payroll in 2016–17 to
0.49 per cent of payroll in 2017–18 (a decrease of 9 per cent).
Indicator 14p – Standardised premium rates for Cultural and recreational services by jurisdiction

21
Personal and other services
Indicator 14q shows that there was a 3 per cent increase in the Australian average premium rate in the
Personal and other services industry in 2017–18 compared to the previous year. The Northern Territory
recorded the largest increase in premium rate in the current year (up 14 per cent), followed by the Australian
Capital Territory (up by 13 per cent). Tasmania recorded the largest decrease (12 per cent) in their premium
rate in 2017–18, followed by South Australia (down 3 per cent). The highest premium rate was recorded by
Comcare (3.92 per cent of payroll) and the lowest by Queensland (0.94 per cent of payroll).
New Zealand recorded a premium rate of 0.54 per cent of payroll in 2017–18, 8 per cent lower than that in
the previous year.
Indicator 14q – Standardised premium rates for Personal and other services by jurisdiction

22
2. Entitlements under workers’ compensation
Entitlements are payable under workers’ compensation in the event an employee is injured or develops a
work-related disease. Different entitlement levels across the jurisdictions can explain some of the
differences in premium rates. Premium rates are set at a level to ensure sufficient funds are available to
cover these entitlements.
The following examples have been included to provide indicative entitlements payable in each jurisdiction.
A brief summary of how entitlements are calculated is contained in Appendix 2 – Table 2: Weekly
entitlements under Australian workers’ compensation schemes for award wage earners as at
1 January 2018. These entitlements are based on legislation current at 1 January 2018. More detailed
information can be found in the Comparison of Workers’ Compensation Arrangements in Australia and New
Zealand publication on the Safe Work Australia website.
Data provided in other chapters of this report should also be considered when comparing entitlements provided under the various workers’ compensation schemes.
2.1 Temporary impairment
Impairment is assessed as temporary when the injury or illness is not likely to continue indefinitely and the
employee remains unable to work for a period of time then returns to previous duties on an ongoing basis.
This example details how jurisdictions compensate low, middle and high income1 employees during
selected periods of temporary impairment. Entitlements for an injured employee are shown in the following
table using pre-injury earnings of $950 gross per week, $1,600 gross per week and $2,200 gross per week.
These profiles have been chosen to highlight the statutory maximum entitlements payable, as well as
jurisdictional differences in entitlements to workers employed on different income levels.
Scenario The employee remains unable to work for a period of time before returning to their previous duties
on a full-time basis. The employee has a dependant spouse and two children (aged 7 and 8). The
employee injured their back and has lower back strain as a result.
Indicator 15 shows that for low income earners, Queensland and Western Australia provided full coverage
(100 per cent) of pre-injury earnings for 104 weeks of impairment. After the 13th week of compensation, the
Western Australian scheme does not compensate low income workers for overtime and bonuses and a
15 per cent reduction in weekly payments applies for higher income workers. The Tasmanian and Northern
Territory schemes provided the second highest percentage (93 per cent) of pre-injury earnings in
compensation at 104 weeks of incapacity for low income earners, followed by South Australia (90 per cent)
and Comcare (86 per cent). The Australian Capital Territory provided the lowest percentage of pre-injury
earnings for 104 weeks of impairment (80 per cent) due in part to the step-down2 in benefits to 65 per cent
of pre-injury earnings after 26 weeks of compensation (see Appendix 2 – Table 2 for more details).
For middle income earners with 104 weeks of impairment, Tasmania provided the highest percentage of
pre-injury earnings (93 per cent), followed by South Australia (90 per cent), Western Australia (87 per cent)
and Comcare (86 per cent). The Australian Capital Territory provided the lowest percentage of pre-injury
earnings for the full period of impairment (74 per cent).
In contrast to the low income scenario, where seven of the nine Australian jurisdictions provided full income
protection for the first 26 weeks, only five jurisdictions provided full income protection for middle and high
income earners for this period of incapacity.
1 Low ($950 pw), medium ($1,600 pw) and high ($2,200 pw) incomes are indicative amounts selected to show differences in entitlements for injured employees between jurisdictions based on income during selected periods of temporary impairment. 2 Step-down denotes the proportionate reduction in the entitlements paid to an injured worker to the increase in time lost (in weeks) from work.

23
New Zealand provided the same percentage (80 per cent) of pre-injury earnings regardless of income
level or weeks of incapacity.
Indicator 15 – Average percentage of pre-injury earnings for selected periods of incapacity, as at
1 January 2018
Level of pre-injury income
NSW Vic Qld WA SA Tas NT ACT Comcare NZ
13 weeks of incapacity
Low income 95 95 100 100 100 100 100 100 100 80
Middle income 95 95 85 100 100 100 100 100 100 80
High income (a)95 95 85 100 100 100 100 100 100 80
26 weeks of incapacity
Low income 88 88 100 100 100 100 100 100 100 80
Middle income 88 88 85 93 100 100 100 100 100 80
High income (a)88 88 85 93 100 100 100 100 100 80
52 weeks of incapacity
Low income 84 84 100 100 100 95 95 87 97 80
Middle income 84 84 80 89 100 95 88 83 97 80
High income (a)84 84 80 89 100 95 88 83 97 80
104 weeks of incapacity
Low income 82 82 100 100 90 93 93 80 86 80
Middle income 82 82 78 87 90 93 82 74 86 80
High income (a)82 82 (b)78 (c)87 90 93 81 (d)74 86 80
(a) In New South Wales maximum weekly payments are capped at $2,101.70 as at 1 January 2018. The level of pre-injury income for a high income earner will vary depending on the proportion of their pre-injury average weekly earnings to the maximum weekly payment.
(b) In Queensland workers are paid a proportion of their normal weekly earnings (NWE) or a percentage of the original series amount of Queensland full time adult persons ordinary time earnings (QOTE) (i.e. 0 to 26 weeks – 85 per cent NWE or Award; 26 to 104 weeks – 75 per cent NWE or 70 per cent QOTE). The percentages are calculated on the higher amounts of the two possible payments.
(c) In Western Australia there is a cap on weekly earnings set at twice the annual Average Weekly Earnings (WA) as published by the ABS each year. The weekly cap as at 1 January 2018 was $2,647.30 and applied to all income levels. The prescribed amount for weekly payments is $224,921.
(d) In the Australian Capital Territory a statutory floor applies after 26 weeks of total incapacity in this example. Statutory floor
means the national minimum wage set by Fair Work Australia under the Fair Work Act 2009 (Cwlth). National minimum wage
as at 1 January 2018 is $672.70 ($17.70 per hour).

24
2.2 Permanent impairment
Impairment is assessed as permanent when it has reached maximal medical improvement. Maximal
medical improvement generally refers to where the impairment has become stable and is unlikely to
change, with or without medical treatment. Over time, there may be some change; however, further
recovery or deterioration is not anticipated.
This scenario shows the entitlements payable for a degree of permanent impairment caused by a workplace
injury. Each jurisdiction has a predetermined statutory maximum lump sum payment for injuries causing
permanent impairment. Maximum amounts are payable in cases of full permanent impairment. Appendix 2
– Table 3 lists entitlements under workers’ compensation schemes for each jurisdiction. The following
scenario is indicative only for these types of payments.
Scenario As a result of a workplace incident the employee was diagnosed with complete tetraplegia below
the 6th cervical neurological segment. This resulted in paralysis of his hands, impaired upper
body movement and paralysis of the trunk and lower limbs. He lost all lower body function and
was wheelchair-bound. Impairment was total and permanent and there was no real prospect of
returning to work.
The employee’s pre-injury earnings were $1,600 gross per week. The employee is 35 years of
age and has a dependant spouse and two children aged 7 and 8. The younger child entered the
workforce at 16 and the older child remained in full-time education until age 25. The employee
contributed to a superannuation fund. There was no contributory negligence on his part; however
there was negligence on the part of the employer.
Indicator 16 details the entitlements payable to the injured employee. The statutory component includes
the weekly benefits payable for the remainder of the employee’s working life. Note that weekly payments
in the New South Wales workers’ compensation scheme may be paid up to one year after retirement age
(30 years in this instance assuming retirement age is 65) and all lump sum payments for permanent
impairment. The common law component is an estimate of the additional payment available under a
common law settlement, where applicable. All figures exclude medical and like services such as attendant
care. Appendix 2 – Table 1: Key features of Australian workers’ compensation schemes as at 1 January
2018, identifies the jurisdictions that have access to common law. In the Australian Capital Territory
common law awards regularly exceed the statutory entitlement for equivalent injuries, therefore the
recovery provisions are always less than the common law payments. The Courts are able to consider
permanent impairment and loss of earnings very broadly and without restriction, and frequently make
awards on the basis of possible foregone career progression. The damage amounts can far exceed the
limited and capped statutory entitlements.
In Western Australia, New South Wales, Queensland, Tasmania and the Australian Capital Territory there
is no upper limit on damages that could be expected from a common law claim under this scenario. The
Australian Capital Territory did not provide a figure for this scenario. Western Australia provided a figure of
$5,897,723 which is based on the average of the five highest common law payments for claims finalised
between 2013–14 and 2017–18. Queensland provided a figure of $1,467,190, which is based on an
example similar to this scenario.
In Victoria the common law cap applicable at 1 January 2018 is $1,972,730 comprising of a maximum for
pain and suffering cap of $598,360 and a pecuniary loss cap at $1,374,370. Statutory benefits received are
deducted from common law damages awarded. After any common law settlement, medical and like
expenses continue to be paid.
The South Australian scheme is limited to statutory compensation. In South Australia legislative changes
that occurred in July 2015 resulted in a significant increase in the maximum lump sum amount payable to
workers who suffer a permanent serious injury or illness. This amount was $502,497 in 2017−18. The South
Australian system is weighted so that more compensation is paid to those with moderate to severe
permanent injuries, rather than those with minor permanent injuries.

25
In the Comcare scheme, the maximum lump sum payable is up to $185,780 plus up to $69,667 for non-economic loss. There is no cap on common law actions against third parties in the Comcare scheme, but a cap of $110,000 applies to proceedings for non-economic loss against scheme employers.
The entitlements provided by the New Zealand scheme in this scenario are comparable to those provided
by Australian jurisdictions. However, there is no access to common law under the New Zealand scheme.
2.3 Workplace fatality
This example examines the entitlements payable to dependants of an employee who died as a result of a
work-related injury. Entitlements to dependants are paid by way of a lump sum and/or weekly benefits,
depending on the employee’s circumstances and scheme design.
Pecuniary entitlements may be affected by common law payments in jurisdictions where there is access to
common law redress. South Australia and the Northern Territory have no access to common law, while the
Comcare scheme has limited access to common law. In Victoria there may be access to an additional lump
sum under the Wrongs Act 1958 (Wrongs Act), which is the main legislation in Victoria that applies to
common law claims for damages for personal injury in cases other than workplace injuries or transport
accidents.
Scenario The employee and family circumstances in this scenario are the same as in the previous example,
but in this case the workplace incident resulted in death on 1 January 2018. The spouse did not
re-enter the workforce or re-marry for 10 years.
Indicator 16 shows that total entitlements payable to dependants in the case of a fatality varied across
jurisdictions. New South Wales provided the highest entitlement payable to dependants in Australia
following a workplace incident resulting in a fatality at the amount of $942,060, followed by South Australia at
$918,497 and Queensland at $849,863. The lowest entitlements for a fatality were provided in the Australian
Capital Territory ($200,407) and Western Australia ($375,721). Appendix 2 – Table 3 provides more details
on how these entitlements are calculated.
In Victoria, legislative changes that were enacted from April 2010 increased lump sum amounts payable
from $273,970 to $503,000 backdated for all claims not determined from 10 December 2009. The lump
sum amount increased to $840,680 in 2017–18.
In the Comcare scheme, benefits under the Safety, Rehabilitation and Compensation (SRC) Act were
amended with lump sum payments (includes both death and permanent impairment payments) set at
$739,409 in 2017–18.
In New Zealand, $204,884 is payable to dependants, which is lower than all but one Australian jurisdiction.
The New Zealand scheme provides little in the way of lump sum amounts but provides high weekly benefits
to the spouse and children while the children remain dependants.

26
Indicator 16 – Entitlements for permanent incapacity or fatality as at 1 January 2018
Notes:
New South Wales workers’ compensation arrangements allow workers with 15% or more WPI to sue for modified common law damages only - these are known as work injury damages. Workers are limited to recovering past and future economic loss only. There is no upper limit on compensation that can be paid for a work injury damages claim. The figure provided by New South Wales is based on the following assumptions: legislation as at 1 January 2018; the worker does not have access to other heads of damages (e.g. motor vehicle accident or civil liability claim); the worker has no residual earning capacity; assume a settlement date of 1 January 2018. When a worker successfully recovers damages, the worker is liable to repay out of those damages the amount of weekly compensation that a person has already been paid in respect of the injury.
In Queensland there is no upper limit on compensation that could be paid for a common law claim. The amount provided is based on an example. The common law additional amount excludes all statutory payments made and the estimated proportion of the lump sum payment attributed to medical and carer services (only one payment is made to the worker).
In the Australian Capital Territory, common law is uncapped so an amount is unable to be determined.
In Western Australia, a cap on common law benefits applies for injuries with more than 15 per cent to less than 25 per cent whole of person impairment (WPI). The cap amount is $472,337. However, in this example no common law cap would apply as the impairment would likely exceed the 25 per cent or more WPI threshold. The figure provided ($5,897,723 excluding medical and carer costs) is based on the average of the five highest common law payments for claims finalised between 2013–14 and 2017–18. It should be noted that weekly benefits and common law payments are not mutually exclusive. Common law payments are inclusive of weekly benefits, therefore, any statutory entitlements received would be deducted from the amount ordered at the common law claim. In Victoria the pain and suffering maximum is $598,360, less any sum received as a statutory lump sum. For pecuniary loss the maximum amount is $1,374,370 less any amount received in weekly benefits prior to settlement plus tax paid on the weekly benefits received. This total the Common Law maximum amount of $1,972,730.

27
3. Workers’ compensation scheme performance
There are significant differences in the funding arrangements for the various schemes around Australia.
The schemes that are fully centrally funded (New South Wales, Victoria, Queensland, South Australia, the
Australian Government and New Zealand) have both their work health and safety and workers’
compensation functions, and staffing and operational budgets funded by premiums. For those jurisdictions
with privately underwritten schemes, funding for non-workers’ compensation functions comes directly from
government appropriation. This difference in funding arrangements may have an impact on the data shown
in this section.
3.1 Assets to liabilities ratio
This section reports the standardised ratio of assets to net outstanding claim liabilities (funding ratio) for
each jurisdiction over the past five years. This indicator is a measure of the adequacy of the scheme to
meet future claim payments. Ratios above 100 per cent indicate that the scheme has more than sufficient
assets to meet its predicted future liabilities. Conversely, low ratios could be an indication of the need for a
scheme to increase its premium rates to ensure that assets are available for future claim payments. Funding
ratio trends should therefore be considered in conjunction with the premium rates reported elsewhere in
this report.
Self-insurers are employers who are allowed by jurisdictions to self-insure for workers’ compensation where
they manage and pay for their employees’ claims for work-related injuries and disease, rather than paying
premiums to insurers to take on these responsibilities. Self-insurers are excluded from the funding ratio
measures as the workers’ compensation assets and liabilities are not quarantined from the rest of the self-
insurer’s business. Self-insurers are regulated in each jurisdiction and are required to lodge financial
guarantees with the regulatory authority to provide security for workers’ compensation entitlements. The
level of guarantee varies between jurisdictions. A summary of the current requirements can be found in the
Comparison of Workers’ Compensation Arrangements in Australia and New Zealand on the Safe Work
Australia website.
The data shown in this indicator may differ from jurisdictions’ annual reports due to the use of standard
definitions of assets and liabilities. While a standard definition of the funding ratio of net outstanding claim
liabilities has been adopted to improve comparability across jurisdictions, fundamental differences remain
between centrally funded and privately underwritten schemes.
Insurers in privately underwritten schemes are governed by the Australian Prudential Regulatory Authority’s
prudential regulatory requirements to make sure that enough funds are available to cover all liabilities.
Including the measure for privately underwritten schemes alongside centrally funded schemes can be
misleading because the funding ratio measure for privately underwritten schemes does not capture the true
extent of the private schemes’ abilities to meet future claim payments. Therefore, the funding ratios of
privately underwritten schemes are shown on a separate graph to those for the centrally funded schemes.
Indicator 17 shows that the average funding ratio for centrally funded schemes was 139 per cent in
2017–18, a 2 per cent increase from the previous year. Except for South Australia and New South Wales,
all centrally funded schemes recorded an increase in funding ratios compared to the previous year. All
centrally funded schemes have funding ratios above 100 per cent, indicating that assets are sufficient to
meet future liabilities in these jurisdictions. The Australian Government funding ratio for 2017–18 increased
by 14 per cent compared to the previous year. Queensland recorded a 6 per cent increase, while New
South Wales recorded a funding ratio in 2017–18 unchanged from the previous year (133 per cent).
In New Zealand, the funding ratio in 2017–18 (153 per cent) decreased by 9 per cent when compared to
the previous years.

28
Indicator 17 – Standardised ratio of assets to net outstanding claim liabilities for centrally funded
(CF) schemes
Indicator 18 shows that in 2017–18 the average funding ratio for privately underwritten schemes was
108 per cent, 7 per cent decrease from the previous year. The Northern Territory recorded the only increase
in funding ratio (up 3 per cent increase), while Tasmania recorded the largest decrease (down 17 per cent).
Seacare and the Australian Capital Territory schemes are privately underwritten, but no data are currently
available for this Indicator.
Indicator 18 – Standardised ratio of assets to net outstanding claim liabilities for privately
underwritten (PU) schemes
29
3.2 Scheme expenditure
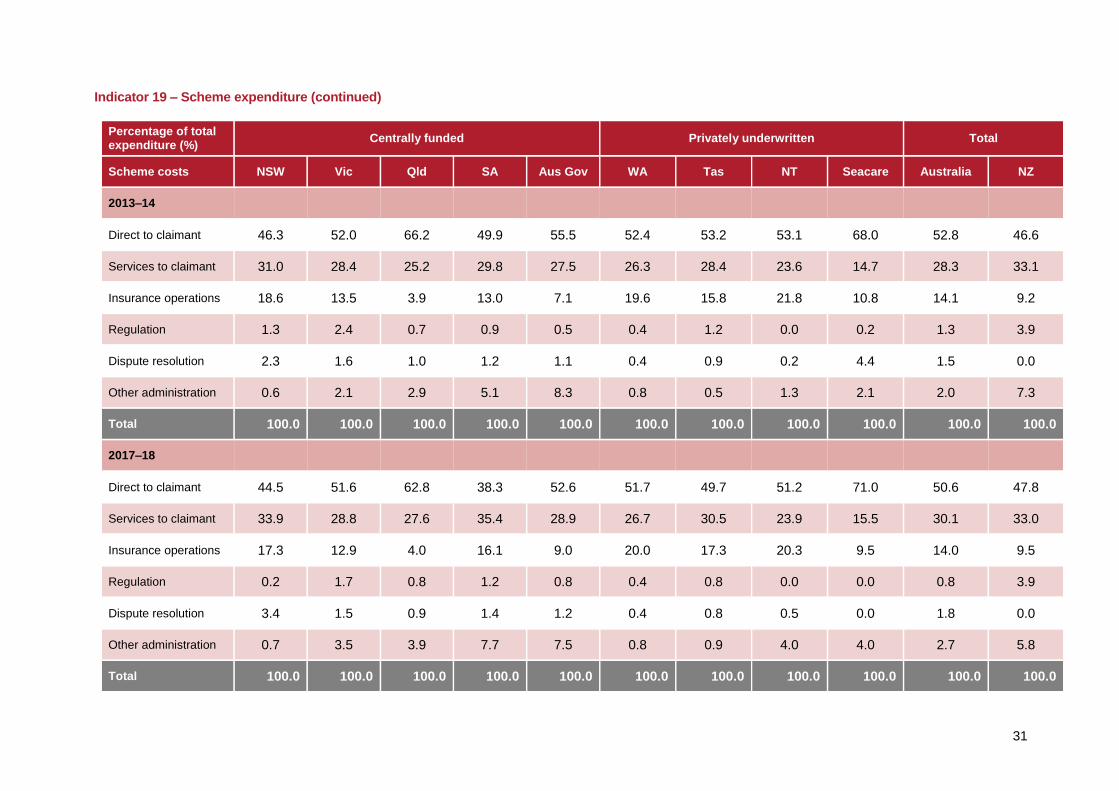
Indicator 19 shows the amount and proportion of total scheme expenditure paid out to injured workers, plus
administrative costs, for the periods 2013–14 and 2017–18. Since centrally funded and privately
underwritten schemes have different financial structures, for this indicator the jurisdictions are shown in
their respective funding arrangement group. While the standardisation methodology provides a comparable
measure across the two groups, caution should still be exercised when making such comparisons.
Total scheme expenditure across Australia slightly increased (up 2 per cent) over the period from 2013–14
to 2017–18. Four out of the nine jurisdictions recorded increases in their total scheme expenditure between
2013–14 and 2017–18. The largest percentage increase was recorded by the Northern Territory (up 35 per
cent), followed by Victoria (up 15 per cent), then New South Wales (up 4 per cent) and Western Australia
(up 2 per cent). South Australia recorded the largest decrease in their total scheme expenditure (down 27
per cent), followed by the Australian Government and Seacare (down 19 per cent each) and Tasmania
(down 11 per cent) between 2013–14 and 2017–18.
Payments direct to workers decreased by 2 per cent over the five years and accounted for 50.6 per cent of
total expenditure in 2017–18. Direct compensation is paid to injured employees either as weekly benefits,
redemptions, common law settlements (excluding legal costs), and non-economic loss benefits. Three
jurisdictions recorded increases in expenditure on payments direct to workers ranging from 30 per cent in
the Northern Territory to 1 per cent in Western Australia. The rest of the jurisdictions recorded variable
decreases in payments direct to workers between 2013−14 and 2017−18, ranging between 44 per cent in
South Australia to 1 per cent drop in New South Wales.
While most jurisdictions recorded decreases in dispute resolution expenses, this payment category
recorded the second largest percentage increase in expenditure of all the cost items (up 25 per cent);
mainly due to the substantial increase recorded by New South Wales (up 55 per cent) and the Northern
Territory (up 204 per cent). Seacare did not record any dispute resolution expenses as these were included
in their services to claimant costs.
Expenditures spent on ‘Other administration’ recorded the highest percentage increase among all cost
items (up 34 per cent); mainly due to the substantial increases recorded by the Victoria (up 92 per cent),
and Queensland (up 31 per cent) and Northern Territory (up 330 per cent). Other administration costs are
generally expenditures for corporate administration purposes.
Expenses paid to workers as services to claimants recorded the third largest percentage increase in
expenditure of all cost items (up 9 per cent) between 2013–14 and 2017–18. It accounted for 30 per cent
of total expenses in 2017–18. Five out of nine jurisdictions recorded increases in the total expenses for
services to claimants with the highest increase in the Northern Territory (up 37 per cent), followed by
Victoria (up 17 per cent) and New South Wales (up 13 per cent). The Australia Government recorded the
largest decrease (down 15 per cent) in expenditure as services to claimants over the five year period,
followed by Seacare (down 14 per cent) and South Australia (down by 13 per cent). Costs associated with
services to claimants include expenditures for medical and legal services plus expenditures for other
services like funeral, interpreting and transport services.
Costs associated with expenses for insurance operations recorded decreases in five jurisdictions, ranging
between 29 per cent for Seacare and 3 per cent for New South Wales, Queensland and Tasmania. The
Northern Territory recorded a 26 per cent increase in total expenses for insurance operations, followed by
Victoria (up 9 per cent) and Western Australia (up 4 per cent).
New Zealand proportions have a different pattern to the Australian schemes with a lower proportion of
expenditure going direct to the claimant and a higher proportion going to services to the claimant. This is
due to the nature of the New Zealand scheme, where a greater proportion of workers’ medical costs are
identified as work-related.

30
Indicator 19 – Scheme expenditure
Expenditure ($M) Centrally funded Privately underwritten Total
Scheme costs NSW Vic Qld SA Aus Gov WA Tas NT Seacare Australia NZ
2013–14
Direct to claimant 1 123.2 1 099.6 902.3 295.2 191.5 601.9 83.3 61.5 13.0 4 371.4 243.3
Services to claimant 751.0 601.4 344.0 176.5 95.1 302.4 44.5 27.3 2.8 2 344.8 172.7
Insurance operations 451.1 285.8 53.8 77.1 24.6 225.1 24.7 25.2 2.1 1 169.8 47.9
Regulation 31.13 50.7 10.2 5.6 1.6 4.4 1.8 0.0 0.0 105.4 20.3
Dispute resolution 55.0 33.9 13.8 6.8 3.9 4.7 1.4 0.3 0.8 120.5 0.0
Other administration 14.1 44.5 39.6 30.2 28.6 9.5 0.8 1.5 0.4 169.2 38.3
Total 2 425.5 2 115.9 1 363.7 591.4 345.3 1 147.8 156.5 115.7 19.2 8 281.1 522.50
2017–18
Direct to claimant 1 117.3 1 252.0 831.1 165.7 147.1 605.3 69.0 80.2 11.1 4 278.8 332.2
Services to claimant 851.8 700.7 364.8 153.2 81.0 312.4 42.3 37.5 2.4 2 545.9 229.1
Insurance operations 435.5 312.8 52.4 69.7 25.2 233.9 24.0 31.8 1.5 1 187.0 65.7
Regulation 4.63 40.7 10.4 5.0 2.2 4.6 1.0 0.0 0.0 68.5 27.3
Dispute resolution 85.1 37.0 12.0 6.1 3.4 4.8 1.1 0.8 0.0 150.3 0.0
Other administration 17.2 85.4 51.7 33.2 21.0 9.3 1.3 6.3 0.6 226.1 40.0
Total 2 511.5 2 428.6 1 322.4 433.0 279.8 1 170.3 138.8 156.6 15.6 8 456.6 694.3
Note: Figures are rounded to the nearest one decimal place and therefore the rows and columns made not add to the respective totals.
3 The split of WorkCover NSW into three separate entities from September 2015 impacted the regulation costs reported for NSW; as a result, regulation costs for 2013-14 and 2017-18 are not directly comparable.
31
Indicator 19 – Scheme expenditure (continued)
Percentage of total expenditure (%)
Centrally funded Privately underwritten Total
Scheme costs NSW Vic Qld SA Aus Gov WA Tas NT Seacare Australia NZ
2013–14
Direct to claimant 46.3 52.0 66.2 49.9 55.5 52.4 53.2 53.1 68.0 52.8 46.6
Services to claimant 31.0 28.4 25.2 29.8 27.5 26.3 28.4 23.6 14.7 28.3 33.1
Insurance operations 18.6 13.5 3.9 13.0 7.1 19.6 15.8 21.8 10.8 14.1 9.2
Regulation 1.3 2.4 0.7 0.9 0.5 0.4 1.2 0.0 0.2 1.3 3.9
Dispute resolution 2.3 1.6 1.0 1.2 1.1 0.4 0.9 0.2 4.4 1.5 0.0
Other administration 0.6 2.1 2.9 5.1 8.3 0.8 0.5 1.3 2.1 2.0 7.3
Total 100.0 100.0 100.0 100.0 100.0 100.0 100.0 100.0 100.0 100.0 100.0
2017–18
Direct to claimant 44.5 51.6 62.8 38.3 52.6 51.7 49.7 51.2 71.0 50.6 47.8
Services to claimant 33.9 28.8 27.6 35.4 28.9 26.7 30.5 23.9 15.5 30.1 33.0
Insurance operations 17.3 12.9 4.0 16.1 9.0 20.0 17.3 20.3 9.5 14.0 9.5
Regulation 0.2 1.7 0.8 1.2 0.8 0.4 0.8 0.0 0.0 0.8 3.9
Dispute resolution 3.4 1.5 0.9 1.4 1.2 0.4 0.8 0.5 0.0 1.8 0.0
Other administration 0.7 3.5 3.9 7.7 7.5 0.8 0.9 4.0 4.0 2.7 5.8
Total 100.0 100.0 100.0 100.0 100.0 100.0 100.0 100.0 100.0 100.0 100.0

32 32
Administrative costs are affected by the type of scheme in operation. Indicator 20 shows the distribution of
direct payments into weekly benefits and lump sums. The payment of long-term weekly benefits results in
higher administration costs. This indicator shows that in 2017–18, all but two Australian schemes paid out
more as weekly benefits than lump sum benefits. Queensland and Tasmania are the only jurisdictions which
paid out more in lump sum payments than in weekly benefits. The New Zealand scheme has little provision
for lump sum payments.
Indicator 20 – Direct compensation payments by type and jurisdiction, 2017–18
3.3 Current return to work
This section reports on the current return to work rates compiled from data published in the Return to Work
Survey Report commissioned by Safe Work Australia.
The Return to Work Survey replaced the Return to Work Monitor that was produced by the Heads of
Workers’ Compensation Authorities (HWCA). The current National Return to Work Survey draws sample
from the population of injured workers who:
had at least one day away from work
submitted a claim in the two years prior to the interview period
had or did not have payment-related activity within 6 months prior to the sample being drawn
worked in either premium paying (including own businesses) or self-insured organisations.
All Australian workers compensation authorities, except for South Australia, took part in the survey in 2018.
The Australian Capital Territory participated for the first time in 2018.
The current return to work rate is based on Question RTW2 ‘Are you currently working in a paid job?’ and
Question RTW1 ‘Have you returned to work at any time since your work-related injury or illness?’ of the
survey, with the rate referring to the proportion of injured workers who state ‘yes’ to both questions.
Current return to work rates reported here are for premium payers and self-insurers together, and are
estimates based on a sample of the eligible population. Differences between and within jurisdictions should
be interpreted with caution. More information on this aspect and the survey design can be found in
Appendix 1.
Indicator 21 shows the current return to work rates by jurisdiction for the four surveys conducted in 2012,
2014, 2016 and 2018. Readers should note that this data represents a new series comprising both the

33 33
balance and historic cohorts and should not be compared to results prior to 2012. In 2018, 82 per cent of
Australian and 80 per cent of New Zealand injured workers from premium paying and self-insured
organisations had returned to work and were working in a paid job at the time of the interview.
Indicator 21 – Current return to work rate for 2012, 2014, 2016 and 2018
The current return to work rate in 2018 for the Australian Capital Territory (86 per cent), Comcare
(85 per cent) and Queensland (83 per cent) was higher than the national rate. By contrast Victoria, New
South Wales (81 per cent each), Tasmania (79 per cent), Seacare (68 per cent) and the Northern Territory
(73 per cent), all recorded lower rates than the national average. The current return to work rate for Seacare
is affected by legislation which requires a person to be certified medically fit to perform the normal on-board
work tasks and duties of a seafarer.
The current return to work rate increased for all jurisdictions who participated in the four biennial return to
work surveys between 2012 and 2018. The rate fell in New Zealand during the same period.
Each jurisdiction faces varying challenges in their endeavors to improve return to work rates. Some drivers
of return to work are defined by legislation and can only be influenced by the nature of the scheme design
(whether it is short or long term in nature). For example, the benefit structure can influence return to work,
as can the associated step down provisions and legislative differences regarding early claims reporting,
employer obligations and common law arrangements.
3.4 Disputation rate
A dispute is an appeal to a formal mechanism, such as a review officer, conciliation or mediation service,
against an insurer’s decision or decisions relating to compensation. Disputes exclude common law and
also exclude redemptions and commutations unless processed as disputes through the jurisdiction’s
dispute resolution system.
Indicator 22 shows the number of new disputes as a proportion of ‘active’ claims in the reference financial
year. An active claim is described as any claim on which a payment of any type was made during the
reference financial year (including claims with medical treatment costs only) regardless of when that claim
was lodged.
The measure includes all disputes lodged for the year against any active claim that had any type of payment
in the reference financial year. However, there could be a small number of disputes lodged against claims
that are not active, such as liability disputes. The comparison of disputation rates between jurisdictions

34 34
must be treated with caution due to jurisdictional differences in scheme design, types of decisions that can
be appealed, dispute resolution models and the cost of appeals.
Indicator 22 shows that while the Australian disputation rate (5.0 per cent of active claims) in 2017–18
has decreased by 4 per cent since 2013–14, the majority of Australian jurisdictions recorded increases in
disputation rates during the five-year period. Seacare, Victoria and Queensland, however, recorded
substantial decreases (down 31 per cent, 27 per cent and 18 per cent respectively) in their disputation
rate since 2013–14.
Indicator 22 – Proportion of claims with dispute
New South Wales and Queensland reported the lowest disputation rate of all the Australian jurisdictions at
2.8 per cent of active claims in 2017–18, followed by Western Australia (4.2 per cent) and Comcare
(7.0 per cent). The disputation rate of Seacare in 2017–18 was the highest of all jurisdictions at
19.0 per cent of active claims.
The New Zealand disputation rate is very low (0.7 per cent) because of the universal nature of its accident
compensation scheme. Since people are covered whether the incident occurs at work, home, on the road,
playing sport and whether they are employed, self-employed or a non-earner (child, pensioner, student,
unemployed) there are very few disputes relating to cover.
3.5 Dispute resolution
The speed with which disputes are resolved depends on the systems and processes that are in place for
each jurisdiction. Generally, the simpler the process, the faster the dispute is resolved. Where there is a
lag in collection, exchange and lodgment of information by one or more parties, disputes are likely to be
more adversarial and therefore more costly. A high percentage of disputes resolved in a longer time frame
may also indicate that there are a high number of more complex disputes being dealt with within a
jurisdiction, or that there are some mandatory medical or legal processes in place that inherently delay
resolution.
Indicator 23 demonstrates that in the past five years in Australia there has been a slight decrease (down
2 per cent) in the proportion of disputes resolved within one month. By contrast, the percentage of disputes
resolved within three and six months increased by 24 per cent each, while the percentage of disputes
resolved within nine months increased by 17 per cent during this period.
In 2017–18, more than half the disputes (63 per cent) were resolved within three months of the date of
lodgment on average in Australia. Queensland resolved the highest proportion of disputes within three
months (92 per cent), followed by Western Australia (75 per cent), Tasmania (74 per cent) and Victoria
(62 per cent).
35 35
Comcare disputes generally took more time to resolve than disputes in other jurisdictions. As Comcare
disputes are referred to an external and independent body (Administrative Appeals Tribunal), it has minimal
control over the associated time frames for dispute resolution. Disputes tend to be quite complex and
require a long time to resolve. In line with this, Comcare recorded the second lowest proportion of disputes
resolved for each of the four time periods in 2017–18. However, these proportions have improved over the
four years to 2017–18 for one month time period (up 17 per cent).
Seacare recorded substantial decreases in the proportions of disputes resolved within one (down 72 per
cent), three (down 31 per cent), six (down 39 per cent) and nine months (down 49 per cent). The time it
takes to resolve applications in the seafarers’ jurisdiction is influenced by many factors, particularly the time
needed by parties to obtain further evidence such as expert medical evidence as well as any delays
associated with ensuring all related claims are before the Administrative Appeals Tribunal. The nature and
complexity of the decisions under review will affect the time within which any agreed resolution can be
reached or the applications can be progressed to hearing and determination. The number of applications
made to the Administrative Appeals Tribunal is relatively small. Small changes in the number of cases
finalised at particular times can result in relatively large percentage changes in the resolution rates within
the specified time frames.
In the New South Wales scheme, while only 4 per cent of disputes were resolved within one month, there
were substantial increases in the resolution rates over the five years for all the time periods. As a result of
the New South Wales legislative amendments in 2012, the Workers’ Compensation Commission (WCC)
experienced a significant increase in the number of dispute applications it received during 2012-13.This led
to a temporary decline in the timeliness of resolving disputes while the additional dispute lodgments were
resolved. This decline in the rate of resolving disputes is clearly reflected in the 2013–14 resolution rates
for all four time periods in New South Wales. The WCC has since returned to its normal efficient resolution
of disputes. Timeliness figures for the WCC include activities such as medical specialist assessments in
permanent impairment disputes and internal appeal processes for decisions by Arbitrators and
assessments by Approved Medical Specialists.
The resolution times for Victoria are affected by the compulsory conciliation process, which may or may not
involve medical panel referral, and the fact that court litigation can only occur at the conclusion of the
compulsory conciliation process. In 2017–18, Victoria recorded decreases in dispute resolution rates for
one (down 15 per cent), three (down 4 per cent) and 6 months (down 1 per cent), while no change was
recorded in the dispute resolution rate for the 9 month time period.
The proportion of disputes resolved in New Zealand in 2017–18 was lower than the Australian average for
the one and three month time periods, but higher than the Australian average for the six and nine month
time periods.

36 36
Indicator 23 – Percentage of disputes resolved within selected time periods (cumulative)
Jurisdiction** Within
1 month Within 3 months
Within 6 months
Within 9 months
2013–14
New South Wales 1.5 6.2 20.4 39.2
Victoria 12.1 64.3 83.0 91.5
Queensland 11.8 87.6 94.4 96.6
Western Australia 35.7 79.4 89.5 96.0
Tasmania 58.5 70.0 79.7 86.9
Comcare 4.8 14.5 29.8 49.6
Seacare 10.0 16.0 32.0 60.0
Australia 14.8 50.3 65.8 76.6
New Zealand 13.8 59.8 91.5 96.9
2017–18
New South Wales 4.0 55.6 87.3 95.3
Victoria 10.3 61.6 82.5 91.9
Queensland 16.5 92.0 94.6 95.6
Western Australia 37.1 74.9 83.9 92.8
Tasmania 63.1 73.8 88.1 95.8
Comcare 5.6 13.0 24.0 38.8
Seacare 2.8 11.1 19.4 30.6
Australia 14.5 62.5 81.3 89.3
New Zealand 12.9 49.1 87.2 95.0
** South Australia and the Northern Territory cannot supply data on the time required to resolve disputes.

37
Appendix 1 — Explanatory notes
Premium rates and entitlements
Issues affecting the comparability of premium rates across the schemes include:
differences in benefits and coverage for certain types of injuries, in particular the coverage of the
journey to and from work
differences in claims management arrangements
variations in the funding arrangements for delivery of work health and safety services, with some
jurisdictions providing degrees of cross-subsidisation
differences in the definitions of wages for premium setting purposes, including whether
superannuation contribution is part of wages
different scheme excess deductibles (note that wage under-declaration has not been accounted
for as it is considered to have a similar prevalence in each jurisdiction)
different levels of self-insurance
different industry mixes
differences in premium calculation methodology, and
different actuarial assumptions used in the calculation of premium rates.
Premiums in the self-insured sector
Most jurisdictions allow large employers to self-insure their workers’ compensation if they prove that they
can manage the associated financial and other risks. Jurisdictions with a large proportion of employees
under self-insurance arrangements include New South Wales, South Australia, Tasmania and Comcare.
Significantly fewer self-insurers operate in Victoria, Queensland, Western Australia and the Australian
Capital Territory Private Scheme. A number of methodologies are employed in this report to obtain an
estimate of the amount of premium that self-insurers would pay.
Employer excess factors
Some schemes have non-compensable excesses where the employer pays the first five or 10 days
compensation and/or meets medical expenses to a maximum amount. To improve comparability of
premium rates a common deductible for the first five days of compensation with no medical costs has been
applied. The factors applied to the insured sector data in each jurisdiction are shown in Appendix 1 –
Table 1. Adjustment factors have also been applied to the self-insured sector to make the data consistent
with the common deductible of the first five days compensation with no medical costs.
Journey factors
All jurisdictions except Victoria, Western Australia, Tasmania, Comcare and New Zealand provide some
level of coverage for journey claims. Hence, an estimated amount equal to the cost of providing this
coverage has been removed from the premium rates of the jurisdictions that provide this type of coverage.
The factors applied are shown in Appendix 1 – Table 1. In New Zealand, journey claims are covered by a
different scheme.

38
Appendix 1 – Table 1: Premium rate adjustment factors (per cent)
Jurisdiction
Employer excess factors
Journey Insured sector Self-insured
Time lost excess Medical
expenses Time lost excess
New South Wales n/a n/a -1.5 n/a
Victoria 2.0 1.0 -3.0 n/a
Queensland n/a n/a n/a -6.5
Western Australia -1.9 n/a n/a n/a
South Australia 0.1 n/a -3.0 n/a
Tasmania n/a 0.3 -2.5 n/a
Northern Territory -2.5 n/a n/a -3.0
Australian Capital Territory Private -1.8 n/a n/a -7.5
Comcare -1.8 n/a -4.5 n/a
Seacare Excess adjustment factors reviewed annually -6.0
New Zealand n/a n/a n/a -7.5
Seacare scheme
Seacare scheme policies often include large excesses, ranging from $5,000 to $100,000, representing
approximately three weeks to more than 12 months compensation, with the majority of policies containing
excesses in the $5,000 to $25,000 range. An adjustment factor has been developed to take into account
the large and variable deductible.
Effect of adjustment factors on premium rates
Appendix 1 – Table 2 presents average premium rates with various adjustments to assist comparability.
Each column in this table represents progressively adjusted premium rates as follows:
Column 1 – These data are average premium rates for insured employers only, calculated using
the definition of remuneration as used by that jurisdiction, i.e. superannuation included where
applicable. GST was excluded in all cases. Rates are applicable to the employer and medical
excesses that apply in each jurisdiction and should not be compared.
Column 2 – These rates are average premium rates for the insured sector adjusted to include
superannuation in the definition of remuneration. Estimates of superannuation were applied to
Western Australia, Tasmania and the Northern Territory. All other jurisdictions were able to
provide appropriate data. Data for New Zealand were also adjusted to include superannuation.
Column 3 – These rates are the average premium rates for each jurisdiction including both the
insured and self-insured sectors before any adjustment factors are applied.
Column 4 – These rates adjust the rates in column 3 to account for the different employer
excesses that apply in each jurisdiction. The adjustment made to the data from the self-insured
sector may be different to the adjustment applied to the premium paying sector due to the
assumption that a nil employer excess applies to the self-insured sector.
Column 5 – These rates further adjust the rates in column 4 to remove a component comparable
to the cost of providing workers’ compensation coverage for journeys to and from work. These
adjustments apply to all jurisdictions except Victoria, Western Australia, Tasmania and New
Zealand where the coverage for these types of claims is outside the workers’ compensation
system.

39
Appendix 1 – Table 2: Effect of adjustment factors on premium rates in 2017–18
Jurisdiction Average premium rates for premium paying sector (%) Total(a) average
premium rate (%)
Total(a) average premium rate adjusted for
employer excess (%)
Total(a) average premium rate adjusted for
employer excess and
journey claims (%)
Unadjusted Adjusted to
include superannuation
1 2 3 4 5
NSW(b) 1.25 1.25 1.39 1.38 1.38
Vic 1.33 1.33 1.29 1.32 1.32
Qld(c) 1.17 1.17 1.24 1.24 1.15
WA 1.29 1.17 1.18 1.16 1.16
SA 1.88 1.88 1.89 1.89 1.89
Tas 1.83 2.54 1.41 1.41 1.41
NT 1.84 1.68 1.54 1.50 1.46
ACT Private 1.89 1.89 1.89 1.86 1.72
Comcare 1.05 1.05 0.87 0.84 0.84
Seacare(d) unavailable unavailable unavailable unavailable unavailable
Australia 1.29 1.29 1.32 1.33 1.31
NZ 0.75 0.68 0.59 0.59 0.59
(a) Total of adjusted premium for insured sector plus calculated premium for self-insured sector. (b) The NSW average premium rates also include the dust diseases levy which is not part of the New South Wales scheme but is payable by employers in that State. (c) Queensland includes stamp duty levied at a rate of 5 per cent of the premium including GST. (d) Note that there are no self-insurers in the Seacare scheme.
Legislative changes to the NSW workers’ compensation system
The Workers Compensation System legislative amendments in 2012 not only introduced a new benefit
structure but created a major cultural shift with the introduction of determining the ‘work capacity’ of the
injured worker to return to work in suitable employment.
Changes to benefits and how they were calculated were introduced so those who had capacity to work
were encouraged to return to work with benefits decreasing in percentages over the life of the claim (from
95 per cent of Pre-injury Average Weekly Earnings (PIAWE) initially to 80 per cent of PIAWE for a
maximum of five years. For workers with a permanent impairment (PI) greater than 20 per cent, the five
year cap on weekly payments does not apply. Medical expenses were limited to a 12-month period from
when the worker ceased to be entitled to weekly benefits or from the date the claim was made (if the worker
had not received any weekly benefits). For workers with a PI greater than 30 per cent, the entitlement to
medical cover continues for life. There were also restrictions introduced for journey claims, heart
attack/stroke claims, nervous shock and disease claims to better connect employment as a contributing
factor to the injury.
Changes were also made to permanent impairment benefits, introducing a single ‘once-and-for-all’
assessment of PI, whereas previously top up payments were made as required if subsequent PI
assessments deemed it necessary. Benefits for pain and suffering were removed from the scheme.
Further legislative amendments in 2015 extended medical expenses entitlements to:

40
for workers assessed with 0–10 per cent PI, 2 years from when the worker ceased to be entitled to
weekly benefits or from the date the claim was made (if the worker had not received any weekly
benefits)
for workers assessed with an 11–20 per cent PI, 5 years from when the worker ceased to be entitled
to weekly benefits or from the date the claim was made (if the worker had not received any weekly
benefits)
for workers with a PI greater than 20 per cent, the entitlement to medical cover continues for life.
In addition, the legislative amendments in 2015 provided that for those workers with highest needs
(being those with PI over 30 per cent), weekly benefits were improved to better support those
injured workers. The legislative amendments in 2015 also enabled injured workers to continue on
weekly payments until the disputed work capacity assessment and/or decision had been resolved.
Return to work data
In 2012, a working group consisting of representatives of Australian and New Zealand workers’
compensation authorities, unions and employer groups developed a survey instrument and sampling
methodology to measure return to work outcomes of injured workers receiving workers’ compensation. In
June 2012, Safe Work Australia’s Strategic Issues Group for Workers’ Compensation (SIG-WC) agreed to
the survey instrument and methodology and the Social Research Centre was contracted to undertake the
survey.
Data for the 2018 Return to Work (RTW) indicator are drawn from the RTW – Full Summary Report. This
measure is based on Question C1, ‘Are you currently working in a paid job?’ and Question C7, ‘Can I just
confirm, have you returned to work at any time since your workplace injury or illness?’ It reports the
proportion of injured workers who state ‘yes’ to both questions. The 2018 sample consisted of 4,602 injured
workers who had made a workers’ compensation claim (Appendix 1 – Table 3). The Australian average for
each year is calculated using the jurisdictions that participated in the survey for that year.
All Australia jurisdictions participated in the 2018 National Return to Work Survey except South Australia.
New Zealand undertook a separate, but comparable, survey in 2018 and the findings of this will be reported
separately by New Zealand.
For Australian jurisdictions, the sample was selected in two cohorts: Historic Return to Work (Historic) and
Balance. The Historic Cohort refers to injured workers of premium paying organisations who had 10 or
more days compensated, with claims ranging from 7 to 8 months of age in large jurisdictions and 7 to 9
months of age in smaller jurisdictions. Large jurisdictions were Queensland, New South Wales, Victoria,
and Western Australia. Small jurisdictions were Comcare, Seacare, Tasmania, and the Northern Territory.
The Balance Cohort refers to injured workers of premium payers or self-insured organisations from a 2 year
period (1 March 2016 to 31 January 2018) with at least one day compensated. The whole sample (Historic
and Balance cohorts) was used in the CPM 20 – part 3 report for the Current Return to work rate by
jurisdiction (Indicator 21).
The full RTW Summary Reports since 2012 are available at the Safe Work Australia website.
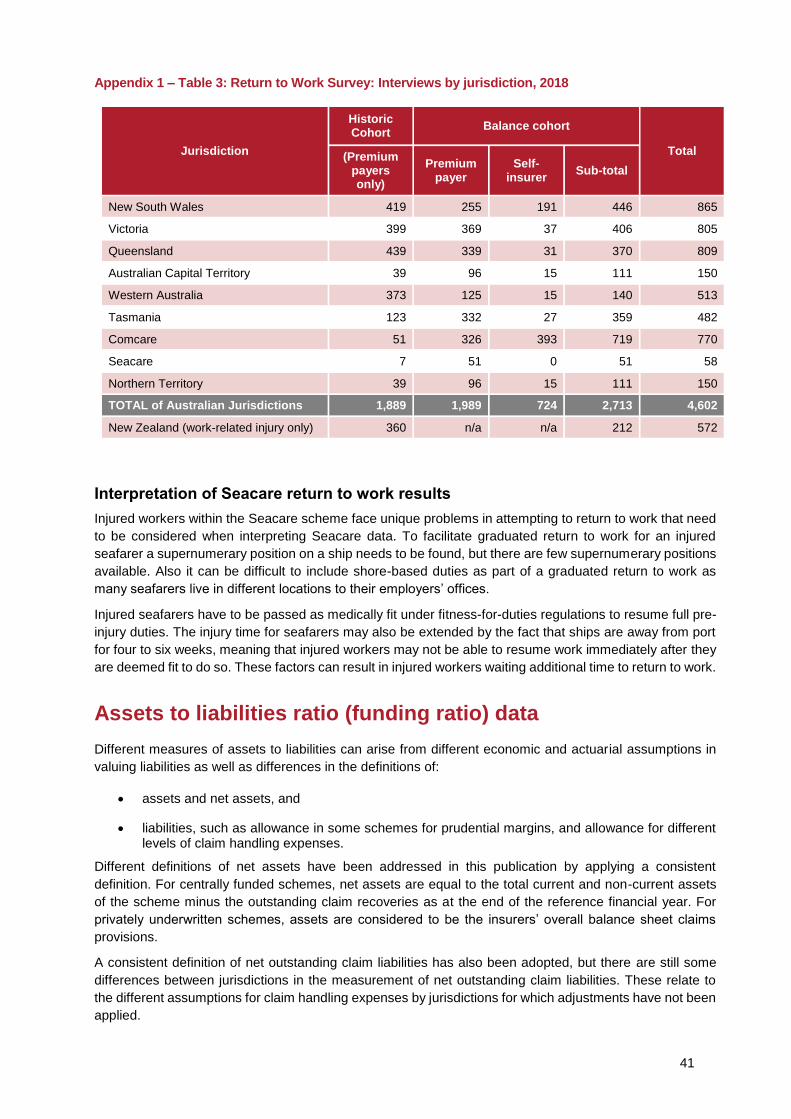
41
Appendix 1 – Table 3: Return to Work Survey: Interviews by jurisdiction, 2018
Jurisdiction
Historic Cohort
Balance cohort
Total (Premium
payers only)
Premium payer
Self-insurer
Sub-total
New South Wales 419 255 191 446 865
Victoria 399 369 37 406 805
Queensland 439 339 31 370 809
Australian Capital Territory 39 96 15 111 150
Western Australia 373 125 15 140 513
Tasmania 123 332 27 359 482
Comcare 51 326 393 719 770
Seacare 7 51 0 51 58
Northern Territory 39 96 15 111 150
TOTAL of Australian Jurisdictions 1,889 1,989 724 2,713 4,602
New Zealand (work-related injury only) 360 n/a n/a 212 572
Interpretation of Seacare return to work results
Injured workers within the Seacare scheme face unique problems in attempting to return to work that need
to be considered when interpreting Seacare data. To facilitate graduated return to work for an injured
seafarer a supernumerary position on a ship needs to be found, but there are few supernumerary positions
available. Also it can be difficult to include shore-based duties as part of a graduated return to work as
many seafarers live in different locations to their employers’ offices.
Injured seafarers have to be passed as medically fit under fitness-for-duties regulations to resume full pre-
injury duties. The injury time for seafarers may also be extended by the fact that ships are away from port
for four to six weeks, meaning that injured workers may not be able to resume work immediately after they
are deemed fit to do so. These factors can result in injured workers waiting additional time to return to work.
Assets to liabilities ratio (funding ratio) data
Different measures of assets to liabilities can arise from different economic and actuarial assumptions in
valuing liabilities as well as differences in the definitions of:
assets and net assets, and
liabilities, such as allowance in some schemes for prudential margins, and allowance for different levels of claim handling expenses.
Different definitions of net assets have been addressed in this publication by applying a consistent
definition. For centrally funded schemes, net assets are equal to the total current and non-current assets
of the scheme minus the outstanding claim recoveries as at the end of the reference financial year. For
privately underwritten schemes, assets are considered to be the insurers’ overall balance sheet claims
provisions.
A consistent definition of net outstanding claim liabilities has also been adopted, but there are still some
differences between jurisdictions in the measurement of net outstanding claim liabilities. These relate to
the different assumptions for claim handling expenses by jurisdictions for which adjustments have not been
applied.

42
Net outstanding claim liabilities for centrally funded schemes are equal to the total current and non-current
liabilities of the scheme minus outstanding claim recoveries as at the end of the reference financial year.
For privately underwritten schemes, liabilities are taken as the central estimate of outstanding claims for
the scheme (excluding the self-insured sector) as at the end of the reference financial year.
For jurisdictions with a separate fund dedicated to workers’ compensation (centrally funded schemes), the
assets set aside for future liabilities can be easily identified from their annual reports. Centrally funded
schemes operate in Victoria, Queensland, South Australia, the Australian Government and New Zealand.
For jurisdictions where workers’ compensation is underwritten by insurance companies (privately
underwritten schemes), assets are set aside to meet all insurance liabilities but the insurance companies
do not identify reserves specifically for workers’ compensation liabilities. For these schemes net assets are
considered to be the balance sheet provisions made by the insurers at the end of each financial year.
Privately underwritten schemes operate in Western Australia, Tasmania, the Northern Territory, the
Australian Capital Territory and Seacare.
The New South Wales scheme is a managed fund, combining some of the features of centrally funded
schemes and privately underwritten schemes.
Prudential margins
Many jurisdictions add prudential margins to their estimates of outstanding claims liabilities to increase the
probability of maintaining sufficient assets to meet the liabilities estimate. This is done in recognition that
there are inherent uncertainties in the actuarial assumptions underlying the value of outstanding liabilities.
The addition of a prudential margin will lower the assets to liabilities ratio for that jurisdiction. As some
jurisdictions do not have prudential margins, these margins have been removed from the estimates to
enhance comparability. For jurisdictions that use prudential margins in determining their liabilities there will
be a greater discrepancy between the ratios shown in this report and those shown in their annual reports.
The margins that have been removed are:
New South Wales — a risk margin of 12 per cent from 2013–14, 15.6 per cent from 2014–15 and 2015–16 and 15.1 per cent from 2016–17 and 2017–18
Victoria — a risk margin of 8.0 per cent for 2013–14, 2014–15, 2015–16, 2016–17 and 2017-18. The risk margin for the Insurers’ Guarantee Fund and the Uninsured Employers and Indemnity Funds is 40 per cent for the period 2013–14 to 2017–18.
Queensland — a prudential margin 9.7 per cent from 2013–14 and 2014–15, 9.8% for 2015-16 and 2016-17 and 9.6 per cent from 2017-18.
South Australia — a prudential margin of 5.5 per cent from 2013–14, 6.3 per cent from 2014–15, 6.8 from 2015–16, 12.9 per cent from 2016-17 and 13.3 per cent from 2017-18.
Northern Territory — a prudential margin of 15 per cent for all years.
Scheme expenditure data
The data items for this measure are as follows:
Direct to worker costs are compensation paid to injured employees either as weekly benefits,
redemptions, lump sums, common law settlements (excluding legal costs) and non-economic loss benefits.
Services to worker costs include medical treatment, rehabilitation, legal costs, return to work
assistance, transportation, employee advisory services and interpreter costs that are used to assist employees recover from their injury and return to work.
Insurance operations costs encompass claims management, premiums/ levy management,
fees paid to agents, medical reports, licensed-insurer expenses, registration of employers,

43
collection of premiums and other costs associated with the claims management and premium collection functions of the scheme.
Dispute resolution costs include all activities associated with the finalising of disputes other
than the direct costs associated with a claim, such as legal representation costs, which are included as claim payments. Dispute resolution costs also include costs associated with departments of justice/courts, conciliation, medical panels and workers’ compensation tribunals/courts.
Other administration costs include expenditure associated with corporate administration, but
exclude corporate administration costs allocated to work health and safety. Costs encompass executive management, board/management committee, corporate planning and reporting, finance, human resources and personnel, administration, audit costs, corporate legal costs, bank charges and IT costs (including depreciation).
Regulation costs include license and performance management, compliance activity, fraud
investigations, litigation and prosecution, return to work and compensation, advertising, IT costs, injury management and return to work research, actuarial services and administration and overseeing of self-insurers and exempt employers.

44
Appendix 2 — Key features of Australian workers’ compensation schemes
Appendix 2 — Table 1: Key features of Australian workers’ compensation schemes as at 1 January 2018
Jurisdiction NSW Vic Qld WA SA Tas NT ACT Comcare
Fund type Managed fund
Central fund Central fund Private insurers
Central fund Private insurers
Private insurers
Private insurers
Central fund
Cover for journey claims No(a) No(b) Yes No No(c) No No unless a police officer(d)
Yes No(e)
Common law available Yes(f) Yes – limited Yes Yes No Yes No Yes Yes –limited
Redemptions/settlements available
Yes(g) Yes – limited Yes Yes Yes(h) Yes Yes Yes Yes – limited
Number of employees (i) 3,611,821 2,967,417 2,279,303 1,230,161 768,214 227,064 141,380 147,400 405,230
Number of self-insurers 58(j) 40 28 25 71 plus crown 10(k) 5 7 35(l)
Standardised average premium rate (per cent)
1.38 1.32 1.15 1.16 2.06 1.41 1.46 1.72 0.84
Funding ratio (per cent) 133 135 214 131 138 117 102 n/a 116
Disputation rate (per cent) 2.8 9.3 2.8 4.2 9.6 11.4 7.2 n/a 7.0
Current return to work rate (per cent)
81 81 83 82 N/A 79 73 86 85
(a) Limited coverage continues for police officers, firefighters, paramedics, bushfire fighters, emergency services volunteers, and workers injured while working in or around coal mines. For all other workers injured on or after 19 June
2012 there must be a real and substantial connection between employments and the accident or incident out of which the personal injury arose. (b) Journey claims as a result of a transport accident are covered by the TAC in Victoria for injuries sustained to/from work. Journey injuries sustained in the course of work are compensable under the Workplace Injury Rehabilitation
and Compensation Act 2013. (c) Journey claims are only covered in SA in limited circumstances – the journey must have been undertaken while carrying out work duties. Commutes between home and work are only compensable where there is a ‘real and
substantial connection’ with employment. (d) Journey claims are not covered if the incident involves a motor vehicle. These are covered by the Motor Accidents (Compensation) Amendment Act 2007. (e) As of 13 April 2007, the SRC Act was amended to remove coverage for non-work related journeys and recess breaks; however on 7 December 2011 section 6 of the SRC Act was amended to reinstate ordinary recess claims. (f) To access common law, workers must reach a threshold of 15 per cent permanent impairment.
(g) Commutations are subject to pre-conditions as per section 87EA of the Workers Compensation Act (h) A worker is only eligible if: (i) they have returned to work but are entitled to ≤ $30 pw, (ii) they are 55 years and have no current work capacity, or (iii) the Tribunal orders a redemption due to exceptional circumstances. Redemption
can only be reached by agreement between the worker and WorkCover SA or self-insured employer. (i) Number of employees is supplied by the ABS using Labour Force Survey data as a base, with a number of adjustments applied to account for differences in coverage for some jurisdictions. (j) NSW licences 58 employers as self-insurers. NSW also licences 6 general insurers to provide insurance within specialised industries and an additional 193 government agencies deemed self-insurers covered by the Treasury
Managed Fund which is centrally administered by the NSW Self-Insurance Corporation. (k) Not including the Tasmanian State Service. (l) As at 30 June 2018.

45
Appendix 2 – Table 2: Weekly entitlements under Australian workers’ compensation schemes for award wage earners as at 1 January 2018(a)
Jurisdiction NSW Vic Qld WA SA Tas NT ACT Comcare
Entitlements expressed as a percentage of pre-injury earnings for award wage earners
0–13 weeks (total incapacity)
95 per cent(b) 95 per cent 85 per cent of NWE(c) (or 100 per cent under industrial agreement) (greater of)
100 per cent 100 per cent 100 per cent 100 per cent 100 per cent 100 per cent
14–26 weeks (total incapacity)
80 per cent 80 per cent 85 per cent of NWE(c) (or 100 per cent under industrial agreement) (greater of)
100 per cent 100 per cent 100 per cent 100 per cent 100 per cent 100 per cent
27–52 weeks (total incapacity)
80 per cent 80 per cent 75 per cent NWE or 70 per cent QOTE(c)
(greater of)
100 per cent 100 per cent 90 per cent or 95 per cent(d)
75–90 per cent 65 per cent or Stat Floor
27–45 wks 100 per cent 46–52 wks 75 per cent(e)
53–104 weeks (total incapacity)
80 per cent (excl O/T(f) and shift allowance)
80 per cent (excl O/T)
75 per cent NWE or 70 per cent QOTE(c)
100 per cent 80 per cent 53–78 weeks 90 per cent or 95 per cent(d), 79–104 weeks 80 per cent or 85 per cent(d)
75–90 per cent 65 per cent or Stat Floor
75 per cent(e)
104+ weeks (total incapacity)
80 per cent - (excl O/T; cease at five years unless >20 per cent permanent impairment
80 per cent (excl O/T, subject to work capacity test after 130 weeks)
75 per cent NWE if >15 per cent impairment, otherwise an amount equal to the single pension rate(c).
100 per cent 80 per cent (ongoing entitlement if worker is taken to be seriously injured on account of an assessment of whole person impairment arising from their work injury of 30 per cent or more)
80 per cent or 85 per cent(d)(g)
75–90 per cent but limited to 260 weeks unless more than 15 per cent PI
65 per cent or Stat Floor
75 per cent(e)
(a) Entitlement benefits in Victoria, WA, TAS, NT, ACT, and NZ do not include superannuation contributions. Compensation in the form of a superannuation contribution is payable in VIC after 52 weeks of weekly payments.
(b) Maximum weekly payment is capped at $2,101.70. (c) NWE – normal weekly earnings, QOTE – Original series amount of Queensland full-time adult persons Ordinary Time Earnings. (d) If there is medical evidence that the worker is unable to perform the worker’s usual duties with the employer; and there is medical evidence that the worker is able to return to perform suitable alternative duties with
the employer and the employer does not enable the worker to undertake suitable alternative duties as part of the worker’s employment by the employer. (e) If the incapacitated employee is retired and receives an employer funded superannuation benefit, the SRC Scheme will pay a maximum of 70 per cent of NWE per week taking into account the weekly superannuation
benefit or weekly equivalent of any lump sum amount received and the compensation amount. (f) O/T means ‘overtime’ (g) But not exceeding: (i) 9 years from the date of the initial incapacity, if the worker’s permanent impairment (if any), at a percentage of the whole person, is less than 15 per cent or is not assessed; or (ii) 12 years from
the date of the initial incapacity, if the worker’s permanent impairment, assessed at a percentage of the whole person, is 15 per cent or more but less than 20 per cent; or (iii) 20 years from the date of the initial incapacity, if the worker’s permanent impairment, assessed at a percentage of the whole person, is between 20 per cent and 30 per cent; or (iv) the period extending from the date of the initial incapacity to the day on which the entitlement of the worker ceases in accordance with Section 87 of the Workers Rehabilitation and Compensation Act 1988, if the worker’s permanent impairment, assessed at a percentage of the whole person, is 30 per cent or more.

46
Appendix 2 – Table 3: Other entitlements under Australian workers’ compensation schemes for award wage earners as at 1 January 2018
Jurisdiction NSW Vic Qld WA SA Tas NT ACT Comcare
Lump sums– maximum
>75 per cent permanent impairment: $598,560 (plus additional 5 per cent for back impairment) (a)
$598,360 is the stat maximum
Max $320370 permanent impairment + up to $320370 additional lump sum if 30% or more DPI + up to $362920 for gratuitous care if 15% or more DPI and a moderate to total level of dependency on day to day care for the fundamental activities of daily living.
$224,921 + $168,691 in special circumstances #
$502,497– lump sum for non-economic loss/ $361,476 for economic loss
$359,988 permanent impairment >70 per cent
$336,232 permanent impairment
$539,002 CPI indexed
Up to $185,780.36 permanent impairment + up to $69,667.68 non-economic loss
Limits– medical and hospital
2 years from cessation of weekly payments (or date claim made if no weekly payments made)(c)
$50,000 or greater amount fixed by the Authority and published in the Gazette or directed by Workers’ Compensation Commission
52 weeks from cessation of weekly payments (d)
Medical - no limit. Hospital - 4 days (>4 days if reasonable)
$67,476 + $50,000 in special circumstances
Not limit for seriously injured workers. Non-seriously injured workers' entitlement ceases after the worker has not had an entitlement to income support for a continuous period of 12 months or, if the worker has not had an entitlement to income support, after a period of 12 months.
No limits but entitlements cease one year following the cessation of weekly benefits, or if not entitled to weekly benefits, one year following the date the claim is made.
No limit No limit No limit
Death benefits (all jurisdictions pay funeral expenses to differing amounts)
$781,900 + $140.00pw for each dependant child
$598,360 (shared) + pre-injury earnings-related pensions to a maximum of $2,220 pw for dependant partner/s and children
$600,080 for total dependency + dependents under 16 or students (under 21, receiving full time education) $148.25 per week paid quarterly. If totally dependent spouse the following additional sums - $16045 for spouse + if dependents under 16 or students an additional $32070 for each member other than spouse + while dependents under 6, to the spouse $118.60 per week paid quarterly. If there a no dependents (spouse, issue, next of kin) to the estate $60010. If death of worker under 21, to the parent/s $36065.
$308,339 + $58.90 pw for each dependant child + reasonable expenses for workers' medical treatment.
$502,497 + 50% of deceased worker's Notional Weekly Earnings ("NWE") to totally dependent spouse + 25% of worker's NWEs to totally dependent orphaned child + 12.5% of worker's NWEs to totally dependent non-orphaned child.
$359,988 +100% weekly payment 0-26 weeks, 90% weekly payment 27-78 weeks, 80% weekly payment 79-104 weeks + $130.12 pw for each dependant child.
$588,406 plus $161.65 pw for each dependant child to a maximum of 10 children.
$539,002 + $148.23 pw for each dependant child (CPI indexed as of 1st Jan, 2018. Funeral benefits $5,620).
$539,002.37 lump sum + up to $11,828.87 funeral + up to 148.23pw for each dependant child.
(a) PI amounts increased as part of the legislative amendments in 2015 reforms. For injuries on or after 5 August 2015, The maximum amount payable (for PI 75% and above) is $598,560. The amounts are subject to indexation
- this is the amount applicable from 1 January 2018. Workers exempt from the June 2012 legislative changes to the NSW workers’ compensation system may also be entitled to pain and suffering lump sum compensation
(max $50,000). (b) Lump sum shared under statutory formulae between spouse and children. Pension payable to partner for 3 years and to children until age of 16 (or 21 in full-time study). (c) For workers with a PI between 11% and 20%, the period extends up to five years, and for workers with a PI >20% entitlement to medical treatment and services for life. Some entitlements continue for life, including: provision
of crutches, artificial members, eyes or teeth and other artificial aids or spectacles, including hearing aids and hearing aid batteries, home or vehicle modifications for life. Secondary surgery is also available for eligible workers.
(d) Except for workers who receive pecuniary loss damages, receive a statutory voluntary settlement or meet statutory requirements for ongoing entitlement.

47
Appendix 3 – Jurisdictional contact information
Jurisdiction Organisation Contact details
New South Wales
State Insurance Regulatory Authority SafeWork NSW NSW Workers Compensation Commission icare NSW
13 10 50
www.sira.nsw.gov.au
[email protected] www.safework.nsw.gov.au 1300 368 040 [email protected] www.wcc.nsw.gov.au www.icare.nsw.gov.au
Victoria WorkSafe Victoria Advisory Service 1800 136 089
www.worksafe.vic.gov.au
Queensland Office of Industrial Relations Infoline 1300 362 128
www.worksafe.qld.gov.au
Western Australia WorkCover WA Department of Mines, Industry Regulation and Safety– WorkSafe
(08) 9388 5555
www.workcover.wa.gov.au
1300 307 877
www.dmirs.wa.gov.au
South Australia ReturnToWorkSA SafeWork SA
13 18 55
www.rtwsa.com
1300 365 255
www.safework.sa.gov.au
Tasmania WorkSafe Tasmania
1300 366 322 (inside Tas)
(03) 6166 4600 (outside Tas)
www.worksafe.tas.gov.au
Northern Territory NT WorkSafe 1800 019 115
www.worksafe.nt.gov.au
Australian Capital
Territory
Access Canberra WorkSafe ACT
within Chief Minister Treasury and
Economic Development Directorate
(02) 6207 3000
www.worksafe.act.gov.au
Seacare Seacare Authority (02) 6275 0070
www.seacare.gov.au
Australian Government Comcare 1300 366 979
www.comcare.gov.au
New Zealand Accident Compensation Corporation
+64 7 848 7400
www.acc.co.nz