Maricopa County Sheriff’s Office Report on the comparative ... · the comparative performance of...
29
october 2012 Maricopa County Sheriff’s Office Report on the comparative performance of police organizations
-
Upload
truongxuyen -
Category
Documents
-
view
214 -
download
0
Transcript of Maricopa County Sheriff’s Office Report on the comparative ... · the comparative performance of...
october 2012
Maricopa County Sheriff’s Office Report on
the comparative performance of police organizations
Acknowledgements The AARIN Project staff thanks Peter Ozanne and Amy Rex for their establishment of the AARIN project and for all of their hard work and assistance on the project. We also thank the Maricopa County Manager and the Board of Supervisors for their continued support for AARIN. Additionally, we would like to thank the officers and command staff of the Maricopa County Sheriff’s Office, without whose cooperation, we would not be able to conduct the project.
This project was funded by Maricopa County. Opinions contained herein are those of the author and do not represent the position of either Maricopa County or Arizona State University.
AARIN Project Staff
Charles M. Katz, Principal Investigator Watts Family Director
Center for Violence Prevention &Community Safety Arizona State University
David E. Choate, Co-Principal Investigator
Associate Director of Operations Center for Violence Prevention & Community Safety
Arizona State University
Marisol Cortez
AARIN Project Manager Center for Violence Prevention & Community Safety
Arizona State University
Michael D. White, Co-Principal Investigator Associate Professor
School of Criminology and Criminal Justice Arizona State University
Lidia Nuño, Research Analyst
AARIN Project Manager Center for Violence Prevention & Community Safety
Arizona State University
Jody Arganbright Business Operations Manager
Center for Violence Prevention & Community Safety Arizona State University
In an effort to reduce our impact on the environment, we have chosen to distribute this report as a digital file.
© 2012 by the Arizona Board of Regents for and on behalf of Arizona State University and its Center for Violence Prevention and Community Safety. This document may be copied and transmitted freely. No deletions, additions, or alterations of contents are permitted without the expressed written consent of the Center for Violence Prevention and Community Safety.
Center for Violence Prevention and Community Safety 500 N. 3rd Street, NHI-1, Suite 200 Phoenix, AZ 85069-7100
(602) 496-1470 Web site: http://cvpcs.asu.edu
Arizona Arrestee Reporting Information Network 2012 Maricopa County Sheriff’s Office Report: Comparative performance assessment of police organizations through arrestee perceptions and experiences
By Charles M. Katz and Andrew M. Fox
September 2012
Suggested citation:
Katz, Charles M. and Andrew M. Fox (2012). Arizona Arrestee Reporting Information Network: Maricopa County
Sheriff’s Office Report: Comparative performance assessment of police organizations through arrestee perceptions
and experiences. Phoenix, AZ: Center for Violence Prevention & Community Safety, Arizona State University.
Center for Violence Prevention and Community Safety 1
AARIN Program Overview The Arizona Arrestee Reporting Information Network (AARIN) is a monitoring system that provides on-going descriptive information about drug use, crime, victimization, and other characteristics of interest among individuals arrested in Maricopa County, Arizona. Funded by the Maricopa County Board of Supervisors beginning in 2007, AARIN is modeled after the former National Institute of Justice (NIJ) national-level Arrestee Drug Abuse Monitoring Program (ADAM). In three facilities throughout the county, professionally trained interviewers conduct voluntary and confidential interviews with recently booked adult arrestees and juvenile detainees. Questions focus on a range of topics including education, employment and other demographics, patterns of drug use (lifetime and recent), substance abuse and dependence risk, criminal activity, gang affiliation, victimization, mental health, interactions with police, public health concerns, incarceration and probation, citizenship, and treatment experiences. Each interviewee also provides a urine specimen that is tested for the presence of alcohol and/or drugs. Arrestees who have been in custody longer than 48 hours are ineligible for participation in AARIN, due to the 72-hour time limitation for valid testing of urine specimen.
The instruments used and the reporting mechanism underwent a substantial revision in 2011. While maintaining all of the data elements from the previous core set of questions, the baseline interview expanded by more than 60%. Additionally, with the change in the core questionnaire, the project shifted its reporting strategy to focus reports to each of six key Maricopa County criminal justice agencies: Maricopa County Manager’s Office, Maricopa County Sheriff’s Office, Maricopa County Attorney’s Office, the Office of the Public Defender, Adult Probation Department, and the Juvenile Probation Department.
Overall, AARIN serves as a near-real time information source on the extent and nature of drug abuse and related activity in Maricopa County, AZ. This information helps to inform policy and practice among police, courts and correctional agencies to increase public safety and address the needs of individuals who find themselves in the criminal justice system.
For information using the most recent set of data, please see the following reports:
Maricopa County Manager’s Office – Report detailing substance abuse and public health concerns among the Maricopa County arrestee population.
Maricopa County Sheriff’s Office – Reports broad characteristics of the entire AARIN sample and a detailed comparison of arrestees’ perception of police in general, and use of force by and against police, by arresting agency.
Maricopa County Attorney’s Office – Detailed report covering street gangs using key core questionnaire elements and a comprehensive interpretation of the Gang Addendum.
Office of the Public Defender – Report comparing arrestees who are at-risk for a mental health problem, substance abuse/dependence problem, a co-occurring disorder (both substance abuse/dependence and mental health), or not at risk.
Arizona State University – College of Public Programs 2
Adult Probation Department – Comprehensive summary of the core questionnaire comparing Maricopa County probationers to probationers from elsewhere and those arrestees who have not served probation.
Juvenile Probation Department - Comprehensive summary of the core juvenile questionnaire comparing Maricopa County juvenile probationers to those who have served probation elsewhere and those detainees who have not served probation.
For other reports and more information about the project, visit the AARIN page of the Center for Violence Prevention & Community Safety’s website: http://cvpcs.asu.edu/ .
Methodology: Sampling and Data Collection In order to ensure representative results for the entire population of arrestees in Maricopa County, the AARIN project employs a systematic sampling protocol that includes the collection of data with target quotas each day. Data are collected during three cycles each calendar year – with interviews conducted during a continuous two-week period at the Central Intake of Maricopa County’s Fourth Avenue Jail each collection cycle. Dispersing data collection cycles across three different four-month blocks helps control for possible seasonal variations in crime and arrest patterns, and conducting collections covering all seven days of the week account for possible differences between weekdays and weekends, or other day-to-day variations. The periodic data collection cycles combined with the sampling protocols ensures a representative sample of all Maricopa County arrestees. The same procedures employed by AARIN were tested under ADAM (Maricopa County was one of the sites used in the evaluation) comparing the selected sample to comprehensive jail census data to assess the representativeness of the sample to the population on key characteristics. The National Opinion Research Center at the University of Chicago was the national data manager for ADAM at the time and concluded that the periodic data collection cycles, sampling protocols and daily quotas would result in a scientifically representative sample of study participants that could be generalized to the whole of arrestees for the particular jurisdiction (i.e. Maricopa County arrestees).
Daily collection quotas call for 23 males and 7 females to be interviewed, including the completion of the core instrument, any and all addenda, and to provide a urine specimen. Potential participants are selected using a standardized procedure (described below) to ensure both a sufficiently randomized and representative sample of arrestees. Some of the potential participants are either unavailable or otherwise ineligible for participation. Most commonly this applies to those arrestees who have already been released from custody or transferred to another facility, but also includes those whose behavior constitutes a safety risk to the jail and/or interview staff. Upon initial contact, arrestees are read an informed consent script (see inset), to which they voluntarily either decline or agree to participate; typically more than 90% agree to participate.
Consent Script: Hello, my name is __. I am working on a research project run by Arizona State University. The purpose of the project is to understand issues and problems confronted by people and to help give advice on how to provide services to individuals who have been arrested. I would like to ask you a series of questions that will take 15-45 minutes to answer. There are no foreseeable risks for participating in this research, and there are no benefits to you individually. Jail personnel will not have access to the information that you provide us. The information you provide is confidential and anonymous, and it will not help or hurt your case. If, for any
Center for Violence Prevention and Community Safety 3
reason, you become distressed or anxious during the interview, you can request to speak with the facility’s medical personnel or psychological counselors. I will not write down your name or any other identifying information the questionnaire. You can refuse to answer any question, and you may stop the interview at any time for any reason. At the end of the interview I will ask you to provide a urine sample. If you listen to my questions, I will give you a candy bar. Do you have any questions?
During the data collection period, interviews are conducted during an eight-hour period each day, with arrestees who are randomly selected based on their booking time that yields a stratified random sample. Consistent with the ADAM sampling strategy, a stock (i.e., arrested and booked during non-data collection hours) and flow (i.e., during data collection hours) process is employed to ensure a representative sample of arrestees across any given 24-hour period. The stock sample is selected by starting with a list of all bookings processed from the 16-hours that range from when collection ended the previous day through the start-time of the current collection day. Eligible bookings are counted and divided by ten, which gives the selection interval. A random start-point is selected, and each nth (e.g. the value equal to the selection interval) arrestee is selected as a potential participant. A “nearest-neighbor” procedure is used to replace members of the stock list that are either found to be ineligible or unavailable, or whom decline to participate, until the daily quota of 10 completed and provided interviews is met. The flow sample is more straight-forward. Potential participants are randomly selected as they are booked into the facility as needed. A minimum of 13 completed and provided interviews are expected to meet daily quota.
Survey Instrument The core AARIN survey instrument is modeled after the ADAM and Drug Use Forecasting (DUF) instruments, and was developed with input from Maricopa County officials. Starting with the third collection cycle of 2011, AARIN began using a new core instrument. The new instrument included the same elements of the previous version, but expanded by more than 60% following extensive input from Maricopa County officials representing six key agencies related to the criminal justice system and the arrestee population – the County Manager’s Office, Sheriff’s Office, County Attorney, Public Defender, Adult Probation, and Juvenile Probation.
The instrument is broken down into a variety of sections that include: demographics and background information (sex, race/ethnicity, age, citizenship, educational level, methods of income), current and past drug use (ever, past 12 months, 30 days and three days), drug dependency and treatment, medical marijuana and marijuana acquisition, criminal history (ever, past 12 months), gang involvement, firearms possession, victimization (past 12 months, 30 days), police interactions, mental health issues (ever and past 12 months), correctional health services and public health concerns, and incarceration and probation history (ever and past 12 months). Additionally, the AARIN platform includes addenda instruments to the core set of questions. Addenda are used to collect more detailed information regarding a particular topic and/or population. Recently, both a police contact and gang addenda were used, collecting information from arrestees about police in general, use of force by and against the police (Police Contact Addendum), reasons and methods for joining and leaving a gang, gang organizational structure and criminal activities, and the respondents’ perceptions of cohesion and connectedness to their gang (Gang Addendum).
Arizona State University – College of Public Programs 4
Urinalysis Testing Once an interview is completed, the arrestee then submits a urine sample. The urine specimens are tested for alcohol and four illicit drugs: cocaine, marijuana, methamphetamine, and opiates. The testing is done using the enzyme-multiplied immunoassay technique (EMIT), which has shown a high degree of accuracy with very few false-positive results (Reardon, 1993). As a reliability check, all specimens that test positive with the EMIT methods are then tested again using Gas Chromatography with Mass Spectrum Detection (GC/MS). The EMIT technique with GC/MS confirmation procedures are well-established and offer highly reliable results for the illicit drugs under study here – cocaine, marijuana, methamphetamine, and opiates – for up to 72 hours after use. Unfortunately, these procedures offer high reliability results for alcohol for only 12-24 hours after use. The adoption of more sensitive alcohol screening procedures was cost-prohibitive, however.
5
Comparative Performance of Police
Evaluating the overall performance of a for-profit entity is a fairly straightforward task when compared
to evaluating government organizations such as the police. Evaluations of for-profit organizations are
usually based on whether or not they are profitable and the margin of profitability. Greater profits are
seen as the reward that successful organizations receive when they meet customer needs and use their
resources efficiently (Hirschey and Pappas, 1996). When managers in the private sector are given the
task of evaluating organizational performance, they typically use an algebraic approach and focus on
productivity—with productivity being “the value of the output (goods or services) produced divided by
the value of input resources (wages, cost of equipment and the like) used” (Krajewski and Ritzman,
1999: 10). While more effective organizations reap the benefits of financial success and can grow, less
effective organizations generate fewer profits, experience economic turbulence, and can go out of
business. Travis and Brann (1997:1) noted 15 years ago that “Police departments don’t go out of
business; good or bad, they survive. So absent the unequivocal report card that the bottom line in
business provides, how do police departments (1) know what they are doing matters, and (2) how do
they measure what matters?”
When police executives are given the task of evaluating the performance of their organization it is often
unclear what they should focus on. Are they to focus on traditional indicators of effectiveness
associated with crime reduction such as crime reports, clearance rates, or response times? Are they to
focus on efficiency-oriented performance indicators such as costs associated with employees; or output
indicators such as the number of traffic citations issued per officer hour, the number of community
meetings attended, or the number of problem-solving projects initiated? Or are they to focus on issues
of rectitude associated with indicators such as police misconduct and citizen complaints? In other
words, police organizations do not have the benefit of having a clear and to the point bottom line.
Instead, for police organizations the bottom line for success is often amorphous and elusive.
Measuring the performance of the police, however, is important for several reasons. First and perhaps
most obvious, evaluating the police is important for the purpose of assessing the success of the
organization. Performance evaluations provide important feedback to police officials about their
organization’s efforts. They assist organizations in identifying weaknesses in structure, process, and
outcomes, and help leaders decide where to disburse limited resources. They also help agencies identify
conditions that might be limiting the organization’s potential for success, and provides information to
other agencies on the “best practices” that have been empirically shown to be successful (Bureau of
Justice Statistics, 1997).
There are other important reasons why we should evaluate the police. Performance assessment assists
managers in performing their administrative duties. Without performance measures managers are
unable to effectively make decisions relating to training, officer evaluations, and promotions. They also
allow mangers to provide useful feedback and guidance to personnel to assist them in carrying out their
duties in a productive and effective manner. Systematic evaluations of the organization and its
6
personnel also provides information to managers concerning the means that officers (and managers) are
using to address problems and keeps them up to date on the support (i.e., personnel and other
resources) that is needed to address the problem (Mastrofski and Wadman, 1991; Oettmeier and
Wycoff, 1997)
Performance evaluations also provide a means of socializing the police. They formally socialize officers
by conveying agency expectations to personnel. They inform officers, in an official and formal capacity,
about the mission, goals, and priorities of the police. They provide detailed expectations about the
types of activities that are to be performed, and the quality of the performance. Additionally,
performance evaluations informally socialize officers about acceptable styles of policing and help create
a shared vision of successful policing. Accordingly, they facilitate professional development among
officers (Oettmeier and Wycoff, 1997).
Unfortunately, police performance measurement has largely taken place in a vacuum. Police agencies
typically measure their success (or failure) based on intra-organizational base line measures rather than
comparing their performance to other police agencies (Maguire, 2004). Over the last two decades
industries throughout the developed world have shifted toward organizational performance appraisals
that are contextualized within the larger ecology of the industry. Today, for example, education and
health organizations are provided with organizational report cards that assess their performance with a
single grade (for examples see U.S. and World New Report). Such an approach has been applauded by
many not-for-profit, for-profit and government organizations because it makes organizations more
accountable to key stakeholders and corrects for “information asymmetries between organizations that
provide services and outsiders who… appraise such services” (Gormley, 2003: 1).
The purpose of this report is to provide a proof of concept for a different, alternative method for
evaluating police agencies. Our method is couched in a comparative approach, which will allow
agencies to compare their performance to other police agencies. This report assesses police
performance through the perceptions and experiences of recently booked arrestees. By comparing the
perceptions and experiences of recently booked arrestees from different jurisdictions we can begin to
contextualize results and observe differences that might serve as an early warning of a problem or serve
as an indicator of success.
Recently booked arrestees provide a unique perspective because of their intimate contact and
experience with the police (Maguire, 2004). The information they can provide is analogous to the client
survey used by companies that provide services to customers, the student survey used by universities
that teach students, and the resident survey used by government organizations that provide services to
the public. While critics point out that arrestees might have a biased perspective of the police, this
critique is at least somewhat muted by comparing each agency’s results to others. In other words, if
arrestees are biased they will be biased across communities, and that differences in arrestee reports
between agencies will be the result of differences in agency or community.
7
For the purpose of this proof of concept, and to begin a dialogue about this method of performance
measurement with local police agencies, we focus on issues related to police legitimacy. Specifically, for
this report we examine recently booked arrestees’ perceptions about cooperation with the police, their
behavior related to disrespectful behavior toward the police and resisting arrest, and the extent to
which they trust the police. We also examine their perceptions of quality of police treatment, whether
the police treat minorities differently, and whether they experienced police use of force. These
concepts were measured across seven different police agencies in Arizona. Organizational
confidentiality was maintained by randomly assigning numbers to each agency in place of the agency’s
name. Additionally, we omit any reference to the number of arrestees interviewed for the project
because it would result in the identification of some agencies. In the sections that follow we describe
our research methods and findings, and discuss our results.
Methods
The present study used data collected as part of the Arizona Arrestee Reporting Information Network
(AARIN). Maricopa County established AARIN in January 2007 to monitor drug use trends, treatment
needs, and at-risk behavior among recently booked arrestees in Maricopa County, Arizona. For six weeks
per year, trained local staff conducted voluntary and anonymous interviews with adults and juveniles
who had been arrested within the past 48 hours.
The core survey instrument generated self-report data on a variety of socio-demographic and behavior
variables. At the beginning of the survey, arrestees reported age, ethnicity, and educational background,
and the interviewer recorded gender, which was obtained from official booking data. Arrestees than
answered a series of questions about their drug use history, treatment needs, mental health history,
criminal history, prior experiences with victimization, and immigration status. At the end of the
interview, charge data were collected from official processing records, and each arrestee was asked to
provide a urine sample to be analyzed for four different drugs and alcohol. As part of the project, each
data collection period we add an addendum containing questions of special interest to stakeholder
organizations. Through this process we included several questions related to police legitimacy, which
were used for this report. These questions focused on such constructs as quality of police treatment,
procedural justice, quality of decision making, trust in police, and use of force. For additional
information about the research methods related to this report see the Appendix.
While data are collected from both adults and juveniles, analysis for this report relied on our adult
sample. The interviews were conducted from 2010 and 2012. Researchers originally contacted more
than 2,000 adult arrestees; of those who were eligible about 90 percent agreed to be interviewed. Of
those interviewed, more than 90 percent agreed to provide a urine sample. In the sections below we
present the questions included in each scale that was used for analysis and then present results.
8
Willingness to cooperate with the police
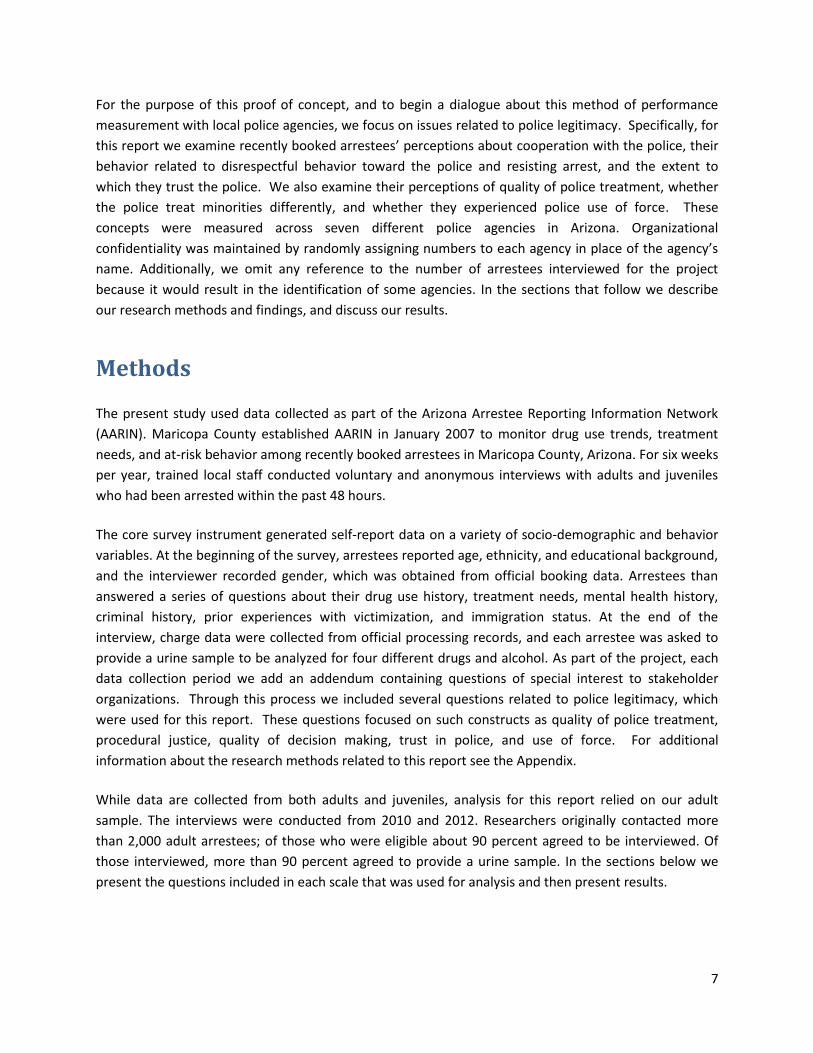
Arrestees across the seven agencies varied significantly on their willingness to cooperate with the police.
Figure 1 shows the mean response for willingness to cooperate with the police by the seven police
agencies. The mean of all the arrestees was 1.67. The mean response in four of the agencies was above
the mean, indicating a higher likelihood that the arrestees would cooperate with the police. The mean in
three of the agencies was below the mean, indicating a lower likelihood that the arrestees would
cooperate with the police. Those arrested by Agency 5 were the most likely to be willing to cooperate
with the police, with a mean score of 1.95. Those arrested by Agency 2 were the next most likely to be
willing to be cooperative with the police (1.79), followed by Agency 7 arrestees (1.71), and Agency 6
arrestees (1.69). Those arrested by Agency 4 (1.63), Agency 1 (1.62), and Agency 3 (1.61) were the least
likely to be willing to cooperate with the police.
1.62
1.79
1.61
1.63
1.95
1.69 1.71
1.00
1.20
1.40
1.60
1.80
2.00
1 2 3 4 5 6 7
Like
liho
od
of
coo
pe
rati
on
Arresting Agency
Figure 1: Arrestee's willingness to cooperate with the police*
Mean = 1.67 Likely
Unlikely
*p < .05
9
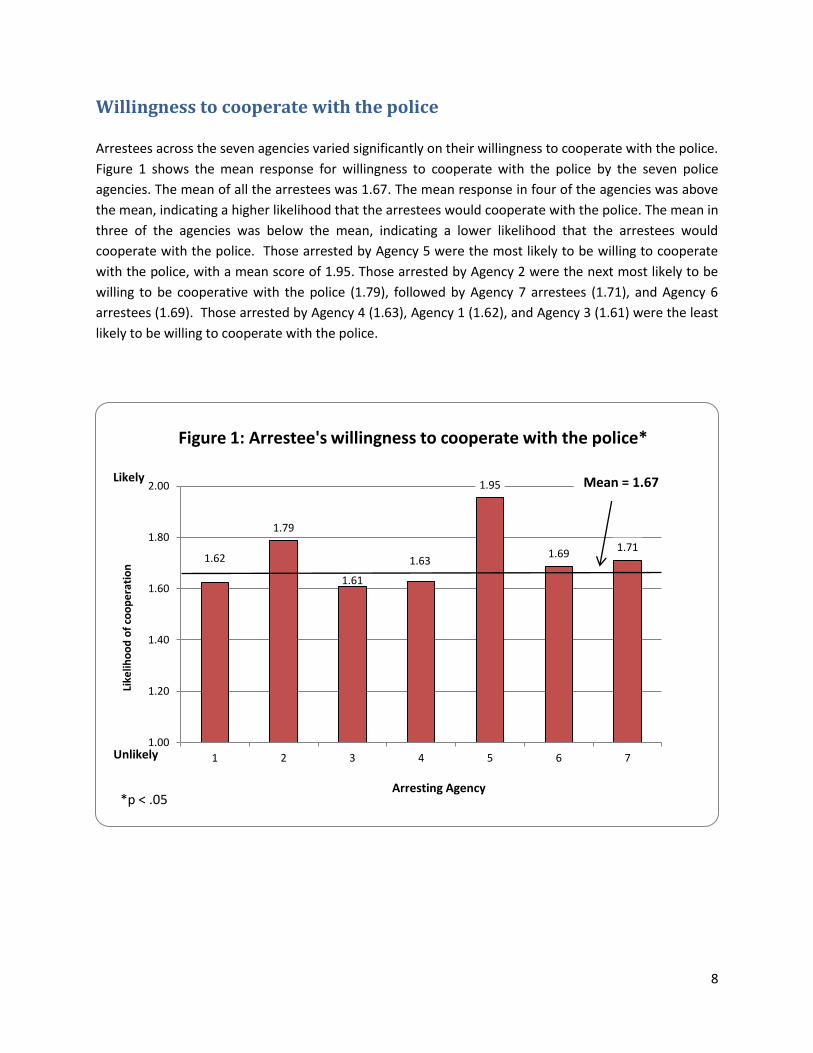
Arrestee self-reported disrespect toward the police
Figure 2 shows the percentage of arrestees self-reporting disrespect toward the police by arresting
agency. The mean level across agencies was 8.8 percent. While arrestees from agencies 1, 3, 4, and 7
reported more than an average amount of disrespect toward their arresting officer, arrestees from
agencies 2, 5, and 6 reported being less likely to be disrespectful toward the police. The variation among
the seven agencies was statistically significant at the .05 level.
12.69
5.20
9.78 9.44
4.17
8.20 9.94
0
2
4
6
8
10
12
14
16
18
20
1 2 3 4 5 6 7
Pe
rce
nta
ge
Arresting Agency
Figure 2: Percent of arrestee's disrespecting the police*
Mean = 8.80
*p < .05
10
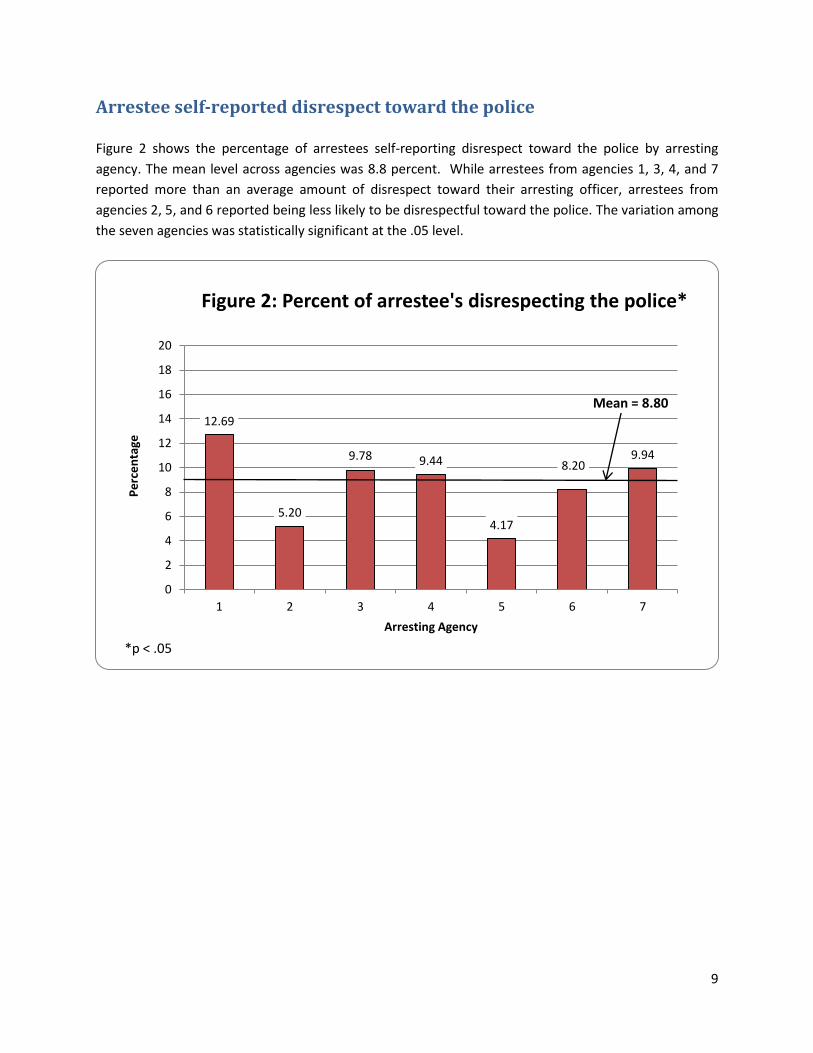
Arrestee self-reported resisting arrest
Figure 3 shows the percentage of arrestees who self-reported resisting arrest by arresting agency. The
overall mean across agencies was about three percent. Arrestees in agency 1 reported the highest levels
of resisting arrest with about 7.5 percent of arrestees reporting resisting arrest. Those arrested by
agencies 3, 5, and 7 self-reported resisting arrest more often than the average agency; and those
arrested by agencies 2, 4, and 6 less often than the average agency. Arrestees from agency six self-
reported the least amount of resisting arrest, with only two percent of arrestees self-reporting resisting
arrest. The variation among the seven agencies was statistically significant at the .05 level.
7.46
2.26
3.68 2.80
4.20
2.00
3.73
0
1
2
3
4
5
6
7
8
1 2 3 4 5 6 7
Per
cen
tage
Arresting Agency *p < .05
Figure 3: Percent arrestees resisting arrest*
Mean = 3.17
11
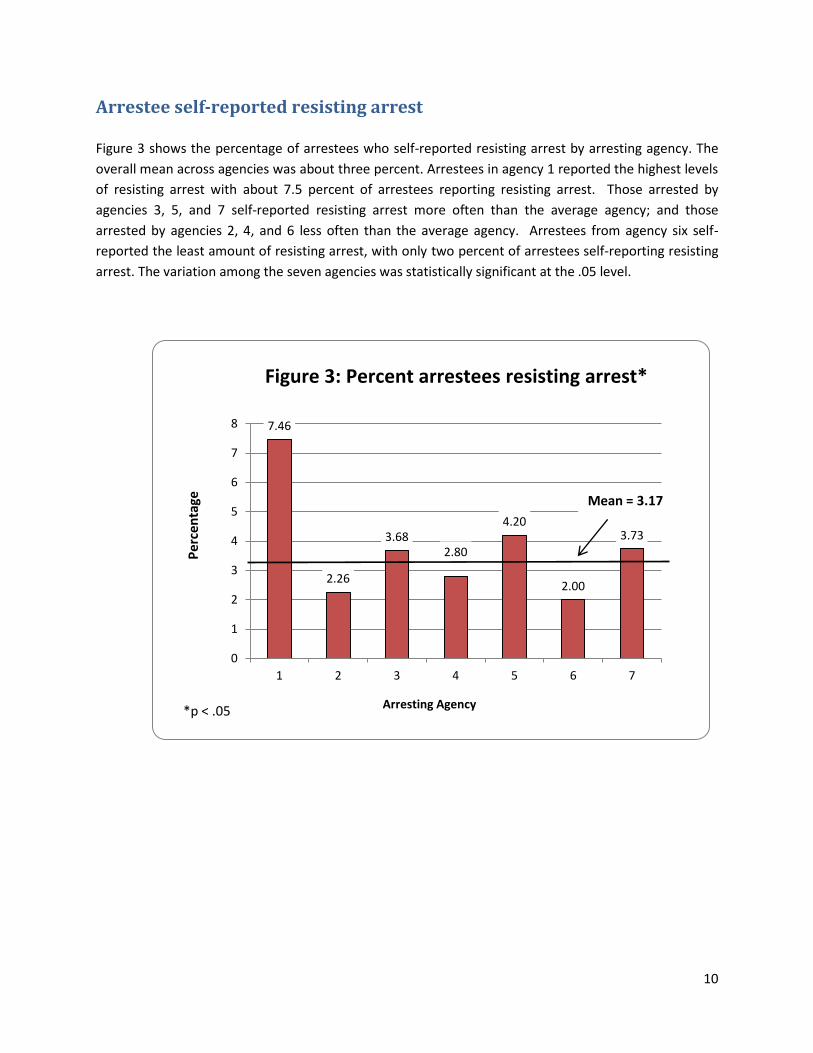
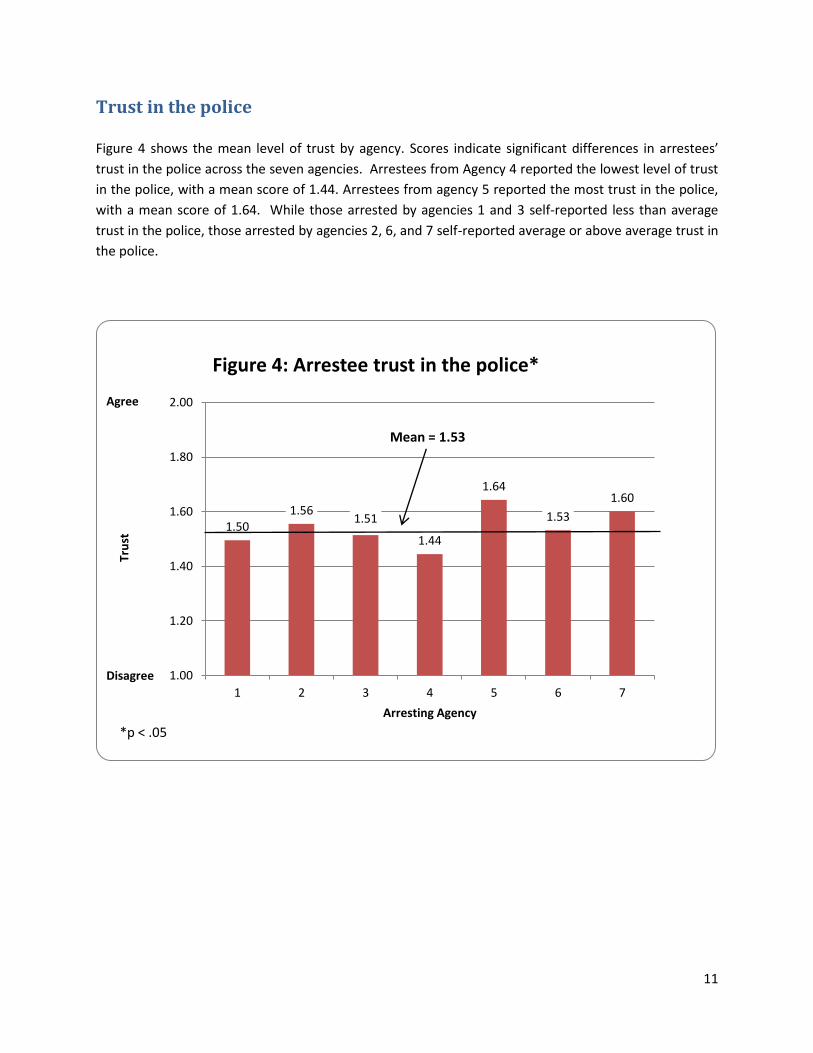
Trust in the police
Figure 4 shows the mean level of trust by agency. Scores indicate significant differences in arrestees’
trust in the police across the seven agencies. Arrestees from Agency 4 reported the lowest level of trust
in the police, with a mean score of 1.44. Arrestees from agency 5 reported the most trust in the police,
with a mean score of 1.64. While those arrested by agencies 1 and 3 self-reported less than average
trust in the police, those arrested by agencies 2, 6, and 7 self-reported average or above average trust in
the police.
1.50 1.56
1.51
1.44
1.64
1.53
1.60
1.00
1.20
1.40
1.60
1.80
2.00
1 2 3 4 5 6 7
Tru
st
Arresting Agency
Figure 4: Arrestee trust in the police*
Mean = 1.53
Agree
Disagree
*p < .05
12
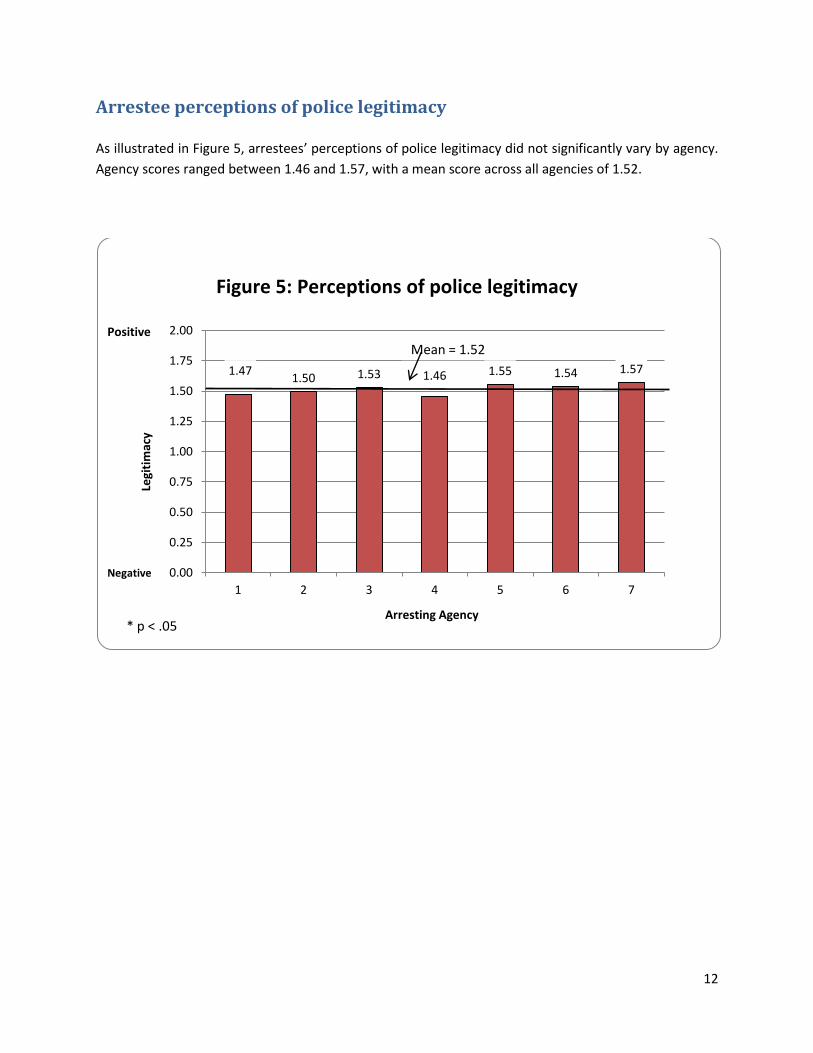
Arrestee perceptions of police legitimacy
As illustrated in Figure 5, arrestees’ perceptions of police legitimacy did not significantly vary by agency.
Agency scores ranged between 1.46 and 1.57, with a mean score across all agencies of 1.52.
1.47 1.50 1.53 1.46 1.55 1.54 1.57
0.00
0.25
0.50
0.75
1.00
1.25
1.50
1.75
2.00
1 2 3 4 5 6 7
Figure 5: Perceptions of police legitimacy
Arresting Agency * p < .05
Legi
tim
acy
Mean = 1.52
Negative
Positive
13
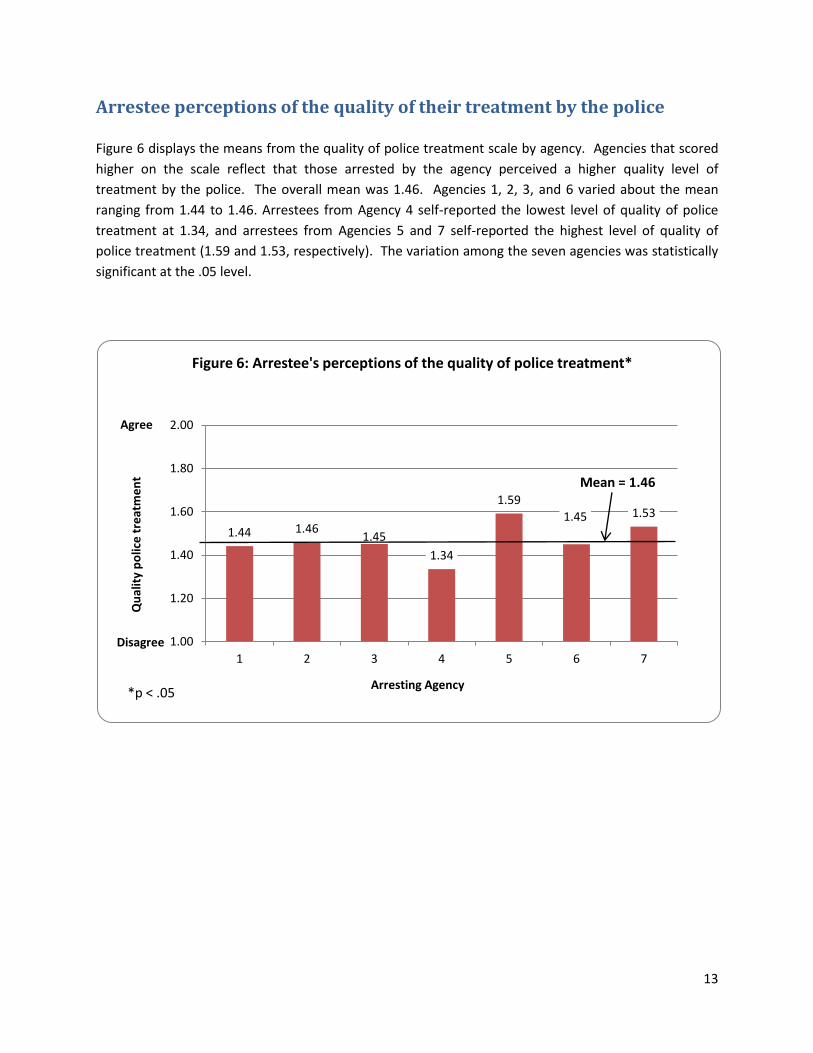
Arrestee perceptions of the quality of their treatment by the police
Figure 6 displays the means from the quality of police treatment scale by agency. Agencies that scored
higher on the scale reflect that those arrested by the agency perceived a higher quality level of
treatment by the police. The overall mean was 1.46. Agencies 1, 2, 3, and 6 varied about the mean
ranging from 1.44 to 1.46. Arrestees from Agency 4 self-reported the lowest level of quality of police
treatment at 1.34, and arrestees from Agencies 5 and 7 self-reported the highest level of quality of
police treatment (1.59 and 1.53, respectively). The variation among the seven agencies was statistically
significant at the .05 level.
1.44 1.46 1.45
1.34
1.59
1.45 1.53
1.00
1.20
1.40
1.60
1.80
2.00
1 2 3 4 5 6 7
Qu
alit
y p
olic
e t
reat
me
nt
Arresting Agency
Figure 6: Arrestee's perceptions of the quality of police treatment*
Mean = 1.46
Agree
Disagree
*p < .05
14
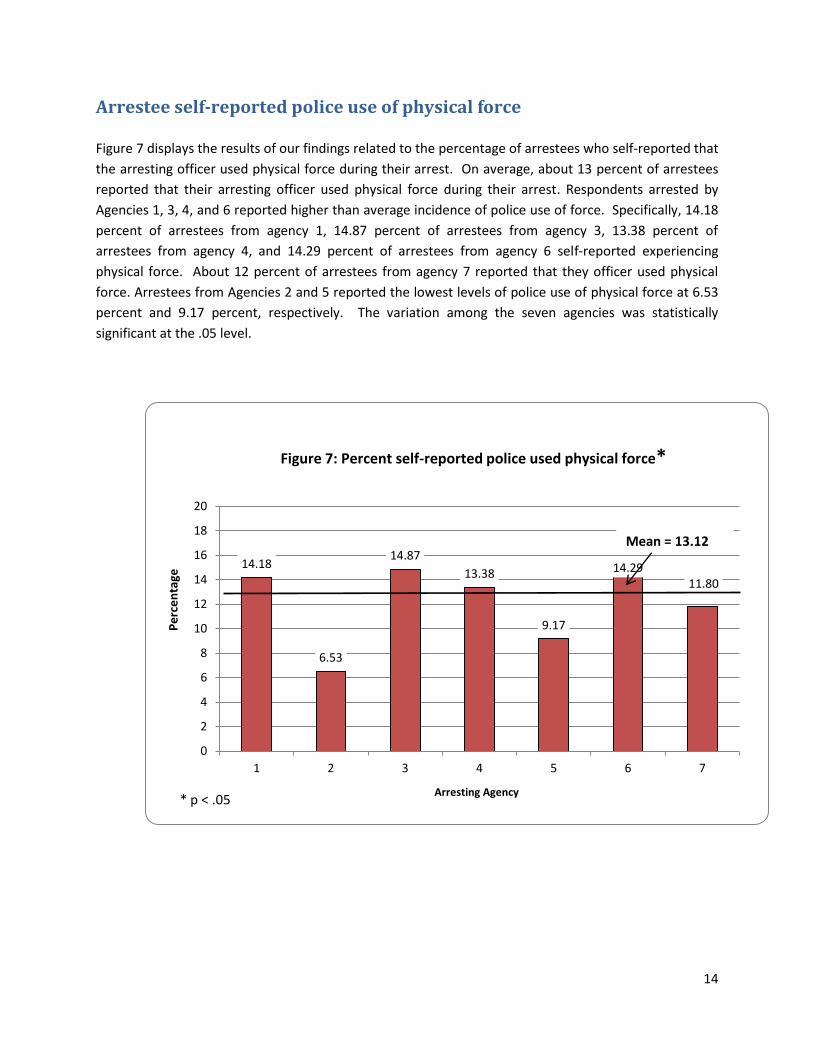
Arrestee self-reported police use of physical force
Figure 7 displays the results of our findings related to the percentage of arrestees who self-reported that
the arresting officer used physical force during their arrest. On average, about 13 percent of arrestees
reported that their arresting officer used physical force during their arrest. Respondents arrested by
Agencies 1, 3, 4, and 6 reported higher than average incidence of police use of force. Specifically, 14.18
percent of arrestees from agency 1, 14.87 percent of arrestees from agency 3, 13.38 percent of
arrestees from agency 4, and 14.29 percent of arrestees from agency 6 self-reported experiencing
physical force. About 12 percent of arrestees from agency 7 reported that they officer used physical
force. Arrestees from Agencies 2 and 5 reported the lowest levels of police use of physical force at 6.53
percent and 9.17 percent, respectively. The variation among the seven agencies was statistically
significant at the .05 level.
14.18
6.53
14.87
13.38
9.17
14.29 11.80
0
2
4
6
8
10
12
14
16
18
20
1 2 3 4 5 6 7
Arresting Agency
Pe
rce
nta
ge
Figure 7: Percent self-reported police used physical force*
* p < .05
Mean = 13.12
15
Arrestee self-reported police use or threat to use deadly force
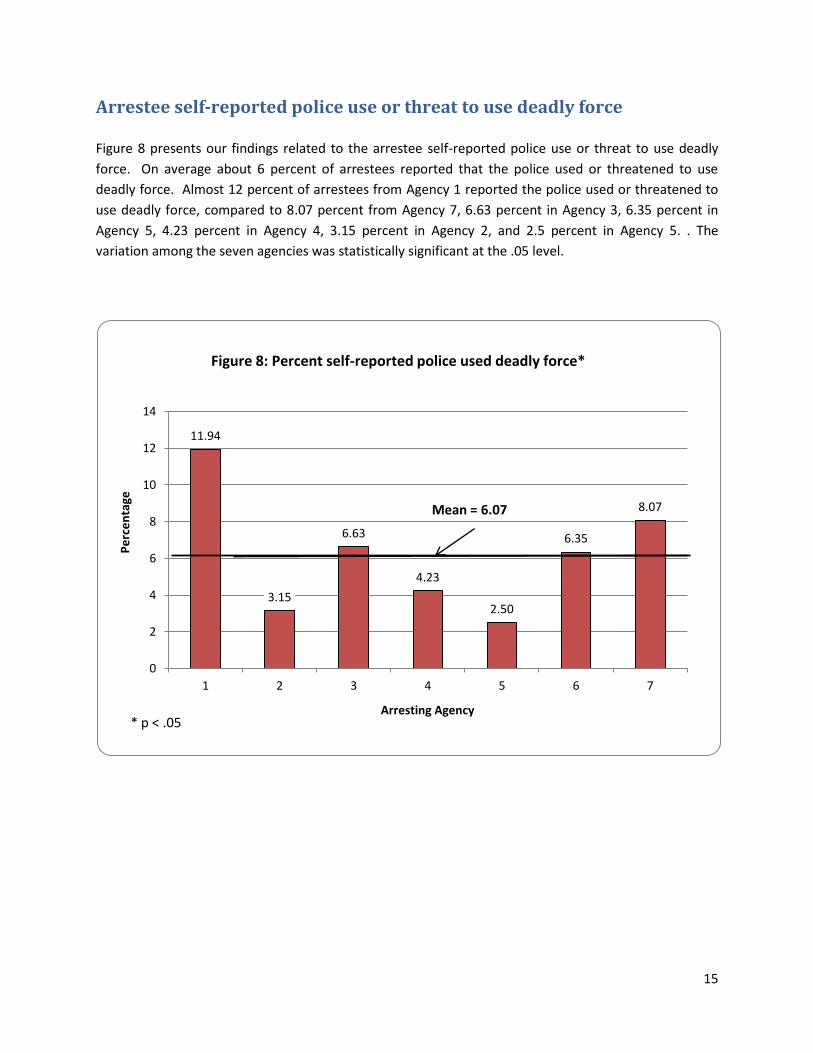
Figure 8 presents our findings related to the arrestee self-reported police use or threat to use deadly
force. On average about 6 percent of arrestees reported that the police used or threatened to use
deadly force. Almost 12 percent of arrestees from Agency 1 reported the police used or threatened to
use deadly force, compared to 8.07 percent from Agency 7, 6.63 percent in Agency 3, 6.35 percent in
Agency 5, 4.23 percent in Agency 4, 3.15 percent in Agency 2, and 2.5 percent in Agency 5. . The
variation among the seven agencies was statistically significant at the .05 level.
11.94
3.15
6.63
4.23
2.50
6.35
8.07
0
2
4
6
8
10
12
14
1 2 3 4 5 6 7
Arresting Agency * p < .05
Pe
rce
nta
ge
Figure 8: Percent self-reported police used deadly force*
Mean = 6.07
16
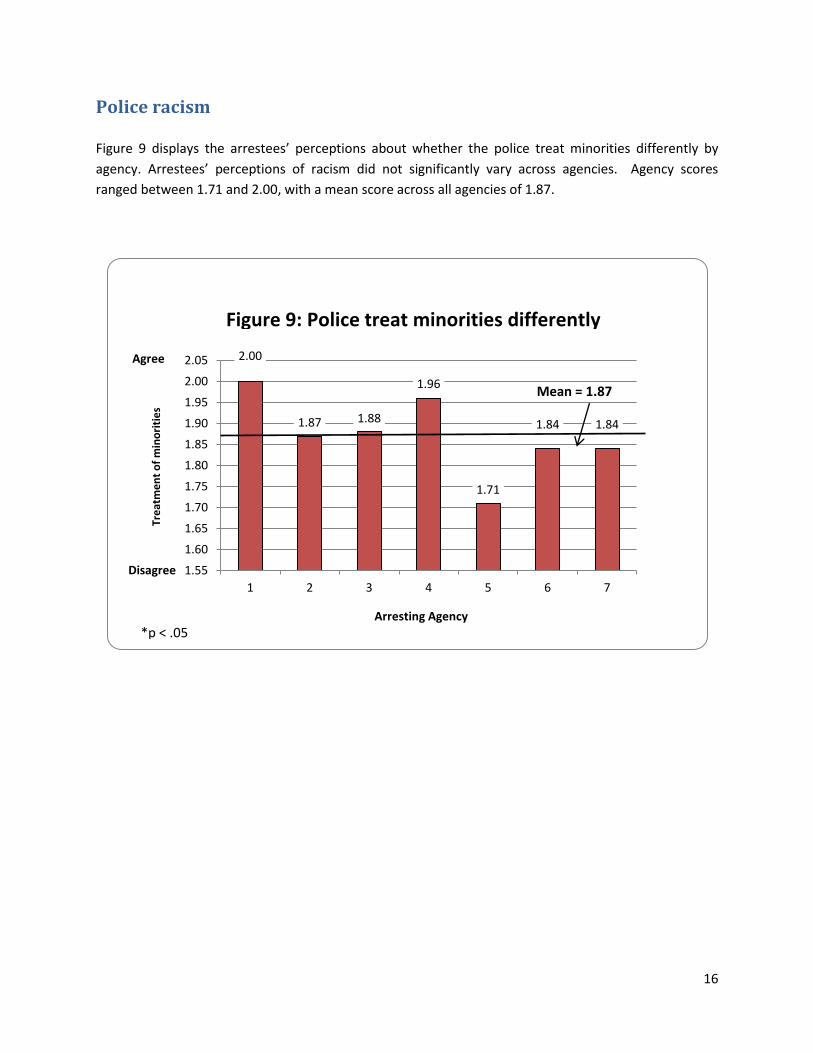
Police racism
Figure 9 displays the arrestees’ perceptions about whether the police treat minorities differently by
agency. Arrestees’ perceptions of racism did not significantly vary across agencies. Agency scores
ranged between 1.71 and 2.00, with a mean score across all agencies of 1.87.
2.00
1.87 1.88
1.96
1.71
1.84 1.84
1.55
1.60
1.65
1.70
1.75
1.80
1.85
1.90
1.95
2.00
2.05
1 2 3 4 5 6 7
Mean = 1.87
Figure 9: Police treat minorities differently
Tre
atm
en
t o
f m
ino
riti
es
*p < .05 Arresting Agency
Disagree
Agree
17
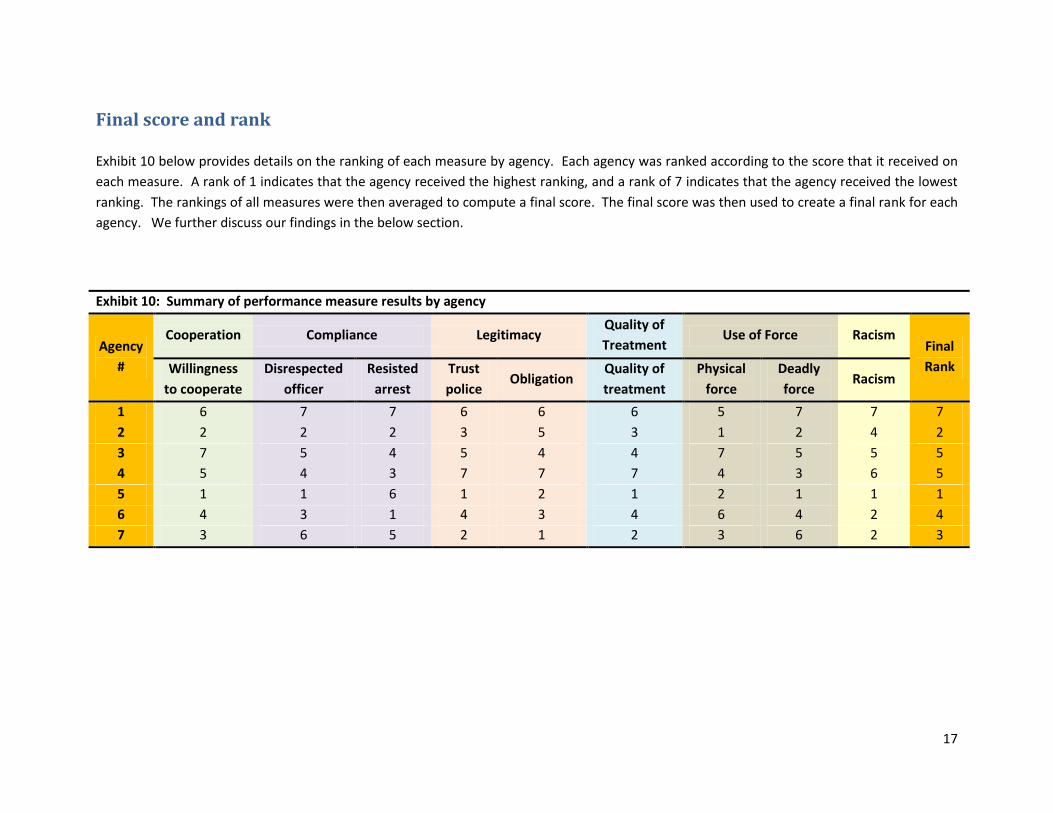
Final score and rank
Exhibit 10 below provides details on the ranking of each measure by agency. Each agency was ranked according to the score that it received on
each measure. A rank of 1 indicates that the agency received the highest ranking, and a rank of 7 indicates that the agency received the lowest
ranking. The rankings of all measures were then averaged to compute a final score. The final score was then used to create a final rank for each
agency. We further discuss our findings in the below section.
Exhibit 10: Summary of performance measure results by agency
Agency
#
Cooperation Compliance Legitimacy Quality of
Treatment Use of Force Racism
Final
Rank Willingness
to cooperate
Disrespected
officer
Resisted
arrest
Trust
police Obligation
Quality of
treatment
Physical
force
Deadly
force Racism
1 6 7 7 6 6 6 5 7 7 7
2 2 2 2 3 5 3 1 2 4 2
3 7 5 4 5 4 4 7 5 5 5
4 5 4 3 7 7 7 4 3 6 5
5 1 1 6 1 2 1 2 1 1 1
6 4 3 1 4 3 4 6 4 2 4
7 3 6 5 2 1 2 3 6 2 3
18
Conclusions
The purpose of this report is to compare the perceptions and experiences of recently booked arrestees
from different law enforcement agencies in Maricopa County to begin a dialogue about alternative
methods of measuring police performance. Data for the report was obtained from self-reports from
recently booked arrestees in Maricopa County from seven arresting law enforcement agencies.
Analysis suggested that arrestee perceptions and experiences on a number of dimensions varied across
arresting agencies. Furthermore, some agencies consistently outperformed others, and some agencies
consistently underperformed. These findings suggest that arrestee monitoring systems, such as AARIN,
have the capacity to identify variation in agency performance and can be used to help agencies learn
more about what they are doing well and not so well compared to other agencies. It also allowed us to
identify the multidimensionality of police performance and examine how some agencies perform well
on some measures and not others. For example, Agency 5 ranked favorably on many of the
performance measures when compared to other agencies. However, Agency 5 was identified as having
potential problems related to compliance in the form of resisting arrest. Our comparative assessment
strategy allows agencies to identify areas of weakness, even within an agency that is otherwise
performing well.
Our findings also have broader implications for the state of policing in the seven local police agencies
examined in Maricopa County; and suggest that from the perspective of recently booked arrestees local
police agencies have much room to improve. In general, our findings suggested that arrestees were
about as likely to cooperate with the police as not. Similarly, arrestees expressed only a modest amount
of trust in the police, most thought that they did not receive quality treatment during their encounter
with the police, and the vast majority thought that the police treated minorities differently. Some of
these findings were expected, as our sample was comprised of recently booked arrestees. These
individuals have been forcibly detained and most will be subject to formal (e.g., fine, probation, jail,
prison) and/or informal sanctions (e.g., upset spouse, loss of pay from missed work, etc.). Their dis-
satisfaction may be expressed through their perceptions of their encounter with the police. Regardless,
a loss in legitimacy has the impact of reducing police effectiveness. The less legitimate the police are
perceived, the less likely individuals will cooperate with the police and obey the law (Tyler, 2002). Police
organizations that can increase trust and confidence in the police can reap reward in the form of police
effectiveness. Our findings here can serve as a baseline for observing change in police efforts to enhance
their legitimacy (Tyler and Huo, 2002).
One particularly concerning finding was that the vast majority of arrestees believed that the police treat
minorities differently. Specifically, about 70 percent of arrestees stated that the police treat minorities
differently than non-minorities (dichotomized analysis not present). This finding suggests that the police
have a long way to go in rectifying arrestees’ perceptions about the impact of race and ethnicity in
police decision making. Police agencies would be well advised to focus much effort on improving the
relationship that they have with the minority community.
19
About nine percent of arrestees self-reported being disrespectful to the police and another three
percent reported resisting arrest. While not always the case, disrespect and resisting arrest can be
symbols of loss of police legitimacy. When individuals trust and perceive the police as legitimate they
are more likely to adhere to police requests and cooperate with the police. Those who do not trust the
police as much and perceive them to be less legitimate are less likely to adhere to police requests and
cooperate with the police (Tyler and Huo, 2002; Johnson et al., 2008). As such, these measures serve as
important benchmarks of police performance in general and police legitimacy more specifically. In the
future trend analysis might allow us to differentiate those agencies that are becoming more legitimate
in the eyes of the public and those agencies that remain unchanged or are losing legitimacy.
Interestingly, 13 percent of the arrestees claimed that the police used physical force and about six
percent claimed that the police threatened or used deadly force during their encounter. Once again, this
finding should not necessarily be surprising given our sample of arrestees, but it does suggest that a
sizable proportion of arrests involve some form of force. Encounters involving use of force increase the
probability of either a suspect or police officer being injured. Related, prior research in jurisdictions
outside of Arizona suggests that roughly one-third of use of force incidents involve excessive force
(Walker and Katz, 2011). Therefore, reducing use of force in general not only reduces risk but also
reduces the opportunity for excessive force.
A next step in the analysis will be to disaggregate our data to examine the role of arrestee ethnicity and
gender (among other things) on perceptions and experiences. Much prior research has demonstrated
that an individual’s background not only has an impact on their perceptions of the police but also their
expectations (Webb, Katz, and Graham, 1997; Webb and Katz, 1997; Katz and Webb, 2006) and
experiences with the police (Walker and Katz, 2011). In the near future we also intend to broaden our
measures of police performance to understand performance from a variety of dimensions including
effectiveness and efficiency. These measures will not only be examined from the community’s
perspective but also through official data obtained from the police.
In summary, this report serves as a starting point, or proof of concept for understanding performance
through a comparative assessment. We have documented that arrestees are accessible, can serve as an
important source of information about police performance, and can provide important feedback
regarding their perceptions and experiences with their encounter with the police. The AARIN program
serves as a valuable monitoring system for evaluating police performance to motivate change through
professional competitiveness and external pressure from key stakeholders.
20
References
Gormley, William (2003). Using organizational report cards. Paper presented at the National Public
Management Research Conference, Washington DC, Georgetown University, October 11, 2003.
Hirschey, Mark and James L. Pappas (1996). Managerial Economics. Fort Worth, TX: The Dryden Press.
Johnson, D., King, W.R., Katz, C.M., Fox, A.M., & Goulette, N (2008). “Youth Perceptions of the Police in
Trinidad and Tobago.” Caribbean Journal of Criminology and Public Safety 13 (1&2): 217-253.
Katz, Charles M., Vincent J. Webb, Patrick R. Gartin, and Chris E. Marshall. (1997). "The Validity of Self-
Reported Marijuana and Cocaine Use." Journal of Criminal Justice 25 (1): 31-42.
Katz, Charles M. and Vincent J. Webb (2006). Policing Gangs in America. Cambridge University Press:
New York.
Maguire, Edward (2004). Police Departments as Learning Laboratories. In Ideas in American Policing,
Police Foundation, 6: 1-15.
Sunshine, Jason and Tyler, Tom (2003). “The role of procedural justice and legitimacy in shaping public
support for policing.” Law & Society Review, 37, 3: 513-547.
Travis, Jeremy and Brann, Joseph (1997). Measuring What Matters Part Two: Developing Measures of
What the Police Do. Research in Action. Washington DC: National Institute of Justice.
Tyler, Tom (2002). “A national survey for monitoring police legitimacy.” Justice Research and Policy, 4:
71-86.
Tyler, Tom and Yuen Huo (2002). Trust in the Law: Encouraging Public Cooperation with the Police and
Courts. New York: Russell-Sage.
Walker, Samuel and Charles M. Katz. (2011). The Police in America: An Introduction (7th Edition).
McGraw-Hill: Boston.
Webb, Vincent J. and Charles M. Katz (1997). "Citizen Assessments of the Importance of Community
Policing Activities." Policing: An International Journal of Police Strategies and Management 20 (1): 7-23.
Webb, Vincent J., Charles M. Katz, and Nanette Graham (1997). "Citizen Ratings of the Importance of
Selected Police Duties." Journal of Crime and Justice 20 (1): 37-54.
Webb, Vincent, Charles M. Katz, and Scott Decker (2006). “Assessing the validity of self-reports by gang
members: Results from the Arrestee Drug-Abuse Monitoring program.” Crime & Delinquency 52 (2):
232-252.

21
Wells, William, Charles M. Katz, and Jeonglim Kim (2010). “Firearm possession among arrestees in
Trinidad and Tobago.” Injury Prevention 16: 337-342.
22
Methodological Appendix
Validity of self-reported data from recently booked arrestees
A number of studies have examined the validity of self-report data obtained from recently booked
arrestees. These studies have examined the consistency between self-reported drug use and urinalyses.
For example, Katz, Webb, Gartin and Marshall (1997) found that only about 15 percent of arrestees who
self-reported not having used marijuana or cocaine in the past 72 hours tested positive for either drug.
Similar research by Webb, Katz, and Decker (2006) found that the validity of data obtained from
arrestees did not differ by gang status or involvement in criminality. See also Wells et al. (2010).
Statistical power
It should be noted that one potential limitation of this study is that our analyses involved comparisons of
recently booked arrestees in Maricopa County from several law enforcement agencies; and some of
these agencies contributed a relatively modest number of arrestees to the sample when compared to
others. Small sample sizes can raise questions about statistical power. Statistical power is the ability of
a statistical test to detect an effect in the sample if one exists. Statistical power consists of four
elements: sample size, sample variance, statistical significance level, and effect size (Cohen, 1988).
Based on our power analysis, we have determined that our comparisons of recently booked arrestees
from seven law enforcement agencies have sufficient sample size to detect small effects. In our sample,
for example, our ANOVA tests had power of .90. This suggests that we can detect a significant effect at
p<.05 about 90 percent of the time.
Scale construction
Scales were created in two ways. The first, which was used for the construction of cooperation, quality
of treatment, trust, and obligation, added each construct related item together and divided by the total
number of available items to obtain a mean score. The second, which was used for the construction of
disrespect, resisting arrest, physical force, deadly force, and racism, each included one to two yes/no
questions. If the arrestee indicated yes to one or both items they received a score of 1 (indicating yes)
and if they indicated no to both items they received a score of 0 (indicating no). The score resulting
from these constructs can be interpreted as a percentage.
23
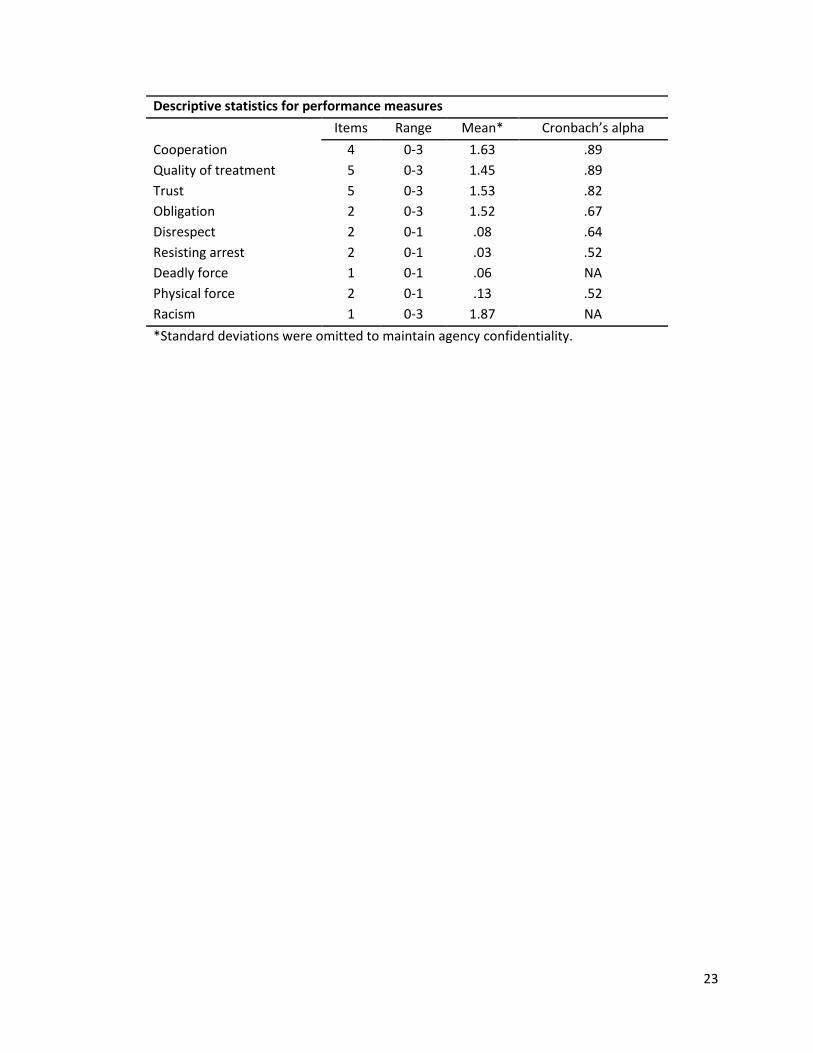
Descriptive statistics for performance measures
Items Range Mean* Cronbach’s alpha
Cooperation 4 0-3 1.63 .89
Quality of treatment 5 0-3 1.45 .89
Trust 5 0-3 1.53 .82
Obligation 2 0-3 1.52 .67
Disrespect 2 0-1 .08 .64
Resisting arrest 2 0-1 .03 .52
Deadly force 1 0-1 .06 NA
Physical force 2 0-1 .13 .52
Racism 1 0-3 1.87 NA
*Standard deviations were omitted to maintain agency confidentiality.
24
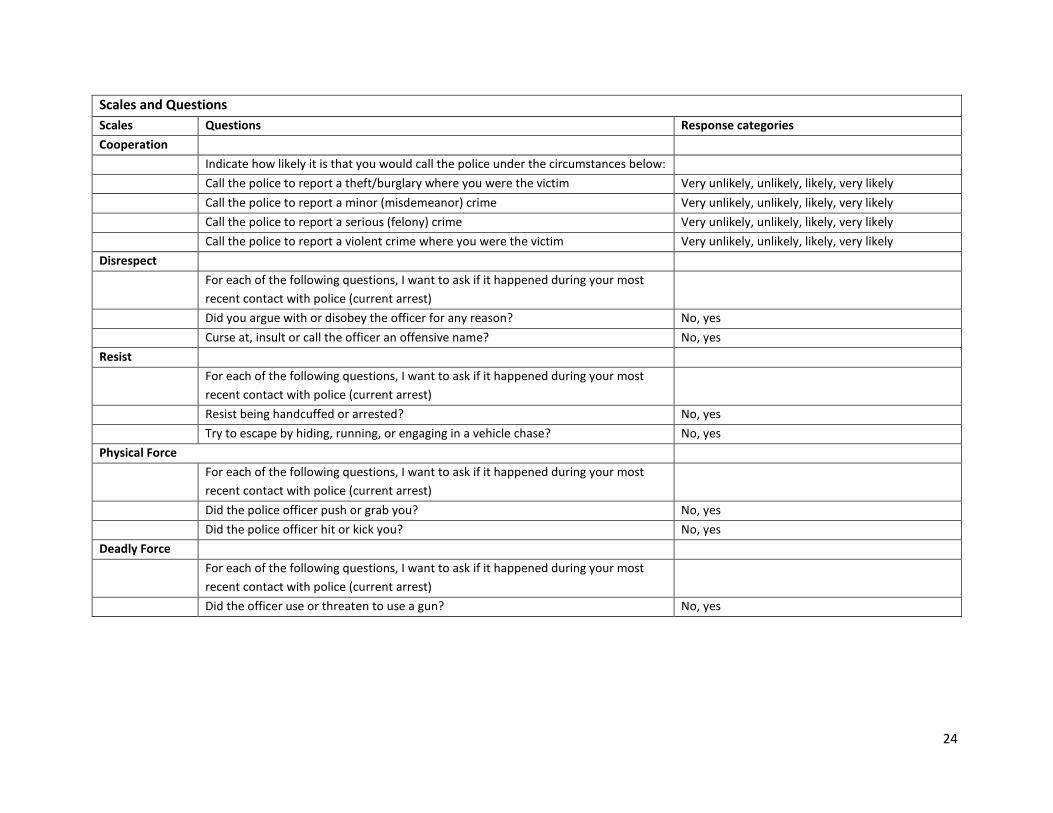
Scales and Questions
Scales Questions Response categories
Cooperation
Indicate how likely it is that you would call the police under the circumstances below:
Call the police to report a theft/burglary where you were the victim Very unlikely, unlikely, likely, very likely
Call the police to report a minor (misdemeanor) crime Very unlikely, unlikely, likely, very likely
Call the police to report a serious (felony) crime Very unlikely, unlikely, likely, very likely
Call the police to report a violent crime where you were the victim Very unlikely, unlikely, likely, very likely
Disrespect
For each of the following questions, I want to ask if it happened during your most
recent contact with police (current arrest)
Did you argue with or disobey the officer for any reason? No, yes
Curse at, insult or call the officer an offensive name? No, yes
Resist
For each of the following questions, I want to ask if it happened during your most
recent contact with police (current arrest)
Resist being handcuffed or arrested? No, yes
Try to escape by hiding, running, or engaging in a vehicle chase? No, yes
Physical Force
For each of the following questions, I want to ask if it happened during your most
recent contact with police (current arrest)
Did the police officer push or grab you? No, yes
Did the police officer hit or kick you? No, yes
Deadly Force
For each of the following questions, I want to ask if it happened during your most
recent contact with police (current arrest)
Did the officer use or threaten to use a gun? No, yes
25
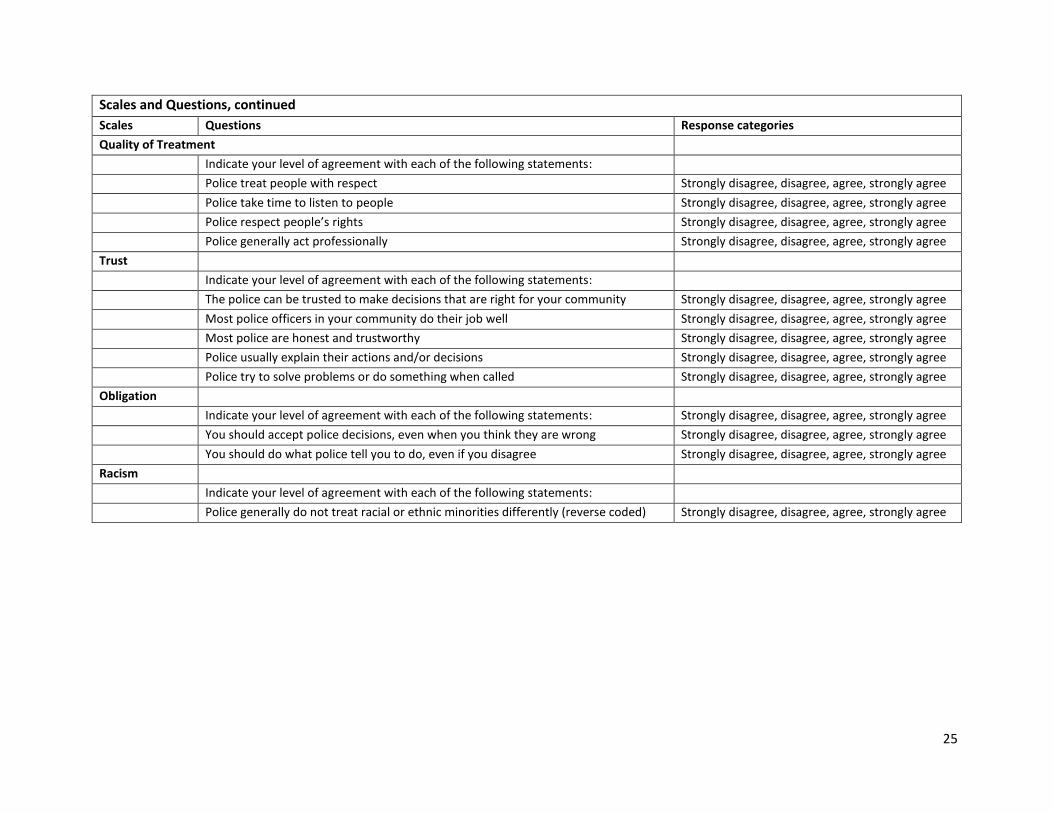
Scales and Questions, continued
Scales Questions Response categories
Quality of Treatment
Indicate your level of agreement with each of the following statements:
Police treat people with respect Strongly disagree, disagree, agree, strongly agree
Police take time to listen to people Strongly disagree, disagree, agree, strongly agree
Police respect people’s rights Strongly disagree, disagree, agree, strongly agree
Police generally act professionally Strongly disagree, disagree, agree, strongly agree
Trust
Indicate your level of agreement with each of the following statements:
The police can be trusted to make decisions that are right for your community Strongly disagree, disagree, agree, strongly agree
Most police officers in your community do their job well Strongly disagree, disagree, agree, strongly agree
Most police are honest and trustworthy Strongly disagree, disagree, agree, strongly agree
Police usually explain their actions and/or decisions Strongly disagree, disagree, agree, strongly agree
Police try to solve problems or do something when called Strongly disagree, disagree, agree, strongly agree
Obligation
Indicate your level of agreement with each of the following statements: Strongly disagree, disagree, agree, strongly agree
You should accept police decisions, even when you think they are wrong Strongly disagree, disagree, agree, strongly agree
You should do what police tell you to do, even if you disagree Strongly disagree, disagree, agree, strongly agree
Racism
Indicate your level of agreement with each of the following statements:
Police generally do not treat racial or ethnic minorities differently (reverse coded) Strongly disagree, disagree, agree, strongly agree
MAILING ADDRESSCenter for Violence Prevention and Community Safety
College of Public ProgramsArizona State University
Mail Code 3120500 N. 3rd Street, Suite 200Phoenix, Arizona 85004-2135
PHONE602.496.1470
WEB SITEhttp://cvpcs.asu.edu
About the Center for Violence Prevention & Community Safety
Arizona State University, in order to deepen its commitment to the communities of Arizona and to society as a whole, has set a new standard for research universities, as modeled by the New American University. Accordingly, ASU is measured not by whom we exclude, but by whom we include.
The University is pursuing research that considers the public good and is assuming a greater responsibility to our communities for economic, social, and cultural vitality. Social embeddedness – university-wide, interactive, and mutually-supportive partnerships with Arizona communities – is at the core of our development as a New American University.
Toward the goal of social embeddedness, in response to the growing need of our communities to improve the public’s safety and well-being, in July 2005 ASU established the Center for Violence Prevention and Community Safety. The Center’s mission is to generate, share, and apply quality research and knowledge to create “best practice” standards.
Specifically, the Center evaluates policies and programs; analyzes and evaluates patterns and causes of violence; develops strategies and programs; develops a clearinghouse of research reports and “best practice” models; educates, trains, and provides technical assistance; and facilitates the development and construction of databases.
For more information about the Center for Violence Prevention and Community Safety, please contact us using the information provided below.