Comparative Performance Monitoring Report: Part 1 - Work ......Australia (no change) during the...
41
Transcript of Comparative Performance Monitoring Report: Part 1 - Work ......Australia (no change) during the...


Disclaimer
Safe Work Australia provides the information in this publication to raise awareness of work health and safety.
While Safe Work Australia makes every effort to ensure information is accurate and up-to-date, Safe Work Australia does not provide any
warranty regarding the accuracy, currency or completeness of the information contained in this publication and will not be held liable for any
loss, damage, cost or expense incurred or arising by reason of any person using or relying on the information in this publication.
This publication may incorporate views or information from third parties, which do not necessarily reflect the views of Safe Work Australia. The
inclusion of such material does not indicate an endorsement of that material or a commitment to any particular course of action. The views in
this publication should not be taken to represent the views of Safe Work Australia unless otherwise expressly stated.
ISSN 2209-9158
Creative Commons
This copyright report is licensed under a Creative Commons Attribution-Noncommercial 4.0 International licence. To view a copy of this licence, visit https://creativecommons.org/licenses/by-nc/4.0/. In essence, you are free to copy, communicate and adapt the work for non-commercial purposes, as long as you attribute the work to Safe Work Australia and abide by the other licence terms.
Enquiries regarding the licence and any use of the report are welcome at:
Copyright Officer
Safe Work Australia
GPO Box 641 Canberra ACT 2601
Email: [email protected]
Important Notice
Safe Work Australia provides the information given in this document to improve public access to information about work health and safety
information generally. The vision of Safe Work Australia is Australian workplaces free from injury and disease. Its mission is to lead and
coordinate national efforts to prevent workplace death, injury and disease in Australia.
3
Contents
Foreword ............................................................................................................................................ 4
1. Serious claims .............................................................................................................................. 8
1.1 Incidence rate ......................................................................................................................... 8
1.2 Frequency rate ....................................................................................................................... 9
1.3 Long term incidence and frequency rates .............................................................................. 9
1.4 Self-insured serious claims .................................................................................................. 10
2. Duration of absence .................................................................................................................. 12
3. Work-related fatalities ............................................................................................................... 13
3.1 Work-related traumatic injury fatalities ................................................................................. 13
3.2 Work-related disease fatalities ............................................................................................. 14
4. Claims by size of business (in the private sector) ................................................................. 15
5. Claims by mechanism of incident ............................................................................................ 17
5.1 Claims by mechanism of incident and jurisdiction ............................................................... 18
6. Claims by industry ..................................................................................................................... 23
6.1 Claims by industry and jurisdiction ....................................................................................... 25
Appendix 1 — Explanatory notes .................................................................................................. 37
Appendix 2 – Jurisdictional contact information ........................................................................ 41

4
Foreword The Labour Ministers’ Council released the first Comparative Performance Monitoring (CPM) report in December 1998. The CPM project was transferred to Safe Work Australia when it was established in 2009. The CPM reports provide trend analysis on the work health and safety and workers’ compensation schemes operating in Australia and New Zealand. This is the 21st annual report of the CPM project.
The CPM is complemented by the Australian Workers’ Compensation Statistics report, which provides more detailed analysis of national workers’ compensation data using key variables such as occupation, industry, age and sex with supporting information on the circumstances surrounding work-related injury and disease occurrences. The CPM is also complemented by the Comparison of Workers’ Compensation Arrangements in Australia and New Zealand, which discusses the way that each scheme deals with key aspects such as coverage, benefits, self-insurance, common law and dispute resolution. The publications can be found on the Safe Work Australia website.
Statement of purpose
The role of the CPM report is to facilitate improvement of work health and safety, workers’ compensation and related service outcomes in Australian and New Zealand schemes through an accessible report that:
(a) monitors the comparative performance of jurisdictions over time, and (b) enables benchmarking across jurisdictions and the identification of best practice to
support policy making.
Data
The data used in this report were supplied by jurisdictions for the 2017–18 financial year and data updates back to 2013–14.
Readers should be aware that the data presented here may differ from jurisdictional annual reports due to the use of different definitions and the application of adjustment factors to aid in the comparability of data. Each chapter contains explanatory commentary on the data items with additional information included in Appendix 1 – Explanatory Notes, at the end of this publication.
The data in this report were collected from:
workers’ compensation schemes and work health and safety authorities as follows:
o New South Wales — State Insurance Regulatory Authority and SafeWork NSW
o Victoria — WorkSafe Victoria
o Queensland — Workplace Health and Safety Queensland, Office of Industrial Relations – Education Queensland, Queensland Workers’ Compensation Regulator and WorkCover Queensland
o Western Australia — Department of Mines, Industry Regulation and Safety – WorkSafe
o South Australia — Return to Work South Australia and SafeWork SA
o Tasmania — WorkSafe Tasmania and WorkCover Board Tasmania
o Northern Territory — NT WorkSafe, Department of Attorney-General and Justice
o Australian Capital Territory — Access Canberra, Worksafe ACT within Chief Minister Treasury and Economic Development Directorate
o Australian Government — Comcare
o Seacare — Seacare Authority (Seafarers Safety, Rehabilitation and Compensation Authority), and
o New Zealand — Accident Compensation Corporation and WorkSafe New Zealand
5
the National Data Set for Compensation-based Statistics and the Work-related Traumatic Injury Fatalities data set compiled by Safe Work Australia. Further information on these data sets can be found on the Safe Work Australia website, and
the Australian Bureau of Statistics (ABS) which provides estimates of the number of employees and hours worked based on the Labour Force Survey, the Survey of Employment and Earnings, and data provided by Comcare. Further adjustments are made using data from the Census, the Forms of Employment Survey and the Survey of Employment Arrangements, Retirement and Superannuation.
Coordination
This report has been compiled and coordinated by Safe Work Australia with assistance from representatives of all work health and safety and workers’ compensation authorities in Australia and New Zealand. As agreed with Comcare in this report, the name ‘Australian Government’ is used for indicators relating to the Australian Government jurisdiction in work health and safety and workers’ compensation matters, while ‘Comcare’ is used to describe Comcare – the entity for indicators relating to scheme performance.
Through a partnership of governments, employers and employees, Safe Work Australia leads the development of national policy to improve work health and safety and workers’ compensation arrangements across Australia.

6

7

8
1. Serious claims The data presented in this section are accepted serious workers’ compensation claims lodged in each financial year. Serious claims refer to claims relating to work-related injury or disease that result in a total absence from work of one working week or more. Workers’ compensation data provides an indicator for measuring work health and safety performance. While there are some limitations, most notably that the data only cover those eligible for workers’ compensation and under-report the incidence of disease, the data still provide a good indication of work health and safety trends. The estimates of the number of employees and hours worked (supplied by the ABS) and claims data have been revised back to 2013–14. This means that the incidence and frequency rates published in this report will differ to those previously published.
1.1 Incidence rate
Indicator 1 shows that the overall Australian incidence rate for serious claims has steadily declined over the past four years, falling by 10 per cent from 10.3 to 9.3 claims per 1,000 employees between 2013–14 and 2016–17. Preliminary data for 2017–18 (denoted by the letter “p”) show an incidence rate of 9.1 claims per 1,000 employees, however this is expected to be revised upwards when updated data are available.
Indicator 1 – Incidence rates of serious injury and disease claims by jurisdiction
Between 2013–14 and 2016–17 all Australian jurisdictions except the Australian Capital Territory recorded falls in the incidence rate of serious claims. The Australian Government recorded the largest decrease (down by 38 per cent), followed by South Australia (down 29 per cent), Seacare and the Northern Territory (down 19 per cent each), and Victoria (down 12 per cent). Preliminary data show that Seacare recorded the highest incidence rate of serious claims in 2017–18 with 17.3 claims per 1,000 employees, while the Australian Government recorded the lowest rate with 3.9 claims per 1,000 employees.
Over the period from 2013–14 to 2016–17, New Zealand recorded a 16 per cent increase in the incidence rate of serious claims, increasing from 11.7 to 13.6 claims per 1,000 employees. Preliminary data show the New Zealand incidence rate has increased slightly to 14.1 serious claims per 1,000 employees in 2017–18.

9
1.2 Frequency rate
Indicator 2 shows that the overall Australian frequency rate of serious claims decreased by 8 per cent from 6.2 claims per million hours worked in 2013–14 to 5.7 in 2016–17. Preliminary data show that the Australian frequency rate of serious claims has decreased slightly to 5.5 claims per million hours worked in 2017–18. Although the frequency rate data show a similar level of improvement to incidence rates across jurisdictions, there are differences in the ranking of jurisdictions. Tasmania recorded the highest frequency rate at 7.6 claims per one million hours worked in 2017–18. Seacare only had the fourth highest frequency rate due to the 24-hour basis on which its frequency rates are calculated. Refer to Note 1 in Appendix 1 – Explanatory notes for further information.
Indicator 2 – Frequency rates of serious injury claims by jurisdiction
1.3 Long term incidence and frequency rates
Indicator 3 shows that the incidence rate of long term (12 weeks or more compensation) injury and disease claims in Australia decreased by 9 per cent between 2013–14 and 2016–17. While the preliminary 2017–18 results show a further decrease in the incidence rate compared to the previous year, this data should be treated with caution as a proportion of claims from the preliminary year are likely to be still open and claimants may accrue more time lost or compensation payments in subsequent years. On average, 32 per cent of serious claims resulted in 12 or more weeks of compensation over the five-year period.
All Australian jurisdictions, except for the Australian Capital Territory (up 3 per cent) and Queensland (unchanged), recorded a decrease in incidence rates of long term claims over the period from 2013–14 to 2016–17. The Australian Government recorded the highest decrease in the long term incidence rate (down by 41 per cent) over the period, followed by South Australia (down 39 per cent), Seacare (down 14 per cent), and the Northern territory (down 11 per cent).
New Zealand recorded a 13 per cent increase over this period, however, its rate remains lower than that of Australia.
10
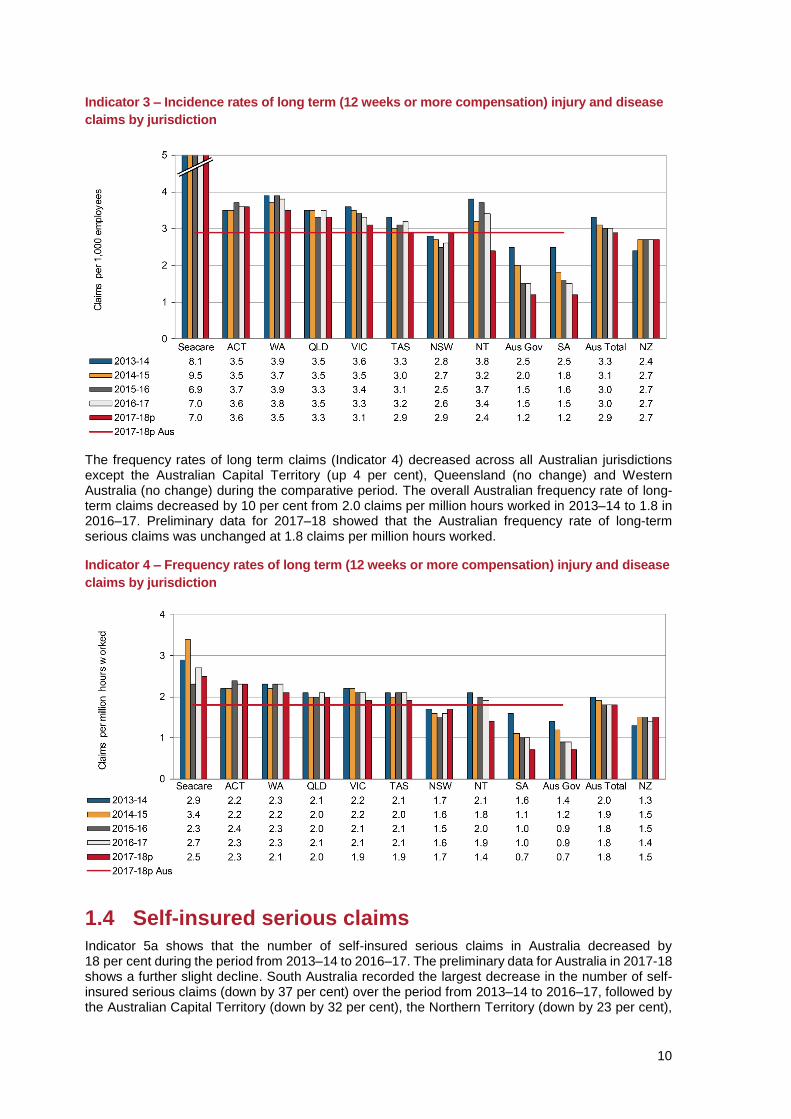
Indicator 3 – Incidence rates of long term (12 weeks or more compensation) injury and disease
claims by jurisdiction
The frequency rates of long term claims (Indicator 4) decreased across all Australian jurisdictions except the Australian Capital Territory (up 4 per cent), Queensland (no change) and Western Australia (no change) during the comparative period. The overall Australian frequency rate of long-term claims decreased by 10 per cent from 2.0 claims per million hours worked in 2013–14 to 1.8 in 2016–17. Preliminary data for 2017–18 showed that the Australian frequency rate of long-term serious claims was unchanged at 1.8 claims per million hours worked.
Indicator 4 – Frequency rates of long term (12 weeks or more compensation) injury and disease
claims by jurisdiction
1.4 Self-insured serious claims
Indicator 5a shows that the number of self-insured serious claims in Australia decreased by 18 per cent during the period from 2013–14 to 2016–17. The preliminary data for Australia in 2017-18 shows a further slight decline. South Australia recorded the largest decrease in the number of self-insured serious claims (down by 37 per cent) over the period from 2013–14 to 2016–17, followed by the Australian Capital Territory (down by 32 per cent), the Northern Territory (down by 23 per cent),
11
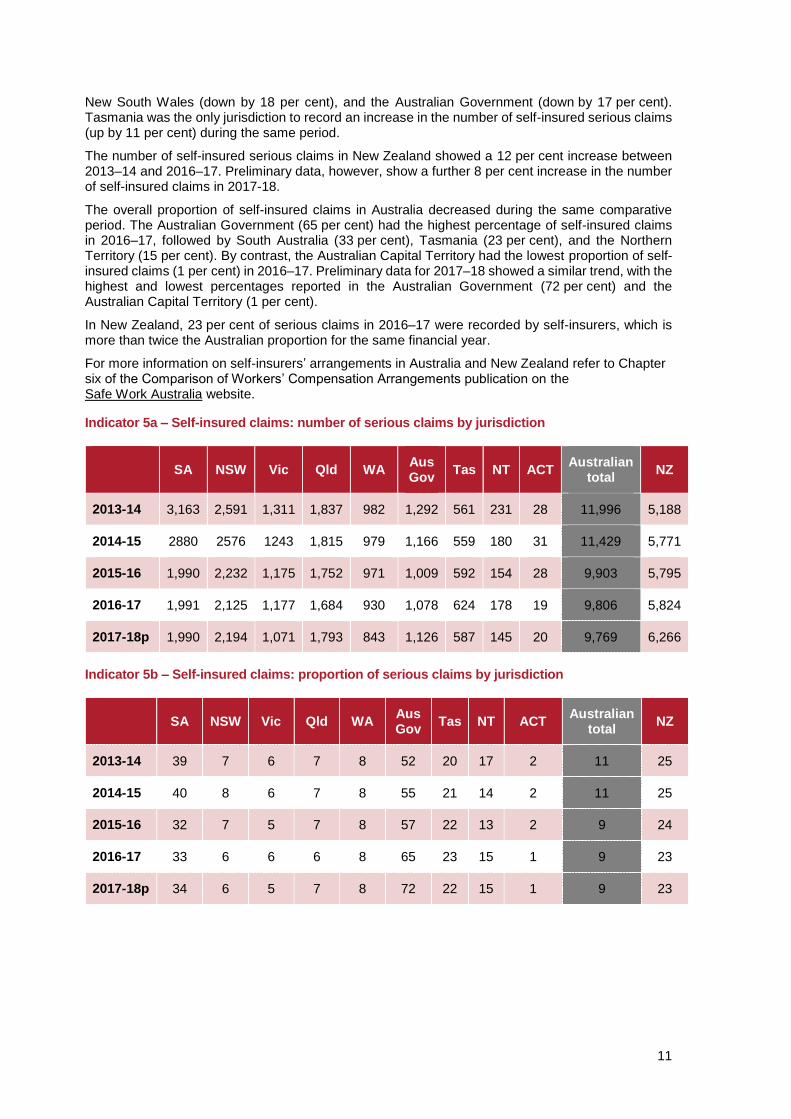
New South Wales (down by 18 per cent), and the Australian Government (down by 17 per cent). Tasmania was the only jurisdiction to record an increase in the number of self-insured serious claims (up by 11 per cent) during the same period.
The number of self-insured serious claims in New Zealand showed a 12 per cent increase between 2013–14 and 2016–17. Preliminary data, however, show a further 8 per cent increase in the number of self-insured claims in 2017-18.
The overall proportion of self-insured claims in Australia decreased during the same comparative period. The Australian Government (65 per cent) had the highest percentage of self-insured claims in 2016–17, followed by South Australia (33 per cent), Tasmania (23 per cent), and the Northern Territory (15 per cent). By contrast, the Australian Capital Territory had the lowest proportion of self-insured claims (1 per cent) in 2016–17. Preliminary data for 2017–18 showed a similar trend, with the highest and lowest percentages reported in the Australian Government (72 per cent) and the Australian Capital Territory (1 per cent).
In New Zealand, 23 per cent of serious claims in 2016–17 were recorded by self-insurers, which is more than twice the Australian proportion for the same financial year.
For more information on self-insurers’ arrangements in Australia and New Zealand refer to Chapter six of the Comparison of Workers’ Compensation Arrangements publication on the Safe Work Australia website.
Indicator 5a – Self-insured claims: number of serious claims by jurisdiction
SA NSW Vic Qld WA
Aus Gov
Tas NT ACT Australian
total NZ
2013-14 3,163 2,591 1,311 1,837 982 1,292 561 231 28 11,996 5,188
2014-15 2880 2576 1243 1,815 979 1,166 559 180 31 11,429 5,771
2015-16 1,990 2,232 1,175 1,752 971 1,009 592 154 28 9,903 5,795
2016-17 1,991 2,125 1,177 1,684 930 1,078 624 178 19 9,806 5,824
2017-18p 1,990 2,194 1,071 1,793 843 1,126 587 145 20 9,769 6,266
Indicator 5b – Self-insured claims: proportion of serious claims by jurisdiction
SA NSW Vic Qld WA
Aus Gov
Tas NT ACT Australian
total NZ
2013-14 39 7 6 7 8 52 20 17 2 11 25
2014-15 40 8 6 7 8 55 21 14 2 11 25
2015-16 32 7 5 7 8 57 22 13 2 9 24
2016-17 33 6 6 6 8 65 23 15 1 9 23
2017-18p 34 6 5 7 8 72 22 15 1 9 23

12
2. Duration of absence The duration of absence associated with claims provides an indication of the severity of injuries and diseases occurring in Australia. Indicator 6 shows the variation in the percentage of claims involving selected periods of compensation across the jurisdictions. These data are based on claims lodged in 2015–16, which is the most recent year that reliable data are available for this indicator.
Indicator 6 shows that 52 per cent of claims in Australia resulted in less than six weeks of compensation. The jurisdictional rates ranged between 65 per cent for South Australia to 23 per cent for Seacare.
Victoria had the highest percentage of claims that continued past 52 weeks of compensation (18 per cent of claims), followed by the Northern Territory and Seacare (14 per cent each), Western Australia (13 per cent), and Australian Capital Territory and Australian Government (10 per cent each). South Australia had the lowest percentage (3 per cent) of claims continuing past 52 weeks of compensation.
The New Zealand scheme finalised 66 per cent of claims within six weeks, which is considerably higher than the Australian average (52 per cent of claims).
Indicator 6 – Serious claims: Percentage involving selected periods of compensation, 2015–16
Jurisdiction less than 6 weeks
6 weeks or more
12 weeks or more
26 weeks or more
52 weeks or more
New South Wales 58 42 26 15 9
Victoria 40 60 44 29 18
Queensland 54 46 29 14 5
South Australia 65 35 19 8 3
Western Australia 45 55 39 23 13
Tasmania 57 43 26 14 7
Northern Territory 41 59 41 25 14
Australian Capital Territory 48 52 35 19 10
Australian Government 48 52 33 18 10
Seacare 23 77 58 32 14
Australian average 52 48 32 18 10
New Zealand 66 34 20 9 4

13
3. Work-related fatalities
3.1 Work-related traumatic injury fatalities
The data presented in this section are sourced from the Work-related Traumatic Injury Fatality (TIF) data collection. The TIF collection provides the most accurate information on work-related injury fatalities, as the data are sourced from workers’ compensation data, fatality notifications to the various work health and safety authorities and information in the National Coronial Information System (NCIS). Only around 60 per cent of work-related fatalities recorded in the TIF collection are typically compensated. This is in part due to self-employed workers not being covered by workers’ compensation schemes. Many self-employed workers work in high risk sectors such as agriculture, transport and construction. Further information about the TIF collection and a detailed analysis of the data can be found on the Safe Work Australia website.
Information presented below in Indicator 7a and 7b does not include fatal work-related incidents occurring on a public road. The compensated injury fatalities in the TIF collection are based on date of death and not date of lodgement.
Indicator 7a shows that there was a 20 per cent decrease in the number of worker fatalities resulting from incidents not on a public road between 2013–14 and 2017–18. Over the five years, on average, New South Wales has recorded the highest number of fatalities per year (39 fatalities), followed by Queensland (32 fatalities) and Victoria (28 fatalities). However, incidence rates over the five year period show that the Northern Territory (2.4 fatalities per 100,000 workers) recorded the highest rate and the Australian Capital Territory (0.7 fatality per 100,000 workers) recorded the lowest rate (Indicator 7b).
It should be noted that traumatic injury fatality data can be volatile year-on-year. In particular, multiple death events can impact the data, despite efforts of jurisdictions in reducing or eliminating work-related traumatic injury fatalities.
Indicator 7a – Traumatic injury worker fatalities: number of incidents not on a public road, by
state of death
2013-14 2014-15 2015-16 2016-17 2017-18 5 yr Average
New South Wales 41 37 36 41 39 39
Queensland 42 25 34 28 29 32
Victoria 31 25 38 23 24 28
Western Australia 20 19 24 11 14 18
South Australia 8 10 9 13 8 10
Tasmania 6 7 5 2 3 5
Northern Territory 5 1 2 2 6 3
Australian Capital Territory 1 u/a u/a 2 u/a 2
Australian total 154 124 148 122 123 134

14
Indicator 7b – Traumatic injury fatalities: incidence rate per 100,000 workers for incidents not
on a public road, by state of death
2013-14 2014-15 2015-16 2016-17 2017-18 5 yr Average
New South Wales 1.1 1.0 1.0 1.1 1.0 1.0
Queensland 1.8 1.1 1.4 1.2 1.2 1.3
Victoria 1.1 0.9 1.3 0.7 0.7 0.9
Western Australia 1.5 1.4 1.8 0.8 1.1 1.3
South Australia 1.0 1.2 1.1 1.6 1.0 1.2
Tasmania 2.6 2.9 2.1 0.8 1.2 1.9
Northern Territory 3.8 0.8 1.5 1.5 4.4 2.4
Australian Capital Territory 0.5 u/a u/a 0.9 u/a 0.7
Australian total 1.3 1.1 1.1 1.2 1.0 1.1
3.2 Work-related disease fatalities
Workers’ compensation data contain some information on disease-related fatalities, but this data is known to understate the number of fatalities from work-related causes. It can be difficult to associate a disease that becomes evident later in life after exposure to a chemical or substance that occurred many years earlier while at work. Some occupational diseases such as asbestosis and mesothelioma are also compensated through separate mechanisms, while many other diseases go unreported and/or uncompensated.
Indicator 8 shows that in 2017–18 there were 50 accepted workers’ compensation claims for work-related fatalities involving an occupational disease in Australia. This number is expected to rise as more claims lodged in 2017–18 are accepted. There was a substantial decrease (down 28 per cent) in the number of compensated fatalities related to occupational diseases in Australia from 2013–14 to 2016–17.
Fatalities are recorded in the National Dataset for Compensation-based Statistics against the date of lodgement of the claim, not the date of death. Data revisions from previous years could occur where a claim is lodged in one year but not accepted until after the data are compiled for that year or for an injury or disease occurring in one year but where the employee dies from that injury or disease in a subsequent year. This is particularly the case with disease-related fatalities where considerable time could elapse between the date of diagnosis leading to a claim being lodged, and the date of death.
The Australian Mesothelioma Registry reports annually on mesothelioma incidence which is available on its reports and publications webpage.

15
Indicator 8 – Compensated fatalities involving occupational diseases by jurisdiction
Jurisdiction 2013-14 2014-15 2015-16 2016-17 2017-18p 5yr
Average
New South Wales 9 10 11 5 6 8
Victoria 12 15 22 8 7 13
Queensland# 16 20 10 10 12 14
Western Australia 6 2 5 3 4 4
South Australia 7 5 6 2 1 4
Tasmania 0 1 1 0 1 1
Northern Territory 0 0 0 0 1 0
Australian Capital Territory
0 1 1 1 0 1
Australian Government 21 14 14 22 17 18
Seacare 0 0 1 0 1 0
Australian total 71 68 71 51 50 62
New Zealand 32 44 27 37 25 33
# The majority of compensated fatalities for occupational diseases in Queensland and the Australian Government are due to mesothelioma or asbestosis. Queensland compensates more of these fatalities through its scheme than is the case in other jurisdictions where compensation is more often sought through separate mechanisms including common law.
4. Claims by size of business (in the private sector) Indicator 9 compares the incidence of serious workers’ compensation claims by size of business in 2013–14 and 2017–18. Six Australian jurisdictions collect compensation data by size of business. Queensland, South Australia and Seacare have been excluded as 2017–18 data breakdown by size of business were unavailable for comparison.
There are differences in the methodologies used by schemes to collect this information and therefore caution should be exercised when making jurisdictional comparisons. This indicator reports on the private sector only and excludes those industry sectors that are wholly or substantially public sector industries (i.e. Public administration and safety, Health care and social assistance, Education and training and Financial and insurance services).
In 2017–18, Australian businesses with 200 or more employees recorded the lowest incidence rate of serious claims (6.2 claims per 1,000 employees). With the exception of the Northern Territory and New South Wales, all jurisdictions recorded the highest incidence rate in businesses with 20−199 employees in 2017–18. Overall, the incidence rate of serious claims in all three business size groups decreased by 10, 8 and 19 per cent respectively between 2013–14 and 2017–18.

16
Indicator 9 – Size of business: incidence rates (claims per 1,000 employees) of serious claims
by jurisdiction (private sector only)*
1–19 employees
20–199 employees
200 or more employees
All employees
2013–14
New South Wales 13.4 12.1 6.4 10.5
Victoria 6.7 12.5 10.0 10.6
Western Australia 9.9 12.5 10.0 10.6
Tasmania 10.9 16.5 10.6 12.3
Northern Territory 23.2 15.6 1.9 13.2
Australian Capital Territory 9.2 15.9 4.9 9.6
Australia** 10.5 12.5 7.7 10.0
2017–18p
New South Wales 12.3 11.0 5.4 9.6
Victoria 5.8 11.6 6.4 7.6
Western Australia 9.0 11.2 8.5 9.4
Tasmania 9.1 15.1 8.0 10.3
Northern Territory 14.8 9.5 1.5 8.4
Australian Capital Territory 9.4 15.4 5.7 9.9
Australia** 9.4 11.5 6.2 8.9
* This indicator shows patterns at two points in time. Selecting different points may show a different pattern.
** Excluding Queensland, Seacare and South Australia.
17
5. Claims by mechanism of incident Claim patterns can be analysed using the Type of Occurrence Classification System (TOOCS), which contains a series of codes providing information on the cause of the incident and the type of injury or disease. Coding for the mechanism of incident is intended to identify the overall action, exposure or event that best describes the circumstances that resulted in the most serious injury or disease. More information on TOOCS can be found on the Safe Work Australia website.
Indicator 10 shows the proportion of serious claims by the mechanism of incident over the past five years. Body stressing accounted for 36.1 per cent of the 107,335 serious claims in 2017–18. Claims due to Mental stress accounted for 7.2 per cent of claims, while claims due to Falls, slips and trips of a person accounted for 23.2 per cent.
Claims arising due to Biological factors (down by 25 per cent) showed the highest reduction in claims between the period 2013–14 and 2016–17, followed by Body stressing (down by 13 per cent) and Chemicals and other substances (down by 11 per cent). However, Mental stress claims increased by 9 per cent during the same reference period.
Indicator 10 – Proportion of serious claims by mechanism of incident
** Other mechanisms of incident include Sound and pressure, Other multiple mechanisms of incident, Roll over, Slide or cave-in and Unspecified mechanisms of incident.

18
5.1 Claims by mechanism of incident and jurisdiction
Presented below is a comparison of the proportion of claims across the Australian jurisdictions for the eight different mechanism of incident groups. Due to the differences in the total number of serious claims across jurisdictions, proportions are a better measure for direct comparison between jurisdictions. Hence, the data reported here are comparisons of the proportion of claims for each mechanism of incident across different jurisdictions. The industry and occupation composition of each jurisdiction, however, can have an influence on the proportion of claims due to different mechanisms and therefore may explain some of the differences between jurisdictions.
Body stressing
Body stressing was the leading mechanism of incident for serious claims between 2013–14 and 2017–18, accounting for 36.1 per cent of the 107,335 serious claims in 2017–18.
Indicator 10a shows that in 2017–18 Seacare had the highest proportion of claims (46.1 per cent) involving Body stressing, followed by the Australian Government (41.8 per cent), Tasmania (39.0 per cent), and Western Australia (38.7 per cent). South Australia had the lowest proportion of claims (33.4 per cent) involving Body stressing in 2017–18.
Indicator 10a – Proportion of serious claims involving Body stressing by jurisdiction

19
Falls, trips and slips of a person
Indicator 10b shows the proportion of claims involving Falls, trips and slips of a person by jurisdiction. Falls, trips and slips of a person accounted for 23.2 per cent of serious claims in Australia in 2017–18.
This mechanism of incident was the second leading cause of serious claims across jurisdictions. Seacare recorded the highest proportion of claims (28.1 per cent) in 2017–18 for this mechanism, followed by Western Australia (25.6 per cent). South Australia recorded the lowest proportion of claims (19.5 per cent) for this mechanism, followed by the Australian Government (20.3 per cent).
Indicator 10b – Proportion of serious claims involving Falls, trips and slips of a person
by jurisdiction
Being hit by moving objects
Overall, Being hit by moving objects accounted for 16.0 per cent of serious claims in 2017–18.
The Northern Territory had the highest proportion of serious claims (24.0 per cent) in 2017–18 arising from Being hit by moving objects, followed by Western Australia (20.1 per cent), and Victoria (18.9 per cent). Seacare had the lowest proportion (7.9 per cent) of serious claims involving this mechanism of incident in 2017–18, followed by the Australian Government (8.5 per cent)
Indicator 10c – Proportion of serious claims involving Being hit by moving objects
by jurisdiction

20
Hitting objects with a part of the body
The mechanism of Hitting objects with a part of the body includes incidents where the motion of a person results in hitting (including bumping, cutting, striking, grasping etc.) stationary and/or moving objects (including machines, vehicles, equipment, tools etc.). Indicator 10d shows that New South Wales recorded the highest proportion of serious claims (8.6 per cent) in 2017–18 due to this mechanism, followed by Queensland (8.0 per cent). The Australian Government recorded the lowest proportion of claims (3.1 per cent) for this mechanism, followed by Victoria (4.0 per cent). Nationally, 7.0 per cent of claims were due to this mechanism across Australia in 2017–18.
Indicator 10d – Proportion of serious claims involving Hitting objects with a part of the body
by jurisdiction
Mental stress
The proportion of serious claims due to Mental stress in Australia increased from 5.8 per cent in 2013–14 to 7.2 per cent in 2017–18. The Australian Government had the highest proportion of Mental stress claims (11.8 per cent) in 2017–18, followed by Victoria (9.6 per cent) and New South Wales (9.5 per cent). The Northern Territory recorded the lowest proportion of Mental stress claims in the same year (3.0 per cent), followed by Western Australia (3.1 per cent). There have been fairly substantial increases in the proportion of Mental stress claims in New South Wales, Tasmania, Victoria and Seacare over the period.
Indicator 10e – Proportion of serious claims involving Mental stress by jurisdiction

21
Other mechanisms
Indicator 10f shows the proportions of serious claims involving Other mechanisms of incident. This category includes Biological factors, Chemicals and other substances, Sound and pressure, Other multiple mechanisms of incidents, Roll over, slide or cave-in and Unspecified mechanisms.
South Australia had the highest proportion of claims (18.6 per cent) for this mechanism in 2017–18, followed by Queensland (10.3 per cent) and New South Wales (7.2 per cent). Western Australia and Victoria recorded the lowest proportion of serious claims (1.9 per cent for each) due to this mechanism. On average, 6.8 per cent of serious claims across Australia in 2017–18 were due to this mechanism.
South Australia recorded substantial increase in the proportion of serious claims due to this mechanism in 2015–16 and 2017–18 and Tasmania recorded a substantial increase in 2014–15. These increases were related to the substantial increase in the number of serious claims coded to “Unspecified mechanisms of incident” in these years and may therefore reflect issues with coding rather than significant increases in serious claims related to the specific issues noted above.
Indicator 10f – Proportion of serious claims involving Other mechanisms by jurisdiction
Vehicle incidents
In 2017–18, 2.4 per cent of all serious claims across Australian jurisdictions were due to Vehicle incidents as shown in Indicator 10g. Serious claims due to vehicle incidents cover all claims lodged and accepted for compensation where a vehicle collision was involved in leading to the injuries.
The Australian Government recorded the highest proportion of serious claims (9.7 per cent) due to this mechanism in 2017–18, which was four times the Australian average. This may, in part, be explained by the composition of this jurisdiction leading to lower proportions of claims for other mechanisms. Tasmania had the lowest proportion of claims (1.3 per cent), followed by South Australia (1.7 per cent). Seacare did not report any Vehicle incident related claims in the period.

22
Indicator 10g – Proportion of serious claims involving Vehicle incidents by jurisdiction
Heat, electricity and other environmental factors
Of all the mechanisms of incident, claims associated with Heat, electricity and other environmental factors accounted for the lowest proportion (1.4 per cent) of serious claims in 2017–18. Except for 2016–17, Indicator 10h shows that the proportion of claims has been stable since 2013–14 at 1.4 per cent.
Northern Territory and Western Australia (1.8 per cent each) had the highest proportion of claims due to this mechanism, followed by Tasmania (1.7 per cent). The lowest proportion was reported by the Australian Government (0.8 per cent), followed by Victoria (1.1 per cent) in 2017–18.
Indicator 10h – Proportion of serious claims involving Heat, electricity and other environmental
factors by jurisdiction

23
6. Claims by industry Indicator 11 shows the incidence rates of serious claims in Australia by industry using the Australian and New Zealand Standard Industrial Classification (ANZSIC) 2006 system. Preliminary data show that in 2017–18, the Agriculture, forestry and fishing industry recorded the highest incidence rate with 16.7 serious claims per 1,000 employees, followed by the Manufacturing (15.2), Construction (15.0) and Transport, postal and warehousing (14.7) industries. Under the Australian Work Health and Safety Strategy 2012–2022 these industries together with Accommodation and food services, Public administration and safety, and Health care and social assistance have been identified as national priorities for prevention activities.
Decreases in the incidence rate of serious claims between 2013–14 and 2016–17 were recorded for all industries except Agriculture, forestry and fishing (up 5 per cent), Wholesale trade and Administrative and support services (up 3 per cent each), Electricity, gas, water and waste services (up 2 per cent), and Construction (up 1 per cent). The highest reductions were seen in Financial and insurance services (down 30 per cent), Information, media and telecommunications (down 22 per cent), Public administration and safety (down 18 per cent), Accommodation and food services (down 15 per cent), Transport, postal and warehousing (down 13 per cent) and Health care and social assistance and Mining (down 12 per cent each).
More detailed information on claims by industry can be found in the Australian Workers’ Compensation Statistics report, published on the Safe Work Australia website.

24
Indicator 11 – Incidence rates of serious* claims by industry
* Includes all accepted workers’ compensation claims for an incapacity that results in a total absence from work of one working week or more excluding fatalities and journey claims.

25
6.1 Claims by industry and jurisdiction
This section contains supplementary information to Indicator 11. Presented below is a comparison of the incidence rates of serious claims across the Australian jurisdictions for the 19 industries.
Incidence rates in some industries at the jurisdictional level can be volatile and should be treated with caution. As the number of employees used in calculating incidence rates are estimated from survey samples, readers should be aware that the relative standard errors for estimating the number of employees will be higher with smaller sample sizes. Jurisdictions are not included in the respective charts and analysis where the relative standard error is greater than 50 per cent.
The analysis presented in the text below does not include 2017-18 due to the preliminary nature of the data, however, it is included in the charts.
Agriculture, forestry and fishing
Indicator 11a shows the incidence rates of serious claims for the Agriculture, forestry and fishing industry, which had the highest Australian average (18.8 claims per 1,000 employees) of all industries during 2016–17.
The incidence rates for the Northern Territory should be interpreted with caution due to the large variability of the data.
Of the other jurisdictions, New South Wales recorded the highest incidence rate of serious claims in the Agriculture, forestry and fishing industry (25.1 claims per 1,000 employees) in 2016–17, followed by Queensland (21.7), Western Australia (21.2) and Tasmania (17.0). The lowest incidence rate was recorded in Victoria (11.3 claims per 1,000 employees), followed by South Australia (12.7 claims per 1000 employees).
Indicator 11a – Incidence rates of serious claims for Agriculture, forestry and fishing
by jurisdiction

26
Mining
In 2016–17 the Australian average incidence rate of serious claims in the Mining industry was 9.7 claims per 1,000 employees. With the exception of Victoria, all jurisdictions recorded a decrease in their incidence rates between 2013–14 and 2016–17. The Northern Territory recorded the largest decrease in incidence rate (down 63 per cent), followed by Tasmania (down 24 per cent), and New South Wales (down 21 per cent), then South Australia (down 20 per cent).
Indicator 11b – Incidence rates of serious claims for Mining by jurisdiction
Manufacturing
Indicator 11c shows that between 2013–14 and 2016–17 the majority of jurisdictions recorded a decrease in incidence rates in the Manufacturing industry. The Australian Government recorded the largest decrease (down 37 per cent), followed by South Australia (down 24 per cent). On the other hand, the Northern Territory recorded a 28 per cent increase in incidence rate during the same period. The Australian average incidence rate in 2016–17 was 15.4 claims per 1,000 employees, a 5 per cent decrease from 2013–14. The incidence rates of the Australian Capital Territory and the Australian Government should be interpreted with caution as the relative standard error of the number of employees was between 25 and 50 per cent.
Indicator 11c – Incidence rates of serious claims for Manufacturing by jurisdiction

27
Electricity, gas, water and waste services
Six out of the nine jurisdictions recorded decreases in the incidence rate in the Electricity, gas, water and waste services industry between 2013–14 and 2016–17. The Australian average incidence rate of serious claims in this industry increased by 2 per cent between 2013–14 and 2016–17. The Northern Territory recorded the largest decrease in the incidence rate for this industry (down 75 per cent), followed by South Australia (down 51 per cent), then Tasmania (down 32 per cent). In contrast, Western Australia recorded a 49 per cent increase, followed by Queensland (up 35 per cent). The incidence rates of the Australian Capital Territory should be interpreted with caution as the relative standard error of the number of employees was between 25 and 50 per cent.
Indicator 11d – Incidence rates of serious claims for Electricity, gas, water and waste services
by jurisdiction
Construction
Indicator 11e shows that the Australian average incidence rate for the Construction industry increased by 1 per cent between 2013–14 and 2016–17. The Australian Government recorded the largest decrease (down 61 per cent), followed by South Australia (down 27 per cent) and Tasmania (down 17 per cent). The Australian Capital Territory recorded an 80 per cent increase in the incidence rate of this industry during the same reference period. However, incidence rates of the Australian Capital Territory and the Australian Government should be interpreted with caution as the relative standard error of the number of employees was between 25 and 50 per cent
Indicator 11e – Incidence rates of serious claims for Construction by jurisdiction

28
Wholesale trade
Between 2013–14 and 2016–17 the Australian average incidence rate for the Wholesale trade industry increased by 3 per cent, from 12.3 claims per 1,000 employees to 12.7. Tasmania recorded the largest decrease in the incidence rate (down 43 per cent) between 2013–14 and 2016–17, followed by the Northern Territory (down 40 per cent) and Western Australia (down 16 per cent). In contrast, New South Wales recorded a 13 per cent increase and Victoria recorded a 6 per cent increase in their incidence rates for this industry between 2013–14 and 2016–17.
Queensland had the highest incidence rate of claims in 2016–17 (17.5 claims per 1,000 employees) followed by Victoria (12.4 claims per 1,000 employees). The lowest incidence rate was recorded by the Northern Territory (5.0 claims per 1,000 employees). The incidence rates of the Australian Capital Territory should be interpreted with caution as the relative standard error of the number of employees was between 25 and 50 per cent.
Indicator 11f – Incidence rates of serious claims for Wholesale trade by jurisdiction

29
Retail trade
Indicator 11g shows that the Australian average incidence rate of serious claims in the Retail trade industry decreased by 9 per cent between 2013–14 and 2016–17. South Australia recorded a substantial decrease (down 27 per cent) over the same period, followed by Victoria (down 19 per cent), and the Australian Capital Territory (down 18 per cent).
Indicator 11g – Incidence rates of serious claims for Retail trade by jurisdiction
Accommodation and food services
Indicator 11h shows that the Australian average incidence rate for the Accommodation and food services industry was 7.1 serious claims per 1,000 employees in 2016–17, down 15 per cent since 2013–14. All but two jurisdictions recorded a decrease in their incidence rates for this industry over the period. The Australian Government did not have any reportable claims in 2014–15, 2016–17 and 2017–18. The incidence rates of the Australian Capital Territory and the Australian Government should be interpreted with caution as the relative standard error of the number of employees was between 25 and 50 per cent. Tasmania recorded an 8 per cent increase between 2013–14 and 2016–17.
Indicator 11h – Incidence rates of serious claims for Accommodation and food services
by jurisdiction

30
Transport, postal and warehousing
Indicator 11i shows that the Australian average incidence rate for this industry was 15.3 serious claims per 1,000 employees in 2016–17, down by 13 per cent since 2013–14. All jurisdictions have recorded a decrease in their incidence rates during this period, ranging between 3 per cent in Tasmania and 30 per cent in the Australian Government. The incidence rates for Seacare were not reported due to the high relative standard error (greater than 50 per cent). The incidence rates of the Australian Capital Territory should be interpreted with caution as the relative standard error of the number of employees was between 25 and 50 per cent.
Indicator 11i – Incidence rates of serious claims for Transport, postal and warehousing
by jurisdiction
Information, media and telecommunications
Indicator 11j shows the Australian average incidence rates of serious claims for the Information, media and telecommunications industry in 2016–17 was 2.8 claims per 1,000 employees. The incidence rates of the Australian Capital Territory and the Northern Territory should be interpreted with caution as the relative standard error of the number of employees were between 25 and 50 per cent. Of the other jurisdictions, South Australia recorded the largest decrease (down 71 per cent) between 2013–14 and 2016–17, followed by the Australian Government (down 49 per cent), and Western Australia (down 43 per cent). Victoria was the only jurisdiction to record an increase (up 30 per cent) in the incidence rate for this industry during the same period.
Indicator 11j – Incidence rates of serious claims for Information, media and telecommunications
by jurisdiction

31
Financial and insurance services
The Australian average incidence rate for the Financial and insurance services industry in 2016–17 was 1.4 claims per 1,000 employees (Indicator 11k), the lowest average incidence rate of serious claims among all industries. While, all jurisdictions recorded a decrease in their incidence rate for this industry, the incidence rates of the Australian Capital Territory should be interpreted with caution as the relative standard error of the number of employees was between 25 and 50 per cent. Other than the Australian Capital Territory, Tasmania recorded the largest decrease (down 58 per cent) in the incidence rate for this industry between 2013–14 and 2016–17, followed by South Australia and the Northern Territory (down 46 per cent each).
Indicator 11k – Incidence rates of serious claims for Financial and insurance services
by jurisdiction
Rental, hiring and real estate services
Indicator 11l shows that the Australian average incidence rate for the Rental, hiring and real estate services industry was 5.0 claims per 1,000 employees in 2016–17. South Australia recorded the largest decrease (down 61 per cent) between 2013–14 and 2016–17, followed by Tasmania (down 42 per cent) and the Northern Territory (down 37 per cent). The incidence rates of the Australian Capital Territory and the Australian Government should be interpreted with caution as the relative standard error of the number of employees was between 25 and 50 per cent.
Indicator 11l – Incidence rates of serious claims for Rental, hiring and real estate services
by jurisdiction

32
Professional, scientific and technical services
All jurisdictions recorded decreases in the incidence rate of serious claims for the Professional, scientific and technical services industry between 2013–14 and 2016–17 (Indicator 11m). The largest decrease was recorded by the Northern Territory (down 40 per cent), followed by South Australia (down 21 per cent). The Professional, scientific and technical services industry had the second lowest incidence rate overall in 2016–17 (1.9 claims per 1,000 employees) when compared to all other industries.
The incidence rates of the Australian Capital Territory were not reported here due to the high relative standard error (greater than 50 per cent).
Indicator 11m – Incidence rates of serious claims for Professional, scientific and technical
services by jurisdiction
Administrative and support services
Indicator 11n shows that the Australian average incidence rate in the Administrative and support services industry was 10.0 serious claims per 1,000 employees in 2016–17. South Australia (5.4 claims per 1,000 employees) had the lowest incidence rate in 2016–17, followed by Western Australia (5.7 per cent). The Northern Territory recorded the largest decrease (down 20 per cent) in the incidence rate between 2013–14 and 2016–17, followed by South Australia (down 18 per cent) and New South Wales (down 10 per cent). Readers should be aware that the Australian Government has not reported any claims for this industry for the reference period.
The incidence rates of the Australian Capital Territory increased by 64 per cent during the same reference period, however, these rates should be interpreted with caution as the relative standard error of the number of employees was between 25 and 50 per cent.

33
Indicator 11n – Incidence rates of serious claims for Administrative and support services
by jurisdiction
Public administration and safety
Indicator 11o shows that the Australian average incidence rate of serious claims in the Public administration and safety industry was 10.6 claims per 1,000 employees in 2016–17, down from 13.0 claims per 1,000 employees in 2013–14. All jurisdictions except Western Australia (up 21 per cent) and the Australian Capital Territory (up 19 per cent) showed a decrease in the incidence rate of claims between 2013–14 and 2016–17. The incidence rates of the Australian Capital Territory should be interpreted with caution as the relative standard error of the number of employees were between 25 and 50 per cent. The Australian Government recorded the largest decrease in incidence rate between 2013–14 and 2016–17 (down 53 per cent), followed by South Australia (down 29 per cent) and New South Wales (down 23 per cent).
Indicator 11o – Incidence rates of serious claims for Public administration and safety
by jurisdiction

34
Education and training
Indicator 11p shows that the Australian average incidence rate for the Education and training industry was 6.6 serious claims per 1,000 employees in 2016–17, a 3 per cent decrease since 2013–14. The Australian Government recorded the largest decrease (down 59 per cent), followed by the Northern Territory (down 44 per cent) and South Australia (down 14 per cent). The incidence rate increased in the Australian Capital Territory (up 11 per cent), Tasmania (up 7 per cent), Western Australia (up 6 per cent) and New South Wales (up 3 per cent) over the same period. The incidence rates of the Australian Capital Territory, however, should be interpreted with caution as the relative standard error of the number of employees were between 25 and 50 per cent.
Indicator 11p – Incidence rates of serious claims for Education and training by jurisdiction
Healthcare and social assistance
The Australian average incidence rate of serious claims in the Healthcare and social assistance industry in 2016–17 was 11.0 claims per 1,000 employees; 12 per cent lower than in 2013–14. The Australian Government recorded the largest decrease (down 43 per cent) in the incidence rates for the industry between 2013–14 and 2016–17, followed by South Australia (down 31 per cent) and the Northern Territory (down 17 per cent).
Indicator 11q – Incidence rates of serious claims for Healthcare and social assistance
by jurisdiction

35
Arts and recreation services
The Australian average incidence rate for the Arts and recreation services industry fell by 7 per cent from 11.7 claims per 1,000 employees in 2013–14 to 10.1 claims per 1,000 employees in 2016–17. The incidence rates for the Australian Capital Territory were not reported due to the high relative standard error (greater than 50 per cent) of the number of employees. The incidence rates of the Australian Government should be interpreted with caution as the relative standard error of the number of employees was between 25 and 50 per cent.
Of the other jurisdictions, Western Australia recorded the largest decrease (down 33 per cent), followed by Tasmania (down 31 per cent), and South Australia (down 19 per cent). In contrast, Queensland recorded the only increase (up 4 per cent) between 2013–14 and 2016–17.
Indicator 11r – Incidence rates of serious claims for Arts and recreation services by jurisdiction

36
Other services
Indicator 11s shows that the Australian average incidence rate of serious claims in the Other services industry decreased by 15 per cent between 2013–14 and 2016–17. The incidence rates of the Australian Capital Territory should be interpreted with caution as the relative standard error of the number of employees were between 25 and 50 per cent. The Australian Government data are not reported due to the high relative standard error (greater than 50 per cent) in the employee numbers.
Of the other jurisdictions, the Northern Territory recorded the largest decrease (down 32 per cent), followed by South Australia (down 25 per cent), New South Wales (down 22 per cent) and Tasmania and Victoria (down 14 per cent each). Queensland recorded a 4 per cent increase in the incidence rate of this industry during the same reference period.
Indicator 11s – Incidence rates of serious claims for Other services by jurisdiction

37
Appendix 1 — Explanatory notes
Workers’ compensation claims data
Scope
The data presented in this report are extracted from the National Data Set for Compensation-based Statistics (NDS), which is compiled annually from claims made under state, territory and Commonwealth workers’ compensation Acts. The New Zealand Accident Compensation Corporation (ACC) also collects data in accordance with the NDS.
Definition of a serious claim: Under the definition, a serious claim is a workers’ compensation claim for an incapacity that results in a total absence from work of one working week or more. Claims excluded from this definition include those arising from a work-related fatality or a journey to or from work or during a recess period. One working week is defined as lost when the number of hours lost is greater than or equal to the number of hours usually worked per week.
The data in this report do not cover all cases of occupational injury and diseases as workers’ compensation generally covers employees only. Therefore many contractors and self-employed workers are not represented by these data. The exclusion of self-employed persons is likely to result in an underestimate of the number of cases in industries where self-employed persons are common, such as Agriculture, forestry and fishing, Construction, Transport, postal and warehousing – Road transport, Administrative and support services and Arts and recreation services. However, the incidence and frequency rates shown in this report for all industries can be considered to be reliable, as the denominators used in the calculation of the rates have been adjusted to exclude self-employed persons.
In addition, the following have been excluded from the data in this report:
occupational injuries and diseases resulting in absences from work of less than one working week
military personnel within the Defence force
cases not claimed as workers’ compensation or not acknowledged as being work-related, and
claims for compensation to the Dust Diseases Authority of New South Wales.
Australian Government employees working in each jurisdiction have been included in Australian Government figures rather than state or territory results. The Australian Capital Territory Public Service employees are covered by the Comcare scheme but operate under the work health and safety provisions of the Australian Capital Territory. These employees and their claims have been combined with the Australian Capital Territory private sector employees for reporting outcomes in this report.
Reporting on fatalities: Similar to the previous edition, this edition sources information from the traumatic injury fatalities (TIF) collection. The TIF collection provides the most accurate information on work-related injury fatalities since the data are sourced from workers’ compensation data, fatality notifications to the various work health and safety authorities and information in the National Coronial Information System (NCIS). Only around 60 per cent of work-related fatalities recorded in the TIF collection are typically compensated. This is in part due to self-employed workers not being covered by workers’ compensation schemes. Many self-employed workers work in high risk sectors such as agriculture, transport and construction. Further information about the TIF collection and a detailed analysis of the data can be found in the Work-Related Traumatic Injury Fatalities report published on the Safe Work Australia website.
There is no change to the source of information on disease-related fatalities in this edition of the CPM. This information is only available through the NDS.

38
The following table (Appendix 1 – Table 1) shows the preliminary number of serious claims, an estimate of the number of employees in each jurisdiction, and an estimate of the number of hours worked in each jurisdiction in 2016–17. Please note that the number of serious claims shown for Victoria includes adjustment factors that are explained later in this section. The figures for employee and hours worked in Appendix 1 – Table 1 are those that have been used to calculate the incidence and frequency rates in this report. Please note that the number of claims shown will increase when updated information is provided by the jurisdictions for the next edition of the report.
Appendix 1 – Table 1: Summary of key jurisdictional data, 2017–18
Jurisdiction Serious claims
Per cent of
claims Employees
Per cent of employees
Hours worked
Per cent of
hours worked
New South Wales 34,860 32.5 3,611,820 30.6 6,030,075,710 30.9
Victoria 21,720 20.2 2,967,420 25.1 4,774,085,450 24.5
Queensland 26,700 24.9 2,279,300 19.3 3,808,143,740 19.5
Western Australia 11,180 10.4 1,230,160 10.4 2,071,714,260 10.6
South Australia 5,900 5.5 768,210 6.5 1,224,759,140 6.3
Tasmania 2,630 2.5 227,060 1.9 345,089,680 1.8
Northern Territory 960 0.9 141,380 1.2 251,653,680 1.3
Australian Capital Territory
1,730 1.6 172,440 1.5 273,839,830 1.4
Australian Government
1,570 1.5 405,230 3.4 717,404,050 3.7
Seacare 90 0.1 5,140 0.0 14,260,410 0.1
Australian total 107,340 100.0 11808170 100.0 19,511,025,940 100.0
Time series and adjustment of scheme data
The estimates of the number of employees and their hours worked for Australia are supplied by the Australian Bureau of Statistics and these denominator data are based on the Labour Force Survey, the Survey of Employment and Earnings and data provided by Comcare. Further adjustments are performed using data from the Census, the Forms of Employment Survey and the Survey of Employment Arrangements, Retirement and Superannuation. These data are matched to the scope of the claims data but may not be exact, particularly in the smaller jurisdictions, due to the number of employees being derived from a survey of the population rather than a census.
The New Zealand employment data used has been sourced from the New Zealand census information.
Incidence and frequency rates, especially for the most recent years, are expected to rise as the number of accepted claims increases as a result of further data development. This may involve additional claims being accepted or shorter-term claims with temporary incapacity incurring additional time lost and subsequently matching the definition of a serious claim: one that involves one or more working weeks of time lost.
Claims data shown in this report for 2017–18 are preliminary unless otherwise stated. Therefore these data are likely to be understated and a comparison of 2017–18 data with those of previous years should be undertaken with caution.
In analysing trends over time, consideration needs to be given to any changes to jurisdiction-specific legislation and administrative processes during the period concerned, further details of which should

39
be sought from the jurisdictions. Any commentary relating to these comparisons should be interpreted carefully, where provided.
Frequency rates for the Seacare scheme have been calculated using a 24-hour basis. This is in recognition of the 24-hour risk of exposure to workplace hazards due to the nature of employment in the maritime industry. This definition is consistent with data published by the Seacare Authority.
Due to difficulties obtaining time lost in hours for the Northern Territory, data have been estimated using the definition of a working week of five working days. To enable comparison of the data reported for the Northern Territory and data reported for all other jurisdictions, the data for the Northern Territory has been increased by a factor of 1.3 per cent.
Definition of injury and disease
Occupational injuries are defined as all employment-related injuries that are the result of a single traumatic event, occurring while a person is on duty or during a recess period at the workplace, and where there was a short or non-existent latency period. This includes injuries that are the result of a single exposure to an agent(s) causing an acute toxic effect.
Occupational diseases are defined as all employment-related diseases that result from repeated or long-term exposure to an agent(s) or event(s), or that are the result of a single event resulting in a disease (for example, the development of hepatitis following a single exposure to the infection).
In this report, the injuries data also include claims for musculoskeletal disorders (MSD). This change was necessitated by the introduction of a new coding system in Victoria in 2002–03 that resulted in a large number of claims previously coded as sprains and strains (injuries) being coded as diseases of the musculoskeletal system and connective tissue. This more accurately reflects the repetitive and long term muscle stress that results in these conditions. To minimise the effect of this coding change on time series consistency, musculoskeletal disorders have been combined with the data on injuries for all years and all jurisdictions in this report. A similar change in coding practices across all other jurisdictions occurred progressively from 2005–06 as the 3rd edition of the Type of Occurrence Classification Scheme (TOOCS) was introduced in each jurisdiction.
Adjustment of Victorian data
Only claims involving one or more weeks of compensation have been used for analysis in Part 1 of the CPM, to enable greater comparability in the jurisdictional data. This accounts for the different employer excesses that exist in various schemes. Under the Victorian workers’ compensation scheme the employer is generally liable for the first 10 days of lost wages by the injured worker. In addition to this, Victorian employers pay the first $692 of medical services (for the year 2017-18 – indexed annually) unless the employer `has elected the Excess Buyout option. Please refer to WorkSafe Victoria’s website for more information on the Excess Buyout option.
As employers do not always provide WorkSafe Victoria with information on claims lasting fewer than 10 days, an adjustment factor needs to be applied in order to compare Victorian claims data with other jurisdictions. To calculate the Victorian under-10-days excess impact, the percentage of claims between one and two weeks duration for Victoria were compared with the percentage of one to two weeks claims for other Australian jurisdictions. From this comparison, the number of Victorian claims between one and two weeks were increased by a factor so that the percentage of such claims was similar to the Australian average. The analysis was undertaken at the industry division level to allow for a greater degree of homogeneity in respect of claim duration in Victoria. The application of the factors has increased claims supplied by WorkSafe Victoria by 13 per cent (from 19,170 to 21,716) in 2017–18.
Changes to South Australian data
Safe Work Australia conducted a review of the methodology used to calculate South Australian under-10-days excess factors. Following the review it was found that the claim numbers after factoring did not accurately represent the South Australian claims. Hence the excess factors for South Australian
40
claims were not applied in this edition of the CPM, which includes claims data from 2013–14 to 2017-18. This change means that the incidence and frequency rates reported for South Australia and the Australian average will differ to those previously published.
Size of business
The number of employees in each of the three business size groups has been provided by the ABS. Estimates of employment figures by ‘Small: less than 20 employees’, ‘Medium: 20–199 employees’ and ‘Large: 200 employees or more’ business size groups published in the ‘Australian Industry’ publication (ABS cat. No. 8155.0) were used. These estimates were produced annually using a combination of data directly collected from the annual Economic Activity Survey (EAS) conducted by the ABS and Business Activity Statement (BAS) data provided by businesses to the Australian Taxation Office (ATO). As figures in this publication are for ‘Employment’, the ABS Labour Force data were also used in order to be able to exclude self-employed persons from the ‘Australian Industry’ figures.
The scope and coverage of these estimates are for the private sector only, which consists of all business entities in the Australian economy except for entities classified as general Government. Data on the number of claims are collected in each jurisdiction by a variety of methods, some via the claim form and others by imputing estimates from the data supplied by employers.

41
Appendix 2 – Jurisdictional contact information
Appendix 2 – Table 1: Jurisdictional contact information
Jurisdiction Organisation Contact details
New South Wales State Insurance Regulatory Authority
SafeWork NSW
Customer Service Centre
www.sira.nsw.gov.au
www.safework.nsw.gov.au
13 10 50
Victoria WorkSafe Victoria Advisory Service 1800 136 089
www.worksafe.vic.gov.au
Queensland Workplace Health and Safety Queensland – Office of Industrial Relations – Education Queensland
Infoline 1300 362 128
www.worksafe.qld.gov.au
Western Australia WorkCover WA
Department of Mines, Industry Regulation and Safety– WorkSafe
(08) 9388 5555
www.workcover.wa.gov.au
1300 307 877
www.dmirs.wa.gov.au
South Australia ReturnToWorkSA
SafeWork SA
13 18 55
www.rtwsa.com
1300 365 255
www.safework.sa.gov.au
Tasmania WorkSafe Tasmania Helpline
1300 366 322 (inside Tas)
(03) 6166 4600 (outside Tas)
www.worksafe.tas.gov.au
Northern Territory NT WorkSafe 1800 019 115
www.worksafe.nt.gov.au
Australian Capital Territory Access Canberra WorkSafe ACT within Chief Minister Treasury and Economic Development Directorate
(02) 6207 3000
www.worksafe.act.gov.au
Seafarers Seacare Authority (02) 6275 0070
www.seacare.gov.au
Australian Government Comcare 1300 366 979
www.comcare.gov.au
New Zealand Accident Compensation Corporation 64 7 848 7400
www.acc.co.nz