COMPANY UPDATE 20 MAR 2017 Voltas - Business...
13
COMPANY UPDATE 20 MAR 2017 Voltas BUY Read the fine print A recent interaction with distributors of air- conditioners (ACs) gave us a fresh perspective on the industry, including the prevalent competition and demand environment for the summer. We came to understand that the buzz around LG’s low- priced inverter ACs is a bit hyped, as these are fitted with cheaper alloy condenser coils, which are not actively pushed by retailers. The copper-fitted ACs (1 ton) are sold at ~Rs 33,000 only in a few LG brand outlets, under a limited-period offers, though MBOs are selling them at ~Rs 37,500. Though household demand is slowly picking up (in the last 2-3 weeks), that from institutional customers continues be subdued. Demand is weak in the north, primarily on account of low temperatures, rather than demonetisation. With the onset of summer, distributors expect strong volume growth across India. Growth in demand in the western region is expected to touch ~15% this summer (could be even higher in case of a harsh summer, given the draught across the Deccan). As mentioned later in this report, the AC market is highly underpenetrated at 8.2%, (especially when compared to discretionary categories like cars). This provides multi-year growth prospects for Voltas (VOLT). While the market share in this category could vary each year, VOLT’s strong distribution, branding and attractive price points should enable it to maintain its leadership in a largely price- sensitive market like India. We reiterate a BUY with higher SOTP-based TP of Rs 462/sh (valuing EMPS/EPS/UCP at FY19E P/E of 10/20/30x). Key highlights Competition manageable: Our channel check reveals that LG’s low-priced inverter AC (alloy condenser coils) is not finding flavour among dealers in the western region. These are also available on the online platform for ~Rs 31,500, but with limited volumes on offer and region-wise dynamic pricing. Daikin and Hitachi lead in inverter ACs: Premium brands continue to command market share in the inverter AC segment (less price sensitive), despite LG’s competitive pricing strategy. Cost dynamics still favour fixed speed ACs: The inverter AC is costlier by Rs 5,000-5,500, as compared to the 5-star fixed speed AC. In our view, it would take ~3 years for energy savings to offset higher upfront costs of inverter ACs (calculations detailed in the note). Fixed speed ACs would continue to dominate the market, which would be a positive for players like VOLT. Financial Summary - Consolidated Rs mn FY15 FY16 FY17E FY18E FY19E Net Sales 51,831 58,574 59,603 67,580 75,460 EBITDA 4,100 4,369 5,314 6,256 7,254 APAT 3,496 3,567 4,385 5,044 5,839 EPS (Rs) 10.6 10.8 13.3 15.3 17.7 P/E(x) 36.9 36.2 29.4 25.6 22.1 EV / EBITDA (x) 28.7 26.4 21.6 18.0 15.2 ROE (%) 17.8 15.9 17.2 17.4 17.8 Source: Company, HDFC sec Inst Research INDUSTRY CAPITAL GOODS CMP (As on 20 Mar 17) Rs 390 Target Price Rs 462 Nifty 9,127 Sensex 29,519 KEY STOCK DATA Bloomberg VOLT IN No. of Shares (mn) 331 MCap (Rs bn) / ($ mn) 129/1,975 6m avg traded value (Rs mn) 530 STOCK PERFORMANCE (%) 52 Week high / low Rs 406/262 3M 6M 12M Absolute (%) 26.6 2.0 45.0 Relative (%) 14.4 (1.5) 26.7 SHAREHOLDING PATTERN (%) Promoters 30.30 FIs & Local MFs 26.87 FPI 22.37 Public & Others 20.46 Source : BSE Pawan Parakh, CFA [email protected] +91-22-6171-7314 Ashutosh Mehta, ACA [email protected] +91-22-3078-8241 HDFC securities Institutional Research is also available on Bloomberg HSLB <GO>
Transcript of COMPANY UPDATE 20 MAR 2017 Voltas - Business...
COMPANY UPDATE 20 MAR 2017
Voltas BUY
Read the fine printA recent interaction with distributors of air-conditioners (ACs) gave us a fresh perspective on the industry, including the prevalent competition and demand environment for the summer. We came to understand that the buzz around LG’s low-priced inverter ACs is a bit hyped, as these are fitted with cheaper alloy condenser coils, which are not actively pushed by retailers. The copper-fitted ACs (1 ton) are sold at ~Rs 33,000 only in a few LG brand outlets, under a limited-period offers, though MBOs are selling them at ~Rs 37,500.
Though household demand is slowly picking up (in the last 2-3 weeks), that from institutional customers continues be subdued. Demand is weak in the north, primarily on account of low temperatures, rather than demonetisation. With the onset of summer, distributors expect strong volume growth across India. Growth in demand in the western region is expected to touch ~15% this summer (could be even higher in case of a harsh summer, given the draught across the Deccan).
As mentioned later in this report, the AC market is highly underpenetrated at 8.2%, (especially when compared to discretionary categories like cars). This provides multi-year growth prospects for Voltas (VOLT). While the market share in this category could vary each year, VOLT’s strong distribution, branding and attractive price points should enable it to maintain its leadership in a largely price-sensitive market like India. We reiterate a BUY with
higher SOTP-based TP of Rs 462/sh (valuing EMPS/EPS/UCP at FY19E P/E of 10/20/30x).
Key highlights
Competition manageable: Our channel check reveals that LG’s low-priced inverter AC (alloy condenser coils) is not finding flavour among dealers in the western region. These are also available on the online platform for ~Rs 31,500, but with limited volumes on offer and region-wise dynamic pricing.
Daikin and Hitachi lead in inverter ACs: Premium brands continue to command market share in the inverter AC segment (less price sensitive), despite LG’s competitive pricing strategy.
Cost dynamics still favour fixed speed ACs: The inverter AC is costlier by Rs 5,000-5,500, as compared to the 5-star fixed speed AC. In our view, it would take ~3 years for energy savings to offset higher upfront costs of inverter ACs (calculations detailed in the note). Fixed speed ACs would continue to dominate the market, which would be a positive for players like VOLT.
Financial Summary - Consolidated Rs mn FY15 FY16 FY17E FY18E FY19E Net Sales 51,831 58,574 59,603 67,580 75,460 EBITDA 4,100 4,369 5,314 6,256 7,254 APAT 3,496 3,567 4,385 5,044 5,839 EPS (Rs) 10.6 10.8 13.3 15.3 17.7 P/E(x) 36.9 36.2 29.4 25.6 22.1 EV / EBITDA (x) 28.7 26.4 21.6 18.0 15.2 ROE (%) 17.8 15.9 17.2 17.4 17.8 Source: Company, HDFC sec Inst Research
INDUSTRY CAPITAL GOODS
CMP (As on 20 Mar 17) Rs 390
Target Price Rs 462 Nifty 9,127
Sensex 29,519
KEY STOCK DATA
Bloomberg VOLT IN
No. of Shares (mn) 331
MCap (Rs bn) / ($ mn) 129/1,975
6m avg traded value (Rs mn) 530
STOCK PERFORMANCE (%)
52 Week high / low Rs 406/262
3M 6M 12M
Absolute (%) 26.6 2.0 45.0
Relative (%) 14.4 (1.5) 26.7
SHAREHOLDING PATTERN (%)
Promoters 30.30
FIs & Local MFs 26.87
FPI 22.37
Public & Others 20.46
Source : BSE
Pawan Parakh, CFA [email protected] +91-22-6171-7314
Ashutosh Mehta, ACA [email protected] +91-22-3078-8241 HDFC securities Institutional Research is also available on Bloomberg HSLB <GO>

VOLTAS : COMPANY UPDATE
Competition: Exaggerated? Over the last couple of months, there is a perception
that competition is heating up in the AC market, primarily led by LG taking certain bold steps. These are (a) Exiting the fixed speed AC segment to focus on inverter ACs, (b) Launching inverter ACs at aggressive price points (Rs 33,000 onwards), comparable to 5-star non-inverter ACs and (c) Offering a 10-year compressor warranty, as against 4-5 years provided by competitors.
These entry-level inverter ACs are bundled with alloy condenser coils, which are cheaper versus copper coils. As per the dealers, coils and metal parts call for great repair and maintenance, and hence the quality of the condenser is vital. Replacing an alloy coil would be ~4x more expensive than repairing a copper coil, as per various dealers.
Copper coils offer better performance, need less maintenance and are repairable, unlike alloy ones. Dealers aver that in the inverter AC segment, demand is not greatly affected by prices. Owing to this, price at the cost of quality is unlikely to be a major volume driver.
It also important to note that apart from LG, Samsung and Whirlpool have also started offering alloy coil-based inverter ACs at lower price points. Our channel also suggests that despite these brands offering extended warranties, they are unable to gain sizeable market share.
Despite stiff competition and tough market conditions post demonetisation, we take comfort in the fact that price discipline prevailed in the industry. None of the players’ resorted to aggressive price cuts immediately post demonetization to push volumes.
10-Year Warranty And Other Offers: It’s Not LG Alone Company Features Key highlights
LG Dual Compressor - 10-years warranty Alloy condenser in cheaper model - Rs 31,590
Service Camp (best efforts to make old LG AC functional at 50% discount)
Copper condenser in expensive models - Rs 37,490
Samsung 10-year compressor warranty ACs available in both variants - alloy and copper condenser
5-year condenser warranty
Whirlpool 10-year compressor warranty ACs available in both variants - alloy and copper condenser
HD Filter – 50% more effective than normal filters
Lloyd 10-year compressor warranty Copper condenser available at price range similar to VOLT Source: Company, HDFC sec Inst Research
Lower priced ACs are fitted with cheaper alloy coils However, alloy coils are not repairable (need complete replacement) and are less efficient than copper coils
Page | 2

VOLTAS : COMPANY UPDATE
Inverter AC: Cost dynamics fail to tempt As per the Bureau of Energy Efficiency (BEE), an
inverter AC consumes ~13/28% lesser electricity than that consumed by a non-inverter 3/5 star one. Taking this into account with our estimates (as tabulated below), we believe the time taken to recover the additional cost will be ~3 years.
Daikin & Hitachi lead: Our channel check suggests that an inverter AC is preferred largely in urban areas or for office usage. Such clients are generally quality conscious. They would prefer to buy products of premium brands and are unlikely to be lured by cheaper offers.
Yearly Cost Saving
AC Type (1 ton) Average consumption
(Watt) Compressor
efficiency Kwh for 1600
hours* Electricity charge
(Rs/kwh) Annual Electricity cost
(Rs) Inverter (3 star) 1,050 100% 1,680 6.5 10,920 Non Inverter (5 star) 1,000 80% 2,000 6.5 13,000
Yearly saving 2,080
Source: Company, HDFC sec Inst Research *Average annual usage in India is 1600 hours
VOLT’s advantage: Better price points
As detailed in the table below, VOLT is competitively priced in the non-inverter segment. In the inverter segment, LG appears to offer better rates on account of the use of alloy coils, not suitable for use in a corrosive environment.
Further, our channel check suggests that LG has resorted to a dynamic pricing strategy, and most of
its new inverter models are outlet specific. These prices are post additional discounts (only for a specific time period) from LG to lure customers.
Price disparity across brick-and-mortar models and online portals is largely compensated by installation fees (Rs 1,500) charged by online sellers, while most others are currently providing free installation.
Prices Comparison Across Modern Trade And Online Sellers (1 ton)
Brand MRP Modern Trade Online Price
Non inverter Inverter Non inverter Inverter Non inverter Inverter 5 star 3 star 5 star 3 star 5 star 3 star
Voltas 37,190 45,490 31,990 36,990 28,490 33,500 Bluestar 36,400 40,000 32,990 37,990 30,989 35,399 LG 37,990 36,990 36,490 34,490 33,000 31,590 Carrier * 38,700 43,800 36,500 40,800 29,890 36,744 Hitachi 37,190 44,190 37,190 41,990 29,990 37,490 Daikin 39,200 40,400 38,500 37,490 33,090 35,590 Note - Prices are for 1 ton non-inverter AC (5 star) and inverter AC (3 star) Source: Company, Croma, Vijay Sales, Flipkart, HDFC sec Inst Research
With a yearly saving of ~Rs 2,080, the additional cost borne to purchase a 3-star inverter AC vis-à-vis a 5 star non-inverter one (~Rs 5,000) would be recovered in ~3 years LG is offering lower prices in the inverter segment because of the use of cheaper alloy condensers, as against copper ones used by competitors
Page | 3

VOLTAS : COMPANY UPDATE
Price hike: A possibility? In the past year, aluminium and copper prices have
increased by 22% and 20% respectively. Our interaction with companies revealed that most of them have made arrangements for procuring commodities for the summer, hence no price hikes would be required.
However, if inflation in commodity prices persists, price hikes would be warranted to maintain margins. Typically, companies resort to price hikes during off season, so that the impact on consumer demand is
minimal. Importantly, there has been no price increase in the last 18 months, and hence a hike in FY18E can be absorbed by the market.
Of the several AC manufacturers, who blinks first still remains the key question. Several players have launched new models at competitive prices only in the inverter AC segment, to establish a foothold there. Hence, price hikes in the inverter AC segment are unlikely in FY18E. But, in our view, marginal price hikes can be taken in 3/5 star fixed speed ACs.
Aluminium Up 22% Over The Last 1 Year
Copper Up 20% Over The Last 1 Year
Source : Bloomberg, HDFC sec Inst Research Source : Bloomberg, HDFC sec Inst Research
In the past year, aluminium/copper prices have risen 22/20% respectively in rupee terms and 24/21% respectively in dollar terms
250,000
300,000
350,000
400,000
450,000
Apr
-16
May
-16
Jun-
16
Jul-1
6
Aug
-16
Sep-
16
Oct
-16
Nov
-16
Dec
-16
Jan-
17
Feb-
17
Mar
-17
Copper (Rs/Tonne)
80,000
90,000
100,000
110,000
120,000
130,000
140,000
Apr
-16
May
-16
Jun-
16
Jul-1
6
Aug
- 16
Sep-
16
Oct
-16
Nov
-16
Dec
-16
Jan-
17
Feb-
17
Mar
-17
Aluminium (Rs/Tonne)
Page | 4

VOLTAS : COMPANY UPDATE
Largely under-penetrated market As highlighted in the table below, AC penetration in
India stands low at 8.2% (only considering the aspiring middle-class and wealthy households). Our calculation assumes that ~25% of the ACs sold would be in the institutional space (hotels, hospitals and offices, among others), and an average of 2 ACs per household (higher in urban areas and lower in rural ones).
With rising income and standards of living, AC penetration should certainly be higher in a tropical
country like India. This provides a multi-year growth visibility for companies like VOLT, in our view.
Even when compared to other discretionary spends like cars, AC sales are considerably low in India. As against annual sales ~26mn cars, AC sales stand extremely low at ~5mn. Even after adjusting for 4W sales in the commercial space, AC sales would still be low on a relative basis, highlighting the potential for future growth.
India AC PenetrationYear Assumptions FY02 FY10 FY17E
Number of households
188.2 221.9 272.9 Aspirers, middle & rich class
28.1% 48.5% 60.0%
Households (potential to buy ACs)
52.9 107.6 163.7
AC installed base (mn)
41.08
Adjustments
1) Replacement demand 10%
4.11 2) Institutional demand 25%
10.27
No of installed residential AC (mn)
26.71 No of household with AC 2 AC per household
13.35
Penetration
8.2% Source: Planning Commission, Industry Data, HDFC sec Inst Research Global comparables of emerging countries in tropical
regions (as shown in the table below) are also indicative of potential future demand for ACs in India. Even when compared to countries like Vietnam and
Pakistan (lower or similar per capita income), AC sales in India are lower.
We remain confident on long-term growth opportunities for ACs in India.
India’s AC penetration (aspiring, middle and wealthy classes) stands considerably low at 8.2%, as compared to 16.0% for 4-wheelers
Page | 5

VOLTAS : COMPANY UPDATE
World AC Demand Comparision
Country Units sold (CY15)
(000’s) Population
(Mn) ACs sold
per mn Per capita income
(current USD) India 4,198 1,311 3.20 1,598
Asia
Malaysia 789 30 26.30 9,768 China 30,248 1,371 22.06 8,028 Thailand 1,268 68 18.65 5,815 Vietnam 1,546 92 16.80 2,111 Indonesia 2,109 258 8.17 3,346 Pakistan 644 189 3.41 1,435
South America
Argentina 1,166 43 27.12 13,432 Brazil 3,349 208 16.10 8,539 Mexico 847 127 6.67 9,005
Africa
Egypt 718 92 7.85 3,615 Nigeria 517 182 2.84 2,640 Source: Industry Report, World Bank, HDFC sec Inst Research
Despite 4.2mn ACs sold in India in CY15, the figure translates to only 3.2 ACs per mn of the population (as against an average of 15.9 per mn in other Asian countries)
Page | 6

VOLTAS : COMPANY UPDATE
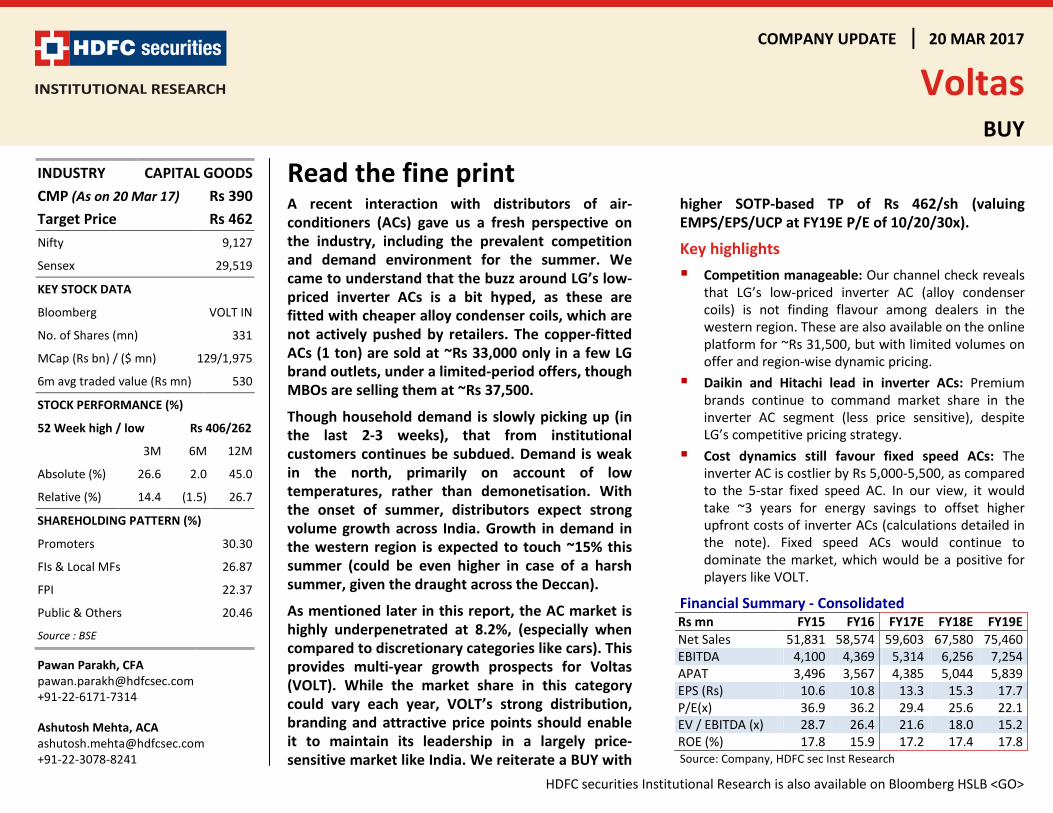
Valuations comfortable: Reiterate BUY Over the last three years, the stock has seen a decent
run-up in the Jan-Mar period, on expectations of strong demand in the summer. In a supportive bull market, the uptick has already begun in the stock price (+17% in the last 2 months).
While the AC market is a competitive space, and will continue to be this way given the growth outlook, in our view, concern regarding competition (primarily from LG) is a bit overdone.. We believe VOLT is likely to sustain 15-17% growth in the UCP segment, aided partly by growth in air coolers.
VOLT is well positioned to capture strong opportunities in the AC space. Its brand and attractive price points should help it maintain a leadership position in the AC market. In this backdrop, valuations (implied FY19E P/E of ~24x) are cheap as compared to other consumer durable peers (table below), and have scope to improve further.
We reiterate BUY on VOLT with a higher SOTP-based TP of Rs 462/share (valuing EMPS/EPS/UCP at FY19E P/E of 10/20/30x).
Stock Price Movement Over The Past 3 Years
Source: Company, HDFC sec Inst Research
180
210
240
270
300
330
360
390
420
Jan-
15
Feb-
15
Mar
-15
Apr
-15
May
-15
Jun-
15
Jul-1
5
Aug
-15
Sep-
15
Oct
-15
Nov
-15
Dec
-15
Jan-
16
Feb-
16
Mar
-16
Apr
-16
May
-16
Jun-
16
Jul-1
6
Aug
-16
Sep-
16
Oct
-16
Nov
-16
Dec
-16
Jan-
17
Feb-
17
Mar
-17
Voltas (Rs / share) Demonetisation impact
Fall in line with broader indices
Despite concerns of competition from LG, we believe VOLT should be able to achieve sustained growth of ~15-17% over the next 2 years Historically, the stock has risen ahead of the summer season. The uptick in the stock price for FY17 has already begun, and could be higher in case of a harsh summer.
Page | 7

VOLTAS : COMPANY UPDATE
Annexure: 2017 Expected Max Temperatures Above Long Term Mean (Period Mar-May)
Source: IMD
IMD expects subdivisions in the North, North-West and certain parts of Eastern and Central India to witness max temperatures > 1.0 degree Celsius over their long-term average The remaining parts of India will witness maximum temperatures 0.5-1.0 degree Celsius higher than their long-term average
Page | 8

VOLTAS : COMPANY UPDATE
Key Assumptions And Estimates
FY15 FY16 FY17E FY18E FY19E
Segment Revenues
Electro-Mechanical Project 22,085 27,171 26,963 29,783 31,653
YoY (%) -18.0% 23.0% -0.8% 10.5% 6.3% Engineering Products & Services 3,601 3,702 3,147 3,304 3,469
YoY (%) -19.7% 2.8% -15.0% 5.0% 5.0% Unitary Cooling Products 25,105 25,566 29,146 34,100 39,897
YoY (%) 22.3% 1.8% 14.0% 17.0% 17.0% Segment Margins
Electro-Mechanical Project -7.6% 1.4% 2.3% 2.8% 3.3% Engineering Products & Services 30.0% 30.5% 30.5% 30.5% 30.5% Unitary Cooling Products 13.9% 13.2% 14.0% 14.0% 14.0% Source: Company, HDFC sec Inst Research
SOTP Valuation
Method FY19E APAT Multiple (x) Valuation VPS
Electro-Mechanical Project P/E multiple 563 10 5,632 17 Engineering Products & Services P/E multiple 1,099 20 21,972 66 Unitary Cooling Products P/E multiple 4,177 30 125,320 379 SOTP
462
Source: HDFC sec Inst Research
Relative Valuations
Company MCap (Rs bn)
CMP (Rs)
Rating TP
(Rs) EPS (Rs/sh) P/E (x) EV/EBITDA (x) ROE (%)
FY17E FY18E FY19E FY17E FY18E FY19E FY17E FY18E FY19E FY17E FY18E FY19E
Havells 280 448 BUY 469 9.5 11.4 13.9 47.2 39.1 32.1 31.2 24.6 20.6 21.2 22.9 24.9 Voltas 129 390 BUY 462 13.3 15.3 17.7 29.4 25.6 22.1 21.6 18.0 15.2 17.2 17.4 17.8 V-Guard 73 173 BUY 175 3.9 5.0 6.2 44.2 34.8 27.9 31.4 25.9 21.4 30.9 31.5 32.2 Bluestar 55 611 NR NR 16.3 19.1 23.3 37.6 32.0 26.3 22.0 18.3 15.1 23.0 25.5 25.5
Source: HDFC sec Inst Research
We value EMPS/EPS/UCP at FY19E P/E of 10/20/30x, to arrive at an SOTP value of Rs 462/share VOLT trades attractively vs. other consumer durable peers
Page | 9
VOLTAS : COMPANY UPDATE
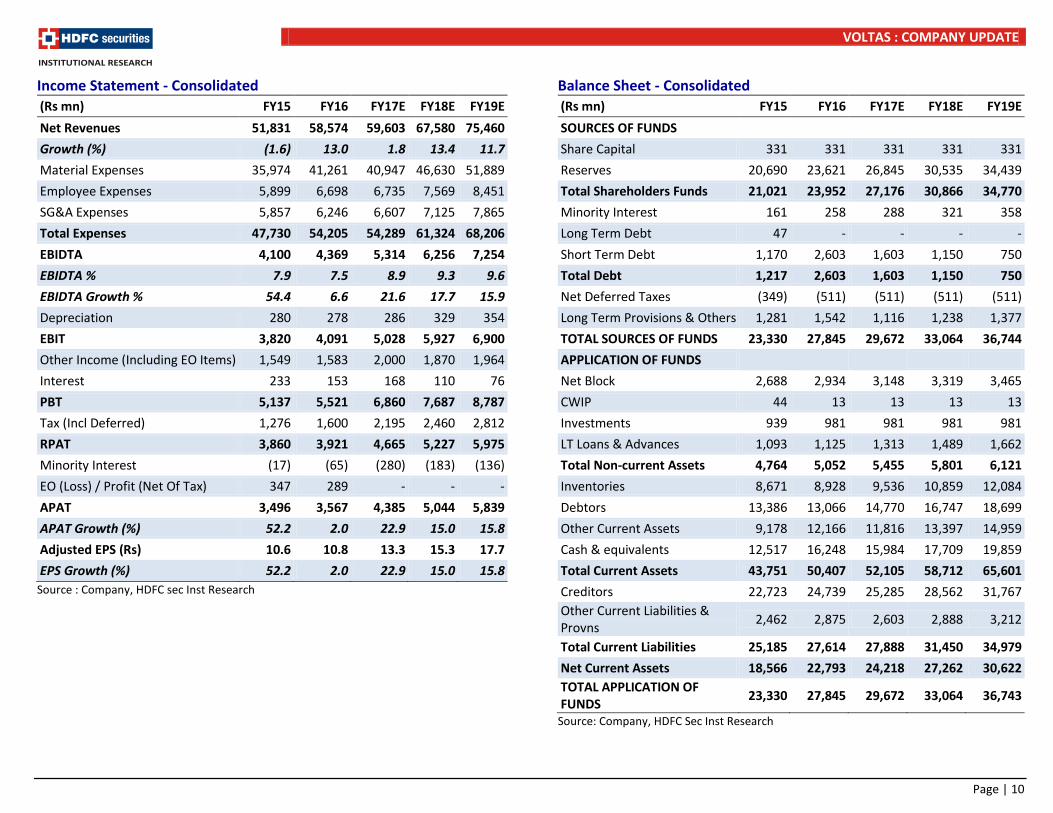
Income Statement - Consolidated (Rs mn) FY15 FY16 FY17E FY18E FY19E
Net Revenues 51,831 58,574 59,603 67,580 75,460
Growth (%) (1.6) 13.0 1.8 13.4 11.7
Material Expenses 35,974 41,261 40,947 46,630 51,889
Employee Expenses 5,899 6,698 6,735 7,569 8,451
SG&A Expenses 5,857 6,246 6,607 7,125 7,865
Total Expenses 47,730 54,205 54,289 61,324 68,206
EBIDTA 4,100 4,369 5,314 6,256 7,254
EBIDTA % 7.9 7.5 8.9 9.3 9.6
EBIDTA Growth % 54.4 6.6 21.6 17.7 15.9
Depreciation 280 278 286 329 354
EBIT 3,820 4,091 5,028 5,927 6,900
Other Income (Including EO Items) 1,549 1,583 2,000 1,870 1,964
Interest 233 153 168 110 76
PBT 5,137 5,521 6,860 7,687 8,787
Tax (Incl Deferred) 1,276 1,600 2,195 2,460 2,812
RPAT 3,860 3,921 4,665 5,227 5,975
Minority Interest (17) (65) (280) (183) (136)
EO (Loss) / Profit (Net Of Tax) 347 289 - - -
APAT 3,496 3,567 4,385 5,044 5,839
APAT Growth (%) 52.2 2.0 22.9 15.0 15.8
Adjusted EPS (Rs) 10.6 10.8 13.3 15.3 17.7
EPS Growth (%) 52.2 2.0 22.9 15.0 15.8 Source : Company, HDFC sec Inst Research
Balance Sheet - Consolidated (Rs mn) FY15 FY16 FY17E FY18E FY19E
SOURCES OF FUNDS
Share Capital 331 331 331 331 331
Reserves 20,690 23,621 26,845 30,535 34,439
Total Shareholders Funds 21,021 23,952 27,176 30,866 34,770
Minority Interest 161 258 288 321 358
Long Term Debt 47 - - - -
Short Term Debt 1,170 2,603 1,603 1,150 750
Total Debt 1,217 2,603 1,603 1,150 750
Net Deferred Taxes (349) (511) (511) (511) (511)
Long Term Provisions & Others 1,281 1,542 1,116 1,238 1,377
TOTAL SOURCES OF FUNDS 23,330 27,845 29,672 33,064 36,744
APPLICATION OF FUNDS
Net Block 2,688 2,934 3,148 3,319 3,465
CWIP 44 13 13 13 13
Investments 939 981 981 981 981
LT Loans & Advances 1,093 1,125 1,313 1,489 1,662
Total Non-current Assets 4,764 5,052 5,455 5,801 6,121
Inventories 8,671 8,928 9,536 10,859 12,084
Debtors 13,386 13,066 14,770 16,747 18,699
Other Current Assets 9,178 12,166 11,816 13,397 14,959
Cash & equivalents 12,517 16,248 15,984 17,709 19,859
Total Current Assets 43,751 50,407 52,105 58,712 65,601
Creditors 22,723 24,739 25,285 28,562 31,767 Other Current Liabilities & Provns
2,462 2,875 2,603 2,888 3,212
Total Current Liabilities 25,185 27,614 27,888 31,450 34,979
Net Current Assets 18,566 22,793 24,218 27,262 30,622 TOTAL APPLICATION OF FUNDS
23,330 27,845 29,672 33,064 36,743
Source: Company, HDFC Sec Inst Research
Page | 10

VOLTAS : COMPANY UPDATE
Cash Flow Statement - Consolidated (Rs mn) FY15 FY16 FY17E FY18E FY19E Reported PBT 5,137 5,521 6,860 7,687 8,787 Non-operating & EO items (1,549) (1,583) (2,000) (1,870) (1,964) Interest Expenses 233 153 168 110 76 Depreciation 280 278 286 329 354 Working capital change 1,820 (266) (2,303) (1,373) (1,245) Tax Paid (1,276) (1,600) (2,195) (2,460) (2,812) Other operating items (284) - - - - OPERATING CASH FLOW (a) 4,360 2,504 816 2,423 3,197 Capex 17 (449) (500) (500) (500) Free Cash Flow 4,377 2,054 316 1,923 2,697 Investments 455 (42) - - - Non-operating Income 1,549 1,583 2,000 1,870 1,964 INVESTING CASH FLOW (b) 2,021 1,092 1,500 1,370 1,464 Debt Issuance/(Repaid) (1,412) 1,387 (1,000) (453) (400) Interest (233) (153) (168) (110) (76) FCFE 2,732 3,288 (853) 1,359 2,221 Share Capital Issuance - - - - - Minority Interest 16 23 (250) (150) (100) Dividend (980) (1,120) (1,161) (1,354) (1,935) FINANCING CASH FLOW (c) (2,609) 136 (2,579) (2,068) (2,511) NET CASH FLOW (a+b+c) 3,772 3,731 (264) 1,725 2,150 Closing Cash & Equivalents 12,517 16,248 15,984 17,709 19,859
Source : Company, HDFC sec Inst Research
Key Ratios - Consolidated
FY15 FY16 FY17E FY18E FY19E
PROFITABILITY %
GPM 30.6 29.6 31.3 31.0 31.2 EBITDA margin 7.9 7.5 8.9 9.3 9.6 APAT margin 6.7 6.1 7.4 7.5 7.7 RoE 17.8 15.9 17.2 17.4 17.8 Core RoCE (RoIC) 23.9 25.9 27.0 27.8 29.1 RoCE 16.2 14.4 15.6 16.3 16.9 EFFICIENCY
Tax Rate (%) 24.8 29.0 32.0 32.0 32.0 Fixed Asset Turnover (x) 19.0 19.9 18.9 20.3 21.7 Inventory (days) 61.1 55.6 58.4 58.7 58.4 Debtors (days) 94.3 81.4 90.5 90.5 90.5 Other Current Assets (days) 64.6 75.8 72.4 72.4 72.4 Payables (days) 160.0 154.2 154.8 154.3 153.7 Other Current Liab & Provns (days) 17.3 17.9 15.9 15.6 15.5 Cash Conversion Cycle (days) 42.6 40.8 50.4 51.6 52.1 Debt/EBITDA (x) 0.3 0.6 0.3 0.2 0.1 Net D/E (x) (0.5) (0.6) (0.5) (0.5) (0.5) Interest Coverage (x) 16.4 26.7 29.9 53.8 90.8 PER SHARE DATA (Rs)
EPS 10.6 10.8 13.3 15.3 17.7 CEPS 11.4 11.6 14.1 16.2 18.7 Dividend 2.3 2.6 3.0 3.5 5.0 Book Value 63.6 72.4 82.2 93.3 105.1 VALUATION
P/E (x) 36.9 36.2 29.4 25.6 22.1 P/BV (x) 6.1 5.4 4.8 4.2 3.7 EV/EBITDA (x) 28.7 26.4 21.6 18.0 15.2 EV/Revenues (x) 2.3 2.0 1.9 1.7 1.5 OCF/EV (%) 3.7 2.2 0.7 2.2 2.9 FCF/EV (%) 3.7 1.8 0.3 1.7 2.5 FCFE/Mkt Cap (%) 2.1 2.5 (0.7) 1.1 1.7 Dividend Yield (%) 0.6 0.7 0.8 0.9 1.3
Source : Company, HDFC sec Inst Research
Page | 11

VOLTAS : COMPANY UPDATE
RECOMMENDATION HISTORY
Rating Definitions BUY : Where the stock is expected to deliver more than 10% returns over the next 12 month period NEUTRAL : Where the stock is expected to deliver (-)10% to 10% returns over the next 12 month period SELL : Where the stock is expected to deliver less than (-)10% returns over the next 12 month period
Date CMP Reco Target 20-May-16 323 NEU 310 4-Aug-16 345 NEU 325
21-Nov-16 293 BUY 351 16-Feb-17 345 BUY 387 20-Mar-17 390 BUY 462
200
250
300
350
400
450
500
550
Mar
-16
Apr
-16
May
-16
Jun-
16
Jul-1
6
Aug
-16
Sep-
16
Oct
-16
Nov
-16
Dec
-16
Jan-
17
Feb-
17
Mar
-17
Voltas TP
Page | 12

VOLTAS : COMPANY UPDATE
HDFC securities Institutional Equities Unit No. 1602, 16th Floor, Tower A, Peninsula Business Park, Senapati Bapat Marg, Lower Parel, Mumbai - 400 013 Board : +91-22-6171 7330 www.hdfcsec.com
Disclosure: We, Pawan Parakh, CFA & Ashutosh Mehta, ACA, authors and the names subscribed to this report, hereby certify that all of the views expressed in this research report accurately reflect our views about the subject issuer(s) or securities. We also certify that no part of our compensation was, is, or will be directly or indirectly related to the specific recommendation(s) or view(s) in this report. Research Analyst or his/her relative or HDFC Securities Ltd. does not have any financial interest in the subject company. Also Research Analyst or his relative or HDFC Securities Ltd. or its Associate may have beneficial ownership of 1% or more in the subject company at the end of the month immediately preceding the date of publication of the Research Report. Further Research Analyst or his relative or HDFC Securities Ltd. or its associate does not have any material conflict of interest. Any holding in stock – No Disclaimer: This report has been prepared by HDFC Securities Ltd and is meant for sole use by the recipient and not for circulation. The information and opinions contained herein have been compiled or arrived at, based upon information obtained in good faith from sources believed to be reliable. Such information has not been independently verified and no guaranty, representation of warranty, express or implied, is made as to its accuracy, completeness or correctness. All such information and opinions are subject to change without notice. This document is for information purposes only. Descriptions of any company or companies or their securities mentioned herein are not intended to be complete and this document is not, and should not be construed as an offer or solicitation of an offer, to buy or sell any securities or other financial instruments. This report is not directed to, or intended for display, downloading, printing, reproducing or for distribution to or use by, any person or entity who is a citizen or resident or located in any locality, state, country or other jurisdiction where such distribution, publication, reproduction, availability or use would be contrary to law or regulation or what would subject HDFC Securities Ltd or its affiliates to any registration or licensing requirement within such jurisdiction. If this report is inadvertently send or has reached any individual in such country, especially, USA, the same may be ignored and brought to the attention of the sender. This document may not be reproduced, distributed or published for any purposes without prior written approval of HDFC Securities Ltd . Foreign currencies denominated securities, wherever mentioned, are subject to exchange rate fluctuations, which could have an adverse effect on their value or price, or the income derived from them. In addition, investors in securities such as ADRs, the values of which are influenced by foreign currencies effectively assume currency risk. It should not be considered to be taken as an offer to sell or a solicitation to buy any security. HDFC Securities Ltd may from time to time solicit from, or perform broking, or other services for, any company mentioned in this mail and/or its attachments. HDFC Securities and its affiliated company(ies), their directors and employees may; (a) from time to time, have a long or short position in, and buy or sell the securities of the company(ies) mentioned herein or (b) be engaged in any other transaction involving such securities and earn brokerage or other compensation or act as a market maker in the financial instruments of the company(ies) discussed herein or act as an advisor or lender/borrower to such company(ies) or may have any other potential conflict of interests with respect to any recommendation and other related information and opinions. HDFC Securities Ltd, its directors, analysts or employees do not take any responsibility, financial or otherwise, of the losses or the damages sustained due to the investments made or any action taken on basis of this report, including but not restricted to, fluctuation in the prices of shares and bonds, changes in the currency rates, diminution in the NAVs, reduction in the dividend or income, etc. HDFC Securities Ltd and other group companies, its directors, associates, employees may have various positions in any of the stocks, securities and financial instruments dealt in the report, or may make sell or purchase or other deals in these securities from time to time or may deal in other securities of the companies / organizations described in this report. HDFC Securities or its associates might have managed or co-managed public offering of securities for the subject company or might have been mandated by the subject company for any other assignment in the past twelve months. HDFC Securities or its associates might have received any compensation from the companies mentioned in the report during the period preceding twelve months from the date of this report for services in respect of managing or co-managing public offerings, corporate finance, investment banking or merchant banking, brokerage services or other advisory service in a merger or specific transaction in the normal course of business. HDFC Securities or its analysts did not receive any compensation or other benefits from the companies mentioned in the report or third party in connection with preparation of the research report. Accordingly, neither HDFC Securities nor Research Analysts have any material conflict of interest at the time of publication of this report. Compensation of our Research Analysts is not based on any specific merchant banking, investment banking or brokerage service transactions. HDFC Securities may have issued other reports that are inconsistent with and reach different conclusion from the information presented in this report. Research entity has not been engaged in market making activity for the subject company. Research analyst has not served as an officer, director or employee of the subject company. We have not received any compensation/benefits from the subject company or third party in connection with the Research Report. HDFC Securities Ltd. is a SEBI Registered Research Analyst having registration no. INH000002475
Page | 13