Company Presentation March 2019 · Global Addressable Market 2018: • ~€81 bn Growth Drivers:...
41
Company Presentation March 2019 Frankfurt stock exchange: FRE │ US ADR program: FSNUY │ www.fresenius.com/investors
Transcript of Company Presentation March 2019 · Global Addressable Market 2018: • ~€81 bn Growth Drivers:...
Company Presentation
March 2019
Frankfurt stock exchange: FRE │ US ADR program: FSNUY │ www.fresenius.com/investors

Safe Harbor Statement
This presentation contains forward-looking statements that are subject to various
risks and uncertainties. Future results could differ materially from those described
in these forward-looking statements due to certain factors, e.g. changes in
business, economic and competitive conditions, regulatory reforms, results of
clinical trials, foreign exchange rate fluctuations, uncertainties in litigation or
investigative proceedings, and the availability of financing. Fresenius does not
undertake any responsibility to update the forward-looking statements contained
in this presentation.
Company Presentation March 2019 © Fresenius SE & Co. KGaA Investor Relations 2
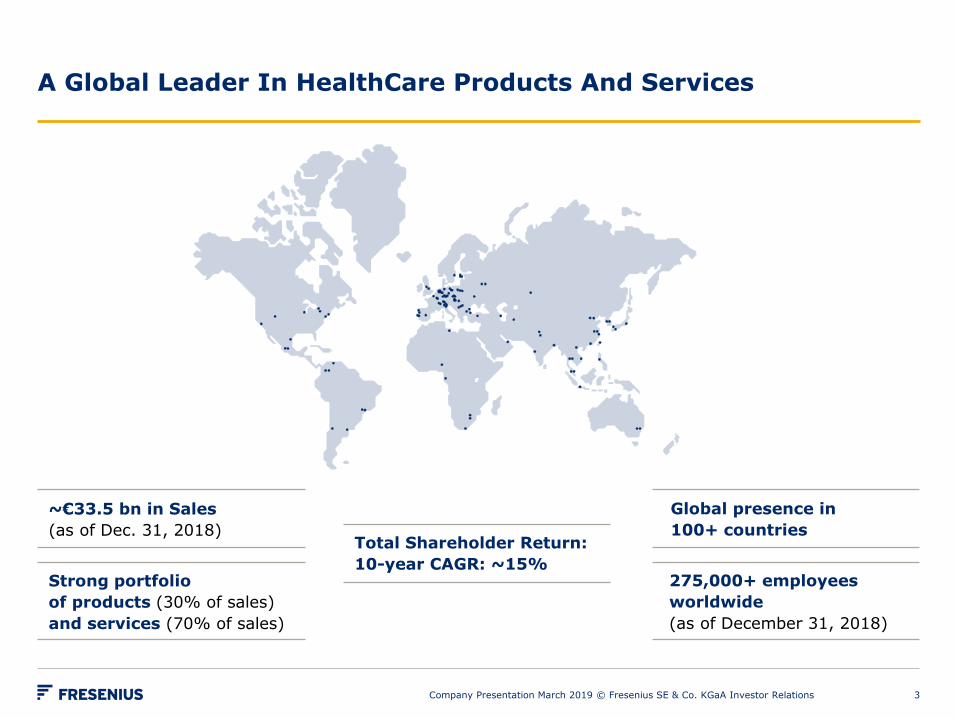
~€33.5 bn in Sales
(as of Dec. 31, 2018)Total Shareholder Return:
10-year CAGR: ~15%Strong portfolio
of products (30% of sales)
and services (70% of sales)
Global presence in
100+ countries
275,000+ employees
worldwide
(as of December 31, 2018)
A Global Leader In HealthCare Products And Services
Company Presentation March 2019 © Fresenius SE & Co. KGaA Investor Relations 3

Strong and Balanced Health Care Portfolio
Company Presentation March 2019 © Fresenius SE & Co. KGaA Investor Relations
Ownership: ~31% Ownership: 100% Ownership: 100% Ownership: 77%
Dialysis Products
Health Care Services
Hospital Supplies Hospital Operation Projects and Services for
Hospitals
• Dialysis services• Hemodialysis products• Peritoneal dialysis products• Care coordination
Sales 2018: €16.5 bn
• IV drugs• Biosimilars• Clinical nutrition• Infusion therapy• Medical devices/
Transfusion technology
Sales 2018: €6.5 bn
• Acute care• Outpatient services
Sales 2018: €9.0 bn1
• Post-acute care• Project development &
Planning• Turnkey construction• Maintenance & Technical
and total operational management
Sales 2018: €1.7 bn1
1 Reflects the transfer of German post-acute care business from Fresenius Helios to Fresenius Vamed as of July 1, 2018
4

Source: Bloomberg; dividends reinvested, as of Dec 31, 2018
DAX S&P 500 MSCI WorldHealth Care
Fresenius
15%
8%
DAX S&P 500 MSCI WorldHealth Care
Fresenius DAX S&P 500 MSCI WorldHealth Care
Fresenius
14%
7%
10%
4%
13%12%
8%9%
6% 6%
Fresenius Fresenius Fresenius
Total Shareholder Return – CAGR, Rounded
10 years 15 years 20 years
Company Presentation March 2019 © Fresenius SE & Co. KGaA Investor Relations 5

3.6
3.0
2.6
2.8
2.5 2.5
3.4
2.7
2.4
2.82.7
2008 2009 2010 2011 2012 2013 2014 2015 2016 2017 2018
6.2
4.8 4.8 4.8
5.2 5.3
5.85.5 5.5 5.4
6.5
4
5
6
7
8
2008 2009 2010 2011 2012 2013 2014 2015 2016 2017 2018
2.7
6.3
7.4
5.6
7.6
6.2
5.2
6.7 6.7 6.6
5.0
2
4
6
8
10
2008 2009 2010 2011 2012 2013 2014 2015 2016 2017 2018
Fresenius Group Consistent Cash Generation
% %
%
Capex gross, in % of sales
FCF margin (before acquisitions & dividends)CFFO margin
Net Debt / EBITDA1
1 Net debt at year-end exchange rate; EBITDA at LTM average exchange rates; before special items; pro forma closed acquisitions/divestitures
Company Presentation March 2019 © Fresenius SE & Co. KGaA Investor Relations
4.0
3.5
3.0
2.5
8.7
11.0
12.0
10.3
12.6
11.4
10.9
12.0 12.211.6
11.2
8
9
10
11
12
13
14
2008 2009 2010 2011 2012 2013 2014 2015 2016 2017 2018
6

Fresenius Medical Care: Global Dialysis Market Leader
• The world’s leading provider of dialysis products
and services treating more than 330,000 patients1
in ~3,900 clinics1
• Provide highest standard of product quality and
patient care
• Expansion in Care Coordination and global dialysis
service opportunities; enter new geographies
Global Dialysis Market 2018:
• ~€71 bn• ~6% patient growth p.a.
Growth Drivers:
• Aging population, increasing incidence of diabetes and high blood pressure, treatment quality improvements
International
30%
Sales 2018:€16.5 bn North America
70%
Dialysis products
Dialysis services
Complete therapy offerings
1 As of December 31, 2018
Market Dynamics
Company Presentation March 2019 © Fresenius SE & Co. KGaA Investor Relations 7

Fresenius Kabi: A Leading Global Hospital Supplier
• Comprehensive product portfolio for critically and chronically ill patients
• Strong Emerging Markets presence
• Leading market positions in four product segments
• Focus on organic growth through geographic product rollouts and new product launches
• Development of biosimilars with a focus on oncology and autoimmune diseases
Global Addressable Market 2018:
• ~€81 bn
Growth Drivers:
• Patent expirations, rising demand for health care products and services, higher health care spending in Emerging Markets
Market Dynamics
Emerging Markets
30%
Sales 2018:€6.5 bn Europe 34%
North America 36%
Generic IV Drugs
Clinical Nutrition
Infusion Therapy
Medical Devices /
Transfusion Technology
Company Presentation March 2019 © Fresenius SE & Co. KGaA Investor Relations
Biosimilars
8

• ~5%1 share in German acute care hospital market
• Organic growth based on growing number ofadmissions and reimbursement rate increases
• Ranks as quality leader in the German hospital sector: defined quality targets, publication of medical treatment results, peer review processes
• Key medical indicators, e.g. mortality rate for heart failure, pneumonia below German average
86 hospitals
~29,000 beds
~1.2 million inpatient admissions p.a.
~4.1 million outpatientadmissions p.a.
1 Based on sales 2 German Federal Statistical Office 2018; total costs, gross of the German hospitals
less academic research and teaching
As of December 31, 2018
Fresenius Helios: Europe’s Largest Private Hospital Operator
Helios Germany
German Acute Care Hospital Market:
• ~€102 bn2
Growth Drivers:
• Aging population leading to increasing hospital admissions
Largest network & nationwide presence
Acute Care
Market Dynamics
Company Presentation March 2019 © Fresenius SE & Co. KGaA Investor Relations
Outpatient
9
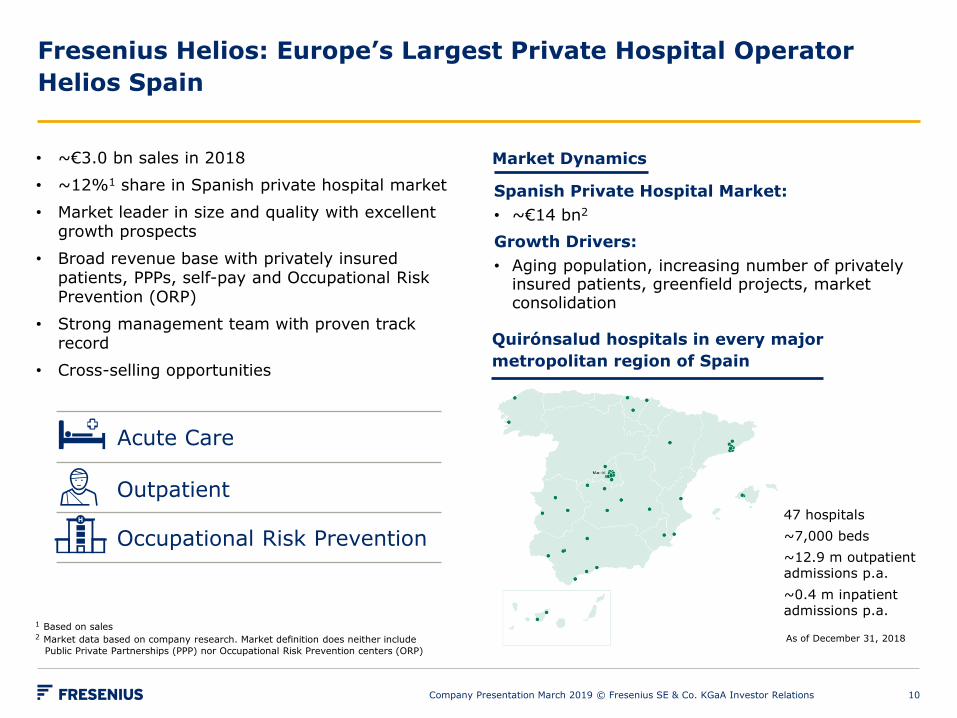
• ~€3.0 bn sales in 2018
• ~12%1 share in Spanish private hospital market
• Market leader in size and quality with excellent growth prospects
• Broad revenue base with privately insured patients, PPPs, self-pay and Occupational Risk Prevention (ORP)
• Strong management team with proven track record
• Cross-selling opportunities
Fresenius Helios: Europe’s Largest Private Hospital Operator
Helios Spain
Spanish Private Hospital Market:
• ~€14 bn2
Growth Drivers:
• Aging population, increasing number of privately insured patients, greenfield projects, market consolidation
Quirónsalud hospitals in every major
metropolitan region of Spain
Acute Care
Occupational Risk Prevention
Outpatient
1 Based on sales2 Market data based on company research. Market definition does neither include
Public Private Partnerships (PPP) nor Occupational Risk Prevention centers (ORP)
Market Dynamics
As of December 31, 2018
47 hospitals
~7,000 beds
~12.9 m outpatient admissions p.a.
~0.4 m inpatientadmissions p.a.
10Company Presentation March 2019 © Fresenius SE & Co. KGaA Investor Relations
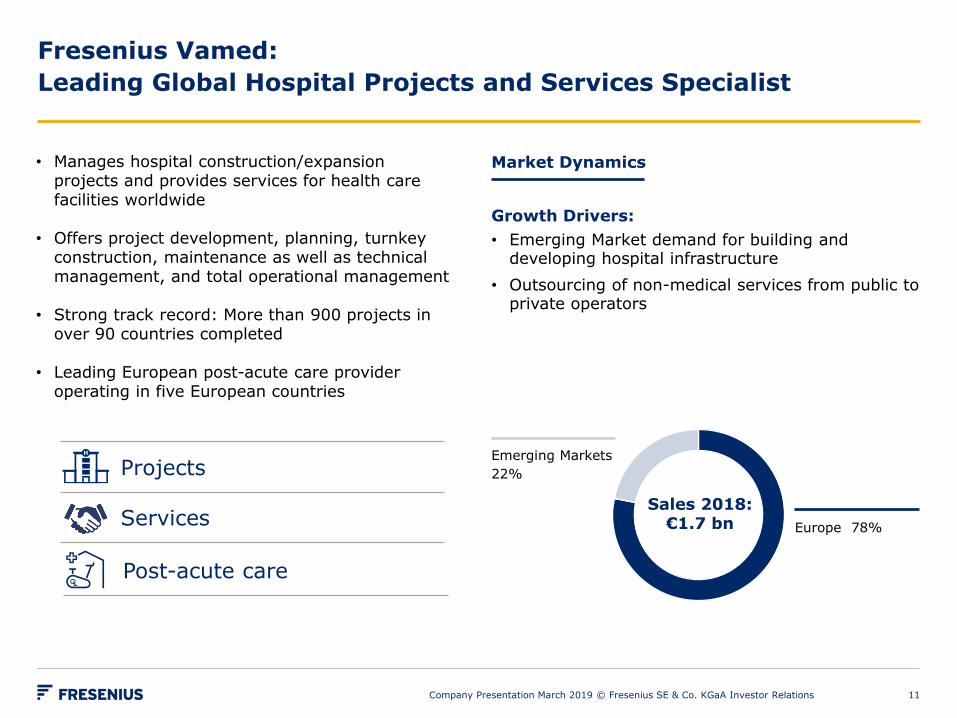
• Manages hospital construction/expansion projects and provides services for health care facilities worldwide
• Offers project development, planning, turnkey construction, maintenance as well as technical management, and total operational management
• Strong track record: More than 900 projects in over 90 countries completed
• Leading European post-acute care provider operating in five European countries
Fresenius Vamed:
Leading Global Hospital Projects and Services Specialist
Market Dynamics
Growth Drivers:
• Emerging Market demand for building and developing hospital infrastructure
• Outsourcing of non-medical services from public to private operators
Emerging Markets
22%
Sales 2018:€1.7 bn Europe 78%
Projects
Services
Company Presentation March 2019 © Fresenius SE & Co. KGaA Investor Relations
Post-acute care
11

€m (except otherwise stated) FY/18 Base FY/19e1
Sales growth (org) 6,544 3% - 6%
EBIT growth (cc) 1,1392 3% - 6%
Sales growth (org) 8,993 2% - 5%
EBIT growth 1,052 -5% to -2%
Sales growth (org) 1,688 ~10%
EBIT growth 110 15% - 20%
1 Excluding transaction-related expenses, revaluations of biosimilars contingent liabilities, adjusted for IFRS 16 effects2 Before special items
For a detailed overview of adjustments and special items please see the reconciliation tables on slides 59-66 and for the bases for FY/19 guidance please see slides 34-36.
Fresenius Group: 2019 Financial Outlook by Business Segment
Company Presentation March 2019 © Fresenius SE & Co. KGaA Investor Relations 12
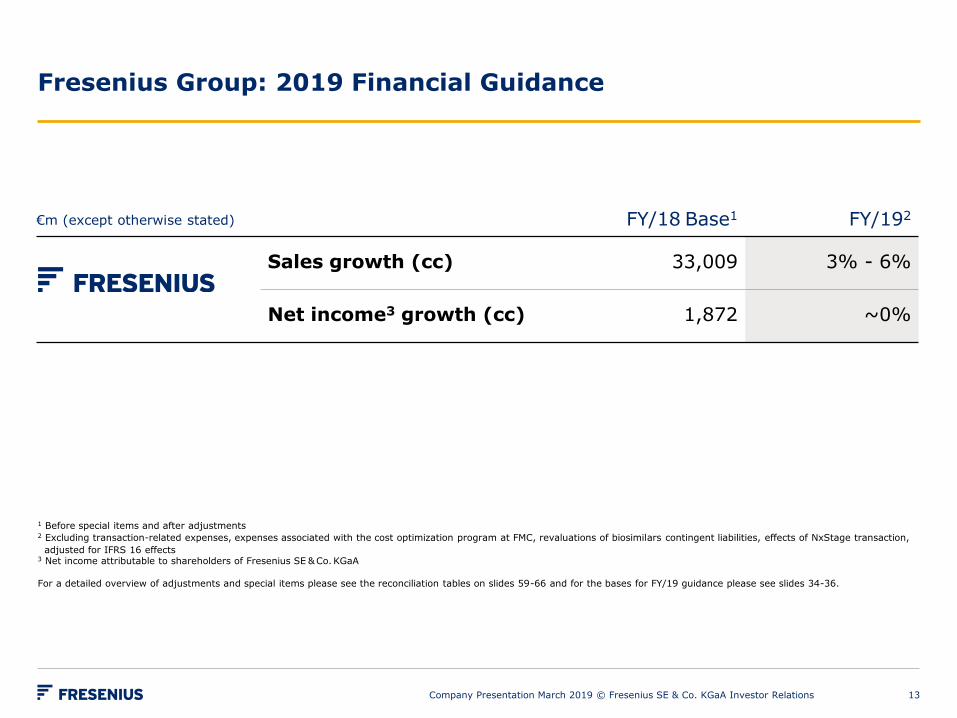
€m (except otherwise stated) FY/18 Base1 FY/192
Sales growth (cc) 33,009 3% - 6%
Net income3 growth (cc) 1,872 ~0%
Fresenius Group: 2019 Financial Guidance
1 Before special items and after adjustments2 Excluding transaction-related expenses, expenses associated with the cost optimization program at FMC, revaluations of biosimilars contingent liabilities, effects of NxStage transaction,
adjusted for IFRS 16 effects3 Net income attributable to shareholders of Fresenius SE &Co.KGaA
For a detailed overview of adjustments and special items please see the reconciliation tables on slides 59-66 and for the bases for FY/19 guidance please see slides 34-36.
Company Presentation March 2019 © Fresenius SE & Co. KGaA Investor Relations 13

FY/18 base for Fresenius Group Guidance FY/19
Company Presentation March 2019 © Fresenius SE & Co. KGaA Investor Relations
€m
Sales reported 33,530
Divestitures of Care Coordination activities at FMC (H1/18) -521
Sales basis for growth rates 33,009
Net Income reported 2,027
Transaction Costs, Akorn, Biosimilars 25
Bridge Financing Costs Akorn 12
Revaluations of Biosimilars contingent liabililties 5
Impact of FCPA related charge 9
Gain related to divestitures of Care Coordination activities -207
Net income (before special items) 1,871
Divestitures of Care Coordination activities at FMC (H1/18) 1
Net income basis for growth rates (before special items and after adjustments) 1,872
14
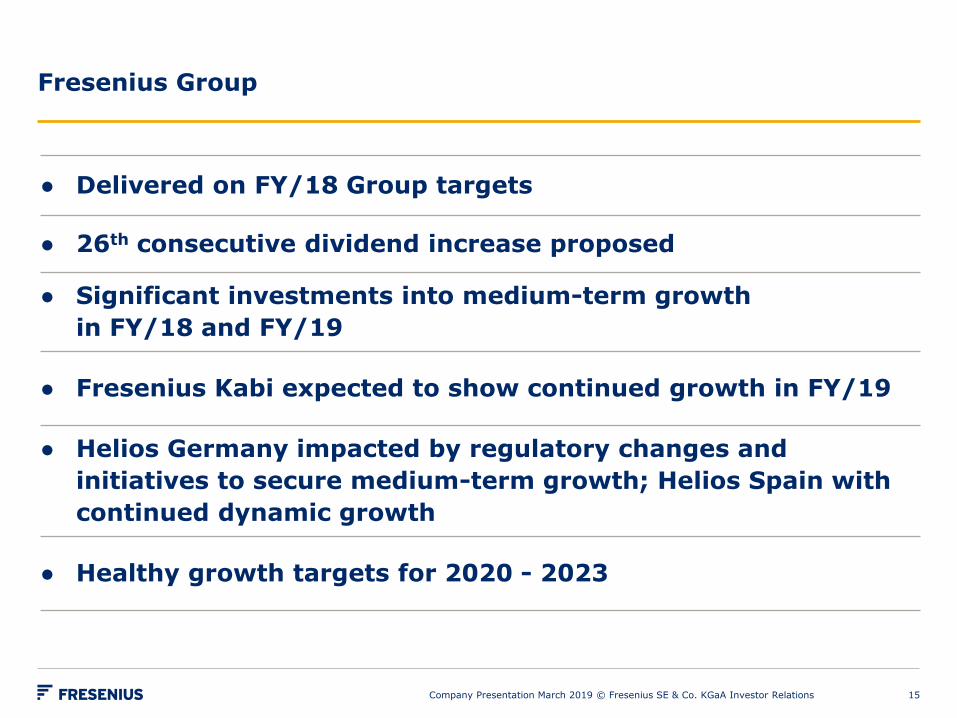
Fresenius Group
● Delivered on FY/18 Group targets
● 26th consecutive dividend increase proposed
● Significant investments into medium-term growth
in FY/18 and FY/19
● Fresenius Kabi expected to show continued growth in FY/19
● Helios Germany impacted by regulatory changes and
initiatives to secure medium-term growth; Helios Spain with
continued dynamic growth
● Healthy growth targets for 2020 - 2023
Company Presentation March 2019 © Fresenius SE & Co. KGaA Investor Relations 15
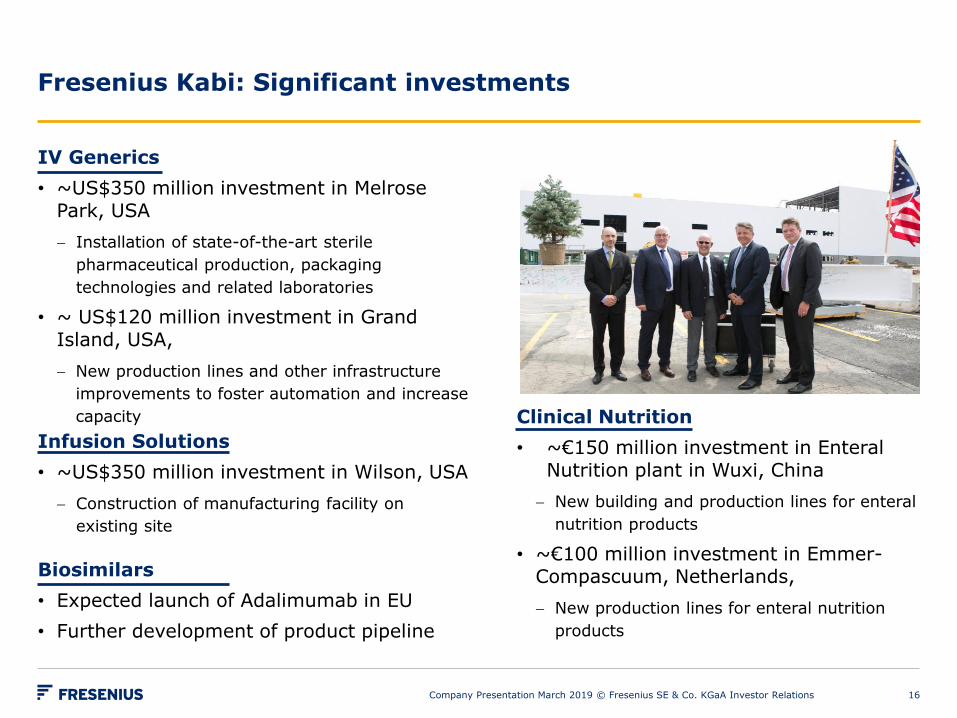
Fresenius Kabi: Significant investments
IV Generics
• ~US$350 million investment in Melrose Park, USA
Installation of state-of-the-art sterile
pharmaceutical production, packaging
technologies and related laboratories
• ~ US$120 million investment in Grand
Island, USA,
New production lines and other infrastructure
improvements to foster automation and increase
capacity Clinical Nutrition
• ~€150 million investment in Enteral Nutrition plant in Wuxi, China
New building and production lines for enteral
nutrition products
• ~€100 million investment in Emmer-Compascuum, Netherlands,
New production lines for enteral nutrition
products
Company Presentation March 2019 © Fresenius SE & Co. KGaA Investor Relations
Infusion Solutions
• ~US$350 million investment in Wilson, USA
Construction of manufacturing facility on
existing site
Biosimilars
• Expected launch of Adalimumab in EU
• Further development of product pipeline
16
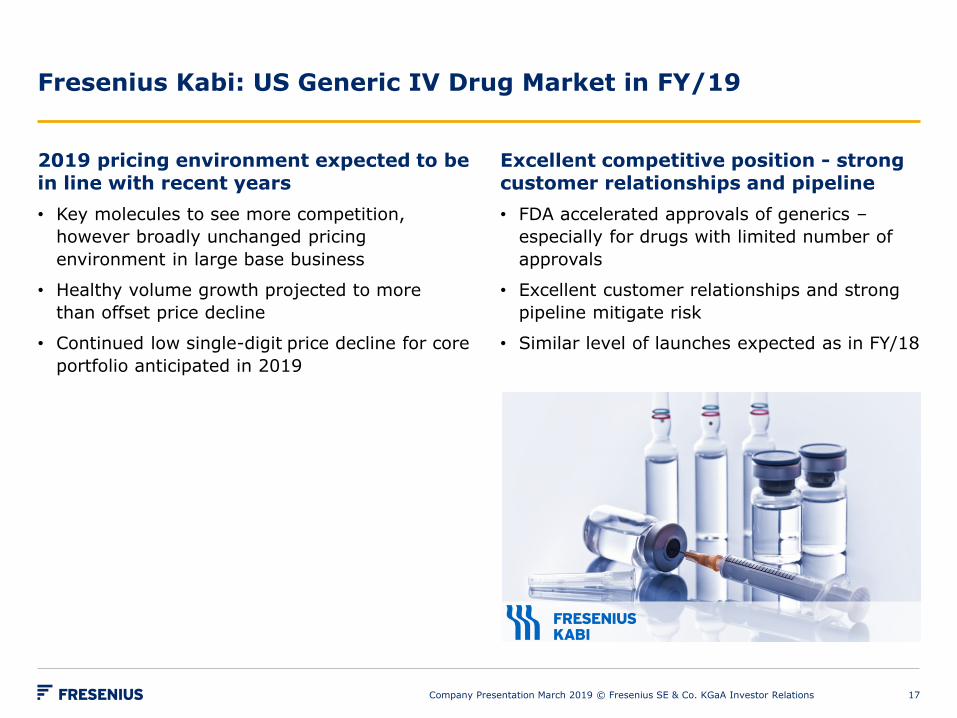
Fresenius Kabi: US Generic IV Drug Market in FY/19
2019 pricing environment expected to be in line with recent years
• Key molecules to see more competition,
however broadly unchanged pricing
environment in large base business
• Healthy volume growth projected to more
than offset price decline
• Continued low single-digit price decline for core
portfolio anticipated in 2019
Excellent competitive position - strong customer relationships and pipeline
• FDA accelerated approvals of generics –
especially for drugs with limited number of
approvals
• Excellent customer relationships and strong
pipeline mitigate risk
• Similar level of launches expected as in FY/18
Company Presentation March 2019 © Fresenius SE & Co. KGaA Investor Relations 17

Helios Germany: Improved visibility
Active management of regulatory challenges by adjusting structures
• Clustering (to fulfill minimum number of
indications)
• Setting up regional centers
• Increased regional cooperation between clinics
Being attractive for nurses
• Central, regional and local recruiting measures
• Impact of minimum staffing levels on FY/19
financials benign
• “Pflegetarifvertrag” – collective bargaining for
nurses
Profit from trend towards outpatient services
• Attractive network of ~125 MVZs (polyclinics)
• Leverage and scaling of outpatient services
New business models
• Develop internationally scalable business models
• New business areas for Germany (e.g. video
consulting, occupational health)
• Digitization for comprehensive cross-sector care
DRG change from 2020 onwards
• We expect that the impact on FY/20 financials
is manageable
Company Presentation March 2019 © Fresenius SE & Co. KGaA Investor Relations 18
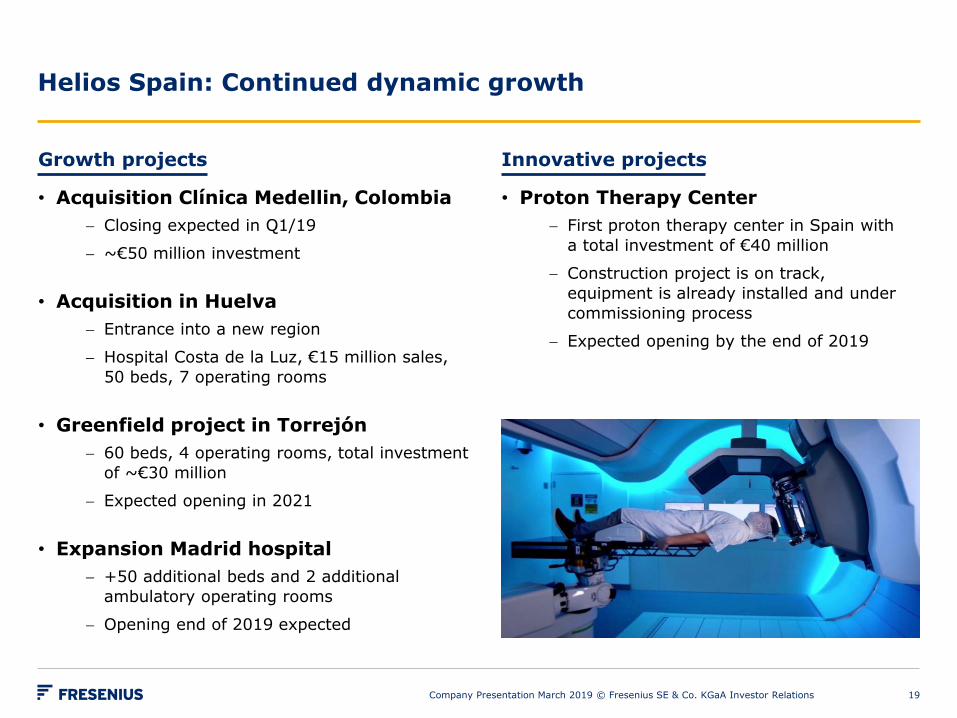
Innovative projects
• Proton Therapy Center
First proton therapy center in Spain with
a total investment of €40 million
Construction project is on track,
equipment is already installed and under
commissioning process
Expected opening by the end of 2019
Helios Spain: Continued dynamic growth
Growth projects
• Acquisition Clínica Medellin, Colombia
Closing expected in Q1/19
~€50 million investment
• Acquisition in Huelva
Entrance into a new region
Hospital Costa de la Luz, €15 million sales,
50 beds, 7 operating rooms
• Greenfield project in Torrejón
60 beds, 4 operating rooms, total investment
of ~€30 million
Expected opening in 2021
• Expansion Madrid hospital
+50 additional beds and 2 additional
ambulatory operating rooms
Opening end of 2019 expected
Company Presentation March 2019 © Fresenius SE & Co. KGaA Investor Relations 19
Financial Review FY/18
Company Presentation March 2019 © Fresenius SE & Co. KGaA Investor Relations 20
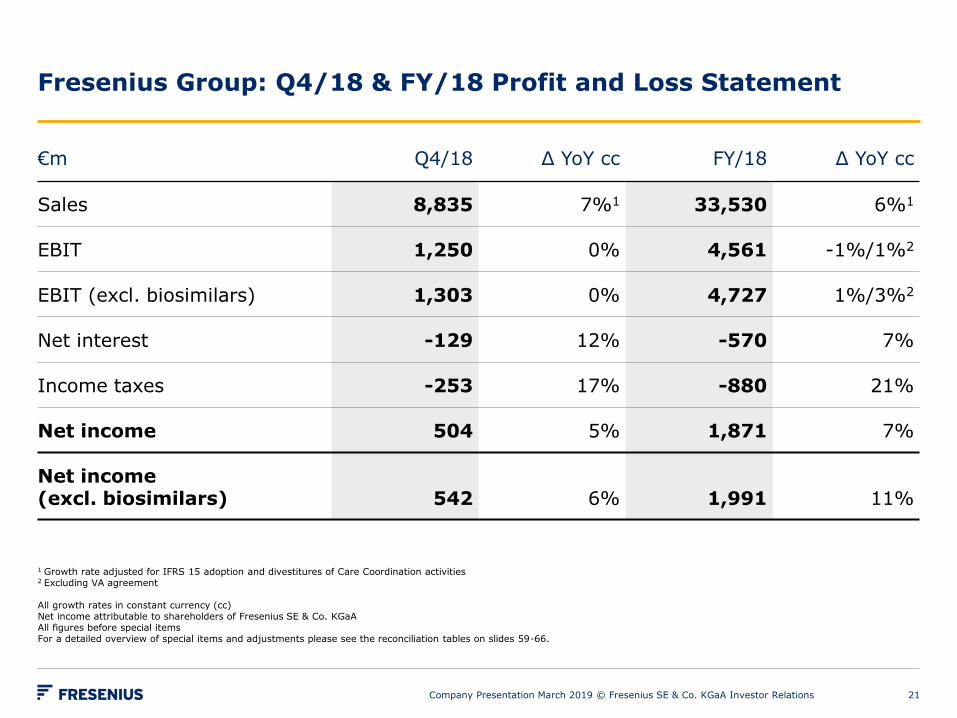
Fresenius Group: Q4/18 & FY/18 Profit and Loss Statement
Company Presentation March 2019 © Fresenius SE & Co. KGaA Investor Relations
€m Q4/18 Δ YoY cc FY/18 Δ YoY cc
Sales 8,835 7%1 33,530 6%1
EBIT 1,250 0% 4,561 -1%/1%2
EBIT (excl. biosimilars) 1,303 0% 4,727 1%/3%2
Net interest -129 12% -570 7%
Income taxes -253 17% -880 21%
Net income 504 5% 1,871 7%
Net income(excl. biosimilars) 542 6% 1,991 11%
1 Growth rate adjusted for IFRS 15 adoption and divestitures of Care Coordination activities 2 Excluding VA agreement
All growth rates in constant currency (cc) Net income attributable to shareholders of Fresenius SE & Co. KGaAAll figures before special itemsFor a detailed overview of special items and adjustments please see the reconciliation tables on slides 59-66.
21

1 Growth rates adjusted for IFRS 15 adoption and divestitures of Care Coordination activities 2 EBIT reported3 Excl. biosimilars4 Adjusted for transfer of German post-acute care business from Helios to Vamed
All figures before special itemsFor a detailed overview of special items and adjustments please see the reconciliation tables on slides 59-66.
Fresenius Group: Q4/18 Business Segment Growth
Organic sales growth
Company Presentation March 2019 © Fresenius SE & Co. KGaA Investor Relations
EBIT growth (cc)
+6%
+7%
+4%
+20%
12%2
6%/8%3
-2%/2%4
39%/11%4
+6%1 0%2/0%2,3
22

Fresenius Kabi: Expected Organic Sales Growth 2019
Company Presentation March 2019 © Fresenius SE & Co. KGaA Investor Relations
North America
Low to mid-single-digit growth
• Growth in 2019 mainly driven by new drug launches and further ramp-up of
pre-filled syringe business
• More competition for key molecules; broadly unchanged pricing environment in base business
• Continued significant launch activity in 2019
Europe
Low to mid-single-digit growth
• Enteral nutrition with dynamic growth momentum
• Launch of biosimilar Adalimumab expected
23

Fresenius Kabi: Expected Organic Sales Growth 2019
Emerging Markets
Likely double-digit growth
China:
• Attractive growth prospects
• Growth particularly driven by Clinical Nutrition and IV drugs
Asia-Pacific ex China:
• Very positive sentiment
• Strong growth momentum expectedLatin America/Africa:
• Continued strong growth expected
Company Presentation March 2019 © Fresenius SE & Co. KGaA Investor Relations 24
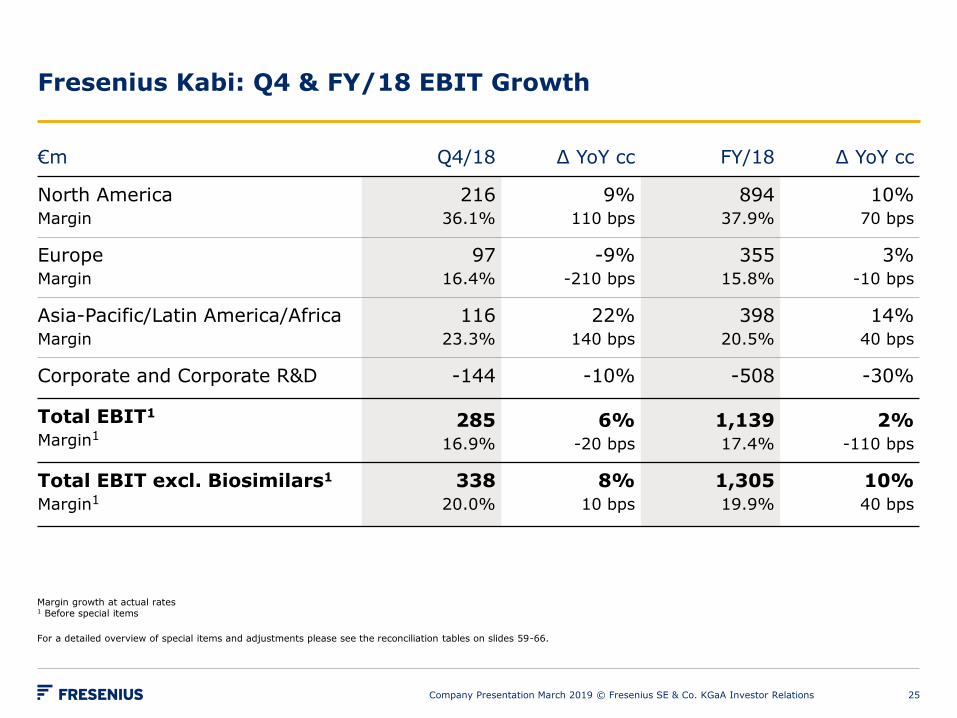
Fresenius Kabi: Q4 & FY/18 EBIT Growth
Company Presentation March 2019 © Fresenius SE & Co. KGaA Investor Relations
€m Q4/18 Δ YoY cc FY/18 Δ YoY cc
North AmericaMargin
21636.1%
9%110 bps
89437.9%
10%70 bps
EuropeMargin
9716.4%
-9%-210 bps
35515.8%
3%-10 bps
Asia-Pacific/Latin America/AfricaMargin
11623.3%
22%140 bps
39820.5%
14%40 bps
Corporate and Corporate R&D -144 -10% -508 -30%
Total EBIT1
Margin1285
16.9%
6%-20 bps
1,13917.4%
2%-110 bps
Total EBIT excl. Biosimilars1
Margin1
33820.0%
8%10 bps
1,30519.9%
10%40 bps
Margin growth at actual rates1 Before special items
For a detailed overview of special items and adjustments please see the reconciliation tables on slides 59-66.
25
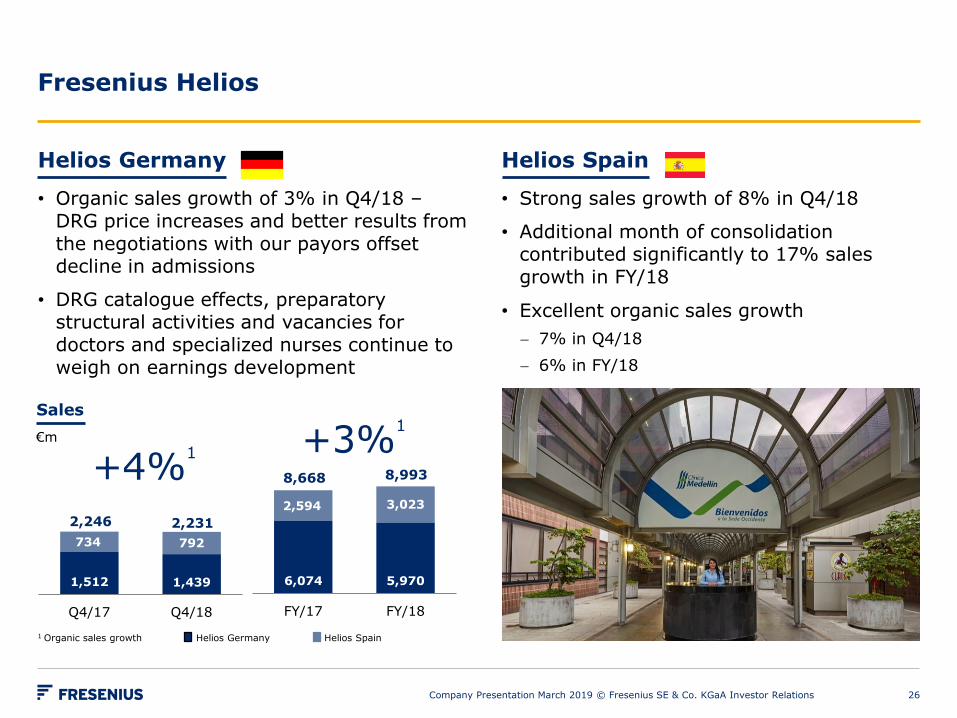
6,074 5,970
2,594 3,023
FY/17 FY/18
1,512 1,439
734 792
Q4/17 Q4/18
1 Organic sales growth
+4%1
2,231
Helios Germany Helios Spain
Fresenius Helios
Helios Germany
• Organic sales growth of 3% in Q4/18 –DRG price increases and better results from
the negotiations with our payors offset decline in admissions
• DRG catalogue effects, preparatory structural activities and vacancies for doctors and specialized nurses continue to weigh on earnings development
Helios Spain
• Strong sales growth of 8% in Q4/18
• Additional month of consolidation contributed significantly to 17% sales growth in FY/18
• Excellent organic sales growth
7% in Q4/18
6% in FY/18
Sales
€m
Company Presentation March 2019 © Fresenius SE & Co. KGaA Investor Relations
2,246
+3%1
8,9938,668
26

Fresenius Helios: Q4 & FY/18 Key Financials
Company Presentation March 2019 © Fresenius SE & Co. KGaA Investor Relations
€m Q4/18 Δ YoY FY/18 Δ YoY
Total sales 2,231 -1%/4%2 8,993 4%/6%2
Thereof Helios Germany 1,439 -5%/3%2 5,970 -2%/2%2
Thereof Helios Spain1 792 8% 3,023 17%
Total EBIT
Margin
277
12.4%
-2%/2%2
-20 bps
1,052
11.7%
0%/3%2
-40 bps
Thereof Helios Germany
Margin
137
9.5%
-22%/-15%2
-210 bps
625
10.5%
-14%/-10%2
-140 bps
Thereof Helios Spain1
Margin
127
16.0%
19%
+140 bps
413
13.7%
26%
+110 bps
Thereof Corporate 13 -- 14 --
1 Consolidated since February 1, 20172 Adjusted for German post-acute care business transferred to Vamed
27

Fresenius Vamed
1 Without German post-acute care business acquired from Helios 2 Project business only
• Both business segments contributed to the
excellent organic sales growth of 16% in
FY/18
• Sales share of more stable and high margin service business clearly outstrips project business
• €1,227 m order intake at all-time high; strong foundation for future growth
€m Q4/18 Δ YoY FY/18 Δ YoY
Total sales
Thereof
organic sales
697 45%
22%1
20%
1,688 37%
19%1
16%
Project
business
360 18% 712 17%
Service
business
337 93%
28%1
976 57%
20%1
Total EBIT 61 39%
11%1
110 45%
9%1
Order intake2 660 65% 1,227 12%
Order
backlog2
2,420 13%
Company Presentation March 2019 © Fresenius SE & Co. KGaA Investor Relations 28
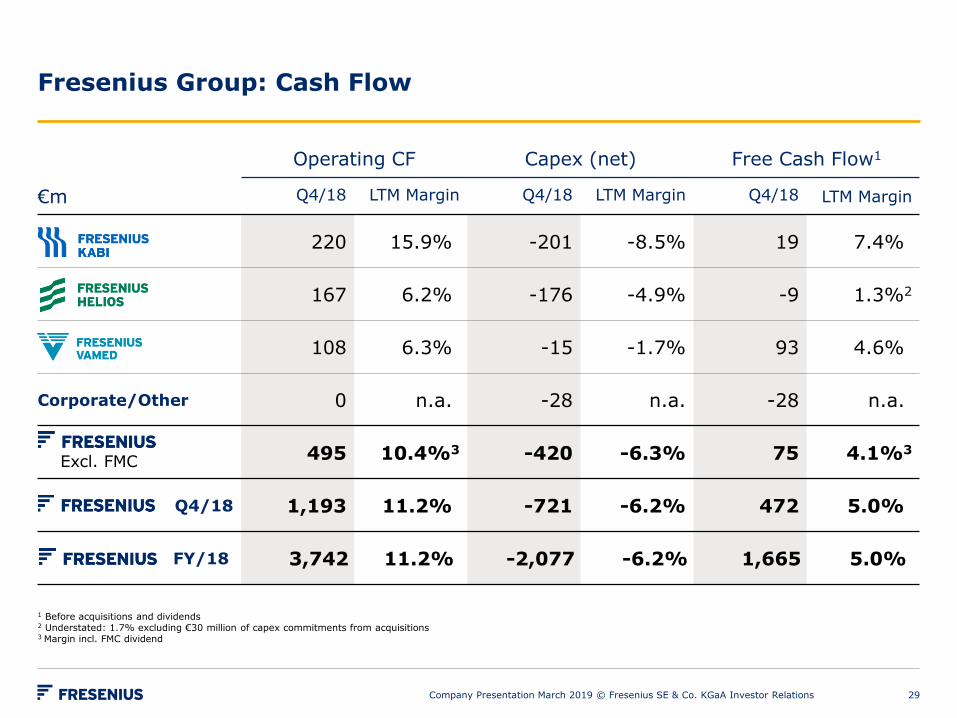
Fresenius Group: Cash Flow
Operating CF Capex (net) Free Cash Flow1
€m Q4/18 LTM Margin Q4/18 LTM Margin Q4/18 LTM Margin
220 15.9% -201 -8.5% 19 7.4%
167 6.2% -176 -4.9% -9 1.3%2
108 6.3% -15 -1.7% 93 4.6%
Corporate/Other 0 n.a. -28 n.a. -28 n.a.
495 10.4%3 -420 -6.3% 75 4.1%3
Q4/18 1,193 11.2% -721 -6.2% 472 5.0%
FY/18 3,742 11.2% -2,077 -6.2% 1,665 5.0%
1 Before acquisitions and dividends2 Understated: 1.7% excluding €30 million of capex commitments from acquisitions 3 Margin incl. FMC dividend
Excl. FMC
Company Presentation March 2019 © Fresenius SE & Co. KGaA Investor Relations 29
Attachments
Company Presentation March 2019 © Fresenius SE & Co. KGaA Investor Relations 30

Fresenius Group: Calculation of Noncontrolling Interest
Company Presentation March 2019 © Fresenius SE & Co. KGaA Investor Relations
€m FY/18 FY/17
Earnings before tax and noncontrolling interest 3,991 4,178
Taxes -880 -1,168
Noncontrolling interest, thereof -1,240 -1,194
Fresenius Medical Care net income not attributable to
Fresenius (FY/18: ~69%)
-925 -864
Noncontrolling interest holders in Fresenius Medical Care -244 -274
Noncontrolling interest holders in Fresenius Kabi (-€43 m),
Fresenius Helios (-€10 m), Fresenius Vamed (-€1 m) and due
to Fresenius Vamed’s 23% external ownership (-€17 m)
-71 -56
Net income attributable to Fresenius SE & Co. KGaA 1,871 1,816
Before special items
For a detailed overview of special items please see the reconciliation tables on slides 59-66.
31
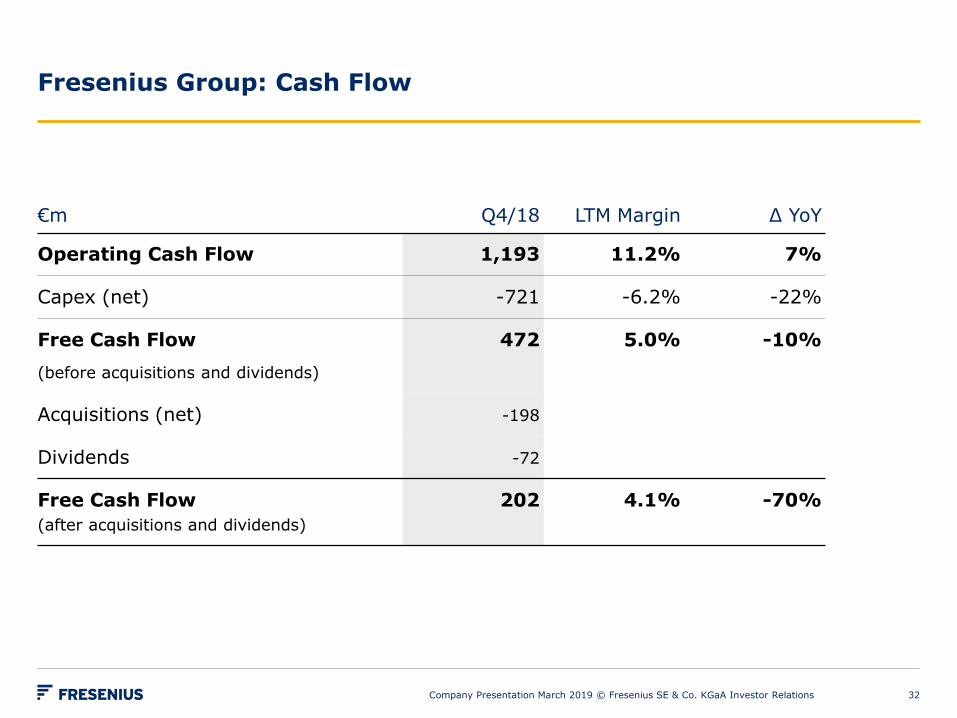
Fresenius Group: Cash Flow
Company Presentation March 2019 © Fresenius SE & Co. KGaA Investor Relations
€m Q4/18 LTM Margin Δ YoY
Operating Cash Flow 1,193 11.2% 7%
Capex (net) -721 -6.2% -22%
Free Cash Flow
(before acquisitions and dividends)
472 5.0% -10%
Acquisitions (net) -198
Dividends -72
Free Cash Flow
(after acquisitions and dividends)
202 4.1% -70%
32
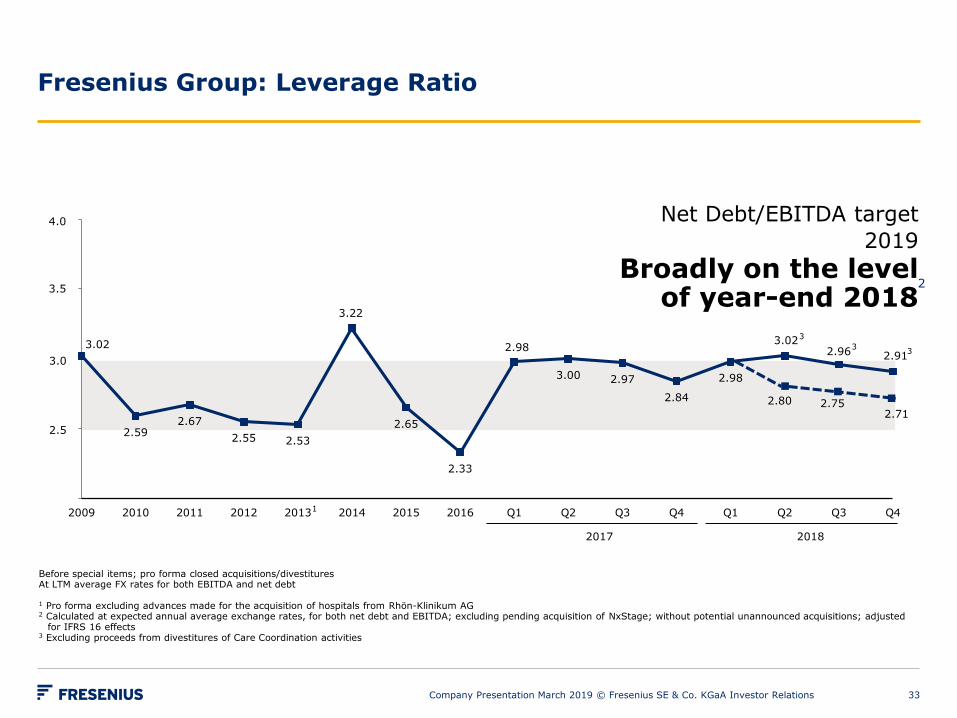
3.02
2.592.67
2.55 2.53
3.22
2.65
2.33
2.98
3.00 2.97
2.84
2.98
3.022.96 2.91
2,00
2,50
3,00
3,50
4,00
2009 2010 2011 2012 2013 2014 2015 2016 Q1 Q2 Q3 Q4 Q1 Q2 Q3 Q4
Before special items; pro forma closed acquisitions/divestituresAt LTM average FX rates for both EBITDA and net debt
1 Pro forma excluding advances made for the acquisition of hospitals from Rhön-Klinikum AG2 Calculated at expected annual average exchange rates, for both net debt and EBITDA; excluding pending acquisition of NxStage; without potential unannounced acquisitions; adjusted
for IFRS 16 effects3 Excluding proceeds from divestitures of Care Coordination activities
Fresenius Group: Leverage Ratio
Company Presentation March 2019 © Fresenius SE & Co. KGaA Investor Relations
Net Debt/EBITDA target
2019
Broadly on the level of year-end 2018
1
4.0
3.5
3.0
2.5
2
2017 2018
2.752.71
3
33
2.80
33
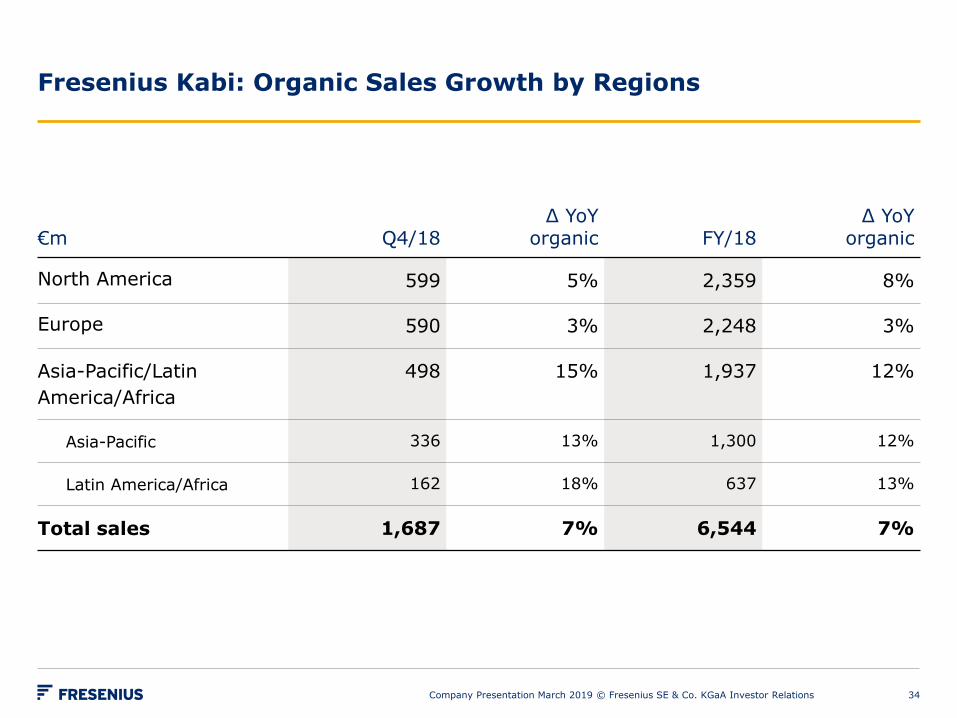
Fresenius Kabi: Organic Sales Growth by Regions
€m Q4/18Δ YoY
organic FY/18Δ YoY
organic
North America 599 5% 2,359 8%
Europe 590 3% 2,248 3%
Asia-Pacific/Latin
America/Africa
498 15% 1,937 12%
Asia-Pacific 336 13% 1,300 12%
Latin America/Africa 162 18% 637 13%
Total sales 1,687 7% 6,544 7%
Company Presentation March 2019 © Fresenius SE & Co. KGaA Investor Relations 34

Fresenius Kabi: Organic Sales Growth by Product Segment
Company Presentation March 2019 © Fresenius SE & Co. KGaA Investor Relations
€m Q4/18Δ YoY
organic FY/18Δ YoY
organic
IV Drugs 710 5% 2,735 5%
Infusion Therapy 226 1% 929 7%
Clinical Nutrition 458 15% 1,796 13%
Medical Devices/
Transfusion Technology
293 5% 1,084 4%
Total sales 1,687 7% 6,544 7%
35
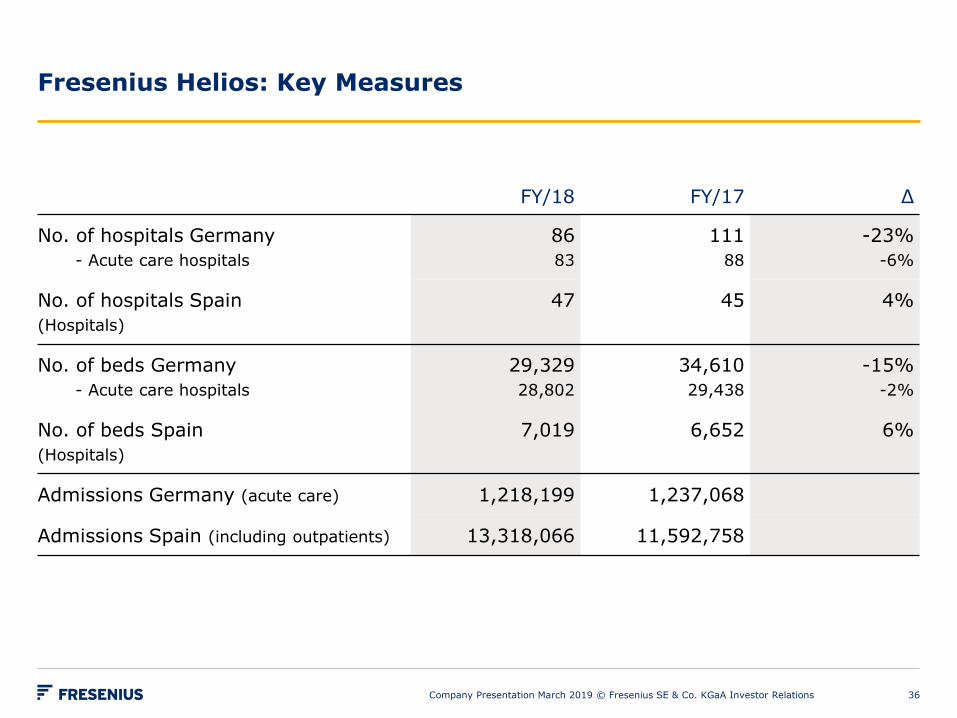
Fresenius Helios: Key Measures
Company Presentation March 2019 © Fresenius SE & Co. KGaA Investor Relations
FY/18 FY/17 Δ
No. of hospitals Germany
- Acute care hospitals
86
83
111
88
-23%
-6%
No. of hospitals Spain
(Hospitals)
47 45 4%
No. of beds Germany
- Acute care hospitals
29,329
28,802
34,610
29,438
-15%
-2%
No. of beds Spain
(Hospitals)
7,019 6,652 6%
Admissions Germany (acute care) 1,218,199 1,237,068
Admissions Spain (including outpatients) 13,318,066 11,592,758
36
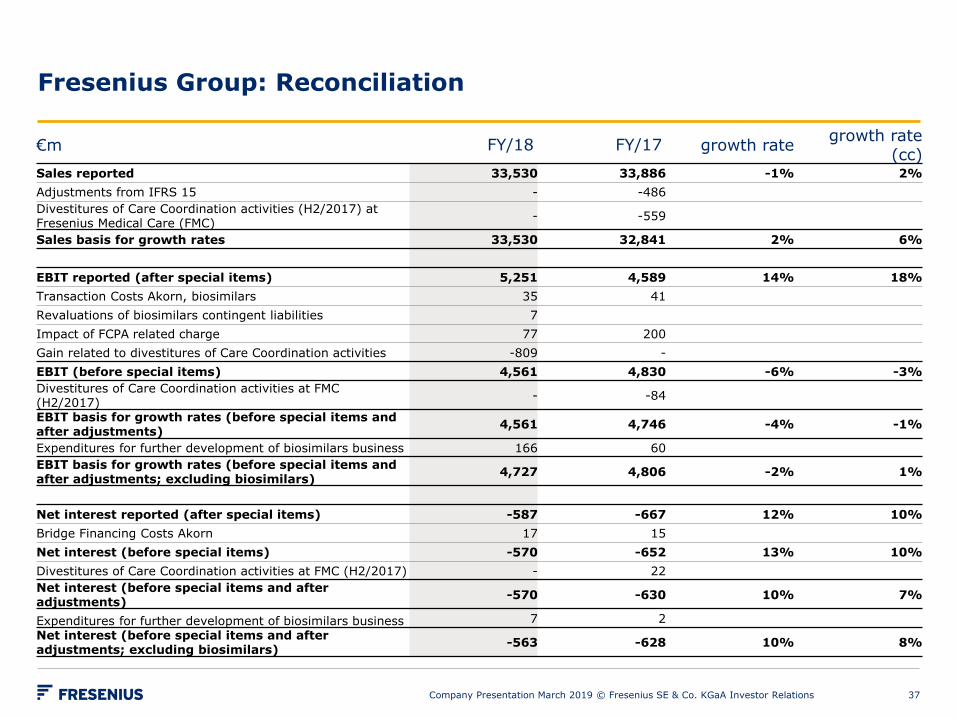
Fresenius Group: Reconciliation
Company Presentation March 2019 © Fresenius SE & Co. KGaA Investor Relations
€m FY/18 FY/17 growth rategrowth rate
(cc)Sales reported 33,530 33,886 -1% 2%
Adjustments from IFRS 15 - -486
Divestitures of Care Coordination activities (H2/2017) at Fresenius Medical Care (FMC)
- -559
Sales basis for growth rates 33,530 32,841 2% 6%
EBIT reported (after special items) 5,251 4,589 14% 18%
Transaction Costs Akorn, biosimilars 35 41
Revaluations of biosimilars contingent liabilities 7
Impact of FCPA related charge 77 200
Gain related to divestitures of Care Coordination activities -809 -
EBIT (before special items) 4,561 4,830 -6% -3%
Divestitures of Care Coordination activities at FMC (H2/2017)
- -84
EBIT basis for growth rates (before special items and after adjustments)
4,561 4,746 -4% -1%
Expenditures for further development of biosimilars business 166 60
EBIT basis for growth rates (before special items and after adjustments; excluding biosimilars)
4,727 4,806 -2% 1%
Net interest reported (after special items) -587 -667 12% 10%
Bridge Financing Costs Akorn 17 15
Net interest (before special items) -570 -652 13% 10%
Divestitures of Care Coordination activities at FMC (H2/2017) - 22
Net interest (before special items and after adjustments)
-570 -630 10% 7%
Expenditures for further development of biosimilars business 7 2
Net interest (before special items and after adjustments; excluding biosimilars)
-563 -628 10% 8%
37
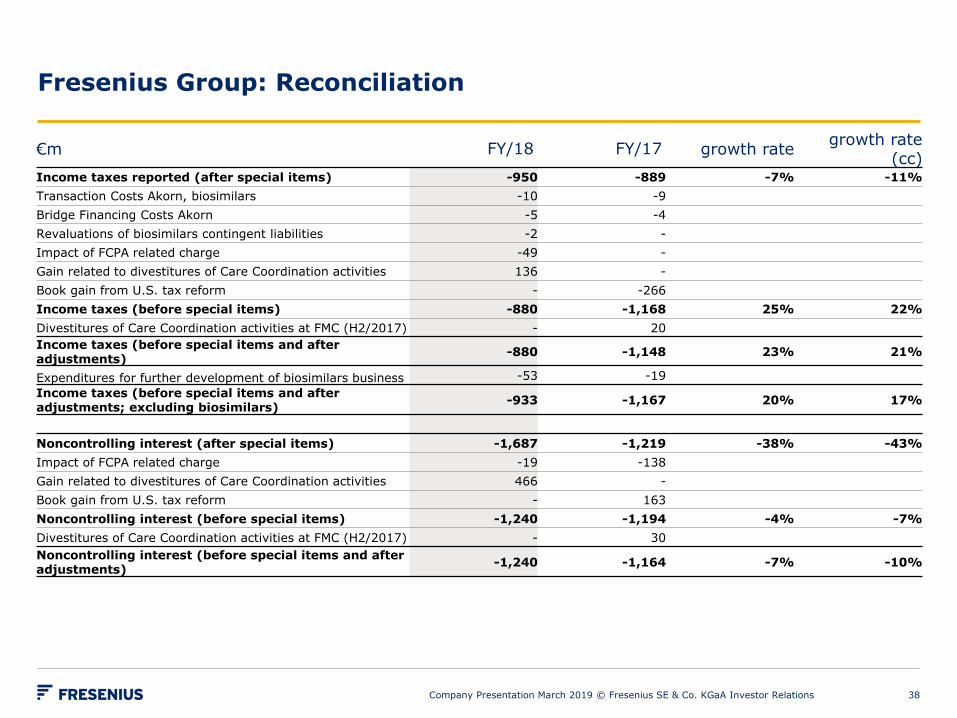
Fresenius Group: Reconciliation
Company Presentation March 2019 © Fresenius SE & Co. KGaA Investor Relations
€m FY/18 FY/17 growth rategrowth rate
(cc)Income taxes reported (after special items) -950 -889 -7% -11%
Transaction Costs Akorn, biosimilars -10 -9
Bridge Financing Costs Akorn -5 -4
Revaluations of biosimilars contingent liabilities -2 -
Impact of FCPA related charge -49 -
Gain related to divestitures of Care Coordination activities 136 -
Book gain from U.S. tax reform - -266
Income taxes (before special items) -880 -1,168 25% 22%
Divestitures of Care Coordination activities at FMC (H2/2017) - 20
Income taxes (before special items and after adjustments)
-880 -1,148 23% 21%
Expenditures for further development of biosimilars business -53 -19
Income taxes (before special items and after adjustments; excluding biosimilars)
-933 -1,167 20% 17%
Noncontrolling interest (after special items) -1,687 -1,219 -38% -43%
Impact of FCPA related charge -19 -138
Gain related to divestitures of Care Coordination activities 466 -
Book gain from U.S. tax reform - 163
Noncontrolling interest (before special items) -1,240 -1,194 -4% -7%
Divestitures of Care Coordination activities at FMC (H2/2017) - 30
Noncontrolling interest (before special items and after adjustments)
-1,240 -1,164 -7% -10%
38
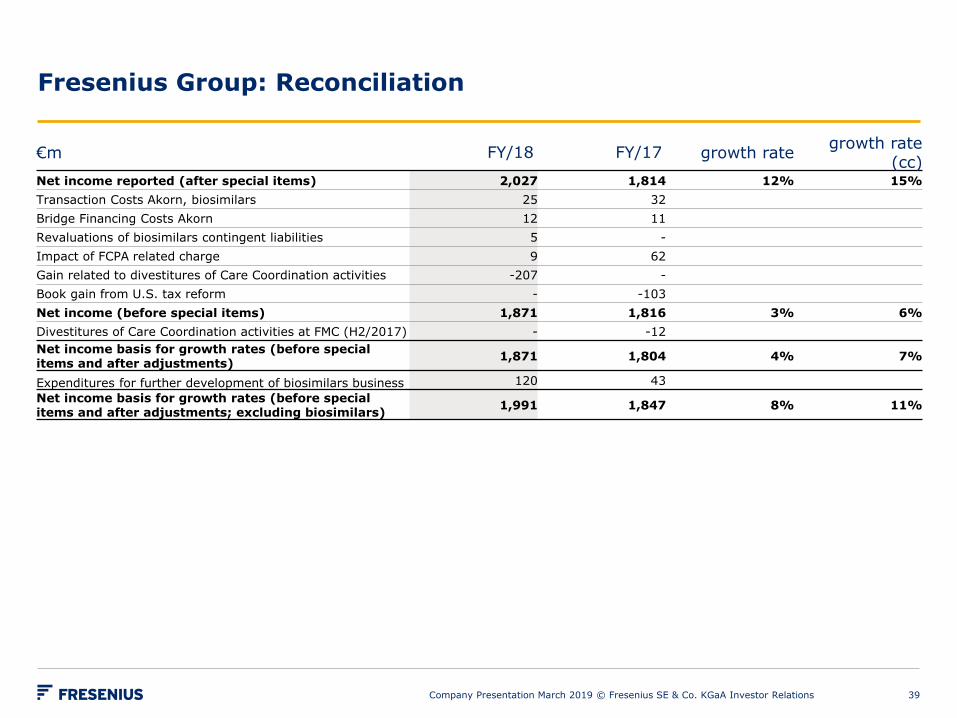
Fresenius Group: Reconciliation
Company Presentation March 2019 © Fresenius SE & Co. KGaA Investor Relations
€m FY/18 FY/17 growth rategrowth rate
(cc)Net income reported (after special items) 2,027 1,814 12% 15%
Transaction Costs Akorn, biosimilars 25 32
Bridge Financing Costs Akorn 12 11
Revaluations of biosimilars contingent liabilities 5 -
Impact of FCPA related charge 9 62
Gain related to divestitures of Care Coordination activities -207 -
Book gain from U.S. tax reform - -103
Net income (before special items) 1,871 1,816 3% 6%
Divestitures of Care Coordination activities at FMC (H2/2017) - -12
Net income basis for growth rates (before special items and after adjustments)
1,871 1,804 4% 7%
Expenditures for further development of biosimilars business 120 43
Net income basis for growth rates (before special items and after adjustments; excluding biosimilars)
1,991 1,847 8% 11%
39
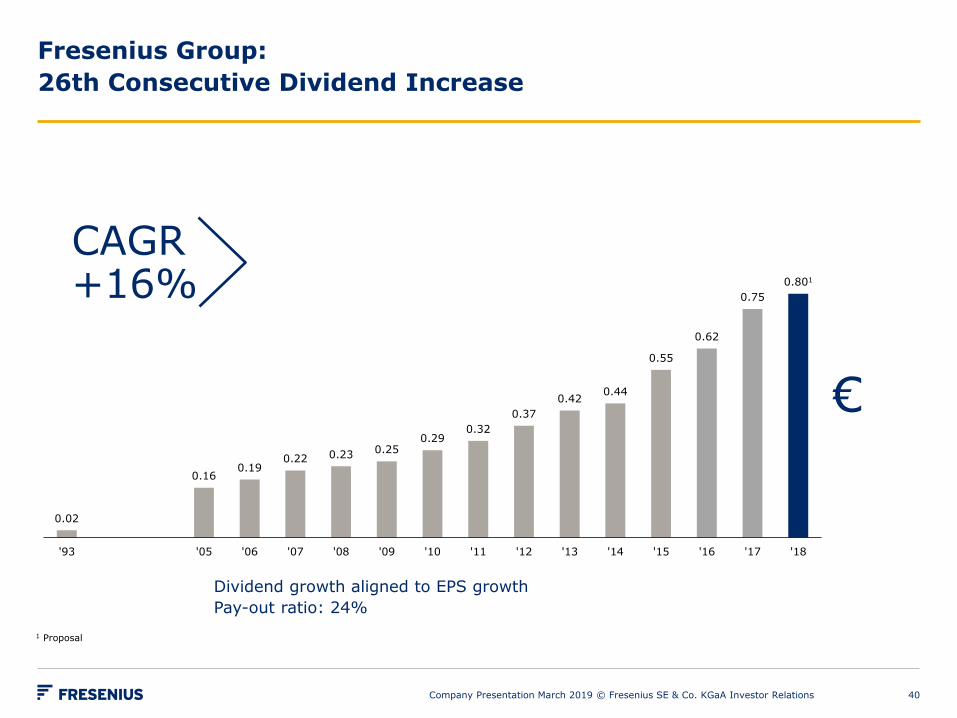
Fresenius Group:
26th Consecutive Dividend Increase
Company Presentation March 2019 © Fresenius SE & Co. KGaA Investor Relations
Dividend growth aligned to EPS growth
Pay-out ratio: 24%
0.02
0.160.19
0.22 0.23 0.250.29
0.32
0.37
0.420.44
0.55
0.62
0.75
0.801
'93 '05 '06 '07 '08 '09 '10 '11 '12 '13 '14 '15 '16 '17 '18
1 Proposal
CAGR+16%
€
40

Financial Calendar / Contact
Financial Calendar
02 May 2019 Results Q1/19
17 May 2019 Annual General Meeting
30 July 2019 Results Q2/19
29 October 2019 Results Q3/19
Please note that these dates could be subject to change.
Contact
Investor Relations
Fresenius SE & Co. KGaA
phone: +49 6172 608-2485
e-mail: [email protected]
For further information and current news: www.fresenius.com
Follow us on Twitter www.twitter.com/fresenius_ir
and LinkedIn: www.linkedin.com/company/fresenius-investor-relations
Company Presentation March 2019 © Fresenius SE & Co. KGaA Investor Relations 41