Company Presentation - Indofood Agri Resources...
25
Company Presentation – 4Q and FY 2012 Results 27 Feb 2013 Company Presentation – 2Q and 1H 2013 Results 14 Aug 2013
Transcript of Company Presentation - Indofood Agri Resources...
Company Presentation – 4Q and FY 2012 Results27 Feb 2013
Company Presentation – 2Q and 1H 2013 Results14 Aug 2013
Integrated Agribusiness with Leading Brands
1 1
Click to edit Master title style
Presentation Outline
11 Plantation Highlights Plantation Highlights
22 Financial Highlights Financial Highlights
33 Strategies and ExpansionStrategies and Expansion
44 AppendixAppendix
2
Section 1Plantation Highlights
Integrated Agribusiness with Leading Brands
3
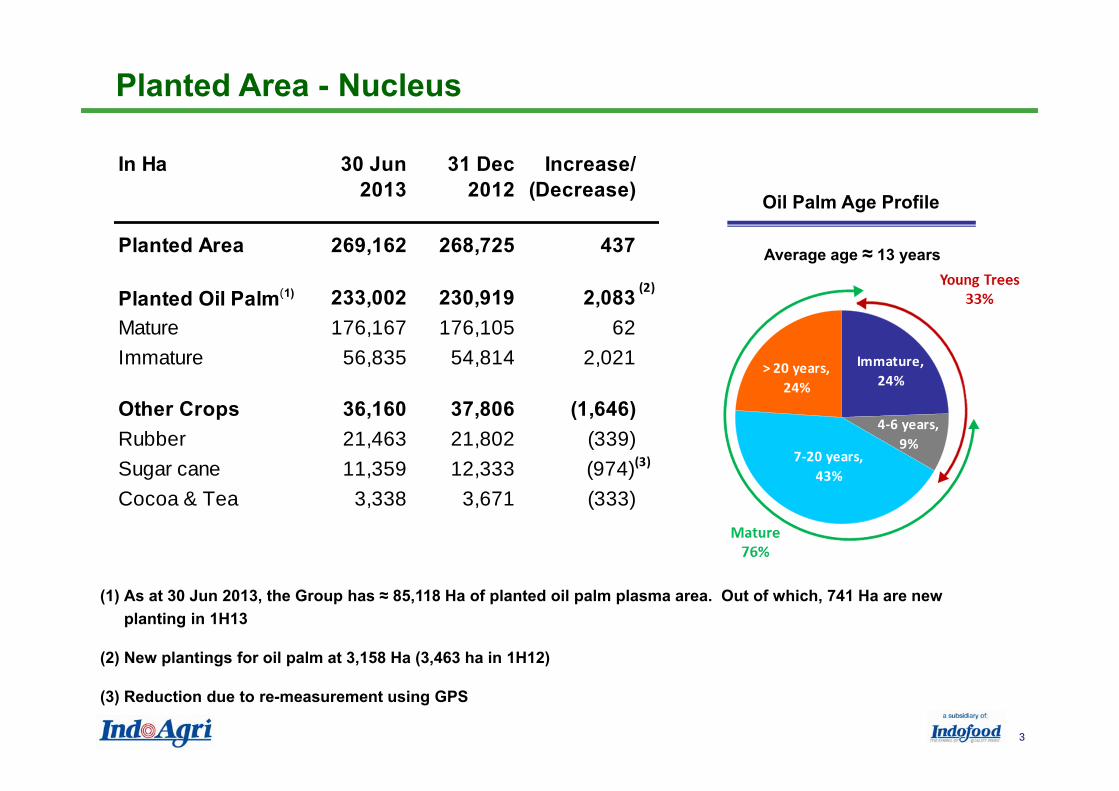
Average age ≈ 13 years
(1) As at 30 Jun 2013, the Group has ≈ 85,118 Ha of planted oil palm plasma area. Out of which, 741 Ha are new planting in 1H13
(2) New plantings for oil palm at 3,158 Ha (3,463 ha in 1H12)
(3) Reduction due to re-measurement using GPS
Planted Area - Nucleus
Oil Palm Age Profile
In Ha 30 Jun 2013
31 Dec 2012
Increase/(Decrease)
Planted Area 269,162 268,725 437
Planted Oil Palm(1) 233,002 230,919 2,083 Mature 176,167 176,105 62 Immature 56,835 54,814 2,021
Other Crops 36,160 37,806 (1,646)Rubber 21,463 21,802 (339)Sugar cane 11,359 12,333 (974)Cocoa & Tea 3,338 3,671 (333)
(2)
(3)
> 20 years, 24%
Immature, 24%
4‐6 years, 9%
7‐20 years, 43%
Integrated Agribusiness with Leading Brands
4
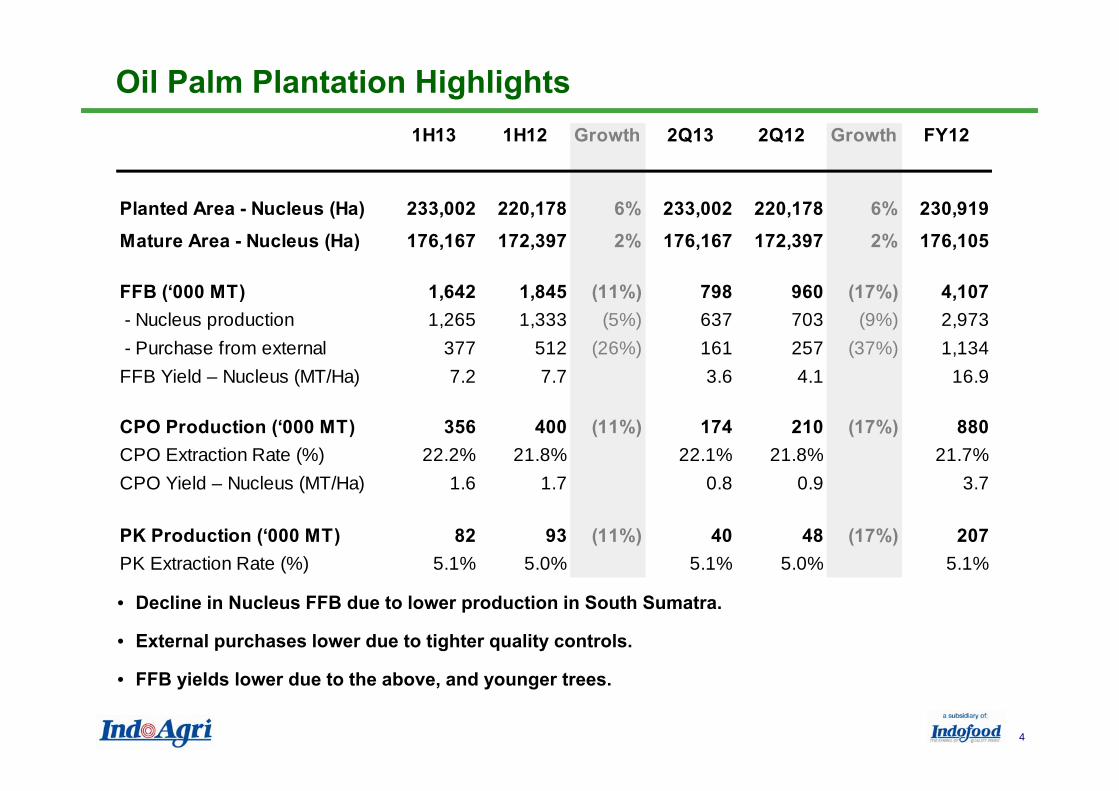
Oil Palm Plantation Highlights
• Decline in Nucleus FFB due to lower production in South Sumatra.
• External purchases lower due to tighter quality controls.
• FFB yields lower due to the above, and younger trees.
1H13 1H12 Growth 2Q13 2Q12 Growth FY12
Planted Area - Nucleus (Ha) 233,002 220,178 6% 233,002 220,178 6% 230,919Mature Area - Nucleus (Ha) 176,167 172,397 2% 176,167 172,397 2% 176,105
FFB (‘000 MT) 1,642 1,845 (11%) 798 960 (17%) 4,107 - Nucleus production 1,265 1,333 (5%) 637 703 (9%) 2,973 - Purchase from external 377 512 (26%) 161 257 (37%) 1,134FFB Yield – Nucleus (MT/Ha) 7.2 7.7 3.6 4.1 16.9
CPO Production (‘000 MT) 356 400 (11%) 174 210 (17%) 880CPO Extraction Rate (%) 22.2% 21.8% 22.1% 21.8% 21.7%CPO Yield – Nucleus (MT/Ha) 1.6 1.7 0.8 0.9 3.7
PK Production (‘000 MT) 82 93 (11%) 40 48 (17%) 207PK Extraction Rate (%) 5.1% 5.0% 5.1% 5.0% 5.1%
Integrated Agribusiness with Leading Brands
5
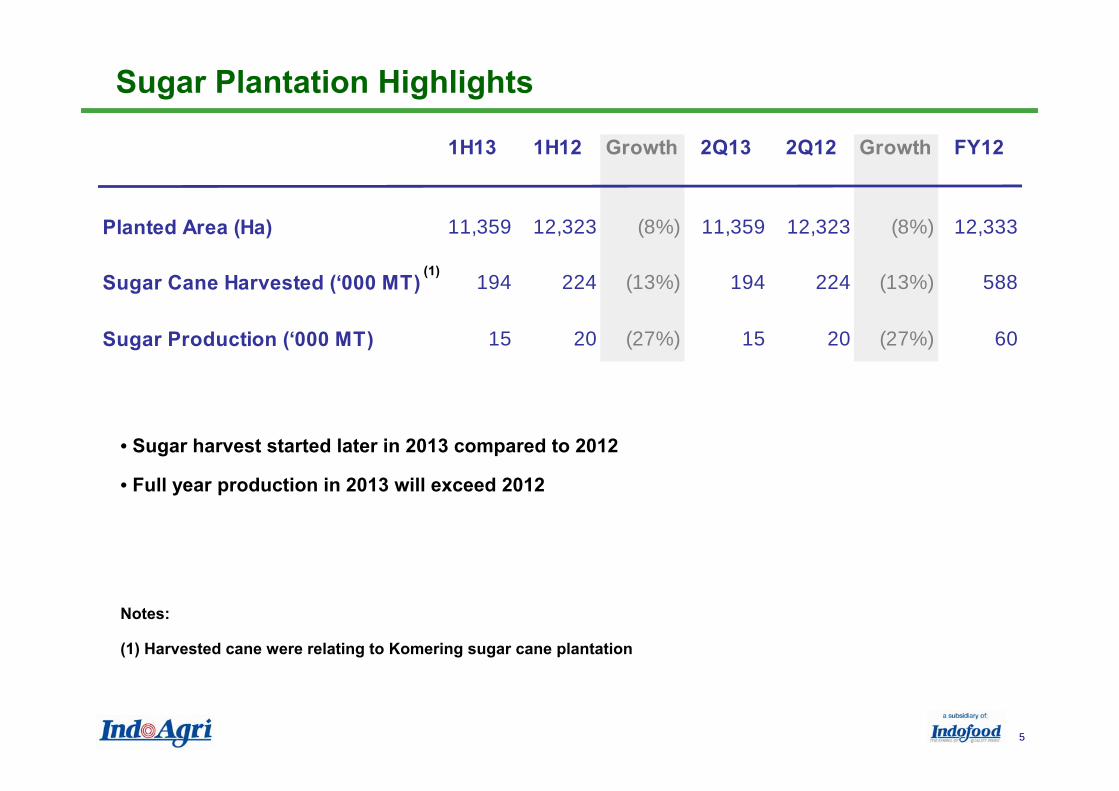
Sugar Plantation Highlights
Notes:
(1) Harvested cane were relating to Komering sugar cane plantation
• Sugar harvest started later in 2013 compared to 2012
• Full year production in 2013 will exceed 2012
1H13 1H12 Growth 2Q13 2Q12 Growth FY12
Planted Area (Ha) 11,359 12,323 (8%) 11,359 12,323 (8%) 12,333
Sugar Cane Harvested (‘000 MT) 194 224 (13%) 194 224 (13%) 588
Sugar Production (‘000 MT) 15 20 (27%) 15 20 (27%) 60
(1)
Integrated Agribusiness with Leading Brands
6
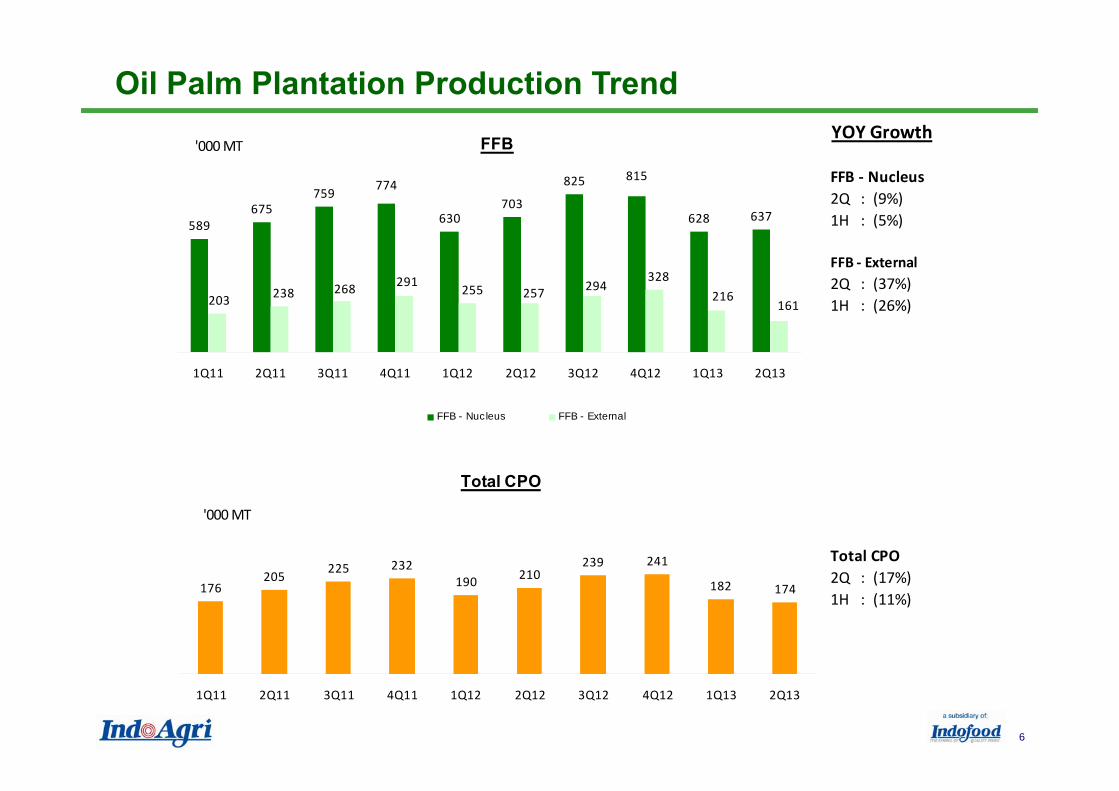
Oil Palm Plantation Production TrendYOY Growth
FFB ‐ Nucleus2Q : (9%)1H : (5%)
FFB ‐ External2Q : (37%)1H : (26%)
Total CPO2Q : (17%)1H : (11%)
Total CPO
176205 225 232
190 210239 241
182 174
1Q11 2Q11 3Q11 4Q11 1Q12 2Q12 3Q12 4Q12 1Q13 2Q13
'000 MT
FFB
589675
759
630703
825
628 637
774815
203 238 268 291 255 257 294328
216161
1Q11 2Q11 3Q11 4Q11 1Q12 2Q12 3Q12 4Q12 1Q13 2Q13
'000 MT
FFB - Nucleus FFB - External

7
Section 2Financial Highlights
Integrated Agribusiness with Leading Brands
8
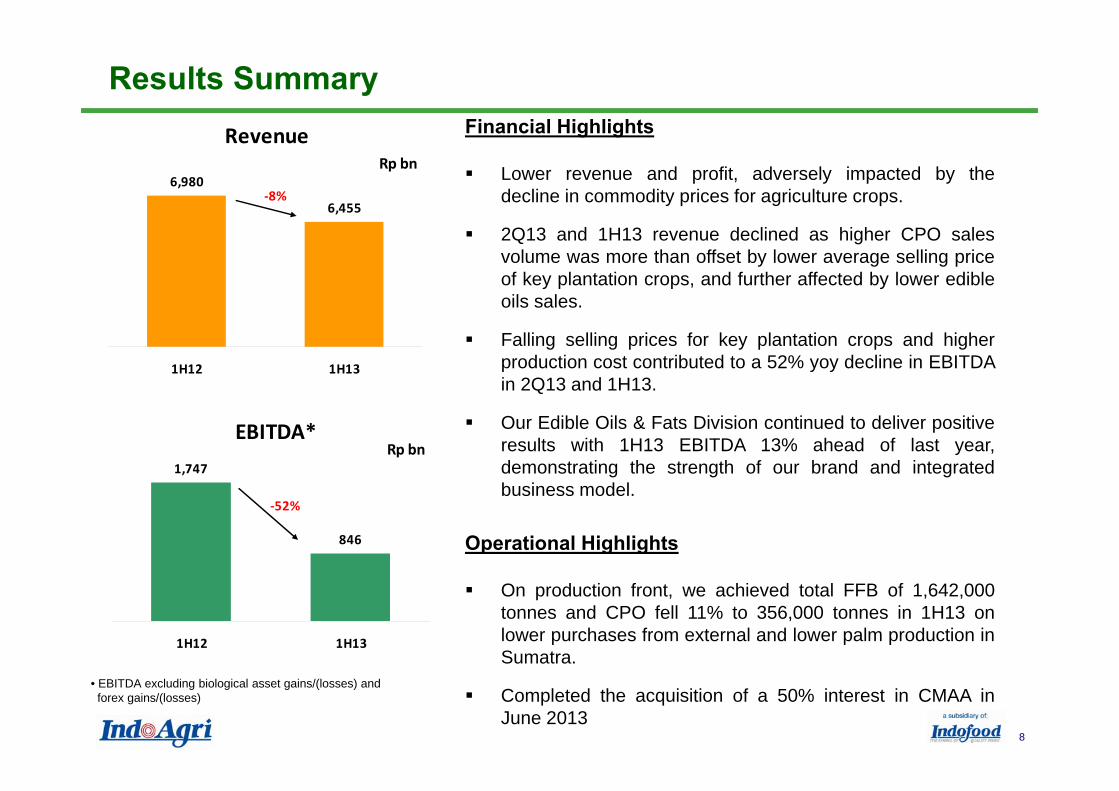
Results Summary
• EBITDA excluding biological asset gains/(losses) and forex gains/(losses)
Revenue
6,980
6,455
1H12 1H13
Rp bn
‐8%
EBITDA*1,747
846
1H12 1H13
Rp bn
‐52%
Financial Highlights
Lower revenue and profit, adversely impacted by thedecline in commodity prices for agriculture crops.
2Q13 and 1H13 revenue declined as higher CPO salesvolume was more than offset by lower average selling priceof key plantation crops, and further affected by lower edibleoils sales.
Falling selling prices for key plantation crops and higherproduction cost contributed to a 52% yoy decline in EBITDAin 2Q13 and 1H13.
Our Edible Oils & Fats Division continued to deliver positiveresults with 1H13 EBITDA 13% ahead of last year,demonstrating the strength of our brand and integratedbusiness model.
Operational Highlights
On production front, we achieved total FFB of 1,642,000tonnes and CPO fell 11% to 356,000 tonnes in 1H13 onlower purchases from external and lower palm production inSumatra.
Completed the acquisition of a 50% interest in CMAA inJune 2013
Integrated Agribusiness with Leading Brands
9
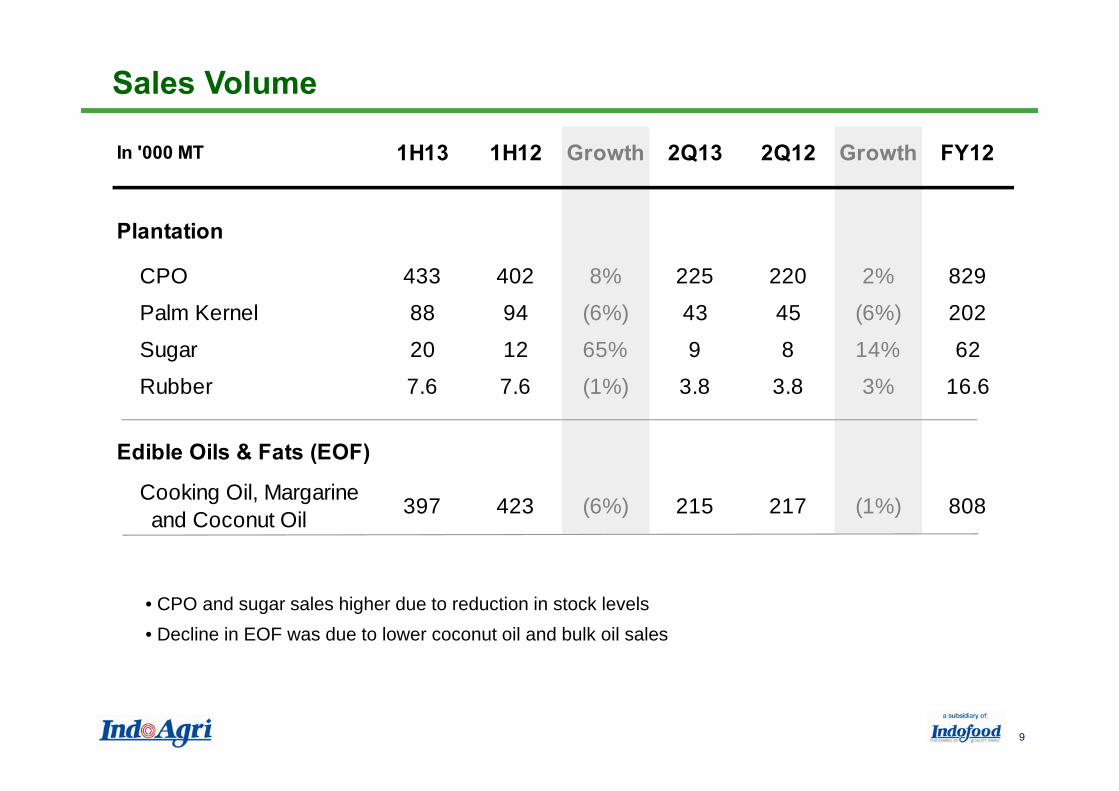
In '000 MT 1H13 1H12 Growth 2Q13 2Q12 Growth FY12
Plantation
CPO 433 402 8% 225 220 2% 829
Palm Kernel 88 94 (6%) 43 45 (6%) 202
Sugar 20 12 65% 9 8 14% 62
Rubber 7.6 7.6 (1%) 3.8 3.8 3% 16.6
Edible Oils & Fats (EOF)
Cooking Oil, Margarine and Coconut Oil 397 423 (6%) 215 217 (1%) 808
Sales Volume
• CPO and sugar sales higher due to reduction in stock levels• Decline in EOF was due to lower coconut oil and bulk oil sales
Integrated Agribusiness with Leading Brands
10
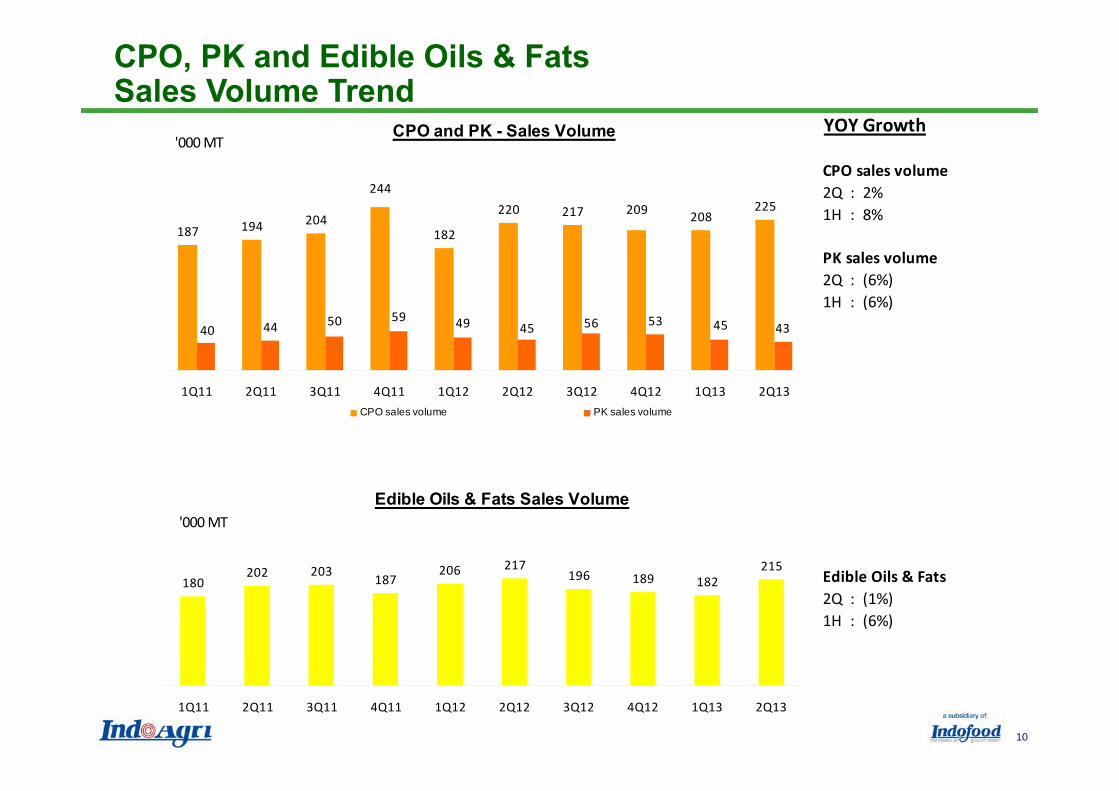
CPO, PK and Edible Oils & FatsSales Volume Trend
YOY Growth
CPO sales volume2Q : 2%1H : 8%
PK sales volume2Q : (6%)1H : (6%)
Edible Oils & Fats2Q : (1%)1H : (6%)
Edible Oils & Fats Sales Volume
180202 203 187
206 217196 189 182
215
1Q11 2Q11 3Q11 4Q11 1Q12 2Q12 3Q12 4Q12 1Q13 2Q13
'000 MT
CPO and PK - Sales Volume
187 194 204182
220 217 208225
43
244209
40 44 50 59 49 45 56 53 45
1Q11 2Q11 3Q11 4Q11 1Q12 2Q12 3Q12 4Q12 1Q13 2Q13
'000 MT
CPO sales volume PK sales volume
Integrated Agribusiness with Leading Brands
11
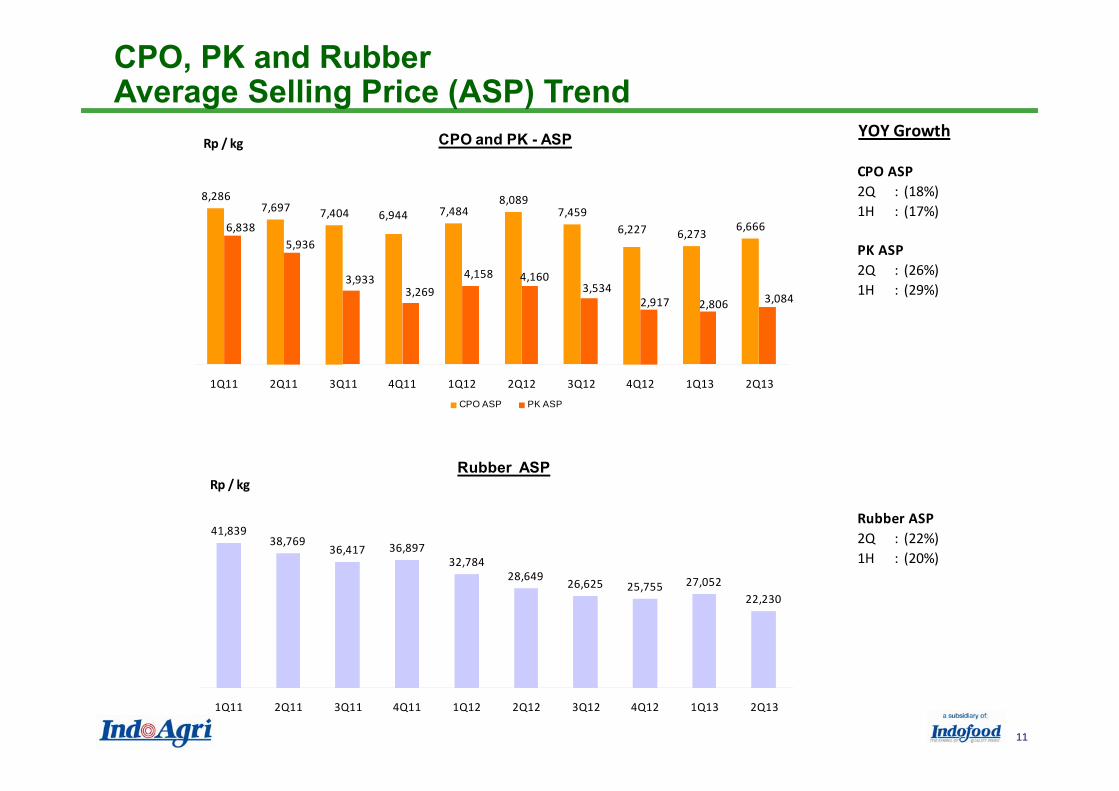
CPO, PK and RubberAverage Selling Price (ASP) Trend
YOY Growth
CPO ASP2Q : (18%)1H : (17%)
PK ASP2Q : (26%)1H : (29%)
Rubber ASP2Q : (22%)1H : (20%)
Rubber ASP
41,83938,769
36,417 36,89732,784
28,649 26,625 25,755 27,05222,230
1Q11 2Q11 3Q11 4Q11 1Q12 2Q12 3Q12 4Q12 1Q13 2Q13
Rp / kg
CPO and PK - ASP
8,2867,697 7,404 7,484
8,0897,459
6,273 6,6666,944
6,2276,8385,936
3,9333,269
4,158 4,1603,534
2,917 2,806 3,084
1Q11 2Q11 3Q11 4Q11 1Q12 2Q12 3Q12 4Q12 1Q13 2Q13
Rp / kg
CPO ASP PK ASP
Integrated Agribusiness with Leading Brands
12
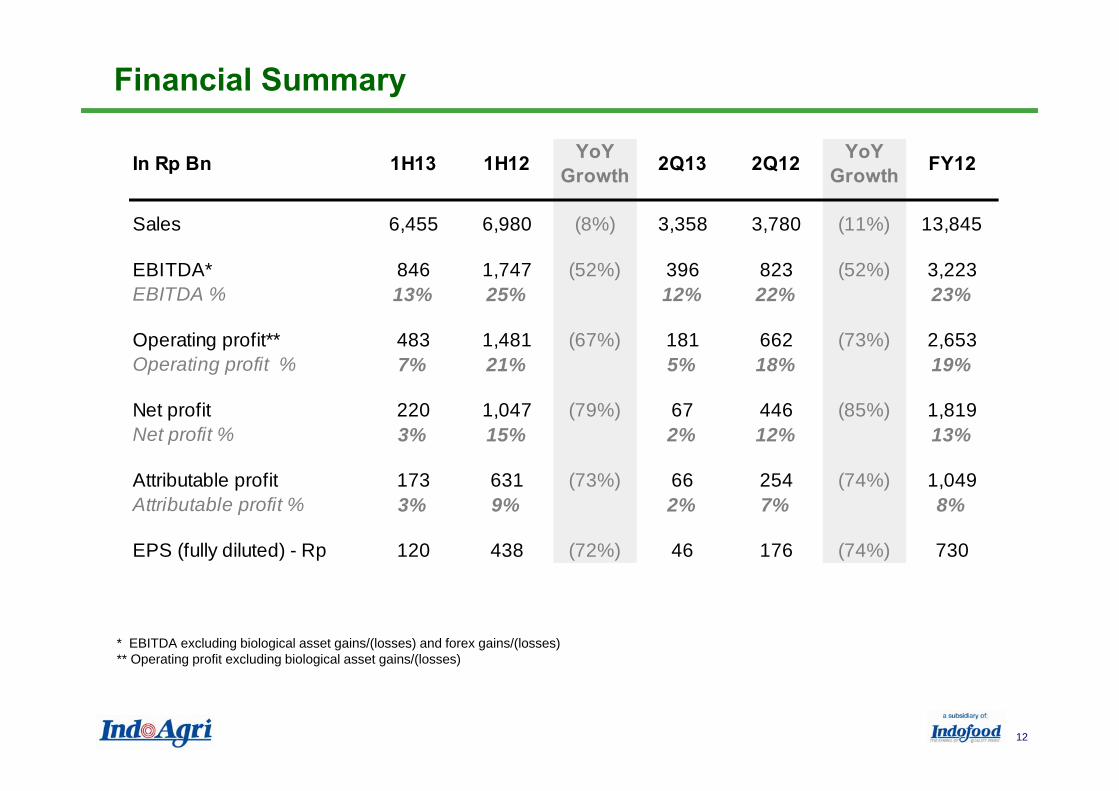
Financial Summary
* EBITDA excluding biological asset gains/(losses) and forex gains/(losses)** Operating profit excluding biological asset gains/(losses)
In Rp Bn 1H13 1H12 YoY Growth 2Q13 2Q12 YoY
Growth FY12
Sales 6,455 6,980 (8%) 3,358 3,780 (11%) 13,845
EBITDA* 846 1,747 (52%) 396 823 (52%) 3,223EBITDA % 13% 25% 12% 22% 23%
Operating profit** 483 1,481 (67%) 181 662 (73%) 2,653Operating profit % 7% 21% 5% 18% 19%
Net profit 220 1,047 (79%) 67 446 (85%) 1,819Net profit % 3% 15% 2% 12% 13%
Attributable profit 173 631 (73%) 66 254 (74%) 1,049Attributable profit % 3% 9% 2% 7% 8%
EPS (fully diluted) - Rp 120 438 (72%) 46 176 (74%) 730
Integrated Agribusiness with Leading Brands
13
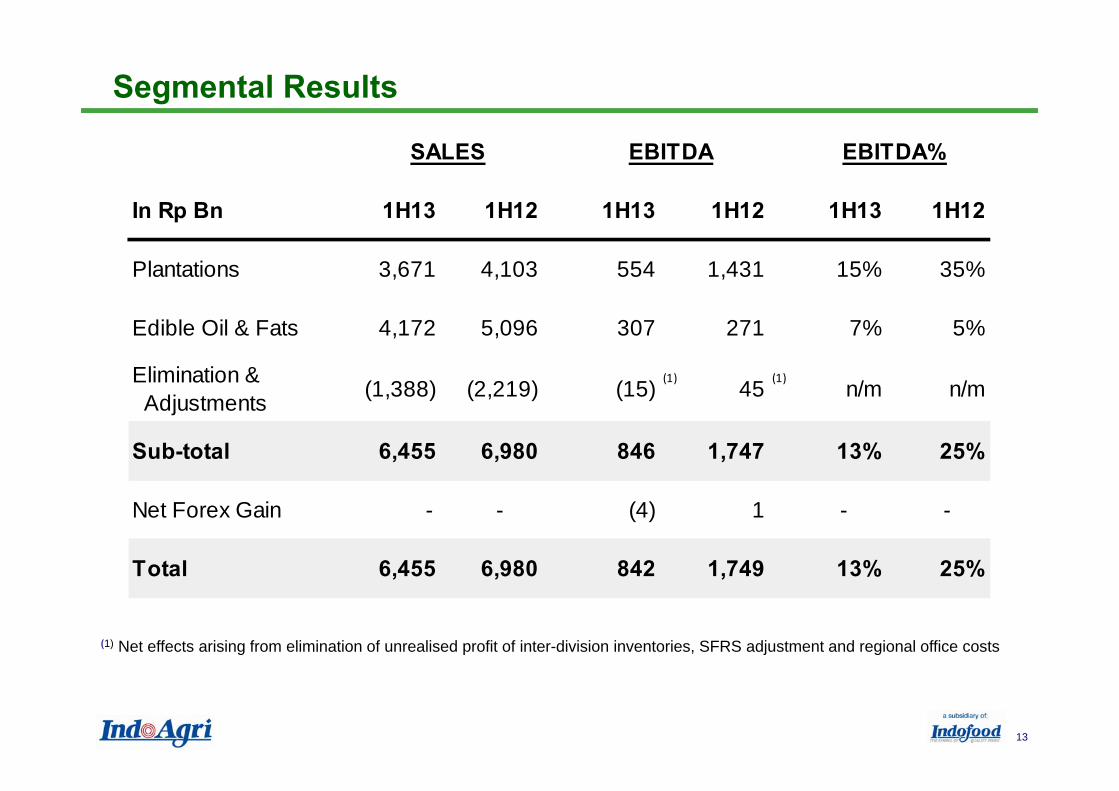
Segmental Results
(1) Net effects arising from elimination of unrealised profit of inter-division inventories, SFRS adjustment and regional office costs
SALES EBITDA EBITDA%
In Rp Bn 1H13 1H12 1H13 1H12 1H13 1H12
Plantations 3,671 4,103 554 1,431 15% 35%
Edible Oil & Fats 4,172 5,096 307 271 7% 5%
Elimination & Adjustments (1,388) (2,219) (15) 45 n/m n/m
Sub-total 6,455 6,980 846 1,747 13% 25%
Net Forex Gain - - (4) 1 - -
Total 6,455 6,980 842 1,749 13% 25%
(1) (1)
Integrated Agribusiness with Leading Brands
14
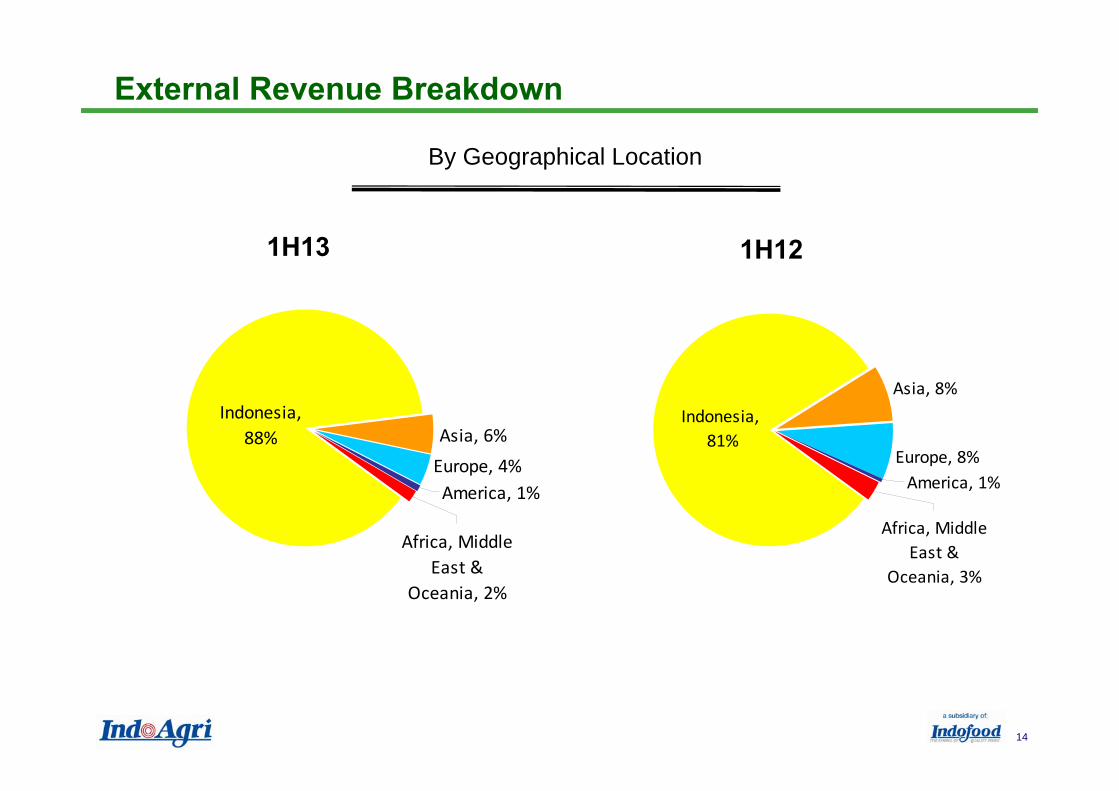
By Geographical Location
External Revenue Breakdown
1H13 1H12
Asia, 6%
America, 1%Europe, 4%
Africa, Middle East &
Oceania, 2%
Indonesia, 88%
Asia, 8%
Europe, 8%America, 1%
Africa, Middle East &
Oceania, 3%
Indonesia, 81%
Integrated Agribusiness with Leading Brands
15
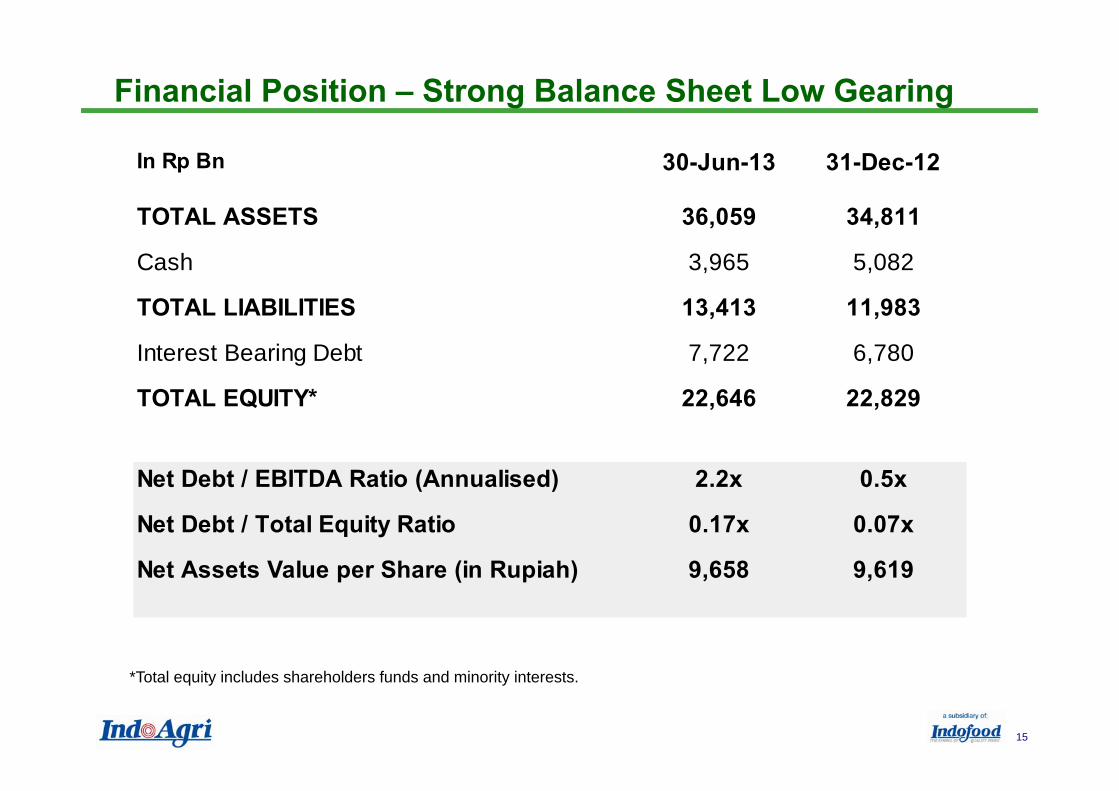
Financial Position – Strong Balance Sheet Low Gearing
*Total equity includes shareholders funds and minority interests.
In Rp Bn 30-Jun-13 31-Dec-12
TOTAL ASSETS 36,059 34,811
Cash 3,965 5,082
TOTAL LIABILITIES 13,413 11,983
Interest Bearing Debt 7,722 6,780
TOTAL EQUITY* 22,646 22,829
Net Debt / EBITDA Ratio (Annualised) 2.2x 0.5x
Net Debt / Total Equity Ratio 0.17x 0.07x
Net Assets Value per Share (in Rupiah) 9,658 9,619

16
Section 3Strategies and Expansion

Integrated Agribusiness with Leading Brands
17
2013 Strategies and Expansion – Indonesia
Focus organic expansion on new plantings of oil palm and sugar plantations
Expand CPO production capacity and enhance supply chain
• Constructing 4 oil palm mills due to higher FFB production in future from immature plantings:- 1 new mill in South Sumatra due for completion in Q4 2013- 1 new mill in Kalimantan due for completion in Q1 2014- Additionally expansion of 2 existing mills
• New bulking station in East Kalimantan with storage capacity of 5,000 tonnes, completion in2014
• Construction of 200MT/day PKO plant in Riau due for completion in 2013
Increase the utilization of internal tugboats and barges for CPO transportation to refineries
Intensifying the promotion of branded products to both modern trade and traditional market with new packaging and brand positioning
Completing roll-out of SAP ERP system in 2013 to the whole group
Integrated Agribusiness with Leading Brands
18
Expansion in Indonesia
On 8 March 2013, the Company’s subsidiaries, SIMP and Lonsum acquired an effective interest of 79.7% in PT Mentari Pertiwi Makmur (MPM) for Rp330 billion (around US$34 million)MPM in turn owns the SAL Group, which holds three industrial forest plantation concessions for a total area of 73,330 hectares in Berau and East Kutai, East KalimantanThis acquisition fits into the Group’s agriculture business model and enhances its diversification into other agriculture crops through intercropping.
Integrated Agribusiness with Leading Brands
19
Overseas Expansion
Rationale:• Expansion of geographical presence into the sugar, ethanol and co-generation industry in
Brazil• Superior technical know-how and best practices from Brazil that can be transferred back
to IndoAgri’s Indonesia sugar operations• Earnings accretive investment with a strong local partner in an expanding business
Key Highlights: • 1 sugar cane factory with a total cane crushing capacity of 3.0m MT p.a.; expanding to
3.8m MT p.a. by 2014/15; supplemented by ethanol and co-generation plants.• Has ~34,000 ha planted of sugar cane and targeted to have ~45,000 ha in the next 3
years, around 50% will be from 3rd parties• Low land competition, favourable logistics and infrastructure (near major roads, railways
and future ethanol pipeline)• Proximity to main consumer markets and suppliers• Expected to be earnings accretive in 2014/2015
CMAA acquisition completed on 25th June 2013

20
Section 4Appendix
Integrated Agribusiness with Leading Brands
21
DistributionSeed breeding
Advanced agriculture research centre
Advanced agriculture research centre
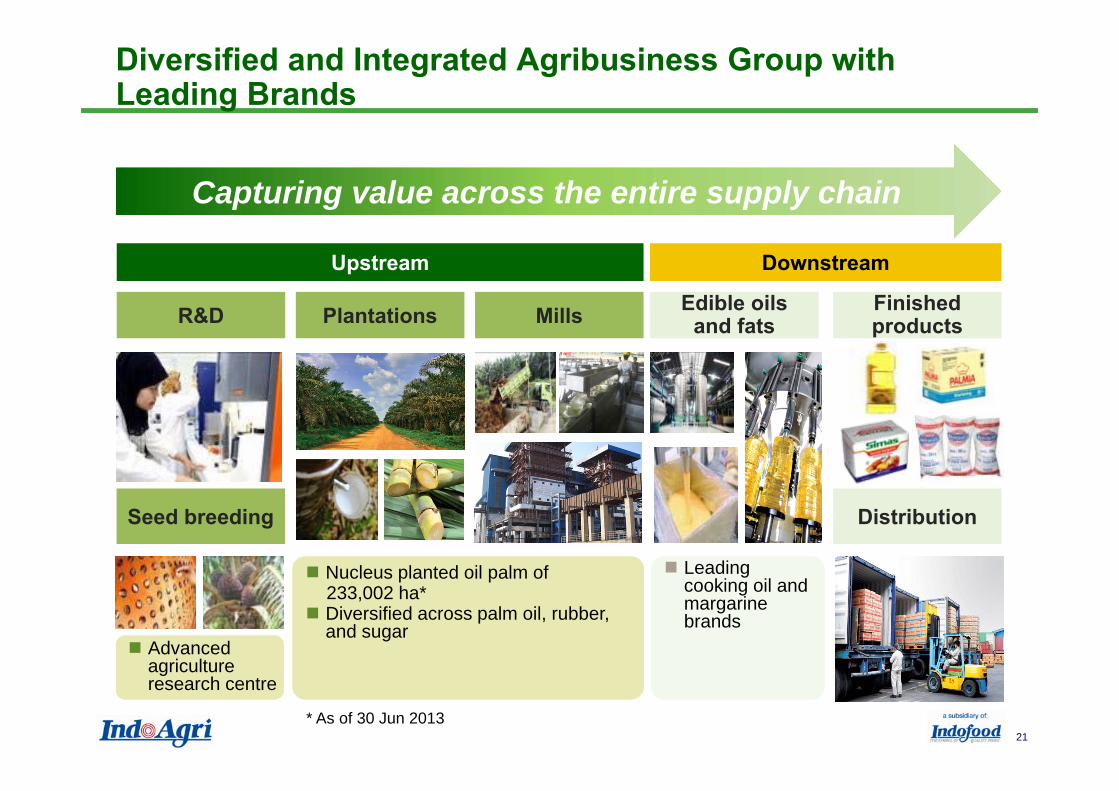
Nucleus planted oil palm of 233,002 ha*Diversified across palm oil, rubber, and sugar
Nucleus planted oil palm of 233,002 ha*Diversified across palm oil, rubber, and sugar
Leading cooking oil and margarine brands
Leading cooking oil and margarine brands
Diversified and Integrated Agribusiness Group with Leading Brands
Upstream Downstream
R&D Plantations Mills Edible oils and fats
Finished products
Capturing value across the entire supply chain
* As of 30 Jun 2013
Integrated Agribusiness with Leading Brands
22
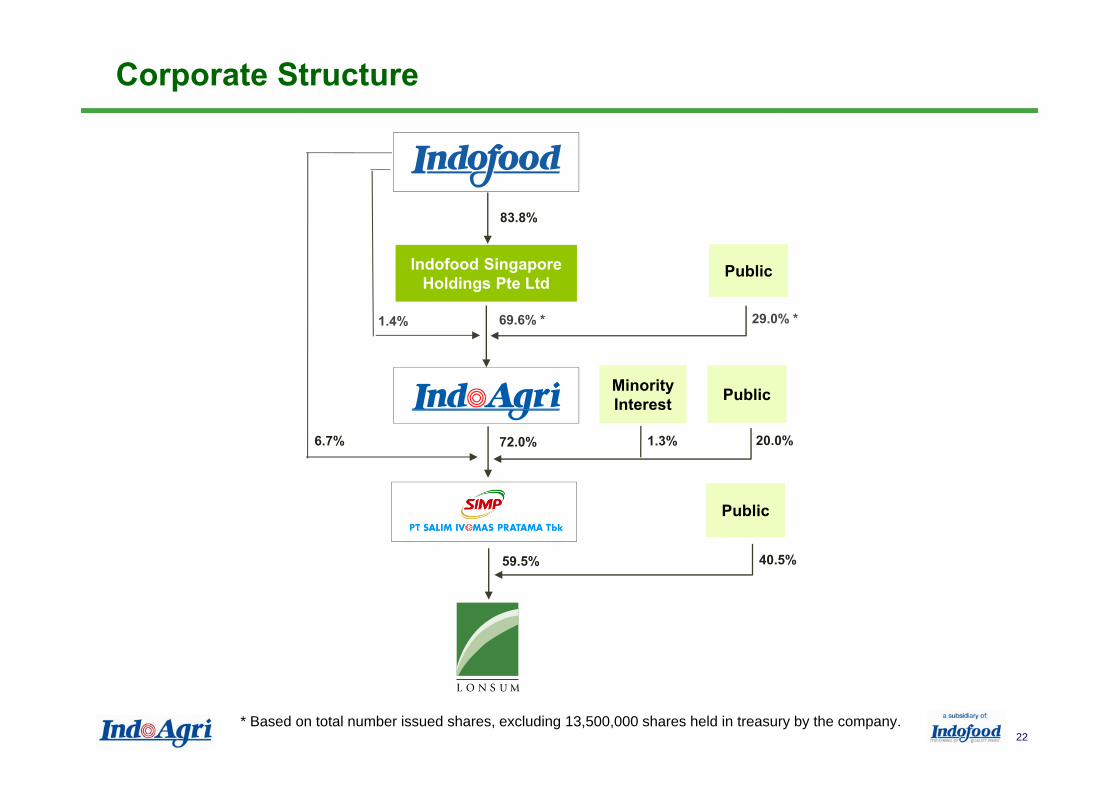
Corporate Structure
* Based on total number issued shares, excluding 13,500,000 shares held in treasury by the company.
83.8%
68.95%
72.00%
59.5%
6.7%
40.5%
Indofood Singapore Holdings Pte Ltd
Minority Interest
29.0% *
Public
1.3% 20.0%
69.6% *
72.0%
Public
Public
1.4%
Integrated Agribusiness with Leading Brands
23 23
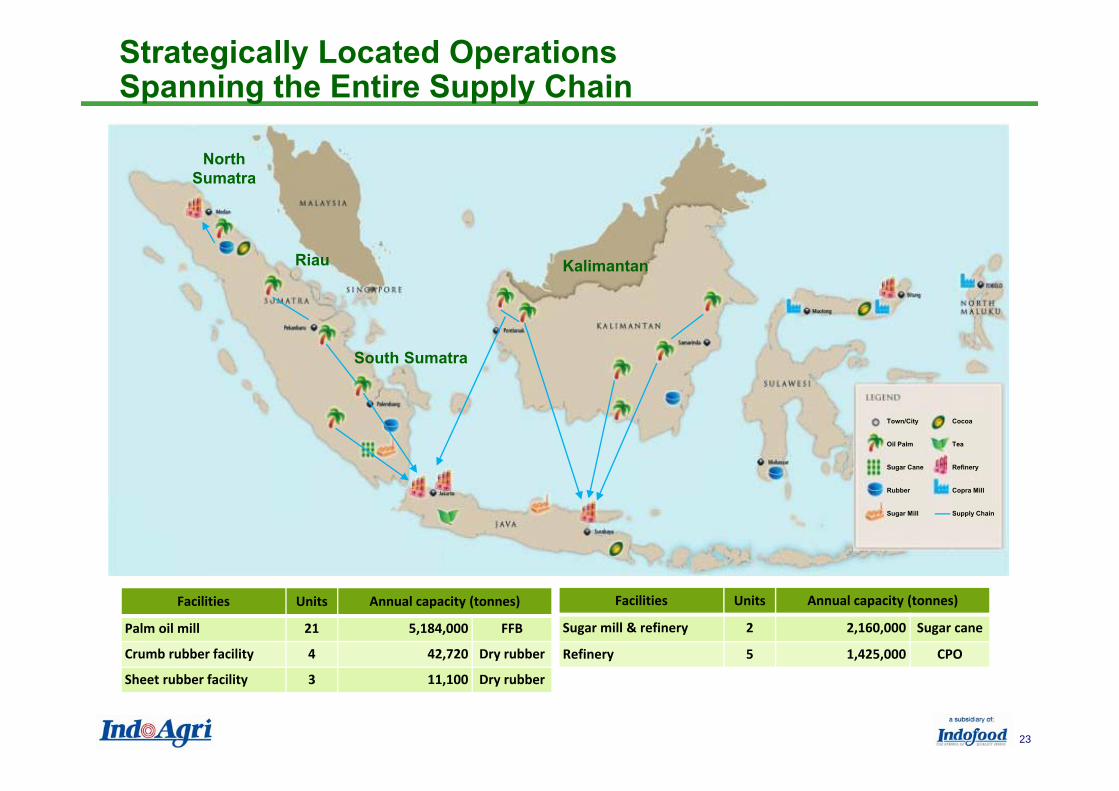
Click to edit Master title styleTown/City
Oil Palm
Sugar Cane
Rubber
Sugar Mill
Copra Mill
Refinery
Tea
Cocoa
Supply Chain
North Sumatra
Riau
South Sumatra
Kalimantan
Strategically Located OperationsSpanning the Entire Supply Chain
Facilities Units Annual capacity (tonnes)
Palm oil mill 21 5,184,000 FFB
Crumb rubber facility 4 42,720 Dry rubber
Sheet rubber facility 3 11,100 Dry rubber
Facilities Units Annual capacity (tonnes)
Sugar mill & refinery 2 2,160,000 Sugar cane
Refinery 5 1,425,000 CPO
Integrated Agribusiness with Leading Brands
24
This presentation was prepared solely and exclusively for the parties presently being invited for the purpose ofdiscussion. Neither this presentation nor any of its content may be reproduced, disclosed or used without the priorwritten consent of Indofood Agri Resources Ltd.
This presentation may contain statements that convey future oriented expectations which represent the Company’spresent views on the probable future events and financial plans. Such views are presented on the basis of currentassumptions, are exposed to various risks, and are subject to considerable changes at any time. Presentedassumptions are presumed correct at the, and based on the data available on the, date at which this presentation isassembled. The Company warrants no assurance that such outlook will, in part or as a whole, eventually bematerialized. Actual results may diverge significantly from those projected.© Indofood Agri Resources Ltd. All rights reserved.
Indofood Agri Resources Ltd.8 Eu Tong Sen Street#16-96/97 The Central
Singapore 059818Tel: +65 6557 2389
Fax: +65 6557 2387
www.indofoodagri.com
Contact Us