Committee for the Review of the Implementation of the ... · GE.18-22319(E) Committee for the...
55
GE.18-22319(E) Committee for the Review of the Implementation of the Convention Seventeenth session Georgetown, Guyana, 28–30 January 2019 Item 2 of the provisional agenda Assessment of Implementation Strategic objectives 1 to 5 Preliminary analysis – strategic objective 1: To improve the condition of affected ecosystems, combat desertification/land degradation, promote sustainable land management and contribute to land degradation neutrality Note by the secretariat Summary In decision 7/COP.13, the Conference of the Parties (COP) to the United Nations Convention to Combat Desertification (UNCCD) adopted the UNCCD 2018−2030 Strategic Framework. This document contains the synthesis and preliminary analysis of information submitted by country Parties on strategic objective 1 of the UNCCD 2018−2030 Strategic Framework: to improve the condition of affected ecosystems, combat desertification/land degradation, promote sustainable land management and contribute to land degradation neutrality. It analyses three land-based progress indicators from a global and regional perspective. Furthermore, in accordance with decision 15/COP.13, it includes an analysis of information related to Sustainable Development Goal indicator 15.3.1: the proportion of land that is degraded over total land area. Finally, the document contains an analysis of national voluntary targets relevant to strategic objective 1, including land degradation neutrality targets, and a compilation of additional indicators relevant to strategic objective 1 in use at the national level. The document offers some conclusions on the status of activities relating to strategic objectives 1 (baseline perspective) and some recommendations for consideration by the Committee for the Review of the Implementation of the Convention. * Reissued for technical reasons on 25 February 2019. United Nations ICCD/CRIC(17)/2* Convention to Combat Desertification Distr.: General 19 December 2018 Original: English
Transcript of Committee for the Review of the Implementation of the ... · GE.18-22319(E) Committee for the...

GE.18-22319(E)
Committee for the Review of the Implementation of the Convention Seventeenth session
Georgetown, Guyana, 28–30 January 2019
Item 2 of the provisional agenda
Assessment of Implementation
Strategic objectives 1 to 5
Preliminary analysis – strategic objective 1: To improve the condition of affected ecosystems, combat desertification/land degradation, promote sustainable land management and contribute to land degradation neutrality
Note by the secretariat
Summary
In decision 7/COP.13, the Conference of the Parties (COP) to the United Nations
Convention to Combat Desertification (UNCCD) adopted the UNCCD 2018−2030
Strategic Framework.
This document contains the synthesis and preliminary analysis of information
submitted by country Parties on strategic objective 1 of the UNCCD 2018−2030 Strategic
Framework: to improve the condition of affected ecosystems, combat desertification/land
degradation, promote sustainable land management and contribute to land degradation
neutrality. It analyses three land-based progress indicators from a global and regional
perspective. Furthermore, in accordance with decision 15/COP.13, it includes an analysis
of information related to Sustainable Development Goal indicator 15.3.1: the proportion of
land that is degraded over total land area. Finally, the document contains an analysis of
national voluntary targets relevant to strategic objective 1, including land degradation
neutrality targets, and a compilation of additional indicators relevant to strategic objective 1
in use at the national level.
The document offers some conclusions on the status of activities relating to strategic
objectives 1 (baseline perspective) and some recommendations for consideration by the
Committee for the Review of the Implementation of the Convention.
* Reissued for technical reasons on 25 February 2019.
United Nations ICCD/CRIC(17)/2*
Convention to Combat Desertification
Distr.: General
19 December 2018
Original: English

ICCD/CRIC(17)/2
2
Contents
Paragraphs Page
List of abbreviations ................................................................................................ 3
I. Introduction ............................................................................................................. 1–9 4
II. Land cover ............................................................................................................... 10–23 5
A. Land cover stocks ........................................................................................... 14 6
B. Land cover changes ........................................................................................ 15–22 6
C. Land cover hotspots and brightspots............................................................... 23 8
III. Land productivity .................................................................................................... 24–32 8
A. Land productivity dynamics within static land cover classes ......................... 28–29 9
B. Land productivity dynamics with changing land cover .................................. 30–31 10
C. Land productivity hotspots and brightspots .................................................... 32 11
IV. Carbon stocks .......................................................................................................... 33–43 11
A. Soil organic carbon stocks .............................................................................. 36–39 12
B. Soil organic carbon stock changes .................................................................. 40–43 12
V. Additional nationally relevant indicators ................................................................ 44–45 13
VI. Proportion of land that is degraded over total land area (SDG indicator 15.3.1) .... 46–51 14
VII. Voluntary targets ..................................................................................................... 52–56 15
A. Land degradation neutrality targets ................................................................ 52–54 15
B. Other targets ................................................................................................... 55–56 15
VIII. Conclusions and recommendations ......................................................................... 57–66 15
Annex
Tables and figures ....................................................................................................................... 19

ICCD/CRIC(17)/2
3
List of abbreviations
CEE Central and Eastern Europe
COP Conference of the Parties
CRIC Committee for the Review of the Implementation of the Convention
ESA European Space Agency
GEO Group on Earth Observations
JRC Joint Research Centre of the European Commission
LAC Latin America and the Caribbean
LDN land degradation neutrality
LDN TSP Land Degradation Neutrality Target-Setting Programme
LPD land productivity dynamics
NMED Northern Mediterranean
PRAIS performance review and assessment of implementation system
SDG Sustainable Development Goal
SO strategic objective
SOC soil organic carbon
UNCCD United Nations Convention to Combat Desertification

ICCD/CRIC(17)/2
4
I. Introduction
1. By decision 7/COP.13, the Conference of the Parties (COP) to the United Nations
Convention to Combat Desertification (UNCCD) adopted the UNCCD 2018−2030
Strategic Framework. Strategic objective (SO) 1 of this framework aims at improving the
condition of affected ecosystems, combating desertification/land degradation, promoting
sustainable land management and contributing to land degradation neutrality (LDN).
2. Indicators used for reporting on the UNCCD 2018−2030 Strategic Framework are
those identified by Parties in decisions 22/COP.11. Specifically, the progress indicators
(and associated metrics) for SO 1 are trends in:
(a) Land cover (metric: land cover change);
(b) Land productivity or functioning of the land (metric: land productivity
dynamics (LPD));
(c) Carbon stocks above and below ground (metric: soil organic carbon (SOC)
stock).
3. In line with decision 22/COP.11 and in order to facilitate national reporting, the
secretariat provided country Parties with national estimates for each respective metric of the
progress indicators based on available data sources through the performance review and
assessment of implementation system (PRAIS). Parties were urged to subsequently verify
or replace these national estimates using data sourced/computed nationally/locally. The data
sources used for the provision of default data1 to country Parties were the following:
(a) Climate Change Initiative Land Cover of the European Space Agency
(ESA);2
(b) LPD of the Joint Research Centre (JRC) of the European Commission;3
(c) SoilGrids250m of the International Soil Reference and Information Centre.4
4. Furthermore, by decision 15/COP.13, Parties requested the secretariat, as the
custodian agency for Sustainable Development Goal (SDG) indicator 15.3.1, to use
information submitted by Parties in their national reports relevant to the implementation of
the 2030 Agenda for Sustainable Development as contributions to the overall follow-up and
review by the High-level Political Forum on Sustainable Development.
5. Therefore, reporting templates also included, under SO 1, a section related to SDG
indicator 15.3.1: the proportion of land that is degraded over total land area. In line with its
latest metadata description,5 the estimation of SDG indicator 15.3.1 should be based on
analyses of available data for three above-mentioned indicators employing the one-out, all-
out principle. This principle maintains that degradation is considered to have occurred if
negative or declining changes are reported in any one of the indicators for a given pixel or
land unit.
1 “Default data” refers to the data sets listed here which were provided to countries Parties for their
consideration for UNCCD reporting.
2 <http://maps.elie.ucl.ac.be/CCI/viewer/index.php>.
3 <https://wad.jrc.ec.europa.eu/landproductivity>.
4 <https://soilgrids.org/#!/?layer=TAXNWRB_250m&vector=1>.
5 <https://unstats.un.org/sdgs/metadata/files/Metadata-15-03-01.pdf>.
ICCD/CRIC(17)/2
5
6. As of the reporting deadline of 31 August 2018, 141 national reports were submitted,
of which 138 were suitable for global and regional analysis. 6 Three country Parties
submitted a national report, but did not report on SO 1.7 Five country Parties that reported
on this SO are included in the global analysis since they do not belong to any UNCCD
Regional Implementation Annex.8 Therefore, in this document the term “global” refers to
the aggregation of data from all 135 country Parties who reported data on SO 1 as of the
reporting deadline of 31 August 2018, while the term “regional” refers to the UNCCD
Regional Implementation Annexes.
7. For each land-based progress indicator and SDG indicator 15.3.1, the “total global
land area reported” is an aggregate of land area reported upon by country Parties. Because
not all country Parties submitted reports, the total global land area reported is less than the
total land area of the planet. This total also varies by indicator because not all country
Parties reported on all indicators. Additionally, reporting for some country Parties was
limited to a subset of land types, and not the total national territory. All analysis is based on
actual reported land areas.
8. This document contains a synthesis and preliminary analysis of information
submitted by country Parties on SO 1. It examines the three land-based indicators from a
global and regional perspective. Furthermore, it includes an analysis of information related
to SDG indicator 15.3.1 and of national voluntary targets relevant to SO 1, including LDN
targets. Finally, it includes a compilation of additional indicators relevant to SO 1 used at
the national level.
9. The document offers preliminary conclusions on the status of activities relating to
SO 1 (baseline perspective) and some recommendations for consideration by the
Committee for the Review of the Implementation of the Convention.
II. Land cover
10. For land cover, country Parties were requested to provide quantitative information
for the period 2000–2015 on: (i) the area within six land cover classes, namely ‘tree-
covered areas’, ‘grassland’, ‘cropland’, ‘wetland’, ‘artificial surfaces’ and ‘other land’;9 and
(ii) changes from one land cover class to another between 2000–2015. Based on the
quantitative data, countries were also requested to describe the direct and/or indirect drivers
of change and the location of the most significant hotspots/brightspots.10 Countries were
also invited to provide complementary information on the sources of data used.
11. A total of 135 country Parties reported quantitative information on land cover: 47
from Africa, 36 from Asia, 26 from Latin America and the Caribbean (LAC), 9 from the
Northern Mediterranean (NMED) and 12 from Central and Eastern Europe (CEE) (see
figure 1). While the number of countries that reported on land cover is high, this only
represents 58.4 per cent of the total global land area.
12. Source data used for land cover reporting is predominantly (66.6 per cent) generated
by the Climate Change Initiative Land Cover of the ESA, utilizing either the 2000−2010
6 Botswana, Japan and Viet Nam submitted their national reports in a format which was not suitable for
data extraction and therefore are not included in the analysis.
7 Honduras, Germany and Switzerland.
8 Austria, Belgium, Czechia, France and Poland.
9 The UNCCD reporting glossary provides the land cover class definitions:
<https://prais.unccd.int/sites/default/files/helper_documents/1-Glossary_EN.pdf>.
10 Hotspots and brightspots are areas exhibiting significant degradation trends or significant
improvements, respectively.

ICCD/CRIC(17)/2
6
default data made available to countries in the context of the Land Degradation Neutrality
Target-Setting Programme (LDN TSP) (3.7 per cent), the 2000–2015 default data made
available in the context of this reporting cycle (37 per cent) or a nationally adapted version
of the two sources (25.9 per cent) (see figure 2). Several countries used Trends.Earth11 or
other tools to compare national data with default data and then harmonized the underlying
classification scheme to the default data standard (29.6 per cent). The remaining countries
(3.7 per cent) used an unspecified source of data.
13. This diverse mix of data sources has resulted in some inherent comparability issues
related to spatial and temporal projection, country boundaries, reporting years, unreported
land cover classes and aggregation methods. Where possible, the data for stocks was
harmonized for global and regional reporting by interpolating class areas for missing years.
A. Land cover stocks
14. Globally, the dominant land cover class in 2015 is tree-covered areas, at 32.4
per cent of the total reported land cover area (see table 1). Grassland, cropland, wetland
and artificial surfaces represent 23.1 per cent, 17.7 per cent, 4.2 per cent and 0.8 per cent of
the total reported land area, respectively. The remaining areas are classified as other land;
this land cover class represents 21.7 per cent of total reported land area and includes deserts,
permanent snow and ice cover and other bare lands. When considering land cover
distribution for these classes at the regional level, it is noteworthy that over 60 per cent of
the reported tree-covered areas are found in LAC and CEE, with 21 per cent found in
Africa and 15 per cent in Asia (see figure 3).
B. Land cover changes
15. Globally, the largest cumulative percent change in any land cover class is that
of artificial areas (which grew 32.2 per cent between 2000–2015, representing an
additional ~168,000 km2) (see figure 5 and table 2). This trend in increasing artificial areas
is considered a critical transition, with 48,240 km2 of the new artificial areas coming from
previously ‘natural’12 areas (see table 3), jumping to 143,200 km2 when combining ‘natural
and semi-natural’ areas (see table 4). Most lands converted to artificial areas have come
from cropland and grassland (see table 5). Urbanization is reported across all regions as
being a direct driver of land cover transition from all classes other than artificial (see table 6
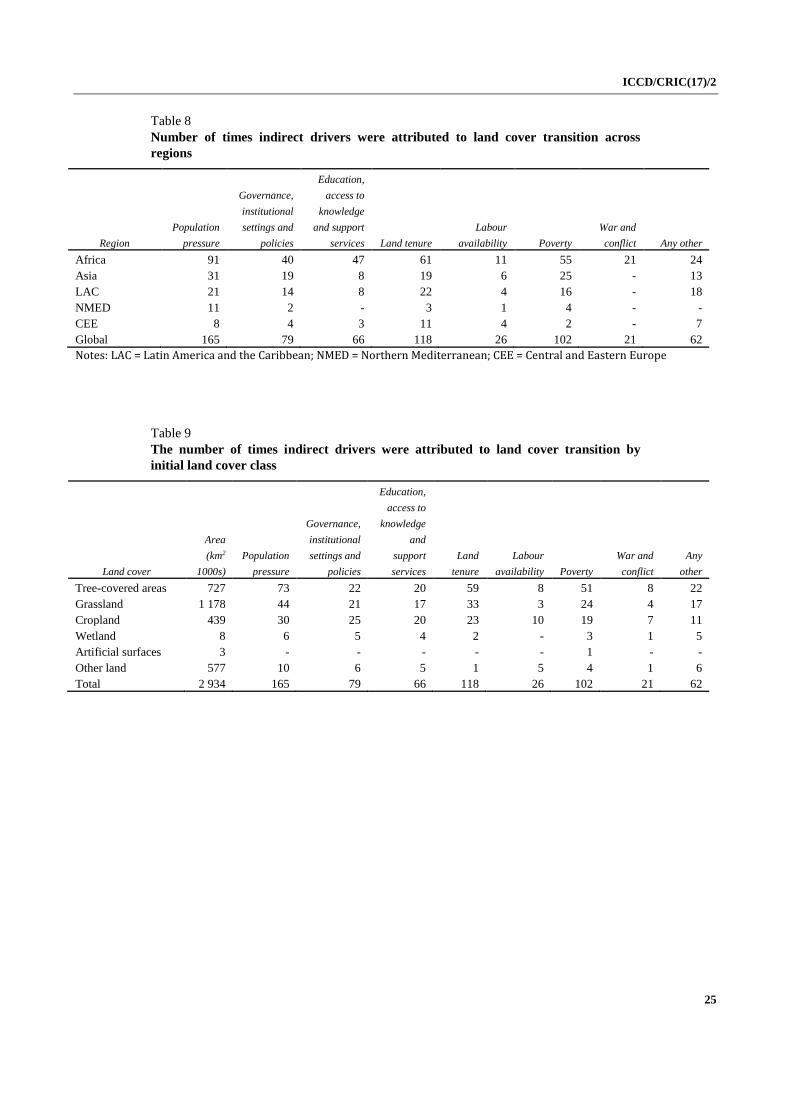
and table 7). Population pressure, land tenure and poverty are the most frequently cited
indirect drivers of land cover change (see table 8 and table 9).
16. Globally, tree-covered areas fell by ~141,610 km2 from 2000 to 2005, but
rebounded by 2015 to a net decline of 35,204 km2 (-0.1 per cent) below 2000 levels (see
figure 4 and table 2). However, total transitions equate to substantially more with 911,100
km2 (3.2 per cent) of total deforestation by 2015 compared with 835,400 km2 (1.4 per cent)
conversion of all other land classes to tree covered areas13 (see table 4). Most of these
transitions to and from tree-covered areas were with grassland and cropland (see table 5).
This is supported by the high frequency of reporting deforestation as a direct driver of tree-
cover loss, (see table 6 and table 7), followed by the overexploitation of vegetation for
11 Trends.Earth is a QGIS plugin developed by Conservation International:
<http://trends.earth/docs/en/>.
12 Natural areas include tree-covered areas, grassland and wetland.
13 The discrepancy in the net loss of tree-covered areas reported in table 1 and the difference between
tree-covered area losses and gains from table 2 stem from some country Parties reporting only on land
cover distribution or on land cover fluxes; this limits data cross-compatibility.

ICCD/CRIC(17)/2
7
domestic use and improper crop management14 (see table 7). A number of indirect drivers
were frequently cited for these trends, including population pressure, land tenure, poverty,
governance15 and education16 (see table 8 and table 9). Regional trends (see table 2) saw
net tree-covered areas increase by 2015 on 2000 level in CEE, NMED and Asia, while
declines were reported in LAC and Africa. Land cover changes involved transitions from
one land cover type to another between 2000 and 2015; the critical conversions reported by
country Parties for each region are summarized in table 4. Table 5 provides a
comprehensive change matrix for each region, where the land area associated with all
possible conversions have been aggregated from data reported by country Parties.
17. Globally, grassland fluctuated with losses increasing to -2.1 per cent by 2010
but returning to a net loss of -1.5 per cent by 2015 (see figure 5 and table 2),
representing a net loss of 301,000 km2 (see figure 4 and table 2). Most grassland losses
are actually transitions to tree-covered areas, cropland or other land (see table 5). Reported
drivers that can be associated with the volatility of the grassland to other land transitions
include overgrazing, overexploitation of vegetation, and improper soil management (see
table 6 and table 7). Regionally, grassland losses were largest in Africa (183,000 km2)
and Asia (186,000 km2), which corresponds to 2.8 per cent and 3.0 per cent, respectively,
of 2000 grassland area by 2015 (see table 2). However, within both these regions there were
also substantial grassland gains from the other land class (see table 5), indicating that these
regions are the source of much of the conversion to grassland observed at the global level.
Gains in grassland were observed in LAC (1.3 per cent), but were largely transitions from
tree-cover areas (see table 2).
18. Globally, cropland has steadily increased in area with gains equalling 575,000
km2 (+3.9 per cent of the 2000 cropland) (see figure 4, figure 5 and table 2). Most of this
is the result of transitions from tree-covered areas (369,000 km2), other land (310,900 km2)
and grassland (424,700 km2) (see table 5). Transitions from other land to cropland is almost
three times the transition of cropland to other land, indicating that more marginal lands
have been brought back into production (see table 5). Drivers of cropland losses include
urbanization, improper soil management, improper crop management14 and industrial
activities (see table 6 and table 7). Drivers of cropland gains are cited as population,
governance,15 education16 and land tenure (see table 8 and table 9). At a regional level the
conversions to cropland over the period 2000–2015 have largely taken place in Asia
(352,000 km2, +8.3 per cent), LAC (136,000 km2, +4.3 per cent) and Africa (133,000
km2, +3.4 per cent), whilst modest cropland losses occurred in NMED (-2 per cent)
and CEE (-0.7 per cent) (see table 2). The most notable gains in cropland from other land
are found in Asia (301,300 km2), representing the majority of other land reclaimed globally
for cropland use (see table 5).
19. Globally, wetland has slowly increased in area by 63,000 km2 (+1.7 per cent) by
2015 (see figure 4, figure 5 and table 2). Most gains in wetland areas have come from tree-
covered areas (62,300 km2) and grassland (44,800 km2). Similarly, the majority of the
wetland transitions were to tree-covered areas (45,000 km2) and to grassland (84,400 km2),
indicating that the reported drivers of disturbance to the water flows and recharge may be
influencing these transitions (see table 7). However, wetland also experienced significant
transitions to other classes, with a small net flux to other land (see table 5). Particularly
notable at a regional level is the relative increase in wetland extent of +10 per cent
(34,000 km2) in Asia from 2000 to 2015 (table 2), most of which appears to have come
from grassland (40,400 km2) (see table 5). There was also considerable flux between
wetland and tree-covered areas, and to a lesser extent cropland areas, in LAC (see table 5).
14 Improper crop management = improper management of annual, perennial, scrub and tree crops.
15 Governance = governance, institutional settings and policies.
16 Education = education, access to knowledge and support services.

ICCD/CRIC(17)/2
8
20. Globally, the other land category has dropped by 233,000 km2 (-1.2 per cent) by
2015, however this land cover class has a volatile trend over the full period (see figure 4,
figure 5 and table 2). Most transitions to other land came from grassland and cropland,
suggesting significant degradation of these vegetative classes (see table 5 and table 4).
Associated drivers are dominated by the group of any other drivers (a compilation of
country Party-nominated drivers), but urbanization, improper crop management, industrial
activities, improper soil management and overgrazing also feature (see table 6 and table 7).
Regionally, in Asia, significant areas of grassland and cropland, but also tree-covered areas,
transitioned into other land. At the same time, Asia gained far higher amounts of grassland
(see table 5), cropland and tree-covered areas, leading to a net reduction in other land of
290,000 km2 (-1.2 per cent of the other land areas for 2000) (see table 2). Similar but more
modest gains in grassland from other lands that occurred in Africa (120,100 km2) were
almost completely offset by losses of grassland to other land (106,000 km2) (see table 5).
Indeed, all regions experienced at least a modest net decrease in other lands with the
exception of LAC, which experienced a small increase by 2015 of 24,000 km2 (3.4 per
cent) (see table 2).
21. When grouping land cover classes, a more nuanced picture emerges (see table 3 and
table 4). Globally, between 2000–2015, land cover changes indicate a total of 1,229,000
km2 lost from natural lands, of which 803,900 km2 was converted to cropland, 377,200
km2 to other land and 48,200 km2 to artificial surfaces. Approximately half of this total
change was in Asia (566,900 km2), with Africa (353,100 km2) and LAC (283,900 km2)
making up most of the remainder. Across most regions, natural land was converted to
cropland with the exception of Asia, where conversions were split nearly equally between
cropland (288,400 km2) and other land (256,300 km2) and, to a lesser extent, Africa, which
saw two thirds go to cropland (231,000 km2) and one third to other land (113,300 km2) (see
table 3).
22. Globally, natural land gains over the same time period totalled 964,800 km2,
indicating a net loss of natural land. Table 3 shows that most of these gains were in
transitions to grassland (647,100 km2) followed by tree-covered areas (292,800 km2). Of
particular note in the regional analysis of gains and losses of natural land reported is that
the vast majority of natural land gains were transitions to grasslands seen in Asia (see
table 3).
C. Land cover hotspots and brightspots
23. Globally, there were 94 brightspots totalling 736,000 km2 and 246 hotspots totalling
3,641,000 km2 reported across all regions, with Africa predominant (see figure 6) in both
count and area identified, followed by Asia and LAC. The average area of hotspots was 5.7
times larger than that of brightspots (14,800 km2 versus 2,600 km2, respectively) (see figure
6). Brightspot areas are ~76 per cent of the reported natural area gains (see table 3)
and hotspots are almost 14 times larger than the net reported natural land losses (see
table 3), implying that at a global level, country Parties could achieve LDN and even
exceed it by rehabilitating hotspots as functional vegetated lands.
III. Land productivity
24. Country Parties were requested to provide quantitative information on LPD (i)
within land cover classes where land cover has remained static (unchanged) during 2000–
2015; and (ii) for areas where the land cover has changed during the 2000–2015 period.
LPD was reported in terms of qualitative classes of persistent land productivity trajectories
that classify the land areas as declining, stressed or stable/increasing land productivity.

ICCD/CRIC(17)/2
9
Countries were also requested to describe the direct and/or indirect drivers of change and
the location of significant hotspots/brightspots related to land productivity, and to provide
complementary information on the sources of data and alternative metrics used to assess
land productivity.
25. A total of 128 country Parties reported quantitative information on land productivity:
47 from Africa, 32 from Asia, 26 from LAC, 8 from NMED and 11 from CEE (see figure
7). This is slightly down from the 135 countries which reported land cover estimates
summarized in chapter II. The reported land productivity estimates contained in this section
cover approximately 53.3 per cent (see figure 7) of global land area.
26. Source data used for reporting on LPD was predominantly default data (68 country
Parties, or 57.6 per cent) generated by the JRC of the European Commission. The default
data is comprised of a 1 km resolution data product representing the 1999−2013 period and
was developed by the JRC in the context of preparing the World Atlas of Desertification.17
A further 37 country Parties (31.4 per cent) relied on the Trends.Earth QGIS plugin to
either recalculate LPD based on the same default data product generated by the JRC but for
differing boundaries, or to estimate trajectory, performance and state of primary
productivity using either 8km Advanced Very High Resolution Radiometer or 250m
Moderate Resolution Imaging Spectroradiometer datasets. A further 16 country Parties
(12.5 per cent) used national data developed domestically according to their own
methodologies, whilst the remaining 7 (5.5 per cent) used unspecified data sources (see
figure 8).
27. As with the reported land cover data, this diverse set of data sources has resulted in
some inherent comparability issues between the different datasets, particularly in relation to
spatial and temporal projection, country boundaries, unreported land cover classes and/or
transitions between land cover classes. While every effort was made to harmonize data for
global and regional reporting, consideration should be given to these issues as a potential
source of error and inherent variability in the data. A further consideration when
interpreting the findings is that country Parties did not provide LPD data over consistent
temporal windows.
A. Land productivity dynamics within static land cover classes
28. Globally, 75.9 per cent of reported static vegetated land area18 showed increasing or
stable LPD (see table 10). However, 8.9 per cent of the reported static vegetated land
area showed declining trends in LPD and a further 9.2 per cent was reported as
stressed, representing collectively almost 11.5 million km2 (see table 10). Examining
each of the land cover classes separately, grassland was reported with the largest areas of
negative LPD trend with 2,748,100 km2 (14.8 per cent of total grassland) declining and
2,248,600 km2 (12.1 per cent) under stress, while cropland was reported with 1,440,300
km2 (10.5 per cent) declining and 1,433,500 km2 (10.4 per cent) under stress (see table 10
and figure 9). Tree-covered areas were reported with 1,296,300 km2 (4.8 per cent) declining
and 1,989,900 km2 (7.3 per cent) under stress, which proportionally is significantly lower
than grassland and cropland (see table 10 and figure 9). The most frequently cited drivers
reported for these areas are the group of any other drivers, over-exploitation of vegetation
for domestic use, deforestation, improper soil management and improper crop management
(see table 11). Specific to each land cover, the degradation in the condition of tree-covered
areas is primarily attributed to the group of any other drivers, deforestation, urbanization
and over-exploitation of vegetation for domestic use (see table 12). Similarly, grasslands
17 <https://wad.jrc.ec.europa.eu/>.
18 Vegetated land areas includes tree-covered areas, grassland, cropland and wetland.

ICCD/CRIC(17)/2
10
were reported to be losing condition due to overexploitation of vegetation for domestic use
and overgrazing. Croplands, on the other hand, were losing condition due to improper soil
management and improper crop management. At the regional level, LAC, Africa and
Asia show declining and stressed productivity dynamics for proportionally
comparable or larger areas than those observed globally, whilst NMED and CEE are
well below the global trend (see table 10, figure 9 and figure 10).
29. In an effort to better understand global trends, a more comprehensive data analysis
was undertaken in which declining and stressed lands were compared against those that
were increasing for LPD in areas of static land cover (see table 10).19 Results of this
analysis indicate that grasslands show a worldwide negative trend with 12 per cent of
reported area remaining on balance within one of the three negative LPD classes. The
results show that, for static land cover classes, grasslands are undergoing substantial
degradation trends in terms of LPD (-12 per cent, on balance), wetland areas are slightly
increasing in productivity (+1.3 per cent, on balance), croplands are marginally improving
(+10.8 per cent, on balance), and more than a third of tree-covered areas (+35.0 per cent, on
balance) in static land cover zones are demonstrating positive LPD trends. This large
positive trend is driven primarily by the northern latitudes and may be related to increased
productivity from the warming trend in northern climates. Furthermore, at a global scale,
these positive trends in northern latitudes may be large enough to mask negative trends seen
in other parts of the world. The regional analysis provided in table 10 demonstrates the
wide variability in LPD trends reported across regions.
B. Land productivity dynamics with changing land cover
30. Globally, the largest declining LPD trajectories within land cover classes that
have experienced significant negative change were reported for transitions from tree-
covered areas to grassland, which exhibited a declining trend across 49.3 per cent of
the reported net area change (see table 13). This represents an area of more than 270,000
km2 and far exceeds the declining productivity dynamics observed across all other
transitions, both in absolute terms and proportionally. Substantial declining trends were also
reported for tree-covered areas that have transitioned to cropland (53,542 km2) (17 per cent),
grassland to tree-covered areas (35,503 km2) (13.5 per cent) and grassland to cropland
(29,460 km2), however, these negative trends are dwarfed by tree-covered areas that have
transitioned to grassland. The wetland-to-cropland transition also exhibits a negative trend
with 18.5 per cent of the reported net area change representing 458 km2. Examining the
stressed global LPD trends that were reported within land cover class transitions presents a
more nuanced pattern with a more even spread across the different transitions. Land cover
transitions that display the largest proportional areas of stressed productivity
dynamics are wetland to grassland (30.2 per cent) and cropland (29.8 per cent),
followed by grassland to tree-covered areas (23.5 per cent) and tree-covered areas to
cropland (21.5 per cent). The most frequently cited drivers reported for these changes are
deforestation, the overexploitation of vegetation for domestic use (28 country Parties),
improper crop management, and improper soil management (22) (see table 14). Examining
each land cover transition separately, the declines in productivity associated with transitions
from tree-covered areas was largely driven by deforestation, with improper crop
19 This analysis assesses the balance of positive and negative LPD trends across all reporting country
Parties. Land within the increasing LPD class minus land within declining, moderately declining and
stressed classes gives the amount of land that is considered ‘on balance’. Thus the percentages in this
paragraph are based on this calculation, using the results reported in table 10. Note that the stable
class is disregarded, which contains both stable ‘healthy’ lands and stable degraded lands that reached
that state prior to 2000.

ICCD/CRIC(17)/2
11
management and the overexploitation of vegetation for domestic use also contributing (see
table 15). Drivers of negative LPD trends associated with the land cover transitions from
grassland were given as overexploitation of vegetation for domestic use and overgrazing,
while declines associated with transitions from cropland were mostly attributed to improper
soil management and urbanization.
31. Table 16 provides a detailed analysis of changes in LPD between 2000–2015
reported by country Parties for each land cover class, aggregated by region. It provides the
net area of change for each land cover transition. These results varied significantly across
regions. The drivers reported by country Parties behind these trends for each region are
provided in table 14.
C. Land productivity hotspots and brightspots
32. Globally there were 84 land productivity brightspots totalling 1,803,000 km2 and
217 hotspots totalling 2,328,000 km2 reported across all regions (see figure 11). Africa
reported the highest number of brightspots and hotspots in both count and the area. For
hotspots, Africa was followed by LAC and Asia, while for brightspots, LAC had the next
greatest count but CEE reported the next largest area. The average area of brightspots
across all regions was two times larger than that of hotspots (26,906 km2 versus 12,934 km2,
respectively). The total area of reported brightspots is more than twice the total reported
area of areas that were found to have declining or stressed LPD trajectories under all land
cover transitions (see table 13).
IV. Carbon stocks
33. Country Parties were requested to provide quantitative information for below-
ground carbon stocks for the period 2000–2015 in the form of SOC stocks (t/ha) in the
topsoil (i.e. 0−30 cm) (i) within each land cover class; and (ii) for areas where the land
cover has changed during the period under consideration. Based on the quantitative data,
countries were also requested to describe the direct and/or indirect drivers of change and
the location of the most significant hotspots/brightspots related to SOC stock. Furthermore,
countries were invited to provide complementary information on the sources of data used.
34. A total of 126 country Parties reported quantitative information on SOC stocks: 46
from Africa, 30 from Asia, 26 from LAC, 8 from NMED and 11 from CEE. An overview
of reporting country Parties is provided in figure 12. The reported SOC estimates contained
in this section cover approximately 53.2 per cent of global land area for country Parties that
reported SOC stocks for at least one land cover class, dropping to 38.6 per cent of the
global land area for the reporting of SOC stocks for all land cover.
35. The majority of countries utilized data sources primarily based on or adapted from
SoilGrids250m global estimates, using either the 2000–2010 default data made available to
countries in the context of the LDN TSP (7.9 per cent), the 2000–2015 default data made
available to countries in the context of this reporting cycle (42.1 per cent) or a nationally
adapted version of either of the two sources (15.9 per cent) (see figure 13). Of the
remaining country Parties, those with national SOC data sources often used them as the
baseline 2000 estimate and utilized the Trends.Earth plugin for QGIS to carry out the
default calculation of SOC change based on land cover changes as well as management and
input effects where national information was available (27 per cent). The remaining
countries (7.1 per cent) utilized an unspecified source of data.

ICCD/CRIC(17)/2
12
A. Soil organic carbon stocks
36. SOC stocks (t/ha) levels between 2000–2015 show a consistent pattern between land
class averages globally and across most regions, with tree-covered areas and wetland
providing the highest average SOC (see figure 14). The most frequently cited direct drivers
of SOC stock degradation were improper crop management, the group of any other drivers,
deforestation, and improper soil management (see table 17). Instances of indirect drivers of
SOC losses were most frequently cited as population pressure (14), the group of any other
drivers and land tenure (see table 18).
37. Globally, the highest SOC stocks are found under wetland (185.3 t/ha),
amounting to more than twice that observed under tree-covered areas (82.9 t/ha). This
high global value for wetland is driven by the higher SOC stocks found in large areas of
wetland in CEE (237.6 t/ha), related primarily to favourable climatic conditions for the
formation of organic soils (e.g. peats). In contrast, wetland in hotter and drier climatic
conditions have lower average SOC stocks, with 54.7 t/ha in the NMED region and 90 t/ha
in Africa. Regional average SOC stocks for tree-covered areas ranged from 68.6 t/ha in
Africa up to 103.9 t/ha in Asia. Direct drivers of SOC degradation within static classes of
tree-covered areas and wetland were deforestation, the group of any other drivers, and
improper crop management (see table 17). Indirect drivers of SOC degradation are reported
as population pressure, land tenure and the group of any other drivers (see table 18).
38. Globally, the average reported SOC stocks under cropland is 21 per cent
higher (59 t/ha) than that under grassland (48.9 t/ha) (see figure 14). Indeed, as
compared to grassland, higher average SOC stocks are reported under cropland for
all regions except for NMED, where grassland (68.5 t/ha) is 11 per cent higher than
croplands (61.1 t/ha). This is in contrast to the common expectation that grassland contains
higher average SOC stocks than cropland, and equal or higher SOC stocks than stocks
found under tree-covered areas. This discrepancy could be related to large areas of low
average SOC stocks found under marginal rangelands being included in the grassland
category, the poor condition of grassland and/or the spatial bias of cropland being
preferentially developed on more fertile soils in higher rainfall areas. Additionally, the
global averages of SOC aggregated from reported statistics are not controlled for variations
due to management, climate or soil type. It is also possible this discrepancy is in part due to
incomplete reporting of land classes by country Parties. In terms of direct drivers of SOC
degradation in grassland, the most frequently reported were overgrazing, improper crop
management, and overexploitation of vegetation for domestic use (see table 17). In contrast,
the most frequently noted direct drivers of SOC degradation in croplands were the group of
any other drivers, suggesting that there are a variety of specific drivers identified at the
national level which are not covered by the standard driver selection (see table 17). Indirect
drivers for grassland and cropland SOC degradation were largely similar, with population
pressure and governance being the most frequently cited (see table 18).
39. Land under artificial surfaces and under the other land cover class were found
to have the lowest average levels of SOC (33.06 t/ha) (see figure 14), most likely because
these two classes contain low or no vegetation cover, the basis for soil organic carbon
inputs to SOC stocks. Direct drivers of SOC degradation of artificial areas were reported as
being urbanization and industrial activities (see table 17) and indirect drivers as population
pressure, the group of any other drivers and land tenure (see table 18).
B. Soil organic carbon stock changes
40. Country Parties reported a blend of SOC stock change data. The most commonly
employed approach was the default methodology for SOC stock change, which is based on

ICCD/CRIC(17)/2
13
the Tier I methodology for SOC change calculation.20 This approach was only applied in
cases where land cover changes were reported in the 2000–2015 period and not extended to
include land management or fertilizer/inputs for land in a static land cover class due to lack
of suitable global data to populate these factors. In some instances, country Parties were
able to report national level estimates, including changes due to management and input
types, as they had access to suitable national level data and sufficient expertise and funds to
carry out such a high-level assessment. In terms of degradation, the most frequently cited
direct drivers of SOC losses following land cover change were deforestation, improper crop
management, the group of any other drivers and improper soil management (see table 19).
Indirect drivers most frequently reported by countries as contributing to SOC losses were
population pressure, land tenure, governance and poverty (see table 20).
41. Globally, LPD for land cover transitions from tree-covered areas, grassland,
wetland to any other class resulted in loss of average SOC stock, and transitions from
artificial surfaces and the other land cover class to any other class resulted net gains
in average SOC stocks (see table 21). The largest absolute change in SOC was seen in the
transition from other land class to tree-covered areas with a positive change of 68.4 t/ha
(168 per cent) across 24,986 km2. The largest percentage increase was the transition from
artificial surfaces to wetland, which exhibited a SOC increase of 396 per cent (56.9 t/ha)
across a limited area of 83 km2. The largest absolute decrease in SOC was reported in the
transition from tree-covered areas to other land with a negative change of 63.3 t/ha (60 per
cent), equivalent to 31,301 km2. The largest percentage decrease in SOC stocks was
reported for 391 km2 of wetland to other land transition, which represented a loss of 57.4
t/ha or a decrease of 78.8 per cent of initial average SOC stock (see table 21).
42. Frequent direct drivers of SOC loss from the transition out of tree-covered areas
were the group of any other drivers and deforestation (see table 17). The indirect drivers of
loss of SOC stocks in formerly tree-covered areas were land tenure, population pressure
and poverty. Direct drivers of grassland SOC degradation for land which transitioned away
from grasslands were improper crop management, overgrazing and improper soil
management. Indirect drivers for the transition away from each initial land cover class were
largely similar, with population pressure, land tenure, poverty and governance the most
frequently reported (see table 19 and table 20).
43. At a global level, twice as many hotspots (46) were reported as brightspots (20),
representing 732,000 km2 and 137,000 km2, respectively (see figure 15). The majority of
hotspots were reported for Africa both in count and area, followed by Asia in terms of area
and CEE in terms of count. In general, few countries reported on hotspots or
brightspots for SOC change. This suggests that whilst SOC degradation is well
understood in terms of direct and indirect drivers, the geographical knowledge
required to locate hotspots and brightspots was low across nearly all country Parties.
V. Additional nationally relevant indicators
44. Country Parties were requested to provide information on any additional indicator
relevant to SO 1 in use at national and subnational level. Additional indicators can assist in
interpreting and understanding global indicators and ensure land degradation is assessed in
a nationally/locally appropriate way.
45. Forty-three country Parties have reported using a total of 99 additional indicators
relevant to SO 1 (see table 22). The majority of these address ecosystem services flowing
20 Adapted from the 2006 Intergovernmental Panel on Climate Change Guidelines for National
Greenhouse Gas Inventories.
ICCD/CRIC(17)/2
14
from land and locally-relevant issues, such as heavy metal contamination and salinization.
Countries also reported socioeconomic indicators to measure progress on enabling policies
and regulations or actions that avoid, reduce or reverse land degradation.
VI. Proportion of land that is degraded over total land area (SDG indicator 15.3.1)
46. Country Parties were requested to provide information on (i) the total area of
degraded land; and (ii) the proportion of degraded land relative to total land area (i.e. SDG
indicator 15.3.1, which employs the three UNCCD land-based indicators as “subindicators”)
as a contribution to the follow-up and review of the 2030 Agenda for Sustainable
Development. Countries were also requested to provide information on the method used to
compute the indicator and their level of confidence in the assessment.
47. A total of 127 country Parties reported quantitative information on SDG
indicator 15.3.1: 46 from Africa, 32 from Asia, 25 from LAC, 8 from NMED and 12 from
CEE, with the remainder ungrouped. The data reported covers approximately 61 per cent of
the total global land area.
48. Ninety-four of 110 (84 per cent) countries used all three subindicators to calculate
SDG indicator 15.3.1, with the remainder using one or two subindicators only (see table 23).
Most integrated the subindicators using the “one out, all out” approach, while a few used
customized or unspecified methods.
49. Overall, 84 of 110 (76 per cent) of country Parties utilized the entire SDG 15.3.1
assessment methodology, which consists of all three subindicators on land cover, land
productivity and carbon stocks (namely SOC stocks) and the “one out, all out”
approach in determining degradation status (see table 23). Several country Parties
elected to report only a portion of their total national area, and in some cases the extent of
reported land varied by subindicator. The majority (86 per cent) of country Parties
reporting indicated the qualitative level of confidence in the indicator data
underpinning estimates of proportion of degraded lands. Of those that reported
confidence, 21 per cent reported high confidence in their estimates (based on
comprehensive evidence), 50 per cent reported medium confidence (based on partial
evidence) and 29 per cent reported low confidence (based on limited evidence) (see
table 24). Where confidence was low, country Parties cited an absence or partial lack of
suitable national data to be used in default data verification, a paucity of tools with which to
undertake the verification, a mismatch with national data where it was available for
verification use and the coarse spatial resolution of the default data in comparison to
country size. Countries with medium confidence primarily cited the lack of national data to
be used for verification of default datasets, as well as some mismatches found when
national data was used for default data verification. Countries that had high confidence in
the indicator data used cited national validation of default data, use of national data and
statistics and the objectivity of default data provided.
50. The proportion of degraded land for all land reported by country Parties is
19.2 per cent or more than 17.5 million km2 (see table 25). The proportion of degraded
land for UNCCD regions amounted to 27.7 per cent or 5.1 million km2 in LAC, 24 per cent
or 6.8 million km2 in Asia, 17 per cent or 4.2 million km2 in Africa, 13.7 per cent or
248,000 km2 in NMED, and 6.7 per cent or 1.2 million km2 in CEE. This table also
summarizes the proportion of degraded land for UNCCD subregions. At country level, the
proportion of degraded land per national territory is presented in figure 16.
51. As the custodian agency for SDG indicator 15.3.1, the UNCCD expects to transmit
this information as a contribution to the 2019 Global SDG reports and database.
ICCD/CRIC(17)/2
15
VII. Voluntary targets
A. Land degradation neutrality targets
52. Country Parties were requested to provide information on voluntary targets they
have set to achieve LDN in accordance with specific national circumstances and
development priorities. Countries were also requested to indicate the expected year of
achievement and the level of application (i.e. national, subnational, or specific target) of the
target.
53. Eighty-two country Parties have set LDN targets, while 36 are planning to do so (see
table 26). 21 LDN targets set by countries vary considerably, reflecting differing land
degradation processes at different scales, and the level of ambition and vision of LDN as
defined by each UNCCD country Party, taking into account their respective national
circumstances. Overall, 64 per cent of 446 targets set by countries are national (see table 26)
and a majority of countries articulated LDN targets that (i) are aligned with a 2030 timeline,
taking the timelines of both the UNCCD 2018–2030 Strategic Framework and 2030
Agenda into account; (ii) contain defined quantitative elements that allow for monitoring
(e.g. percentages, area units); and (iii) combine (sub)targets for at least two of the three
elements of the LDN response hierarchy.22
54. The complementary information provided by countries was not sufficient to draw
conclusions regarding the level of adoption of the targets.
B. Other targets
55. Country Parties were requested to provide information on any additional target
relevant to SO 1 they have set. Countries were also requested to indicate the expected year
of achievement and the level of application (i.e. national or subnational).
56. Sixty-eight country Parties have set other targets relevant to SO 1; 88 per cent of
these have been set at the national level (see table 27) and the vast majority are aligned with
the 2030 SDG timeline. However, similarly to LDN targets, the majority of the other targets
are aimed at avoiding, reducing or reversing land degradation or at creating an enabling
environment to combat land degradation through the development of policies, legislation,
awareness, research or monitoring.
VIII. Conclusions and recommendations
57. The core of this analysis addresses country Party reporting on three UNCCD
progress indicators and their metrics for land cover, LPD and SOC, as well as SDG
indicator 15.3.1. It is based on reported data from 135, 128, 126, and 127 country
Parties representing 58.4 per cent, 53.3 per cent, 53.2 per cent and 61 per cent of the
global land area, respectively. Additional nationally relevant indicators were further
reported by 43 countries, involving 99 additional indicators.
58. The submitted data enabled the compilation of regional and global statistics
reflecting country Party reporting. The three land-based progress indicators provide
insights into the global land degradation status in an increasingly harmonized way,
21 Data based on national reports as of 31 August 2018 and thus may differ from LDN target setting data
in ICCD/CRIC(17)/3.
22 LDN response hierarchy = avoid > reduce > reverse land degradation.

ICCD/CRIC(17)/2
16
while the additional national indicators reinforce the reality that causes of local-scale
land degradation vary. The calculation of SDG indicator 15.3.1 provides an initial
indication of LDN status relevant to 2019 SDG indicators global database 23 and
reports.
59. Information relating to voluntary targets for LDN and other national targets
revealed 82 country Parties have set LDN targets and 36 are in planning stages, whilst
a further 68 countries have set other targets, mostly at the national scale.
60. Country Parties reported more hotspots than brightspots, in both number and
area.
61. Country Parties most frequently reported deforestation, overgrazing and
improper soil management as direct drivers of change, and population pressure, land
tenure, poverty, governance and education as indirect drivers of change. The high
frequency of reporting the group of any other drivers is indicative that there is a high
degree of nationally relevant/contextual knowledge of the drivers of degradation not
yet captured by the reporting process.
62. The majority of country Parties used default data to report on the land-based
progress indicators, underscoring the utility, suitability and need for data prepared in
a globally consistent manner, lowering the barriers to reporting for many countries.
In addition, country Parties indicated their use of Trends.Earth, which enabled
national adaptation of default data to official country boundaries as well as the
introduction of national datasets while employing the same methods, classes and
underlying algorithms that had been used to calculate the default data. In this way,
the majority of countries, whether through the direct use of default data or through
analysis of national data within Trends.Earth, reported on SO 1 in a methodologically
harmonized way.
63. However, variability in the scope of reporting, methods employed and the
scaling up of data handling processes underscores that spatially-explicit biophysical
indicator reporting remains challenging. Although this variability limits direct
comparability of nationally reported data, the aggregated results are indicative of
global land degradation. Moreover, significant progress has been made in the pursuit
of methodological harmonization in progress indicator reporting while simultaneously
enhancing the potential for country ownership of progress indicator monitoring and
data analysis.
64. Notable observations resulting from the analysis of data reported for SO 1 are
listed below for each progress indicator and SDG indicator 15.3.1:
Land cover
● Global trends indicate that losses in natural land cover classes between
2000–2015 exceed gains in the same classes by more than 250,000 km2.
● Grassland shows small fluctuations in trend but represent a loss of ~
300,000 km2 by 2015.
● Artificial areas increased by nearly one third between 2000–2015 with
the majority of this increase coming from natural and semi-natural
areas.
23 <https://unstats.un.org/sdgs/indicators/database/>.

ICCD/CRIC(17)/2
17
Land productivity
● Declining and stressed LPD trends were reported across 20 per cent of
the reported vegetated land area where land cover was static, with
grasslands experiencing the largest negative trends.
● Under changing land cover dynamics, the largest negative LPD
trajectories (more than half the areas reported) were seen in the
transition from tree-covered areas to grassland.
Carbon stocks
● Land cover transitions from tree-covered areas, grassland or wetland to
any other class resulted, on average, in losses of SOC.
● Transitions from artificial surfaces and the other land cover class to any
other class resulted, on average, in gains of SOC.
● Reporting for SOC stock averages was inconsistent between land cover
classes, with some countries reporting stocks for only a subset of classes.
Proportion of degraded land
● The proportion of degraded land for all land reported by country Parties
is 19.2 per cent, or more than 17.5 million km2.
● Two thirds of reporting country Parties utilized the entire SDG 15.3.1
indicator assessment methodology.
● Less than one third of reporting country Parties reported high
confidence in their proportion of degraded land estimates; half reported
medium confidence and one third reported low confidence, based on an
evaluation of underlying progress indicator data.
65. Parties at CRIC 17 may wish to consider these conclusions and the following
recommendations with a view to initiating early consultations on draft decisions to be
forwarded to COP 14.
66. Parties may wish to:
For continued work towards supporting efforts to achieve land degradation neutrality
(a) Encourage Parties and, with support of UNCCD secretariat and the
Global Mechanism of the UNCCD, enhance efforts to create an enabling environment
for LDN at the levels of both integrated land use planning and the design of
transformative projects/programmes, with aim of working with:
(i) Relevant international partners to expand initiatives which promote
increased tree-covered areas while also working to reverse declining
trends where these have been reported;
(ii) Relevant international partners to scale up/out approaches designed to
reverse the declining trends in grassland productivity;
(iii) Relevant partners on rural-urban linkages to optimize urban/peri-urban
growth to avoid cumulative losses of productive agricultural croplands,
grasslands and tree-covered areas;
(iv) Relevant partners to systematically bring LDN monitoring data into
land-use planning efforts from national to local levels;

ICCD/CRIC(17)/2
18
(v) Relevant custodian agencies of SDG indicators which may help in
monitoring and managing the direct and indirect drivers of land
degradation;
For continued work towards improved land-based progress indicator data sets
(b) Encourage Parties, with the support of the UNCCD secretariat and in
collaboration with other relevant international bodies and organizations, to expand
efforts to improve data quality through:
(i) Expansion of national soil mapping and monitoring networks with the
aim of increasing the coverage, resolution and accuracy of SOC data;
(ii) Enhancing national and global SOC mapping and modelling through
collective coordination and integration of legacy data into appropriate
national and global open data repositories;
(iii) Integration of above- and below-ground carbon stocks into the full Tier
II IPCC accounting methodology related to process modelling and net-
net accounting;
(iv) Expansion of crowd-based validation tools for improving national land-
based progress indicator datasets;
For continued work towards land-based progress indicator data harmonization and data
management
(c) Encourage Parties, with support of the UNCCD secretariat in
collaboration with the Group on Earth Observation (GEO) and participating
organizations and the GEO LDN Initiative24 to reinforce activities that:
(i) Further develop harmonized land-based progress indicator data using
new techniques, data and/or methodologies to achieve greater
consistency in future reporting rounds;25
(ii) Build national capacity to ensure that national datasets can be readily
used in UNCCD reporting on land-based progress indicators through the
standardized automation of agreed algorithms in open-source
tools/plugins such as Trends.Earth;
(iii) Support open-source data creation, automated analysis and curation
initiatives to reduce duplication of effort and to ensure progress
indicator data are up-to-date, replicable, globally applicable and
enabling for country Parties;
(iv) Ensure the long-term consistency and sustainability of data systems
supporting the reporting process, including data discovery, access and
storage systems, which help collect observations for validation, curation,
quality control, harmonization, analysis and archiving.
24 <https://www.earthobservations.org/activity.php?id=149>.
25 See ICCD/CRIC(17)/8, paragraphs 14 (i) and 52 (d).

ICCD/CRIC(17)/2
19
Annex
[English only]
Tables and figures
I. Introduction
1. This annex contains the tables and figures relevant to the parent document
“Preliminary analysis – strategic objective 1: To improve the condition of affected
ecosystems, combat desertification/land degradation, promote sustainable land management
and contribute to land degradation neutrality” prepared for the seventeenth session of the
Committee for the Review of the Implementation of the Convention.
2. The tables and figures herein are presented under section headings that mirror those
found in the main document and are numbered according to their appearance in the main
document. Each main section heading within this annex is separated into subsections
containing the tables relevant to that section and then the figures, where relevant.
II. Land cover tables and figures
A. Land cover tables
Table 1
Distribution of land cover stocks (km2) and percentage over global and regionally
reported land areas as of 2015
Tree-covered areas Grassland Cropland Wetland
Artificial
surfaces Other land
Region
Area
(1000s
km2) Percentage
Area
(1000s
km2)
Per-
centage
Area
(1000s
km2)
Per-
centage
Area
(1000s
km2)
Per-
centage
Area
(1000s
km2)
Per-
centage
Area
(1000s
km2)
Per-
centage
Africa 5 892 23.9 6 334 25.7 4 013 16.3 369 1.5 67 0.3 7 948 32.3
Asia 4 285 19.3 6 080 27.4 4 577 20.6 369 1.7 268 1.2 6 633 29.9
LAC 8 805 44.6 6 250 31.6 3 286 16.6 605 3.1 78 0.4 737 3.7
NMED 523 28.6 292 16.0 913 49.9 9 0.5 46 2.5 47 2.5
CEE 8 362 47.7 1 039 5.9 2 113 12.1 2 285 13.1 192 1.1 3 521 20.1
Global 28 192 32.4 20 134 23.1 15 426 17.7 3 643 4.2 692 0.8 18 896 21.7
Notes: LAC = Latin America and the Caribbean; NMED = Northern Mediterranean; CEE = Central and Eastern Europe

ICC
D/C
RIC
(17
)/2
20
Table 2
Cumulative change in land area and as percentage of original area for different land cover classes from 2000−2015
Region
name
Tree-covered areas Grassland Cropland Wetland Artificial surfaces Other land
Year
Net area
change
(km2 1000s)
Percent
change
Net area
change
(km2 1000s)
Percent
change
Net area
change
(km2 1000s)
Percent
change
Net area
change
(km2 1000s)
Percent
change
Net area
change
(km2 1000s)
Percent
change
Net area
change
(km2 1000s)
Percent
change
Africa
2005 21 0.4 -70 -1.1 61 1.6 2 0.7 7 15.5 -11 -0.1
2010 7 0.1 -132 -2.0 120 3.1 3 1.0 14 30.8 0 0.0
2015 -4 -0.1 -183 -2.8 133 3.4 5 1.5 23 51.6 47 0.6
Asia
2005 -6 -0.1 16 0.3 84 2.0 4 1.0 16 7.9 -103 -1.5
2010 -11 -0.3 -342 -5.5 215 5.1 18 5.4 40 20.0 77 1.1
2015 24 0.6 -186 -3.0 352 8.3 34 10.0 69 34.4 -290 -4.2
LAC
2005 -171 -1.9 43 0.7 106 3.4 4 0.7 9 16.7 0 0.0
2010 -210 -2.3 48 0.8 134 4.2 6 1.0 16 31.7 -1 -0.2
2015 -270 -3.0 77 1.3 136 4.3 8 1.3 26 50.4 24 3.4
NMED
2005 6 1.1 -3 -0.8 -8 -0.9 0 1.1 7 22.2 -2 -3.0
2010 14 2.7 -6 -2.1 -16 -1.7 0 2.1 11 34.9 -3 -5.5
2015 15 2.9 -8 -2.5 -19 -2.0 0 2.6 15 48.6 -4 -7.5
CEE
2005 10 0.1 -1 -0.1 -12 -0.6 0 0.0 7 4.4 -2 -0.1
2010 198 2.4 -3 -0.3 -12 -0.6 -2 -0.1 17 10.1 -2 -0.1
2015 198 2.4 1 0.1 -14 -0.7 16 0.7 22 13.3 -10 -0.3
Global
2005 -142 -0.5 -15 -0.1 222 1.5 10 0.3 56 10.6 -118 -0.6
2010 -2 0.0 -436 -2.1 430 2.9 26 0.7 110 21.0 71 0.4
2015 -35 -0.1 -301 -1.5 575 3.9 63 1.7 168 32.2 -233 -1.2
Notes: LAC = Latin America and the Caribbean; NMED = Northern Mediterranean; CEE = Central and Eastern Europe

ICC
D/C
RIC
(17
)/2
2
1
Table 3
Land area converted from natural vegetation land cover classes (natural land losses) and converted to natural land cover classes (natural
land gains) as well as transitions between other classes (other transitions) as net area change (km2 1000s) and percent change between
2000 and 2015
Region
Land cover
transition
Tree-covered
areas
Grassland Cropland Wetland Artificial surfaces Other land Total
Net area
change
(km2
1000s)
Percent
change
Net area
change
(km2
1000s)
Percent
change
Net area
change
(km2
1000s)
Percent
change
Net area
change
(km2
1000s)
Percent
change
Net area
change (km2
1000s)
Percent
change
Net area
change
(km2
1000s)
Percent
change
Net area
change
(km2
1000s)
Percent
change
Africa Natural land
losses - - - - 231.0 1.8 - - 8.9 0.1 113.3 0.9 353.1 2.8
Natural land gains 56.5 0.4 136.1 1.1 - - 7.1 0.1 - - - - 199.7 1.6
Asia Natural land
losses - - - - 288.4 2.7 - - 22.2 0.2 256.3 2.4 566.9 5.2
Natural land gains 135.1 1.2 446.2 4.1 - - 15.4 0.1 - - - - 596.7 5.5
LAC Natural land
losses - - - - 266.0 1.7 - - 11.3 0.1 6.6 0.0 283.8 1.8
Natural land gains 66.4 0.4 52.2 0.3 - - 1.6 0.0 - - - - 120.2 0.8
NMED Natural land
losses - - - - 8.7 1.1 - - 2.5 0.3 0.2 0.0 11.4 1.4
Natural land gains 17.6 2.1 1.4 0.2 - - 0.0 0.0 - - - - 19.0 2.3
CEE Natural land
losses - - - - 4.8 0.0 - - 0.8 0.0 0.8 0.0 6.4 0.1
Natural land gains 11.1 0.1 10.1 0.1 - - 0.7 0.0 - - - - 22.0 0.2
Global Natural land
losses - - - - 803.9 1.5 - - 48.2 0.1 377.2 0.7 1 229.3 2.4
Natural land gains 292.8 0.6 647.1 1.2 - - 24.9 0.0 - - - - 964.8 1.8
Notes: LAC = Latin America and the Caribbean; NMED = Northern Mediterranean; CEE = Central and Eastern Europe

ICCD/CRIC(17)/2
22
Table 4
Critical land cover transitions by different regions and globally between 2000 and
2015
Region Transition class
Area
(km2 1000s)
Percent
initial area
Africa Conversion from tree-covered areas to other land types (deforestation) 172.2 2.9
Conversion from natural and semi-natural vegetated land to artificial areas 18.4 0.1
Conversion from natural and semi-natural vegetated land to other land 117.2 0.7
Conversion from cropland to natural vegetated land 71.2 1.8
Conversion from other land types to tree-covered areas 163.6 0.9
Asia Conversion from tree-covered areas to other land types (deforestation) 270.8 6.4
Conversion from natural and semi-natural vegetated land to artificial areas 59.9 0.4
Conversion from natural and semi-natural vegetated land to other land 385.1 2.6
Conversion from cropland to natural vegetated land 141.1 3.3
Conversion from other land types to tree-covered areas 409.9 2.3
LAC Conversion from tree-covered areas to other land types (deforestation) 447.3 4.9
Conversion from natural and semi-natural vegetated land to artificial areas 26.2 0.1
Conversion from natural and semi-natural vegetated land to other land 7.1 0.0
Conversion from cropland to natural vegetated land 111.3 3.5
Conversion from other land types to tree-covered areas 217.7 2.0
NMED Conversion from tree-covered areas to other land types (deforestation) 8.1 1.6
Conversion from natural and semi-natural vegetated land to artificial areas 10.9 0.6
Conversion from natural and semi-natural vegetated land to other land 0.4 0.0
Conversion from cropland to natural vegetated land 18.3 2.0
Conversion from other land types to tree-covered areas 21.4 1.6
CEE Conversion from tree-covered areas to other land types (deforestation) 6.5 0.1
Conversion from natural and semi-natural vegetated land to artificial areas 14.3 0.1
Conversion from natural and semi-natural vegetated land to other land 0.8 0.0
Conversion from cropland to natural vegetated land 12.8 0.6
Conversion from other land types to tree-covered areas 15.3 0.2
Global Conversion from tree-covered areas to other land types (deforestation) 911.1 3.2
Conversion from natural and semi-natural vegetated land to artificial areas 143.2 0.2
Conversion from natural and semi-natural vegetated land to other land 510.7 0.8
Conversion from cropland to natural vegetated land 361.5 2.4
Conversion from other land types to tree-covered areas 835.4 1.4
Notes: LAC = Latin America and the Caribbean; NMED = Northern Mediterranean; CEE = Central and Eastern Europe

ICCD/CRIC(17)/2
23
Table 5
Area change (km2 1000s) from initial land cover classes (rows) to final land cover
classes (columns) between 2000 and 2015 for different regions
Region
name Land cover
Tree-covered
areas
(km2 1000s)
Grassland
(km2 1000s)
Cropland (km2
1000s)
Wetland
(km2 1000s)
Artificial
surfaces
(km2 1000s)
Other land
(km2 1000s)
Africa Tree-covered areas 5 652.9 79.8 83.0 2.4 5.4 1.6
Grassland 105.6 5 271.8 146.8 1.0 3.2 106.1
Cropland 49.4 15.9 3 472.0 6.0 9.4 3.9
Wetland 1.5 0.8 1.2 341.6 0.3 5.6
Artificial surfaces 0.1 0.1 0.2 0.1 26.5 2.0
Other land 7.0 120.1 7.8 1.0 5.0 7 754.5
Asia Tree-covered areas 2 379.3 109.3 106.9 9.1 7.8 37.8
Grassland 270.8 4 920.0 174.9 40.4 13.3 211.2
Cropland 79.8 55.4 3 050.6 5.9 37.7 128.8
Wetland 3.9 31.9 6.6 169.1 1.0 7.3
Artificial surfaces 5.4 2.5 15.8 1.3 110.5 5.5
Other land 49.9 388.3 301.3 8.1 20.1 3 021.0
LAC Tree-covered areas 7 547.5 226.8 167.1 50.5 2.4 0.6
Grassland 112.0 5 460.1 96.7 2.9 8.2 5.8
Cropland 66.1 44.0 2 926.0 1.2 14.9 0.5
Wetland 39.3 51.4 2.2 479.9 0.8 0.2
Artificial surfaces 0.1 0.3 0.6 0.0 43.6 0.0
Other land 0.2 7.9 0.6 0.4 0.4 254.8
NMED Tree-covered areas 458.2 1.6 5.1 0.1 1.1 0.1
Grassland 3.8 272.9 3.6 0.0 1.3 0.1
Cropland 17.4 0.9 880.1 0.0 8.5 0.2
Wetland 0.1 0.0 0.0 7.1 0.1 0.0
Artificial surfaces 0.0 0.0 0.0 0.0 26.7 0.0
Other land 0.2 0.5 0.5 0.0 3.2 46.0
CEE Tree-covered areas 337.2 1.3 4.0 0.2 0.4 0.5
Grassland 4.1 58.8 0.8 0.3 0.3 0.3
Cropland 10.7 1.8 694.5 0.2 13.5 0.0
Wetland 0.0 0.2 0.0 4.4 0.0 0.0
Artificial surfaces 0.0 0.0 0.1 0.0 21.0 0.0
Other land 0.4 8.3 0.7 0.5 0.0 2.9
Global Tree-covered areas 16 691.0 420.9 369.0 62.3 18.1 40.8
Grassland 497.7 16 120.9 424.7 44.8 27.9 323.4
Cropland 229.0 119.0 11 543.4 13.5 95.0 133.5
Wetland 45.0 84.4 10.1 1 006.4 2.2 13.0
Artificial surfaces 5.6 3.0 16.7 1.4 254.9 7.6
Other land 58.2 525.1 310.9 10.0 28.6 11 088.9
Notes: LAC = Latin America and the Caribbean; NMED = Northern Mediterranean; CEE = Central and Eastern Europe

ICC
D/C
RIC
(17
)/2
24
Table 6
Number of times direct drivers were attributed to land cover class transition by regions
Region Deforestation
Over-
grazing
Improper
management
of annual,
perennial,
scrub and
tree crops
Improper
soil
management Urbanization
Overexploitation
of vegetation for
domestic use
Release of
airborne
pollutants Discharges
Disturbance
of the water
cycle
Industrial
activities
Any
other
Africa 44 29 38 37 30 39 2 6 7 12 45
Asia 27 4 17 8 17 18 - 2 5 9 29
LAC 20 5 8 15 13 5 3 1 6 4 23
NMED 1 - 4 2 8 - - - - 3 2
CEE 9 - 7 1 7 - - 2 - 4 5
Global 102 38 76 63 76 62 5 11 18 32 106
Notes: LAC = Latin America and the Caribbean; NMED = Northern Mediterranean; CEE = Central and Eastern Europe
Table 7
Number of times direct drivers were attributed to land cover transition by initial land cover class
From
Area
(km2
1000s) Deforestation
Over-
grazing
Improper
management
of annual,
perennial,
scrub and
tree crops
Improper
soil
management Urbanization
Over-
exploitation
of vegetation
for domestic
use
Release
of
airborne
pollutants Discharges
Disturbance
of the water
cycle
Industrial
activities
Any
other
Tree-covered
areas 674 90 11 34 22 21 37 2 2 6 12 22
Grassland 1 161 6 23 16 18 15 19 1 3 3 3 35
Cropland 438 4 3 18 19 27 5 2 4 4 12 30
Wetland 8 1 - 3 3 5 1 - 1 4 2 4
Artificial
surfaces 4 - - - - 1 - - - - - -
Other land 655 - 1 3 1 6 - - 1 1 3 15
Total 2 940 102 38 76 63 76 62 5 11 18 32 106
ICCD/CRIC(17)/2
25
Table 8
Number of times indirect drivers were attributed to land cover transition across
regions
Region
Population
pressure
Governance,
institutional
settings and
policies
Education,
access to
knowledge
and support
services Land tenure
Labour
availability Poverty
War and
conflict Any other
Africa 91 40 47 61 11 55 21 24
Asia 31 19 8 19 6 25 - 13
LAC 21 14 8 22 4 16 - 18
NMED 11 2 - 3 1 4 - -
CEE 8 4 3 11 4 2 - 7
Global 165 79 66 118 26 102 21 62
Notes: LAC = Latin America and the Caribbean; NMED = Northern Mediterranean; CEE = Central and Eastern Europe
Table 9
The number of times indirect drivers were attributed to land cover transition by
initial land cover class
Land cover
Area
(km2
1000s)
Population
pressure
Governance,
institutional
settings and
policies
Education,
access to
knowledge
and
support
services
Land
tenure
Labour
availability Poverty
War and
conflict
Any
other
Tree-covered areas 727 73 22 20 59 8 51 8 22
Grassland 1 178 44 21 17 33 3 24 4 17
Cropland 439 30 25 20 23 10 19 7 11
Wetland 8 6 5 4 2 - 3 1 5
Artificial surfaces 3 - - - - - 1 - -
Other land 577 10 6 5 1 5 4 1 6
Total 2 934 165 79 66 118 26 102 21 62
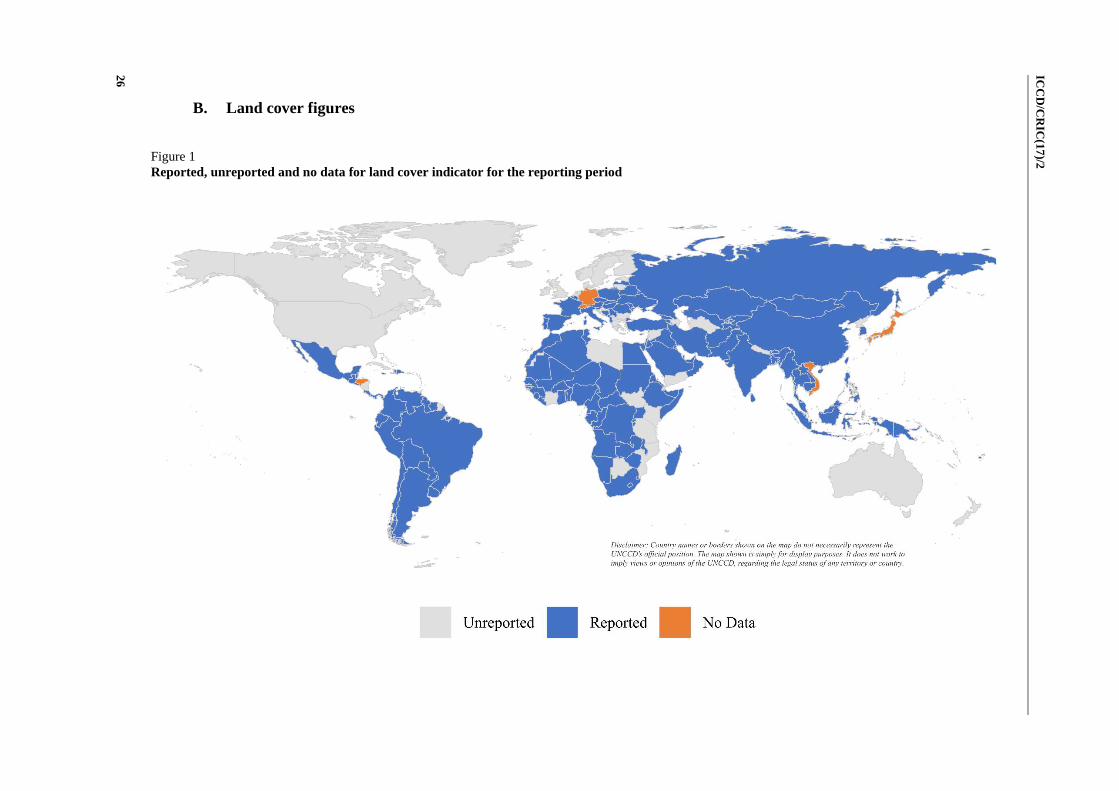
ICC
D/C
RIC
(17
)/2
26
B. Land cover figures
Figure 1
Reported, unreported and no data for land cover indicator for the reporting period

ICCD/CRIC(17)/2
27
Figure 2
Data sources used by country Parties in reporting for land cover
Figure 3
Per cent area of each land cover class found within each regional grouping as of 2015
Notes: LAC = Latin America and the Caribbean; NMED = Northern Mediterranean; CEE = Central and Eastern
Europe

ICCD/CRIC(17)/2
28
Figure 4
Cumulative total area change (1000’s km2) by land cover type for all areas reported
for 2000
Figure 5
Cumulative percent change of land cover type on all areas reported in 2000
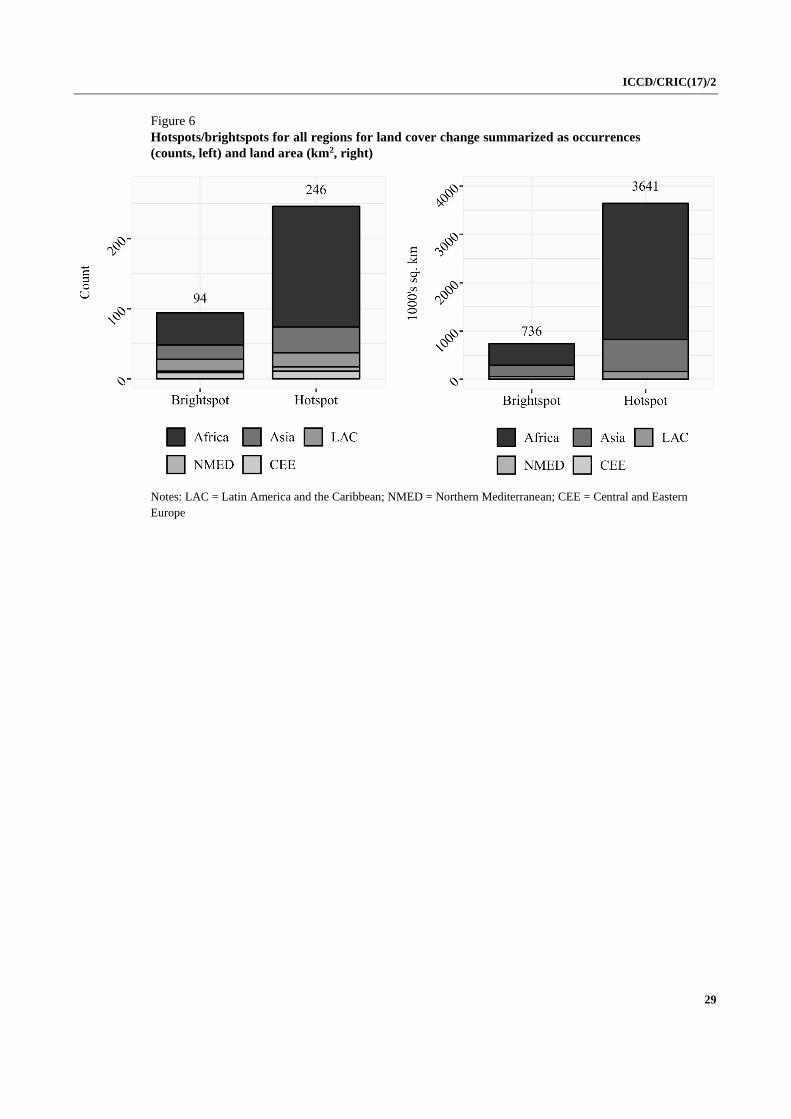
ICCD/CRIC(17)/2
29
Figure 6
Hotspots/brightspots for all regions for land cover change summarized as occurrences
(counts, left) and land area (km2, right)
Notes: LAC = Latin America and the Caribbean; NMED = Northern Mediterranean; CEE = Central and Eastern
Europe

ICC
D/C
RIC
(17
)/2
30
III. Land productivity
A. Land productivity tables
Table 10
Land productivity dynamics (LPD) for static land cover classes of each LPD class across different regions as area (km2) and as percentage of initial
area
Declining Stressed Stable or increasing No data
Region Land cover
Area (km2
1000s) Percentage
Area (km2
1000s) Percentage
Area (km2
1000s) Percentage
Area (km2
1000s) Percentage
Africa Tree-covered areas 318.9 5.4 489.8 8.3 5 054.8 86.0 14.7 0.2
Grassland 922.6 14.8 524.8 8.4 4 603.1 74.1 163.5 2.6
Cropland 498.3 12.9 365.7 9.5 2 980.9 77.2 18.9 0.5
Wetland 18.6 5.3 18.4 5.2 283.9 80.5 31.9 9.0
Total 1 758.3 10.8 1 398.7 8.6 12 922.8 79.2 228.9 1.4
Asia Tree-covered areas 361.6 9.8 421.1 11.4 2 893.7 78.3 18.6 0.5
Grassland 628.2 12.7 943.8 19.1 3 311.2 66.9 69.7 1.4
Cropland 180.9 5.3 360.8 10.6 2 829.3 83.2 30.0 0.9
Wetland 23.2 9.1 46.8 18.3 160.2 62.8 24.8 9.7
Total 1 193.8 9.7 1 772.5 14.4 9 194.4 74.7 143.1 1.2
LAC Tree-covered areas 606.4 7.0 1 022.2 11.8 6 975.7 80.5 56.4 0.7
Grassland 1 188.0 19.5 731.1 12.0 4 034.7 66.3 128.4 2.1
Cropland 647.7 21.0 513.6 16.6 1 913.1 62.0 10.9 0.4
Wetland 52.6 9.6 58.9 10.8 373.9 68.3 61.9 11.3
Total 2 494.7 13.6 2 325.8 12.7 13 297.4 72.4 257.6 1.4
NMED Tree-covered areas 5.7 1.3 40.0 8.9 403.4 89.8 0.3 0.1
Grassland 4.0 1.6 37.5 14.7 212.8 83.5 0.7 0.3
Cropland 20.2 2.3 101.8 11.5 760.8 86.1 1.1 0.1
Wetland 0.1 1.1 1.4 12.0 9.6 81.2 0.7 5.8
Total 30.0 1.9 180.7 11.3 1 386.6 86.7 2.7 0.2
CEE Tree-covered areas 1.1 0.0 6.4 0.1 8 271.4 99.9 3.4 0.0
Grassland 1.8 0.2 2.3 0.2 43.9 4.5 926.1 95.1
Cropland 75.3 3.8 63.6 3.2 1 864.6 92.9 3.0 0.2
Wetland 0.1 0.0 0.2 0.0 4.7 0.2 2 268.4 99.8
Total 78.2 0.6 72.5 0.5 10 184.6 75.2 3 200.9 23.6

ICC
D/C
RIC
(17
)/2
3
1
Global Tree-covered areas 1 296.3 4.8 1 989.9 7.3 23 862.7 87.6 94.2 0.3
Grassland 2 748.1 14.8 2 248.6 12.1 12 314.2 66.2 1 288.6 6.9
Cropland 1 440.3 10.5 1 433.5 10.4 10 814.8 78.6 64.6 0.5
Wetland 95.3 2.8 125.9 3.7 834.6 24.2 2 387.1 69.3
Total 5 580.0 8.9 5 797.9 9.2 47 826.3 75.9 3 834.5 6.1
Notes: LAC = Latin America and the Caribbean; NMED = Northern Mediterranean; CEE = Central and Eastern Europe
Table 11
Direct drivers of land productivity dynamics within static land cover classes grouped by region
Region Deforestation Discharges
Disturbance
of the water
cycle
Improper
management
of annual,
perennial and
tree crops
Improper soil
management
Industrial
activities
Over-
exploitation of
vegetation for
domestic use
Over-
grazing
Release of
airborne
pollutants Urbanization
Any
other
Africa 20 2 3 14 11 2 21 8 - 13 15
Asia 4 - - 7 8 2 3 3 - 4 8
LAC 5 - - 1 3 - 7 1 - 3 9
NMED - - - 1 - - - - - - -
CEE - - 3 1 2 - - 1 - 3 10
Global 29 2 6 24 24 4 31 13 - 23 42
Notes: LAC = Latin America and the Caribbean; NMED = Northern Mediterranean; CEE = Central and Eastern Europe

ICC
D/C
RIC
(17
)/2
32
Table 12
Direct drivers of land productivity dynamics (LPD) within static land cover classes grouped by LPD trajectory classes
From LPD Area (km2)
Deforesta
tion
Discharge
s
Disturbance
of the water
cycle
Improper
managemen
t of annual,
perennial
and tree
crops
Improper
soil
managemen
t
Industri
al
activitie
s
Over-
exploitation
of
vegetation
for domestic
use
Over-
grazin
g
Release of
airborne
pollutants
Urbanizati
on
Any
other
Tree-
covered
areas
Declinin
g 98 092 5 - 1 - - - 3 1 - 3 3
Stressed 69 460 4 - - - - - - - - 1 2
Other 1 096 395 6 - - 2 1 - 3 - - - 11
Total 1 263 948 15 - 1 2 1 - 6 1 - 4 16
Grass- Declinin
g 192 358 2 - - 2 2 1 4 4 - 2 1
land Stressed 24 031 - - - 1 - - 2 - - - 1
Other 60 358 1 - - 1 - - - 2 - - 5
Total 276 747 3 - - 4 2 1 6 6 - 2 7
Cropland Declinin
g 86 098 1 - 1 6 7 1 2 2 - 3 4
Stressed 53 417 - - 1 1 4 - - - - - 2
Other 694 849 3 - - 4 5 1 8 - - - 8
Total 834 364 4 - 2 11 16 2 10 2 - 3 14
Wetland Declinin
g 965 1 1 2 2 1 - 1 - - 2 -
Stressed 130 1 - - 2 1 - 1 - - 1 -
Other 28 434 - - 1 - - - 1 - - - -
Total 29 530 2 1 3 4 2 - 3 - - 3 -
Total 2 404 588 24 1 6 21 21 3 25 9 - 12 37
Notes: LAC = Latin America and the Caribbean; NMED = Northern Mediterranean; CEE = Central and Eastern Europe

ICC
D/C
RIC
(17
)/2
3
3
Table 13
Global land productivity dynamics (LPD) for changing land cover classes between 2000 and 2015 showing net area change (km2) for each land cover
transition, with the area (km2) of each LPD trajectory and the proportion (%) of the LPD trajectory relative to the net area change
Net area
change (km)
Declining Stressed Other
Initial Final Area (km2) Percent Area (km2) Percent
Area
(km2) Percent
Tree-covered areas Grassland 556 807 274 483 49.3 79 999 14.4 202 325 36.3
Cropland 315 176 53 542 17.0 67 779 21.5 193 855 61.5
Wetland 13 851 905 6.5 967 7.0 11 979 86.5
Grassland Tree-covered areas 263 866 35 503 13.5 62 107 23.5 166 255 63.0
Cropland 144 242 29 460 20.4 7 679 5.3 107 103 74.3
Wetland 36 205 3 038 8.4 4 725 13.1 28 441 78.6
Cropland Tree-covered areas 169 109 11 873 7.0 28 659 16.9 128 577 76.0
Grassland 68 968 6 456 9.4 10 377 15.0 52 135 75.6
Wetland 3 541 230 6.5 306 8.6 3 005 84.9
Wetland Tree-covered areas 1 810 67 3.7 181 10.0 1 562 86.3
Grassland 2 349 224 9.5 711 30.2 1 415 60.2
Cropland 2 474 458 18.5 736 29.8 1 280 51.7
Table 14
Direct drivers of land productivity dynamics with changing land cover classes grouped by region
Region Deforestation Discharges
Disturbance
of the water
cycle
Improper
management
of annual,
perennial and
tree crops
Improper soil
management
Industrial
activities
Over-
exploitation of
vegetation for
domestic use
Over-
grazing
Release of
airborne
pollutants Urbanization
Any
other
Africa 20 - 5 18 16 7 19 15 1 14 14
Asia 5 - 3 5 2 4 2 4 - 3 7
LAC 19 - 3 4 4 2 7 5 2 6 10
NMED - - - - - - - - - 2 1
CEE - - - - - 2 - - - 1 -
Global 44 - 11 27 22 15 28 24 3 26 32
Notes: LAC = Latin America and the Caribbean; NMED = Northern Mediterranean; CEE = Central and Eastern Europe

ICC
D/C
RIC
(17
)/2
34
Table 15
Direct drivers of land productivity dynamics (LPD) with changing land cover classes grouped by initial land cover class and LPD trajectory classes
From LPD Area (km2)
Deforesta
tion
Dis-
charges
Disturbance
of the water
cycle
Improper
management
of annual,
perennial and
tree crops
Improper
soil
manage-
ment
Indus-
trial
active-
ties
Over-
exploitation
of
vegetation
for domestic
use
Over-
grazin
g
Release of
airborne
pollutants
Urbani-
zation
Any
other
Tree-
covered
areas
Declining 73 894 20 - 1 6 2 5 6 3 - 4 5
Stressed 31 663 12 - 1 5 5 1 4 1 - - 1
Other 12 801 5 - - 1 2 - 2 2 - - 7
Total 118 358 37 - 2 12 9 6 12 6 - 4 13
Grass- Declining 62 374 2 - 1 1 3 1 4 5 - 5 -
land Stressed 63 710 3 - 3 5 2 - 5 8 - 1 1
Other 1 102 558 - - - 2 1 1 1 - 1 - 7
Total 1 228 643 5 - 4 8 6 2 10 13 1 6 8
Cropland Declining 23 512 - - 2 4 5 3 2 2 - 8 1
Stressed 836 - - 1 1 1 1 1 1 - 1 -
Other 113 032 1 - - 2 1 2 1 - 2 2 6
Total 137 380 1 - 3 7 7 6 4 3 2 11 7
Wetland Declining 1 824 1 - - - - 1 1 1 - 2 -
Other 26 - - 2 - - - - - - - -
Total 1 850 1 - 2 - - 1 1 1 - 2 -
Total 1 486 231 44 - 11 27 22 15 27 23 3 23 28

ICCD/CRIC(17)/2
35
Table 16
Regional land productivity dynamics (LPD) for land cover classes that have
undergone change between 2000 and 2015, reported as net area change (km2) for each
land cover transition, with the area (km2) of each LPD trajectory and the proportion
(%) of the LPD trajectory relative to the net area change for the land cover transition
Net area
change
(km)
Declining Stressed Other
Region Initial Final
Area
(km2) Percent
Area
(km2) Percent
Area
(km2) Percent
Africa Tree-covered
areas
Grassland 55 195 9 893 17.9 4 360 7.9 40 942 74.2
Cropland 87 481 11 281 12.9 6 300 7.2 69 900 79.9
Wetland 1 646 79 4.8 66 4.0 1 501 91.2
Grassland Tree-covered areas 52 441 8 277 15.8 1 867 3.6 42 296 80.7
Cropland 47 678 18 106 38.0 3 875 8.1 25 698 53.9
Wetland 488 68 13.8 14 2.8 407 83.3
Cropland Tree-covered areas 79 225 5 902 7.4 10 518 13.3 62 805 79.3
Grassland 6 018 1 054 17.5 311 5.2 4 652 77.3
Wetland 1 762 98 5.5 92 5.2 1 573 89.3
Wetland Tree-covered areas 103 3 2.4 3 2.5 98 95.1
Grassland 14 0 0.0 0 2.0 14 98.0
Cropland 30 10 33.8 1 2.6 19 63.5
Asia Tree-covered
areas
Grassland 112 493 15 677 13.9 21 186 18.8 75 630 67.2
Cropland 50 234 5 101 10.2 9 515 18.9 35 618 70.9
Wetland 2 894 55 1.9 58 2.0 2 781 96.1
Grassland Tree-covered areas 152 689 20 285 13.3 33 929 22.2 98 474 64.5
Cropland 74 302 2 616 3.5 3 377 4.5 68 309 91.9
Wetland 35 697 2 967 8.3 4 711 13.2 28 018 78.5
Cropland Tree-covered areas 54 584 3 081 5.6 5 154 9.4 46 348 84.9
Grassland 51 376 3 259 6.3 6 159 12.0 41 959 81.7
Wetland 1 459 74 5.0 212 14.5 1 174 80.4
Wetland Tree-covered areas 308 6 1.9 31 10.1 271 88.0
Grassland 1 333 58 4.4 107 8.0 1 167 87.6
Cropland 1 774 255 14.4 440 24.8 1 080 60.8
LAC Tree-covered
areas
Grassland 385 829 248 155 64.3 54 312 14.1 83 362 21.6
Cropland 167 912 36 770 21.9 51 206 30.5 79 937 47.6
Wetland 9 138 767 8.4 827 9.0 7 545 82.6
Grassland Tree-covered areas 55 594 6 938 12.5 26 298 47.3 22 358 40.2
Cropland 22 214 8 732 39.3 406 1.8 13 076 58.9
Wetland 20 3 16.3 0 0.9 16 82.8
Cropland Tree-covered areas 29 726 2 881 9.7 12 951 43.6 13 895 46.7
Grassland 10 635 2 119 19.9 3 817 35.9 4 699 44.2
Wetland 127 58 46.0 2 1.5 66 52.4
Wetland Tree-covered areas 1 397 59 4.2 147 10.5 1 190 85.2
Grassland 1 003 165 16.5 603 60.2 234 23.4
Cropland 669 193 28.9 295 44.1 181 27.0
NMED Tree-covered
areas
Grassland 25 6 24.0 6 24.0 13 52.0
Cropland 2 534 166 6.6 290 11.4 2 078 82.0
Cropland Grassland 853 23 2.7 89 10.4 741 86.9

ICCD/CRIC(17)/2
36
CEE Tree-covered
areas
Grassland 886 43 4.9 35 4.0 807 91.2
Cropland 4 064 132 3.2 241 5.9 3 691 90.8
Wetland 173 4 2.3 16 9.1 153 88.5
Grassland Tree-covered areas 3 143 4 0.1 13 0.4 3 126 99.5
Cropland 48 6 12.6 21 44.5 20 42.9
Cropland Tree-covered areas 5 573 9 0.2 36 0.6 5 528 99.2
Grassland 86 2 1.7 1 1.2 84 97.1
Wetland 192 0 0.2 0 0.2 192 99.7
Wetland Tree-covered areas 2 0 0.0 0 8.9 2 91.1
Notes: LAC = Latin America and the Caribbean; NMED = Northern Mediterranean; CEE = Central and Eastern Europe

ICC
D/C
RIC
(17
)/2
3
7
B. Land productivity figures
Figure 7
Reported, unreported and no data for land productivity dynamics indicator for the reporting period

ICCD/CRIC(17)/2
38
Figure 8
Data sources used in reporting for land productivity dynamics
Notes: LPD = land productivity dynamics
Figure 9
Global land productivity dynamics for static land cover classes
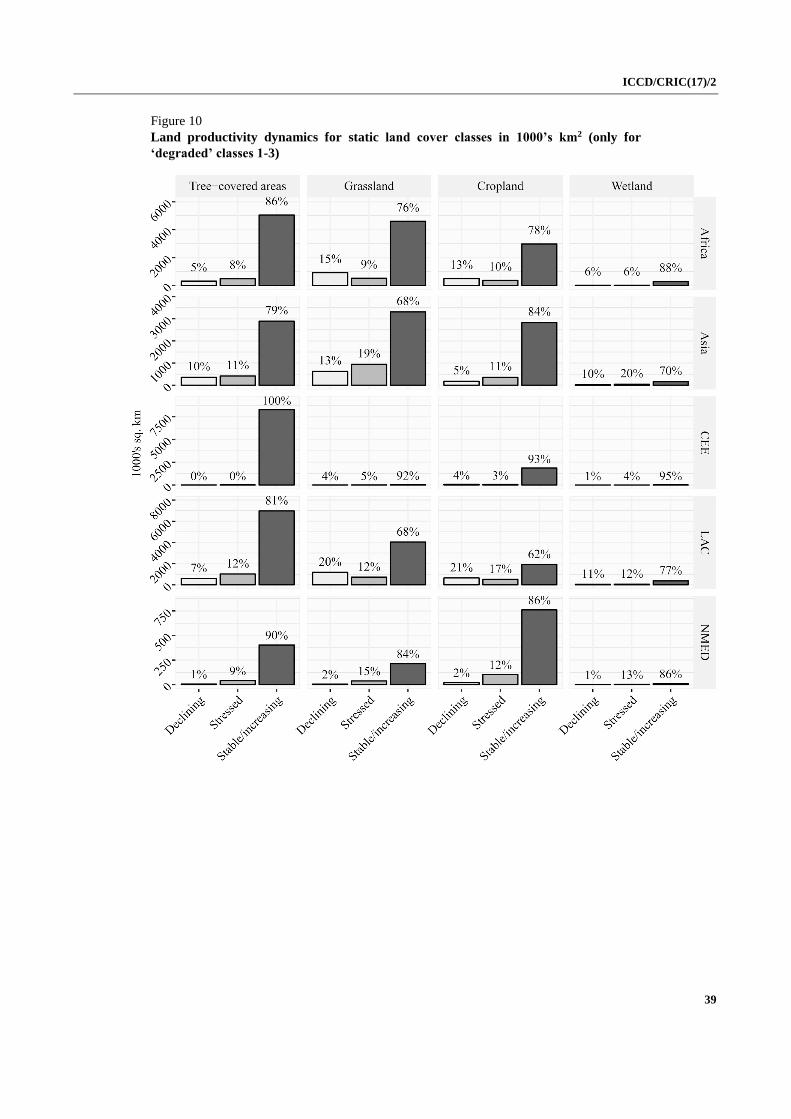
ICCD/CRIC(17)/2
39
Figure 10
Land productivity dynamics for static land cover classes in 1000’s km2 (only for
‘degraded’ classes 1-3)

ICCD/CRIC(17)/2
40
Figure 11
Hotspots/brightspots for all regions for land productivity dynamics as summarized as
occurrences (counts, left) and land areas (km2, right)
Notes: LAC = Latin America and the Caribbean; NMED = Northern Mediterranean; CEE = Central and Eastern
Europe
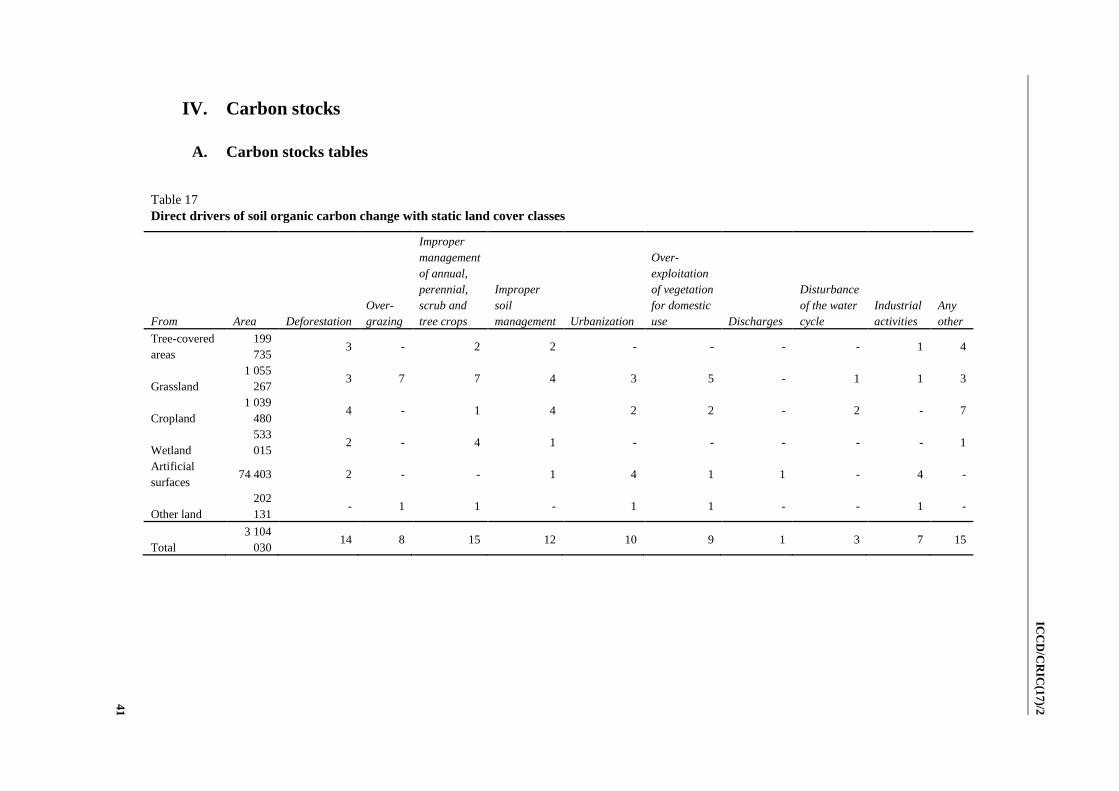
ICC
D/C
RIC
(17
)/2
4
1
IV. Carbon stocks
A. Carbon stocks tables
Table 17
Direct drivers of soil organic carbon change with static land cover classes
From Area Deforestation
Over-
grazing
Improper
management
of annual,
perennial,
scrub and
tree crops
Improper
soil
management Urbanization
Over-
exploitation
of vegetation
for domestic
use Discharges
Disturbance
of the water
cycle
Industrial
activities
Any
other
Tree-covered
areas
199
735 3 - 2 2 - - - - 1 4
Grassland
1 055
267 3 7 7 4 3 5 - 1 1 3
Cropland
1 039
480 4 - 1 4 2 2 - 2 - 7
Wetland
533
015 2 - 4 1 - - - - - 1
Artificial
surfaces 74 403 2 - - 1 4 1 1 - 4 -
Other land
202
131 - 1 1 - 1 1 - - 1 -
Total
3 104
030 14 8 15 12 10 9 1 3 7 15

ICC
D/C
RIC
(17
)/2
42
Table 18
Indirect drivers of soil organic carbon change with static land cover classes
From Area
Population
pressure Poverty
Governance,
institutional
settings and
policies
Labour
availability
Land
tenure
Education, access
to knowledge and
support services
War and
conflict Any other
Tree-covered areas 199 735 2 2 1 1 3 1 - 2
Grassland 1 055 267 2 1 2 1 - 1 1 2
Cropland 1 039 480 4 2 3 3 1 2 1 1
Wetland 533 015 3 1 - - 1 - - 1
Artificial surfaces 74 403 3 - - - 2 - - 2
Other land 202 131 - - - - - - - -
Total 3 104 030 14 6 6 5 7 4 2 8
Table 19
Direct drivers of soil organic carbon change with changing land cover classes
From To Area
De-
forestation
Over-
grazing
Improper
management
of annual,
perennial,
scrub and
tree crops
Improper
soil
manage-
ment
Urbani-
zation
Over-
exploitation
of vegetation
for domestic
use
Release of
airborne
pollutants
Dis-
charges
Distur-
bance of
the water
cycle
Industrial
activities
Any
other
Tree-
covered
areas
Grassland 131 484 19 8 5 3 - 6 - - 1 - 3
Cropland 79 716 26 1 14 14 3 10 - 2 2 3 5
Wetland 2 540 - - - - - - - 1 - - -
Artificial surfaces 2 315 5 - 2 1 6 2 - - - 3 1
Other land 10 425 3 1 2 - 1 3 - - 1 1 3
Total 226 480 53 10 23 18 10 21 - 3 4 7 12
Grasslan
d
Tree-covered
areas 55 419 - 1 3 2 1 1 - 1 1 - 6
Cropland 61 365 4 4 3 5 1 6 - - - 1 2
Wetland 1 346 - - - - - 1 - - - - -
Artificial surfaces 4 169 - 1 - 1 10 1 1 1 - 4 2
Other land 69 979 2 7 3 5 3 4 1 1 2 2 1
Total 192 278 6 13 9 13 15 13 2 3 3 7 11

ICC
D/C
RIC
(17
)/2
4
3
Cropland Tree-covered
areas 8 543 - - 2 2 - 1 - 1 - - 6
Grassland 11 890 1 4 3 6 - 3 - 1 1 - 9
Wetland 304 1 - 1 1 - - - - - - -
Artificial surfaces 11 833 1 3 7 3 16 2 - 1 - 8 2
Other land 3 569 - 1 - 2 - 1 - - 1 - 2
Total 36 140 3 8 13 14 16 7 - 3 2 8 19
Wetland Tree-covered
areas 1 429 - - - - - - - 1 1 - 1
Cropland 195 - - - - - - - - 1 - 1
Artificial surfaces 93 - - 1 1 1 - - - 1 - 1
Other land 180 1 1 1 - 1 - - - 2 - -
Total 1 897 1 1 2 1 2 - - 1 5 - 3
Artificial
surfaces
Tree-covered
areas 61 - - - - - - - - - - 1
Total 61 - - - - - - - - - - 1
Other
land
Tree-covered
areas 35 - - - - - - - - - - -
Grassland 27 637 - - - - - - - - - - 2
Cropland 215 - - - - - - - - - - -
Wetland 7 - - 1 - - - - - - - -
Artificial surfaces 4 578 1 1 2 1 3 - - - - 1 1
Other land 2 314 - - 1 1 - - - - - - -
Total 34 787 1 1 4 2 3 - - - - 1 3
Total 491 645 64 33 51 48 46 41 2 10 14 23 49

ICC
D/C
RIC
(17
)/2
44
Table 20
Direct drivers of soil organic carbon change with static land cover classes
From To Area
Population
pressure Poverty
Governance,
institutional
settings and
policies
Labour
availability
Land
tenure
Education,
access to
knowledge
and support
services
War
and
conflict
Afforestation,
including natural
afforestation and
reforestation occurred
on abandoned
agricultural lands
Any
other
Tree-
covered
areas
Grassland 131 484 8 7 5 3 10 2 2 - 5
Cropland 79 716 19 12 11 3 15 5 2 - 5
Wetland 2 540 - - - - - - - - 1
Artificial surfaces 2 315 8 3 3 - 6 - - - -
Other land 10 425 3 3 3 - 3 1 - - 3
Total 226 480 38 25 22 6 34 8 4 - 14
Grassland Tree-covered areas 55 419 - 1 2 2 1 3 1 1 4
Cropland 61 365 6 3 3 1 6 - - - 2
Wetland 1 346 - - - - - - - - 1
Artificial surfaces 4 169 7 3 3 2 5 1 2 - 1
Other land 69 979 5 3 5 1 2 2 2 - 2
Total 192 278 18 10 13 6 14 6 5 1 10
Cropland Tree-covered areas 8 543 1 1 2 1 1 2 - 1 3
Grassland 11 890 2 3 2 1 5 2 2 - 6
Wetland 304 1 1 3 1 1 1 - - -
Artificial surfaces 11 833 7 2 4 - 9 - 2 - 3
Other land 3 569 2 - 2 1 1 - - - 2
Total 36 140 13 7 13 4 17 5 4 1 14
Wetland Tree-covered areas 1 429 - - 1 - - - - - 1
Cropland 195 - - 1 - - - - - 1
Artificial surfaces 93 1 1 1 - 1 - - - -
Other land 180 - 1 1 - 1 - - - -
Total 1 897 1 2 4 - 2 - - - 2
Artificial
surfaces
Tree-covered areas 61 - 1 - - - 1 - - -
Total 61 - 1 - - - 1 - - -

ICC
D/C
RIC
(17
)/2
4
5
Other land Tree-covered areas 35 - - - - - 1 - - -
Grassland 27 637 - - - - - - - - 2
Cropland 215 1 - - - 1 - - - -
Wetland 7 - - - - - - - - -
Artificial surfaces 4 578 1 - 1 - 2 - - - 1
Other land 2 314 - - - - - - - - -
Total 34 787 2 - 1 - 3 1 - - 3
Total 491 645 72 45 53 16 70 21 13 2 43

ICCD/CRIC(17)/2
46
Table 21
Changes in global soil organic carbon with changing land cover between 2000 and
2015
Initial class Final class
Net area change
(km2)
Change in
stock (t/ha)
Percent
change
Tree-covered areas Grassland 171 065 -9.1 -15.2
Cropland 267 585 -15.8 -18.1
Wetland 4 764 12.3 13.2
Artificial surfaces 5 556 -12.6 -19.1
Other land 31 301 -63.3 -60.2
Grassland Tree-covered areas 1 011 521 1.5 1.8
Cropland 159 853 -10.1 -23.0
Wetland 378 853 -0.1 -0.1
Artificial surfaces 7 098 -7.3 -12.6
Other land 88 787 -31.6 -49.7
Cropland Tree-covered areas 43 764 -19.1 -30.6
Grassland 56 367 -0.1 -0.3
Wetland 3 076 22.5 31.1
Artificial surfaces 41 166 -16.5 -26.3
Other land 126 324 -17.5 -29.4
Wetland Tree-covered areas 2 448 -24.9 -28.3
Grassland 5 651 -8.9 -9.0
Cropland 2 309 -21.7 -20.0
Artificial surfaces 243 -34.2 -60.0
Other land 391 -57.4 -78.8
Artificial surfaces Tree-covered areas 120 44.8 99.6
Grassland 632 26.4 93.9
Cropland 2 310 36.8 174.5
Wetland 83 56.9 395.7
Other land 33 -12.1 -27.8
Other land Tree-covered areas 24 986 68.4 168.7
Grassland 12 771 34.5 63.0
Cropland 294 073 20.6 51.6
Wetland 558 52.2 97.9
Artificial surfaces 1 614 -11.1 -20.1

ICC
D/C
RIC
(17
)/2
4
7
B. Carbon stocks figures
Figure 12
Reported, unreported and no data for Soil Organic Carbon indicator for the reporting period where at least one land cover class was reported

ICCD/CRIC(17)/2
48
Figure 13
Data sources used in reporting for soil organic carbon stocks
Notes: LAC = Latin America and the Caribbean; NMED = Northern Mediterranean; CEE = Central and Eastern
Europe
Figure 14
Average t/ha soil organic carbon for reported lands between 2000 and 2015, where no
change in land cover has been reported
Notes: LAC = Latin America and the Caribbean; NMED = Northern Mediterranean; CEE = Central
and Eastern Europe

ICCD/CRIC(17)/2
49
Figure 15
Hotspot/Brightspot for all regions for soil organic carbon fluctuation summarized as
occurrences (counts, left) and area (km2 right)
Notes: LAC = Latin America and the Caribbean; NMED = Northern Mediterranean; CEE = Central and Eastern
Europe
V. Additional nationally relevant indicators tables
Table 22
Number of countries which have reported additional indicators relevant to strategic
objective 1 and total number of additional indicators
Regions
Number of countries having additional
indicators for strategic objective 1
Number of additional indicators for
strategic objective 1
Africa 16 38
Asia 11 31
LAC 9 15
NMED 3 4
CEE 4 11
Global 43 99
Notes: LAC = Latin America and the Caribbean; NMED = Northern Mediterranean; CEE = Central
and Eastern Europe

ICCD/CRIC(17)/2
50
VI. Proportion of degraded land tables and figures
A. Proportion of degraded land tables
Table 23
Method used to compute the proportion of land that is degraded over total land area
Region Number of indicators used One-out, All-out
approach
III indicators used plus One-out, All-out
approach to determining degradation III II I
Africa 37 2 3 40 35
Asia 21 5 3 21 18
LAC 22 - 1 20 20
NMED 6 - 1 6 6
CEE 6 - 3 6 5
Global 92 7 11 93 84
Notes: LAC = Latin America and the Caribbean; NMED = Northern Mediterranean; CEE = Central and Eastern
Europe
Table 24
Area (km2) and proportion (%) of land that is degraded over total land area across
reporting countries with a qualitative indication of the country’s confidence level in
the estimate where available.
Reporting
nation
Total area
degraded land
(km2 1000s)
Percent
degraded
land (%) Confidence
Reporting
nation
Total area
degraded
land
(1000s km2)
Percent
degraded
land (%) Confidence
Afghanistan 54.7 8.5 - Latvia 8.3 12.8 Low
Albania 2.2 7.9 Medium Lesotho 6.0 19.9 Low
Algeria 18.5 0.8 Low Liberia 28.0 29.8 Medium
Angola 250.9 20.1 Medium Madagascar 178.0 33.0 Medium
Antigua and Barbuda 0.0 8.6 High Malawi 16.4 17.6 Medium
Argentina 1 055.5 38.5 Medium Malaysia 52.6 16.2 High
Armenia 0.5 1.7 Medium Maldives - - -
Austria - - - Mali 40.0 6.8 High
Bangladesh 89.8 65.0 Medium Mauritania 30.0 2.9 Medium
Belarus 1.5 0.7 Medium Mauritius 0.5 32.6 Medium
Belgium 3.3 10.9 - Mexico 925.1 47.1 High
Belize 17.3 81.4 - Mongolia 206.0 13.3 Medium
Benin 60.4 52.9 High Montenegro 0.9 6.4 Medium
Bhutan 3.7 9.9 Medium Morocco 134.5 18.9 Low
Bolivia (Plurinational
State of) 192.5 18.0 Medium
Myanmar 153.2 23.3 Low
Bosnia and
Herzegovina 2.0 3.9 Low
Namibia 156.7 19.2 Medium
Brazil 2 217.4 26.4 Low Nauru 0.0 62.3 Low
Burkina Faso 51.6 18.8 Medium Niger 89.4 7.1 Medium

ICCD/CRIC(17)/2
51
Reporting
nation
Total area
degraded land
(km2 1000s)
Percent
degraded
land (%) Confidence
Reporting
nation
Total area
degraded
land
(1000s km2)
Percent
degraded
land (%) Confidence
Burundi 7.3 28.9 Medium Nigeria 283.7 31.5 High
Cabo Verde 0.7 17.0 High Oman 22.5 7.3 Low
Cambodia 77.0 43.0 Low Pakistan 37.4 4.8 Low
Cameroon 0.9 0.0 Medium Palau 0.1 26.2 Low
Central African
Republic 81.5 13.2 High
Panama 10.3 13.9 Low
Chad 428.0 33.5 High Papua New
Guinea 93.9 20.7 Medium
Chile 7.0 1.0 - Paraguay 204.2 51.7 Low
China 2 611.6 27.2 High Peru - - -
Colombia 80.7 7.2 Low Philippines 111.3 37.0 Medium
Comoros 0.4 23.0 High Poland 16.5 5.4 Medium
Congo 32.8 9.6 High Portugal 29.1 32.2 High
Cook Islands 0.0 30.3 Low Qatar 0.7 6.2 -
Costa Rica 4.7 9.3 Medium Republic of
Korea - - -
Côte d'Ivoire 46.5 14.5 Medium Republic of
Moldova 9.6 29.1 Medium
Cyprus 1.8 19.3 High Romania 5.0 2.0 Medium
Czechia 4.6 5.9 - Russian
Federation 1 001.0 26.3 Medium
Democratic Republic
of the Congo 133.9 5.8 Low
Rwanda 3.0 12.4 Medium
Dominica 0.0 0.2 Low Saint Kitts and
Nevis 0.1 41.2 Low
Dominican Republic 23.1 48.5 Medium Saint Lucia 0.0 3.6 Medium
Ecuador 72.1 28.6 Low Samoa - - Low
Egypt 10.9 1.1 Medium Sao Tome and
Principe 0.0 0.0 Low
El Salvador 3.2 15.7 Medium Saudi Arabia 83.5 4.0 High
Equatorial Guinea 5.4 20.6 Low Senegal - - -
Eritrea 42.5 35.2 Medium Serbia 5.7 6.5 Low
Ethiopia 326.9 29.2 Medium Seychelles 0.1 12.4 Medium
Fiji 12.0 70.1 Low Sierra Leone 12.8 17.9 Medium
France 67.4 12.4 - Slovakia 2.1 4.3 -
Gabon 41.8 16.2 High Slovenia 1.1 5.4 -
Gambia 1.6 13.8 Medium Somalia 147.7 23.4 Low
Georgia 4.1 5.9 Low South Africa 944.1 30.7 High
Ghana 31.9 13.8 Medium Spain 91.3 18.2 Low
Grenada 0.1 31.8 High Sri Lanka 22.9 35.7 Low
Guatemala 26.3 24.1 High State of
Palestine 0.9 14.9 Medium
Guinea 26.2 10.9 Medium Sudan 220.6 12.0 Medium
Guinea-Bissau 0.1 24.0 Low Suriname 32.2 19.7 High
Guyana 32.3 16.4 Medium Swaziland 2.2 13.1 Medium
Haiti 8.6 32.9 Medium Switzerland - - -
Honduras - - - Tajikistan 138.9 13.1 Medium
Hungary 11.8 12.9 Low Thailand 1.0 0.2 Medium
India 964.0 29.3 High Togo 6.5 11.5 High

ICCD/CRIC(17)/2
52
Reporting
nation
Total area
degraded land
(km2 1000s)
Percent
degraded
land (%) Confidence
Reporting
nation
Total area
degraded
land
(1000s km2)
Percent
degraded
land (%) Confidence
Indonesia 404.2 21.7 - Tunisia 19.5 12.6 Medium
Iran (Islamic Republic
of) 371.6 22.9 Medium
Turkey 71.1 9.3 Medium
Iraq 114.5 26.0 Medium Uganda 44.4 21.7 Medium
Israel - 0.0 Low Ukraine 148.1 0.3 Medium
Italy 39.7 13.4 Low United Arab
Emirates 0.7 1.0 High
Jamaica 10.0 11.3 Medium Uruguay 45.8 26.4 Medium
Jordan 3.2 3.7 Low Uzbekistan 127.1 28.6 Medium
Kazakhstan 964.5 36.9 Medium
Venezuela
(Bolivarian
Republic of)
131.7 14.6 Medium
Kuwait 11.3 72.0 High Zambia 55.1 7.5 High
Kyrgyzstan 46.6 24.3 Medium Zimbabwe 140.7 36.5 Medium
Lao People's
Democratic Republic - - -
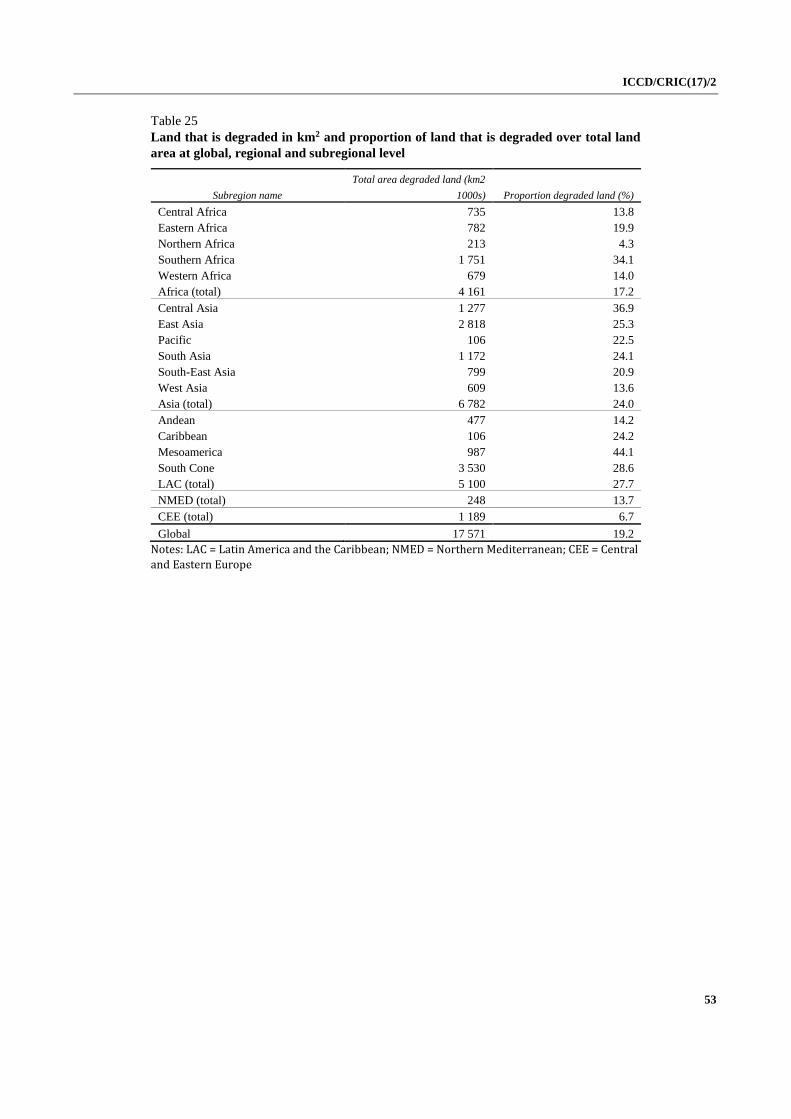
ICCD/CRIC(17)/2
53
Table 25
Land that is degraded in km2 and proportion of land that is degraded over total land
area at global, regional and subregional level
Subregion name
Total area degraded land (km2
1000s) Proportion degraded land (%)
Central Africa 735 13.8
Eastern Africa 782 19.9
Northern Africa 213 4.3
Southern Africa 1 751 34.1
Western Africa 679 14.0
Africa (total) 4 161 17.2
Central Asia 1 277 36.9
East Asia 2 818 25.3
Pacific 106 22.5
South Asia 1 172 24.1
South-East Asia 799 20.9
West Asia 609 13.6
Asia (total) 6 782 24.0
Andean 477 14.2
Caribbean 106 24.2
Mesoamerica 987 44.1
South Cone 3 530 28.6
LAC (total) 5 100 27.7
NMED (total) 248 13.7
CEE (total) 1 189 6.7
Global 17 571 19.2
Notes: LAC = Latin America and the Caribbean; NMED = Northern Mediterranean; CEE = Central
and Eastern Europe

ICC
D/C
RIC
(17
)/2
54
B. Proportion of degraded land figures
Figure 16
Proportion of degraded land relative to the total land area (i.e. SDG indicator 15.3.1) as reported from all methods

ICCD/CRIC(17)/2
55
VII. Voluntary targets tables
Table 26
Number of countries which have set voluntary LDN targets or are planning to do so,
and total number of LDN targets by level of application
Regions
Number of
countries
having set
LDN targets
Number of
countries planning
to set LDN targets
Number of LDN targets
National
level
Sub-
national
level
Specific
targets
No level of
application
Total
number of
LDN
targets
Africa 39 7 120 28 70 7 225
Asia 20 11 76 8 16 - 100
LAC 13 11 56 11 9 2 78
NMED 2 4 18 - - - 18
CEE 8 3 17 5 3 - 25
Global 82 36 287 52 98 9 446
Notes: LAC = Latin America and the Caribbean; NMED = Northern Mediterranean; CEE = Central and Eastern
Europe
Table 27
Number of countries which have set other voluntary targets relevant to strategic
objective 1 and total number of targets by level of application
Regions
Number of countries
having set other targets
related to strategic
objective 1
Number of other targets related to strategic objective 1
National
level
Sub-
national
level
No level of
application
Total number of
targets
Africa 27 72 9 0 81
Asia 15 33 - 2 35
LAC 13 26 5 - 31
NMED 3 1 1 1 3
CEE 9 15 1 2 18
Global 68 148 16 5 169
Notes: LAC = Latin America and the Caribbean; NMED = Northern Mediterranean; CEE = Central
and Eastern Europe