Coefficient Of Drag Vs Reynolds Number – Clean Wing and...
35
REVOLUTIONARY AERODYNAMICS Sumon K. Sinha, Ph.D., P.E, SINHATECH, Oxford, Mississippi www.sinhatech.com [email protected]
Transcript of Coefficient Of Drag Vs Reynolds Number – Clean Wing and...

REVOLUTIONARY AERODYNAMICS
Sumon K. Sinha, Ph.D., P.E,
SINHATECH, Oxford, Mississippi

TRADITIONAL AERODYNAMICS for Maximizing L/D
Maintain Laminar FlowAvoid Boundary Layer SeparationMaintain Elliptical Spanwise Lift Distribution

MOTIVATIONHighest L/D is for Sailplanes (70 for AR of 33 with flaps, 48 for AR of 22 without flaps)L/D Restricted by Limits of Laminar FlowCan we do better than Laminar Flow?
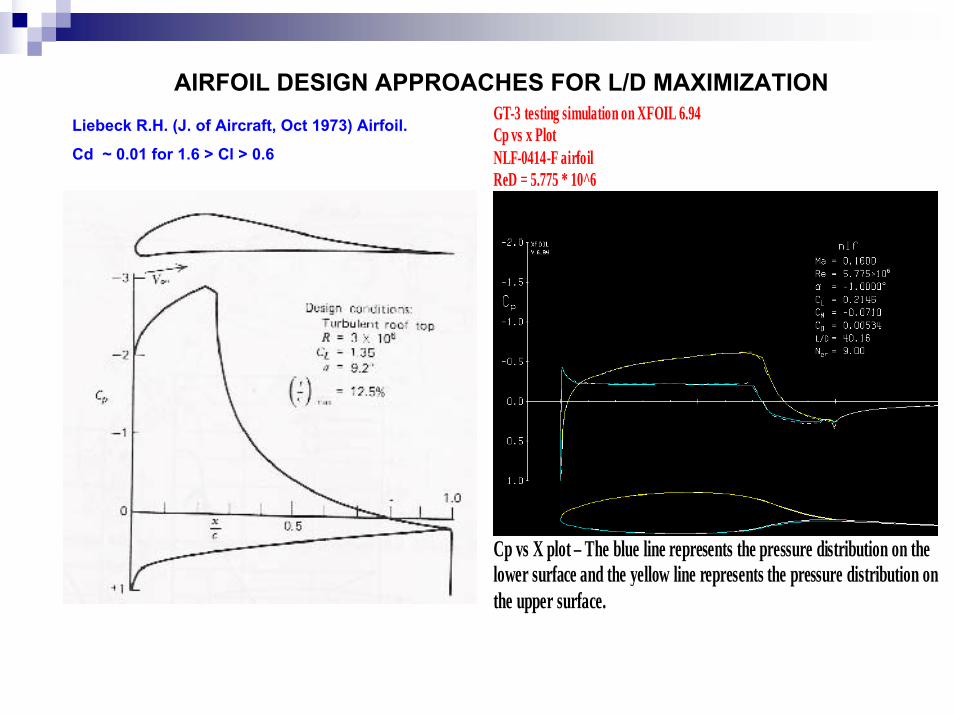
AIRFOIL DESIGN APPROACHES FOR L/D MAXIMIZATIONGT-3 testing simulation on XFOIL 6.94Cp vs x Plot NLF-0414-F airfoil ReD = 5.775 * 10^6
Cp vs X plot – The blue line represents the pressure distribution on the lower surface and the yellow line represents the pressure distribution on the upper surface.
Liebeck R.H. (J. of Aircraft, Oct 1973) Airfoil.
Cd ~ 0.01 for 1.6 > Cl > 0.6

L/D Increase using Flow Control The turbulent skin friction drag reduction by the use of Riblets(δCD/CD of about 1-2% flat-plate)
The hybrid laminar flow technology (δCD/CD of about 6 - 10% flat plate);
The innovative wing-tip devices(δCD/CD of about 5 - 8% flight);
The sub-layers vortex generators and MEMS technology which can be used to control flow separation.Deturbulator Flow Controlreduces parasitic & induced drag (δCD/CD as much as 30% for Total Aircraft) REVOLUTIONARY!
Shapes of riblet films
Source:http://aerodyn.org/Drag/riblets
Wing-tip DevicesSource:J.Reneaux., “Overview on drag reduction
technologies for civil transport aircrafts” European Congress on Computational Methods in Applied Sciences
and Engineering, ECCOMAS 2004.

The Sinha-Deturbulator Approach
Modified Boundary Layer (Thickness Exaggerated)
DeturbulatorModified Velocity Profile
Unmodified Velocity Profile
SLIP LAYER: Deturbulator Stabilized Viscous
Sub-layer with slow Reversed Flow negates Skin Friction Drag and Speeds up Freestream Flow
Airfoil

SINHA FLEXIBLE COMPOSITE SURFACE DETURBULATOR (FCSD)
Membrane Tension
50-100µmS
Boundary Layer Flow
Flexible Membrane ∼ 6µm thick
Substrate Base glued to aerodynamic surface
High Strips or Ridges
Low Strips as needed to fix flexural damping
Fundamental Flexural Vibration Mode of MembraneShown (Amplitude < 0.1 µm)
10-50µm thick Air-Gap (Membrane Substrate)
Wing or other aerodynamic body

FLOW-FCSD INTERACTION
∂ p/ ∂ x < 0
∂ p/ ∂ x ≅ 0
∂p/∂x > 0
Free stream ∂ U/ ∂ t ≈ v( ∂ u/ ∂ y) y=0
SINHA - FCS (Membrane Oscillation velocity v)
Separation point
Separated Shear Layer (Oscillates due to fluctuations)
Flow of pressure fluctuations
BEST INTERACTION where ∂p/∂x = 0
• FCSD passes oscillation without damping at the Interactionfrequency :
f = U/sAttenuates other frequencies
•This stabilizes the shear layerand mitigates turbulent dissipation
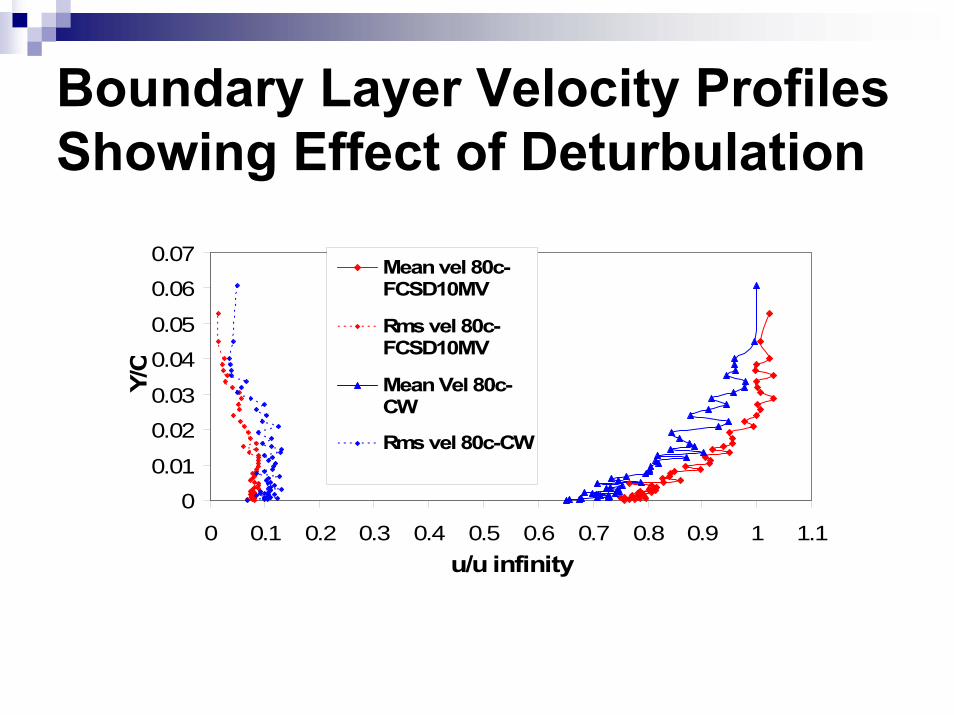
Boundary Layer Velocity Profiles Showing Effect of Deturbulation
0
0.01
0.02
0.03
0.04
0.05
0.06
0.07
0 0.1 0.2 0.3 0.4 0.5 0.6 0.7 0.8 0.9 1 1.1u/u infinity
Y/C
Mean vel 80c-FCSD10MV
Rms vel 80c-FCSD10MV
Mean Vel 80c-CW
Rms vel 80c-CW

Development HistoryPreliminary Drag Reduction Studies jointly with Global Aircraft 1999-2000 on GT-3 Aircraft based on Electrically actuated Active Flexible Wall Transducer (Invented in 1993, Sinha, 1999 Patent)Passive Flexible Composite Surface Deturbulator observed in 2001 (Pending Patents, Sinha 2003, 2004, 2005). Subsequent 15-20% wing profile drag reduction on NLF-0414F on GT-3 (NASA Sponsored project with Advanced Technologies, 2004).
Sailplane Drag Reduction (2002-Present): 5-30%enhancement of total Lift/Drag over a wide range of airspeeds for the Standard Cirrus 15-m span Sailplane.

Previous Research On Active Flexible Wall (AFW Transducer)
FCSD concept evolved out of an earlier electrically powered AFW (Sinha, 1999).
Mylar stretched across the high and low electrode.
Air gap between Mylar and electrode provide the mechanical damping.
DC bias applied across membrane
Flow-membrane interaction produces an AC signal
AC signal decomposed into fundamental flow-membrane frequencies
Membrane actuated at those aforementioned frequencies
2.25KHz
Schematic of the Active Flexible Wall (AFW) Transducer
Spectrum of AFW sensed signals on a cylinder showing the 2.25 kHz interaction
Interaction Frequency

MODIFICATION OF TURBULENCE
BY FLEXIBLE SURFACESPECTRA OF
STREAMWISE VELOCITY FLUCTUATIONS
With (top) and Without(bottom) Flexible-Surface Interaction for Separated Flow over a Cylinder in Crossflow for Re = 150,000, M = 0.05 at θ = 90º from stagnation (From: Sinha and Wang, 1999, AIAA Paper 99-0923)
INTERACTION FREQUENCY f = U/s
With Interaction
Without Interaction

TESTS ON NLF 0414F WING
AFW or FCSD
BL-Mouse
Global GT-3 Trainer
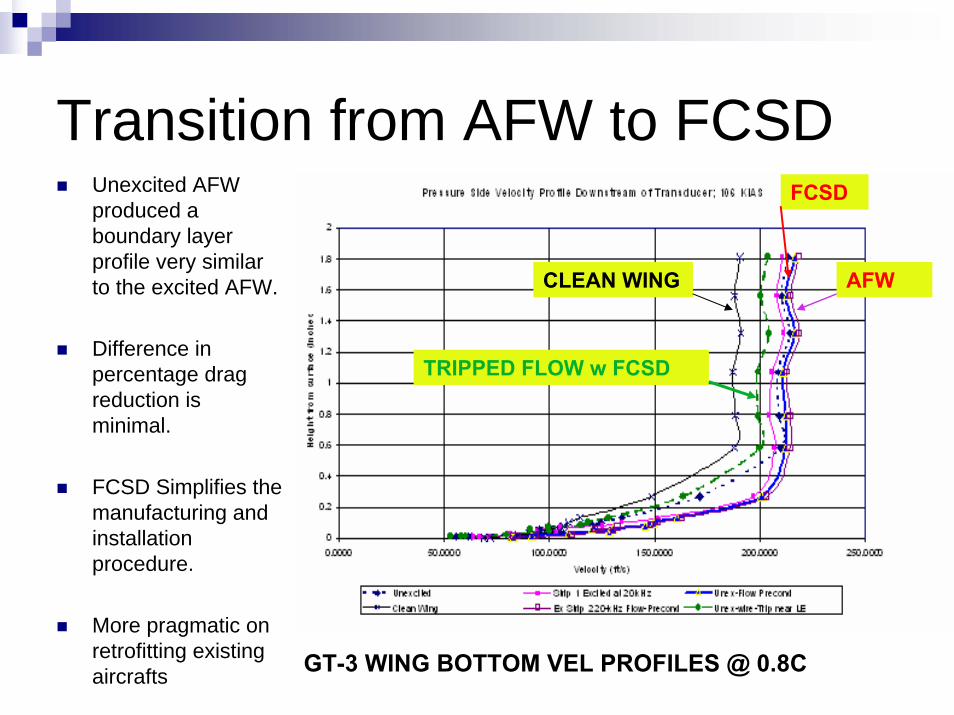
Transition from AFW to FCSDUnexcited AFW produced a boundary layer profile very similar to the excited AFW.
Difference in percentage drag reduction is minimal.
FCSD Simplifies the manufacturing and installation procedure.
More pragmatic on retrofitting existing aircrafts
CLEAN WING
TRIPPED FLOW w FCSD
AFW
FCSD
GT-3 WING BOTTOM VEL PROFILES @ 0.8C

Comparision of coefficient of Total drag Vs ReD-GT-3- Clean Wing and FCSD Final
0.003
0.004
0.005
0.006
0.007
0.008
5000000 5100000 5200000 5300000 5400000 5500000 5600000 5700000 5800000 5900000
ReD
Cd
-25
-20
-15
-10
-5
0
ReD
% C
hang
e In
Dra
g R
educ
tion
Cd-Total-CW
Cd-Total-FCSD-Final
% change in drag (total)

Boundary Layer MeasurementBL Probe 0.90c, Upper Surface, , WS115, Global GT-3
109 KIAS, Palt 2000 ft, 88 F
0.0
0.0
0.0
0.0
0.0
0.0
0.0
0.0
0.0 0.2 0.4 0.6 0.8 1.0 1.2 1.4
u/Uinfinity
Y/C
Average 109 KIAS-Clean WingAvg 109 KIAS FCSD/FPC

DETURBULATOR CLOSE UP & SURFACE OIL FLOW PATTERNS
LSB TRANSITION ATTACHED TURBULENT FLOW
FCSD MODIFIED SLIP LAYER
CLOSE UP OF FCSD

TESTS ON STANDARD CIRRUS SAILPLANE TO IMPROVE L/D
Drag Pressure Sensors
Gross Weight: 728 lbs
Best L/D: 36 @ 52-kts
Wing Loading: 6.8 lb/ft2 Aspect Ratio: 22.5

STANDARD CIRRUS LOWER SURFACE DRAG REDUCTION
Fig. 7. Drag-probe pressure sensor output (proportional to upstream stagnation pressure minus wake stagnation pressure). A reduction in output indicates drag reduction resulting from FCSD applications (1FCSD and 2FCSD) on wing bottom at the given location. % change (reduction) scale is on the right

Sinhatech Low-Speed Wind-Tunnel
Sinhatech Slow-Speed Wind-Tunnel
Experimental set-up showing the pressure transducers and manometer

Airfoils Tested in the Wind-Tunnel
Close up of tunnel test section showing NLF-0414F airfoil being tested
Stereo-lithography used to develop the Wortmann FX-S-02-196 Airfoil

XFOIL SIMULATION OF STANDARD CIRRUS 53”-SPAN WORTMANN AIRFOIL

Pressure distribution on 2nd. Wind-Tunnel model of 53-Inch Span Section of Standard Cirrus Wing (New FCSD installion on Suction Side Only)-11/20/04
-2
-1.5
-1
-0.5
0
0.5
1
0 10 20 30 40 50 60 70 80 90 100X/C ( percentage of chord)
Cp
Clean Wing Suct Side Press-11/19/04
Suction Side Pr dist w new FCSD-11/20/04
Pressure Dist Pressure Side
CL change 0.25 to 0.62
CD change from 0.014 to 0.007
L/D change 17 to 89

SKIN FRICTION REDUCTIONSuction Surface Cf Distribution Wortmann 53 inch Std Cirrus
Airfoil (Re 300,000 in Sinhatech Wind Tunnel)
-0.1
-0.05
0
0.05
0.1
0.15
0.2
0 20 40 60 80 100 120
Position on Chord (X/C) %
Cf
(Tau
-wal
l/(R
ho-U
inf
2̂
Cf-Clean Wing Measured Cf-FCSD

Drag Reduction on a Standard Cirrus Sailplane (Wing Top)
Standard Cirrus - 53" Station Average of Two Flights
0.4
0.6
0.8
1.0
1.2
1.4
40 45 50 55 60 65 70 75 80 85 90Calibrated airspeed (kts)
Diff
eren
tial P
ress
ure
(Vol
ts)
0510152025303540
Perc
ent C
hang
e
CleanAverage of 12/3 & 12/12%Change
Standard Cirrus - 167" Station Average of Two Flights
0.4
0.6
0.8
1.0
1.2
1.4
1.6
1.8
2.0
40 50 60 70 80 90Calibrated Airspeed (kts)
Diff
eren
tial P
ress
ure
(Vol
ts)
0
5
10
15
20
25
30
35
40
Perc
ent C
hang
e
CleanAverage of 12/3 & 12/12%Change
Standard Cirrus - Upper Surface 53" Station - 10/30/2004
0.4
0.5
0.6
0.7
0.8
0.9
1.0
1.1
1.2
1.3
1.4
40 45 50 55 60 65 70 75 80 85 90Calibrated Airspeed (kts)
Diff
eren
tial P
ress
ure
(Vol
ts) Clean FCSD
Modified FCSD
Original FCSDAileron Station
Mid pt. between Root & Air Brake

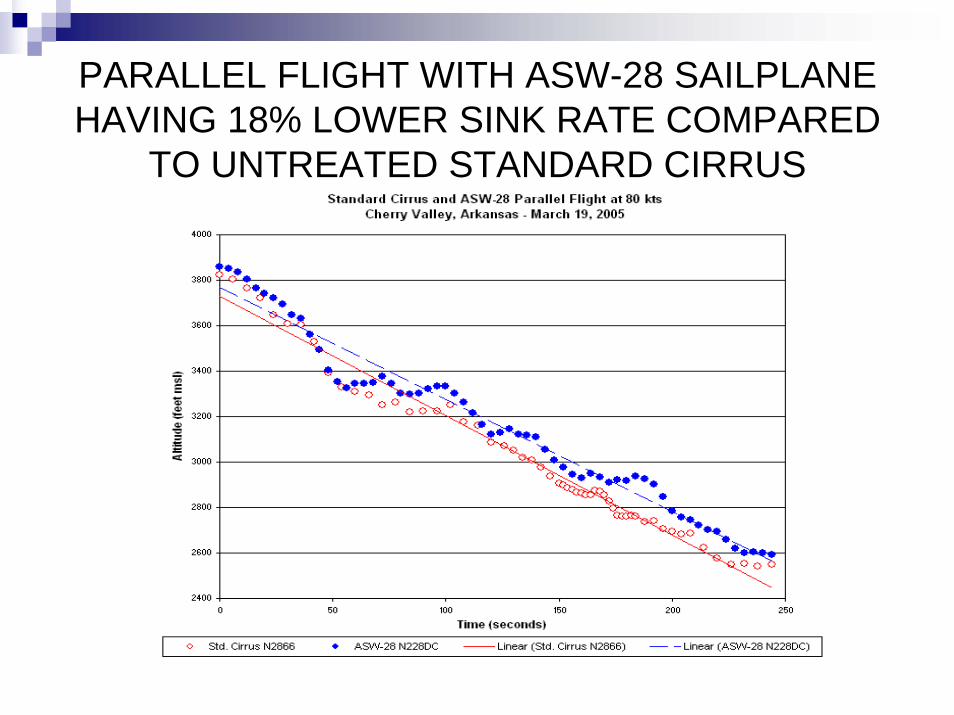
PARALLEL FLIGHT WITH ASW-28 SAILPLANE HAVING 18% LOWER SINK RATE COMPARED
TO UNTREATED STANDARD CIRRUS

Std. Cirrus #60 2/26/05 L/D Averaged vs Baseline (2nd test: top Inboard 14' of each wing fully deturbulated)
10
15
20
25
30
35
40
45
40 50 60 70 80 90 100Airspeed (kts)
L/D
.
-10
0
10
20
30
40
50
60
Perc
ent I
ncre
as
Avg 2/26/05 Baseline % Change Poly. (Baseline)

Induced Drag Vs Airspeed on a Standard Cirrus sailplane - CW and FCSD - 03/01/05
0
0.005
0.01
0.015
0.02
0.025
0.03
0 10 20 30 40 50 60Airspeed (m/s)
CD
i
Clean WingFCSD 60% FCSD full span

Sink Rates with Modified Full Span FCSD Treatment
Std. Cirrus #60 Polar Average of 10/12/05 & 10/8/05
0
100
200
300
400
500
600
700
800
40 50 60 70 80 90 100 110Airspeed (kts)
Sink
Rate (fp
m
Baseline Average 10/12 & 10/8 Poly. (Baseline)

L/D Improvement with Modified Full Span FCSD Treatment
Std. Cirrus #60 L/D Average of 10/12/05 & 10/8/05
0
5
10
15
20
25
30
35
40
45
40 50 60 70 80 90 100 110
Airspeed (kts)
L/D
-10
0
10
20
30
40
50
60
70
80
Percen
t Cha
ng
Average 10/12 & 10/8 Baseline % Chg Poly. (Baseline)

SUMMARY OF REVOLUTIONARYFCSD AERODYNAMICS
FCSD Reduces Turbulence Creates “Slip Layer”Reduces Skin Friction Increases LiftReduces Induced and Parasitic Drag Across Speed Range.Increased Best Sailplane L/D by 7-11%Max Sailplane L/D increase 30%Max Section L/D increase (Low-Re) ~ 400%

OTHER Important ISSUES
ConsistencyRobustnessIntegration with Wing at the Design stage

ACKNOWLEDGEMENTS
National Science FoundationNASA Oxford Aero EquipmentGlobal Aircraft Mr. Robert WilliamsMr. Sundeep Ravande

QUESTIONS ?