Co-digestion of Theobroma cacao (Cocoa) pod husk and ...
13
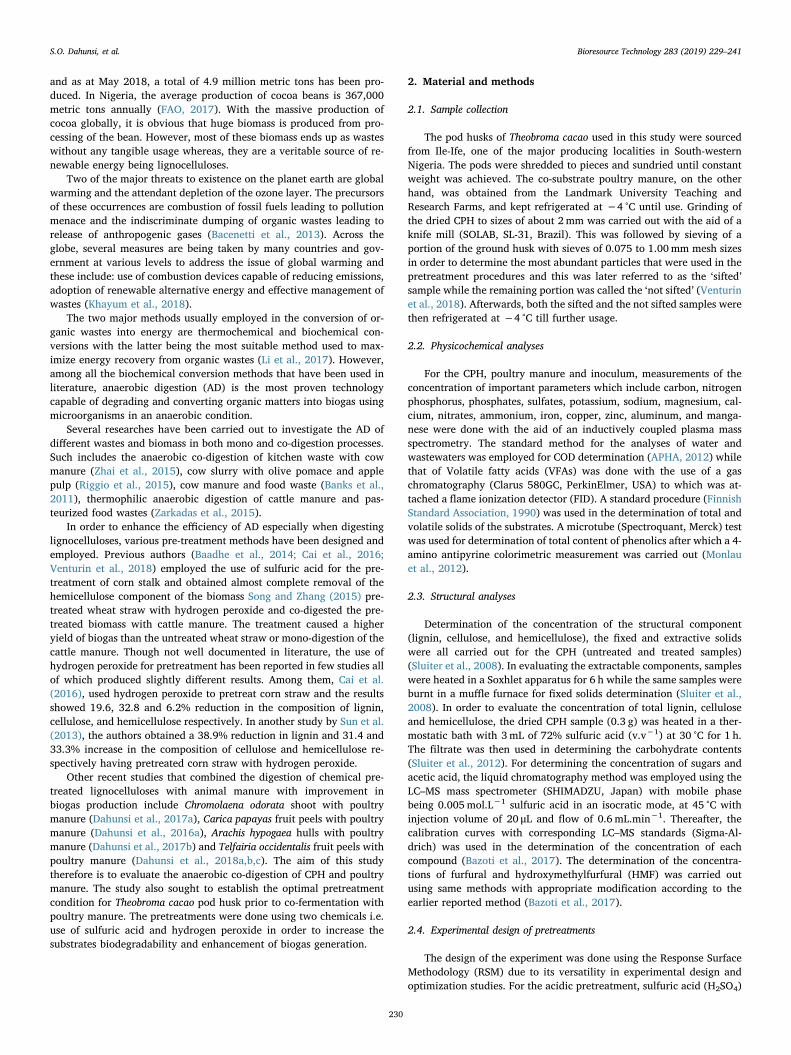
Contents lists available at ScienceDirect Bioresource Technology journal homepage: www.elsevier.com/locate/biortech Co-digestion of Theobroma cacao (Cocoa) pod husk and poultry manure for energy generation: Effects of pretreatment methods S.O. Dahunsi a,b, ⁎ , C.O. Osueke c , T.M.A. Olayanju d , A.I. Lawal e a Department for Management of Science and Technology Development, Ton Duc Thang University, Ho Chi Minh City, Viet Nam b Faculty of Environment and Labour Safety, Ton Duc Thang University, Ho Chi Minh City, Viet Nam c Department of Mechanical Engineering, Landmark University, Nigeria d Department of Agricultural and Biosystems Engineering, Landmark University, Nigeria e Department of Accounting and Finance, Landmark University, Nigeria GRAPHICAL ABSTRACT ARTICLE INFO Keywords: Anaerobic digestion Biogas Biomass Economics Energy Lignocelluloses ABSTRACT In this study, biogas was produced from the anaerobic co-digestion of Cocoa pod husk (CPH) and poultry manure. Pretreatment of the CPH was carried out using sulfuric acid and hydrogen peroxide. The physico- chemical, elemental and structural analyses were carried out on the CPH before and after pretreatment. The microbial composition of the fermenting materials were also determined using standard method while the Fourier Transform Infra-red (FTIR) spectroscopy was used to identify the structural changes that took place after pretreatments. Use of alkaline hydrogen peroxide caused high solubilization of the lignin component of the CPH and reduced up to 81% of lignin i.e. initial value of 21.7% m.m -1 to final value of 4.2% m.m -1 . Similarly, the alkali reduced the hemicellulose content of the CPH from 27.0% m.m -1 to 8.5% m.m -1 . Overall, there was 68% increase in biogas volume from the alkaline pretreated CPH. 1. Introduction Cocoa (Theobroma cacao) is primarily and largely cultivated in three tropical regions i.e. Latin America, Southeast Asia and West Africa in which up to 70 percent of global production is from four West African countries (Ivory Coast, Ghana, Nigeria, and Cameroon) (Kaufman and Justeson, 2006; Davison and Howe, 2015). The ten leading world producers are Cote d‘Ivoire, Ghana, Indonesia, Nigeria, Cameroon, Brazil, Ecuador, Mexico, Peru and Dominican Republic (FAO, 2017). Ivory Coast and Ghana are by far the two largest producers of cocoa accounting for more than 50 percent of global production in which the former alone produced approximately 1.6 million metric tons of cocoa beans which increased to 1.9 million metric tons during the 2016/2017 crop year. Global production in 2017 was over 4.6 million metric tons https://doi.org/10.1016/j.biortech.2019.03.093 Received 3 February 2019; Received in revised form 16 March 2019; Accepted 18 March 2019 ⁎ Corresponding author at: Department for Management of Science and Technology Development, Ton Duc Thang University, Ho Chi Minh City, Viet Nam. E-mail address: [email protected] (S.O. Dahunsi). Bioresource Technology 283 (2019) 229–241 Available online 19 March 2019 0960-8524/ © 2019 Elsevier Ltd. All rights reserved. T
Transcript of Co-digestion of Theobroma cacao (Cocoa) pod husk and ...

Contents lists available at ScienceDirect
Bioresource Technology
journal homepage: www.elsevier.com/locate/biortech
Co-digestion of Theobroma cacao (Cocoa) pod husk and poultry manure forenergy generation: Effects of pretreatment methods
S.O. Dahunsia,b,⁎, C.O. Osuekec, T.M.A. Olayanjud, A.I. Lawale
a Department for Management of Science and Technology Development, Ton Duc Thang University, Ho Chi Minh City, Viet Namb Faculty of Environment and Labour Safety, Ton Duc Thang University, Ho Chi Minh City, Viet Namc Department of Mechanical Engineering, Landmark University, NigeriadDepartment of Agricultural and Biosystems Engineering, Landmark University, Nigeriae Department of Accounting and Finance, Landmark University, Nigeria
G R A P H I C A L A B S T R A C T
A R T I C L E I N F O
Keywords:Anaerobic digestionBiogasBiomassEconomicsEnergyLignocelluloses
A B S T R A C T
In this study, biogas was produced from the anaerobic co-digestion of Cocoa pod husk (CPH) and poultrymanure. Pretreatment of the CPH was carried out using sulfuric acid and hydrogen peroxide. The physico-chemical, elemental and structural analyses were carried out on the CPH before and after pretreatment. Themicrobial composition of the fermenting materials were also determined using standard method while theFourier Transform Infra-red (FTIR) spectroscopy was used to identify the structural changes that took place afterpretreatments. Use of alkaline hydrogen peroxide caused high solubilization of the lignin component of the CPHand reduced up to 81% of lignin i.e. initial value of 21.7% m.m−1 to final value of 4.2% m.m−1. Similarly, thealkali reduced the hemicellulose content of the CPH from 27.0% m.m−1 to 8.5% m.m−1. Overall, there was 68%increase in biogas volume from the alkaline pretreated CPH.
1. Introduction
Cocoa (Theobroma cacao) is primarily and largely cultivated in threetropical regions i.e. Latin America, Southeast Asia and West Africa inwhich up to 70 percent of global production is from four West Africancountries (Ivory Coast, Ghana, Nigeria, and Cameroon) (Kaufman andJusteson, 2006; Davison and Howe, 2015). The ten leading world
producers are Cote d‘Ivoire, Ghana, Indonesia, Nigeria, Cameroon,Brazil, Ecuador, Mexico, Peru and Dominican Republic (FAO, 2017).Ivory Coast and Ghana are by far the two largest producers of cocoaaccounting for more than 50 percent of global production in which theformer alone produced approximately 1.6 million metric tons of cocoabeans which increased to 1.9 million metric tons during the 2016/2017crop year. Global production in 2017 was over 4.6 million metric tons
https://doi.org/10.1016/j.biortech.2019.03.093Received 3 February 2019; Received in revised form 16 March 2019; Accepted 18 March 2019
⁎ Corresponding author at: Department for Management of Science and Technology Development, Ton Duc Thang University, Ho Chi Minh City, Viet Nam.E-mail address: [email protected] (S.O. Dahunsi).
Bioresource Technology 283 (2019) 229–241
Available online 19 March 20190960-8524/ © 2019 Elsevier Ltd. All rights reserved.
T
and as at May 2018, a total of 4.9 million metric tons has been pro-duced. In Nigeria, the average production of cocoa beans is 367,000metric tons annually (FAO, 2017). With the massive production ofcocoa globally, it is obvious that huge biomass is produced from pro-cessing of the bean. However, most of these biomass ends up as wasteswithout any tangible usage whereas, they are a veritable source of re-newable energy being lignocelluloses.
Two of the major threats to existence on the planet earth are globalwarming and the attendant depletion of the ozone layer. The precursorsof these occurrences are combustion of fossil fuels leading to pollutionmenace and the indiscriminate dumping of organic wastes leading torelease of anthropogenic gases (Bacenetti et al., 2013). Across theglobe, several measures are being taken by many countries and gov-ernment at various levels to address the issue of global warming andthese include: use of combustion devices capable of reducing emissions,adoption of renewable alternative energy and effective management ofwastes (Khayum et al., 2018).
The two major methods usually employed in the conversion of or-ganic wastes into energy are thermochemical and biochemical con-versions with the latter being the most suitable method used to max-imize energy recovery from organic wastes (Li et al., 2017). However,among all the biochemical conversion methods that have been used inliterature, anaerobic digestion (AD) is the most proven technologycapable of degrading and converting organic matters into biogas usingmicroorganisms in an anaerobic condition.
Several researches have been carried out to investigate the AD ofdifferent wastes and biomass in both mono and co-digestion processes.Such includes the anaerobic co-digestion of kitchen waste with cowmanure (Zhai et al., 2015), cow slurry with olive pomace and applepulp (Riggio et al., 2015), cow manure and food waste (Banks et al.,2011), thermophilic anaerobic digestion of cattle manure and pas-teurized food wastes (Zarkadas et al., 2015).
In order to enhance the efficiency of AD especially when digestinglignocelluloses, various pre-treatment methods have been designed andemployed. Previous authors (Baadhe et al., 2014; Cai et al., 2016;Venturin et al., 2018) employed the use of sulfuric acid for the pre-treatment of corn stalk and obtained almost complete removal of thehemicellulose component of the biomass Song and Zhang (2015) pre-treated wheat straw with hydrogen peroxide and co-digested the pre-treated biomass with cattle manure. The treatment caused a higheryield of biogas than the untreated wheat straw or mono-digestion of thecattle manure. Though not well documented in literature, the use ofhydrogen peroxide for pretreatment has been reported in few studies allof which produced slightly different results. Among them, Cai et al.(2016), used hydrogen peroxide to pretreat corn straw and the resultsshowed 19.6, 32.8 and 6.2% reduction in the composition of lignin,cellulose, and hemicellulose respectively. In another study by Sun et al.(2013), the authors obtained a 38.9% reduction in lignin and 31.4 and33.3% increase in the composition of cellulose and hemicellulose re-spectively having pretreated corn straw with hydrogen peroxide.
Other recent studies that combined the digestion of chemical pre-treated lignocelluloses with animal manure with improvement inbiogas production include Chromolaena odorata shoot with poultrymanure (Dahunsi et al., 2017a), Carica papayas fruit peels with poultrymanure (Dahunsi et al., 2016a), Arachis hypogaea hulls with poultrymanure (Dahunsi et al., 2017b) and Telfairia occidentalis fruit peels withpoultry manure (Dahunsi et al., 2018a,b,c). The aim of this studytherefore is to evaluate the anaerobic co-digestion of CPH and poultrymanure. The study also sought to establish the optimal pretreatmentcondition for Theobroma cacao pod husk prior to co-fermentation withpoultry manure. The pretreatments were done using two chemicals i.e.use of sulfuric acid and hydrogen peroxide in order to increase thesubstrates biodegradability and enhancement of biogas generation.
2. Material and methods
2.1. Sample collection
The pod husks of Theobroma cacao used in this study were sourcedfrom Ile-Ife, one of the major producing localities in South-westernNigeria. The pods were shredded to pieces and sundried until constantweight was achieved. The co-substrate poultry manure, on the otherhand, was obtained from the Landmark University Teaching andResearch Farms, and kept refrigerated at −4 °C until use. Grinding ofthe dried CPH to sizes of about 2mm was carried out with the aid of aknife mill (SOLAB, SL-31, Brazil). This was followed by sieving of aportion of the ground husk with sieves of 0.075 to 1.00mm mesh sizesin order to determine the most abundant particles that were used in thepretreatment procedures and this was later referred to as the ‘sifted’sample while the remaining portion was called the ‘not sifted’ (Venturinet al., 2018). Afterwards, both the sifted and the not sifted samples werethen refrigerated at −4 °C till further usage.
2.2. Physicochemical analyses
For the CPH, poultry manure and inoculum, measurements of theconcentration of important parameters which include carbon, nitrogenphosphorus, phosphates, sulfates, potassium, sodium, magnesium, cal-cium, nitrates, ammonium, iron, copper, zinc, aluminum, and manga-nese were done with the aid of an inductively coupled plasma massspectrometry. The standard method for the analyses of water andwastewaters was employed for COD determination (APHA, 2012) whilethat of Volatile fatty acids (VFAs) was done with the use of a gaschromatography (Clarus 580GC, PerkinElmer, USA) to which was at-tached a flame ionization detector (FID). A standard procedure (FinnishStandard Association, 1990) was used in the determination of total andvolatile solids of the substrates. A microtube (Spectroquant, Merck) testwas used for determination of total content of phenolics after which a 4-amino antipyrine colorimetric measurement was carried out (Monlauet al., 2012).
2.3. Structural analyses
Determination of the concentration of the structural component(lignin, cellulose, and hemicellulose), the fixed and extractive solidswere all carried out for the CPH (untreated and treated samples)(Sluiter et al., 2008). In evaluating the extractable components, sampleswere heated in a Soxhlet apparatus for 6 h while the same samples wereburnt in a muffle furnace for fixed solids determination (Sluiter et al.,2008). In order to evaluate the concentration of total lignin, celluloseand hemicellulose, the dried CPH sample (0.3 g) was heated in a ther-mostatic bath with 3mL of 72% sulfuric acid (v.v−1) at 30 °C for 1 h.The filtrate was then used in determining the carbohydrate contents(Sluiter et al., 2012). For determining the concentration of sugars andacetic acid, the liquid chromatography method was employed using theLC–MS mass spectrometer (SHIMADZU, Japan) with mobile phasebeing 0.005mol.L−1 sulfuric acid in an isocratic mode, at 45 °C withinjection volume of 20 μL and flow of 0.6mL.min−1. Thereafter, thecalibration curves with corresponding LC–MS standards (Sigma-Al-drich) was used in the determination of the concentration of eachcompound (Bazoti et al., 2017). The determination of the concentra-tions of furfural and hydroxymethylfurfural (HMF) was carried outusing same methods with appropriate modification according to theearlier reported method (Bazoti et al., 2017).
2.4. Experimental design of pretreatments
The design of the experiment was done using the Response SurfaceMethodology (RSM) due to its versatility in experimental design andoptimization studies. For the acidic pretreatment, sulfuric acid (H2SO4)
S.O. Dahunsi, et al. Bioresource Technology 283 (2019) 229–241
230
was used in humid steam in an autoclave with the input variablesExposure time (min), Temperature (°C), H2SO4 concentration (%) andDry mass (g). in the same way, the alkaline pretreatment was carriedout with hydrogen peroxide (H2O2) with variables: Exposure time(min), Temperature (°C), Agitation (rpm), H2O2 concentration (%) andDry mass (g). In both designs, the evaluated responses were the residualor percentage lignin, cellulose and hemicellulose composition in m.m−1
in the pretreated CPH. All the experimental runs generated by the de-signs with their corresponding variables were tested in anaerobic di-gestions experiments in order to determine the optimum values for eachpretreatment.
2.5. Pretreatment with H2SO4
This was carried out in the presence of sulfuric acid using the humidsteam of an autoclave. Four important variables were evaluated inorder to optimize the acidic pretreatment and they are as follow: ex-posure time of 5, 15, 25, 35 and 45min), autoclave temperature of 80,90, 100, 110 and 120 °C), H2SO4 concentration of 0, 0.5, 1, 1.5 and 2%(v.v−1), and dry mass of 2, 4, 6, 8 and 10 g which were all experi-mented as a modification to earlier methods (Baadhe et al., 2014;Venturin et al., 2018).
2.6. Pretreatment with H2O2
The alkaline pretreatment procedure was carried out with hydrogenperoxide using an orbital shaker. As done for the acidic treatment,values were chosen based on the modification of earlier methods andconsidering the biomass in question (Rabelo et al., 2011; Venturinet al., 2018). In doing this, exposure time of 50, 60, 70, 80 and 90minwere considered while the rest were orbital shaker temperature of 30,38, 46, 54 and 62 °C, agitation of 130, 140, 150, 160 and 170 rpm, drymass of 1.5, 3, 4.5, 6 and 7.5 g and H2O2 concentration of 3, 6, 9, 12and 15% (v.v−1). An antifoam agent was added so as to reducefoaming.
2.7. Determination of functional groups
The functional groups present in the pretreated CPH which is anindication of the chemical changes that have taken place as a result ofthe pretreatment application as well as the functional groups in theuntreated CPH were determined using the IR tracer-100 FourierTransform infrared spectroscopy (FTIR) (SHIMADZU, Japan). Theprocedure of Zhao et al. (2018) was employed in doing this.
2.8. Biogas potential (BP) test
In order to quantify the maximum biogas that the substrates(CPH+poultry manure) could produce under constant temperature(37 °C) and pressure for a 30-day retention period, the Biogas potentialtest was carried out using 250mL capacity mini batch digesters con-nected to 500mL eudiometer tubes with 10% (m.v−1) volatile solidsfollowing standard procedures (Angelidaki et al., 2009). Activity testswere performed on acetate and cellulose in order to check the quality ofthe used inoculum which has a specific activity of 0.5 g CH4-COD/gVSS·d on acetate. Compliance was also done to the VDI 4630 (2006)standard while carrying out the test. The biogas yield was observed tobe increasing and stabilized when the daily yield of gas was less orequal to 1% of the total produced gas.
2.9. Anaerobic co-digestion
After the pretreatment regimes, both the pretreated and untreatedsamples of the CPH were anaerobically co-digested with poultrymanure which was based on the most suitable responses obtained fromthe experimental design of the pretreatments. The digestion was carried
out using the Computer controlled anaerobic digester (EDIBON). Thedigester is a paired system with two double jacketed anaerobic cham-bers with electronic sensors for regulating parameters such as waterflow, temperature, mixing rate, gas production etc. The inoculum whichmade up 10% of digesters total volume was obtained from a runningmesophilic digester treating cattle manure (Angelidaki et al., 2009).Produced biogas was collected in the water displacement trough at-tached to the digester while comparison was made between the resultsfrom the pretreated samples and the untreated (sifted and not sifted).Similarly, a comparison was made between the results of the untreatedsifted sample and the not sifted one so as to evaluate the effect of siftingas it relates to biogas yield. Biogas composition analysis was carried outby infrared and electrochemical sensors (BIOGASS5000, USA) majorlyto determine the values of CH4, CO2, and H2S.
2.10. Assessment of economic viability of pretreatments
There is a need to establish the economic viability of pretreatmentin order to justify the investment into the procurement of acid and al-kali besides the cost of obtaining energy used for the pretreatment. Indoing this, the balance between production and usage of energy wasdone by comparing the cost of obtaining heat energy and chemicalswith the extra energy that will be obtained from the additional biogasas a result of the applied pretreatments. The purpose was to evaluatethe possibility that the additional biogas obtained would suffice for thecost of heat energy and chemicals. The heat energy required (HER) forpretreating CPH was determined via Eq. (1):
=
∗ −m x Sh Tfinal TinitialHER
( )3600 (1)
where:m=mass substrate (1000 kg);Sh=specific heat of water i.e. 4.18 kJ kg−1 C−1
T= Temperature (°C)3600= the amount of calories produced by the biomassThe United States costs of hydrogen peroxide and sulfuric acid i.e.
USD 400 and 300 respectively was adopted.
2.11. Combustion/cooking test for produced gas
The cooking test was conducted in order to evaluate the combust-ibility of the biogas generated in all four experiments carried out in thisstudy using a biogas burner designed for the purpose. Two commodities(Water and rice) were boiled using the biogas while the time taken forboiling was documented which corresponds to the heating value andcombustibility of the biogas in each case (Alfa et al., 2013).
2.12. Analysis of microbial community
In order to analyze the microbial community, 45mL each was takenfrom all samples, co-substrates, and effluents on days 6, 12, 18, 24 and30 respectively and stored at −20 °C. The total DNA extraction from allsamples was carried out according to the method of Vilchez-Vargaset al. (2013) followed by conventional PCR in order to target the totalbacterial population using the total bacterial primers P338f and P518r(Boon et al., 2002). Agarose gel electrophoresis was thereafter used toevaluate the purity of the extracted DNA and PCR products which wasfollowed by Real-time PCR analysis using a StepOnePlus™ Real-TimePCR System (Applied Biosystems, Carlsbad, CA). The total bacterialpopulation was then analyzed (Desloover et al., 2015). The quality ofthe Real-time PCR products was checked by examining the differentparameters which were obtained with the StepOnePlus software V2.3.Analysis of each sample was done in triplicate and results were pre-sented as copies per gram of wet sludge.
S.O. Dahunsi, et al. Bioresource Technology 283 (2019) 229–241
231

2.13. Statistical analysis of data
A major component of the RSM is the central composite design(CCD) which has been proved to be effective in experimental designs.The CCD was employed in this study to evaluate the different pre-treatments. Afterward, the STATISTICA V. 12 software (StatSoft, Tulsa,USA) was employed in analyzing the different responses with a 95%(p < 0.05) confidence level while comparison of mean values wasdone using the Analysis of variance (ANOVA) and the Tukey’s test.
3. Results and discussion
3.1. Characterization of CPH husk before pretreatment
Various sizes ranging: 0.622, 0.401, 0.261, 0.109 and 0.073mmwere obtained from sieving of the ground untreated dried CPH and eachof these sizes was obtained from 28.1 ± 1.2, 51.6 ± 1.0, 13.1 ± 1.0,5.1 ± 1.2 and 2.1 ± 0.5% respectively from the total ground sample.The most abundant sample fraction was the 0.401mm and this wassubsequently used for the pretreatment procedures. As shown inTable 1, results of the structural analysis by chromatography showedthe contents of total lignin, cellulose, hemicellulose and fixed solids tobe 21.7 ± 0.01, 31.7 ± 0.10, 27.0 ± 0.10 and 3.7 ± 0.10% m.m−1
respectively for the untreated not sifted sample while for the untreatedsifted sample, the values were 19.2 ± 0.11, 29.2 ± 0.10,25.2 ± 0.01 and 3.8 ± 0.02% m.m−1 respectively.
Similarly, the composition of lignin, cellulose, hemicellulose, andfixed solids are very close to earlier results (Cai et al., 2016; Venturinet al., 2018) from the structural characterization of different part andwhole biomass of corn stalk. The two methods of pretreatment hadpositive effects on the CPH in terms of structural solubilization but atdifferent rates.
3.2. Elemental composition of CPH before pretreatment
As shown in Table 2, the CPH is rich in nutrients elements andminerals that are required for the growth and proliferation of micro-organisms in a fermentation medium. Of importance are values of im-portant elements like carbon, nitrogen, phosphorus, potassium, cal-cium, and magnesium which further reveal the husk as rich in nutrientsand elemental composition. Similarly, the CPH is moderately high insoluble sugars which can be utilized and converted to alcohols by mi-croorganisms during the subsequent anaerobic fermentation for thepurpose of biogas generation. This is similar to the submission of earlierresearches (Dahunsi et al., 2016a,b, 2017a,b,c).
3.3. Characterization of pretreated sifted CPH
3.3.1. Sulfuric acid pretreatmentUse of sulfuric acid caused enormous solubilization of the hemi-
cellulose component of the CPH. This solubilization was evident by thebreakage of all important chemical bonds (Hydrogen and covalent andVan der Waals forces) in the husk. Similarly, the hemicellulose com-ponent of the husk was depolymerized by the hydrolysis of xylose toform monosaccharides while the concentration of both lignin and cel-lulose after the pretreatment. This shows that the two components werenot affected by the acids but on the other hand were strengthened asevident in their increase
The optimal condition for the most efficient acidic pretreatment ofthe CPH was 2% (w/v) H2SO4, autoclave temperature of 121 °C and4.01 g dry mass for 60min. The outcome of this was reduction inhemicellulose content by 69% (from 27.0 ± 0.01 to 8.5 ± 0.01%m.m−1) while total lignin content increased by 24% (from 21.7 ± 0.01to 28.6 ± 0.20% m.m−1) while cellulose also increased by 35%(31.7 ± 0.10 to 49.0 ± 0.01% m.m−1). This result agrees with pre-vious studies (Baadhe et al., 2014; Cai et al., 2016; Venturin et al.,2018) where almost complete removal of hemicellulose was reportedwhen corn stalk was pretreated using acids. In this study, however,lesser volume of acid was used to achieve higher hemicellulose solu-bilization which is a major improvement in the current study. Acidictreatment was observed to also cause the increase in the composition ofboth total lignin and cellulose and this also agrees with the study by Caiet al. (2016) who achieved 87% increase in hemicellulose content ofcorn stalk while increasing the composition of lignin and cellulose by25% each after the application of acidic pretreatment. Other authorsobtained similar results after applying acidic pretreatment to differentbiomass. However, the important chemical groups found in lignin areusually associated with the 1734, 1716, 1633, and 1604 cm−, 1 bands.All these bands experienced reduction due to acidic pretreatment ap-plication. Though the composition of cellulose increased in this study, itwas obviously modified due to the exposure to factors like acid con-centration, temperature, and pressure similar to previous findings (Caiet al., 2016; Zhao et al., 2018).
The results obtained for the acidic pretreated biomass in this studystrongly agree with previous studies that reported structural composi-tion (lignin) increment characterized by pseudo-lignin formation due toacidic pretreatment coupled with extreme temperature and pressure(Cai et al., 2016). Such an increase in lignin ended up inhibiting the rateand final volume of biogas produced as seen in this study and maysometimes completely inhibit the entire anaerobic digestion process.
As reported in the literature, inhibition of the digestion process is
Table 1Characterization of CPH before and after pretreatments, poultry manure and inoculum.
Parameter Inoculum Poultry manure Cellulose Standard Pretreated CPH Untreated CPH
H2SO4 H2O2 Sifted Not Sifted
pH (Sample+ Inoculum) 7.79 ± 0.02 6.92 ± 0.01 7.85 ± 0.10 7.88 ± 0.11 7.90 ± 0.10 7.82 ± 0.10a 7.83 ± 0.10a
Total solids (% m.m−1) 4.2 ± 0.02 256.5 ± 9.02 95.1 ± 1.00 88.9 ± 0.11 90.4 ± 0.01 96.5 ± 1.02b 94.1 ± 0.02b
Volatile solids (% m.m−1) 3.0 ± 0.01 166.1 ± 7.05 85.3 ± 2.00 75.9 ± 2.01 52.5 ± 1.02 70.6 ± 2.01c 68.4 ± 0.01c
Total Lignin (% m.m−1) 29.5 ± 2.01 5.6 ± 0.01 ND 28.6 ± 0.20 4.2 ± 0.02 19.2 ± 0.11d 21.7 ± 0.01d
Cellulose (% m.m−1) 3.3 ± 0.01 3.2 ± 0.01 99 ± 1.01 49.0 ± 0.01 39.8 ± 1.01 29.2 ± 0.10 31.7 ± 0.10Hemicellulose (% m.m−1) 20.9 ± 0.01 1.8 ± 0.01 ND 8.5 ± 0.01 8.7 ± 0.11 25.2 ± 0.01 27.0 ± 0.10Fixed solids (% m.m−1) 1.4 ± 0.01 0.6 ± 0.01 0 ± 0.00 1.9 ± 0.01 1.1 ± 0.01 3.8 ± 0.02 3.7 ± 0.10Extractives (% m.m−1) ND 0.4 ± 0.01 ND ND ND 17.9 ± 0.01 16.8 ± 0.02Solids after pretreatment (% m.m−1) – – – 3.8 ± 0.00 2.4 ± 0.02 – –Added sample (g) 0 ± 0.00 0 ± 0.00 1 ± 0.10 2.4 ± 0.12 2.4 ± 0.12 2.4 ± 0.12 2.4 ± 0.12COD (g COD/g VS) 148.08 ± 1.10 229.9 ± 8.05 ND 212.32 ± 1.20 204.62 ± 0.10 206.72 ± 5.00 211.05 ± 0.10BP (LNbiogas. kg VSadd−1) 25.6 544.2 ± 8.09 617.4 ± 2.01 203.6 ± 2.10 633.2 ± 3.10 321.1 ± 3.10 382.4 ± 3.00µmax (LNbiogas. kg VSadd−1).d−1 ND 200.3 ± 4.02 154.0 ± 2.02 222.6 ± 0.01 275.5 ± 2.10 44.5 ± 0.10 52.2 ± 0.10Day of µmax ND 2–3 3–4 4–6 1–2 4–6 3–4
Values shown in table are means of triplicate analyses with respective standard errors; superscripts with same letters are statistically the same by the Tukey’s test at5%; ND=Not determined; BP=Biogas potential; µmax=maximum biogas generation rate.
S.O. Dahunsi, et al. Bioresource Technology 283 (2019) 229–241
232

Table2
Elem
entalco
mpo
sition
ofCPH
+po
ultryman
urean
dinoc
ulum
before
andafterpretreatmen
ts.
Parameter
Inoc
ulum
Poultryman
ure
H2SO
4Pretreated
CPH
H2O2Pretreated
CPH
Untreated
sifted
CPH
Untreated
notsifted
CPH
CPH
only
CPH
+po
ultryman
ure
CPH
only
CPH
+po
ultryman
ure
CPH
only
CPH
+po
ultryman
ure
CPH
only
CPH
+po
ultryman
ure
Ash
Con
tent
(%)
5.56
±1.02
19.56±
2.02
4.60
±0.01
20.34±
3.01
3.51
±1.00
19.06±
3.05
4.20
±0.01
18.04±
3.01
4.71
±0.00
17.38±
3.01
MoistureCon
tent
(%)
90.48±
3.02
68.94±
6.01
81.19±
3.01
71.47±
7.02
93.21±
1.05
88.91±
11.03
80.51±
1.01
76.56±
6.02
87.2
±0.02
72.47±
4.00
TotalCarbo
n(g/k
gTS
)26
5.21
±0.10
298.41
±9.01
635.09
±4.02
897.92
±12
.05
722.55
±5.21
922.64
±9.04
436.11
±2.05
598.41
±9.01
435.04
±1.23
594.18
±7.04
TotalNitroge
n(g/k
gTS
)48
.00±
2.02
61.12±
5.22
27.56±
0.22
44.17±
4.02
30.04±
0.25
41.68±
1.02
21.04±
0.02
35.25±
2.02
22.43±
1.20
31.20±
2.02
C/N
6/1
5/1
23/1
20/1
24/1
22/1
21/1
17/1
19/1
19/1
Acetate
(gCOD/g
VS)
1.04
±0.10
2.01
±1.01
0.09
±0.01
1.11
±0.01
0.10
±0.01
1.08
±0.01
0.04
±0.10
0.07
±0.01
0.04
±0.10
0.07
±0.01
Prop
iona
te(g
COD/g
VS)
1.07
±0.02
1.99
±0.02
0.11
±0.01
1.13
±0.01
0.12
±0.01
1.25
±0.05
0.07
±0.01
0.09
±0.01
0.10
±0.01
0.19
±0.01
TVFA
s(g
COD/g
VS)
2.44
±0.10
2.61
±1.01
1.19
±0.10
2.10
±0.01
1.12
±0.10
1.74
±0.02
0.11
±0.01
1.18
±0.02
1.02
±0.01
1.17
±1.00
Ammon
ia(m
g/gVS)
4.97
±1.01
17.12±
2.02
2.03
±0.10
14.25±
1.02
2.09
±0.03
15.02±
1.04
1.20
±0.01
11.00±
1.05
1.07
±0.10
12.01±
2.01
Uronicacids(%
VS)
1.67
±1.11
0.62
±0.01
2.56
±0.10
1.95
±0.05
2.08
±0.10
1.81
±0.02
1.61
±1.00
1.22
±0.01
1.01
±0.10
0.61
±0.01
@So
lublesuga
rs(%
VS)
4.02
±2.10
2.27
±1.00
6.01
±0.11
4.45
±0.05
7.35
±0.10
5.72
±1.10
3.04
±1.00
2.42
±0.03
3.17
±0.10
2.28
±1.00
Phen
ols(m
gL−
1)
4.71
±2.10
0.91
±0.01
0.00
5±
0.01
0.01
±0.01
0.00
3±
0.01
0.02
±0.01
0.00
1±
0.01
0.06
±0.01
0.00
1±
0.10
0.01
±0.01
TotalPh
osph
orus
(g/k
gTS
)6.30
±0.02
8.12
±1.05
4.64
±0.02
6.27
±0.03
5.58
±0.01
7.04
±1.03
3.00
±0.01
5.02
±1.02
3.37
±0.01
5.11
±1.02
Potassium
(g/k
gTS
)7.20
±0.11
9.27
±1.03
7.2±
0.11
9.01
±1.01
9.23
±0.01
9.17
±1.01
3.03
±0.01
5.29
±1.07
3.25
±0.01
4.73
±0.02
Phosph
ate(g/g
TS)
3.00
±0.02
2.85
±1.01
3.30
±0.11
2.77
±1.00
3.40
±0.10
2.88
±0.03
1.04
±0.01
2.52
±1.00
1.20
±0.20
1.55
±1.01
Sulpha
te(g/k
gTS
)13
4±
2.00
136.71
±9.02
100.00
±3.00
121.13
±6.01
111.10
±3.01
122.11
±4.00
54.00±
2.00
86.65±
4.00
61.04±
1.02
66.14±
3.02
Calcium
(g/k
gTS
)80
.00±
0.10
48.81±
3.05
523.50
±1.42
358.48
±6.03
584.03
±5.01
388.88
±8.15
333.7±
0.22
228.16
±7.03
361.30
±2.03
211.12
±5.01
Mag
nesium
(g/k
gTS
)96
.00±
0.10
125.11
±8.02
47.50±
1.02
97.41±
4.00
70.10±
1.40
95.82±
3.05
35.22±
0.02
75.82±
2.04
39.40±
1.10
75.51±
4.01
Man
gane
se(g/k
gTS
)1.18
±0.22
0.09
±0.01
0.01
4±
0.04
0.06
±0.01
0.02
0±
0.00
0.04
±0.01
0.00
9±
0.01
0.04
±0.02
0.01
0±
0.10
0.01
±0.01
Iron
(g/k
gTS
)1.18
±0.11
1.77
±0.03
1.72
±0.01
1.66
±0.01
1.43
±0.01
1.55
±0.02
0.40
±0.01
0.94
±0.01
0.46
±0.01
0.71
±0.01
Zinc
(g/k
gTS
)38
.00±
0.02
56.11±
7.01
34.30±
0.02
46.01±
2.01
42.04±
0.01
46.01±
2.01
14.40±
0.02
36.01±
2.01
18.20±
0.01
36.01±
2.01
Aluminium
(g/k
gTS
)0.80
±0.11
0.44
±1.02
1.27
±0.01
0.94
±0.01
1.43
±0.02
0.74
±1.02
0.15
±0.02
1.04
±1.01
0.20
±0.10
0.24
±1.00
Cop
per(g/k
gTS
)4.80
±0.10
5.67
±0.05
3.33
±0.11
4.43
±0.02
4.02
±0.10
4.71
±0.02
2.02
±0.10
3.36
±0.02
2.31
±0.10
3.07
±0.02
N=
120;
COD=
Che
mical
Oxy
genDem
and;
TVFA
s=To
talvo
latile
fattyacids;
C/N
=Carbo
n/Nitroge
nratio.
S.O. Dahunsi, et al. Bioresource Technology 283 (2019) 229–241
233

usually caused by different lignin derivatives paramount among whichare phenolic lignin, syringyl ring, and acetyl lignin. Phenolic lignin isnot easily degraded during digestion (Alfa et al., 2014). The very reasonlower volume of gas was produced from the acidic pretreated CPH asshown in this study was the preferential action of the acid causingchanges in the lignin structure. However, the action of the alkali was onthe entire lignin thereby causing enormous solubilization. For syringylring at the 1329 cm−1 band, there was an increase in its composition asa result of alkaline pretreatment over the untreated biomass (Sun et al.,2013; Alfa et al., 2014). For the composition of acetyl lignin at the1251 cm−1 band, both pretreatment procedures decreased its compo-sition with the alkali after a higher effect with 36.1% (Alfa et al., 2014).On the other hand, the acidic treatment decreased the peak intensity at1059 cm−1, an indication of hemicellulose breakdown (Sun et al.,2013). In the result of the analysis, both crystalline and the amorphouscellulose (1110 cm–1/897 cm−1) were present in the CPH as shown.After pretreatment, the ratio between the two cellulose types revealed17.2 and 48.2% decrease for acidic and alkaline respectively (Venturinet al., 2018).
Effect analysis with 95% confidence interval was used to evaluatethe composition of lignin, cellulose, and hemicellulose after pretreat-ment as the responses. Results of the analysis showed two of the fourvariables are significant. These are temperature and time of exposurewhich leads to the development of mathematical models so as tomaximize the cellulose while reducing the lignin and hemicellulosecontents in the pretreated CPH. Validation of the three derived modelswas carried out via analysis of variance (ANOVA) at 99.95% confidenceinterval. The contour curves of the mathematical models and their re-spective 3-D plots were constructed to show the lignin, cellulosic andhemicellulosic compositions as shown in Fig. 1. The models were shownto have good statistical abilities evident by their coefficient of de-termination (R2) values which are 0.9633, 0.9835 and 0.9771 forlignin, cellulose, and hemicellulose respectively.
3.3.2. Hydrogen peroxide pretreatmentAs seen in this study, the most efficient condition for the alkaline
pretreatment of the CPH was: 7.5% (w/v) H2O2, orbital shaker tem-perature of 30 °C, agitation at 130 rpm for 75min using 3 g dry mass ofthe ground CPH. With this condition, total lignin content was reducedby 71.34% (from initial 17.8 to 5.1% m.m−1), cellulose increased by39% (from initial 26.6 to 43.3% m.m−1) while hemicellulose decreasedby 61% (22.8 to 8.8% m.m−1). Contrary to the effects of acidic pre-treatment on the CPH, use of alkaline hydrogen peroxide caused thehigher lignin solubilization while that of hemicellulose was partial withan increase in the composition of cellulose.
The most visible effect of pretreatment was observed in the alkalinepretreated CPH in which enormous breaking of lignin bonds occurred.All the important bands/peaks associated with lignin i.e. 1734, 1716,1633, 1604 and 1516 cm−1 were completely flattened, ruptured andhave even disappeared in some cases after the alkaline pretreatmentthus causing enormous solubilization of lignin. This agrees with pre-vious studies on the use of different alkalis (H2O2, NaOH, and KOH) inbiomass pretreatment prior to anaerobic digestion process (Dahunsiet al., 2016a,b, 2017a).
Though not well documented, pretreatment with hydrogen peroxidehas been reported in few studies in which slightly different result wasobtained. Cai et al. (2016), used hydrogen peroxide to pretreat cornstraw and obtained 19.6, 32.8 and 6.2% reduction in the composition oflignin, cellulose, and hemicellulose respectively. Similarly, Sun et al.(2013) obtained a 38.9% reduction in lignin and 31.4 and 33.3% in-crease in the composition of cellulose and hemicellulose respectivelyafter pretreating corn straw with hydrogen peroxide.
Alkaline hydrogen peroxide treatment of CPH as seen in this studyenhanced the decrease in the lignin and cellulosic ratio by over 75%whereas there was an increase with acidic pretreatment using sulfuricacid. Among the five variables used in the statistical effect evaluationfor both lignin and hemicellulose compositions, only three (exposuretime, shaker temperature and H2O2 concentration) were significant onthe pretreated biomass with 95% confidence interval. Only one of them
LIGNIN CELLULOSE HEMICELLULOSE
00.5400.7300.9200.1200.3100.5
80.00
88.00
96.00
104.00
112.00
120.00Lignin
Exposure time (Min)
Te
mp
era
ture
(D
30
3540
40
45
50
Prediction 52.5757
00.5400.7300.9200.1200.3100.5
0.00
0.50
1.00
1.50
2.00Lignin
Exposure time (Min)
Ac
idC
on
ce
ntr
a
20
3040
50
Prediction 52.5757
Fig. 1. Contour plots for the optimization of acidic pretreatment for CPH.
S.O. Dahunsi, et al. Bioresource Technology 283 (2019) 229–241
234

Fig. 1. (continued)
Fig. 2. Contour plots for the optimization of alkaline pretreatment for CPH.
S.O. Dahunsi, et al. Bioresource Technology 283 (2019) 229–241
235

Fig. 2. (continued)
Fig. 2. (continued)
S.O. Dahunsi, et al. Bioresource Technology 283 (2019) 229–241
236

(H2O2 concentration) was however significant at 99.95% in order tomaximize the cellulose component (Fig. 2).
3.3.3. Assessment of untreated biomassThe comparison was done between both untreated samples of the
untreated CPH i.e. sifted and not sifted so as to evaluate the possibleeffect of sieving on the biomass using the Tukey test. The results re-vealed that the two samples were statistically insignificant in thecomposition which means that sieving brought about no significantdifference between the samples.
3.3.4. Structural changes in the CPH after pretreatmentsTable 3 shows the results of structural/molecular changes in the
CPH which was caused by the pretreatments as well as those of theuntreated biomass. The percentage relative variation was computedusing Eq. (2)
= ∗ −RV 100 (U P)/U (2)
where:RV=Relative variation (%)U=Absorbance of untreated CPHP=Absorbance of pretreated CPHAll the bands revealed by the FTIR spectra were between the 3348
and 2900 cm−1 indicating the presence of chemical bonds of cellulosic.At the end of hydrogen peroxide treatment, the cellulose content of thepod increased also causing an increase in absorbance to the tune of 20.8and 52.5% for both pretreated and untreated samples. An increase atthe 1373 cm−1 band was also observed. A different result was obtained
showing reduction of the cellulosic O–H bonds after the acidic pre-treatment and this further resulted in absorbance reduction in the3448 cm−1 band beside phenolic lignin decrease at the 1373 cm−1
peak.
3.4. Effect of anaerobic digestion on biomass structure
The anaerobic digestion process further conferred more structuralbreakdown to the CPH in terms of reduction in all three structuralcomponent i.e. lignin, cellulose and hemicellulose as well as the fixedsolids as evident in the digestates. There were 23, 40, 26 and 13%; 45,21, 26, 14%; 20, 14, 8 and 15% and 11, 18, 27 and 21% reductions inthe composition of lignin, cellulose, hemicellulose and fixed solids re-spectively after the anaerobic digestions involving the acidic pre-treated, alkaline pretreated, not sifted untreated and sifted untreatedCPH respectively. Similarly, the concentration of uronic acids was re-duced by 33.12, 41.11, 17 and 26% in the four experiments respectivelywhile those of soluble sugars increased by 37.4, 46.7, 22.1 and 26.3%for the four experiments. Most of the chemical parameters in the CPHwere also affected by the AD process in which increase in value wererecorded for these parameters due to enormous degradation that havetaken place as evident in the digestates. Only parameters such as ashcontent, moisture, carbon and calcium were not affected. There wasalso significant reduction in COD across all digestions by average valuesof 48.9, 60.19, 40.23 and 48.3% for the acidic pretreated, alkalinepretreated, not sifted untreated and sifted untreated CPH respectively.
Fig. 2. (continued)
Table 3Wave lengths that correspond to a given functional group and respond to infrared spectroscopy, and their respective relative values for H2SO4 and H2O2 pre-treatments tested for CPH.
Wavelength (cm−1) Assignment Untreated H2SO4 Pretreated H2O2 Pretreated
Absorbance/Ratio Absorbance/Ratio Variation (%) Absorbance/Ratio Variation (%)
3348 O–H stretch (Hydrogen cellulose connections bond) 0.3261 0.2516 22.8 0.4156 −27.42900 C–H stretch (Methyl/methylene cellulose group) 0.1134 0.1021 10.0 0.1653 −45.81734 Carbonyl bonds (Associated with removal of lignin side chain) 0.1024 0.1004 2.0 0.0192 81.31716 Carboxylic acids/ester groups 0.1141 0.0682 40.2 0.0665 41.71633 Aromatic ring stretch (Associated with lignin removal) 0.2015 0.0305 84.9 0.1012 49.81604 Aromatic ring stretch (Changes in lignin structure) 0.1931 0.1133 41.3 0.1057 45.31516 Generic lignin 0.1421 0.1191 16.2 0.0636 55.21516/897 Lignin/cellulose ratio 2.9 3.5 −20.7 0.7 75.91373 Phenolic O–H stretch (Changes in lignin structure) 0.2222 0.1423 36.0 0.1810 18.51319 Syringyl ring stretch (Changes in the lignin monomer) 0.2062 0.1128 45.3 0.1650 20.01251 C-O absorption (Result of acetyl-lignin groups cleavage) 0.1419 0.1405 1.0 0.1061 25.21110 Crystalline cellulose 0.4504 0.1452 67.8 0.2334 48.21059 C-O-C stretch (Cellulose and hemicellulose) 0.3752 0.2755 26.6 0.4720 −25.8897 Amorphous cellulose 0.1054 0.0429 35.7 0.0678 35.71110/897 Crystalline/amorphous cellulose ratio 9.0 6.8 24.4 4.7 47.8833 C–H flexion of syringyl 0.1208 0.0135 88.8 0.0110 90.9771 Crystalline cellulose (Iα) 0.0188 0.0115 38.8 0.0280 −48.9719 Crystalline cellulose (Iβ) 0.0344 0.0271 21.2 0.0372 −8.1771/719 Ratio of crystalline cellulose polymorphs (Iα/Iβ) 0.3 0.2 33.3 0.4 −33.3
ND=Not determined; All positive values indicates decrease.
S.O. Dahunsi, et al. Bioresource Technology 283 (2019) 229–241
237

3.5. Biogas potential (BP)
As shown in this study, the inoculum produced a minimal quantityof biogas which was less than 10% of total generation from all thepretreated and untreated substrates and was also lower than the po-tential of the microcrystalline cellulose used as a standard. Productionfrom the latter was higher by over 70% than the value obtained fromthe reference 650 LNbiogas.kg VSad−1 produced by following the VDIstandards 4630 (2006).
As shown in Fig. 3, biogas generation from the anaerobic co-di-gestion of the hydrogen peroxide-treated CPH+poultry manure washigh. On the other hand, the digestion of the sulfuric acid pretreatedbiomass+ poultry manure produced about 68% LNbiogas.kg VSad−1
lower biogas volume than the alkaline pretreated CPH+poultrymanure. The second highest in terms of gas generation was the un-treated not sifted sample+ poultry manure which was also followed bythe untreated sifted sample+ poultry manure while the acidic pre-treated sample+ poultry manure produced the least quantity of gas. Incomparison, the alkaline pretreated CPH+poultry manure producedmore biogas (52%) than the untreated samples. Using the ANOVA,there was a significant difference between the values obtained for thetwo untreated samples and to further confirm this, the post-hoc test wascarried out using Tukey’s test with F and p values of 0.69 and 0.0005respectively.
The overall volume of biogas produced from the four digestionsetups i.e acidic pretreated+poultry manure, alkaline pre-treated+ poultry manure, untreated sifted+poultry manure and notsifted sample+ poultry manure are 203.6 ± 5.1, 633.2 ± 6.2,321.1 ± 2.1 and 382.4 ± 2.3 respectively. The highest biogas gen-eration was obtained from the alkaline pretreated CPH+poultry
manure which was achieved 2 days before. The maximum biogas gen-eration rate was calculated using the equation below:
=
− −Maximum biogas generation rate((L kg VS ). d )
0.05m Total biogas
Nbiogas. ad1 1
3 (3)
The alkaline hydrogen peroxide-pretreated CPH+poultry manureproduced the highest volume of biogas as seen in this study and wasfollowed by the not sifted untreated sample+ poultry manure. Fig. 3shows a 58% more biogas produced by the alkaline pretreated sampleover the untreated one indicating the efficiency of treatment with thealkali. This corroborates the findings of Venturin et al. (2018) whoreported increased biogas yield after pretreatment with a low con-centration of hydrogen peroxide. The need for biomass pretreatmentprior to digestion for further justified in the rate values of maximumbiogas generation in LNbiogás.kg VSad −1.d−1 and the day the max-imum biogas yield was achieved (Mancini et al., 2018). The highest wasobtained from the alkaline treated experiment which reached the peakof production in 11 days. The difference in the time of cooking as ob-served for each commodity is due to the quality of produced biogas interms of methane content.
In all, gas production commenced on the 2nd experimental day andreached the peak on the 11th day out of the total of 30 day retentiontime thus indicating that though at a lower retention time as adopted inthis study, higher biogas generation was achieved. The composition ofthe biogas generated across the four different digestions showed me-thane to be within 63 ± 1.2 and 66 ± 2.1, carbon dioxide of between20 ± 1.2 and 28 ± 0.2 and hydrogen sulfide of between 4 ± 0.2 and7.3 ± 0.2.
3.6. Microbial composition, volatile fatty acids (VFAs) dynamics,Stoichiometry and mass balance
The molecular method of isolation and identification used in thisstudy helped to properly identified all the major microbial groupspresent in the inoculum, fermenting substrates and the effluents afterdigestion. Aerobes of the genera Bacillus dominated the aerobic or-ganisms in all samples with members such as Bacillus pantothenticus,Bacillus licheniformis and Bacillus stearothermophilus while other aerobesinclude Serratia ficaria and Proteus vulgaris. For the anaerobic group,members of the genera Clostridium were the dominant with membersincluding Clostridium clostridioforme, Clostridium histolytica andClostridium species while others are Fusobacterium mortiferum andPorphyromonas assacharolyticum. The identified methanogens includemembers of the genera Methanosarcinaceae, Methanobacteriales,Methanosaetaceae and Methanomicrobiales.
The diverse microorganisms and their population brought aboutrobust microbial activities in the digesters and one of the effects isVFA’s accumulation due to production of several intermediate acidscapable of causing inhibition to the digestion process. These VFAs ac-cumulation largely depend on the balance between their production
0
100
200
300
400
500
600
700
0 5 10 15 20 25 30
Biog
as (L
Nbi
ogas
.kg
SVad
−1)
Retention Time (Day)
Pretreatment with H2O2
Pretreatment with H2SO4
Untreated sifted
Untreated not sifted
Fig. 3. Daily biogas production per kilogram of added volatile solids for H2S2pretreated CPH+poultry manure, H2SO4 pretreated CPH+poultry manure,untreated sifted CPH+poultry manure and untreated not sifted CPH+poultrymanure.
Table 4Stoichiometry and mass balance for one ton of CPH.
Parameter H2SO4 Pretreated Cocoa pod+ Inoculum H2O2 Pretreated Cocoa pod+ Inoculum Untreated Cocoa pod+ Inoculum
InputCocoa pod+ Inoculum (kg) 1000 1000 1000Volatile solids (VS) (kg) 859 705 914OutputMethane (CH4) (%) 58.5 65.2 58.2Carbon dioxide (CO2) (%) 23.5 22.6 21.4Digestate (kg VS) 561 341 535Sum 643 428.8 614.6Mass balance* 0.25 0.39 0.33% Volatile solids (VS) removal 35 52 41
* Input–output)/input (%).
S.O. Dahunsi, et al. Bioresource Technology 283 (2019) 229–241
238

and consumption by the digester’s bacterial community. Two promi-nent VFAs were implicated in this study i.e. acetate and propionatewhose accumulation was very minimal from the commencement of theprocess through to the middle between the 13th 15th days when theirconcentrations were at the peak. This shows a gross imbalance betweenthe hydrolysis-acidogenesis and the acetogenesis-methanogenesiscombined stages of the digestions. This agrees with previous submis-sions. The high population of members of the genera Clostridia whichare facultative anaerobes brought about pronounced acetogenesis andmethanogenesis stages in the digesters. This group of organism breaksdown amino-acids into acetic and propionic acids with ammonia as theend-product.
In order to evaluate the volatile solids consumption/removal in allthe experiments, the mass balance was evaluated as shown in Table 4.These showed a high consumption of volatile solids as a result of thehigh microbial population and diversity which was more pronounced inthe alkaline pretreated biomass+ poultry manure.
3.7. Results of the cooking test
In the cooking test carried out to confirm the flammability/com-bustibility of the produced biogas, the gas produced from the alkalinepretreated sample showed higher combustibility/cooking rate than theone produced from the acidic pretreated biomass. The gas from thealkaline pretreated sample boiled both water and rice at 0.08 L/min and0.0039 kg/min respectively whereas the gas from the acidic pretreatedbiomass boiled the same commodities at lower cooking rates i.e. 0.14 L/min and 0.0045 kg/min respectively. These values were also higherthan those obtained when cooking was done with the biogas from theuntreated samples which recorded cooking rates of 0.16 L/min and0.0049 kg/min and 0.18 L/min and 0.0051 kg/min respectively.Considering the design of the used biogas stove, biogas flow rates of0.0057m3/min was obtained.
3.8. The composition of digestate after digestion
Analyses of the digestates from all the four digestions regimesshowed that the materials were rich in nutrients, elemental composi-tions, and microbial biomass. Of importance is the increase in the va-lues of all major and minor elements over their initial concentrationprior to anaerobic digestion. In terms of structural composition, therewas an increase in the lignin to cellulose-hemicellulose complex ratiowith values of 0.4–0.7, 0.2–1.4, 0.3–1.0 and 0.3–1.0 for the acidic
pretreated, alkaline pretreated, untreated sifted and untreated notsifted CPH respectively. The sulfuric acid pretreated sample had thelowest lignin to cellulose-hemicellulose complex ratio and equallyproduced the least volume of biogas.
As also seen in this study, the anaerobic co-digestion process hadprofound effects on the biodegradability of all the substrates used asfurther solubilization of the components of the pretreated CPH wascaused by the anaerobic digestion process. The value of most elementswas seen to have increased after the digestion except for carbon andcalcium which must have taken up by the digester’s microflora and usedfor metabolism and cell wall synthesis. This phenomenon is similar tothe results of some previous studies on the effect of fermentation onsubstrates digestibility (Dahunsi et al., 2016a,b, 2017c,d,e, 2018a,b,c,2019).
Analysis of the digestates from all experiments showed elevatedlevels of all major and minor elements and richness in the nutrient. Thisfurther shows that such digestate could be reused as biofertilizer toenhance soil fertility improvement and crop yield. However, there wasinefficiency in the utilization of the bulk carbohydrate content in thedigesters. This further corroborates the submission of Croce et al.(2016).
3.9. Energy and economic balance
The computation of the energy balance for this study was doneusing standard methods with the combined heat and power (CHP)system (Dahunsi et al., 2016a,b, 2017c,d,e) as shown in Table 5 whileheat loss was neglected (Dahunsi et al., 2016a,b, 2017c,d). For the al-kaline treated experiments, the 1223 kWh t−1 TS heat energy gainexceeded the 1055 kWh t−1 TS used in the pretreatment thus giving anet heat energy of 168 kWh t−1 TS. The possibility is there that this netenergy can be increased via the use of heat exchanger during the pre-treatment. Heat exchangers have been previously employed to increasethe recovery of thermal energy up to about 80% (Dahunsi et al., 2017e).Perhaps, full integration of heat energy is another prominent methodfor assessing the economic feasibility in this study as earlier reported(Dahunsi et al., 2016a,b, 2017d,e). For the acidic pretreated sample ofCPH, the investment into acid purchase, equipment usage and timeseemed fruitless because the−136 kWh t−1 TS heat energy gain was farbelow the 1436 kWh t−1 TS heat energy used in pretreatment with a netheat energy of −1300 kWh t−1 TS.
In electrical energy assessment, an account was only taken for theenergy consumed during substrate mixing while neglecting that used
Table 5Energy and economic evaluation for the digestion of CPH.
Energy parameters H2O2 pretreated H2SO4 pretreated Not Sifted (Untreated) Sifted (Untreated)
Produced electrical and heat energy from combined heat and power (CHP) 3315 1011 1298 1203Produced heat energy (kWh t−1 TS) 2236 877 1013 910Produced electrical energy (kWh t−1 TS) 1079 534 685 676
Heat balanceHeat energy gain (kWh t−1 TS)* 1223 −136 – –Heat energy requirement (kWh t−1 TS) 1055 1436 – –Heat energy requirement with 80% of heat recovery (kWh t−1 TS) 211 287 – –Net heat energy (kWh t−1 TS)# 168 −1300 – –Net heat energy with 80% of heat recovery (kWh t−1 TS) 134 −1040 – –
Electrical balanceElectrical energy gain$ 394 −252 – –Energy for mixing during pretreatment 218 −554 – –Net electrical energy 176 −806
Economic evaluationCost of H2O2 and H2SO4 (є t−1 TS)
* Difference of heat energies produced by the pretreated experiment minus the untreated.# Difference between the heat energy gain and the heat energy required for the pretreatment.$ Difference of electricity energy produced by pretreated experiment minus the untreated.
S.O. Dahunsi, et al. Bioresource Technology 283 (2019) 229–241
239

during mechanical grinding since the same grinding was done for allexperiments following earlier submissions (Dahunsi et al., 2017a,b,c,d).For the alkaline treated experiment, the net electrical energy of394 kWh t−1 TS far outweigh the −252 kWh t−1 TS obtained from theacidic pretreated CPH. This further confirms that alkaline pretreatmentis profitable as against the use of acids which on the other hand willlead to loss of time, energy and other investments. The net heat andelectrical energies obtained can be sold directly to consumers or in-jected into the energy grid adhering to existing environmental andgovernmental regulations.
4. Conclusions
Use of alkaline hydrogen peroxide as a pretreatment agent in thisstudy caused high solubilization of the lignin component of the CPHand reduced up to 81% of lignin. Similarly, the alkali reduced thehemicellulose content of the pod by approximately 69%. A majorachievement in this study is the upsurge in biogas volume from thealkaline pretreated CPH which was 68% higher than the acidic pre-treated biomass and 40% more than the untreated biomass. Furtherusage of hydrogen peroxide for biomass pretreatment is therefore ad-vocated in the pretreatment of CPH prior to anaerobic digestion.
Acknowledgments
The author appreciates the efforts of the technical staffs in theEnvironmental Engineering Laboratory of Landmark University, Omu-Aran, Nigeria.
Funding source
This research received funding from the Ton Duc Thang University,Ho Chi Minh City, Vietnam.
Conflict of interest
The author declares no conflict of interest whatsoever
Appendix A. Supplementary data
Supplementary data to this article can be found online at https://doi.org/10.1016/j.biortech.2019.03.093.
References
Alfa, I.M., Dahunsi, S.O., Iorhemen, O.T., Okafor, C.C., Ajayi, S.A., 2014. Comparativeevaluation of biogas production from poultry droppings, cow dung, and lemongrass.Bioresour. Technol. 157, 270–277.
Alfa, M.I., Adie, D.B., Iorhemen, O.T., Okafor, C.C., Ajayi, S.A., Dahunsi, S.O., Akali, D.M.,2013. Assessment of mesophilic co-digestion of cow dung with lemongrass for biogasproduction. Nig. J. Technol. 32 (3), 478–484.
Angelidaki, I., Alves, M., Bolzonella, D., Borzacconi, L., Campos, J.L., Guwy, A.J.,Kalyuzhnyi, S., Jenicek, P., Van Lier, J.B., 2009. Defining the biomethane potential(BMP) of solid organic wastes and energy crops: a proposed protocol for batch assays.Water Sci. Technol. 59 (5), 927–934.
APHA, 2012. Standard Methods for the Examination of Water and Wastewater. AmericanPublic Health Association, Washington, DC, USA.
Baadhe, R.R., Potumarthi, R., Mekala, N.K., 2014. Influence of dilute acid and alkalipretreatment on reducing sugar production from corncobs by crude enzymaticmethod: a comparative study. Bioresour. Technol. 162, 213–217.
Bacenetti, J., Negri, M., Fiala, M., Gonzalez-García, S., 2013. Anaerobic digestion ofdifferent feedstocks: impact on energetic and environmental balances of biogasprocess. Sci. Total Environ. 463, 541–551.
Banks, C.J., Salter, A.M., Heaven, S., Riley, K., 2011. Energetic and environmental ben-efits of co-digestion of food waste and cattle slurry: a preliminary assessment. Resour.Conserv. Recycl. 56 (1), 71–79.
Bazoti, S.F., Golunski, S., Pereira, S.D., Scapini, T., Barrilli, É.T., Alex, M.D., Barros, K.O.,Rosa, C.A., Stambuk, B.U., Alves, S.L., Valério, A., de Oliveira, D., Treichel, H., 2017.Second-generation ethanol from non-detoxified sugarcane hydrolysate by a rottingwood isolated yeast strain. Bioresour. Technol. 244, 582–587.
Boon, N., De Windt, W., Verstraete, W., Top, E.M., 2002. Evaluation of nested PCR-DGGE(denaturing gradient gel electrophoresis) with group-specific 16S rRNA primers for
the analysis of bacterial communities from different wastewater treatment plants.FEMS Microbiol. Ecol. 39, 101–112.
Cai, D., Li, P., Chen, C., Wang, Y., Hu, S., Cui, C., Qin, P., Tan, T., 2016. Effect of chemicalpretreatments on corn stalk bagasse as immobilizing carrier of Clostridium acet-obutylicum in the performance of a fermentation-pervaporation coupled system.Bioresour. Technol. 220, 68–75.
Croce, S., Wei, Q., Imporzano, G.D., Dong, R., Adani, F., 2016. Anaerobic digestion ofstraw and corn stover: the effect of biological process optimization and pretreatmenton total bio-methane yield and energy performance. Biotechnol. Adv. 34, 1289–1304.
Dahunsi, S.O., Oranusi, O., Efeovbokhan, V.E., 2017a. Anaerobic mono-digestion ofTithonia diversifolia (Wild Mexican sunflower). Energy Conv. Manage. 148, 128–145.
Dahunsi, S.O., Oranusi, O., Efeovbokhan, V.E., 2017b. Pretreatment optimization, Processcontrol, Mass and Energy balances and Economics of anaerobic co-digestion ofArachis hypogaea (Peanut) hull and poultry manure. Bioresour. Technol. 241,454–464.
Dahunsi, S.O., Oranusi, S., Efeovbokhan, V.E., 2017c. Bioconversion of Tithonia diversi-folia (Mexican Sunflower) and poultry droppings for energy generation: optimization,mass and energy balances, and economic benefits. Energy Fuels 31, 5145–5157.
Dahunsi, S.O., Oranusi, S., Efeovbokhan, V.E., 2017d. Cleaner energy for cleaner pro-duction: Modeling and optimization of biogas generation from Carica papayas(Pawpaw) fruit peels. J. Clean. Prod. 156, 19–29.
Dahunsi, S.O., Oranusi, S., Efeovbokhan, V.E., 2017e. Optimization of pretreatment,process performance, Mass and Energy balance in the anaerobic digestion of Arachishypogaea (Peanut) hull. Energy Conv. Manage. 139, 260–275.
Dahunsi, S.O., Oranusi, S., Owolabi, J.B., Efeovbokhan, V.E., 2016a. Comparative biogasgeneration from fruit peels of Fluted Pumpkin (Telfairia occidentalis) and its optimi-zation. Bioresour. Technol. 221, 517–525.
Dahunsi, S.O., Oranusi, S., Owolabi, J.B., Efeovbokhan, V.E., 2016b. Mesophilic anae-robic co-digestion of poultry droppings and Carica papaya peels: Modelling andprocess parameter optimization study. Bioresour. Technol. 216, 587–600.
Dahunsi, S.O., Olayanju, A., Izebere, J.O., Oluyori, A.P., 2018a. Data on Energy andEconomic evaluation and microbial assessment of anaerobic co-digestion of fruit rindof Telfairia occidentalis (Fluted Pumpkin) and Poultry Manure. Data Brief 21, 97–104.
Dahunsi, S.O., Oranusi, S., Efeovbokhan, V.E., Olayanju, A., Zahedi, S., Ojediran, J.O.,Izebere, J.O., Aladegboye, O.J., 2018b. Anaerobic conversion of Chromolaena odorata(Siam weed) to biogas. Energy Rep. 4, 691–700.
Dahunsi, S.O., Oranusi, S., Efeovbokhan, V.E., Zahedi, S., Ojediran, J.O., Olayanju, A.,Oluyori, A.P., Adekanye, T.A., Izebere, J.O., Enyinnaya, M., 2018c. Biochemicalconversion of fruit rind of Telfairia occidentalis (Fluted Pumpkin) and Poultry Manure.Energy Sources (Part A) Utiliz. Environ. Effects 40 (23), 2799–2811.
Dahunsi, S.O., Olayanju, A., Adesulu-Dahunsi, A.T., 2019. Data on Optimization of bio-conversion of fruit rind of Telfairia occidentalis (Fluted Pumpkin) and Poultry manurefor biogas generation. Chem. Data Collect. 20, 100192.
Davison, K., Howe, P.R., 2015. Potential implications of dose and diet for the effects ofcocoa flavanols on cardiometabolic function. J. Agric. Food Chem. 63 (45),9942–9947.
Desloover, J., De Vrieze, J., de Vijver, M.V., Mortelmans, J., Rozendal, R., Rabaey, K.,2015. Electrochemical nutrient recovery enables ammonia toxicity control and biogasdesulfurization in anaerobic digestion. Envion. Sci. Technol. 49, 948–955.
Finnish Standard Association SFS 3008. Determination of total residue and total fixedresidue in water, sludge, and sediment, 1990.
Food and Agriculture Organization of the United Nations Statistics Division, 2017.Kaufman, T., Justeson, J., 2006. History of the word for 'cacao' and related terms in
ancient Meso-America. In: McNeil, Cameron L. (Ed.), Chocolate in Mesoamerica: ACultural History of Cacao. University Press of Florida, pp. 121.
Khayum, N., Anbarasu, S., Murugan, S., 2018. Biogas potential from spent tea waste: alaboratory scale investigation of co-digestion with cow manure. Energy 165,760–768.
Li, Y., Jin, Y., Li, J., Li, H., Yu, Z., Nie, Y., 2017. Effects of thermal pretreatment ondegradation kinetics of organics during kitchen waste anaerobic digestion. Energy118, 377–386.
Mancini, G., Papirio, S., Riccardelli, G., Lens, P.N.L., Esposito, G., 2018. Trace elementsdosing and alkaline pretreatment in the anaerobic digestion of rice straw. Bioresour.Technol. 247, 897–903.
Monlau, F., Barakat, A., Steyer, J.P., Carrere, H., 2012. Comparison of seven types ofthermo-chemical pretreatment on the structural features and anaerobic digestion ofsunflower stalks. Bioresour. Technol. 120, 241–247.
Rabelo, S.C., Amezquita, F.N.A., Andrade, R.R., Maciel, F.R., Costa, A.C., 2011. Ethanolproduction from enzymatic hydrolysis of sugarcane bagasse pretreated with lime andalkaline hydrogen peroxide. Biom. Bioeng. 35, 2600–2607.
Riggio, V., Comino, E., Rosso, M., 2015. Energy production from anaerobic co-digestionprocessing of cow slurry, olive pomace, and apple pulp. Renew. Energy 83,1043–1049.
Sluiter, A., Hames, B., Ruiz, R., Scarlata, C., Sluiter, J., Templeton, D., Crocker, D., 2012.Determination of structural carbohydrates and lignin in biomass. Laboratory analy-tical procedures (LAP). Natl. Renew Energy Lab 1–18 Report No. TP-510-42618,2012.
Sluiter, A., Ruiz, R., Scarlata, C., Sluiter, J., Templeton, D., 2008. Determination ofExtractives in Biomass. Laboratory Analytical Procedures (LAP). Natl. Renew. EnergyLab 1–12 Report No. TP-510-42619.
Song, Z., Zhang, C., 2015. Anaerobic co-digestion of pretreated wheat straw with cattlemanure and analysis of the microbial community. Bioresour. Technol. 186, 128–135.
Sun, S.N., Li, M.F., Yuan, T.Q., Xu, F., Sun, R.C., 2013. Effect of ionic liquid/organicsolvent pretreatment on the enzymatic hydrolysis of corncob for bioethanol pro-duction. Part 1: Structural characterization of the lignins. Ind. Crops Prod. 43,570–577.
S.O. Dahunsi, et al. Bioresource Technology 283 (2019) 229–241
240

Venturin, B., Camargo, A.F., Scapini, T., Mulinari, J., Bonatto, C., Bazoti, S., Siqueira,D.P., Colla, L.M., Alves Jr., S.L., Bender, J.P., Steinmetz, R.L.R., Kunze, A., Fongaro, G.,Treichel, H., 2018. Effect of pretreatments on corn stalk chemical properties for biogasproduction purposes. Bioresour. Technol. 266, 116–124.Vilchez-Vargas, R., Geffers, R., Suarez-Diez, M., Conte, I., Waliczek, A., Kaser, V.S.,
Kralova, M., Junca, H., Pieper, D.H., 2013. Analysis of the microbial gene landscapeand transcriptome for aromatic pollutants and alkane degradation using a novel in-ternally calibrated microarray system. Environ. Microbiol. 15, 1016–1039.
Zarkadas, I.S., Sofikiti, A.S., Voudrias, E.A., Pilidis, G.A., 2015. Thermophilic anaerobicdigestion of pasteurized food wastes and dairy cattle manure in batch and large
volume laboratory digesters: focusing on mixing ratios. Renew. Energy 80, 432–440.Zhai, N., Zhang, T., Yin, D., Yang, G., Wang, X., Ren, G., Feng, Y., 2015. Effect of initial
pH on anaerobic co-digestion of kitchen waste and cow manure. Waste Manage. 38,126–131.
Zhao, X., Luo, K., Zhang, Y., Zheng, Z., Cai, Y., Wen, B., Cui, Z., Wang, X., 2018.Improving the methane yield of maize straw: focus on the effects of pretreatmentwith fungi and their secreted enzymes combined with sodium hydroxide. Bioresour.Technol. 250, 204–213.
S.O. Dahunsi, et al. Bioresource Technology 283 (2019) 229–241
241