Then-Transit Division Cmdr. Donna Henderson's analysis of her officers' actions

External Assistance For Health Sector : 1Societal Goals of Commercial Banks in India: Promise and Reality
CMDR Monograph Series No. - 49
SOCIETAL GOALS OF COMMERCIALBANKS IN INDIA : PROMISE AND REALITY
Mihir K. Mahapatra
CENTRE FOR MULTI-DISCIPLINARY DEVELOPMENT RESEARCHAlur Venkatrao Circle, DHARWAD-580001, Karnataka, India
Ph : 091-0836-2447639, Fax : 2447627E-mail : [email protected]

2 CMDR Monograph Series No. - 49
The Backdrop Sound financial systems with stable
macro economic fundamentals are some ofthe primary requirements to be ensured forsustaining higher growth of the economy overtime. In the financial system, banking sectorplays a crucial role in mobilizing resourcesand in ensuring timely disbursement of creditto certain productive units. Allocation of creditfor various developmental purposes includingpriority sector is expected to smoothen thepersisting economic disparities across regionsand likely to improve overall growth inemployment. Taking cognizance of it,nationalization of commercial banks wasundertaken so as to transform the commercialbanking into social banking by assigningpriority to certain sectors and in fulfilling creditneeds of the deprived section. The policyurged the bankers to reprioritize lendingprocess by shifting from urban-centric growthto rural-oriented approach.
It is during the reforms period whenskepticism has arisen about the role playedby the banking sector partly because ofdisquieting trends in some of the macroeconomic indicators and inadequate priorityassigned to social aspect of banking.1 Added
Societal Goals of Commercial Banks in India: Promise and Reality
This is part of ongoing research work in Banking and Development, partially sponsored by CanaraBank. An earlier version of the paper was presented in a seminar in Centre For Multi-DisciplinaryDevelopment Research, Dharwad in 2004. I am grateful to Canara Bank for providing financial supportand to Professors P R Panchamukhi and Sailabala Debi for their critical comments on an earlier versionof this paper.1 For instance, the overall growth in per capita income of the states edged up during the 1990s ascompared to the 1980s but persisting disparities among the states got aggravated during the previousdecade. Similarly, the rate of unemployment measured in Current Daily Status (CDS) also went up (from6.03 per cent in 1993-94 to 7.32 percent in 1999-2000) during the 1990s. Growth of employment has alsodropped from about 2 per cent per annum in 1983-93 to less than 1 per cent during 1993-94 to 1999-2000.
2 Based on some of the issues discussed above, the Finance Minister, Government of India urged thePSBs to double credit to agriculture in three years ahead, by 2007.
to this, farmers’ suicide in various statesespecially in Andhra Pradesh, Maharashtraand Karnataka can be partly the outcome oferosion in disbursement of credit toagriculture.2
Against this backdrop, the presentpaper attempts to examine the overallprogress and achievement of ScheduledCommercial Banks (SCBs) operating in Indiaduring the pre-reforms and reforms periodswith focus on societal goals. Efforts havebeen made to capture achievement of thebanking sector in fulfilling few majorobjectives of bank nationalization, includingshift form ‘elite banking’ to ‘mass banking’and lending for priority sector.
The paper is organized as follows.With a brief analysis about conceptual andfunctional issues associated with banking insection I, an overview of the performance ofcommercial banks during pre-reforms and re-forms periods has been captured in sectionII. The penultimate section deals withachievement of commercial banks with focuson social baking followed by summary andconclusion in section IV.

External Assistance For Health Sector : 3Societal Goals of Commercial Banks in India: Promise and Reality
Section I1. Commercial Banks: Classification and Function
The Commercial banks areconsidered as the dominant financialintermediaries in India as it channelises largeamount of savings into investment andconsumption. In the financial system itoccupies the second position as a financialinstitution next to the Reserve Bank of India.In this contest, it may be essential to touchupon some of the conceptual issuesassociated with banking, namely commercialbank, Scheduled Commercial Banks (SCBs)and various categories of SCBs.
A bank is an institution that acceptsdeposits of money from the publicwithdrawable by cheque and used forlending.3 In other words, two essentialfunctions that make a financial institution abank are acceptance of chequable deposits(of money) from public and lending to others( but not for financing its own business ofany kind, say manufacturing or trade). 4
In defining Commercial banks thebusiness of commercial firms that providevarious types of services to its customers(provision of different types of deposits,purpose specific loans, safety lockers to storevaluable assets of the customers and so on)can be taken into account.
3 In exploring the origin of the word ‘bank’, one may go back to the days of Lombard money –changerswho used to keep overseas travellers’ money in safe custody. They conducted their business from abench (banc in French). Therefore, the word ‘bank’ is used to specify a place where money is handled(Dhingra, I. C, 2000).4Acceptance of chequable deposits is a necessary but not a sufficient function to consider a financialinstitutions as a bank. In other words, it has to fulfill others’ lending requirement. Therefore, PostOffice Savings Bank are not technically considered as bank though some of them accept chequabledeposits. Similarly, lending alone does not make a financial institution a bank as it has to acceptchequable deposits (Gupta, Suraj: 1999).
Further, commercial banks can bebroadly classified into Scheduled CommercialBanks (SCBs) and non-ScheduledCommercial Banks; with proportionatelylarger share contributed by the former. InMarch 2004, out of total 291 commercialbanks 289 are Scheduled Commercial Banksand the remaining 5 are non-scheduledCommercial Banks. Of the total 289 SCBs, amajority (196) are Regional Rural Banks.
A ‘scheduled bank’ is a bank whichis included in the second schedule to the Re-serve Bank of India Act 1934. These banksenjoy certain privileges such as free confes-sional remittances facilities and financial ac-commodation from the RBI. They also havecertain obligations like minimum cash reserveratio (CRR) to be kept with the RBI. AllScheduled Banks comprise Schedule Com-mercial and Scheduled Co-operative banks.
The commercial Banks which con-duct the business of banking in India andwhich (a ) have paid up capital and reservesof an aggregate real and exchangeable valueof not less than Rs. 5 lakhs and (b) satisfythe Reserve Bank of India that their affairsare not being conducted in a manner detri-mental to the interest of their depositors, areeligible for inclusion in the Second scheduleto the Reserve Bank of India Act, 1934, andwhen included are known as ‘Scheduled Com-mercial Banks’.

4 CMDR Monograph Series No. - 49
The Scheduled Commercial Banksin India can be broadly classified into fivedifferent groups according to their ownershipand / or nature of operation. These bankgroups are (i) State Bank of India and itsassociates, (ii) Nationalized Banks, (iii)Regional Rural Banks, (iv) Foreign Banks and(v) Other Indian Scheduled CommercialBanks (in the private sector)5 . Among thevarious groups of banks the Public Sectorbanks ( 19 nationalized banks and SBI withAssociates) occupy the dominant position. Atthe other end Scheduled Co-operative bankscan be classified as Scheduled State Co-operative banks and Scheduled Urban Co-operative banks (chart I). 6
1.1 Functions of Commercial BanksCommercial bank fulfills investment
requirements of savers and credit needs ofboth the investors and consumers. Overall,
5 The Regional Rural Banks have been set up since 1975 onwards under the Regional Rural Banks Act1975 while Co-operative Banks’ existence can be traced back to the period prior to independence.6 Under the Banking Regulation (B.R.) Act, 1949 only Urban Co-operative Banks (UCBs),State Co-operative Banks (St CBs) and District Central Co-operative Banks (CCBs) are qualified to becalled as banks in the Co-operative sector.
the basic functions of bank intermediationinclude Liability-Asset transformation,Maturity Transformation and RiskTransformation (Jadhav and Ajit, 1996).Liability-Asset transformation indicatesacceptance of deposits from the public asliability and converting the same into assetssuch as loan. Asset-Liability management isdefined as a process of adjusting bankliabilities to meet loan demands, liquidity needsand safety requirements. It focuses onprofitability and long term operating viability(Louis, I J H, 1997-98). Similarly, size-transformation implies providing large loanson the basis of numerous small deposits andmaturity-transformation ensures provision ofalternative forms of deposits to the saversaccording to their liquidity preference whileat the same time offering the borrowers withloans of desired maturities. At the other end,risk-transformation offers distribution of risksthrough diversification, which substantially
Scheduled Commercial Banks (286)
Scheduled Co-operative Banks
Public Sector (27)
Private Sector (30)
Foreign Banks (33)
Regional Rural
Banks(196)
Scheduled Urban Co-operative Banks (52)
Scheduled State Co-operative Banks (16)
Nationalized Banks (19)
SBI & its Associates
(8)
Old Private Banks (21)
New Private Banks (9)
Scheduled Banks in India
Chart-I Scheduled Banking Structure in India
External Assistance For Health Sector : 5Societal Goals of Commercial Banks in India: Promise and Reality
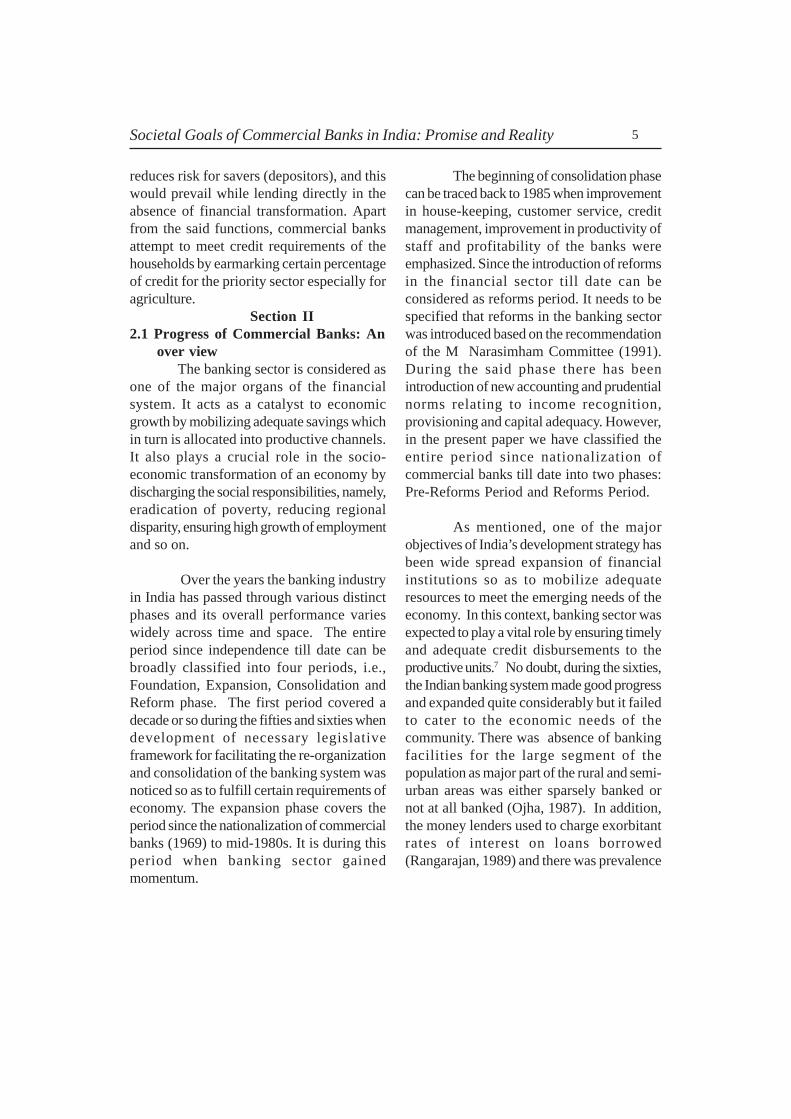
reduces risk for savers (depositors), and thiswould prevail while lending directly in theabsence of financial transformation. Apartfrom the said functions, commercial banksattempt to meet credit requirements of thehouseholds by earmarking certain percentageof credit for the priority sector especially foragriculture.
Section II2.1 Progress of Commercial Banks: An over view
The banking sector is considered asone of the major organs of the financialsystem. It acts as a catalyst to economicgrowth by mobilizing adequate savings whichin turn is allocated into productive channels.It also plays a crucial role in the socio-economic transformation of an economy bydischarging the social responsibilities, namely,eradication of poverty, reducing regionaldisparity, ensuring high growth of employmentand so on.
Over the years the banking industryin India has passed through various distinctphases and its overall performance varieswidely across time and space. The entireperiod since independence till date can bebroadly classified into four periods, i.e.,Foundation, Expansion, Consolidation andReform phase. The first period covered adecade or so during the fifties and sixties whendevelopment of necessary legislativeframework for facilitating the re-organizationand consolidation of the banking system wasnoticed so as to fulfill certain requirements ofeconomy. The expansion phase covers theperiod since the nationalization of commercialbanks (1969) to mid-1980s. It is during thisperiod when banking sector gainedmomentum.
The beginning of consolidation phasecan be traced back to 1985 when improvementin house-keeping, customer service, creditmanagement, improvement in productivity ofstaff and profitability of the banks wereemphasized. Since the introduction of reformsin the financial sector till date can beconsidered as reforms period. It needs to bespecified that reforms in the banking sectorwas introduced based on the recommendationof the M Narasimham Committee (1991).During the said phase there has beenintroduction of new accounting and prudentialnorms relating to income recognition,provisioning and capital adequacy. However,in the present paper we have classified theentire period since nationalization ofcommercial banks till date into two phases:Pre-Reforms Period and Reforms Period.
As mentioned, one of the majorobjectives of India’s development strategy hasbeen wide spread expansion of financialinstitutions so as to mobilize adequateresources to meet the emerging needs of theeconomy. In this context, banking sector wasexpected to play a vital role by ensuring timelyand adequate credit disbursements to theproductive units.7 No doubt, during the sixties,the Indian banking system made good progressand expanded quite considerably but it failedto cater to the economic needs of thecommunity. There was absence of bankingfacilities for the large segment of thepopulation as major part of the rural and semi-urban areas was either sparsely banked ornot at all banked (Ojha, 1987). In addition,the money lenders used to charge exorbitantrates of interest on loans borrowed(Rangarajan, 1989) and there was prevalence

6 CMDR Monograph Series No. - 49
of urban bias as evident from easy availabilityof bank credit for the large industries andtrading houses. At the other end certainproductive units were deprived of havingaccess to banking funds. Therefore, ascheme of social control was introduced inearly 1968 with the aim of changing thelending pattern by directing increasing volumeof credit flow to the desired sectors andmaking banks an effective instrument ofeconomic development.8 Identifying slowprogress of the banking system in achievingsocietal goals through the scheme of ‘socialcontrol’, nationalization of 20 major banks wasinitiated to hasten the pace of branch bankingand to smoothen regional disparities.
In addressing the nationalization ofcommercial banks it may be mentioned thatthe Imperial Bank, treated as the largest bankin India in those days, was nationalized in 1955and merged with the government ownedbanks of some of the princely states to be-come the State Bank of India (Agarwal,1996). The first phase of major banknationalisation was introduced in July 1969when 14 largest privately owned commercialbanks, each having a deposit liability of Rs 50crores and above were nationalized. It fol-lowed nationalization of 6 more commercialbanks in 1980, each having a deposit liabilityof Rs 200 crores and above.
Nationalization of banks was effectedfor speedy achievement of social purposes
such as meeting the legitimate requirementsof the weaker sections of the society. Thiscan be facilitated by reducing both concen-tration of banks in a specific region and theirinfluence on industrial and business monopo-lies as reflected by allocation of more re-sources for this sector. In other words, thesavings mobilized cab be utilized for produc-tive purposes based on plans and priorities.To be specific, it needs to be ensured thatcredit needs of the productive sectors andweaker sections of the economy especiallyfarmers, SSI and self-employed have beenfulfilled. The distribution of institutional creditin favour of the farmers and informal sectorproduction units, viz., small scale industries,village artisans and household enterprises,could serve the purpose of expanding pro-duction base along with rise in employmentopportunities. This, in turn, could reduce theextent of poverty and improve the standardof living of the households. Further, effortshave to be made to kick start growth in someof the hitherto neglected backward regions.
2.2 Banking Sector During Pre-Reforms Period
Prior to economic reforms introducedin 1991, the Indian banking and financial sys-tem made commendable progress in extend-ing its geographical spread and expandingbranch network. This is reflected by thegrowth of financial savings and fulfillment ofthe credit requirements of the borrowers es-pecially in agriculture and small scale indus-
7 The banking sector comprises public sector banks, foreign banks, urban cooperative banks, privatesector banks, regional rural banks and co-operative banks.8The scheme of social control over banking was introduced in 1968 with the major objectives ofachieving a wider spread of bank credit, preventing its misuse, directing large volume of credit flow tothe priority sectors and making it a more effective instrument of economic development.9 Later on New Bank of India got merged with Punjab National Bank

External Assistance For Health Sector : 7Societal Goals of Commercial Banks in India: Promise and Reality
try (Narasimham, 1991). In contrast, therehas been a decline in productivity and effi-ciency, and erosion of profitability of the bank-ing sector. This is partly on account of lowerinterest rate charged by the commercial banksfor directed investments and directed creditprogrammes, rise in expenditure on accountof fast and massive expansion of branches,inadequate progress in updating work tech-nology and weaknesses in the internal struc-ture of the banks.10 No doubt, various fac-tors are held accountable for this yet, the cru-cial one is the policy induced rigidities suchas excessive degree of central direction oftheir operations in terms of investments, creditallocations, branch expansion and even inter-nal management aspects of the business. Theoperation of the banking system in the rigidlycontrolled system especially maintenance ofhigh reserve requirements, interest rate con-trols and allocation of financial resources topriority sectors made them neither competi-tive nor innovative.
Shetty (1996) argues that poorperformance of the banking sector during theearly 1990s can be on account of poor loanportfolio, sizeable non-performing assets,declining productivity and operationalefficiency, low capital base which deteriorateddue to sharp erosion in profitability, poorhousekeeping and deterioration in customerservice. But erosion in profitability of banksis not due to directed investment or directedcredit as it is generally believed to be.Therefore, there was an urgent need for thebanks to get involved in priority sector lendingelse the state had to intervene. Similarly, to
tackle the management related weakness,public sector banks need to be freed fromthe clutches of bureaucrats. No doubt,different committees set up over timeexamined some of the issues discussed aboveand recommended policy measures. Buteither non-implementation or adoption of piecemeal approach in implementing therecommendations culminated the problemfurther.
2.3 Reforms and Challenges in the Banking Sector
Introduction of reforms in theBanking sector seems to have been initiatedduring the 1980s based on therecommendation of the ChakravartyCommittee Report (Report of the Committeeto Review the Working of the MonetarySystem). The committee justified thenecessity to move away from quantitativecontrols so as to remove distortion in the creditmarket in achieving higher growth of theeconomy. Similarly it is also specified thatadministered interest rate system has becomeunduly complex and therefore, it has reducedthe ability of the system to ensure effectiveuse of credit. The persistence of administeredinterest rates failed to make sure necessaryflexibility to mobilize adequate financialsavings by introducing suitable changes in thedeposit rates. This, in turn, affected averagecost of deposit and therefore, a decline inprofitability can not be ruled out.
In the backdrop of erosion inproductivity and efficiency, reforms in thebanking sector were introduced based on the
10 In other words, the interest rate was lower than the prevalent market rates or what the banks couldhave earned from alternate deployment of funds.

8 CMDR Monograph Series No. - 49
recommendations of the Committee on theFinancial System (1991) and the Report ofthe Committee on Banking Sector Reforms(1998) headed by M Narasimham.Undoubtedly, reforms in the financial sectorreceived a major thrust with the identificationof various factors accountable for decline inproductivity, profitability and erosion inefficiency during the two decades sincenationalization of commercial banks. Overall,the major reforms in the banking sectorintroduced in Indian economy can be groupedinto six categories: prudential measures,reforms in institutional and legal set-up,changes in supervisory aspects, adoption ofvarious methods to enhance competition,issues related to improvement in the role ofmarket forces and technology related aspects.Broadly, the recommendations of thecommittee include liberalization of entrynorms for domestic and foreign banks,reduction in the levels of statutory pre-emption, to dismantle the complex structureof interest rates, lay down capital adequacyrequirements, introduce income recognitionand provisioning for bad debts. To ensuresafety and soundness of the financial systemand at the same time to encourage marketforces to play a crucial role, prudential normsand regulations need to be introduced (Jadavand Ajit, 1996).11 There are two primarypurposes to introduce prudential norms, i.e.,to reveal the true picture of the banks’ loanportfolio and to help arrest its deterioration(Rangarajan, 1994). Based on this,Prudential norms for classification of assetsand provisioning for bad debts have beenintroduced. The capital adequacy norm can
be considered as incentive based regulationwhereby well capitalized and efficient bankscan compete and impose cost on undercapitalized and poorly managed banks (Jadavand Ajit, 1996). It allows the efficient banksthat can control its risk can hold less capitalas compared to the inefficient banks. The Capital-to-risk weighted assets ratio of 8 percent have been introduced with further riseto 9 per cent since 1999-2000.
As part of statutory pre-emption, theCommittee argued that it can be used as aprudential requirement but not as aninstrument for financing public sectorrequirement. Further, the SLR needs to bebrought down to 25 per cent over a period offive years and Cash Reserve Ratio to begradually reduced though interest on theseinstruments to be raised. Also Debt RecoveryTribunals have been set up to assist the banksin the recovery of loans. The scheme ofOmbudsman introduced in 1995 can look intoand resolve customer grievances.
Based on the recommendations,noticeable change in various norms has beenobserved over time. For instance, during theearly 1990s through the use of StatutoryLiquidity Ratio (SLR) and Cash Reserve Ratio(CRR) as much as 63.5 per cent of the bankresources were pre-empted (Rakesh Mohan,2004). But these rates have been cutconsiderably in a sequenced manner as SLRdeclined from 38.5 per cent in 1991-92 to thestatutory minimum of 25 per cent now whileCRR dropped from 15 per cent to 4.5 percent during the said period. The level and
11 Reforms in the prudential norm include income recognition, asset classification, provisioning for badand doubtful debts and capital adequacy.

External Assistance For Health Sector : 9Societal Goals of Commercial Banks in India: Promise and Reality
structure of interest rates have beenrationalized in a phased manner. There hasbeen abolition of minimum lending rates andthe banks have been allowed to determinetheir prime lending rates. The Prime LendingRates (PLRs) declined from 19 per cent in1991-92 and the benchmark PLR in respectof 5 major banks remained in the range of10.5-11 per cent. The interest rates on loansabove Rs 2 lakh have been fully deregulated.Similarly, interest rates on domestic termdeposits have also been deregulated. In 1995,all controls on deposit rates above one yearmaturity were removed. To strengthensupervisory system of banks and financialinstitutions Board of Financial Supervision(BFS) has been set up. Further, less strongbanks that suffered capital erosion due torising levels of NPA have been recapitalised.
It is during the 1990s when the com-mercial banks particularly the public sectorbanks have faced new challenges, namely,improving bottomline, reducing non-perform-ing assets and to observe the discipline ofregulatory and prudential norms for capitaladequacy. The persistence of soft interestrate regime across the globe also motivatedthe banks to diversify their activities formpurely traditional banking to providing vari-ous financial and other services to its cus-tomers. Of late, banks have preferred non-interest income deployment of funds for theirsurvival.
Section III3. Progress in Social Aspect of Banking
The commercial banks can play avital role in the process of economic devel-opment and achievement of social justice.This can be facilitated through extension and
expansion of banking facilities in unbankedand under-banked areas, mobilization of sav-ings to meet investment requirement of aneconomy, allocation of credit for developmen-tal purposes with focus on priority sector lend-ing so as to relieve the farmers from clutchesof money lenders and to improve growth ofemployment, diversification of banking activi-ties based on the changing needs of the cus-tomers, and improvement in productivity, prof-itability and quality of customer care to growand face the challenges over time. However,mere growth in the banking sector may notnecessarily alleviate poverty and reduce dis-parities in per capita income across regionsand various groups of people. Therefore, oneof the major issues that needs to be assignedpriority is the concept of ‘social banking’, i.e.,a shift from urban centric growth to adoptionof rural –oriented growth strategy. The shiftfrom ‘class banking’ to ‘mass banking’ wasone of the crucial issues that motivated na-tionalization of commercial banks.
‘In social banking, not only freshprocedures are to be evolved to suit the needsof new class of borrowers, but the whole phi-losophy of lending has also to undergone aradical change, and is an entirely new andunconventional approach to bank lending(Garg, 1994).’ Social banking aim at partici-pation of the bankers in the process of eco-nomic development to achieve developmen-tal goals without jeopardizing or even dilutingthe professional standards of banking. In otherwords, social banking refers to the policy in-duced bank assistance to the designated pri-ority sectors of the economy and weaker sec-tions of the community (Garg, 1994). How-ever, the present paper may not necessarilycapture the said issues in detail. But an at-

10 CMDR Monograph Series No. - 49
tempt has been made to infer the progressand achievement of commercial banks in ful-filling the societal goals in both pre-reformsand reforms period. To analyse the achieve-ment during different periods, growth of of-fice, mobilization of deposit and CD ratio inboth rural and urban area has been examinedalong with pattern of priority sector lending.
3.1 Growth of Bank OfficePrior to economic reforms Indian
banking and financial system madecommendable progress in extending itsgeographical spread and functional reach. Forinstance, number of Scheduled commercialbanks increased about two times in about adecade during the 1970s and the trend almostcontinued during the 1980s with slowdown inthe 1990s (table 1).12 Similarly, massivegrowth of commercial bank office wasnoticed during the 1970s (from marginallyhigher than 8,000 in 1969 to close to 32,500 in1980) and to a large extent in the early 1980s(a rise of about 19,000 during 1980-1985).An unprecedented growth of office sincenationalization of major commercial banksimplies adequate availability of bankingfacilities at large. In contrast, during the initialperiod of economic reforms when the growthof bank office witnessed slow growth thoughit picked up during the second half of the1990s. The number of offices went up byabout 2000 during 1990-1995 while itincreased by about 5,500 during 1995-2000(table 1). A comparative analysis of annualaverage growth of SCBs office during thepre-reforms and reforms periods reveals asharp erosion during the latter period (from5.1 per cent in1980-91 to 0.8 per centduring1992-2003).
A mere slow down in growth ofoffice would not be a major source of concernprovided the commercial banks sustainedrising trend in the rural area. In this context,it can be mentioned that one of the majorobjectives of bank nationalization is to shiftfrom ‘elite banking’ to ‘mass banking’ byexpanding banking facilities in the rural, semi-urban areas especially in unbanked and under-banked areas. In other words, persistence of‘urban-centric’ nature of banking at the costof rural areas can affect allocation of creditfor developmental purposes especially for thepriority sector and therefore, it can be a causefor serious concern.
Decline in growth of offices in therural and semi-urban areas is noticed duringthe reforms period despite the fact that a largechunk of total population live in rural areas(Chart 1). In rural area it declined from 6.7per cent in 1980-91 to 0.8 per cen in 1992-2003.Growth in semi-urban area alsowitnessed a fall during the said period but theextent of decline is not so pronounced ascompared to the rural area. At other end therehas been improvement in growth of officesin the metropolitan area during the reformsperiod.
The disparity in growth of office (asnoticed during the 1990s) can change theshare of office across population groups. Forinstance, close to 60 per cent of total officeswere in the rural area during the mid-80s andearly 1990s (table 1). It declined sharply toabout 47 per cent during the closing years ofthe 1990s and also in recent years. At theother end, there has been growth of office inthe urban and metropolitan area during thereforms period (tables 1 and 2). The share of
12 The number of commercial banks in India went up from 73 in June 1969 to 154 in June 1980.

External Assistance For Health Sector : 11Societal Goals of Commercial Banks in India: Promise and Reality
YearSch.Com
Banks
of which
RRBs
Non Sch
Commercial
Banks
Total Rural Semi - urban Urban Metropolitan Total
Population
per office
('000)
1 2 3 4 5(=2+4) 6 7 8 9 10(=6 to9) 11
1969 73 - 16 89 1833 3342 1584 1503 8262 64
22.2 40.5 19.2 18.2 100
1980 148 73 5 153 15105 8122 5178 4014 32419 21
46.6 25.1 16 12.4 100
1985 264 183 4 268 30185 9816 6578 4806 51385 15
58.7 19.1 12.8 9.4 100
1990 270 196 4 274 34791 11324 8042 5595 59752 14
58.2 19 13.5 9.4 100
1992 272 196 4 276 35269 11356 8279 5666 60570 14
58.2 18.7 13.7 9.4 100
1995 281 196 3 284 33004 13341 8868 7154 62367 15
52.9 21.4 14.2 11.5 100
2000 297 196 1 298 32852 14841 10994 9181 67868 15
48.4 21.9 16.2 13.5 100
2003 289 196 5 294 32303 14859 10693 8680 66535 16
48.6 22.3 16.1 13 100
2004* 286 196 5 291 31999 15113 11113 8996 67221 16
47.6 22.5 16.5 13.4 100
Number of Commercial Banks Number Of Bank Offices
Chart 1: Proportion of SCBs Office Across Population Group
(in per cent)
0
10
20
30
40
50
60
70
De
c-7
2
De
c-7
5
De
c-7
8
De
c-8
1
De
c-8
4
De
c-8
7
Ma
r-9
0
Ma
r-9
3
Ma
r-9
6
Ma
r-9
9
Ma
r-0
2
Se
pt 2
00
3
year
pe
r c
en
t
Off ices in Rural Area
as % of TotalOff ices in Semi-Urban
Area as % of TotalOff ices in Urban area
as % of TotalOff ices in Metropolitan
area as % of Total
Table 1: Key Indicators of Commercial Banks in India
*SeptemberNotes: (i) Sch.com: Scheduled Commercial Banks, Non-Sch: Non-Scheduled Commercial Banks, RRBs:
Regional Rural Banks(ii) Figures in Italic are percentages to total
Source: Compiled from RBI’s Banking Statistics: 1972-95 and Basic Statistical Returns of Scheduled Commercial Banks in India, March 2003, Vol.32.

12 CMDR Monograph Series No. - 49
metropolitan area in total office of thecommercial banks which was less than 10per cent during the mid-1980s and early 1990s,went up to 14 per cent in the recent past (table1). The number of rural office decline by closeto 2,500 during 1992 – 2000. In contrastnumber of office in urban and metros wentup by around 2,200 and 3,500 during the abovesaid period. It reflects emergence of atendency to exit from rural areas in the recentpast. This is noticed despite the fact that costof deposit is relatively low in rural areas ascompared to urban and metros. Normallypeople in the rural areas prefer savingsaccount deposit and withdraw money lessfrequently while bulk of the deposits in urbanand metros comes from the people workingin the organized sector (salaried class) whoused to withdraw money more frequently. Nodoubt, proliferation of ATM facilities is likelyto reduce cost of serving a customer in theurban areas provided customers would feelcomfortable to withdraw cash from ATM.
While examining the fall in growthof office during the reforms period, the roleof RBI can not be ignored. The RBI gave upits bank expansion programme in April 1995and therefore, the number of SCBs ruraloffices steadily declined from 32,981 inMarch 1996 to 31, 999 in September 2004(Shetty, 2005). It can be mentioned that since1996, banks having three year profitabilityrecord and non-performing assets below 15
1980-1991 1992-2003 1980-2003
Rural A rea 6.7 10.6 6 0.8 9.8 6.4 2 8.4 6
Semi-Urban Area 2.7 7.8 7.5 2.3 10.3 7.3 2.3 7.3 4.9
Urban Area 4.6 8.9 8.1 1.9 10.3 8 2.9 7.5 5.6
Metropolitan A rea 3.4 9.2 7 3.8 10.6 13 3.6 9 8.8
India 5.1 8.9 7.9 0.8 10.3 10.5 2.4 8.1 7.3
Note: Real compound growth has been estimated for deposit and credit by using semi-log model.
per cent can be allowed to open newbranches. The banks will have to fulfill certainother requirements such as maintaining capitaladequacy norm of 9 per cent and minimumowned fund requirement of Rs 100 crore.This seems to be difficult to achieve for anumber of Public Sector Banks.
Apart from the policy reforms, thegrowth of branch expansion can bedetermined by performance of varioussectors. A substantial growth in service sectorduring the reforms period might havemotivated the bankers to accelerate growthof branch expansion in the Metropolitan area.Added to this, the growth of private sectorand foreign banks threw a challenge to theirpublic sector counterparts in the recent past.
3.1.1 Distribution of Bank office acrossRegions/States
The presence of bank office in a region isdetermined by a number of factors includingdensity of population, level of development,availability of adequate infrastructure and soon. With the rise in per capita income onaccount of growth of business activity/agriculture, a substantial amount of resourcemobilization seems to be feasible andtherefore, there is scope for expansion of
Table 2: Growth of Office, Deposit and Credit of SCBs Across Population Groups(In per cent )
Population Group

External Assistance For Health Sector : 13Societal Goals of Commercial Banks in India: Promise and Reality
credit. Taking into account population as thesole determinant it is noticed thatconcentration of banks is more in southernand northern regions as on an average 12,000people are served by each office in thoseregions (table 5). Of late, around 28 per centof the total bank office is confined to thesouthern region followed by central (20 percent), northern region (16 per cent) andwestern (close to 16 per cent). In contrast,close to 3 per cent of bank offices is confinedto North-Eastern region (table 3, chart 2).Among the states, concentration of office isnoticed in few states, namely, Uttar Pradesh(14 per cent) followed by Maharashtra (closeto 10 per cent) and some of the middle incomestates in the southern region (Tamil Nadu,Karnataka and Andhra Pradesh) each havingabout 7 per cent share in total. It is only duringthe early 1980s when substantial improvementin share of office was observed in some ofthe relatively backward regions including
Chart 2: Distribution of SCBs Office Across Regions
(in per cent)
0
5
10
15
20
25
30
35
1980 1985 1990 1992 1995 2002
Year
Per
cen
t
Northern RegionNorth-Eastern RegionEastern RegionCentral RegionWestern Region
Eastern and Central Regions. In contrast, nonoticeable change in share of office is noticedin the said region during the first half of the1990s.
3.1.2 Growth of Major Scheduled Commercial Banks
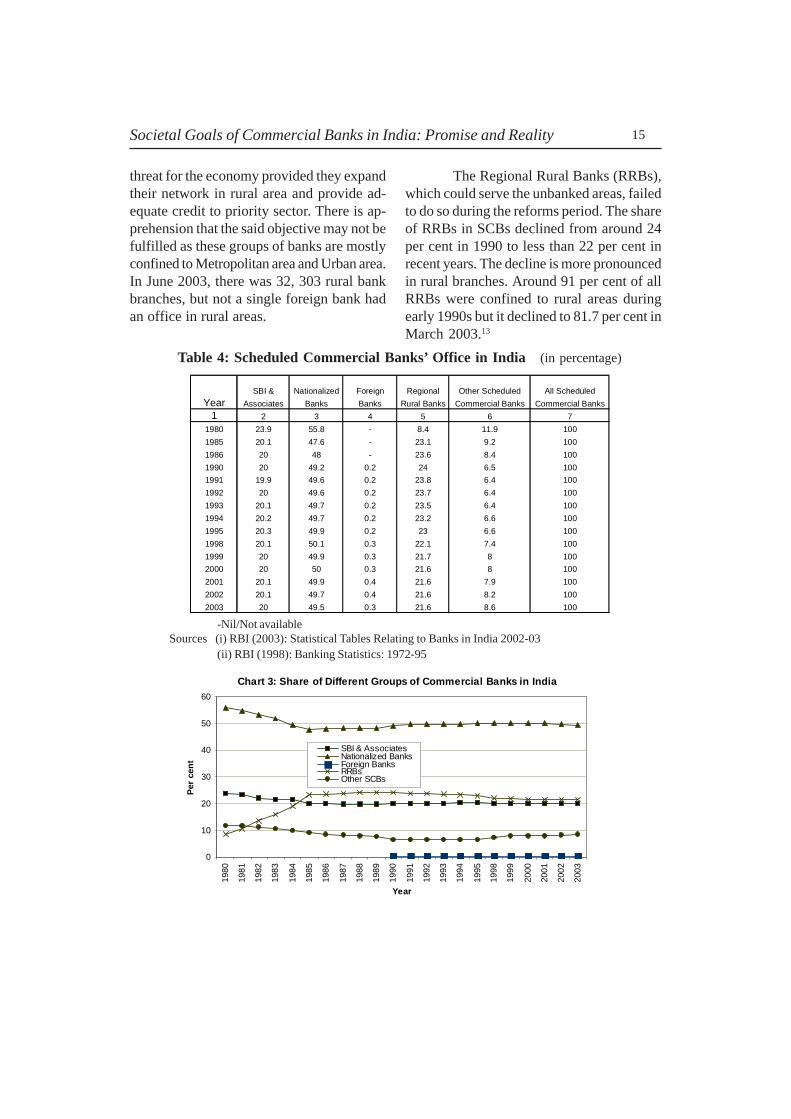
The dominance of various groups ofbanks has undergone a change over the years(chart 3). It is found that the share of nation-alized banks which constitute close to 50 percent of total banks has declined form about55 per cent during the initial year of the 1980sto about 48 per cent during the latter part ofthe same decade with marginal improvementin recent years (table 4). This can be partlythe outcome of reforms in the banking sec-tor, i.e., allowing new private banks to enterthe market and decision taken by RBI to giveup bank expansion programme in April 1995.Growth of New Private Sector Banks andForeign Banks may not necessarily pose a

14 CMDR Monograph Series No. - 49
Table 3: Distribution of SCBs’ Office Across Regions/States (in per cent)
-: Negligible/Not available. Note: On account of bifurcation of the states the figures for U.P, M.P, Bihar and Goa can not be strictly comparable.Source: RBI (1998) : Banking Statistics: 1972-75 and various issues of RBI’s Basic Statistical Returns
of Scheduled Commercial Banks.
External Assistance For Health Sector : 15Societal Goals of Commercial Banks in India: Promise and Reality
threat for the economy provided they expandtheir network in rural area and provide ad-equate credit to priority sector. There is ap-prehension that the said objective may not befulfilled as these groups of banks are mostlyconfined to Metropolitan area and Urban area.In June 2003, there was 32, 303 rural bankbranches, but not a single foreign bank hadan office in rural areas.
SBI & Nationalized Foreign Regional Other Scheduled All Scheduled
Year Associates Banks Banks Rural Banks Commercial Banks Commercial Banks
1 2 3 4 5 6 7
1980 23.9 55.8 - 8.4 11.9 100
1985 20.1 47.6 - 23.1 9.2 100
1986 20 48 - 23.6 8.4 100
1990 20 49.2 0.2 24 6.5 100
1991 19.9 49.6 0.2 23.8 6.4 100
1992 20 49.6 0.2 23.7 6.4 100
1993 20.1 49.7 0.2 23.5 6.4 100
1994 20.2 49.7 0.2 23.2 6.6 100
1995 20.3 49.9 0.2 23 6.6 100
1998 20.1 50.1 0.3 22.1 7.4 100
1999 20 49.9 0.3 21.7 8 100
2000 20 50 0.3 21.6 8 100
2001 20.1 49.9 0.4 21.6 7.9 100
2002 20.1 49.7 0.4 21.6 8.2 100
2003 20 49.5 0.3 21.6 8.6 100
-Nil/Not availableSources (i) RBI (2003): Statistical Tables Relating to Banks in India 2002-03
(ii) RBI (1998): Banking Statistics: 1972-95
The Regional Rural Banks (RRBs),which could serve the unbanked areas, failedto do so during the reforms period. The shareof RRBs in SCBs declined from around 24per cent in 1990 to less than 22 per cent inrecent years. The decline is more pronouncedin rural branches. Around 91 per cent of allRRBs were confined to rural areas duringearly 1990s but it declined to 81.7 per cent inMarch 2003.13
Chart 3: Share of Different Groups of Commercial Banks in India
0
10
20
30
40
50
60
1980
1981
1982
1983
1984
1985
1986
1987
1988
1989
1990
1991
1992
1993
1994
1995
1998
1999
2000
2001
2002
2003
Year
Per
cen
t
SBI & AssociatesNationalized BanksForeign BanksRRBsOther SCBs
Table 4: Scheduled Commercial Banks’ Office in India (in percentage)
16 CMDR Monograph Series No. - 49
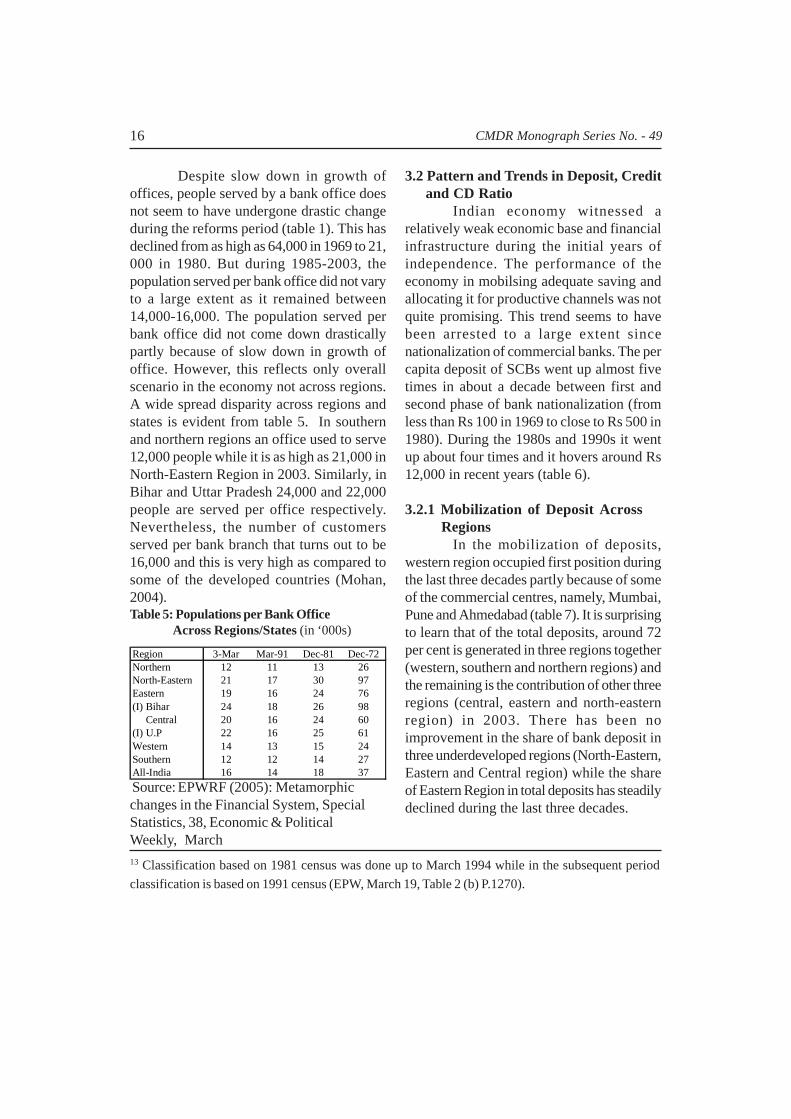
Despite slow down in growth ofoffices, people served by a bank office doesnot seem to have undergone drastic changeduring the reforms period (table 1). This hasdeclined from as high as 64,000 in 1969 to 21,000 in 1980. But during 1985-2003, thepopulation served per bank office did not varyto a large extent as it remained between14,000-16,000. The population served perbank office did not come down drasticallypartly because of slow down in growth ofoffice. However, this reflects only overallscenario in the economy not across regions.A wide spread disparity across regions andstates is evident from table 5. In southernand northern regions an office used to serve12,000 people while it is as high as 21,000 inNorth-Eastern Region in 2003. Similarly, inBihar and Uttar Pradesh 24,000 and 22,000people are served per office respectively.Nevertheless, the number of customersserved per bank branch that turns out to be16,000 and this is very high as compared tosome of the developed countries (Mohan,2004).Table 5: Populations per Bank Office Across Regions/States (in ‘000s)
Source: EPWRF (2005): Metamorphicchanges in the Financial System, SpecialStatistics, 38, Economic & PoliticalWeekly, March
13 Classification based on 1981 census was done up to March 1994 while in the subsequent period
classification is based on 1991 census (EPW, March 19, Table 2 (b) P.1270).
Region 3-Mar Mar-91 Dec-81 Dec-72Northern 12 11 13 26North-Eastern 21 17 30 97Eastern 19 16 24 76
(I) Bihar 24 18 26 98 Central 20 16 24 60(I) U.P 22 16 25 61
Western 14 13 15 24Southern 12 12 14 27All-India 16 14 18 37
3.2 Pattern and Trends in Deposit, Credit and CD Ratio
Indian economy witnessed arelatively weak economic base and financialinfrastructure during the initial years ofindependence. The performance of theeconomy in mobilsing adequate saving andallocating it for productive channels was notquite promising. This trend seems to havebeen arrested to a large extent sincenationalization of commercial banks. The percapita deposit of SCBs went up almost fivetimes in about a decade between first andsecond phase of bank nationalization (fromless than Rs 100 in 1969 to close to Rs 500 in1980). During the 1980s and 1990s it wentup about four times and it hovers around Rs12,000 in recent years (table 6).
3.2.1 Mobilization of Deposit Across Regions
In the mobilization of deposits,western region occupied first position duringthe last three decades partly because of someof the commercial centres, namely, Mumbai,Pune and Ahmedabad (table 7). It is surprisingto learn that of the total deposits, around 72per cent is generated in three regions together(western, southern and northern regions) andthe remaining is the contribution of other threeregions (central, eastern and north-easternregion) in 2003. There has been noimprovement in the share of bank deposit inthree underdeveloped regions (North-Eastern,Eastern and Central region) while the shareof Eastern Region in total deposits has steadilydeclined during the last three decades.

External Assistance For Health Sector : 17Societal Goals of Commercial Banks in India: Promise and Reality
Table 6: Major Performance Indicators of Scheduled Commercial Banks in India
44 68 14 56 88 15.5
48 148 25 67 208 19.9
68 327 33 103 494 35.8
107 747 41 150 1026 39.4
176 1275 40.7 290 2098 48.6
217 1516 37.1 392 2738 49.5
339 2320 33.7 620 4242 51.7
669 4555 35.4 1255 8542 53.5
779 5228 31 1456 9770 56
893 5927 33.7 1659 11008 49.3
1143 7275 Na 1925 12253 51.8
Share of Priority
Sector Advances
in Total Credit
Deposit Per
Office (Rs)
Per Capita
Deposit
Deposit To
National Income
(percent)Year
Credit per
Office (Rs
lakh)
Per Capita
Credit (Rs)
2003
1995
2000
2001
2002
1969
1975
1980
1985
1990
1992
Note: National Income at current prices.
Sources: (i) RBI (1998): Banking Statistics:1972-95
(ii) RBI(2003): Statistical Tables Relating to Banks in India 2002-03.
The extent of deposit mobilized isdetermined by various factors including thelevels of development, concentration of officeand RBI’s policy prescription. Taking intoaccount the concentration of office alone it islearnt that there is a mismatch between extentof resource mobilized in a region and shareof total office in the same region (table 8,chart 5). In 2002 the share of Northern andWestern Region in total office turns out to be16 per cent but in the resource mobilization itis much higher, i.e., 23 and 26 per centrespecively. In contrast, the resourcemobilized in Central, Southern and EasternRegion is much less as compared to share oftotal office in those regions. No doubt it canbe partly on account of level of development,per capita income and growth of urbancentres. In the Southern region it is surprisingto learn that most of the states are in themiddle income category and people arerelatively more mobile, especially in Keralaand parts of Karnataka. The population served
per bank office is also very low (12, 000) ascompared to some other regions. Despite thisthe extent of resource mobilized is laggingbehind the level of concentration of office inthis region.3.2.2 Growth of Deposit vis-à-vis National Income
An analysis of deposit as percentageof National Income reveals a substantialimprovement during the 1970s (an increaseby about 20 percentage points) and 1980s (13percentage points rise) but the trend was notsustained during the 1990s. This implies thatbank deposit had grown faster than nationalincome during pre-reforms period ascompared to reforms period. The deposit aspercentage of National Income that was closeto 49 per cent in 1990 went up to 53.5 percent in 2000 with further decline in recentyears (table 6).
The slow growth in deposit-to-nationalincome ratio during the reforms period can

18 CMDR Monograph Series No. - 49
Table 7: Regional Share in Bank Deposits in India
(per cent to all India)
Note: Number of offices includes Administrative offices. Population group (Rural/Semi-Urban etc.)classification is based on 1991 census.
Source: EPWRF (2005): Metamorphic changes in the Financial System, Special Statistics, 38, Economic& Political Weekly March, 19 and RBI’s Basis Statistical Returns
Table 8 Regional Share of Bank Office vis-à-vis Bank Deposit in Total(per cent to All India)
* Refers to 1980 **Refers to 1995Source: Compiled from RBI’s Basic Statistical Returns and EPWRF (2005).
Chart 5: Regionwise Share of Office & Deposit of Commercial Banks in India
0
5
10
15
20
25
30
35
Northern North-eastern Eastern Central Western Southern
Regions
Per
cen
t
Mar-02 Office Mar-02 Deposit
Mar-92 Office Mar-92 Deposit
Dec-82 Off ice* Dec-82 Deposit
(p )
D ep o s its
R e g io n s /Y e a r M a r-0 3 M a r-0 2 M ar -9 6 M a r-9 2 D e c-8 2 D ec -72
N o rth ern 2 3 .0 2 2 .9 22 .2 2 0 .7 21 .3 1 8 .3
N o rth -e a s te rn 1 .6 1 .6 1 .6 1 .6 1 .5 1 .2
E as te rn 1 2 .4 1 2 .9 13 .0 1 4 .5 16 .7 1 9 .1
C e n tra l 1 3 .6 1 3 .6 13 .5 1 3 .4 13 .7 1 1 .5
W es te rn 2 6 .2 2 6 .4 27 .2 2 8 .9 25 .4 3 1 .9
S ou th ern 2 3 .2 2 2 .6 22 .4 2 0 .9 21 .4 1 8 .1
A ll - In d ia 1 00 .0 10 0 .0 1 00 .0 1 00 .0 1 0 0 .0 1 0 0 .0
Year Mar-03 Mar-96 Mar-92 Dec-82
Region Office Deposit Office** Deposit Office Deposit Office* Deposit
Northern 16.3 23.0 15.4 22.2 15.3 20.7 16.7 21.3
North-eastern 2.8 1.6 3.0 1.6 3.1 1.6 2.2 1.5
Eastern 17.6 12.4 18.2 13.0 18.4 14.5 14.7 16.7
Central 20.2 13.6 20.8 13.5 21.1 13.4 17.2 13.7
Western 15.6 26.2 15.4 27.2 15.4 28.9 17.9 25.4
Southern 27.6 23.2 27.1 22.4 26.8 20.9 31.3 21.4
All – India 100.0 100.0 100.0 100.0 100.0 100.0 100.0 100.0

External Assistance For Health Sector : 19Societal Goals of Commercial Banks in India: Promise and Reality
be partly due to low level of inflation duringthe 1990s as compared to 1980s. Further, afall in interest rate on deposits and slowgrowth in office might have affected itsgrowth in the recent past. With the emergenceof declining trend in rate of interest on demandand term deposits (from the closing years ofthe previous decade) the people in generalmight have diversified the pattern of savingand investment. The interest rate on NationalSavings Certificate declined from 12 per centin 1996 to 8 per cent in 2003. For instance,interest rate for one-year bank deposit fellfrom 11 per cent in 1996 to 5 per cent in 2004with marginal improvement in the current year(5.5 to 6 per cent).14 The risk lovers may optfor mutual fund and investment in variousshares while the risk averse may go for postoffice savings as the later offers relativelyhigh interest rate to along with income taxbenefit. Besides, people in the unbanked areas
14The interest rate on National Savings Certificate declined from 12 per cent in 1996 to 8 per cent in 2003.The interest rate on Public Provident fund also steadily fell from 12 per cent in 1999 to 8 per cent in 2003.Interest rate on post office saving deposit also declined from 5.5 during the second half of the 1990s to3.5 per cent in recent years.
and rural area may opt for savings in postoffice.
3.2.3 Urban Centric Banking and Mobilization of Deposit
The tempo of deposit growth hasbeen improved during the reforms perioddespite fall in interest rate on term depositsfrom 11.1 per cent in 1998 to 8 per cent inMarch 2003. ‘The public sector image of thebanking system, combined with the absenceof effective social security system for thepopulace, and fluctuating nature of investmentopportunities in the capital market, has retainedthe attractive nature of bank deposits even atlonger maturity levels (EPWRF,2005)’.Nevertheless, the growth of depositin reforms period is not quite encouraging inthe rural area (table 2). Banking statisticsreveal that annual average compound growthof deposit for the economy as a whole was
Chart 6: Deposit of SCBs as Percentage of National Income
(current price)
0
10
20
30
40
50
60
1969 1975 1980 1985 1990 1992 1995 2000 2001 2002 2003Year
Pe
r c
en
t
Deposit-to-National Income Ratio

20 CMDR Monograph Series No. - 49
close to 8 per cent during the pre-reformsperiod, it went up to marginally higher than10 per cent during reforms period. Animprovement in growth is noticed acrosspopulation groups barring Rural area wherethe growth rate declined by 0.8 percentagepoints during the said period.
A considerable increase in per capitadeposit and credit as noticed over the yearssuggest an improvement in average businessper bank branch and likely to have improvedthe viability of individual bank branchesincluding those in rural and semi-urbanbranches (Mohan, 2004). But one should notbe carried away with this observation as it ispartly on account of growth of deposits andoffices in the metropolitan area; not in therural area (chart 1). The pattern of deposit ofSCBs also reflect a similar trend aspercentage share of metropolitan area in totaldeposits of all the SCBs taken together wentup since mid-80s and especially during theearly 1990s (chart 7). Contrary to it, share ofsemi-urban, urban area followed by rural areasuffered a setback during the above saidperiod.
3.3.1 Status of Rural Credit in Aggregate Disbursement
The growth and development of aneconomy is determined by the availability ofcredit from institutional sources. But meregrowth in allocation of credit can notnecessarily offset the persisting regionaldisparities in levels of development. In theallocation of credit there is a need to identifycredit needs of backward regions and variousemployment generating sectors especiallyagriculture.
An improvement in growth of creditfrom close to 8 per cent in the pre-reformsperiod to 10.5 per cent in the reforms periodhas been noticed for the economy as a whole(table 2). This phenomenon can be partlyattributed to substantial growth of credit inthe Metropolitan area as annual averagecompound growth of credit in Metropolitanarea went up by 6 percentage points duringthe reforms period as compared to pre-reforms period. At the other end, there hasbeen decline in growth of credit for otherpopulation groups barring Rural area which
Chart 7: Pattern of Aggregate Deposits of Scheduled Commercial Banks
0
5
10
15
20
25
30
35
40
45
50
De
c -6
9
De
c-7
1
De
c-7
3
De
c-7
5
De
c -7
7
De
c-7
9
De
c-8
1
De
c -8
3
De
c-8
5
De
c-8
7
De
c-8
9
Ma
r -9
1
Ma
r-9
3
Ma
r-9
5
Ma
r-9
7
Ma
r-9
9
Ma
r-0
1
Se
pt
200
2
Se
pt
200
3
Year
Pe
r c
en
t
Deposits in Rural Area as %
of TotalDeposits in Semi-Urban area
as % of Total Deposits in Urban area as %
of totalDeposits in Metropolitan as
% of Total

External Assistance For Health Sector : 21Societal Goals of Commercial Banks in India: Promise and Reality
witnessed a marginal growth of 0.4 per centduring the said period (chart 8). A highergrowth in credit for metropolitan area during1992-2003 is noticed despite a general declinein the share of loans and advances in totalcredit.
The allocation of credit to variousregions (developed vis-à-vis underdeveloped)and for different sectors has also undergonea change during the last few decades (tables9). Of late, around 82 per cent of total creditis disbursed in three relatively developedregions, namely, Western (36 per cent),Southern (26 per cent) and Northern (22 percent) regions and the remaining 18 per centis sanctioned in other three relativelybackward regions (Eastern, Central andNorth-Eastern). The persistence of disparitiesis evident from the fact that less than 1 percent of total credit is disbursed in North-Eastern region while it is as high as 36 percent in the Western region. Second, the shareof above said developed regions (Western,Southern and Northern regions) together alsowitnessed a rising trend as it went up from
about 75 per cent during the early 1970s and1980s to 82 per cent in recent years implyingpositive correlation between level ofdevelopment and disbursement of credit.Third, share of credit sanctioned acrossregions also witnessed a change duringreforms period. To be specific share of creditdisbursed in western region alone witnesseda steady rise from 29 per cent in 1992 to about36 per cent in recent years. While it hasdeclined in three backward regions during thereforms period.
3.3.2 Migration of CreditCredit sanctioned in a region may not
necessarily reflect the same amount has beenutilized in that region as emergence ofmismatch between credit sanctioned andutilization can not be ruled out partly becauseof credit migration. In this aspect thebackward regions relatively enjoyedimprovement as compared to other regions.In contrast, the extent of credit utilized inWestern region is much less than that ofcredit sanctioned, implying out-migration ofcredit to other regions. But it is surprising to
Chart 8:Disbursement of Credit by Scheduled Commercial Banks
Across Population Group (in per cent)
0
10
20
30
40
50
60
70
Dec-
69
Dec-
72
Dec-
75
Dec-
78
Dec-
81
Dec-
84
Dec-
87
Mar-
90
Mar-
93
Mar-
96
Mar-
99
Mar-
02
Sept
2003
Year
Per
cen
t
Proportion of Total Credit
Disbused in Rural Area
Credit Disbursed in Semi-
urban area as % of Total
Credit Disbursed in Urban
area as % of Total

22 CMDR Monograph Series No. - 49
learn that credit utilized in southern region ishigher than credit sanctioned in this region.
As regards migration of credit acrosspopulation groups, it is noticed that rural sectorenjoyed migration of credit from other areas.Normally it is of the order of above 30 percent (EPWRF, 2005). But it is interesting tonote that average level of in-migration of loansto rural area which hovered around Rs 5 lakhtill March 1998 went up around Rs 30 lakh inthe recent past. Therefore, it needs closescrutiny.
3.3.3 Pattern of Priority Sector Lending: Is it Growth Compressing?
A substantial improvement in growthof credit does not necessarily ensureachievement of higher growth with equity. Thepattern of allocation of credit especially forpriority sector can to some extent determine
Table 9: Regional Share of Credit (As per Sanction & Utilization)(in per cent)
3-Mar 2-Mar Mar-96 Mar-92 Dec-82 Dec-72
Northern 21.8 22 19.1 18.4 22.2 13.1
North-eastern 0.7 0.8 1 1.3 0.9 0.6
Eastern 8.5 8.3 10.2 12.4 14 18.1
Central 7.7 7.9 9 11.1 9.8 6.8
Western 35.5 36 32.8 29.1 27.9 36.6
Southern 25.8 25 27.8 27.7 25.3 24.8
All - India 100 100 100 100 100 100
Northern 21.6 21.5 18.7 17.7 21.5 12.8
North-eastern 1.3 1.5 1.1 1.9 1.3 1.2
Eastern 9.2 9.2 10.1 12.3 13.7 18
Central 8.9 8.9 9.5 11.7 10.3 7.7
Western 31.4 32.2 32.5 28.3 27.6 34.4
Southern 27.7 26.6 28.1 28.1 25.6 25.8
All - India 100 100 100 100 100 100
Credit (As Per Sanction)
Credit (As Per Sanction)
Source: EPWRF(2005): Metamorphic changes in the Financial System, Special Statistics,38, Economic & Political Weekly March, 19
the level of growth and development of aneconomy. In this context, it needs to bespecified that Scheduled Commercial Banksexcluding the Regional Rural Banks aresupposed to earmark 40 per cent of net bankcredit for priority sector. Out of the 40 percent net bank credit, allocation for agriculturesector alone, under direct and indirect lending,has to be 18 per cent. To avoid dilution ofdirect credit to agriculture, indirect credit cannot exceed one-fourth of the 18 per centtarget, i.e., 4.5 per cent.
The growth of financial savings andfulfillment of the credit requirements of theborrowers especially in agriculture and small-scale industry were fulfilled to a large extentduring the pre-reforms period. This isreflected by share of priority sector lendingin non-food credit which went up by 22percentage points (from 15 per cent to 37

External Assistance For Health Sector : 23Societal Goals of Commercial Banks in India: Promise and Reality
per cent) in about a decade (1969-1980) withfurther marginal rise to 39 per cent in 1991.The priority sector advances in total non-foodcredit has declined from 39 per cent in 1990to 33.7 per cent in 2003.
In the allocation of credit, bothagriculture and SSI suffered a setback duringthe reforms period. The share of agriculturein total credit has been declining and it droppedfrom about 16 per cent of total in 1980 toclose to 10 per cent in 2002 (table 10). Infact, the target for agriculture was introducedin 1989 and was supposed to be met byMarch 1990 but later on it got extended toMarch 2003. Despite abnormal delay inmeeting the target, few commercial bankshave been able to fulfill it. Undoubtedly,commercial banks agricultural advancesoutstanding grew nearly four fold (Rs 22,000crore to Rs 85,000 crore) over the last decadebut only 5 Public Sector Banks (PSBs) and 2private sector banks met the target ofextending 18 per cent of net credit outstandingto agriculture in March 2003 while theremaining 22 PSBs and 27 private sectorbanks remained off the target (Vyas, 2004).
The high risk of NPA in agriculturecan be one of the factors that discourage lend-ing to farm sector (table 11). For instance,NPAs of PSBs emerged from priority sector(14.2 per cent) is much higher than that ofnon-priority sector (9.4) in 2001-03. In prior-ity sector, the risk of NPA is relatively high inSSI followed by Agriculture and other sec-tors. In contrast, for the private sector banks,NPAs generated in non-priority sectoroutweighes the priority sector in 2001-03.Overall, the performance of the private sec-tor is relatively better as compared to the
PSBs in Non-Performing Assets. But theperformance of the private sector banks needsto be examined in the light of resources allo-cated for this sector.
A sharp decline in disbursement ofcredit to agriculture can be on account ofacceleration in growth of service sectorduring the reforms period. As such, thecommercial banks have been diversifying theiractivities from traditional banking to retailbanking so as to improve the profit margin.In recent years, a relatively large share ofcredit has been allocated in favor of personalloans. At the other end, low interest earningsfrom small loan accounts and farm loans,combined with relatively high servicing cost,have left no incentives for banks to prefersuch lending in an environment of businessfreedom and competition (Shetty 2004).Overall, to compete with the private sectorand foreign banks PSBs have to explore theavenues to park the fund so as to improvethe bottom line. In this contest, it can beargued that an economy can not afford toignore priority sector especially agriculturewhich remained the major source of incomefor a large chunk of population? The RBI andgovernment of India need to find out waysout to reduce the level of NPAs in agriculture.
To sustain higher growth in credit tofarm sector there is also a need to improvedemand for it. The demand for credit isdetermined by several factors. In this context,it is difficult to rule out that decline in shareof agriculture in GDP along with persistenceof unstable and slow growth in agricultureduring the 1990s is partly on account oferosion in capital formation in agriculture.Unless improvement in allocation of resources

24 CMDR Monograph Series No. - 49
Table 10: Distribution of SCB’s Credit (Amount Outstanding) according to Occupation(In percentage)
Notes (i): The amount outstanding figurers shown against each year represent the month March.(ii) Figures for professional services and other services include personal loan for 1990 and1996. Therefore the aggregate figures do not match with the sum of all the constituents.
Source: EPWRF (2004)
for infrastructure development in agricultureespecially for irrigation system anddevelopment of connecting roads is ensuredit can be difficult to improve the demand forcredit. Assured irrigation system can motivatethe farmers to shift from traditional tocommercial agriculture, introduce changes incropping pattern and rotation of crops. This,in turn, can ensure improvement in demandfor credit. No doubt, in the present contestthe role of output market can not be ignoredas price of output and extent of procurementby the government decide the level ofproduction else distress sale can be a normalphenomenon.
At the other end mere supply ofcredit does not necessarily ensureimprovement in demand by the borrowers astimeliness and adequacy of credit, cost ofavailing the credit, prevailing rate of interestand cost effective lending procedures aresome of the issues need to be emphasized.The attitude of the bankers towards prioritysector lending especially to agriculture needsto be changed. The SCBs should realize thatthere is hardly any better avenue of retailbanking than agriculture in India (Vyas, 2004).There is tremendous scope for creditexpansion in the productive sector and itneeds the adoption of risk management policyrather than risk aversion.
Sl.No. Occupation 1980 1990 1996 2001 2002 2003
I Agriculture (Direct and Indirect) 15.7 15.9 11.3 9.6 9.8 10.0
II Industry 48.8 48.7 48.0 43.9 41.4 41.0
III Transport Operations 4.6 3.2 1.8 1.6 1.4 1.2
IV Professional and Other Services 2.2 9.4 12.8 3.6 4.2 4.5
V Personal Loans NA 6.4 9.3 12.2 12.6 15.1
(a) Lonas for purchase of consumer durables NA 0.4 0.3 0.6 0.5 0.4
(b) Loans for Housing NA 2.4 2.8 4.7 5.0 6.5
(.C) Rest of persnal loans NA 3.6 6.1 6.9 7.1 8.2
VI Trade 19.7 13.9 13.9 16.6 15.4 13.8
VII Financial Institutions 3.4 2.1 3.5 4.9 5.7 6.7
VIII Miscellaneous 5.6 6.8 8.6 7.5 9.5 7.7
IX Total Bank Credit 100.0 100.0 100.0 100.0 100.0 100.0
of which:
(i) Artisans and Village Industries NA 0.9 0.6 0.4 0.9 0.7
(ii) Other Small Scale Industries 1.2 11.5 10.1 6.9 4.9 5.0

External Assistance For Health Sector : 25Societal Goals of Commercial Banks in India: Promise and Reality
Table 11 : Non-Performing Assets Across Bank Groups and Sectors, 2001-03 (Amount in Rupees crore)
Source: Mohan (2004b): RBI Bulletin, November.
Note: NPAs and outstanding advances as on March 31, Avg.: Average
As agriculture is still considered asgamble in monsoon, introduction of crop in-surance scheme can to some extent addressthis problem. Concomitantly, by providingmore teeth to the legal system so as to en-sure easy recovery of loans by the bankers;an improvement in allocation of credit foragriculture can not be ruled out.
To reduce level of NPAs, integrationof credit and output market may be a fea-sible option. The provision of credit along withintroduction of government purchase of hor-ticulture product from the farmers need to beexplored and it is likely to reduce the debtburden of the latter. Overall, it is high timefor the RBI and policy makers to address theissues discussed above and credit needs tobe integrated with production and marketing.
3.4.1 Credit-Deposit Ratio of Commercial Banks
The aggregate credit orientation ofthe commercial banks gets reflected byCredit-Deposit (CD) ratio. It intents tocapture the extent of resources allocated in
the form of credit as proportion of total depositin a specific region. To ensure developmentof rural areas, the bankers have to stick tothe norm specified by the RBI, i.e., CD ratioof 60 per cent needs to be maintained in therural and semi-urban area.
Over the years a consistent rise innominal per capita deposit and credit has beennoticed (chart 8). The growth of the saidindicators seems to have been acceleratedsince the second half of the 1990s. But it issurprising to note that the gap between percapita deposit and credit got widened overthe said period, implying a decline in CD ratioduring the reforms period.
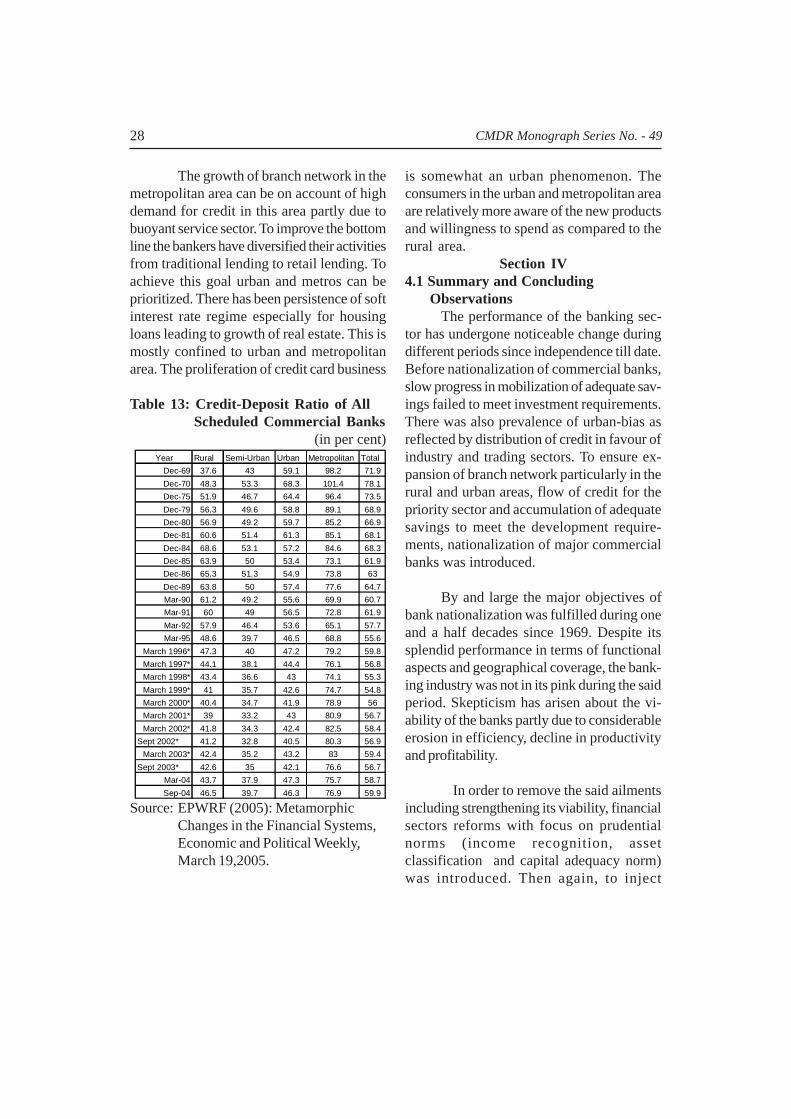
From table 13 it is evident that CDratio dropped from 78 per cent in 1970 to 67percent in 1980 with further decline to about61 per cent in 1990. There has been a declinein CD ratio during the reforms period as itremained in the range of 55-59 per cent, butthe extent of decline is not so pronounced ascompared to the pre-reforms period (chart8).
Agriculture SSIs Others Total Priority Non-Priority Sectors Bank Groups Sector Sector
Public Sector Banks 7,635 10,362 6,748 24,745 28,764
Avg. Non-Performing Assets
Avg. NPA to Avg. outstanding
Advances (in per cent) 12.0 20.6 12.2 14.2 9.4
Private Sector Banks 433 1,249 593 2,275 9,271
Avg. Non-Performing Assets
Avg. NPA to Avg. outstanding
Advances (in per cent) 5.1 15.9 5.3 8.1 10.2

26 CMDR Monograph Series No. - 49
3.4.2 Regional Variation in Credit- Deposit Relationship
To ensure steady growth in incomeand achieve overall development, aproportionately higher CD ratio needs to bemaintained in the backward regions. Bankingstatistics reveal that CD ratio in the countryhas been declining since 1980 (from 67 percent in 1982 to 58 per cent in 1992 andremained almost the same in recent years).Across the regions, CD ratio as per sanctionis very high in the Western Region (81 percent) while it is as low as 27 per cent in theNorth-Eastern Region in 2003. In other words,around 81 per cent of the deposit is providedin the form of credit in the Western regionwhile it is about one –fourth in the North-Eastern region.
It is mentioned that CD ratio as perutilization can be a better indicator incomparison to CD ratio as per sanction. Thedifference between the two can track thedirection and extent of migration over time.
In this aspect the underdeveloped regionshave enjoyed considerable improvement sincethe nationalization of commercial banks. Fromtable 12 it is evident that relatively moreresources have been flowing to some of thebackward regions especially to the North-Eastern region where the extent of differencebetween sanction and utilization is very high(28 percentage points) in 2003. The flow ofresource is from some of the developedregions especially from the Western region.But it is surprising to learn that utilizationoutweighed sanction with a high margin inthe moderately developed southern region andthe extent of difference is very high in recentyears. This calls for close scrutiny.
3.4.3 Credit Deposit Ratio Across Population Groups
The credit-deposit relationship acrosspopulation groups indicates distinct changesover the years. From table 13 it is discernablethat CD ratio declined for all population groupsbarring Metropolitan area during the reformsperiod.
Chart 8: Per Capita Deposit & Credit of SCBs
0
1000
2000
3000
4000
5000
6000
7000
8000
9000
10000
11000
12000
13000
1969 1975 1980 1985 1990 1992 1995 2000 2001 2002 2003Y ear
Per Capita Credit of SCBs
Per Capita Deposit of SCBs

External Assistance For Health Sector : 27Societal Goals of Commercial Banks in India: Promise and Reality
The extent of decline is distinct in ruralarea- showing a fall by 18 percentage points(from 60 per cent in 1991 to 42 per cent in2003) during the reforms period. This is incontrast to the RBI norm of maintaining 60per cent CD ratio in the Rural areas. Even insemi-urban and urban areas the extent of fallis around 14 percentage points during thereforms period though the ratio went up byabout 10 percentage points during the saidperiod for metropolitan area (from 73 per centin 1991 to as high as 83 per cent in March2003).
Despite an erosion in CD ratio in therural area net migration of credit to this areais much higher (around 30 per cent) ascompared to other population groups (semi-urban and urban area). In contrast, there hasbeen net out-migration of credit from themetropolitan area during the said period.Nevertheless, CD ratio as per utilization isstill higher in Metropolitan area as comparedto the rural, semi-urban and urban area. Forinstance, in recent years CD ratio as perutilization (amount outstanding) remainedbetween 70-75 per cent in Metropolitan areawhile it is lying between 50-60 per cent forrural area, hovers around 40 per cent for semi-urban area and confined within the range of40-50 per cent for the urban area. The
persistence of CD ratio in rural areas indicatethat rural areas provide resources more thanwhat it receives in the form of credit. It impliesnet siphoning of savings from the country sideto other developed centres (urban andmetros).
The persistence of branch expansionin the metropolitan area along with highergrowth in deposit, credit and CD ratio in thesaid population group can be explained byconsidering some of the issues discussed be-low. As mentioned since 1995, expansion ofbranch network became the responsibility ofthe bank board and therefore, growth ofbranch expansion in the metropolitan area cannot be an abnormal phenomenon. The bank-ers might not be keen to allocate more re-sources for agriculture partly because of highlevel of NPA in agricultural lending as com-pared to lending for other sectors. Added tothis, a majority of the farmers and small ac-count holders became defaulters due to genu-ine or political reason and this, in turn, de-prived them to have access to fresh loans.The persistence of slow and unstable growthin agriculture and decline in its share to 23per cent of GDP can be some of the issuesthat might have motivated the PSBs not toallocate more funds for agriculture.
Source: EPWRF(2005): Metamorphic changes in the Financial System, Special Statistics, 38, Economic & Political Weekly March, 19.
Table 12: Credit-Deposit Ratio of Commercial Banks Across Regions in India(In Per cent)
( p )
D ec-72 Dec-82
M arch-92
M arch-96
M arch-02
M arch-03
Regions S anction U tiliza tion Sanction Utilization Sanction U tilization Sanction U tiliza tion S anction Utilization Sanction Utilization
Northern 47 .6 46.6 70 .0 67 .7 51.1 49 .3 51.4 50.4 56 .2 55.0 56 .0 55.5
North-eastern 36 .3 71.4 41 .2 57 .5 46.7 66 .3 35.5 41.1 27 .2 53.2 27 .4 48.2
E aste rn 62 .9 62.6 56 .1 55 .2 49.5 49 .1 47.0 46.4 37 .6 41.4 39 .6 42.8
Central 39 .1 44.4 47 .8 50 .6 47.6 50 .2 40.0 42.0 33 .9 38.4 33 .3 38.6
W estern 76 .2 71.8 73 .7 73 .0 58.2 56 .5 72.2 71.4 79 .7 71.3 81 .0 71.5
S ou thern 91 .1 94.7 79 .2 80 .2 76.5 77 .7 74.2 74.8 64 .6 68.9 66 .3 71.2
All - India 66 .4 66.4 67 .1 67 .1 57.7 57 .7 59.8 59.8 58 .4 58.4 59 .2 59.2
28 CMDR Monograph Series No. - 49
The growth of branch network in themetropolitan area can be on account of highdemand for credit in this area partly due tobuoyant service sector. To improve the bottomline the bankers have diversified their activitiesfrom traditional lending to retail lending. Toachieve this goal urban and metros can beprioritized. There has been persistence of softinterest rate regime especially for housingloans leading to growth of real estate. This ismostly confined to urban and metropolitanarea. The proliferation of credit card business
Table 13: Credit-Deposit Ratio of All Scheduled Commercial Banks
(in per cent)
Source: EPWRF (2005): MetamorphicChanges in the Financial Systems,Economic and Political Weekly,March 19,2005.
is somewhat an urban phenomenon. Theconsumers in the urban and metropolitan areaare relatively more aware of the new productsand willingness to spend as compared to therural area.
Section IV4.1 Summary and Concluding Observations
The performance of the banking sec-tor has undergone noticeable change duringdifferent periods since independence till date.Before nationalization of commercial banks,slow progress in mobilization of adequate sav-ings failed to meet investment requirements.There was also prevalence of urban-bias asreflected by distribution of credit in favour ofindustry and trading sectors. To ensure ex-pansion of branch network particularly in therural and urban areas, flow of credit for thepriority sector and accumulation of adequatesavings to meet the development require-ments, nationalization of major commercialbanks was introduced.
By and large the major objectives ofbank nationalization was fulfilled during oneand a half decades since 1969. Despite itssplendid performance in terms of functionalaspects and geographical coverage, the bank-ing industry was not in its pink during the saidperiod. Skepticism has arisen about the vi-ability of the banks partly due to considerableerosion in efficiency, decline in productivityand profitability.
In order to remove the said ailmentsincluding strengthening its viability, financialsectors reforms with focus on prudentialnorms (income recognition, assetclassification and capital adequacy norm)was introduced. Then again, to inject
Year Rural Semi-Urban Urban Metropolitan Total
Dec-69 37.6 43 59.1 98.2 71.9
Dec-70 48.3 53.3 68.3 101.4 78.1
Dec-75 51.9 46.7 64.4 96.4 73.5
Dec-79 56.3 49.6 58.8 89.1 68.9
Dec-80 56.9 49.2 59.7 85.2 66.9
Dec-81 60.6 51.4 61.3 85.1 68.1
Dec-84 68.6 53.1 57.2 84.6 68.3
Dec-85 63.9 50 53.4 73.1 61.9
Dec-86 65.3 51.3 54.9 73.8 63
Dec-89 63.8 50 57.4 77.6 64.7
Mar-90 61.2 49.2 55.6 69.9 60.7
Mar-91 60 49 56.5 72.8 61.9
Mar-92 57.9 46.4 53.6 65.1 57.7
Mar-95 48.6 39.7 46.5 68.8 55.6
March 1996* 47.3 40 47.2 79.2 59.8
March 1997* 44.1 38.1 44.4 76.1 56.8
March 1998* 43.4 36.6 43 74.1 55.3
March 1999* 41 35.7 42.6 74.7 54.8
March 2000* 40.4 34.7 41.9 78.9 56
March 2001* 39 33.2 43 80.9 56.7
March 2002* 41.8 34.3 42.4 82.5 58.4
Sept 2002* 41.2 32.8 40.5 80.3 56.9
March 2003* 42.4 35.2 43.2 83 59.4
Sept 2003* 42.6 35 42.1 76.6 56.7
Mar-04 43.7 37.9 47.3 75.7 58.7
Sep-04 46.5 39.7 46.3 76.9 59.9
External Assistance For Health Sector : 29Societal Goals of Commercial Banks in India: Promise and Reality
competitiveness in the banking industry,private sector banks have been allowed toenter the industry. The outcome of it isreflected by the achievement of the industryin cleaning the balance sheet. Nevertheless,the performance of the banking sector inachieving societal goals does not seem to bequite promising during the reforms period.
As specified, no reform is successfulunless it ensures equity in distribution. Therehas been considerable overall growth ofdeposit and credit during the reforms periodbut it is mostly confined to the metropolitanarea, implying emergence of urban centricgrowth. Based on credit sanctioned, there hasbeen erosion in CD ratio for the rural areaduring the said period but it has been arrestedto a large extent by in-migration of credit torural areas thereby improving CD ratio as perutilization.
A disaggregation of credit allocatedto various sectors reveals inadequate weightassigned to the priority sector including
agriculture during the said period. In theabsence of requisite support for agricultureand allied areas from the financial system,the economy can hardly sustain highergrowth, eradicate poverty throughimprovement in growth of employment andsmoothen regional disparity. The recent TenthPlan Mid-Term Appraisal also indicates anerosion in growth of agriculture from 3.2 percent that it had notched up during 1980/81-1995/96 to 1.9 per cent in the subsequentperiods, implying decline in productivitygrowth. Therefore, it is quite difficult to acceptthat 1.9 per cent growth can support morethan 60 per cent of total population living inrural area. Needless to say, to sustain overallhigher growth in an economy with equityleading to rural area and agriculture can notbe looked down upon. At the other end meresupply of bank credit to agriculture can notnecessarily ensure improvement in effectivedemand unless development of infrastructurein agriculture is prioritized and the price policyis based on functioning of the agrarianmarkets.

30 CMDR Monograph Series No. - 49
References
Agarwala, R N (1996): Financial Liberalisation in India, A study of Banking System and Stock
Markets, B R Publishing Corporation, Delhi.
Dhingara. I.C (2000): The Indian Economy, Sultan chanda & sons, New Delhi
EPWRF (2005): ‘Metamorphic Changes in the Financial System, Special Statistics-38’, Economic and
Political Weekly, March 19.
EPWRF (2004): ‘Scheduled Commercial Banks in India: A 30-Year Data Base’, Economic and Political
Weekly, March 20.
Garg, Subhash (1994): Social Banking, Arihant Publishing House, Jaipur.
Jadav, N and D Ajit (1996-97): ‘ The Role of Banks in Economic Development of India’, Prajnan, Vol.
XXV, Nos. 3-4, 310.
Louis, I J H(197-98): ‘Commercial Banks as Multiproduct Firms: Relevance for Asset-Liability
Management in Banks: A Theoretical Model and Empirical Results’, Prajnan, Vol. XXVI, No.1
Mohan, Rakesh (2004): ‘Financial Sector Reforms in India: Policies and Performance Analysis’, Reserve
Bank of India Bulletin, October
Mujumdar, N A (1998): ‘Banking Sector Reforms: Second Coming’, Economic and Political Weekly,
November 21.
Narasimham, M (1991): Report of the Committee on the Financial System, Ministry of Finance,
Government of India, New Delhi, November.
Ojha, P. D. (1987): ‘Banking and Economic Development in India: Problems and Prospects’, Reserve Bank
of India Bulletin, January.
Ramasastri, A. S., Achamma Samuel and S Gangadaran (2004): “Income stability of the Scheduled
Commercial Banks”, Economic and Political Weekly, vol. xxxix, No.12.
Rangarajan C (1994): ‘Indian Financial System: The Emerging Horizon’, Reserve Bank of India Bulletin,
PP.747-58
Rangarajan, C (1989): ‘Banking Developments Since 1947: Achievements and Challenges’, Reserve Bank
of India Bulletin, January.
RBI (2004): Reserve Bank of India Bulletin, October and November
Shetty, S.L. (2004): Distributional Issues in Bank Credit: Multi-Pronged Strategy for Correcting Past
Neglect, Economic and Political Weekly, Vol.39, No.29, July 17.
Shetty, S L (1996): Financial Sector Reforms in India: An Evaluation, Prajnan, October-Dec 1996 and
January-March 1997, Vol XXV and Nos 3 & 4.
Shetty, S.L. (1978): ‘Performance of Commercial Banks Since Nationalization of Major Banks; Promise
and Reality’, Economic and Political Weekly, August.
Venkitaramanan, S. (2004): ‘Agricultural Credit: Case for Mitigating Lending Risks’, Business Line, Dec.
Vyas, V S (2004): Report of the Advisory Committee on Flow of Credit to Agriculture and Related
Activities From the Banking System, Reserve Bank of India, June.
External Assistance For Health Sector : 31Societal Goals of Commercial Banks in India: Promise and Reality
PREFACE
Centre for Multi-disciplinary Development Research (CMDR) is one of the Social
Science Research Institutes located in a moffusil area of Karnataka. The institute is recognized
by the Indian Council of Social Science Research (ICSSR), Government of India. Since its
inception till date the Centre aimed at undertaking analytical studies of conceptual and policy
significance on the socio-economic and cultural issues using multi-disciplinary perspectives.
As a part of publication programme, the Centre has initiated CMDR Monograph
Series, consisting of both invited contributions and the research studies undertaken at the
Centre.We are happy to present Monograph No.49 with the title “Societal Goals of Commercial
Banks in India: Promise and Reality” authored by Dr.Mihir Kumar Mahapatra, Associate
Fellow, CMDR.
The present monograph deals with overall progress and achievement of commercial
banks with focus on societal goals during the periods prior to financial sector reforms and
afterwards. By and large, the major objectives of bank nationalization were fulfilled during
one and a half decades since nationalization of commercial banks. In contrast, the banking
industry was not in its pink during the said period. To strengthen its viability, financial sector
reforms with focus on prudential norms were introduced based on the M.Narasimham’s
Committee Report. Over the years, banking industry succeeded to a large extent in cleaning
its balance sheet but its performance in fulfilling societal goals is not quite promising during
the reforms period.
We acknowledge with gratitude for the financial support provided by Canara Bank,
Bangalore to carry out research work in banking and development at the Centre.
16-08-2005 Dr.Sailabala Debi
Joint Director, CMDR

32 CMDR Monograph Series No. - 49
Societal Goals of Commercial Banks in India
Abstract
The paper made an attempt to capture progress and achievements of commercial banks
in India during pre-reforms and reforms periods with focus on societal goals. Some of the
major objectives of bank nationalization were fulfilled to a large extent during the period prior
to financial sector reforms. Despite encouraging performance in functional aspects and geo-
graphical coverage, the banking industry was not in its pink during the said period partly on
account of erosion in efficiency, decline in productivity and profitability. To remove the said
ailments and strengthen viability, reforms in the banking sector were introduced during the
early 1990s. The outcome is reflected by the industry’s achievement in cleaning the balance
sheet.
In social aspect of banking the performance of the industry does not seem to be quite
promising during the reforms period. There has been improvement in mobilization of deposit
and allocation of credit but this is mostly confined to the urban centres. Concomitantly, rural
area witnessed sharp decline in office and Credit-Deposit ratio (CD) though the declining
trend in CD ratio has been arrested to some extent due to in-migration of credit.
A disaggregation of credit allocated to various sectors reveals inadequate weight
assigned to the priority sector including agriculture during the reforms period. In this context,
the recent Tenth Plan Mid-Term Appraisal also indicated erosion in growth of agriculture
from 3.2 per cent noticed during 1980-81 to 1995-96 to 1.9 per cent in the subsequent period.
For the present, the major cause for concern is ‘how 1.9 per cent growth can support around
60 per cent of the total population living in rural area?’ Overall, skepticism has arisen about
sustaining higher growth, eradication of poverty through improvement in growth of employ-
ment and smoothening of regional disparity.
Key words: Social aspect in banking, priority sector lending and CD ratio
JEL Code: G 21

External Assistance For Health Sector : 33Societal Goals of Commercial Banks in India: Promise and Reality

34 CMDR Monograph Series No. - 49
Monograph Series: No. 49August: 2005
Publication Unit:Centre for Multi -DisciplinaryDevelopment Research (CMDR),Alur Venkat Rao Circle, D.B. Rodda Road,Dharwad - 580001Karnataka, INDIAPh: 0091-836-2447639Fax: 0091-836-2447627Email: [email protected]: http // www.cmdr.co.in