Cloning, Expression and Characterisation of Novel Chicken Egg Yolk...
173
Cloning, Expression and Characterisation of Novel Chicken Egg Yolk Allergens by Sarukkalige Chamika De Silva B. Biomed (Hons) Submitted in fulfilment of the requirements for the degree of Doctor of Philosophy Deakin University December, 2016
Transcript of Cloning, Expression and Characterisation of Novel Chicken Egg Yolk...

Cloning, Expression and Characterisation of Novel Chicken Egg Yolk Allergens
by
Sarukkalige Chamika De Silva B. Biomed (Hons)
Submitted in fulfilment of the requirements for the degree of
Doctor of Philosophy
Deakin University
December, 2016

DEAKIN UNIVERSITY
CANDIDATE DECLARATION
I certify the following about the thesis entitled ‘Cloning, Expression and Characterization of Novel Chicken Egg Yolk Allergens’ submitted for the degree of Doctor of Philosophy
a. I am the creator of all or part of the whole work(s) (including content and layout)
and that where reference is made to the work of others, due acknowledgment is given.
b. The work(s) are not in any way a violation or infringement of any copyright, trademark, patent, or other rights whatsoever of any person.
c. That if the work(s) have been commissioned, sponsored or supported by any organisation, I have fulfilled all of the obligations required by such contract or agreement.
d. That any material in the thesis which has been accepted for a degree or diploma by any university or institution is identified in the text.
e. All research integrity requirements have been complied with.
'I certify that I am the student named below and that the information provided in the form is correct'
Full Name: SARUKKALIGE CHAMIKA DE SILVA
Signed:
Date: 24th December 2016

DEAKIN UNIVERSITY ACCESS TO THESIS - A
I am the author of the thesis entitled ‘Cloning, Expression and Characterization of Novel Chicken Egg Yolk Allergens’ submitted for the degree of Doctor of Philosophy
This thesis may be made available for consultation, loan and limited copying in accordance with the Copyright Act 1968.
'I certify that I am the student named below and that the information provided in the form is correct'
Full Name: SARUKKALIGE CHAMIKA DE SILVA
Signed:
Date: 24th December 2016


Acknowledgements
This project would not have been possible without the guidance and support of
several individuals who in many ways provided their assistance in the preparation
and completion of this study. First and foremost, I would like to thank my supervisor
Associate Professor Cenk Suphioglu for giving me the opportunity to carry out this
PhD project and providing valuable guidance throughout the research. Thank you
very much Cenk for providing unreserved support all the time throughout these years
which helped me complete this PhD project.
Thank you Professor Mimi Tang and Professor Tim Doran for providing samples
that were necessary to carry out my PhD project. I want to thank Poultry CRC for
their generosity in providing research funding to carry out the PhD. I specially want
to thank Professor Mingan Choct, Liz Roan, Mick Warner and Professor Patrick
Blackwell for providing support for my PhD.
Thanks to all the fellow students at NeuroAllergy Research Laboratory especially
Pathum for providing me support whenever I needed. Thanks to my friends Pathum,
Damitha, Ciaran and Colm for all the help and good times we had. Thank you to my
girlfriend Dilusha, for all the love and support you gave during a significant stage of
my PhD work. Finally, I would like to thank my family for all the support,
encouragement and love you gave throughout my life. Thank you to my brother Piu
for everything you have done for me. Thank you to my parents for all the sacrifices
you have done for me. Thank you again to my family for providing me with love and
support all the time.
i

Table of Contents
Acknowledgements ................................................................................... i
Publications ............................................................................................ vii
List of Figures ....................................................................................... viii
List of Tables .......................................................................................... xi
Abbreviations ........................................................................................ xii
Abstract ................................................................................................ xvii
Chapter 1: Literature review ................................................................. 1
1.1 An insight into allergy: Classification and nomenclature ................................... 2
1.2 Molecular and cellular basis of allergy ............................................................... 4
1.2.1 The role of T cell subsets in allergy and health ........................................... 4
1.2.2 Pathogenesis of IgE-mediated allergy.......................................................... 9
1.2.2.1 Sensitisation phase ................................................................................ 9
1.2.2.2 Activation phase .................................................................................. 10
1.2.3 Pathogenesis of non-IgE mediated allergy................................................. 12
1.3 Allergens ........................................................................................................... 13
1.4 Risk factors of allergic diseases ........................................................................ 16
1.4.1 The genetic basis of allergic diseases ........................................................ 16
1.4.2 The environmental basis of allergic diseases ............................................. 18
1.4.2.1 Cellular and molecular basis of hygiene hypothesis ........................... 19
1.4.2.2 Population based studies on hygiene hypothesis ................................. 20
1.5 Egg allergy ........................................................................................................ 21
1.5.1 Allergy to egg yolk .................................................................................... 22
1.5.2 Allergens in the hen’s egg Yolk ................................................................. 23
1.5.2.1 Chicken serum albumin (Gal d 5) ....................................................... 23
1.5.2.2 The bird-egg syndrome........................................................................ 24
ii
1.5.2.3 YGP42 (Gal d 6) .................................................................................. 25
1.5.2.4 Other IgE binding proteins in the egg yolk ......................................... 26
1.5.3 Diagnosis of egg allergy ............................................................................ 26
1.5.4 Management of egg allergy........................................................................ 27
1.6 A potential cure for allergies: Allergen-specific immunotherapy .................... 29
1.7 The application of recombinant DNA technology in allergy diagnosis and SIT
................................................................................................................................ 30
1.8 Aims of this study ............................................................................................. 32
Chapter 2: Immunological analysis of egg yolk proteins from hen,
quail and emu and production of recombinant Gal d 6 in E. coli .... 35
2.1 Introduction ....................................................................................................... 36
2.2 Materials & methods ......................................................................................... 38
2.2.1 Immunological analysis of hen, quail and emu egg yolk extracts ............. 38
2.2.1.1 Human patients’ sera ........................................................................... 38
2.2.1.2 Preparation of crude egg yolk extracts (CEY) from hen, quail and emu
eggs .................................................................................................................. 40
2.2.1.3 SDS-PAGE analysis of CEYs of hen, quail and emu eggs ................. 40
2.2.1.4 Western immunoassay of CEYs .......................................................... 41
2.2.1.4.1 Western immunoassay of hen’s CEY with individual patients’ sera
..................................................................................................................... 41
2.2.1.4.2 Western immunoassay of hen, quail and emu CEYs with pooled
patients’ sera ................................................................................................ 42
2.2.1.5 Proteomic analysis of IgE reactive proteins from CEYs ..................... 42
2.2.2 Cloning and expression of Gal d 6 in E. coli expression system ............... 43
2.2.2.1 Strains, vectors and growth conditions ................................................ 43
2.2.2.2 Extraction of Poly A+ mRNA from chicken liver .............................. 43
2.2.2.3 Reverse transcription polymerase chain reaction (RT-PCR)
amplification of Gal d 6 ................................................................................... 45
2.2.2.4 Analysis and gel purification of PCR amplified Gal d 6 gene ............ 46
iii

2.2.2.5 Synthesis of pTrcHis A-Gal d 5 construct ........................................... 47
2.2.2.6 Chemical transformation of E. coli ..................................................... 47
2.2.2.7 Growth of transformant colonies and plasmid isolation ..................... 48
2.2.2.8 Restriction enzyme digest screening for colonies harbouring the
pTrcHis A-Gal d 5 construct ........................................................................... 49
2.2.2.9 Time course of expression and analysis of recombinant protein
expression levels .............................................................................................. 49
2.2.2.10 Purification of rGal d 6 ...................................................................... 50
2.2.3 Immunological analysis of rGal d 6 ........................................................... 51
2.2.3.1 Inhibition enzyme-linked immunosorbent assay (ELISA) .................. 51
2.3 Results............................................................................................................... 52
2.3.1 Immunological and mass spectrometry analysis of CEY fractions from
hen, emu and quail eggs ...................................................................................... 52
2.3.2 Expression of rGal d 6 in E. coli ................................................................ 60
2.3.3 Inhibition ELISA experiments ................................................................... 65
2.4 Discussion ......................................................................................................... 66
Chapter 3: Immunological comparison of native and recombinant
hen’s egg yolk allergen α-livetin (Gal d 5) .......................................... 75
3.1 Introduction ....................................................................................................... 76
3.2 Materials and methods ...................................................................................... 77
3.2.1 Human patients’ sera .................................................................................. 77
3.2.1 Cloning and expression of Gal d 5 in E. coli expression system ............... 79
3.2.1.1 RT-PCR amplification of Gal d 5 ........................................................ 79
3.2.1.2 Synthesis of pTrcHis A-Gal d 5 construct and expression of rGal d 5 in
E. coli ............................................................................................................... 80
3.2.2 Cloning and expression of Gal d 5 in K. lactis eukaryotic protein
expression system ............................................................................................... 80
3.2.2.1 Natural allergen extract ....................................................................... 80
3.2.2.2 Strains, vectors and growth conditions ................................................ 81
iv

3.2.2.3 PCR amplification of Gal d 5 gene with a C-terminal hemagglutinin
(HA) epitope tag .............................................................................................. 81
3.2.2.4 Construction of pKLAC2-Gal d 5 expression vector .......................... 82
3.2.2.5 Production of linearized pKLAC2 expression cassette ....................... 83
3.2.2.6 Transformation of K. lactis ................................................................. 84
3.2.2.7 Identification of multi-copy integrants ................................................ 85
3.2.2.8 Time course of expression and detection of secreted rGal d 5 ............ 86
3.2.2.9 Purification of rGal d 5 ........................................................................ 86
3.2.2.10 Identification of patients sensitized to nGal d 5 ................................ 87
3.2.2.11 Dot-blot analysis of rGal d 5 ............................................................. 88
3.2.2.12 Indirect ELISA for quantification of specific IgE against rGal d 5 and
nGal d 5 ........................................................................................................... 88
3.3 Results............................................................................................................... 89
3.3.1 Expression of rGal d 5 in E. coli ................................................................ 89
3.3.2 Expression of Gal d 5 in K. lactis .............................................................. 92
3.3.3 Immunological analysis of nGal d 5 and rGal d 5 ..................................... 98
3.4 Discussion ....................................................................................................... 100
Chapter 4: Production of hypoallergenic variant of recombinant
hen’s egg yolk allergen chicken serum albumin (Gal d 5) .............. 107
4.1 Introduction ..................................................................................................... 108
4.2 Materials and methods .................................................................................... 110
4.2.1 Site-directed mutagenesis of Gal d 5 ....................................................... 110
4.2.2 Transformation of XL10-Gold ultracompetent cells ............................... 111
4.2.3 Identifying colonies harbouring pTrcHis A-Gal d 5196/205-388/397 construct
........................................................................................................................... 112
4.2.4 Cloning and expression of rGal d 5196/205-388/397 in K. lactis ..................... 112
4.2.4.1 Cloning of Gal d 5196/205-388/397 in K. lactis ......................................... 112
4.2.4.2 Detection of secreted rGal d 5196/205-388/397 by transformed K. lactis . 113
v

4.2.4.3 Cloning and expression of rGal d 5196/205-388/397 in E. coli ................. 114
4.2.5 Immunological analysis of rGal d 5 and mutant rGal d 5196/205-388/397...... 114
4.3 Results............................................................................................................. 115
4.3.1 Recombinant production of Gal d 5196/205-388/397 in K. lactis .................... 115
4.3.2 Recombinant production of rGal d 5196/205-388/397 in E. coli ...................... 124
4.3.3 Immunological analysis of non-mutant and mutant rGal d 5 ................... 125
4.4 Discussion ....................................................................................................... 127
Chapter 5: General discussion ........................................................... 132
References ............................................................................................ 142
vi

Publications
Peer-reviewed journals
1. De Silva C, Dhanapala P, Doran T, Tang MLK & Suphioglu C (2016): Molecular and immunological analysis of hen’s egg yolk allergens with a focus on YGP42 (Gal d 6), Molecular Immunology: 71: 152-160.
2. Dhanapala P, De Silva C, Doran T & Suphioglu C (2015): Cracking the egg: an insight into egg hypersensitivity, Molecular Immunology: 66: 375-383.
Conference papers
1. De Silva C & Suphioglu C (2016): Immunological analysis of natural and recombinant hen’s egg yolk allergen chicken serum albumin, Internal Medicine Journal: 46: S4: 7.
Publications under preparation
1. De Silva C, Dhanapala P, Doran T, Tang MLK & Suphioglu C: Immunological analysis of natural and recombinant hen’s egg yolk allergen chicken serum albumin.
vii

List of Figures
Figure 1.1: The steps involved in the IgE-mediated allergic reaction………………11
Figure 2.1: SDS-PAGE analysis of CEYs under reducing and denaturing
conditions……………………………………………………………………………53
Figure 2.2: Western immunoassay conducted using individual patients’ sera against
hen’s CEY…………………………………………………………………………...55
Figure 2.3: Western immunoblots conducted using pooled patients’ sera against all
CEYs…………………………………………………………………………...……55
Figure 2.4: Percentage of patients with IgE reactivity to proteins (P1 to P7) of hen’s
egg yolk, as analysed from the western immunoblot in Figure 2.2 and Table 2.2….57
Figure 2.5: RT-PCR of Gal d 6 gene………………………………………………..61
Figure 2.6: Restriction enzyme digest screening for E. coli colonies harbouring
pTrcHis A-Gal d 6 construct………………………………………………………...61
Figure 2.7: Sequence alignment comparison of DNA sequence derived for pTrcHis
A-Gal d 6 construct using NCBI Nucleotide BLAST tool………………………….62
Figure 2.8: Time-course of expression of soluble and insoluble E. coli cell culture
fractions harbouring rGal d 6………………………………………………………..64
Figure 2.9: Purification of 6×His tagged rGal d 6…………………………………..64
Figure 2.10: Inhibition ELISA experiments………………………………………...65
Figure 3.1: RT-PCR of Gal d 5 gene. The PCR product was electrophoresed on a 1%
(W/V) agarose gel…………………………………………………………………...90
Figure 3.2: Restriction enzyme digest screening for the colonies harbouring the
pTrcHis A-Gal d 5 construct………………………………………………………...90
Figure 3.3: Sequence alignment comparison of DNA sequence derived for pTrcHis
A-Gal d 5 construct using NCBI Nucleotide BLAST tool………………………….91
Figure 3.4: Time-course of expression of soluble and insoluble E. coli cell culture
fractions harbouring rGal d 5………………………………………………………..92 viii

Figure 3.5: PCR amplification of Gal d 5 gene. The PCR product was
electrophoresed on E-Gel® CloneWell™ agarose gel with 0.8% SYBR Safe™ DNA
Gel stain……………………………………………………………………………..93
Figure 3.6: Restriction enzyme digest screening for the colonies harbouring the
pKLAC2-Gal d 5 construct………………………………………………………….93
Figure 3.7: Sequence alignment comparison of DNA sequence derived for pKLAC2-
Gal d 5 construct using NCBI Nucleotide BLAST tool…………………………….94
Figure 3.8: SacII digest of the pKLAC2-Gal d 5 construct. The digested plasmid was
electrophoresed on a 1% (w/v) agarose gel…………………………………………95
Figure 3.9: Whole cell PCR analysis for screening of strains containing multi-copy
integrants…………………………………………………………………………….96
Figure 3.10: Time-course of expression of K. lactis culture supernatants containing
secreted rGal d 5…………………………………………………………………….97
Figure 3.11. Analysis of immunoprecipitation purified rGal d 5 (A) SDS-PAGE and
(B) western immunoassay of purified rGal d 5 fractions……………………………98
Figure 3.12. Testing of patients allergic to hen’s egg white described in Table 1 for
IgE reactivity with dot-blotted nGal d 5…………………………………………….99
Figure 3.13. Testing of patients sensitised to nGal d 5 for IgE reactivity with dot-
blotted rGal d 5……………………………………………………………………...99
Figure 3.14. Comparison of the binding activity of human specific IgE against
recombinant and natural Gal d 5………………………………………………….100
Figure 4.1: Nucleotide BLAST search result of the pTrcHis A-Gal d 5196/205-388/397
DNA sequence (plus strand) obtained from pTrcHis forward primer……………..117
Figure 4.2: Nucleotide BLAST search result of the pTrcHis A-Gal d 5196/205-388/397
DNA sequence (minus strand) obtained from pTrcHis reverse primer……………118
Figure 4.3: (A) PCR of Gal d 5196/205-388/397. The PCR product was electrophoresed on
E-Gel® CloneWell™ agarose gel with 0.8% SYBR Safe™ DNA Gel stain………..119
ix

Figure 4.4: Nucleotide BLAST search result of the pKLAC2- Gal d 5196/205-388/397
DNA sequence (plus strand) obtained from pTrcHis forward primer……………..120
Figure 4.5: Nucleotide BLAST search result of the pKLAC2-Gal d 5196/205-388/397
DNA sequence (minus strand) obtained from pTrcHis reverse primer……………121
Figure 4.6: SacII digest of the pKLAC2-Gal d 5196/205-388/397 construct……………123
Figure 4.7: Whole cell PCR analysis for screening of K. lactis strains containing
multi-copy integrants………………………………………………………………123
Figure 4.8: SDS-PAGE analysis of spent culture media from K. lactis strains
harbouring rGal d 5196/205-388/397……………………………………………………124
Figure 4.9: Time-course of expression of soluble E. coli cell culture fractions
harbouring rGal d 5196/205-388/397……………………………………………………125
Figure 4.10: Western blot analysis of non-mutant rGal d 5 expressed by K. lactis and
E. coli and mutant rGal d 5196/205-388/397 produced by E. coli……………………….126
Figure 4.11: Western immunoblots conducted using nGal d 5 sensitised patients’ sera
against non-mutant rGal d 5 expressed by K. lactis and E. coli and mutant rGal d
5196/205-388/397 produced by E. coli…………………………………………………..126
x

List of Tables
Table 1.1: Gell and Coomb’s classification of hypersensitivity disorders of the
immune system……………………………………………………………………….3
Table 1.2: The six main allergens from the hen’s egg white and the yolk……...…….................................................................................................…….24
Table 2.1: The levels of allergen specific IgE antibodies against egg white
determined by ImmunoCAP (Phadia)…………………………………………….…39
Table 2.2: Qualitative IgE binding data from western immunoassay based on Figure
2.2……………………………………………………………………………………56
Table 2.3: Protein identities revealed from mass spectrometry analysis, their
approximate molecular weights on SDS-PAGE, score and percentage sequence
coverage for each protein……………………………………………………………59
Table 3.1: The levels of allergen specific IgE antibodies against egg white
determined by ImmunoCAP (Phadia)……………………………………………….78
Table 4.1: Mutagenic primers used for disruption of disulfide bridges in Gal d 5
(CSA). Substitutions of Cys by Ala residues are indicated by the codon GCC bolded
and underlined……………………………………………………...………………111
Table 4.2: Thermal cycling conditions for mutant strand synthesis…………….....111
xi

Abbreviations
AAHL Australian Animal Health Laboratory
Ala Alanine
amdS Acetamidase gene
APC Antigen presenting cell
Apo B Apolipoprotein B
BBC Boston Birth Cohort
BCIP/NBT 5-bromo-4-chloro-3’indolyphosphate p toluidine/nitro-blue tetrazolium chloride
BLAST Basic Local Alignment Search Tool
BSA Bovine serum albumin
CD4 Cluster differentiation 4
CD8 Cluster differentiation 8
CD25 Cluster differentiation 25
cDNA Complementary DNA
CEY Crude egg yolk extract
CMP Cow’s milk protein
CSA Chicken serum albumin
CSIRO Commonwealth Scientific and Industrial Research Organisation
C-terminal Carboxyl terminal
Cys Cysteine
DB Disulfide bond
DBPCFC Double blind placebo controlled food challenge
dH2O Deionized water
DNA Deoxyribose nucleic acid
dNTP Deoxynucleotide triphosphate
ds-DNA Double stranded DNA
xii

EAACI European Academy of Allergy and Clinical
Immunology
ELISA Enzyme linked-immunosorbant assay
FcεRI High affinity IgE receptor
FPE Food protein induced enteropathy
FPIAP Food protein induced proctocolitis
FPIES Food protein induced enterocolitis syndrome
GOS Galacto-oligosacharide
GWAS Genome-wide association studies
HA Hemagglutinin
HEAG Human Ethics Advisory Group
His Histidine
HLA-DR Human Leukocyte Antigen-antigen D Related
IB Inclusion body
IFN-γ Interferon-γ
IgA Immunoglobulin A
IgE Immunoglobulin E
IgG Immunoglobulin G
IgG1 immunoglobulin G-1
IgG3 immunoglobulin G-3
IgG4 immunoglobulin G-4
IgM Immunoglobulin M
IL-2 Interleukin-2
IL-4 Interleukin-4
IL-5 Interleukin-5
IL-6 Interleukin-6
IL-9 Interleukin-9
IL-10 Interleukin-10
xiii

IL-12 Interleukin-12
IL-13 Interleukin-13
IPTG isopropyl β-D-1-thiogalactopyranoside
JAK1 Janus kinases 1
JAK3 Janus kinases 3
LB Lysogeny broth
LC-MS/MS Liquid chromatography-tandem mass spectrometry
MCS Multiple cloning site
MHC Major histocompatibility complex
MMR Measles, mumps and rubella
mRNA Messenger ribonucleic acid
MW Molecular weight
NCBI National Centre for Biotechnology Information
NEB New England Biolabs
NFA Non-IgE mediated food allergies
nGal d 5 Natural Gal d 5
nGal d 6 Natural Gal d 6
Ni-NTA Ni2+-Nitrilotriacetic acid
NMR Nuclear magnetic resonance
NPV Negative predictive value
N-terminal Amino terminal
OD Optical density
OFC Oral food challenges
OTI Oral tolerance induction
PBS Phosphate buffered saline
PBST Phosphate buffered saline with Tween 20
PCR Polymerase chain reaction
pNPP Alkaline phosphatase yellow
xiv

PPV Poor positive predictive value
RAST Radioallergosorbent test
rGal d 5 Recombinant Gal d 5
rGal d 6 Recombinant Gal d 6
RORγt RAR-related orphan receptor gamma
rpm Revolutions per minute
RT-PCR Reverse transcription polymerase chain reaction
SDM Site directed mutagenesis
SDS-PAGE Sodium dodecyl sulfate-polyacrylamide gel electrophoresis
SIT Specific immunotherapy
SNP Single-nucleotide polymorphism
SOC Super optimal broth with catabolite repression
SPT Skin prick test
ss-DNA Single stranded DNA
STAT3 Signal Transducer and Activator of Transcription 3
STAT4 Signal Transducer and Activator of Transcription 4
STAT5 Signal Transducer and Activator of Transcription 5
STAT6 Signal Transducer and Activator of Transcription 6
TGF-β Transforming growth factor-β
Th T helper cell
Th0 Naive T helper cell
Th1 T helper 1 cell
Th2 T helper 2 cell
Th9 T helper 22 cell
Th9 T helper 22 cell
Th17 T helper 17 cell
TNF-α Tumour necrosis factor-α
xv
TNF-β Tumour necrosis factor-β
Tr T regulatory cell
Tr1 T regulatory 1 cell
VTG-1 Vitellogenin-1
VTG-2 Vitellogenin-2
YCB Yeast carbon base
YGP42 Yolk glycoprotein 42
α-MF α-mating factor
β-ME β-mercaptoethanol
xvi

Abstract
Allergy to hen’s egg white is one of the most common forms of food allergies and, as
a result, has been well investigated. However, allergy to hen’s egg yolk has been
overlooked by many studies, despite evidence of causing important immunological
hypersensitivity in humans. Furthermore, the use of recombinant allergens in
diagnosis and treatment of allergy has been very popular due to their excellent
pharmaceutical qualities and standardised content. Therefore, immunological studies
of hen’s egg yolk and production of recombinant versions of egg yolk allergens is of
great interest. My work involves investigating hen’s egg yolk proteome in relation to
food allergy using molecular, proteomic and immunological methods. The major
objectives of this study were three fold. First objective was to investigate
sensitisation to egg yolk proteins in patients diagnosed with allergy to egg white. The
second objective involved producing immunologically active recombinant versions
of hen’s egg yolk allergens; chicken serum albumin and yolk glycoprotein 42
(YGP42). The final objective was to develop a recombinant based mutant variant of
chicken serum albumin with reduced immunoglobulin E (IgE) antibody reactivity. In
order to investigate sensitisation to egg yolk proteins, I conducted Western
immunoassays using sera from 25 patients with allergy to hen’s egg white (Chapter
2). The results showed that 36% of the patients tested had concomitant sensitisation
to egg yolk proteins indicating a possible link between allergy to egg white and
allergy to egg yolk. The proteomic analysis identified vitellogenin-1, vitellogenin-2
and apolipoprotein B as major IgE-reactive proteins. Then, the production of IgE-
reactive recombinant YGP42 and chicken serum albumin in Escherichia coli and
Kluyveromyces lactis, respectively, are presented in Chapters 2 and 3. We were able
to confirm that recombinant chicken serum albumin to have similar IgE-reactivity to
xvii

its natural counterpart. Finally, this thesis presents the successful production of a
mutant variant of recombinant chicken serum albumin using site directed
mutagenesis and showed that it completely lacks IgE-reactivity (Chapter 4). The
work presented in this study confirms hen’s egg yolk as an important source of food
allergens. The recombinant allergens produced in this study may be useful in the
preparation of standardised reagents for the diagnosis and immunotherapy of hen’s
egg yolk allergy in the future.
xviii

xix
Chapter 1: Literature review
Publication: Dhanapala P, De Silva C, Doran T & Suphioglu C (2015): Cracking the egg: an insight into egg hypersensitivity, Molecular Immunology: 66: 375-383.
1

1.1 An insight into allergy: Classification and nomenclature
Allergy is a term used to describe a collection of diseases manifesting in many
different ways such as, food allergy (gastroenteritis), asthma, urticaria, anaphylaxis
and rhinitis [1, 2]. Allergies mainly occur in young children. However, they can
affect individuals from any age group, from infancy to adulthood to elderly [1]. In
technical terms, allergy is a hypersensitivity disorder of the immune system caused
by non-pathogenic environmental substances resulting in self-inflammatory damage.
Antigens that trigger allergic reactions are termed as allergens. Hypersensitivity
reactions of non-immunological nature are not categorized as allergies. For example,
food intolerance due to enzymatic defects or pharmacological activity and side
effects to drugs belong to non-allergic hypersensitivity disorders [2-4].
Traditionally, allergic diseases were classified under Type I hypersensitivity
according to Gell and Coomb’s classification of hyper-immune diseases (Table 1.1)
[5]. Mutually exclusive and distinct pathophysiological mechanisms responsible for
disease progression and symptoms were used as the basis for this classification [4-6].
Since the conception of Gell and Coomb’s classification about 40 years ago,
numerous patho-physiologies and patho-mechanisms underlying allergic diseases
have been discovered. Although, the framework provided by Gell and Coomb’s
classification is not inaccurate, it is now considered outdated [3, 4, 6, 7]. Therefore,
Gell and Coomb’s classification of hypersensitive diseases is no longer used in
relation to allergic diseases. Nevertheless, it is still used by some authors
occasionally when describing hypersensitivity diseases including allergies [4, 6].
2

Table 1.1: Gell and Coomb’s classification of hypersensitivity disorders of the immune system [5, 8].
Category Disease name Mediator Antigen
Type I Allergy IgE Allergens Type II Cytotoxic
hypersensitivity IgG, IgM, complement
Individual’s own cells, drugs, haptens
Type III Immune complex hypersensitivity
IgG, IgM Foreign sera, therapeutic antibodies
Type IV Delayed-type (cellular) hypersensitivity
T lymphocytes, macrophages
Mycobacterium tuberculosis, heavy metals (Ni)
A revised classification for allergic diseases is formulated by the European Academy
of Allergy and Clinical Immunology (EAACI) nomenclature task force. According
to EAACI position paper, allergic diseases are separated into two categories, based
on its immuno-pathological mechanisms known as antibody-mediated and non-
antibody mediated [3]. Majority of patients with allergies exhibit antibody-mediated
allergic diseases. In antibody-mediated allergic diseases, the immune system
produces antibodies of immunoglobulin E (IgE) isotype against allergens.
Consequently, these patients are said to be suffering from IgE-mediated allergy. By
contrast, patients suffering from non-antibody mediated allergy, do not exhibit raised
levels of allergen specific IgE. Nevertheless, those patients also exhibit and suffer
from typical allergic symptoms, as in IgE-mediated allergy. Little is known about the
underlying mechanism responsible for non-IgE mediated allergies. However, it is
believed that a cellular mechanism, independent from IgE antibodies, is responsible
for non-antibody mediated allergic diseases [3, 7].
The term atopy was introduced by Coca & Cooke in 1926 to describe the inherited
hypersensitivity towards allergens in man [9]. Over the years, many physicians and
researchers used the term atopy, simply to describe IgE-mediated allergic diseases.
3

However, at the same time, paediatricians used the term atopy to describe the genetic
predisposition to develop IgE-mediated allergies due to the strong familial basis [4].
Because of this inconsistent use of the terminology, much confusion was created
among readers. Therefore, EAACI position paper re-defined atopy as the genetic
predisposition to produce IgE antibodies against allergens and develop typical
symptoms of allergies. Therefore, the term atopy is no longer used to describe an
IgE-mediated hypersensitivity [3, 7].
1.2 Molecular and cellular basis of allergy
1.2.1 The role of T cell subsets in allergy and health
Cluster differentiation 4 (CD4+) T helper (Th) lymphocytes are the main effector
cells involved in pathogenesis of allergic diseases [10, 11]. Functional Th cell
subsets include Th1, Th2, Th9, Th17, Th22, regulatory T (Tr) and follicular helper
cells based on their overall cytokine secretion profile. It has been shown that all T
helper cell subsets are derived from the same precursor Th cell known as
undifferentiated or naive T helper (Th0) cell. Polarization into a committed Th cell
subset from Th0 cells is driven under the influence of a combination of strong micro-
environmental signals and genetic factors acting at the level of antigen presentation.
Initiation of a particular Th cell subset is directed through factors such as specific
cytokines, cytokine receptors, and transcription factors at the time Th0 cells engage
with the antigens [12]. Dose of antigen, route of antigen exposure, physical form of
immunogen and the type of adjuvant are some of the environmental determinants
proposed. However, the genetic basis of Th cell polarization still remains poorly
understood [13-15]. In the context of allergies Th cell subsets, Th1, Th2 , Tr cell and
recently identified Th17 subsets are of particular important in understanding the
underlying mechanism governing pathogenesis of allergies [13-15].
4

Th1 lymphocytes produce interleukin-2 (IL-2), interferon-γ (IFN-γ) and tumour
necrosis factor-β (TNF-β) and other cytokines responsible for macrophage activation
and cell mediated immunity against intracellular pathogens such as bacteria and
viruses. Th1 cell differentiation is stimulated by IL-12 and IFN-γ, and mediated by
Signal Transducer and Activator of Transcription 4 (STAT4) and T-bet [12]. The
signature Th1 cytokine, IFN-γ is known to activate macrophages and stimulate B
lymphocytes to produce several subclasses of immunoglobulin G (IgG) antibodies,
such as IgG1 and IgG3. IgG antibodies are capable of binding to high-affinity Fcγ
receptors and complement proteins resulting in opsonisation and phagocytosis of
particulate microbes [13]. Furthermore, Th1 cells are known to play a down-
regulatory function on Th2 activity by inhibiting IgE production by B cells [16].
On the other hand, Th2 cells produce cytokines such as IL-4, IL-5, IL-6, IL-9, IL-10
and IL-13 that promote antibody mediated defence against multicellular parasites
such as gastro intestinal nematodes. Th2 cell differentiation is stimulated by IL-4
mediated activation of Janus kinases 1 (JAK1) and JAK3 along with recruitment of
transcription factors STAT3, STAT5, STAT6 and GATA3 [12]. IL-4 and IL-13 are
known to stimulate IgE antibody production from B cells while IL-5 recruits and
differentiates eosinophils. The main effector function of Th2 type cytokines are
production of antigen specific IgE antibodies leading to mast cell and eosinophil
mediated inflammation. Furthermore, an immunosuppressive role for Th2
lymphocytes have been described since IL-4, IL-10 and IL-13 together are known to
inhibit several macrophage functions. [16-19]. In the event of prolonged Th1
response due to sustained intracellular microbial infection a switch to Th2 response
may occur. This is considered as an important protective mechanism of Th2 immune
response which results in downgrading the effects of prolonged cell mediated
immunity of Th1 response which could damage the host [16, 20]. 5

The IgE-mediated allergic hypersensitivity is considered to arise as a result of strong
Th2 immune response against common environmental allergens in predisposed
individuals. Cytokine profile of T cell clones derived from majority of allergic
patients exhibit a Th2 phenotype with high production of IL-4, IL-5 and little or no
production of IFN-γ [16, 20]. In healthy subjects, the concentration of serum IgE is
the lowest compared to other 5 types of antibodies. The production of IgE is very
low at birth and gradually increases until the age of 10 to 15 years. However, patients
with allergies exhibit earlier and sharper IgE production indicating a predominant
Th2 immune response [21].
Furthermore, Th2 lymphocytes are known to preferentially induce production of
IgG4 antibodies through the help of IL-10. The normal immune response of IgG4 is
mainly limited to non-microbial antigens. The accompanying involvement of IgG4 in
allergy has a protective role. In IgE-mediated allergies, increased production of IgG4
antibodies is associated with a decrease in symptoms. In healthy individuals, the
immune system reacts to allergens with increased allergen specific IgG4 antibodies
without detectable IgE antibodies. This immune response is termed as the modified
Th2 response, which represents the typical healthy immune response to allergens.
However, it is quite common to find both allergen specific IgG4 and IgE antibodies
together in affected individuals. Well known examples of this phenotype can be seen
in allergy to bee venom, rodent proteins and mammalian serum albumins.
Furthermore, IgG isotype (IgG1 and/or IgG4) is more common in subjects with IgE-
mediated allergy, than in IgE-negative subjects as in allergy to pollen and mites.
Some allergens elicit the classical IgE-mediated immune response without any IgG
antibody productions, whereas other allergens produce an IgG (IgG1 and/or IgG4)
response without any detectable IgE. This difference in the type of immune response
suggests that not all allergens are equal [22]. 6

Two mechanisms have been suggested to explain the protective role of IgG4
antibodies in relation to allergy. Firstly, it has been proposed that IgG4 antibodies act
as blocking antibodies by preventing the interaction between IgE and allergens. On
the other hand, IgG4 is considered as a marker for tolerance induction. A positive
correlation has been observed between increments in IgG4 concentration, and
reduction in allergic symptoms in follow up studies. However, the exact mechanism
of IgG4 dependent tolerance induction is not clear. IgG4 is generally regarded as a
non-pathogenic antibody. However, IgG4 has been implicated in both allergic and
non-allergic diseases as well. For example BanLec1, a lecithin from banana is a
known potent allergen that induces IgG4 resulting in allergies. However, the
involvement of IgG4 antibodies as the sole food allergy mediator is not fully
resolved. According to EAAIC taskforce report food specific IgG4 does not indicates
food allergy. Furthermore, IgG4 antibodies are also involved in non-allergic diseases
such as pemphigus and sclerosing autoimmune pancreatitis [22].
In allergic individuals the underlying mechanism governing the preferential
activation of allergen specific Th2 cells is not fully elucidated. The presence of IL-4
in the immunological milieu of the patient during the initial allergen exposure is
identified as a crucial factor driving the polarization of Th2 response. In vitro studies
conducted using both human and murine T cells clones have demonstrated IL-4 as an
important requirement for the development of Th2 immune response [23, 24].
Furthermore, T cells from IL-4 deficient mouse models failed to stimulate a Th2
response following in vitro stimulation [25]. However, despite these results it is still
not clear what is the source of initial IL-4 production which is required for
polarization of Th0 into active Th2 lymphocytes [16].
7

Tr cells are another subset of T lymphocytes described in humans responsible for
suppression and regulation of overall immune responses against antigens. Majority of
Tr cells exists as CD4+CD25+ T regulatory 1 (Tr1) type, secreting cytokines IL-10
and transforming growth factor-β (TGF-β) (Figure 1.1) [26-28]. Tr1 cells play an
important role in maintaining immunological tolerance to self and innocuous
environmental substances by suppressing Th2 cells. Tr1 secreted IL-10 and TGF-β
has shown to suppress IgE production and favour production of non-inflammatory
antibodies such as IgG4 and immunoglobulin A (IgA). Therefore, a weak Tr1
immune function would lead to a stronger Th2 polarized immune response leading to
allergy [26, 27]. Healthy and allergic individuals both represent Tr1, Th1 and Th2
cells in different proportions. It has been proposed that the ratio all three T cell
subsets to be a crucial factor determining health or allergy where patients suffering
from allergy represent a dominant Th2 response against allergens while healthy
individuals exhibit a dominant Tr1 response against allergens [27].
The newly discovered Th cell subset, Th17 has been reported to implicate in
development of allergic asthma and atopic dermatitis. Development of Th17 cells is
stimulated by TGF-β and IL-6 or IL-21, and is mediated by STAT3 and RAR-related
orphan receptor gamma (RORγt). Th17 cells are characterised by the production of
IL-17, IL-17F, IL-22 and other cytokines responsible for inducing autoimmunity.
Studies conducted on mice have shown that IL-17 and IL-22 are capable of
triggering inflammation. It has been shown that elevated levels of circulating Th17
cells, plasma IL-17 and IL-22 are important characteristics of allergic asthma.
However, the role of Th17 cells in development of allergic asthma hasn’t been
completely elucidated. Further investigations at population level focusing on
different classifications of asthma, and experiments on the cellular basis are required
[12, 29]. 8

1.2.2 Pathogenesis of IgE-mediated allergy
The IgE-mediated immune response occurs in a cascade fashion from initial allergen
exposure to the ultimate tissue inflammation. For simplification, the IgE-mediated
allergic reaction is described in two phases known as sensitisation phase and
activation phase (Figure 1.1) [2, 10, 15, 30].
1.2.2.1 Sensitisation phase
Immunological sensitisation starts during the initial encounter between an allergen
and the immune system. Infiltrated allergens are captured by antigen presenting cells
(APC) such as dendritic cells, macrophages and granulocytes, most likely from the
site of entry. The epitopes of internalized allergens are then processed and presented
to Th0 cells through class II major histocompatibility complex (MHC) molecules of
APCs. Following engagement with the presented allergens, Th0 cells differentiate
into an active cytokine secreting Th2 state. Polarization into Th2 lymphocytes is
further aided by the presence of IL-4 in the patient’s immunological milieu. Th2
cells produce cytokines such as IL-4, IL-5, IL-6, IL-9, IL-10 and IL-13 that provide
optimum help for IgE production, and activation of cellular components of the
allergic cascade [2, 4, 13, 15, 31].
Cytokines IL-4, IL-5 and IL-13 are recognized as the signature cytokines of Th2
lymphocyte profile. IL-4 is the main cytokine responsible for inducing B cells to
produce allergen specific IgE antibodies and further enhances the development of
additional Th2 cells. Newly synthesized IgE antibodies then bind with high affinity
IgE receptors (FcεRI) expressed on the surfaces of mast cells and basophils. IgE
bound mast cells and basophils are now said to be sensitised, since they can be
activated by subsequent allergen exposures. IL-5 has a role in development and
9
activation of eosinophils, which produce high levels of inflammatory mediators. IL-
13 further enhances IgE production and stimulates mucus secretion by epithelial cells
[2, 4, 10, 13, 15, 31-33].
1.2.2.2 Activation phase
When a sensitised immune system is exposed to the same allergen, or a different
cross-reactive allergen with the same IgE-binding epitopes, they bind and cross-link
IgE immobilised on mast cells and basophils. Cross-linking cell bound IgE results in
explosive degranulation of mast cells and basophils, releasing chemical mediators
such as histamines, prostaglandins, cytokines and leukotrienes, which are responsible
for the typical symptoms of allergy [10, 32].
10

Figure 1.1: The steps involved in the IgE-mediated allergic reaction. At the initial allergen exposure, APCs capture and present the allergens to Th0 cells. With the aid of IL-4 in the patient’s immunological milieu Th0 cells differentiate into an active Th2 type, secreting cytokines such as IL-4, IL-5 and IL-13. IL-4 produced by Th2 cells then activates B cell to produce allergen specific IgE antibodies and further enhances the differentiation of Th0 into Th2. At the end of the sensitisation phase IgE antibodies bind to FcεRI on mast cells and basophils. During the secondary and subsequent exposures to the same offending allergen they bind and cross-link IgE immobilised on mast cells and basophils. Cross-linking IgE antibodies result in explosive degranulation releasing variety of chemical mediators causing inflammation.
Sensitisation phase A
ctivation phase
IgE
APC Th0 Th2 B cell
Initial allergen exposure
Mast cell Basophil
IL-
Mast cell Basophil
Chemical mediators released through mast cells and basophil degranulation
Secondary allergen exposure
IL-4 IL-5 IL-13
11

1.2.3 Pathogenesis of non-IgE mediated allergy
Non-IgE mediated allergies are less commonly encountered than IgE-mediated
allergic diseases. The underlying mechanism responsible for pathogenesis of non-IgE
mediated allergies is believed to be cause by mechanisms independent from IgE
antibodies. However, the pathophysiological mechanism responsible for non-IgE
mediated allergic reaction is poorly understood. Non-IgE mediated allergies are
mainly caused by food proteins, especially cow’s milk proteins (CMP) and soy
proteins. Therefore, non-IgE mediated allergies are often referred to as non-IgE
mediated food allergies (NFA). Some common manifestations of NFAs include food
protein-induced enterocolitis syndrome (FPIES), food protein-induced allergic
proctocolitis (FPIAP), and food protein-induced enteropathy (FPE) [34-36].
Typically, patients suffering from NFAs do not exhibit allergen specific IgE
antibodies in serology based diagnostic tests. However, some patients with NFAs
were found to have low levels of IgE against offending food allergens. For example,
some patients suffering from FPIES are reported to exhibit detectable levels of
allergen specific IgE antibodies. Nevertheless, the clinical relevance between
allergen specific IgE antibodies and FPIES is still not clear [37, 38].
Only a limited number of studies have addressed the underlying immunological
mechanism of NFAs. TNF-α is known to play an important role in pathogenesis of
NFA. It has been shown that in patients with cow’s milk allergy, TNF-α production
by mononuclear cells increases following CMP challenge leading to increased
intestinal permeability [39]. A central role for TNF-α in pathogenesis of NFAs is
further supported by studies presenting evidence of increased amounts of faecal
TNF-α and the presence of TNF-α in the duodenal biopsy specimens in patients with
FPIES. Furthermore, it has been shown that intact CMP holds a superior capability to
12
stimulate PBMCs from patients with FPIES to produce TNF-α than processed CMP.
The authors also reported a substantial drop in TNF-α production following
avoidance of CMP in FPIES patients [40-42]. The Th lymphocyte response in NFAs
is also predominantly directed towards Th2 type as in IgE-mediated allergies
however, without detectable allergen specific IgE antibodies. Morita et al.,
demonstrated that Th2 cytokines, namely IL-3, IL-5 and IL-13, were significantly
produced by PBMCs from patients with NFAs when stimulated with CMP [43]. The
increased production of TNF-α and the polarization of Th0 cells into Th2 state can be
considered as important steps in pathogenesis of NFAs [38, 43-45].
1.3 Allergens
Antigens that stimulate IgE-mediated or non-IgE mediated allergic hypersensitivity
disorders are defined as allergens [3]. Existing studies on molecular, biological and
immunological basis of allergens are primarily investigated in the context of IgE-
mediated allergy. In this thesis, the role of allergens will be discussed in relation to
IgE-mediated hypersensitivity only. Allergens are derived from numerous sources
such as foods, animal dander, chemical additives, drugs, fungi, insect stings and
pollen [19].
Most of the well-known allergens are glycoproteins with molecular masses ranging
from 5 kDa to 70 kDa. The antigenic determinants of those allergenic glycoproteins
are commonly found on their protein components [46]. Traditionally, it was thought
that carbohydrates are not capable of serving as epitopes resulting in the formation of
specific IgE antibodies. However, this assumption has been proven false by studies
presenting evidence on carbohydrates containing allergenic epitopes. For example,
allergy to cetuximab, (chimeric mouse-human IgG1 monoclonal antibody against
epidermal growth factor receptor) arises as a result of producing specific IgE
13

antibodies against oligosaccharide galactose-α-1,3-galactose on the Fab portion of
the heavy chain [47, 48]. Furthermore, pure carbohydrates are also reported to cause
IgE-mediated hypersensitivity as in allergy to galacto-oligosacharides (GOS) [48].
Significant proportion of studies has been dedicated to investigate the role of food
allergens in causing IgE-mediated hypersensitivity. Most common IgE-mediated
food allergies in children are caused by peanuts, milk and hen’s egg proteins.
Majority of the food allergies seen in adults are attributed to allergens derived from
peanuts, tree nuts, fish and shellfish. All of these food sources contain thousands of
proteins and yet only a handful of them cause allergy [49].
Availability of high amounts of allergenic proteins in the food source, resistance to
processing, digestion and existence of multiple linear IgE binding epitopes are some
characteristics of food allergens [46, 49]. The presence of proteins in high quantities,
as a requirement to act as an allergen, is demonstrated by the increased prevalence of
codfish allergy among Norwegians. The increased consumption of codfish coincides
with the high frequency of codfish allergy in Norway. Consequently, allergy to fish
is not prominent in Texas where beef consumption is high [46]. A single allergen is
considered to carry at least two IgE-binding epitopes in order to cross-link mast cell
bound IgE. Two types of IgE-binding epitopes are described, known as linear and
conformational. Linear or sequential epitopes only require the primary amino acid
sequence of the protein for IgE binding. On the other hand, conformational epitopes
require secondary or tertiary structures in addition to the primary amino acid
sequences for IgE binding. Conformational epitopes are mainly seen in aeroallergens
where allergens are presented to the immune system in their native form. On the
other hand, linear epitopes are of particular importance to food allergens. Food
allergens are presented to the immune system after partial digestion or denaturation
14

in the gastrointestinal tract, which reveal their linear epitopes. Study by Vila et al.,
showed that patients with milk allergy have higher specific IgE antibodies to linear
epitopes than to native α and β casein proteins [50].
Resistance to digestion and denaturation is considered a distinctive character of food
allergens. The ability of food allergens to withstand digestion in the gastrointestinal
tract increases the probability of encountering the immune system in their intact
form. Numerous studies have reported that food allergens hold a superior capability
to resist in vitro pepsin digestion compared to non-food allergens and non-allergenic
proteins. However, these in vitro digestion models do not fully represent the human
digestion. Therefore, further studies are required to evaluate the relationship between
allergenicity and resistance to gastric acid digestion [46, 49].
Three-dimensional structures of some allergens have been studied using X-ray
diffraction and nuclear magnetic resonance (NMR) in order to find a unifying link
among allergens. Birch pollen allergens Bet v 1 and Bet v 2 and timothy grass pollen
allergen Phl p 2 are some of the allergens subjected to structural studies. These
studies found that the shape and the dimensions of the allergens to be a common
trait. The average shortest and longest dimensions of the allergens were 3.4 nm and
4.4 nm, respectively, giving them a spherical shape. However, structures of many
more allergens need to be analysed to obtain a better understanding of the molecular
basis of allergenicity [46].
Obviously, not all proteins with above-mentioned characteristics are allergens.
Therefore, it is still not clear why some proteins act as allergens while others do not.
Development of an allergic disease is multifactorial. An allergen must be presented
to a genetically or environmentally predisposed individual in order to induce an
allergic reaction [19]. In order to find the answer to the question “What makes a
15

protein an allergen?”, genetic and environmental factors must be taken into account
as well, along with their biochemistry.
1.4 Risk factors of allergic diseases
1.4.1 The genetic basis of allergic diseases
Pathogenesis of allergic diseases is considered to have a strong hereditary factor. The
risk of developing allergic diseases is higher in individuals with a family history. For
example, a positive family history is found to be a strong risk factor for both asthma
and rhinitis [51, 52]. An epidemiological study from Sweden showed that the risk of
developing asthma and rhinitis increases up to four-fold and six-fold, respectively, in
individuals with a family history [53]. Another population-based study from
Germany investigated the risk of developing asthma and rhinitis in children with
affected parents. This study estimated that if one parent had asthma, the odds ratio of
a child inheriting asthma to be 2.6. The odds ratio reported for rhinitis was 3.6.
However, the same study reported that 22% of children without a positive family
history to be suffering from allergic diseases as well, indicating the influence of
environmental factors [54].
Although, there is compelling evidence of familial basis of allergic diseases,
identification of culprit genes had been problematic. The presences of multiple
markers, vaguely described phenotypes and possible involvement of multiple genes
have all contributed to difficulties in conducting genetic studies. Multiple
chromosome regions are implicated with numerous phenotypes of allergic diseases,
indicating the genetic heterogeneity of allergies. Candidate gene approach and
positional cloning are some of the techniques used to identify genes related to
allergic diseases. Candidate gene approach is used to identify disease genes through
polymorphisms in known genes. On the other hand, positional cloning involves
16

linking suspected chromosomal regions with a disease through genetic markers [55,
56].
Several loci have been linked with IgE-mediated allergy by candidate gene approach.
IgE-mediated allergy to short ragweed pollen allergen Ra5 has been reported to be
involved with an allele of the HLA-DR (Human Leukocyte Antigen-antigen D
Related) locus [57]. Furthermore, polymorphisms of the β-chain of the FcεRI
receptor and IL-4 family of cytokine genes on chromosome 5 have been linked with
IgE-mediated allergy [58, 59]. However, candidate gene studies had yielded some
conflicting reports as well. For example, some alleles found to be linked with asthma
were independent of raised IgE levels and other markers of IgE-mediated allergy
[60].
Positional cloning studies have linked several chromosomes and chromosomal
regions with allergic phenotypes, in particular with asthma and rhinitis. Diverse
populations have been used for positional cloning studies. However, majority of the
studies have included predominantly Caucasian populations. Some recently reported
allergy related genes are ADAM33 on chromosome 20p, SPRINK5 on 5q31-35,
IRAKM on 12q, DPP10 on 2q14-32, GPRA on 7p, HLA-G on 6p21 and PHF11 on
13q14 [61-67]. A common finding in many studies was the existence of multiple
susceptible loci in many linkage regions of chromosomes. Positions 31 to 35 on the
long arm of chromosome 5 have shown to harbour multiple genes related to
pathological mechanisms of allergy. Genes regulating Th1/Th2 polarization and IgE
production (i.e. IL-4, IL-13, TIM1 and TIM3), innate immunity (i.e. CD14) and
genes improving T cell adhesion (i.e. CYFIP2) are some examples for susceptible
genes on chromosome 5 with links to allergy [56, 59].
Study conducted by Tripathi et al., using Boston Birth Cohort (BBC) investigated the
link between allergic sensitisation to common environmental allergens, and 17
cockroach allergens with single-nucleotide polymorphisms (SNP) in known
candidate genes in the pathogenesis of allergic diseases. It was shown that SNPs near
or in JAK2, CNOT6, MAML1, CD40, IL-4R, and IL-5RA genes were associated
with allergic sensitisation. SNPs near or in JAK1, JAK3, IL-5RA, FCER1A, and
ADAM33 genes were associated with cockroach sensitisation. SNP rs6665683 in
FCER1A was shown to have a strong association with cockroach sensitisation and
high levels of specific IgE to cockroach allergens. Also SNP rs7851969 in JAK2
showed consistent association with sensitisation to house dust mite, and cockroach
allergens. Further validation to these findings can be brought by analysing the same
genes on different populations [68].
Large number of susceptibility genes for allergies have been uncovered by Genome-
wide association studies (GWAS). According to the Catalogue of Published
Genome-Wide Association Studies, there are about 40 GWAS for asthma and 3
GWAS for atopy been conducted along with a plethora of susceptible genes and loci.
However, association of a gene to allergic disease does not certainly imply biological
functionality. Therefore, follow-up studies are required to translate findings of
GWAS into the biological functionality, which will then enhance diagnosis and
therapeutics of allergies [69].
1.4.2 The environmental basis of allergic diseases
The rising incidence of allergic diseases cannot be justified by genetics alone. The
history of environmental exposure and life style of affected individuals are also
important risk factors of allergies. This dimension of the allergic diseases was
conceived from epidemiological studies, which illustrate the association between
human health and adverse environmental conditions. The change in the environment
could mean an addition of a risk factor such as infectious agents resulting in plagues.
18
However, the opposite is also true where an alteration in the environment results in
removal of a protective factor leading to diseases [70]. Based on this model,
epidemiologist David Strachan conceived the idea of hygiene hypothesis in his study
that used the 1958 British birth cohort [71]. Hygiene hypothesis regards infections in
early childhood as protective, which may prevent the development of allergies.
Hygiene hypothesis also states that this benefit of infections is lacking or limited in
highly developed regions of the world when compared to the rest of the world due to
sanitary living standards and advanced health care. Excessive cleanliness,
vaccinations and wide spread use of antibiotics commonly seen in the urban Western
lifestyle, are considered strong risk factors for development of allergies [70-72].
Even though, hygiene hypothesis is a well-accepted theory, there are evidence that
do not agree with it. In Japan, where hygiene standards are high, asthma levels are
much lower than in the United States or Australia. Also in the United States asthma
is reported to be high among children who live in very poor housing [73].
1.4.2.1 Cellular and molecular basis of hygiene hypothesis
The framework required to support hygiene hypothesis is laid down by both the
Th1/Th2 imbalance theory and early life events leading to allergic sensitisation. The
capacity to mount an immune response against common environmental allergens is
acquired even before birth. During the gestation period, the foetal immune cells
normally assume a Th2 and Tr1 type response. Therefore, foetus is exposed to high
concentrations of Th2 and Tr1 type cytokines. This is believed to be an adaptation by
the foetus to down-regulate maternal Th1 immune response against foeto-paternal
antigens, which may lead to foetal rejection. In addition, studies have demonstrated
that foetus is often exposed to allergens that cross the placenta from the maternal
19

circulation. Therefore, in-utero priming of T lymphocytes by allergens and allergen
sensitisation is possible [55, 74, 75].
However, after birth it has been suggested that a normal individual’s immune system
gradually changes to a Th1 type immune response against common environmental
allergens. By contrast, in potentially allergic individuals, further upregulation of Th2
type immunity takes place. It has been proposed that in healthy subjects the shift
from Th2 to Th1 immunity against allergens is achieved through the aid of
infections. Macrophages when engulfing microbes such as Mycobacteria and
Lactobacilli secrete IL-12, which is a known potent stimulator of Th1 lymphocytes.
Therefore, it is said that IL-12 rich environment drives the development of Th1
lymphocytes leading to down-regulation of Th2 lymphocytes [55, 74, 75].
1.4.2.2 Population based studies on hygiene hypothesis
Comparative studies conducted at the population level have provided some wide
spread support to hygiene hypothesis [19, 55]. One of the most informative studies
ever performed was the investigation of former East and West German populations
following the fall of Berlin wall in 1989. Unification of Germany allowed researches
to study genetically equal populations, which used to live under very different
environmental conditions for about four decades. Allergies such as hay fever in
particular were less common in East Germany than West Germany before
unification. However, after unification an increase in hay fever among children from
former East Germany was reported, with the advent of Western life style [76].
Furthermore, an inverse relationship between allergies and infectious diseases was
shown by serological studies conducted on hepatitis A, Helicobacter pylori,
Toxoplasma gondii, childhood measles and Mycobacterium tuberculosis. During
infections with such microbes, macrophages become active and secrete IL-12, which
20

promotes Th1 type immunity leading to down-regulation of Th2 immune response.
These findings explain why populations, particularly in Western Europe, North
America and Australia, exhibit a high degree of allergies due to the lack of infections
caused by high sanitary living conditions [19, 55].
1.5 Egg allergy
Allergy to hen’s (Gallus domesticus) egg is one of the most common forms of
childhood allergies seen in industrialised countries. The prevalence of egg allergy
sufferers in industrialised countries ranges from 1.6% to 3.2% [77, 78]. The
development of egg allergy generally occurs during infancy and resolves before the
school age. Sensitisation to egg allergens can occur even before birth in utero and
during breast-feeding. As a consequence, clinical reactions to eggs, even without
direct exposure, can occur in infants sensitised in such ways [79]. Egg allergens are
known to cause both IgE-mediated and non-IgE mediated allergic reactions.
However, the most common form of egg hypersensitivity is due to IgE-mediated
allergy. Clinical manifestations to egg allergy occur in various organ systems such as
the skin, the respiratory system and the gastrointestinal system. Some of the common
forms of clinical signs and symptoms of egg allergy are urticaria, angioedema,
asthma and vomiting. In infants, the most common clinical manifestation is atopic
dermatitis. Severe anaphylaxis due to egg allergy is possible, especially in patients
with acute IgE-mediated sensitivity to hen’s egg. For example, 7% of severe
anaphylactic reactions were reported due to egg ingestion in infants according to a
survey from Germany. Generally, fatal reactions due to eggs are uncommon, but
have been reported [78, 80].
Six allergenic proteins from both the albumen and the yolk have been identified from
the hen’s egg. The egg white contains four well known allergens, namely ovomucoid
21

(Gal d 1), ovalbumin (Gal d 2), ovotransferrin (Gal d 3) and lysozyme (Gal d 4) [78].
The egg yolk consists of two minor allergens known as α-livetin (Gal d 5) and yolk
glycoprotein 42 or YGP42 (Gal d 6) [81, 82]. The immunogenic properties of egg
white allergens have been extensively studied over the years [78]. Some of the
earliest studies reported the degree of allergenicity of egg white allergens to be in the
following order: lysozyme, ovomucin, ovalbumin and ovomucoid, based on skin
prick test (SPT) diagnosis. However, further studies demonstrated that ovomucoid to
be the dominant allergen followed by ovalbumin, ovotransferrin and finally
lysozyme [83-87].
Egg yolk proteome was not a popular subject for immunological studies like the egg
white [78]. However, a limited number of studies have confirmed egg yolk as a
source of allergenic proteins [78, 81, 82]. Currently, there could be many knowledge
gaps in regards to the allergenicity of the hen’s egg yolk. For example, the frequency
of recognition of egg yolk allergens in sensitised patients, T and B cell epitopes
relevant to yolk allergens and the association of egg white and egg yolk allergies still
remain to be investigated.
1.5.1 Allergy to egg yolk
Allergy to egg yolk is present in a considerable percentage of individuals however,
with much less prevalence and potency than allergy to egg white. Unlike egg white
allergy, which is commonly seen in young children with atopic dermatitis, egg yolk
allergy mostly affects during the adulthood. The underlying immunological
mechanism responsible for egg yolk allergy is IgE-mediated according currently
available reports, and usually produce symptoms such as urticaria, vomiting,
abdominal pain and diarrhoea [88-90].
22

The true existence of allergy to egg yolk was highly doubtful in the past despite well-
investigated reports on anaphylactogenic properties of egg white constituents.
Although sensitisation to egg yolk had been reported before, its actual existence were
not confirmed and the general notion was that allergy to egg yolk cannot occur
without the existence of egg white allergy [91].
However, Rubin SS., for the first time presented a case of a genuine sensitisation to
egg yolk independent of egg white allergy [91]. The report describes the case of a
19-year-old soldier, who was diagnosed with angioneurotic oedema following typhus
fever and yellow fever vaccines. According to the patient’s medical history, he was
not able to tolerate eggs but was able to consume hard-boiled egg white without any
complications. SPTs on the patient were positive for egg yolk and negative for egg
white, chicken feathers and chicken meat [91].
Yellow fever and typhus fever vaccines are cultured in chick embryos and yolk sacs,
respectively. It had been shown that those vaccines contain egg yolk constituents.
Considering the patient’s medical history and SPT results, the author was able to
conclude definitively that the allergic manifestations were due to egg yolk
components in the administered vaccines. As a result, this case report confirmed the
fact that genuine sensitisation to egg yolk exists and that it can occur without
concomitant egg white sensitivity [91].
1.5.2 Allergens in the hen’s egg Yolk
1.5.2.1 Chicken serum albumin (Gal d 5)
Chicken serum albumin (CSA) also known as α-livetin, is Gal d 5 the first allergen
identified from the hen’s egg yolk. Gal d 5 is synthesised in the liver of laying hens
and present in both the blood circulation and the egg yolk [82, 92]. It is a water-
23

soluble globular glycoprotein with a molecular weight of 69 kDa. Gal d 5 had been
confirmed as an inhalant allergen as well as a food allergen through bronchial
provocation and oral challenge tests, respectively. Gal d 5 is a partially heat resistant
allergen, thus some patients are able to tolerate extensively heated egg yolk, but not
raw egg yolk. The main route of sensitisation for Gal d 5 is through the respiratory
tract as seen in bird-egg syndrome [82].
Table 1.2: The six main allergens from the hen’s egg white and the yolk (allergen data obtained from www. allergen.org) Allergen name Source of
the allergen Biochemical name(s) MW(SDS-PAGE)
kDa Gal d 1 Egg white Ovomucoid 28 Gal d 2 Egg white Ovalbumin 44 Gal d 3 Egg white Ovotransferrin 78 Gal d 4 Egg white Lysozyme 14 Gal d 5 Egg yolk Chicken serum albumin/α-
livetin 69
Gal d 6 Egg yolk YGP42 35
1.5.2.2 The bird-egg syndrome
Bird-egg syndrome is an IgE-mediated hypersensitivity disorder. In bird-egg
syndrome, allergy to egg yolk develops, following sensitisation to inhalant avian
antigens derived from sources such as bird’s blood serum, feathers, droppings and
dander [89]. This is different to cross reactivity, where a patient allergic to a certain
allergen reacts to homologous or non-homologous allergens from the same or
different species [93, 94]. In bird-egg syndrome, sensitisation and allergy to egg yolk
occurs due to a common allergen present in both avian antigens and the egg yolk.
The common allergen present in hen’s egg yolk and other avian antigens is Gal d 5
[90, 92].
Most patients with bird-egg syndrome have regular exposure to pet birds or poultry
where sensitisation to inhalant avian antigens occurs. Patients with bird-egg
24
syndrome suffer from both respiratory and gastrointestinal allergic symptoms such as
asthma, rhinoconjunctivities, oedema, diarrhoea and vomiting. Unlike allergy to egg
white, which is predominantly seen in children with atopic dermatitis, bird-egg
syndrome mainly affects adults with an obvious gender predisposition where
majority of patients tend to be females [89, 90]. The higher number of females
reported in these studies may just relate to higher number of females in the poultry
industry. However, in the study conducted by Quirce et al., majority of the patients
with bird-egg syndrome was males [82]. Furthermore, allergens produced by birds at
workplace may also increase IgG levels in excess and can lead to allergic alveolitis.
Currently, these IgG levels can be quantified and qualitatively evaluated using the
UniCAP system, a type of ImmunoCAP [95]. Furthermore, radioallergosorbent test
(RAST) inhibition experiments had demonstrated inhibition of IgE binding to
livetins of hen’s egg yolk by avian antigens from different bird species. This result
indicates that serum proteins from different bird species have highly conserved
epitopes which allow specific IgE antibodies to cross react [89].
1.5.2.3 YGP42 (Gal d 6)
Gal d 6 is the second allergen identified from the hen’s egg yolk. It is a glycoprotein
with a molecular weight of 35 kDa. Gal d 6 is the C-terminal fragment of
vitellogenin-1 (VTG-1) precursor, which is a serum lipoprotein specific for laying
hens. VTG-1 is produced in the liver of laying hens and transported into the growing
oocyte by receptor-mediated endocytosis. Following delivery into the oocyte, VTG-1
precursor is enzymatically cleaved into several fragments giving rise to mature
proteins lipovitellin-1, phosvitin, lipovitellin-2 and YGP42 [81, 96].
Gal d 6 contains three glycosylation signals at positions 1662, 1698 and 1703. The
periodate oxidation treatment of Gal d 6 does not abolish the IgE binding capacity,
25

indicating that sugar residues are not related to allergenicity. Furthermore, heat
treatment and reduction does not affect the allergenicity of Gal d 6. However,
simulated gastric acid digestion completely eliminated its IgE reactivity. Gal d 6 was
also investigated for any implication in bird-egg syndrome. The inhibition
immunobloting experiments did not demonstrate any degree of inhibition of
allergens from chicken meat and feather extracts. Therefore, Gal d 6 is not
considered to be involved in bird-egg syndrome [81].
1.5.2.4 Other IgE binding proteins in the egg yolk
Apart from the recently discovered egg yolk allergens Gal d 5 and Gal d 6, few other
proteins from the hen’s egg yolk proteome have exhibited a possible allergenic
potential [97, 98]. Three abundant egg yolk proteins from the egg yolk known as
apovitellenin I, apovitellenin VI and phosvitin have demonstrated substantial IgE
binding capacity among egg allergic patients. Furthermore, all of these proteins were
found to effectively inhibit binding of egg yolk specific IgE. However, the clinical
relevance of these proteins in relation to food allergy has not been established so far.
Therefore, their status as allergens still remains uncertain [98].
1.5.3 Diagnosis of egg allergy
Several diagnostic tools must be used to confirm egg allergy in an individual.
Diagnosis of egg allergy usually commences with an investigation of medical history
and physical examination looking for evidence of clinical reactivity to eggs. Next
steps may involve in vitro and in vivo diagnostic tests. Some of the commonly used
diagnostic tests are the measurement of allergen-specific IgE antibodies, SPT, atopy
patch tests, diagnostic elimination diets and oral food challenges (OFC) [80]. SPT
involves introducing allergens into the skin using a lancet to detect egg specific IgE
26

antibodies [99]. The reliability of SPT depends on the quality of the allergen extract
used. A wheal size greater than or equal to 3 mm is considered positive for egg
allergy when a clear clinical history is taken into account. However, SPTs have a
poor positive predictive value (PPV). Therefore, a positive SPT result without a
clinical history may not indicate egg allergy. A negative SPT essentially rule out
IgE-mediated egg allergy since it has a high negative predictive value (NPV) [80,
100, 101].
Egg allergen specific IgE antibodies can be quantified using standardized in vitro IgE
assays. As in SPT, the accuracy of the result heavily depends on the quality of the
allergen extracts used. The predictive values for egg specific IgE for diagnosis
reported by various study groups are not consistent. These variations are mainly due
to the different parameters used in the studies. Therefore, it has been recommended
to consider the relevant variables when determining cut-off levels in patient
populations [102, 103].
To date, the gold standard for diagnosis of all food allergies is double blind placebo
controlled food challenge (DBPCFC). The major drawback of challenge tests is that
it can trigger potentially life threatening allergic reactions. Therefore, challenge tests
are only conducted by trained health care personal with adequate facilities. DBPCFC
are widely used in diagnosis of egg and milk allergy however, requires substantial
improvements for implication in everyday practice [102].
1.5.4 Management of egg allergy
Currently, there is no cure for allergies. Therefore, patients are required to undergo
management according to the guidelines prepared by dieticians and clinicians. Egg
avoidance is essential in managing egg allergy. Avoidance of eggs when they are
27

prepared in a recognizable form can be easily achieved. However, avoiding eggs in
manufactured food products and contaminated food can be challenging. Furthermore,
mothers nursing infants, who are known to be sensitised to eggs, must also take extra
care since breast milk can contain egg allergens derived from the diet. Therefore,
mothers may have to depend on an egg free diet if infants develop clinical reactions
following breast feeding [104]. An egg free diet does not impose the risk of
nutritional deficiency unless there are additional dietary limitations such as
vegetarian diet or multiple food allergies. If such situation arises, a dietician should
be consulted [101].
Apart from dietary elimination of eggs, patients may have to avoid vaccines derived
from chicken eggs. Measles, mumps and rubella (MMR), influenza and yellow fever
vaccines are cultured in chicken eggs. Influenza and yellow fever vaccines both
contain measurable quantities of egg proteins both from the albumen and the yolk
and patients with egg allergy have reacted adversely following administration of
these vaccines. Patients with mild egg allergy are capable of receiving the
vaccination with minimal or no side effects. However, for patients with severe egg
allergy, administration of vaccines is not generally recommended. However, MMR
vaccine is deemed safe to administer to egg allergic patients. A large scale study that
vaccinated egg allergic children showed no risk of severe allergic reactions [100,
101, 105].
In egg allergy, provision of emergency medication commonly involves the use of
antihistamines and adrenaline. Antihistamines are administered orally and are
recommended to treat mild reactions. Adrenaline is available as a self-injectable auto
injector and is recommended in the event of severe allergic reactions. Both
28

medications provide symptomatic relief by reversing the effects of chemical
mediators released during the allergic reaction [100, 101, 105].
As for treatment strategies at experimental level, some progress has been made in
increasing tolerance to eggs by means of oral immunotherapy, also known as oral
tolerance induction (OTI). OIT has demonstrated successful results in peanut allergy.
It has been shown that early consumption of peanuts in infancy to result in reduction
of peanut allergy. These findings indicate that consumption of peanuts during
infancy may result in prevention of developing peanut allergy [106]. Although some
patients were able to tolerate certain doses of egg proteins, none of them were able to
tolerate the complete dose. The efficiency of OTI is still questionable since it is not
clear whether partial tolerance is resulted by OTI or due to spontaneous allergy
resolution and therefore, it requires further investigations [104, 105, 107]. Based on
the current results, OTI is still not recommended for use in routine clinical practice
[105].
1.6 A potential cure for allergies: Allergen-specific immunotherapy
Allergen-specific immunotherapy (SIT) is the only treatment strategy that has
demonstrated a curative potential in allergies [108]. SIT involves gradually
administering allergen extracts to the patient in order to increase the capacity of the
immune system to tolerate allergens [109, 110]. The allergen extracts used in
immunotherapy are now known as allergen vaccines since they have the capacity to
act as immune modifiers [111]. The traditional route of administration of
immunotherapy is subcutaneously and known as injection immunotherapy. Injection
immunotherapy is known as the most efficient form of immunotherapy. Nasal, oral,
intra-lymphatic and sublingual are some other forms of immunotherapy. [109-111].
29
Injection immunotherapy is proven to work well with insect venom allergy,
especially for Hymenoptera venom allergy. In fact, venom immunotherapy is now
approved as the standard care for Hymenoptera venom allergy. Furthermore, some
clinical trials have demonstrated promising results with allergen SIT for pollen
allergy and house dust mite allergy [111, 112]. Injection immunotherapy also had
limited success in reducing clinical reactivity in patients allergic to fruits, vegetables
and tree nuts [107]. Despite these successes, immunotherapy for food allergies is still
deemed unsafe. The last injection immunotherapy trial conducted to treat peanut
allergy resulted in failure. Majority of patients in the test group produced severe
adverse reactions following injection immunotherapy. Therefore, injection
immunotherapy for food allergies is currently abandoned [111, 113, 114].
The mechanism on how tolerance is achieved during immunotherapy is not well
understood. Recent studies have shown that immunotherapy causes a change in the
overall Th cell response by increasing Th1 differentiation and reversing Th2 into
Th0. As a result of this immune deviation, the immune system increases the
production of IgG1 and IgG4, while decreasing the production of allergen specific
IgE [115]. Further observations during immunotherapy include an increase in CD8+
cells and reduction in inflammatory cell recruitment, activation and mediator
secretion [111, 115].
1.7 The application of recombinant DNA technology in allergy diagnosis and SIT
Commercial allergen extracts, derived from natural sources, have many drawbacks
that cannot be resolved by any practical methods currently available. Natural allergen
products are often contaminated with various allergenic and non-allergenic
substances. In some cases, the allergen of interest is very low or absent. Therefore,
30

patients undergoing treatment with natural allergen extracts face the risk of
developing new sensitisations. Furthermore, precise diagnosis of allergic diseases is
difficult with the use of natural allergen preparations due to the contamination issue
[115-118].
For successful diagnosis and SIT of allergic diseases, the purity and the definition of
the allergen extracts are crucial. The above-mentioned difficulties associated with
commercial allergen extracts can be successfully overcome with the use of
recombinant DNA technology. With the use of recombinant DNA technology,
recombinant allergens can be harvested in unlimited amounts with properly defined
immunological, biological and molecular features. Recombinant allergens can be
produced to mirror the IgE-reactivity of natural allergens for diagnosis and are
already in use for clinical diagnosis [115-118].
Furthermore, recombinant allergens can be genetically engineered to produce
hypoallergens with reduced IgE-binding activity. Advantages of using recombinant
based hypoallergens over natural allergens in SIT are two-fold. Firstly, hypoallergens
offer improved safety due to low IgE-reactivity. Secondly, the dose that can be safely
administered to patients can be increased. Therefore, the efficacy of hypoallergen
based SIT can also rises with the dose increments [116]. The first injection
immunotherapy trial conducted with recombinant based hypoallergenic variants of
the major birch pollen allergen Bet v 1 was highly successful. Patients that
underwent immunotherapy showed strong IgG antibody response against the Bet v 1
allergen and exhibited reduced clinical reactivity during subsequent birch pollen
seasons [116, 119].
31

1.8 Aims of this study As described above, very little is known about allergy to egg yolk. The existence of
allergy to hen’s egg yolk was highly doubted by many in the past. Recent discovery
of allergens Gal d 5 and Gal d 6 has spurred much interest in hen’s egg yolk allergy.
However, in depth investigations involving hen’s egg yolk in relation to food allergy
has been rarely performed. Therefore, allergy to hen’s egg yolk is still a developing
area. The use of recombinant allergens has been a very popular approach in the field
of allergy for both diagnosis and therapy due to the many advantages they offer.
However, to date, production of recombinant versions of hen’s egg yolk allergens
Gal d 5 and Gal d 6 have not been reported in the literature. Thus, the main focus of
this PhD project was to investigate allergy to hen’s egg yolk in humans, mainly at
molecular level, and to produce recombinant versions of hen’s egg yolk allergens.
The work of this thesis was conducted in order to provide a better understanding and
fill research gaps in knowledge regarding allergy to hen’s egg yolk. Below is a brief
description of the research hypotheses addressed and the manner in which they were
investigated in this PhD project.
In Chapter 2, I investigated the in vitro IgE-reactivity of hen’s egg yolk proteins
using molecular and proteomic methods. Furthermore, in addition to hen’s egg yolk I
included egg yolks from emu and quail in some of the work conducted. The first aim
of this study was to investigate the existence of sensitisation to egg yolk proteins
from hen, emu and quail in patients with allergy to hen’s egg white. It was
hypothesised that majority of patients diagnosed with allergy to hen’s egg white
would have concomitant sensitisation to egg yolk proteins. Here, Western
immunoblot was used as a rapid method of identifying IgE reactive proteins using
sera from a cohort of 25 egg white allergy patients. The second aim of this chapter
32

involved identifying the IgE-reactive egg yolk proteins from all of the bird species
used in the Western immunoassays. The third and final aim of Chapter 2 was to
produce a recombinant version of hen’s egg yolk allergen Gal d 6 as a soluble
fraction in an E. coli expression system. It was hypothesised that cloning and
expression of complementary DNA (cDNA) coding for Gal d 6 in E. coli would
allow production of an IgE-reactive recombinant Gal d 6 as a soluble fraction.
In Chapter 3, the main objective was to produce an IgE reactive recombinant version
of hen’s egg yolk allergen Gal d 5 as a soluble fraction. Firstly, an E. coli expression
system was used to clone and express recombinant Gal d 5. It was hypothesised that
cloning and expression of cDNA coding for Gal d 5 in E. coli would allow
production of an IgE-reactive recombinant Gal d 5 as a soluble fraction. However,
the hypothesis was rejected as 100% of the recombinant Gal d 5 was expressed as an
insoluble fraction by E. coli. Therefore, as an alternative method I used an eukaryotic
protein expression system Kluyveromyces lactis (K. lactis) yeast strain. Here, I
hypothesised that the cloning of cDNA coding for mature Gal d 5 in frame with the
yeast secretion signal would allow production of recombinant Gal d 5 as a secreted
protein. Finally, in this chapter, we comparatively analysed the IgE-binding
reactivity of recombinant and natural Gal d 5 using sera from egg white allergy
patients.
In Chapter 4, the main objective was to produce a recombinant based mutant variant
of Gal d 5 with reduced IgE binding capacity in order to develop a hypoallergen for
potential use in immunotherapy in the future. In this Chapter, site directed
mutagenesis (SDM) technique was used to disrupt disulfide bonds of Gal d 5 to
synthesize a mutant Gal d 5 DNA. Then cDNA coding for mutant Gal d 5 was cloned
33

into K. lactis for recombinant protein expression. It was hypothesised that
recombinant Gal d 5 with a modified conformation resulted by disulfide bond
disruption would reduce or completely impair interaction with IgE antibodies.
However, K. lactis yeast expression system failed to express the mutant Gal d 5
despite successful cloning. Therefore, as an alternative approach I expressed mutant
Gal d 5 as a soluble fraction in an E. coli expression system. The recombinant based
mutant Gal d 5 was then comparatively analysed with wild-type recombinant Gal d 5
to evaluate the IgE-binding capacity, which successfully demonstrated reduction in
IgE binding.
The Chapter 5, which is the final chapter of this PhD thesis, discuss the findings
presented in Chapters 2-4. All the findings are summarised and presented in Chapter
5 and explains how the work of this PhD project has contributed to improve
knowledge regarding allergy to hen’s egg yolk. Furthermore, this chapter also
provides future directions of the current project.
34

Chapter 2: Immunological analysis of egg yolk proteins from hen, quail and emu and production of recombinant Gal d 6 in E. coli
Publication: De Silva C, Dhanapala P, Doran T, Tang MLK & Suphioglu C (2016): Molecular and immunological analysis of hen’s egg yolk allergens with a focus on YGP42 (Gal d 6), Molecular Immunology: 71: 152-160.
35

2.1 Introduction
Hen’s egg has been a very popular diet in most regions of the world since ancient
times [120]. Nevertheless, immunological hypersensitivity to hen’s egg is present in
a significant percentage of children [121, 122]. The major allergens are found in the
egg white. On the other hand, egg yolk is also reported to exhibit low level
allergenicity in humans [78]. Food allergy can be divided into primary and secondary
food allergies based on the sensitisation process. Allergic hypersensitivity reactions
independent of sensitisation to offending food source is defined as primary food
allergies. Secondary food allergy is defined as allergic hypersensitivity reactions
arising as a result of initial sensitisation to offending food source. A study has
demonstrated that approximately 9.4% and 5.5% of the population are affected by
primary and secondary food allergies, respectively [123]. In adults, secondary food
allergy often follows primary food allergy caused by inhalant or contact allergens.
Secondary food allergy is mainly attributed to cross-reactive IgE antibodies that
recognize homologous sequences among allergens. On the other hand, primary food
allergies are mainly seen in children caused by the offending food allergens [123,
124].
Clinical studies have shown that sensitisation to egg white allergens precede onset of
clinical reactivity to hen’s egg yolk. Development of egg allergy starts with
sensitisation to Gal d 1 and Gal d 2. However, during the course of the disease,
patients tend to produce IgE antibodies against other egg white allergens (Gal d 3
and Gal d 4) and finally against egg yolk allergens. Furthermore, IgE reactivity to
Gal d 5 has been identified as a marker for egg yolk sensitisation. Nevertheless, not
all egg yolk allergic patients react with Gal d 5 and therefore, Gal d 6 or other
36

potential egg yolk allergens, such as apolipoproteins, may play a role in development
of allergy to egg yolk [98, 124].
Patients suffering from allergy to hen’s egg face significant challenges in terms of
quality of life. Due to the lack of cure for egg allergy, avoidance of eggs and egg
derived food products represents the sole strategy to manage the condition. As a
consequence, there is a current trend towards consuming eggs from different bird
species such as quail, duck, turkey (Meleagris gallopavo), sea-gull and emu
(Dromaius novaehollandiae), as an alternative to hen’s egg. Nevertheless, clinical
and serological cross-reactivity between hen’s egg allergens and proteins from other
bird eggs such as turkey, duck, goose and sea-gull have been reported [125].
Additionally, allergy to quail, duck and goose eggs, independent from allergy to
hen’s egg, have been reported as well [120, 126].
Current data regarding hypersensitivity to bird eggs suggest that diagnosis of egg
allergy should include discrimination of egg white and the yolk proteomes at
molecular level. For proper patient management, in detail diagnosis, based on
molecular techniques, may equip clinicians to provide better dietary advice. As a
result, patients can avoid unnecessary dietary restrictions leading to improvements in
quality of life. An important requirement for successful molecular based diagnosis is
the availability of well-defined standardized allergen preparations. A popular
approach for developing allergen preparations for diagnosis is the use of recombinant
DNA technology to produce recombinant allergens that mimic the IgE-reactivity of
their natural counterparts [116].
The overall objective of this chapter was to subject egg yolk proteins of hen, emu
and quail using immunological, proteomic and molecular methods in order to shed
light on egg yolk allergy. The first aim of this chapter involved investigating the
37
sensitisation profiles of egg white allergic patients and compared in vitro IgE
reactivity of egg yolk proteins from hen, emu and quail eggs. Furthermore, we
discriminately analysed free range and caged chicken eggs in order to investigate if
different environmental conditions of laying hens would influence the allergenicity
of the egg yolk proteins. In this chapter, we used a cohort of 25 patients diagnosed
with allergy to hen’s egg white using in vitro immunological methods.
The second objective of this chapter involved producing an immunologically active
recombinant hen’s egg yolk allergen Gal d 6 (rGal d 6). In this chapter, we present
the successful expression of rGal d 6 as a soluble fraction in E. coli. rGal d 6 was
then subjected to in vitro immunological analysis using patients’ serum sensitised to
natural Gal d 6 (nGal d 6) to compare its’ allergenicity with crude hen’s egg yolk
extract.
2.2 Materials & methods
2.2.1 Immunological analysis of hen, quail and emu egg yolk extracts
2.2.1.1 Human patients’ sera
Sera from 25 patients allergic to hen’s egg white and non-allergic individuals as
healthy controls were obtained from the Royal Children’s Hospital (Melbourne, VIC,
Australia). The egg white specific IgE levels of patients are shown in Table 2.1.
Experimentation involving patients’ sera was conducted in compliance with the
National Statement on Ethical Conduct in Human Research (2007) with approval
from Deakin University Faculty of Science, Engineering and Built Environment
Human Ethics Advisory Group (HEAG), with a project approval number of STEC-
34-2013-DHANAPALA.
38

Table 2.1: The levels of allergen specific IgE antibodies against egg white determined by ImmunoCAP (Phadia)
Patient number
IgE level (IU/mL) against hen’s egg white
1 93.50
2 28.80
3 13.60
4 9.26
5 13.20
6 8.63
7 6.89
8 18.50
9 16.50
10 4.13
11 3.62
12 1.02
13 1.21
14 1.32
15 1.72
16 2.08
17 2.21
18 2.58
19 1.78
20 1.19
21 1.25
22 1.05
23 0.32
24 0.18
39
Patient number
IgE level (IU/mL) against hen’s egg white
25 0.47
2.2.1.2 Preparation of crude egg yolk extracts (CEY) from hen, quail and emu eggs
Chicken (White Leghorns) and emu eggs were provided by the Australian Animal
Health Laboratory (AAHL, Geelong, VIC, Australia). Caged chicken eggs, free-
range chicken eggs and quail eggs were bought from a local market. Shelling and
separation of the egg yolk from the albumen was performed manually. In order to
minimize egg white contamination, intact yolks were rinsed thoroughly with
deionized water (dH2O) and rolled on a filter paper to remove remaining residual egg
white as much as possible. The vitelline membrane was pierced using a pair of
tweezers and the yolk constituents were extracted with a pipette. The solubilisation
of egg yolk samples was based on the method published by Guilmineau et al., [127].
One volume of egg yolk was mixed with 12 volumes of 0.1 M glycine/NaOH buffer
(pH 9; 0.56 NaCl) and kept overnight at 4°C to equilibrate.
2.2.1.3 SDS-PAGE analysis of CEYs of hen, quail and emu eggs
Novex 4-20% Tris-Glycine gels (Thermo Fisher Scientific®, Waltham, MA, USA)
were used for all sodium dodecyl sulfate-polyacrylamide gel electrophoresis (SDS-
PAGE) under reducing and denaturing conditions. Approximately 25 μg of protein
was applied per lane. The CEY samples were prepared by dissolving in Novex Tris-
Glycine SDS sample buffer (2×) (Thermo Fisher Scientific®, Waltham, MA, USA),
NuPAGE sample reducing agent (10×) (Thermo Fisher Scientific®, Waltham, MA,
USA) and dH2O. The egg yolk samples were mixed by pipetting and heated at 85°C
for 2 minutes prior electrophoresis. SeeBlue pre-stained protein standard (Thermo 40

Fisher Scientific®, Waltham, MA, USA) was used as the molecular weight marker.
Electrophoretic separation was performed using an X-Cell SureLock Mini-Cell
system (Thermo Fisher Scientific®, Waltham, MA, USA) applying a constant voltage
of 125 V for 90 minutes. The protein bands were then stained for visualization using
SimplyBlue SafeStain (Thermo Fisher Scientific®, Waltham, MA, USA).
2.2.1.4 Western immunoassay of CEYs
2.2.1.4.1 Western immunoassay of hen’s CEY with individual patients’ sera
For the immunoassay with individual patients’ sera, only CEY prepared from hen’s
eggs provided by AAHL was used. Following SDS-PAGE, proteins were electro-
transferred on to nitrocellulose membranes using X-Cell II Blot Module system
(Thermo Fisher Scientific®, Waltham, MA, USA). The egg yolk immobilised
nitrocellulose membranes were developed using WesternBreeze® Chromogenic
Western Blot Immunodetection Kit according to manufacturer’s instructions
(Thermo Fisher Scientific®, Waltham, MA, USA). Following transfer, the
nitrocellulose membrane was stained with Ponceau S solution (Sigma-Aldrich, MO,
USA) for visualization of proteins. Lanes containing the CEY profiles were cut into
individual strips. Then all nitrocellulose membrane strips were destained with 0.1 M
NaOH and immediately blocked using the blocking solution (hammersten casein
solution) provided in the kit. Then, egg yolk immobilised strips were individually
incubated overnight at 4°C with patients’ sera (patient no. 1 to 25) (diluted 1:10 in
blocking solution) and 5 non-allergic subjects’ sera (diluted 1:10 in blocking
solution) as negative controls. Then, unbound antibodies were removed by washing
the serum-incubated nitrocellulose strips four times in the antibody wash solution
provided in the kit for 5 minutes. Following washing, all serum-incubated
nitrocellulose strips were incubated with monoclonal anti-human IgE mouse 41

antibodies labelled with alkaline phosphatase (diluted 1:1000 in blocking solution)
(Sigma-Aldrich, MO, USA) for 2 hours at room temperature. CEY immobilised
strips without any serum incubations, (“no serum” negative controls) were incubated
for 2 hours at room temperature with anti-human IgE mouse antibodies labelled with
alkaline phosphatase (diluted 1:1000 in blocking solution). Then all the nitrocellulose
strips were washed with antibody wash solution. The signal was developed by adding
5-bromo-4-chloro-3’indolyphosphate p toluidine/nitro-blue tetrazolium chloride
(BCIP/NBT) chromogenic substrate. This immunoassay was repeated one more time
to ensure the reproducibility. The blot IgE reactivity for each IgE-reactive protein
was then analysed by eye.
2.2.1.4.2 Western immunoassay of hen, quail and emu CEYs with pooled patients’ sera
A second Western immunoassay was conducted using a pool of sera (diluted 1:10 in
blocking solution) composed from patients 1, 3, 10, 14, 15, 16 and 25, against all
CEYs. SDS-PAGE of CEY samples was conducted according to method mentioned
in section 2.2.1.3. Then, separated CEYs were electro-transferred on to nitrocellulose
membranes and developed according to the method mentioned in Section 2.2.1.4.1.
Another Western immunoassay was carried out using a pool of non-allergic
individuals’ sera (diluted 1:10 in blocking solution) as a negative control. This
immunoassay was repeated one more time to ensure the reproducibility.
2.2.1.5 Proteomic analysis of IgE reactive proteins from CEYs
The IgE reactive protein bands were excised from SDS-PAGE gels and subjected to
liquid chromatography-tandem mass spectrometry (LC-MS/MS). The proteins were
in-gel digested with trypsin and incubated overnight at 37°C. Then, analysis of
digested peptide mixtures was carried out at Bio21 Institute (Melbourne, VIC,
42

Australia) on a LTQ Orbitrap Elite (Thermo Fisher Scientific®, Waltham, MA, USA)
coupled to an Ultimate 3000 RSLC nanosystem (Dionex, Sunnyvale, CA). Analysis
of data was done using a Proteome Discoverer (Thermo Fisher Scientific® version
1.4) with a MASCOT search engine against the BIRDS database.
Carbamidomethylation of cysteine was set as the fixed modification while oxidized
methionine was set as the variable modification. The precursor mass tolerance was
set at 10 ppm and fragment mass tolerance was set at 0.6 Da. One missed cleavage
was allowed.
2.2.2 Cloning and expression of Gal d 6 in E. coli expression system
2.2.2.1 Strains, vectors and growth conditions
NEB Express Iq Competent E. coli cells (New England Biolabs (NEB), Ipswich, MA,
USA) were used as the cloning and expression host. E. coli cells were grown in
lysogeny broth (LB) supplemented with 50 µg/mL ampicillin at 37°C. pTrcHis A
expression vector (Thermo Fisher Scientific®, Waltham, MA, USA) contains the
ampicillin resistance gene (β-lactamase), which allows growth on media containing
ampicillin. The selection of E. coli cells transformed with pTrcHis A vectors were
performed by growing on LB agar medium supplemented with 50 µg/mL ampicillin
at 37°C.
2.2.2.2 Extraction of Poly A+ mRNA from chicken liver
Animal experimentation/sampling was conducted under protocol AEC1496,
approved by the Australian Animal Health Laboratory, Commonwealth Scientific
and Industrial Research Organisation (AAHL-CSIRO) Animal Ethics Committee and
in accordance with the Australian code of practice for the care and use of animals
for scientific purposes.
43

Total messenger ribonucleic acid (mRNA) from chicken liver was extracted using
Oligotex Direct mRNA kit (QIAGEN, Hilden, Germany) according to the
manufacturer’s instructions. All the centrifugation steps were carried out at 13, 000
rpm. A freshly harvested liver from an egg laying hen was stabilized in RNA
stabilization reagent RNAlater, which was provided by AAHL (Geelong, VIC,
Australia). The liver tissue was immediately frozen in liquid nitrogen upon removal
from RNAlater and ground until a fine powder was formed using a sterile mortar and
pestle. 186 mg of tissue powder was measured in a sterile liquid nitrogen cooled 15
mL tube and mixed with 2 mL of buffer OL1 containing 0.42 M β-mercaptoethanol
(β-ME). 700 µl of the resulting lysate was transferred into a QIAshredder spin
column, contained in a 2 ml collection tube and centrifuged for 2 minutes. 1.2 mL of
buffer ODB was added to the lysate and mixed by pipetting prior centrifugation for 3
minutes. The supernatant was transferred into a sterile microcentrifuge tube and 165
µL of Oligotex suspension was added to the sample and mixed by vortexing. The
mixture was incubated at room temperature for 10 minutes and centrifuged for 5
minutes to pellet the Oligotex: mRNA complex. The supernatant was discarded.
Oligotex: mRNA pellet was then resuspended in 200 µL of buffer OL1 containing
0.42 M β-ME and mixed by vortexing. Then, 400 µL of buffer ODB was added to
the sample and incubated at 70°C for 3 minutes and placed at room temperature for
10 minutes. Oligotex: mRNA complex was then pelleted by centrifugation for 5
minutes. The supernatant was discarded and the pellet was resuspended in 400 µl of
buffer OW1 by vortexing. The lysate was then transferred into a small spin column
placed in a sterile microcentrifuge tube and centrifuged for 1 minute. The flow-
through was discarded. The spin column was centrifuged again for 1 minute and the
flow-through was discarded. Then, 600 µL of buffer OW2 was added on to the spin
column and centrifuged for 1 minute in a new sterile microcentrifuge tube. The flow-
44

through was discarded. The spin column was centrifuged again for 1 minute and the
flow-through was discarded. The spin column was then transferred into a new
RNase-free microcentrifuge tube and 200 µL of hot (70°C) buffer OEB was loaded
on to the column. The resin was resuspended in buffer OEB by pipetting and
centrifuged for 1 minute to elute mRNA. The concentration of the collected mRNA
sample was measured using a Thermo Fisher Scientific® NanoDrop™ 1000
spectrophotometer.
2.2.2.3 Reverse transcription polymerase chain reaction (RT-PCR) amplification of Gal d 6
The RT-PCR amplification of Gal d 6 was performed using OneStep RT-PCR kit
(QIAGEN, Hilden, Germany) according to manufacturer’s instructions.
Oligonucleotide primers used for amplification of Gal d 6 gene were based on the
sequence published for VTG-1 precursor in Genbank (Genbank accession number:
D89547). The sequence that code for Gal d 6 of the VTG-1 gene was amplified with
oligonucleotide forward primer 5’-CGCGGATCCCCTGAAATAGCTTCACAAAT
AGCAC-3’ and oligonucleotide reverse primer 5’-CGCGAATTCTTAACTACAGT
CACCAGTGCAG-3’. BamHI and EcoRI restriction sites were incorporated into 5’
ends of the forward and reverse primers, respectively for cloning (restriction sites
underlined in the primer sequences). Furthermore, a 5’ CGC extension sequence was
added to each primer in order to increase the cleavage efficiency of the restriction
enzymes. The RT-PCR master mix was prepared by mixing 10 µL of 5× QIAGEN
One-Step RT-PCR buffer, 2 µL of 10 mM dNTP mix, 10 µL of 5× Q-solution, 1 µL
of 1 µM forward primer, 1 µL of 1 µM reverse primer, QIAGEN One-Step RT-PCR
enzyme mix and 170.82 ng of mRNA in a 50 µL total reaction volume in a sterile
PCR tube. The thermal cycler conditions used for RT step were 30 minutes at 50°C
45

for RT and 15 minutes at 95°C for activation of HotStart DNA polymerase. The
parameters used for the 3 step PCR cycling step were 35 cycles of 1 minute
denaturation at 94°C, 1 minute annealing at 53°C, 2 minute extension at 72°C and a
final 10 minute extension at 72°C.
2.2.2.4 Analysis and gel purification of PCR amplified Gal d 6 gene
The PCR product was electrophoretically analysed on 1% (W/V) agarose gel stained
with GelRed™ nucleic acid stain (Biotium, Hayward, CA, USA). The electrophoresis
was performed at 100 V for 45 minutes. Following electrophoresis, the PCR product
was purified using MinElute Gel Extraction kit (QIAGEN, Hilden, Germany)
according to manufacturer’s instructions. The gel section containing the PCR
fragment was excised using a sterile scalpel and weighed. 3 volumes of buffer QG
was added to 1 volume of gel (100 mg gel ~ 100 µL). The tube was incubated at
50°C for 10 minutes to dissolve the gel slice. Then, 1 gel volume of isopropanol was
added to the sample and mixed. The sample was applied to a MinElute column
placed in a 2 mL collection tube and centrifuged for 1 minute. The flow-through was
discarded. 500 µL of buffer QG was added to the tube and centrifuged for 1 minute.
The flow-through was discarded. Then, 750 µL of Buffer PE was added to the tube
and allowed to stand for 5 minutes prior centrifugation for 1 minute to wash. The
flow-through was discarded and the tube was centrifuged again for 1 minute to
remove residual wash buffer. The column was placed in a clean microcentrifuge
tube. Then, 50 µL of buffer EB was added to the centre of the MinElute column and
allowed to stand for 1 minute. The DNA was then eluted by centrifuging for 1
minute. The concentration of gel purified PCR sample was measured using a
NanoDrop™ spectrophotometer and stored at -20°C until needed.
46

2.2.2.5 Synthesis of pTrcHis A-Gal d 5 construct The restriction enzyme digestion of PCR amplified Gal d 6 and pTrcHis A plasmid
was conducted according to New England Biolabs (NEB) Time-Saver™ protocol. 1
μg of DNA was digested with 1 μL of BamHI, 1 μL EcoRI and 5 μL of 10×
NEBuffer 3.1 in a 50 μL total reaction volume. As a negative control, 1 μg of
pTrcHis A was mixed with 5 μL of 10× NEBuffer 3.1 in a 50 μL total reaction
volume without restrictions enzymes. All samples were then incubated at 37°C for 1
hour. Then, all three samples were electrophoretically analysed on 1% (W/V)
agarose gel stained with GelRed™ nucleic acid stain. The DNA samples were gel
purified using QIAquick Gel Extraction kit as mentioned in Section 2.2.2.3. The
concentrations of gel purified DNA samples were measured using a NanoDrop™
spectrophotometer and stored at -20°C until needed.
The ligation reaction was performed under standard conditions [23]. Equal amounts
(~30 ng) of digested Gal d 6 gene and linearized pTrcHis A were ligated with 1 μL
of T4 DNA ligase (New England Biolabs, Ipswich, MA, USA) and 10× T4 DNA
ligase reaction buffer (New England Biolabs, Ipswich, MA, USA) in a 10 μL total
reaction volume. As a negative control, approximately 30 ng of undigested pTrcHis
A plasmid vector was mixed with T4 DNA ligase and 10× T4 DNA ligase buffer in a
10 μL total reaction volume. Both samples were then incubated overnight at 4°C.
2.2.2.6 Chemical transformation of E. coli The ligation reaction was chemically transformed into competent E. coli according to
NEB high efficiency transformation protocol. A tube of chemically competent E. coli
cells was thawed on ice for 10 minutes. 5 µL of ligation reaction was added to the
cell mixture and mixed by flicking the tube 5 times. The tube was placed on ice for
30 minutes. Then, heat shock was performed at 42°C for 20 seconds. The tube was
47

again placed on ice for 5 minutes. Then, 950 µL of room temperature super optimal
broth with catabolite repression (SOC) media was added to the tube and incubated at
37°C with shaking at 250 rpm for 1 hour. 100 µL and 200 µL of transformation
mixture were plated on LB agar and incubated overnight at 37°C.
2.2.2.7 Growth of transformant colonies and plasmid isolation
Five individual colonies from the overnight transformation plates were picked using
sterile pipette tips and inoculated into fresh LB and allowed to grow overnight at
37°C with shaking at 250 rpm. Then, plasmid isolation from overnight bacterial
cultures was performed using QIAprep Spin Miniprep kit (QIAGEN, Hilden,
Germany), according to the manufacturer’s instructions. All centrifugation steps
were performed at 13, 300 rpm at room temperature. 1.5 mL of overnight bacterial
culture was centrifuged for 3 minutes and the supernatant was discarded. Then 250
µL of buffer P2 was added to the suspension and mixed by inverting the tube. 350
µL of buffer N3 was added to the cell suspension and mixed by inverting the tube.
The tube was then centrifuged for 10 minutes. Then, 800 µL of the supernatant was
added to the QIAprep 2.0 spin column and centrifuged for 1 minute. The flow-
through was discarded. The spin column was washed by adding 750 µL of buffer PE
and centrifuging for 1 minute. The flow-through was discarded and the spin column
was centrifuged for 1 minute to remove residual wash buffer. The spin column was
then placed in a new microcentrifuge tube and 50 µL of buffer EB was applied to the
centre of the column and allowed to stand for 1 minute, prior centrifuging for 1
minute to elute DNA. The concentrations of isolated plasmid DNA samples were
measured using a NanoDrop™ spectrophotometer and stored at -20°C.
48

2.2.2.8 Restriction enzyme digest screening for colonies harbouring the pTrcHis A-Gal d 5 construct
The restriction enzyme digestions of isolated plasmids were performed according to
the NEB Time-Saver™ protocol (Section 2.2.2.5) using restriction enzymes BamHI
and EcoRI. All digested samples were electrophoretically analysed on 1% (W/V)
agarose gel stained with GelRed™ nucleic acid stain. For all the positive clones,
glycerol stocks were made by mixing 0.5 mL overnight bacterial culture with 0.5 mL
of sterile 80% (v/v) glycerol and stored at -80°C until needed. The plasmids
harbouring the insert were then sequenced using pTrcHis A forward primer 5’-
GAGGTATATATTAATGTATCG-3’ and pTrcHis A reverse primer 5’-
GATTTAATCTGTATCAGG-3’ (Micromon-Monash University Clayton, VIC,
Australia). The DNA sequences were then compared against the nucleotide sequence
database of National Centre for Biotechnology Information (NCBI) web site using
the nucleotide Basic Local Alignment Search Tool (BLAST).
2.2.2.9 Time course of expression and analysis of recombinant protein expression levels The selected transformant clone was streaked for single colonies on LB agar media
from the glycerol stock and incubated overnight at 37°C. Following incubation, a
single colony was picked using a sterile pipette tip and inoculated into 10 mL of LB
media and allowed to grow overnight at 37°C with shaking at 250 rpm. The
overnight culture was then re-inoculated into fresh LB media and allowed to grow at
37°C with shaking at 250 rpm until optical density reached 0.4 - 0.6 at 600 nm. Then,
expression was induced by adding isopropyl β-D-1-thiogalactopyranoside (IPTG) to
give a final concentration of 1 mM. The culture was allowed to grow for 5 hours and
cell pellets were collected every hour by centrifugation.
49

All cell pellets were resuspended in 400 µL of CellLytic™ B bacterial cell lysis
reagent (Sigma-Aldrich, MO, USA) and briefly vortexed. The resultant cell lysate
was mixed using a tube mixer for 10 minutes. The cell lysate was then centrifuged at
13, 000 rpm for 5 minutes to separate soluble and insoluble fractions. The insoluble
fractions were further resuspended in 100 μL of Novex® Tris-Glycine SDS-Sample
Buffer (2×). The expression levels were examined on SDS-PAGE gels according to
the protocol mentioned in Section 2.2.1.3. Un-induced culture fractions were run as
controls. The authenticity of the recombinant protein was confirmed by Western
immunoblotting. Separated proteins were electro-transferred on to a nitrocellulose
membrane and developed according to the protocol mentioned in Section 2.2.1.4.1
with the following changes. Monoclonal Anti-Xpress™ antibody produced in mouse
(Thermo Fisher Scientific®, MA, USA) (diluted 1:1000 in blocking solution) was
used as the primary antibody while alkaline phosphatase-conjugated anti mouse IgG
antibody (Thermo Fisher Scientific®, MA, USA) was used as the secondary
antibody.
2.2.2.10 Purification of rGal d 6
rGal d 6 fused to a 6×His affinity tag was purified using Ni2+-Nitrilotriacetic acid
(Ni-NTA) resin using Ni-NTA spin kit (Qiagen, Hilden, Germany) under native
conditions according to manufacturer’s instructions. In brief, a pellet derived from a
5 mL cell culture volume was resuspended in 630 µL of lysis buffer (50mM
NaH2PO4, 300 mM NaCl, 10 mM imidazole, pH 8.0). After centrifugation, the
cleared lysate containing 6×His tagged rGal d 6 protein was loaded on to the Ni-
NTA spin column pre-equilibrated with lysis buffer. The resin was then washed
thrice with 600 µL wash buffer (50 mM NaH2PO4, 300 mM NaCl, 20 mM imidazole,
pH 8.0). The recombinant protein was eluted using 200 µL of elution buffer (50mM
50
NaH2PO4, 300 mM NaCl, 500 mM imidazole, pH 8.0). The collected fractions were
then analysed on SDS-PAGE and Western immunoblotting according to the protocol
mentioned in Section 2.2.2.9.
2.2.3 Immunological analysis of rGal d 6
2.2.3.1 Inhibition enzyme-linked immunosorbent assay (ELISA)
In brief, 10 µg of crude egg yolk in 50 µL of coating buffer (60 mM NaHCO3, 30
mM Na2CO3, pH 9.3) was used to coat each well of an ELISA microtiter plate. The
proteins were allowed to coat the wells for 2 hours at 37°C. Each sample was done in
triplicates. After triple washing the wells with 0.05% phosphate buffered saline with
Tween 20 (PBST), each well was blocked with 50 µL of 1% (w/v) bovine serum
albumin (BSA) in 1× PBS for 2 hours at 37°C. The serum pool from patients 3, 5, 10,
16 and 25 were used since they had the highest reactivity against Gal d 6 and due to
the limited availability of sera. The wells were triple washed with 0.05% PBST.
Then, all wells were incubated with 50 µL control serum pool (diluted 1:10 in 0.05%
BSA in 1× PBS) and 50 µL serum pools which were pre-incubated with different
amounts (10 µg and 50 µg) of rGal d 6 for 1 hour at room temperature. Following
triple washing with 0.05% PBST, all wells were incubated with 50 µL of monoclonal
anti-human IgE mouse antibodies labelled with alkaline phosphatase (diluted 1:2000
in 0.05% BSA in 1× PBS) for 1 hour at 37°C. After triple washing the wells with
0.05% PBST, 50 µL of alkaline phosphatase yellow (pNPP) liquid substrate (Sigma-
Aldrich, MO, USA) was added to each well and incubated at 37°C. After the colour
development, the reaction was terminated by adding 13 µL of 3 M NaOH, and
absorbance was read at 405 nm. Percentage of inhibition was calculated using the
following formula.
51

% Inhibition = 100 – (absorbance value with inhibitor/absorbance value without
inhibitor × 100)
A second ELISA was also done using CEY to inhibit IgE binding to coated rGal d 6
according to the same method described above. Wells of the microtiter plate was
coated with 10 µg of rGal d 6 in 50 µL of coating buffer. The test serum pool was
pre-incubated with 10 µg or 50 µg of CEY. The absorbance was measured at 405 nm
and the percentage of inhibition was calculated.
2.3 Results
2.3.1 Immunological and mass spectrometry analysis of CEY fractions from hen, emu and quail eggs
The complexity of CEY profiles of different bird species is evident as seen on SDS-
PAGE (Figure 2.1). The resulting protein profiles of various CEYs show a large
number of protein bands. Although there are some overlapping bands, most proteins
could be clearly distinguished. Approximately 13, 7 and 11 different proteins ranging
from 10-250 kDa could be distinguished in the hen (Figure 2.1, A), emu (Figure 2.1,
B) and quail (Figure 2.1, C) egg yolks, respectively. No differences were observed
for the protein profiles generated from caged chicken eggs, free-range chicken eggs
and hen’s eggs obtained from AAHL. However, a high molecular weight protein just
under 250 kDa marker can be observed in the hen’s egg yolk from free range eggs.
This high molecular weight protein was absent in both the caged eggs and eggs
obtained from AAHL. Considerable number of proteins from all three avian species
had similar migration levels on the SDS-PAGE indicating potential homology among
proteins. Nevertheless, all three egg yolk samples from different bird species were
clearly distinguishable from each other based on their protein profiles on SDS-
PAGE.
52

Figure 2.1: SDS-PAGE analysis of CEYs under reducing and denaturing conditions. (A) SDS-PAGE of hen’s CEY. Lane 1: CEY from chicken eggs obtained from AAHL, Lane 2: CEY from caged chicken eggs, Lane 3: CEY from free-range chicken eggs. (B) SDS-PAGE of CEY from emu eggs. (C) SDS-PAGE of CEY from quail eggs. MW: molecular weight marker in kDa (SeeBlue pre-stained protein standard). Arrows indicate Gal d 5 and Gal d 6 at 69 kDa and 42 kDa, respectively. Proteins were stained with SimplyBlue SafeStain.
Western immunoassay performed with individual patients’ sera (Figure 2.2) against
hen’s CEY extract revealed multiple IgE reactive proteins. The repeated
immunoassay also reproduced the same result. 56% (14 out of 25) of the egg white
allergy patients tested in this study had IgE reactivity to multiple egg yolk proteins
with varying degrees of intensities. A second Western immunoblot was conducted
with a pool of sera composed of patients seropositive for hen’s egg yolk against
CEYs prepared from all bird eggs (Figure 2.3). The repeated immunoassay also
reproduced the same result. Immunoblots conducted with pooled sera against hen,
emu and quail CEYs showed multiple IgE reactive proteins. IgE reactive proteins
from various CEYs were assigned with an identification code. The serum pool
250
98
64
50
36
30
16
6
MW 1 2 3 MW MW
(A) (B) (C)
53

detected seven different proteins (P1 to P7) (Figure 2.3, A) from hen’s CEY, which
were also detected in the Western blot performed with individual patients’ sera
(Figure 2.2). When analysing the immunoblots of hen’s CEY, it was clear that not
all hen’s egg yolk proteins had genuine IgE reactivity (Figure 2.2 and Figure 2.3, A).
Hen’s egg yolk proteins P6 and P7 had reactivity in negative control no serum and
non-allergic serum lanes indicating non-specific binding with the secondary
antibody. Furthermore, all patient serum lanes also had reactivity with P6 and P7.
This result indicates that reactivity of proteins P6 and P7 in patients are due to non-
specific binding with the detection antibody and not due to genuine sensitisation. In
this study, proteins P6 and P7 were not considered as proteins with potential
allergenic capacity. As a result, patients 6, 12, 13, 20 and 21 that have only reacted
with proteins P6 and P7 were considered non-sensitised towards CEY. Therefore, the
percentage of patients with genuine IgE-reactivity to hen’s CEY is 36% (9 out of 25)
after the exclusion of patients with false positives. The percentage of patients reacted
to each protein is shown in Figure 2.4. Table 2.2 shows the IgE binding data of hen’s
egg yolk sensitised patients.
Emu CEY showed six IgE reactive proteins (X1 to X6) (Figure 2.3, B). Quail CEY
showed five IgE reactive proteins (Y1 to Y5) (Figure 2.3, C). The band intensities
of IgE reactive proteins from hen’s CEYs were very similar. However, in CEY from
caged chicken eggs, the protein P5 had slightly higher IgE-reactivity when compared
to CEYs from AAHL and free-range eggs.
54
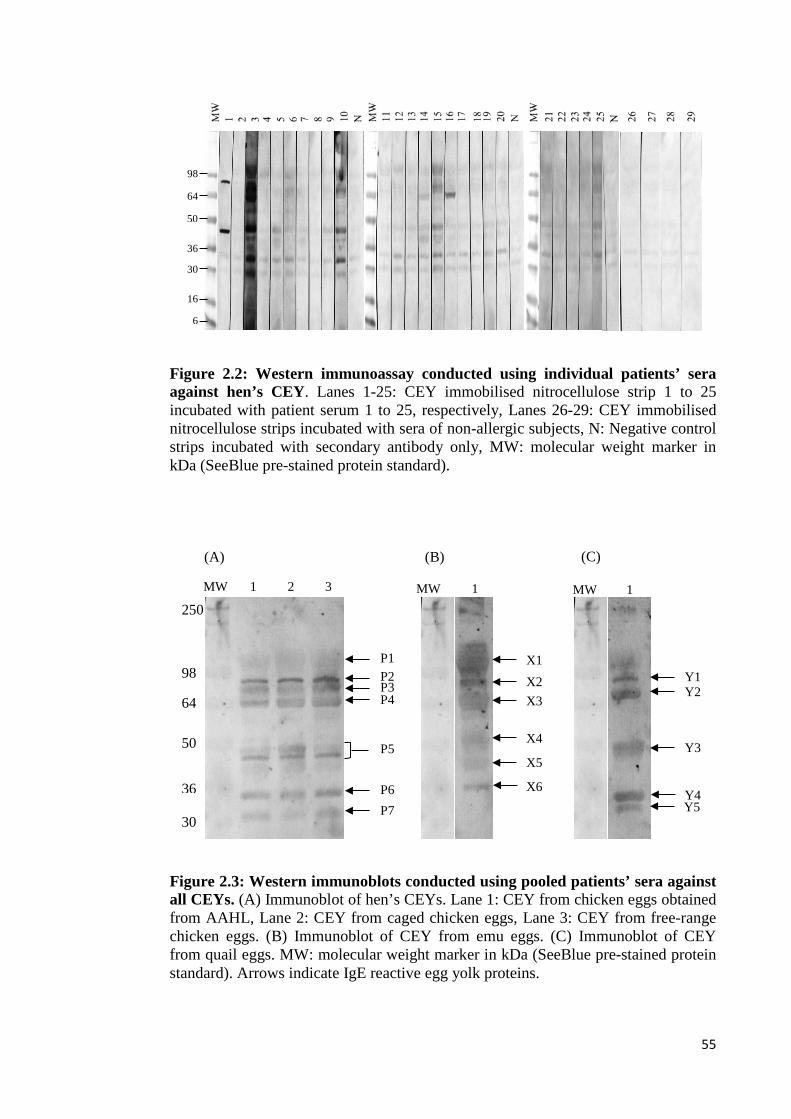
Figure 2.2: Western immunoassay conducted using individual patients’ sera against hen’s CEY. Lanes 1-25: CEY immobilised nitrocellulose strip 1 to 25 incubated with patient serum 1 to 25, respectively, Lanes 26-29: CEY immobilised nitrocellulose strips incubated with sera of non-allergic subjects, N: Negative control strips incubated with secondary antibody only, MW: molecular weight marker in kDa (SeeBlue pre-stained protein standard).
Figure 2.3: Western immunoblots conducted using pooled patients’ sera against all CEYs. (A) Immunoblot of hen’s CEYs. Lane 1: CEY from chicken eggs obtained from AAHL, Lane 2: CEY from caged chicken eggs, Lane 3: CEY from free-range chicken eggs. (B) Immunoblot of CEY from emu eggs. (C) Immunoblot of CEY from quail eggs. MW: molecular weight marker in kDa (SeeBlue pre-stained protein standard). Arrows indicate IgE reactive egg yolk proteins.
X1 X2 X3
X4
X5
X6
MW 1
Y1 Y2
Y3
Y4 Y5
MW 1 250
98
64
50
36
30
P2 P1
P3 P4
P5
P6 P7
MW 1 2 3
(A) (B) (C)
64
98
50
30
16
6
36
55
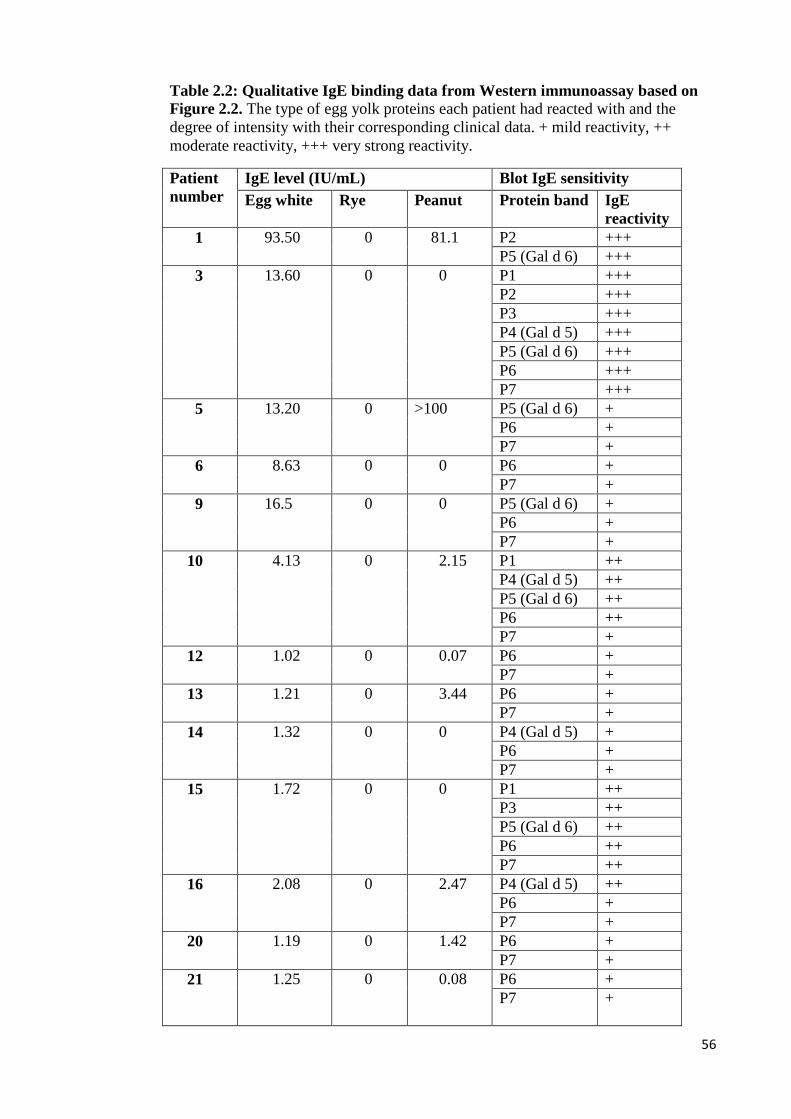
Table 2.2: Qualitative IgE binding data from Western immunoassay based on Figure 2.2. The type of egg yolk proteins each patient had reacted with and the degree of intensity with their corresponding clinical data. + mild reactivity, ++ moderate reactivity, +++ very strong reactivity.
Patient number
IgE level (IU/mL) Blot IgE sensitivity Egg white Rye Peanut Protein band IgE
reactivity 1 93.50 0 81.1 P2 +++
P5 (Gal d 6) +++ 3 13.60 0 0 P1 +++
P2 +++ P3 +++ P4 (Gal d 5) +++ P5 (Gal d 6) +++ P6 +++ P7 +++
5 13.20 0 >100 P5 (Gal d 6) + P6 + P7 +
6 8.63 0 0 P6 + P7 +
9 16.5 0 0 P5 (Gal d 6) + P6 + P7 +
10 4.13 0 2.15 P1 ++ P4 (Gal d 5) ++ P5 (Gal d 6) ++ P6 ++ P7 +
12 1.02 0 0.07 P6 + P7 +
13 1.21 0 3.44 P6 + P7 +
14 1.32 0 0 P4 (Gal d 5) + P6 + P7 +
15 1.72 0 0 P1 ++ P3 ++ P5 (Gal d 6) ++ P6 ++ P7 ++
16 2.08 0 2.47 P4 (Gal d 5) ++ P6 + P7 +
20 1.19 0 1.42 P6 + P7 +
21 1.25 0 0.08 P6 + P7 +
56

Patient number
IgE level (IU/mL) Blot IgE sensitivity Egg white Rye Peanut Protein band IgE
reactivity 25 0.47 88.7 3.64 P5 (Gal d 6) +
P6 + P7 +
Figure 2.4: Percentage of patients with IgE reactivity to proteins (P1 to P7) of hen’s egg yolk, as analysed from the Western immunoblot in Figure 2.2 and Table 2.2.
In order to determine the identities of the IgE reactive proteins of various CEYs, they
were subjected to proteomic analysis using LC-MS/MS. The identity of each protein
band was determined from critically analysing both the mass spectrometry data and
molecular weights of each protein based on SDS-PAGE. The identities revealed for
all the IgE reactive proteins were previously known hen’s egg yolk proteins. The
identities of proteins analysed from the LC-MS/MS and their approximate molecular
weights on SDS-PAGE are listed in the Table 2.3. The mass spectrometry result
confirmed that all the IgE reactive proteins of hen’s CEYs are fragments derived
12% 8% 8%
16%
28%
52% 52%
0
10
20
30
40
50
60
P1 P2 P3 P4 P5 P6 P7
% o
f pat
ient
s rea
cted
IgE reactive yolk proteins
57

from well-known precursor proteins of the hen; VTG-1, VTG-2 and Apo B. The
proteomic analysis of hen’s egg yolk proteins identified P4 as Gal d 5 and P5 as Gal
d 6 (Table 2.3). According to the Western immunoassay conducted with individual
patients’ sera 16% of the patients tested have recognized Gal d 5 (P4) while 28% of
subjects have recognized Gal d 6 (P5) (Table 2.2). The degree of IgE reactivity in
both allergens ranged from very strong to mild in sensitised patients. The identities
of IgE reactive proteins from emu and quail CEYs are listed in Table 2.3. Here also
majority of the proteins were found to be fragments of precursor proteins as in the
IgE reactive hen’s egg yolk proteins. However, the mascot BIRD database is not
complete with all the bird species. Therefore, it was clear that the majority of emu
and quail proteins had matches to proteins with close homologies from other bird
species such as chicken, duck and turkey. Some of the IgE-reactive proteins in the
emu and quail egg yolks came up as egg white proteins such as ovalbumin and
ovotransferrin indicating minor contamination with the egg white. However, mass
spectrometry analysis did not reveal any contamination with human proteins.
58

Table 2.3: Protein identities revealed from mass spectrometry analysis, their approximate molecular weights on SDS-PAGE, score and percentage sequence coverage for each protein
Protein band
Molecular weight
Identity Species Score Sequence coverage (%)
P1 120 Vitellogenin II
Chicken 13575 52
P2 90 Apolipoprotein B
Chicken 8412 30
P3 72 Apolipoprotein B
Chicken 523037 30
P4 (Gal d 5) 65 Chicken serum albumin
Chicken 3490 54
P5 (Gal d 6) 42 Vitellogenin I
Chicken 5438 35
P6 35 Vitellogenin I
Chicken 5500 28
P7 30 Vitellogenin II
Chicken 5294 37
X1 120 Apolipoprotein B
Chicken 524 14
X2 72 Ovotransferrin
Emu 943 46
X3 65 Ovalbumin
Emu 455 21
X4 52 Apolipoprotein B
Chicken 723 15
X5 42 Fibrinogen beta chain
Zebra finch
520 16
X6 35 Vitellogenin II variant 1
Emu 548 14
Y1 90 Transferrin receptor protein I-like
Turkey 574 13
Y2 68 Serum albumin Domestic duck
2971 29
Y3 42 Ovalbumin Common quail
1111 43
Y4 34 Apolipoprotein A-I Japanese quail
795 70
Y5 31 Apolipoprotein A-I Japanese quail
2298 86
59

2.3.2 Expression of rGal d 6 in E. coli
Analysis of RT-PCR product on 1% (W/V) agarose gel showed a predominant band
approximately in between 500 bp and 1000 bp markers (expected size: 876 bp)
(Figure 2.5). E. coli cells transformed with pTrcHis A-Gal d 6 construct had growth
when incubated on LB agar under ampicillin resistance. When BamHI and EcoRI
digested plasmids of transformant clones were electrophoresed on 1% (W/V) agarose
gel, all clones showed the insert approximately at 1000 bp marker (expected size:
876 bp) (Figure 2.6). Sequencing analysis of plasmids harbouring the insert
confirmed the in-frame ligation of the Gal d 6 into the pTrcHis A vector within the
multiple cloning site (MCS). The NCBI BLAST search of the derived sequence from
pTrcHis A-Gal d 6 construct produced Gallus gallus vitellogenin 1 (VTG1)
(sequence ID: refΙNM_0010044008.2) as the top match with a 99% similarity
corresponding to the mature peptide YGP42 (Gal d 6) of the C-terminal part of the
VTG-1 gene (Figure 2.7).
60
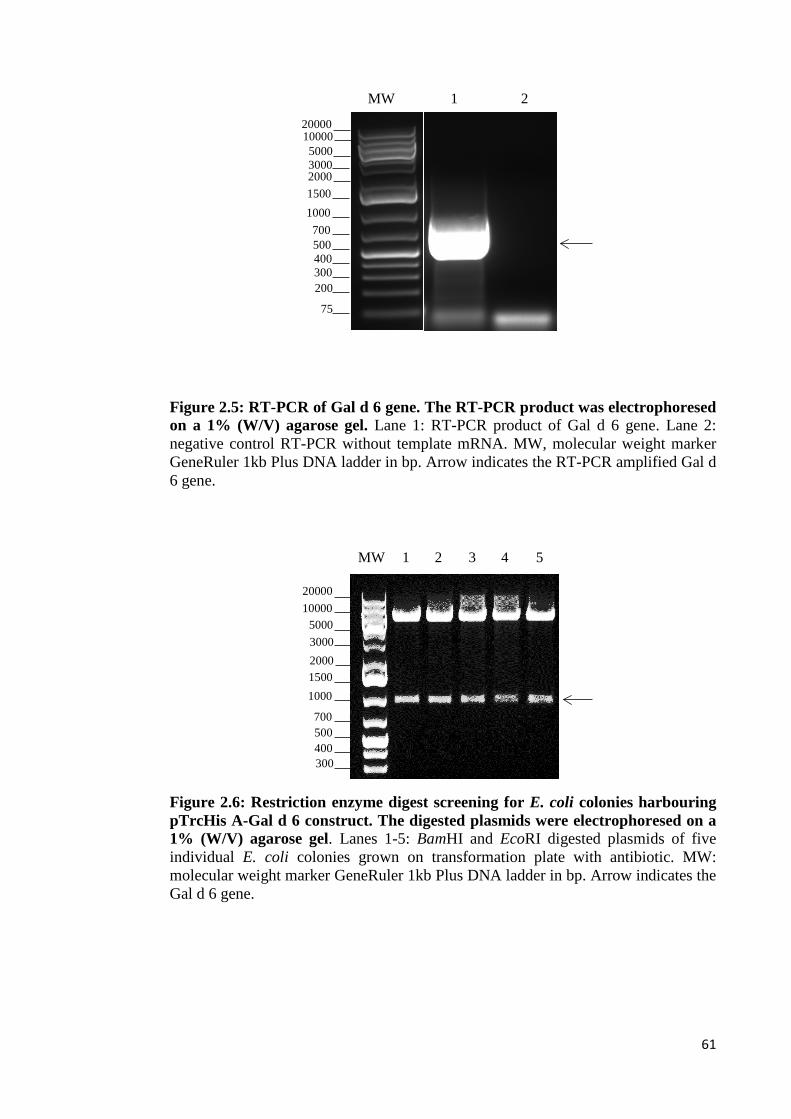
MW 1 2
75
200 300 400
1000 700 500
1500
20000
5000 3000
10000
2000
300 400
1000
700 500
1500
20000
5000 3000
10000
2000
MW 1 2 3 4 5
Figure 2.5: RT-PCR of Gal d 6 gene. The RT-PCR product was electrophoresed on a 1% (W/V) agarose gel. Lane 1: RT-PCR product of Gal d 6 gene. Lane 2: negative control RT-PCR without template mRNA. MW, molecular weight marker GeneRuler 1kb Plus DNA ladder in bp. Arrow indicates the RT-PCR amplified Gal d 6 gene.
Figure 2.6: Restriction enzyme digest screening for E. coli colonies harbouring pTrcHis A-Gal d 6 construct. The digested plasmids were electrophoresed on a 1% (W/V) agarose gel. Lanes 1-5: BamHI and EcoRI digested plasmids of five individual E. coli colonies grown on transformation plate with antibiotic. MW: molecular weight marker GeneRuler 1kb Plus DNA ladder in bp. Arrow indicates the Gal d 6 gene.
61

Figure 2.7: Sequence alignment comparison of DNA sequence derived for pTrcHis A-Gal d 6 construct using NCBI Nucleotide BLAST tool. The DNA sequence represents the mature peptide YGP42 (Gal d 6) of the C-terminal part of the VTG-1 gene.
62
The Western immunoblot of time-course of expression experiment showed a
predominant protein band approximately at 42 kDa region when probed with Anti-
Xpress antibody. E. coli cells harbouring the construct have expressed majority of
the rGal d 6 as an insoluble fraction. However, a reasonable amount of soluble rGal d
6 was also expressed by the E. coli cells, with an optimum time of 5-hour post IPTG
induction (Figure 2.8).
The production of a recombinant protein fused to a short polypeptide such as 6×His
tag permits the purification of the fusion peptide using a metal chelating resin (Figure
2.9). The SDS-PAGE analysis (Figure 2.9, A) of the purified soluble rGal d 6 using
the Ni-NTA resin revealed a predominant band approximately at 42 kDa region.
However, several E. coli derived proteins were also present in the purified fraction.
The Western immunoblot of purified protein fraction probed with Anti-Xpress
antibody showed a clear band approximately at 42 kDa region corresponding to the
protein band in SDS-PAGE (Figure 2.9, B).
63

Figure 2.8: Time-course of expression of soluble and insoluble E. coli cell culture fractions harbouring rGal d 6. Lane 1: un-induced culture fractions. Lanes 2-5: IPTG induced culture fractions at time points 2nd, 3rd, 4th and 5th hours, respectively, analysed by (A) SDS-PAGE and (B) Western immunoassay. Arrows indicate rGal d 6 in the soluble fraction at 42 kDa. MW: molecular weight marker in kDa (SeeBlue pre-stained protein standard).
Figure 2.9: Purification of 6×His tagged rGal d 6. Lane 1: cleared lysate, Lane 2: flow- through, Lane 3-5: 1st, 2nd and 3rd wash, respectively. Lane 6: elution, analysed by (A) SDS-PAGE and (B) Western immunoassay. MW: molecular weight marker in kDa (SeeBlue pre-stained protein standard). Arrows indicate purified rGal d 6 at 42 kDa.
MW 1 2 3 4 5 6
250
98 64 50 36 30
16 6
MW 1 2 3 4 5 6
(A) (B)
Soluble fraction Insoluble fraction Soluble fraction Insoluble fraction
250
98 64 50 36 30
16 6
MW 1 2 3 4 5 MW 1 2 3 4 5 MW 1 2 3 4 5 MW 1 2 3 4 5
(A) (B)
250
98 64 50 36 30
16 6
64

2.3.3 Inhibition ELISA experiments
The results of inhibition ELISA experiments are shown in Figure 2.10. The results
shown in Figure 2.10 demonstrate that rGal d 6 is able to inhibit IgE binding to CEY
by up to 30%. The amount of rGal d 6 required to achieve maximum IgE binding
inhibition of 30% was 50 μg. On the other hand, CEY was able to inhibit IgE binding
to rGal d 6 by up to 31% as shown in Figure 2.10. Further, inhibitions with
increasing amounts of proteins were not achieved in both cases. The amount of CEY
required to achieve maximum IgE binding inhibition of 31% was 50 μg. However,
inhibitions with increasing amounts of proteins reached a plateau at 50 μg in both
cases. This experiment was only conducted once due to the limited availability of
sera.
Figure 2.10: Inhibition ELISA experiments. When rGal d 6 was used as an inhibitor, CEY was immobilised on to the wells of the microtiter plate. When CEY was used as an inhibitor, rGal d 6 was immobilised on to the wells of the microtiter plate. The IgE antibody binding of selected seven patients reactive towards CEY proteins was detected calorimetrically at OD 405 nm.
0
5
10
15
20
25
30
35
0 10 20 30 40 50 60
% In
hibi
tion
Inhibitior (μg)
CEYrGal d 6
65

2.4 Discussion
Hen’s egg is one of the most well-known sources of allergens. Egg white allergens
have much stronger allergenic potential than the yolk proteins. Hen’s egg yolk
allergy is still a developing area within the domain of food allergy. Allergy to egg
white and egg yolk has been often investigated separately. However, concomitant
sensitisation to egg white and yolk proteins due to cross reactive proteins has been
reported previously [98]. Nevertheless, the association between egg white and egg
yolk allergies have been overlooked by many researchers. Egg white and egg yolk
allergens have a similar origin and therefore, occurrence of cross sensitisation or co-
sensitisation in egg allergic patients would be a high possibility.
CEY extracts were made according to the method reported by Guilmineau et al.,
[127]. The protein profiles of CEYs were investigated on SDS-PAGE without
delipidation. Most studies have used delipidated egg yolk fractions in order to reduce
the smearing effect caused by the high lipid content. Chemicals used during
delipidation process can significantly alter the nature of proteins and thereby
affecting the result of immunoassays. Therefore, we used the whole egg yolk extract
without subjecting to delipidation throughout the study. The SDS-PAGE profile of
the un-delipidated CEYs obtained offered good resolution of protein bands,
indicating that most of the egg yolk proteins have been solubilized in the 0.1 M
glycine/NaOH buffer (pH 9; 0.56 NaCl). An important advantage of the approach
used here is that egg yolk proteins are presented in the same format as would be
encountered by an individual during the sensitisation process. The egg yolk allergens
Gal d 5 and Gal d 6 are both glycoproteins, which were identified using fractioned
yolk extracts [81, 82]. In theory, any protein can act as an IgE reactive allergen.
66

Therefore, it is imperative to bring the whole egg yolk under investigation to reveal
allergenicity of other yolk proteins.
The protein profiles generated from caged chicken eggs, free-range chicken eggs and
hen’s eggs obtained from AAHL were similar. However, a high molecular weight
protein just under 250 kDa marker was observed in the hen’s egg yolk from free
range eggs. This could be a marker of free-range condition. However, further
proteomic analyses are required to investigate if the presence of high molecular
weight protein in free-range eggs is due to the environmental factors. In this study,
we employed Western immunoblotting as a rapid method of identifying IgE reactive
proteins in various CEYs. The sera we used in this study came from a cohort of
patients diagnosed with allergy to hen’s egg white. However, no clinical data were
available regarding sensitisation or allergic reactivity to hen’s egg yolk in those
patients. Therefore, these patients may or may not have clinical reactivity to hen’s
egg yolk. First major aim of this chapter was to investigate the sensitisation profiles
of egg white allergic patients and compare in vitro IgE reactivates of egg yolks from
hen, emu and quail. Sensitisation to a certain allergen does not necessarily imply
clinical allergy [3, 7]. However, it is well known that majority of patients with
sensitisation develops clinical symptoms upon ingestion of the offending food.
Therefore, the major epitopes relevant to sensitisation are of great interest.
Western immunoassay results showed that multiple egg yolk proteins from hen, emu
and quail have reacted with IgE antibodies of many patients. Sensitisation to egg
yolk proteins could be a result of direct exposure to yolk proteins during
consumption or due to the existence of similar IgE binding epitopes present in egg
white and yolk proteins. In such cases, both types of allergens are responsible for
overall pathogenesis and pathophysiology of egg allergy. Therefore, it is imperative
67
that clinical diagnosis of egg allergy include both the egg white and egg yolk and
determine appropriate management and treatment strategies based on a patient’s total
sensitisation profile. . However, proteins P6 and P7 were considered as false
positives due to the influence of the secondary antibodies. A possible reason behind
this could be the presence of hen’s egg proteins in the diet fed to mouse. As a
consequence the mouse immune system may have generated IgG antibodies against
egg yolk proteins P6 and P7. Production of IgG antibodies against non-pathogenic
proteins is considered as a normal process of a healthy immune system [22].
However, it is not possible to elucidate why the mouse immune system only
produced IgG antibodies against only those two egg yolk proteins.
Furthermore, sensitised patients against hen’s CEY were also able to recognize a
number of proteins from the yolk proteomes of emu and quail. Here also, cross
sensitisation to egg yolk proteins from different bird species could be a result of
direct exposure to respective bird eggs or due to the existence of similar IgE binding
epitopes among different egg proteins. If sensitisation is due to cross-reactive IgE
antibodies, allergic reactions to emu and quail egg proteins can occur during the first
exposure even without the initial sensitisation phase. Therefore, for such patients,
emu and quail eggs may not be suitable to use as an alternative to hen’s eggs.
Sensitisation to certain allergens is not a definitive marker of allergy. This is because
not all sensitised individuals develop clinical symptoms of allergic hypersensitivity
when exposed to relevant allergens. Therefore, this result does not confirm allergy to
egg yolk in patients identified with sensitisation to egg yolk proteins. Nevertheless,
presence of reactive antibodies is considered a risk factor for allergy. Furthermore, it
has been shown that sensitisation to allergens can be used to predict the onset of
clinical allergy. For example, presence of hen’s egg white specific IgE antibodies
68

even without clinical symptoms can be used to predict the development of allergy
before 7-10 years of age [3].
IgE reactive egg yolk proteins from all CEYs were subjected to proteomic analysis in
order to reveal their identities. According to the mass spectrometry results, all IgE
reactive hen’s egg yolk proteins belongs to major precursor protein families VTG-1,
VTG-2 and apolipoprotein B (Apo B). VTG-1 precursor is already implicated in
allergy. The allergen Gal d 6 is the C-terminal part of VTG-1 precursor [81]. Already
known hen’s egg yolk allergens Gal d 5 and Gal d 6 were able to identify through
proteomic analysis. Gal d 5 is a protein with a molecular weight of 69 kDa.
However, on the SDS-PAGE analysis it was seen approximately at 65 kDa region.
This may be due to the limited solubility resulted by the presence of high lipid
content or due to the alteration of three dimensional structure caused by method used
for CEY preparation.
Furthermore, Walsh et al., reported apovitellenin I and VI to be significantly
allergenic in some patients with egg allergy. Therefore, this result is consistent with
our result since apovitellenin I is a fragment derived from Apo B [98]. Both VTG-1
and VTG-2 are collectively known as vitellogenins. During egg formation,
vitellogenins are transported into developing oocyte through a process known as
receptor mediator endocytosis. Once they are transported into the egg yolk, mature
proteins are produced as a result of enzymatic cleavage. On the other hand, Apo B is
also produced in liver and transported into growing oocytes the same way as
vitellogenins, resulting in the formation of mature Apo B fragments through
enzymatic activity [96, 128, 129]. The MASCOT bird database is not complete with
proteins from all bird species. Therefore, most proteins from emu and quail had
matches to proteins with closest homologies from other bird species such as hen.
69

Inability to identify the exact mature proteins derived from vitellogenins or Apo B
precursors is a limitation of this study. Egg yolk is a more complex system than the
albumen, with a significant proportion of lipids. The presence of high amounts of
lipids has made identification of allergens from the egg yolk very challenging and
may have thus contributed to fewer studies reported in the literature. Nevertheless,
this study had narrowed down the search for allergens out of hundreds of different
proteins for just three classes of precursor proteins. In order to identify IgE reactive
proteins, each mature protein derived from precursors should be purified and
subjected to immunological testing using sera from patients allergic to hen’s egg.
Furthermore, we performed the immunological analysis of egg yolk using sera from
patients allergic to hen’s egg white. This also can be considered as another limitation
of this study since clinical reactivity to yolk proteins may not exist in those patients,
even though sensitisation is present. Therefore, in order to establish the clinical
relevance of those three egg yolk precursor proteins, it is imperative to subject those
proteins to both in vivo and in vitro studies using patients with clinical reactivity to
hen’s egg yolk.
Comparison of immunoblot results with the patients’ clinical data showed that the
majority of patients that reacted strongly with the egg yolk had high IgE levels
against hen’s egg white. However, this was not always the case since some patients
with low IgE also had strong reactivity against egg yolk proteins, suggesting
presence of clinically unique allergens in the egg yolk. In this study, more patients
had reacted with Gal d 6 (28%) than Gal d 5 (16%). It was previously suggested that
Gal d 6 is a minor allergen implicated in egg allergy. However, our results indicate
that Gal d 6 may be more allergenic and affects more patients than originally
thought.
70

The cDNA coding for the mature egg yolk allergen Gal d 6 was selectively amplified
from the VTG-1 precursor using liver tissue from an egg-laying hen. The sequencing
result obtained for Gal d 6 gene showed several insertion mutations, especially at the
end of the sequence. However, this does not affect the validity of the construct.
These errors are mainly attributed to the introduction of artefactual mutations, rather
than due to true mutations resulted during the PCR amplification. The Gal d 6 was
cloned into pTrcHis A plasmid vector where the trc promoter leads the translation of
the fusion peptide with the 6×His tag on the N-terminal side. The soluble and
insoluble fractions of IPTG induced and un-induced E. coli fractions were subjected
to Western immunoassay and probed with anti-Xpress antibody specific to the fusion
peptide. The developed immunoblot revealed a clear band at 42 kDa, which is the
expected size of natural Gal d 6.
This result is in excellent agreement with studies conducted by Mann & Mann., and
Yamamura et al., where they reported the size of natural Gal d 6 as 42 kDa [96, 130].
Furthermore, our proteomic analysis of CEY proteins also indicated that the protein
P5 approximately at 42 kDa region to be YGP42 or Gal d 6. However, the theoretical
molecular weight of Gal d 6 is 31.45 kDa as calculated by ExPASy ProtParam tool.
On the other hand, the study by Amo et al., which confirmed YGP42 as an allergen,
reported a molecular weight of 35 kDa from SDS-PAGE [81]. The discrepancies
observed regarding the molecular weight on SDS-PAGE could be attributed to the
different sample preparation methods used.
The solubility of recombinant proteins produced by bacteria is a major concern in the
production process. Although bacterial expression systems provide a convenient way
for recombinant protein expression, many foreign proteins expressed in bacterial
hosts undergo partial or irregular folding resulting in insoluble and refractile
71

aggregates known as inclusion bodies (IB) [131]. Therefore, to retain the biomedical
value, it is essential to produce the recombinant protein as a soluble fraction in its
native form. However, it is not possible to predict the solubility of a foreign protein
before the actual expression [131, 132]. In this study, majority of the rGal d 6 has
been produced as an insoluble protein as seen by the Western immunoassay result.
However, there were reasonable amount of soluble rGal d 6 produced by the E. coli
cells that could be used for purification and other downstream applications.
Therefore, enhancement of bacterial cells to increase production of rGal d 6 as a
soluble fraction was not necessary.
The production of a recombinant protein fused to a short polypeptide such as 6×His
tag permits the purification of the fusion peptide using a metal chelating resin. The
SDS-PAGE analysis of the purified soluble rGal d 6 using the Ni-NTA resin revealed
a predominant band at around 42 kDa. However, the final purified rGal d 6
preparation was present with several potential contamination E. coli proteins. The
authenticity of the rGal d 6 was determined by probing the purified protein with
Anti-Xpress antibody. Furthermore, most water soluble proteins are highly
susceptible to proteolytic degradation [133]. However, in this study no such
degradation was observed.
Obtaining a recombinant protein as a soluble fraction in sufficient amounts is highly
desirable. Although bacteria have the capacity to produce protein with the correct
amino acid sequence based on the gene, they lack the machinery for post-
translational modification. Recombinant allergens produced in bacteria are
structurally different than their wild type counterparts [134]. Therefore, analysing the
immunological potency of recombinant allergen in comparison to natural allergen is
a crucial step in recombinant allergy research [116]. In this study, we analysed the
72

immunological relevance of rGal d 6 through inhibition ELISA technique and
showed that it has cross reactivity with CEY. rGal d 6 showed clear IgE reactivity by
inhibiting IgE binding to CEY. Similarly, CEY was able to inhibit IgE binding to
rGal d 6. It is usually expected that the percentage of inhibition could reach nearly
100% due to the abundant existence of Gal d 6 in the CEY extract. However, the
inhibition of rGal d 6 due to CEY was only 31%. This may be because of the three
dimensional structures of proteins often altered when immobilised on ELISA plates.
The alteration of structure of proteins can also change the IgE binding epitopes and
therefore, reduce inhibition. These results indicate that rGal d 6 is immunologically
reactive and allergenic. Therefore, it is clear that IgE binding epitopes are present in
rGal d 6. However, these results are not sufficient to establish the immunological
equivalence in comparison to natural Gal d 6 (nGal d 6). In order to overcome this
limitation, rGal d 6 must be compared with purified nGal d 6 through RAST using a
panel of sera from patients diagnosed with allergy to hen’s egg yolk. However,
purification of nGal d 6 proves to be a challenge and thus purified rGal d 6 provides
a more logical option.
In conclusion, results of this chapter suggest that some patients with allergy to hen’s
egg white are sensitised against egg yolk proteins. Furthermore, our results indicated
that sensitisation is not limited to hen’s egg yolk. It was shown that a number of yolk
proteins from emu and quail were also able to react with egg white allergy patients’
serum. Therefore, in those patients’ development of allergy can be attributed to
allergens derived from both the albumen and yolk. Furthermore, these results suggest
that there are potentially undiscovered allergens within the egg yolks of hen, emu
and quail. Mass spectrometry results revealed that IgE reactive yolk proteins derived
from VTG-1, VTG-2 and Apo B precursor families. In addition, we report the
successful production of rGal d 6 as a soluble fraction in E. coli. The inhibition 73

ELISA immunoassays showed clear IgE binding to rGal d 6 and indicated a similar
level of allergenicity to natural CEY. However, it is important to analyse the exact
level of allergenicity of rGal d 6 in comparison to purified nGal d 6 in future studies.
Knowledge on exact allergenicity of rGal d 6 would be highly valuable to researchers
where it would facilitate decision-making when subjecting it to further molecular
studies such as epitope analysis, production of hypoallergenic mutants and
determining structural and functional basis of allergenicity. Indeed, our results
highlight the significance of Gal d 6 (YGP42) as an important allergen of the egg
yolk, and paves the way for the preparation of recombinant allergens for potential
use in future diagnostics and therapeutics of egg yolk allergy.
74

Chapter 3: Immunological comparison of native and recombinant hen’s egg yolk allergen α-livetin (Gal d 5)
Publication under preparation: De Silva C, Dhanapala P, Doran T, Tang MLK & Suphioglu C: Immunological analysis of natural and recombinant hen’s egg yolk allergen chicken serum albumin.
75

3.1 Introduction
Gal d 5 is a partially heat-labile allergen from the egg yolk of domestic chicken. Gal
d 5 is synthesised in the liver of laying hens, and is present in both the blood
circulation and the egg yolk. It is considered as the most common avian allergenic
serum albumin and is the causative allergen implicated in bird-egg syndrome [82,
135]. Gal d 5, like most other serum albumins, can act as both a food and an inhalant
allergen resulting in respiratory and food allergy symptoms, respectively. In bird-egg
syndrome, sensitisation to Gal d 5 usually starts with the exposure to airborne
chicken serum through the respiratory tract. Development of clinical allergy then
takes place when the immune system encounters Gal d 5 derived from the egg yolk
or chicken serum [82, 92].
Studies on IgE sensitisation to Gal d 5 is very limited when compared to egg white
allergens, and other allergenic serum albumins from different species [92]. A cross-
sectional survey on IgE reactivity to various allergens reported that 0.14% of subjects
had IgE sensitisation to Gal d 5 [136]. However, another study reported the
percentage of IgE sensitisation to Gal d 5 to be high as 20% [137]. Furthermore, to
the best of our knowledge there are no reports of production of a recombinant Gal d
5 (rGal d 5). The use of recombinant allergens over natural allergen extracts in
allergy diagnosis, treatment, and research offer many advantages due to their
superior pharmaceutical quality as discussed in Chapter 1. Current applications and
future potential developments of recombinant allergen use in clinical and research
settings are extensively discussed in the scientific literature [115, 116, 118, 133, 138,
139].
The first aim of this chapter was to produce a recombinant version of Gal d 5 as a
soluble fraction. We first used NEB Express Iq Competent E. coli to produce rGal d
76

5. In this study, the E. coli strain was not successful at producing rGal d 5 as a
soluble fraction despite successful expression of rGal d 6 in Chapter 2. Our pilot
expression study showed that 100% of the rGal d 5 was produced as IBs indicating
the unpredictability and challenging nature of recombinant protein production.
However, in the event of IB formation, manipulation of microbiological growth
conditions may result in induction of soluble protein production. These include
changing culture media composition, growth temperature, production rate and the
availability of heat-shock chaperones. However, implicating such changes do not
guarantee the minimization of IB formation. Therefore, we employed a different
recombinant protein production platform as an alternative approach to express rGal d
5 as a soluble fraction in a eukaryotic expression system [131, 132].
In this chapter, we present the successful cloning and expression of rGal d 5 as a
soluble fraction using Kluyveromyces lactis (K. lactis) yeast strain. Then, in this
study, we immunologically compared rGal d 5 and natural Gal d 5 (nGal d 5) using
serum from patients allergic to hen’s egg white. The IgE-mediated allergic reaction is
the most common form of food allergy. Therefore, we comparatively analysed
specific IgE binding capacity of rGal d 5 with nGal d 5 using ELISA and Western
dot blot analysis.
3.2 Materials and methods
3.2.1 Human patients’ sera
Sera from 21 patients allergic to hen’s egg white were obtained from the Royal
Children’s Hospital (Melbourne, VIC, Australia). The egg white specific IgE levels
of patients are shown in Table 2.1. Experimentation involving patients’ sera was
conducted in compliance with the National Statement on Ethical Conduct in Human
Research (2007) with approval from Deakin University Faculty of Science,
77

Engineering and Built Environment Human Ethics Advisory Group (HEAG), with a
project approval number of STEC-34-2013-DHANAPALA.
Table 3.1: The levels of allergen specific IgE antibodies against egg white determined by ImmunoCAP (Phadia)
Patient number
IgE level (IU/mL) against hen’s egg white
1 93.50
2 28.80
3 13.60
4 9.26
7 6.89
8 18.50
9 16.50
10 4.13
11 3.62
13 1.21
14 1.32
15 1.72
16 2.08
17 2.21
18 2.58
19 1.78
21 1.25
22 1.05
23 0.32
24 0.18
25 0.47
78
3.2.1 Cloning and expression of Gal d 5 in E. coli expression system
3.2.1.1 RT-PCR amplification of Gal d 5
RT-PCR amplification of Gal d 5 was performed using OneStep RT-PCR kit
according to the manufacturer’s instructions. The oligonucleotide primers required
for amplification of mature Gal d 5 gene were based on the nucleotide sequence
published on NCBI (NCBI reference number: NM_205261.2). The oligonucleotide
forward primer 5’-CGCGGATCCTTTGCTCGTGATGCAGAGC-3’ and reverse
primer 5’-CGCGAATTCTTAAGCACCAATTCCTAATGTGGC-3’ were
synthesised at Micromon-Monash University (Clayton, VIC, Australia). BamHI and
EcoRI restriction enzyme sites were incorporated into 5’ ends of forward and reverse
primers, respectively to facilitate cloning of Gal d 5 gene (restriction sites are
underlined in the primer sequences). Furthermore, a 5’ CGC extension was added to
each primer in order to increase the cleavage efficiency of the restriction enzymes.
Total mRNA extracted from the chicken liver in Section 2.2.2.2 was used as the
template for RT-PCR. The RT-PCR master mix was prepared by mixing 10 µL of 5×
QIAGEN One-Step RT-PCR buffer, 2 µL of 10 mM dNTP mix, 10 µL of 5× Q-
solution, 1 µL of 1 µM forward primer, 1 µL of 1 µM reverse primer, QIAGEN One-
Step RT-PCR enzyme mix and 170.82 ng of mRNA in a 50 µL total reaction volume
in a sterile PCR tube. The thermal cycler conditions used for RT step were 30
minutes at 50°C for RT and 15 minutes at 95°C for activation of HotStart DNA
polymerase. The parameters used for the 3 step PCR cycling step were 35 cycles of 1
minute denaturation at 94°C, 1 minute annealing at 53°C, 2 minute extension at 72°C
and a final 10 minute extension at 72°C. The RT-PCR product was then analysed on
1% (W/V) agarose gel and purified according to the protocol mentioned in Section
2.2.2.4.
79

3.2.1.2 Synthesis of pTrcHis A-Gal d 5 construct and expression of rGal d 5 in E. coli Restriction enzyme digestion and cloning of Gal d 5 gene into pTrcHis A plasmid
vector was performed according to the protocol mentioned in Section 2.2.2.5. The
ligation reaction was transformed into chemically competent NEB Express Iq
Competent E. coli according to the protocol mentioned in Section 2.2.2.6. Five
transformant clones were picked using sterile pipette tips and inoculated into fresh
LB media containing 50 μg/mL ampicillin and allowed to grow overnight at 37°C
with shaking at 250 rpm. Then, plasmid isolation of all five overnight bacterial
cultures was performed according to the protocol outlined in Section 2.2.2.7.
Restriction enzyme digest screening for clones harbouring pTrcHis A-Gal d 5
construct and sequencing of the constructs were done according to the protocol
mentioned in Section 2.2.2.8. Time course of expression analysis of rGal d 5 was
carried out according to the method mentioned in Section 2.2.2.9. E. coli culture
fractions were collected at 2nd, 3rd and 5th hourly time points.
3.2.2 Cloning and expression of Gal d 5 in K. lactis eukaryotic protein
expression system
3.2.2.1 Natural allergen extract
Lyophilized chicken serum albumin (nGal d 5) powder (chicken serum albumin,
CSA62-0001) available at the highest purification level (≥ 96% purity) was
purchased from Equitech-Bio, Inc. (Kerrville, TX, USA) and prepared at a
concentration of 10 mg/mL in 1× PBS.
80

3.2.2.2 Strains, vectors and growth conditions
E. coli strain NEB® 5-alpha F’ Iq (New England Biolabs Inc., MA, USA) was used as
the cloning host and was grown in LB medium supplemented with 50 µg/mL
ampicillin at 37°C. K. lactis strain GG799 (New England Biolabs Inc., MA, USA)
was used as the host strain for the secretion of rGal d 5. K. lactis were grown in
either YPGal medium (1% (W/V) yeast extract, 2% (W/V) peptone, 2% (W/V)
galactose) or YPGlu medium (1% (W/V) yeast extract, 2% (W/V) peptone, 2%
(W/V) glucose) at 30°C. The K. lactis integrative expression vector pKLAC2 (New
England Biolabs Inc., MA, USA) contains the Aspergillus nidulans acetamidase gene
(amdS), which allows growth on nitrogen-free minimal medium containing
acetamide. The selection of K. lactis cells transformed with pKLAC2 vectors were
grown on yeast carbon base (YCB) agar medium supplemented with 5 mM
acetamide at 30°C.
3.2.2.3 PCR amplification of Gal d 5 gene with a C-terminal hemagglutinin (HA) epitope tag
Gal d 5 gene was amplified by PCR technique using the QIAGEN Fast Cycling PCR
kit (Qiagen, Hilden, Germany). pTrcHis A-Gal d 5 expression vector was used as the
template DNA (constructed in Section 3.2.1.2). Primers used for amplification of Gal
d 5 gene were based on the sequence published on NCBI (NCBI accession number:
NM_205261.2).
The sequence coding for the mature Gal d 5 was amplified with the forward primer
5’-CGCCTCGAGAAAAGATTTGCTCGTGATGCAGAGCACAAGAG-3’ and
reverse primer 5’-CGCGCGGCCGCTTATGCATAATCTGGAACATCATATGG
81

ATAAGCACCAATTCCTAATGTGGCTCTGC-3’. XhoI and NotI restriction
enzyme sites were incorporated into 5’ sides of forward and reverse primers,
respectively (restriction sites underlined in the primer sequences). Forward primer
contains a Kex protease cleavage site immediately downstream of the XhoI
restriction site (nucleotides in italics). The reverse primer contains sequences for C-
terminal hemagglutinin (HA) epitope (nucleotides in bold) and a TTA stop codon
immediately downstream the NotI restriction site. Both primers contain CGC
extensions at the 5’ ends. The PCR reaction mix was prepared by mixing 10 µL of
QIAGEN PCR Fast Cycling Master Mix, 4 µL of 5×Q-Solution, 2.5 µL of forward
primer to a final concentration of 0.5 µM, 1.82 µL of reverse primer to a final
concentration of 0.5 µM and 1.82 µL of template DNA (<300 ng) in a 20 µL total
reaction volume. The thermal cycler conditions were 5 minutes at 95°C for
activation of HotStart DNA polymerase, 35 cycles of 5 seconds denaturation at 96°C,
5 seconds annealing at 60°C, 5.34 minutes of extension at 68°C and a final extension
for 1 minute at 72°C. The PCR product was then analysed on E-Gel® CloneWell™
agarose gel with 0.8% SYBR Safe™ DNA Gel stain (Thermo Fisher Scientific®, MA,
USA), powered through E-Gel® iBase Power System (Thermo Fisher Scientific®,
MA, USA). The PCR product was then extracted from the bottom collection wells of
the precast gel by pipetting. The concentration of the gel-purified PCR product was
then measured by NanoDrop™ spectrophotometer and stored at -20°C until needed.
3.2.2.4 Construction of pKLAC2-Gal d 5 expression vector
The mature Gal d 5 gene was cloned into the XhoI and NotI sites, in frame with the
α-mating factor (α-MF) secretion leader sequence of the pKLAC2 vector, to yield
pKLAC2-Gal d 5 construct. The mature Gal d 5 gene and the pKLAC2 vector were
digested with restriction enzymes XhoI and NotI according to NEB Time-Saver™
82

protocol (protocol mentioned in Section 2.2.2.5). Ligation of the digested products
was conducted under standard conditions with a 1:6 vector to insert ratio keeping the
total DNA under 10 ng. The amounts of vector and insert DNA were calculated using
the following formula.
4 ng of digested pKLAC2 vector and 4.80 ng of linearized Gal d 5 gene were ligated
using 1 μL of T4 DNA ligase and 10× T4 DNA ligase reaction buffer in a 10 μL total
reaction volume. The ligation reaction was incubated overnight at 4°C. The ligation
reaction was chemically transformed into NEB 5-alpha F’ Iq Competent E. coli
according to NEB high efficiency transformation protocol (protocol mentioned in
Section 2.2.2.6). Transformed cells were grown overnight on LB agar medium at
37°C. Screening for E. coli colonies harbouring pKLAC2-Gal d 5 construct was
performed by restriction enzyme digestion of isolated plasmids with XhoI and NotI
(Protocol outlined in Section 2.2.2.8). The plasmids harbouring the insert were then
sequenced using #S1274 LAC4mt promoter sequencing forward primer 5’-
GCGGATAACAAGCTCAAC-3’ (Micromon-Monash University, Clayton, VIC,
Australia). The DNA sequences obtained from sequencing were then subjected to
nucleotide BLAST search using the NCBI online tool.
3.2.2.5 Production of linearized pKLAC2 expression cassette
pKLAC2-Gal d 5 construct was digested with SacII restriction enzyme in order to
produce the linear expression cassette. 1 µg of pKLAC2-Gal d 5 construct was
digested with 1 µL of SacΙΙ and 5 µL of NEBuffer 3.1 in a 50 µL total reaction
ng Insert = ng Vector × bp Insert bp Insert
83

volume. The sample was then incubated at 37°C for 1 hour. The digested DNA was
then desalted using QIAquick® PCR purification kit (QIAGEN, Hilden, Germany)
according to manufacturer’s instructions. All centrifugation steps were carried out at
13, 000 rpm at room temperature. 5 volumes of Buffer PB were mixed with 1 volume
of linearized DNA. Then, 10 µL of 3 M sodium acetate (C2H3NaO2) (pH 5.0) was
added to the sample to adjust the pH. To bind DNA, two SacII digested pKLAC2-
Gal d 5 reactions (100 µL of total volume) were run through a single QIAquick
column placed in a 2 mL collection tube by centrifugation for 1 minute. The flow-
through was discarded. Then, 750 µL of Buffer PE was added to the QIAquick
column and centrifuged for 1 minute to wash. The flow-through was discarded. The
QIAquick column was centrifuged for an additional 1 minute and the flow-through
was discarded. The QIAquick column was placed in a clean 1.5 mL microcentrifuge
tube. To elute DNA, 50 µL of Buffer EB was added to the centre of the QIAquick
membrane and allowed to stand for 1 minute, prior centrifugation for 1 minute. The
concentration of purified DNA was measured using a NanoDrop™
spectrophotometer.
3.2.2.6 Transformation of K. lactis
Linearized expression cassette was introduced into K. lactis GG799 competent cells
by chemical transformation according to the manufacturer’s instructions. A tube of
K. lactis competent cells was thawed on ice. Then, 620 µL of NEB Yeast
Transformation Reagent was added to the cells and mixed by inverting the tube until
the solution was homogeneous. 1 µg of linearized pKLAC2 expression cassette was
added to the cell mixture in a volume less than 15 µL and mixed by inverting the
tube several times. The mixture was incubated at 30°C for 30 minutes. Then, the
cells were heat shocked by incubating at 37°C for 1 hour in a water bath. The cells
84

were pelleted by centrifugation at 7000 rpm for 2 minutes. The supernatant was
discarded. The cell pellet was resuspended in 1 mL sterile YPGlu medium and
centrifuged at 7000 rpm for 2 minutes. The supernatant was discarded. The cell pellet
was resuspended again in YPGlu media in a sterile 1.5 mL tube and incubated at
30°C for 3.5 hours with shaking at 250 rpm. The cell mixture was then transferred
into a new microcentrifuge tube. The cells were pelleted by centrifugation at 7000
rpm for 2 minutes and the supernatant was discarded. The cell pellet was
resuspended in 1 mL of sterile 1× PBS. Then, 50 µL and 100 µL aliquots were plated
on YCB agar medium containing 5 mM acetamide and incubated at 30°C for 3.5
days until colonies formed.
3.2.2.7 Identification of multi-copy integrants
K. lactis transformants with multi-copy integrants were identified through whole cell
PCR analysis. Individual K. lactis colonies were patched onto fresh YCB agar
medium plates containing 5 mM acetamide and incubated at 30°C for 1-2 days. Cells
from an area approximately 1 mm2 were harvested by scraping with a sterile pipette
tip and resuspended in 25 µL 1 M sorbitol (Sigma-Aldrich, MO, USA) containing 10
mg/mL lyticase (Sigma-Aldrich, MO, USA). The cells were mixed by vortexing and
incubated at 30°C for 1 hour. Lyticase-treated cells were lysed in a thermocycler by
incubating at 98°C for 10 minutes. Then, PCR reaction was made by adding 10 µL of
10× integration primer 2 (5’-ATCATCCTTGTCAGCGAAAGC-3’), 10 µL of 10×
integration primer 3(5’-ACCTGAAGATAGAGCTTCTAA-3’), 10 µL of 2 mM
dNTPs, 10 µL of 10× ThermoPol Buffer, 1 µL of Taq DNA Polymerase and 34 µL
of deionised water to lyticase-treated cells in a final reaction volume of 100 µL. The
thermal cycler conditions were: 30 cycles at 30 seconds at 94°C, 30 seconds at 50°C
and 3 minutes at 72°C and a final incubation at 72°C for 10 minutes. The whole cell
85

PCR products were analysed on E-Gel® CloneWell™ agarose gel with 0.8% SYBR®
Safe DNA gel stain.
3.2.2.8 Time course of expression and detection of secreted rGal d 5
Transformed K. lactis strain containing multi-copy integrants were screened for its’
ability to secrete rGal d 5 in YPGal medium. A small aliquot of frozen K. lactis cells
was revived on YCB agar medium containing 5 mM acetamide by incubating at
30°C for 1.5 days. For expression, a single K. lactis colony was grown in 5 mL of
YPGal medium at 30°C with shaking at 250 rpm for 7 days. Culture supernatants
were harvested by centrifugation daily starting from 2nd day to 7th day during the
time course of expression. Collected culture supernatants were then analysed by
SDS-PAGE (protocol mentioned in Section 2.2.1.3) and Western blotting (protocol
mentioned in Section 2.2.1.4.1). Here, monoclonal anti-HA antibody produced in
mouse (diluted 1:1000 in blocking solution) (Sigma-Aldrich, MO, USA) was used as
the primary antibody, while alkaline phosphatase-conjugated anti-mouse IgG
antibody was used as the secondary antibody.
3.2.2.9 Purification of rGal d 5
Purification of rGal d 5 was performed using Pierce Magnetic HA-Tag IP/Co-IP kit
(Thermo Fisher Scientific®, MA, USA) according to the manufacturer’s instructions.
25 µL of Pierce anti-HA Magnetic Beads were mixed with 175 µL of IP Lysis/Wash
Buffer by gently vortexing in a microcentrifuge tube. The tube was placed into a
magnetic stand to collect the beads. The supernatant was discarded. 1 mL of IP
Lysis/Wash Buffer was added to the microcentrifuge tube and gently vortexed for 1
minute. The magnetic beads were collected using a magnetic stand. The supernatant
was discarded. 300 µL of culture supernatant sample containing HA-tagged rGal d 5
86
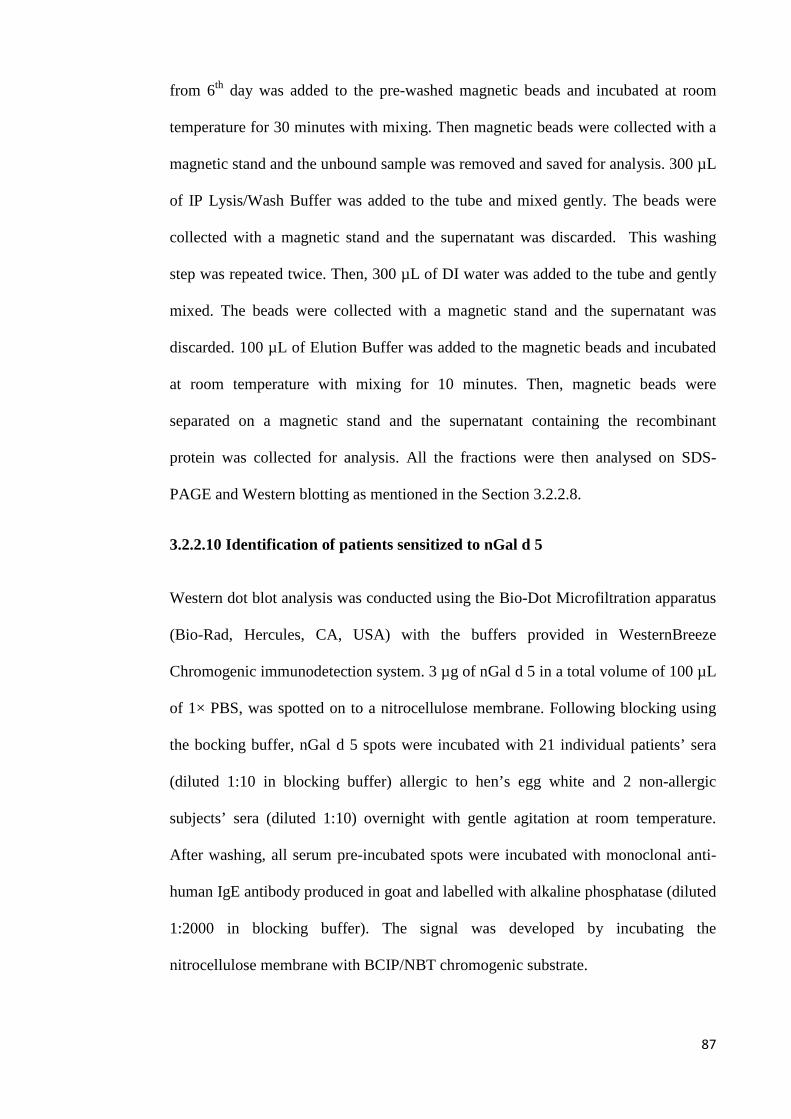
from 6th day was added to the pre-washed magnetic beads and incubated at room
temperature for 30 minutes with mixing. Then magnetic beads were collected with a
magnetic stand and the unbound sample was removed and saved for analysis. 300 µL
of IP Lysis/Wash Buffer was added to the tube and mixed gently. The beads were
collected with a magnetic stand and the supernatant was discarded. This washing
step was repeated twice. Then, 300 µL of DI water was added to the tube and gently
mixed. The beads were collected with a magnetic stand and the supernatant was
discarded. 100 µL of Elution Buffer was added to the magnetic beads and incubated
at room temperature with mixing for 10 minutes. Then, magnetic beads were
separated on a magnetic stand and the supernatant containing the recombinant
protein was collected for analysis. All the fractions were then analysed on SDS-
PAGE and Western blotting as mentioned in the Section 3.2.2.8.
3.2.2.10 Identification of patients sensitized to nGal d 5
Western dot blot analysis was conducted using the Bio-Dot Microfiltration apparatus
(Bio-Rad, Hercules, CA, USA) with the buffers provided in WesternBreeze
Chromogenic immunodetection system. 3 µg of nGal d 5 in a total volume of 100 µL
of 1× PBS, was spotted on to a nitrocellulose membrane. Following blocking using
the bocking buffer, nGal d 5 spots were incubated with 21 individual patients’ sera
(diluted 1:10 in blocking buffer) allergic to hen’s egg white and 2 non-allergic
subjects’ sera (diluted 1:10) overnight with gentle agitation at room temperature.
After washing, all serum pre-incubated spots were incubated with monoclonal anti-
human IgE antibody produced in goat and labelled with alkaline phosphatase (diluted
1:2000 in blocking buffer). The signal was developed by incubating the
nitrocellulose membrane with BCIP/NBT chromogenic substrate.
87

3.2.2.11 Dot-blot analysis of rGal d 5
3 µg of rGal d 5 was spotted on to nitrocellulose membrane using the Bio-Dot
Microfiltration apparatus according to the protocol mentioned in Section 3.2.2.10
above. rGal d 5-spotted membrane was probed with pooled sera (diluted 1:5 in
blocking buffer) composed of patients sensitised to nGal d 5 (patients 3, 10, 15, 16,
17, 19, 24 and 25). As a negative control, two rGal d 5 spots were probed with sera
from 2 non-allergic individuals. After washing, all serum pre-incubated spots were
incubated with monoclonal anti-human IgE antibody produced in goat labelled with
alkaline phosphatase (diluted 1:2000 in blocking buffer). The signal was developed
by incubating the nitrocellulose membrane with BCIP/NBT chromogenic substrate.
3.2.2.12 Indirect ELISA for quantification of specific IgE against rGal d 5 and nGal d 5
In brief, 1 µg of nGal d 5 and rGal d 5 in 100 µL of coating buffer (100 mM
bicarbonate/carbonate coating buffer, pH 9.6) were allowed to coat wells of an
ELISA microtiter plate. The proteins were allowed to coat the microtiter wells
overnight at 4°C. After triple washing with 0.05% PBST, all protein coated wells
were blocked with 1% (W/V) non-fat dry milk in 1× PBS for 2 hours at room
temperature. The plates were triple washed with 0.05% PBST. nGal d 5 and rGal d 5
coated wells were then incubated with patient sera (diluted 1:10 in 1% (W/V) non-fat
dry milk in 1× PBS) 3, 10, 15, 16, 17, 19, 24, 25 and one non-allergic sera (diluted
1:10 in 1% (W/V) non-fat dry milk in 1× PBS) overnight at 4°C. Each sample was
done in triplicates. After triple washing the wells with 0.05% PBST, all wells were
incubated with monoclonal anti-human IgE antibody produced in goat and labelled
with alkaline phosphatase (diluted 1:1000 in 1% non-fat dry milk in 1× PBS) for 2
hours at room temperature. Following triple washing with 0.05% PBST, 200 µL of
88

alkaline phosphatase Yellow (pNPP) liquid substrate was added to the wells and
incubated at 37°C. The colour development was terminated by adding 3 M NaOH
(50 µL per well) and the plate was read at 405 nm using a plate reader.
3.3 Results
3.3.1 Expression of rGal d 5 in E. coli Analysis of RT-PCR product on 1% (W/V) agarose gel showed a predominant band
between 1500 bp and 2000 bp markers (expected size: 1827 bp) (Figure 3.1). E. coli
cells transformed with pTrcHisA-Gal d 5 construct had growth when grown on LB
agar under ampicillin resistance. When BamHI and EcoRI digested plasmids of
selected transformant clones were electrophoresed on 1% (W/V) agarose gel, 4 out of
5 clones showed the insert approximately at 2000 bp marker (expected size: 1827 bp)
(Figure 3.2). Sequencing analysis of plasmids harbouring the insert confirmed the in-
frame ligation of the Gal d 5 gene within the MCS of pTrcHis A vector. The NCBI
BLAST search of the derived sequence produced Gallus gallus albumin (sequence
ID: refΙNM 205261.2) as the top match with a 96% sequence similarity (Figure 3.3).
89

Figure 3.1: RT-PCR of Gal d 5 gene. The PCR product was electrophoresed on a 1% (W/V) agarose gel. Lane 1: RT-PCR product of chicken Gal d 5gene. Lane 2: negative control RT-PCR without template mRNA. MW: molecular weight marker GeneRuler 1kb Plus DNA ladder in bp. The arrow indicates the RT-PCR amplified Gal d 5 gene.
Figure 3.2: Restriction enzyme digest screening for the colonies harbouring the pTrcHis A-Gal d 5 construct. The digested plasmids were electrophoresed on a 1% (W/V) agarose gel. Lanes 1-5: BamHI and EcoRI digested plasmids of 5 individual bacterial colonies grown on transformation plate with antibiotic. MW: molecular weight marker GeneRuler 1kb Plus DNA ladder in bp. The arrow indicates the Gal d 5 gene.
MW 1 2
75
200
300 400
1000
700
500
1500
20000
5000
3000
10000
2000
MW 1 2 3 4 5
75
200 300 400
1000 700 500
1500
20000
5000 3000
10000
2000
90
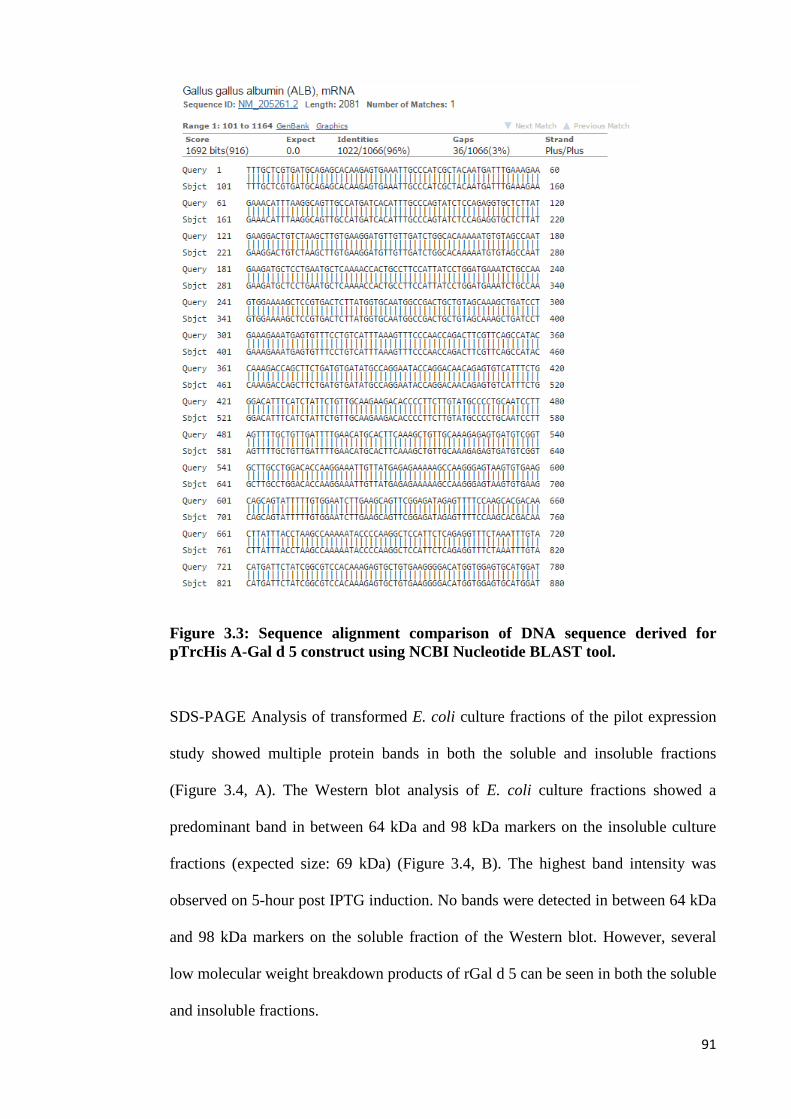
Figure 3.3: Sequence alignment comparison of DNA sequence derived for pTrcHis A-Gal d 5 construct using NCBI Nucleotide BLAST tool.
SDS-PAGE Analysis of transformed E. coli culture fractions of the pilot expression
study showed multiple protein bands in both the soluble and insoluble fractions
(Figure 3.4, A). The Western blot analysis of E. coli culture fractions showed a
predominant band in between 64 kDa and 98 kDa markers on the insoluble culture
fractions (expected size: 69 kDa) (Figure 3.4, B). The highest band intensity was
observed on 5-hour post IPTG induction. No bands were detected in between 64 kDa
and 98 kDa markers on the soluble fraction of the Western blot. However, several
low molecular weight breakdown products of rGal d 5 can be seen in both the soluble
and insoluble fractions.
91

Soluble fraction Insoluble fraction Soluble fraction Insoluble fraction
250
98 64 50 36
30
16 6
MW 1 2 3 4 MW 1 2 3 4 MW 1 2 3 4 MW 1 2 3 4
(A) (B)
250
98 64 50
36
30
16
6
Figure 3.4: Time-course of expression of soluble and insoluble E. coli cell culture fractions harbouring rGal d 5. Lane 1: un-induced culture fractions. Lanes 2-4: IPTG-induced culture fractions at time points 2nd, 3rd and 5th hours, respectively, and analysed by (A) SDS-PAGE and (B) Western immunoassay. MW: molecular weight marker in kDa (SeeBlue Pre-Stained protein standard). The arrows indicate the rGal d 5 in the insoluble fraction.
3.3.2 Expression of Gal d 5 in K. lactis
The full-length cDNA coding for the mature Gal d 5 gene was amplified in a single
step using QIAGEN Fast Cycling PCR kit. A single predominant band was visible
just below 2000 bp marker (expected size: 1827 bp) when electrophoresed on E-Gel®
CloneWell™ agarose gel (Figure 3.5). E. coli cells transformed with newly
synthesised pKLAC2-Gal d 5 construct had growth when grown on LB agar under
ampicillin resistance. When XhoI and NotI digested plasmids of selected
transformant clones were electrophoresed on 1% agarose gel, 6 out of 7 clones
showed the insert approximately at 2000 bp marker (expected size: 1827 bp) (Figure
3.6). Sequencing analysis pKLAC2-Gal d 5 constructs confirmed the ligation of Gal
d 5 gene in-frame with the α-MF secretion signal of the pKLAC2 vector. The NCBI
BLAST search of the derived sequence produced Gallus gallus albumin (sequence
ID: refΙNM 205261.2) as the top match with a 98% sequence similarity (Figure 3.7).
92

Figure 3.5: PCR amplification of Gal d 5 gene. The PCR product was electrophoresed on E-Gel® CloneWell™ agarose gel with 0.8% SYBR Safe™
DNA Gel stain. Lane 1: PCR amplified Gal d 5 gene. MW: molecular weight marker in bp (E-Gel® 96 High Range DNA marker). The arrow indicates the PCR amplified Gal d 5 gene.
Figure 3.6: Restriction enzyme digest screening for the colonies harbouring the pKLAC2-Gal d 5 construct. The digested plasmids were electrophoresed on a 1% (W/V) agarose gel. Lanes 1-7: XhoI and NotI digested plasmids of 7 individual bacterial colonies grown on transformation plate under ampicillin resistance. MW: molecular weight marker in bp (E-Gel® 96 High Range DNA marker). The arrow indicates the Gal d 5 gene.
MW 2 3 4 5 6 7 1
10, 000
4, 000
2, 000
800
400
1 MW
10,000 bp
4,000 bp
2,000 bp
800 bp
400 bp
93

Figure 3.7: Sequence alignment comparison of DNA sequence derived for pKLAC2-Gal d 5 construct using NCBI Nucleotide BLAST tool.
94
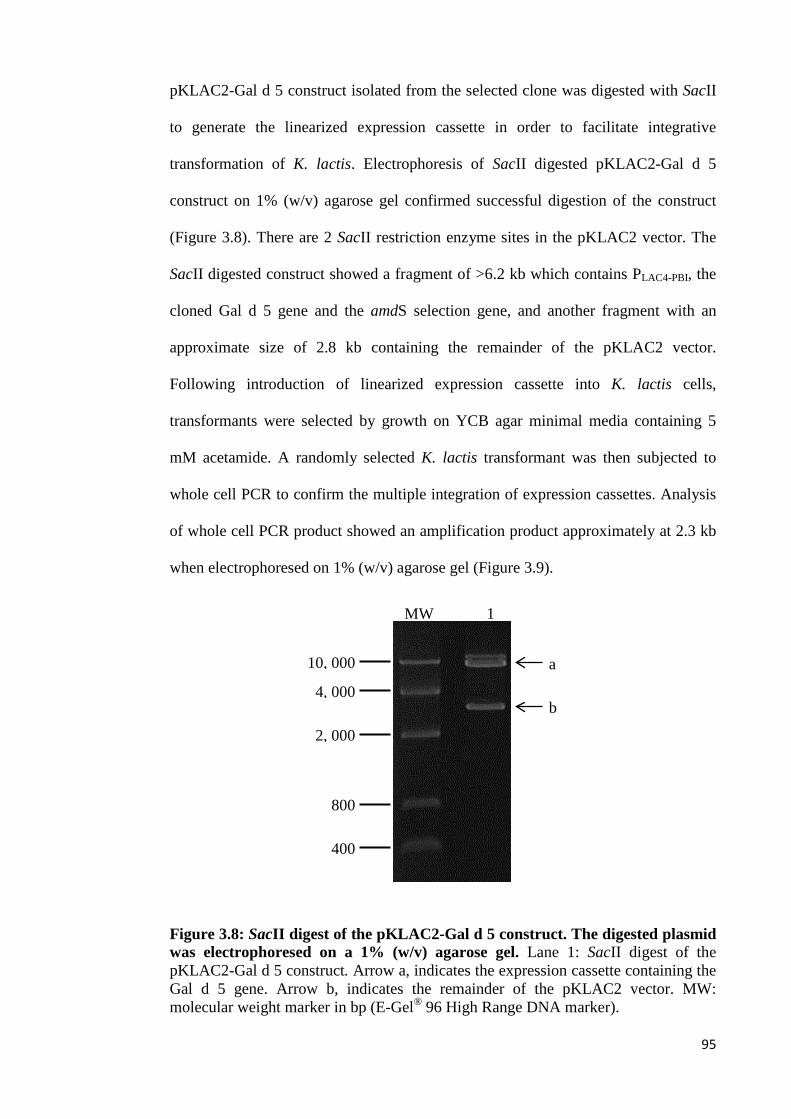
pKLAC2-Gal d 5 construct isolated from the selected clone was digested with SacΙΙ
to generate the linearized expression cassette in order to facilitate integrative
transformation of K. lactis. Electrophoresis of SacII digested pKLAC2-Gal d 5
construct on 1% (w/v) agarose gel confirmed successful digestion of the construct
(Figure 3.8). There are 2 SacII restriction enzyme sites in the pKLAC2 vector. The
SacII digested construct showed a fragment of >6.2 kb which contains PLAC4-PBI, the
cloned Gal d 5 gene and the amdS selection gene, and another fragment with an
approximate size of 2.8 kb containing the remainder of the pKLAC2 vector.
Following introduction of linearized expression cassette into K. lactis cells,
transformants were selected by growth on YCB agar minimal media containing 5
mM acetamide. A randomly selected K. lactis transformant was then subjected to
whole cell PCR to confirm the multiple integration of expression cassettes. Analysis
of whole cell PCR product showed an amplification product approximately at 2.3 kb
when electrophoresed on 1% (w/v) agarose gel (Figure 3.9).
Figure 3.8: SacII digest of the pKLAC2-Gal d 5 construct. The digested plasmid was electrophoresed on a 1% (w/v) agarose gel. Lane 1: SacII digest of the pKLAC2-Gal d 5 construct. Arrow a, indicates the expression cassette containing the Gal d 5 gene. Arrow b, indicates the remainder of the pKLAC2 vector. MW: molecular weight marker in bp (E-Gel® 96 High Range DNA marker).
10, 000
4, 000
2, 000
800
400
MW 1
a
b
95

Figure 3.9: Whole cell PCR analysis for screening of strains containing multi-copy integrants. The PCR product was electrophoresed on a 0.8 % precast agarose gel with SYBR Safe™ DNA gel stain. Lane 1: PCR product. MW: molecular weight marker in bp (E-Gel® 96 High Range DNA marker). Arrow indicates the PCR amplicon at 2.3 kb. A time course of expression was performed to confirm the secretion of rGal d 5 and
to determine the optimum recombinant protein expression conditions of K. lactis
cells harbouring rGal d 5. The culture supernatant samples were analysed by SDS-
PAGE (Figure 3.10, A) and Western blot (Figure 3.10, B). SDS-PAGE analysis of
culture supernatants showed a single predominant band in between 64 kDa and 98
kDa markers in all the culture fractions (expected size: 1827 bp). The Western blot
showed a predominant band approximately in between 64 kDa and 98 kDa markers
corresponding to the protein on SDS-PAGE confirming the authenticity of rGal d 5.
SDS-PAGE analysis of nGal d 5 also showed a predominant band in between 64 kDa
and 98 kDa markers and was comparable to the SDS-PAGE of rGal d 5 (Figure 3.10,
C). The SDS-PAGE analysis of the time course of expression showed the highest
recombinant protein production on the 6th day.
8.0
2.0
MW 1
0.5
1.5
6.0 5.0 4.0
1.0
3.0
10.0
96
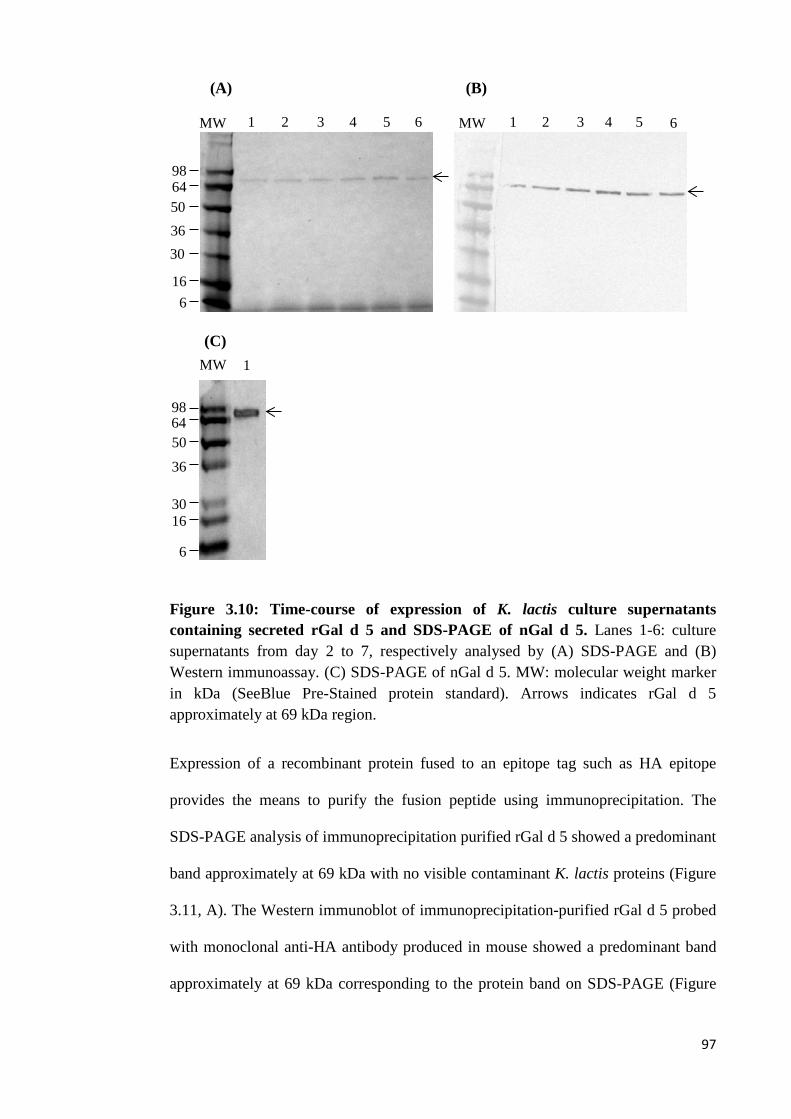
MW 1 2 3 4 5 6 MW 1 2 3 4 5 6
98 64 50 36 30
16 6
(A) (B)
98 64 50
36
30 16
6
MW 1 (C)
Figure 3.10: Time-course of expression of K. lactis culture supernatants containing secreted rGal d 5 and SDS-PAGE of nGal d 5. Lanes 1-6: culture supernatants from day 2 to 7, respectively analysed by (A) SDS-PAGE and (B) Western immunoassay. (C) SDS-PAGE of nGal d 5. MW: molecular weight marker in kDa (SeeBlue Pre-Stained protein standard). Arrows indicates rGal d 5 approximately at 69 kDa region.
Expression of a recombinant protein fused to an epitope tag such as HA epitope
provides the means to purify the fusion peptide using immunoprecipitation. The
SDS-PAGE analysis of immunoprecipitation purified rGal d 5 showed a predominant
band approximately at 69 kDa with no visible contaminant K. lactis proteins (Figure
3.11, A). The Western immunoblot of immunoprecipitation-purified rGal d 5 probed
with monoclonal anti-HA antibody produced in mouse showed a predominant band
approximately at 69 kDa corresponding to the protein band on SDS-PAGE (Figure
97

3.11, B). Furthermore, no proteolytic degradation of rGal d 5 was observed in all
SDS-PAGE and Western immunoblot analysis of K. lactis culture supernatants.
Figure 3.11: Analysis of immunoprecipitation purified rGal d 5. (A) SDS-PAGE and (B) Western immunoassay of purified rGal d 5 fractions. Lane 1: unbound sample. Lane 2: elution containing rGal d 5. MW: molecular weight marker in kDa (SeeBlue Pre-Stained protein standard). Arrows indicate rGal d 5.
3.3.3 Immunological analysis of nGal d 5 and rGal d 5
Sera from 21 patients’ allergic to hen’s egg white were tested with dot-blot analysis
to examine the frequency and degree of IgE sensitisation against nGal d 5. The dot-
blot analysis was performed only once due to the limited availability of patients’
sera. The dot-blot analysis (Figure 3.12) showed that 38% (8 out of 21) of egg white
allergy patients to have IgE reactivity to nGal d 5. Out of the all sensitised patients,
patient 3 exhibited significantly high IgE reactivity against nGal d 5 when compared
to others. Other sensitised patients exhibited mild IgE reactivity to Gal d 5. The
ability to recognize rGal d 5 by the immune systems of nGal d 5 sensitised patients
was demonstrated by Western dot blot (Figure 3.13). rGal d 5 showed clear IgE
reactivity when probed with pooled patients’ sera. rGal d 5 showed negligible level
of IgE reactivity when probed with non-allergic sera.
An indirect ELISA assay was performed to compare the degree of IgE reactivity of
nGal d 5 and rGal d 5 (Figure 3.14). The result shows that patient 3 to have the
98 64 50 36 30
16 6
MW 1 2 MW 1 2
(A) (B)
98

N
nGal
d 5
sens
itise
d pa
tient
s’ se
rum
N
highest IgE reactivity against both nGal d 5 and rGal d 5. The remaining patients
showed mild reactivity to nGal d
5 and rGal d 5. Furthermore, in every patient the amount of IgE reactivity directed at
nGal d 5 and rGal d 5 were very similar.
Figure 3.12: Testing of patients allergic to hen’s egg white described in Table 1 for IgE reactivity with dot-blotted nGal d 5. The grid above shows the identity of the serum used corresponding to each spot. nGal d 5 sensitised patients are highlighted in the grid. Dots denoted by N are non-allergic serum.
Figure 3.13: Testing of patients sensitised to nGal d 5 for IgE reactivity with dot-blotted rGal d 5. Dots denoted by N are sera from non-allergic subjects.
I II III IV V VI VII VIII
A 21 9 7 19 25 17 11 16
B 23 10 15 1 8 24 13 18
C 22 3 4 2 14 N N
A
B
C
I II III IV V VI VII VIII
99

Figure 3.14: Comparison of the binding activity of human specific IgE against recombinant and natural Gal d 5. Blue boxes represent IgE reactivity against nGal d 5 and red boxes represent IgE reactivity against rGal d 5. N denotes the non-allergic serum and numbers denotes different patients’ sera. Data are average of triplicate measurements SE ±.
3.4 Discussion
The main objective of Chapter 3 was to produce an IgE-reactive recombinant version
of hen’s egg yolk allergen Gal d 5 and analyse its’ IgE binding capacity in
comparison to nGal d 5. The first challenge of this study was to successfully clone
and express sufficient amounts of rGal d 5 as a soluble fraction. Variety of
recombinant production platforms are being designed in order to meet these
demands. However, there is no universal protein expression system or a predictive
tool, which can guarantee the desired outcome. This is mainly attributed to the
biochemistry of each protein and its effects on the host expression system [140].
Due to the success with expressing rGal d 6 in E. coli, it was decided to clone and
express rGal d 5 in the same strain. Analysis of RT-PCR result indicated that cDNA
coding for the mature egg yolk allergen Gal d 5 was selectively amplified from total
0
0.05
0.1
0.15
0.2
0.25
0.3
0.35
3 10 15 16 17 19 24 25 N
Abs
orba
nce
(405
nm
)
Human patients serum
nGal d 5rGal d 5
100

mRNA extracted from liver tissue. Analysis of SDS-PAGE and Western blot results
of IPTG induced culture fractions of E. coli harbouring pTrcHis A-Gal d 5 confirmed
the successful expression of rGal d 5. These data suggest that the PCR amplified Gal
d 5 gene has been successfully integrated to the MCS of the pTrcHis A vector.
Therefore, translation of rGal d 5 fusion peptide with a N-terminal 6×his tag has been
successfully lead by the Ptrc resulting in high levels of recombinant protein yield.
However, complete lack of soluble rGal d 5 indicates that rGal d 5 has undergone
irregular folding resulting in insoluble and refractile IBs.
Even though, E. coli host expression systems are well known for their versatility in
recombinant protein production, they also contain few drawbacks. For example
production of recombinant proteins, which contains large amounts of disulphide
bonds (DBs) has always been challenging. DBs are very common in proteins such as
mammalian proteins, hormones and secreted proteins [141]. Gal d 5 is a secreted
protein with 17 DBs stabilizing it [142]. DBs are crucial for correct protein folding,
stability and functionality. In general, the cytoplasm of E. coli cells does not offer a
favourable environment for DB formation due to the presence of numerous DB
reductases, such as thioredoxins and glutaredoxins. These DB reductases quickly
reduce DBs formed between two cysteine groups back to its thiolate state. Failure to
form DBs in the recombinant proteins results in it being formed as inactive IBs.
Therefore, it is highly possible that the large number of DBs present in Gal d 5
haven’t been formed in the E. coli cytoplasm and have undergone IB formation [141,
143]. On the other hand it is clear why Gal d 6 protein production by E. coli as a
soluble fraction had relative success when compared to Gal d 5 protein production. It
is evident that lack of DBs in Gal d 6 [144] may have contributed to undergo
successful expression of it as a soluble fraction.
101

In order to retain the biomedical value of a biomolecule, it is essential that the
recombinant protein is produced in a soluble fraction, resembling as much as
possible to its native form. Therefore, in the event of IB formation, a number of
strategies have been recommended to promote the production of recombinant
proteins as a soluble fraction in the literature. If IB formation is due to lack of DB
formation, in vitro refolding can be used to obtain a functional protein. However, it is
well known that refolding in IBs is often unpredictable and challenging.
Furthermore, in vitro refolding is highly time consuming and require a large amounts
of reagents [143]. Majority of the mentioned implications are aimed at changing
growth conditions of the host strain to induce soluble protein expression.
Nevertheless, introducing changes in growth conditions do not always guarantee
successful expression of soluble recombinant protein [131, 132]. Therefore, overall
generation of the soluble protein is the preferred choice [143].
As an alternative approach, we decided to use a different host organism to express
rGal d 5 as a soluble fraction. In this chapter, we used the eukaryote yeast strain K.
lactis to produce rGal d 5 as a secreted protein. Our results confirmed that rGal d 5
produced by K. lactis is IgE-reactive and has very similar IgE binding levels to nGal
d 5. Furthermore, in vitro immunoassay results indicate that patients with allergy to
hen’s egg white can have reactive IgE antibodies against Gal d 5, indicating potential
allergy to hen’s egg yolk.
Analysis of PCR results indicated that cDNA coding for the mature egg yolk allergen
Gal d 5 was selectively amplified from the pTrcHis A-Gal d 5 construct. The
randomly selected K. lactis transformant strain was confirmed as a multi-copy
integrant using the whole cell PCR technique. In this strategy, only strains
containing multiple copies of pKLAC2 expression cassette will produce an amplicon
102

with a size of 2.3 kb. Strains harbouring multiple copy inserts may have higher
recombinant protein expression levels than single copy integrants. However, this
technique is unable to indicate the number of integrated expression vector fragments
in the cells [145]. K. lactis transformant selection is based on acetamide selection
instead of traditional antibiotic selection. It has been reported that acetamide
selection enriches transformants with multi-copy integrants over transformants with
single copy integrants. As a result, majority of the strains contain multiple copies of
the expression fragment [145, 146]. Therefore, we were able to obtain a strain with
multi-copy integrants with relative ease.
Analysis of galactose-induced K. lactis culture supernatants with SDS-PAGE and
Western immunoassay confirmed the presence of rGal d 5 at the expected size. These
data suggests that the pKLAC2 containing Gal d 5 gene has been successfully
integrated into the K. lactis genome at the LAC4 locus, which drives protein
expression. Furthermore, this result indicates that cloning of Gal d 5 gene into
pKLAC2 expression vector had been done in-frame with the α-MF secretion leader
sequence. The α-MF domain directs the fusion protein to be efficiently transported
through yeast secretory pathway. Furthermore, there were not any visible K. lactis
derived proteins in the culture supernatants. Therefore, lack of detectable amounts of
native host proteins serves as the first step of purification. Lack of native of K. lactis
proteins in the spent culture media indicates that those proteins haven’t been secreted
efficiently through the yeast secretory pathway. Multiple integration of Gal d 5 gene
may have resulted in overexpression of the recombinant protein. Therefore, a high
amount of recombinant Gal d 5 can enter the K. lactis secretory pathway preventing
or reducing the secretion of native proteins.
103

The expression of fusion protein with a HA-epitope tag provides the means to
selectively purify proteins through immunoprecipitation in addition to serving as an
identification tag. The rGal d 5 was purified to homogeneity by immunoprecipitation
using anti-HA magnetic beads. There were no visible K. lactis derived proteins on
SDS-PAGE indicating a high level of purity. The Western immunoassay of purified
rGal d 5 indicated that the majority of the anti-HA magnetic beads were able to
capture the target rGal d 5 protein without any cross reactivity with native K. lactis
host proteins. A major concern in recombinant protein production is protein
degradation due to proteolysis [133]. Our results confirmed that there was no
proteolytic degradation of rGal d 5.
The dot-blot immunoassay showed that 38% (8 out of 21patients) of egg white
patients to have IgE sensitisation directed against nGal d 5. However, only one
patient (patient number 3) out of the 8 IgE-reactive patients had significant reactivity
against nGal d 5 when compared to non-allergic controls. The amount of specific IgE
antibodies directed against a certain allergen can vary from person to person
influenced by a combination of genetic and environmental factors. However, exact
determinants responsible for producing such high amounts of specific IgE against
nGal d 5 in our experiment cannot be deduced without further investigations.
Furthermore, the remaining seven patients which have sensitisation against nGal d 5
had very minor reactivity. This could be attributed to the fact that Gal d 5 is a minor
allergen. A limitation in this study is the use of sera from patients diagnosed with egg
white allergy rather than from patients diagnosed with egg yolk allergy. At the
present time, allergy to hen’s egg yolk is not commonly tested in hospitals which
forced us to use sera from egg white allergy patients. The patients sensitized towards
nGal d 5 may or may not develop symptoms of allergy from Gal d 5. Nevertheless,
presence of such antibodies is considered a risk factor for allergy and to have a 104

predictive value. For example, it has been shown that presence of hen’s egg white
specific IgE antibodies even without clinical symptoms can be used to predict the
development of allergy before 7-10 years of age [3].
IgE binding capacity between recombinant and their corresponding natural allergens
may be different. Therefore, in this study we comparatively analysed the degree of
IgE binding of rGal d 5 and nGal d 5. The ELISA experiment showed that both
recombinant and natural Gal d 5 to exhibit very similar levels of IgE binding.
Furthermore, the dot-blot analysis of rGal d 5 confirmed that it is IgE reactive. These
results together suggest that rGal d 5 produced by K. lactis is recognizable by the
human immune system and bears similar epitopes to that of nGal d 5.
In conclusion, Chapter 3 presents the successful production of IgE-reactive rGal d 5
using K. lactis yeast strain. We have shown that rGal d 5 has similar allergenicity to
nGal d 5 by comparing IgE binding activity of both using sera from egg white allergy
patients. Furthermore, we were able to isolate rGal d 5 with a high level purity with
relative ease. Therefore, rGal d 5 produced in this chapter is a potential candidate to
be used in in vitro allergy diagnosis in the future. However, it is also important to
further subject rGal d 5 into immunological investigations using sera from patients
allergic to hen’s egg yolk. Immunological analysis of rGal d 5 in comparison to nGal
d 5 using patients with allergy to hen’s egg yolk may provide some in depth
validation to the results presented in this chapter. Furthermore, availability of IgE
reactive recombinant allergens opens the way to develop recombinant based
hypoallergenic variants with the aim to reduce IgE-mediated side effects during
immunotherapy. The efficacy of immunotherapy combined with recombinant based
hypoallergenic allergens has demonstrated promising results. For example,
subcutaneous immunotherapy trials conducted using recombinant hypoallergenic
105

variants of grass and birch pollen allergens showed that recombinant vaccines have
vaccination characteristics and is clinically effective [116]. Therefore, availability of
an IgE reactive recombinant hen’s egg yolk allergen Gal d 5 provide the means for
development of hypoallergenic derivatives using techniques such as site-directed
mutagenesis (SDM) [147]. Consequently, availability of hypoallergenic rGal d 5
variants in the future may open new treatment strategies to cure egg allergy.
106
Chapter 4: Production of hypoallergenic variant of recombinant hen’s egg yolk allergen chicken serum albumin (Gal d 5)
107

4.1 Introduction The use of genetically engineered recombinant based hypoallergenic variants in SIT
has proved its therapeutic supremacy over crude allergen extracts during SIT [116].
Furthermore, the reduced risk of side effects in patients undergoing SIT with
hypoallergens has been well commended [116, 119]. For example, recombinant
based hypoallergenic variants of peanut and birch pollen allergens has been shown to
perform SIT without the risk of severe allergic reactions in patients [119, 148]. In
Chapter 3, we produced an immunologically active recombinant version of Gal d 5
with similar IgE reactivity to its wild type counterpart, which may be useful as
standardised reagents in diagnostics in the future. In addition, rGal d 5 produced in
the previous chapter can be used as a platform to develop hypoallergenic variants
with reduced IgE binding capacity for potential use in SIT for patients suffering from
hen’s egg yolk allergy.
The availability of information regarding IgE binding allergenic epitopes can
immensely benefit the production of hypoallergens. IgE binding epitopes could be
either sequential or conformational. Reducing or complete elimination of IgE binding
can be achieved by introducing a number of mutations targeting the allergenic
epitopes using techniques such as SDM. Furthermore, in addition to serving as a tool
for introducing mutations to a DNA sequence, SDM can also be used to successfully
map epitopes of allergens, especially conformational epitopes [147, 148].
A common approach to develop hypoallergenic mutants is by changing the overall
conformation of the allergen by disrupting disulfide bonds (DB) by using the SDM
technique. DBs can be deleted by substituting corresponding cysteine residues that
form DBs with a different amino acid by introducing appropriate mutations to the
DNA sequence. Systematic disruption of DBs allows researchers to evaluate the
108

relationship between the allergen confirmation and the degree of IgE-mediated
immune response. Gal d 5 is stabilized by 17 DBs [142]. In this chapter, our primary
aim was to develop a mutant variant of Gal d 5 with reduced IgE binding capacity,
which could be used as a SIT hypoallergen in the future. However, due to the lack of
data regarding IgE binding antigenic epitopes of Gal d 5, an alternative approach was
required to develop a mutant with reduced IgE binding reactivity.
In this chapter, we first developed a mutant variant of Gal d 5 by simultaneously
disrupting two randomly selected DBs, by substituting cysteine (Cys) with alanine
(Ala). We hypothesised that removal of DBs would result in a mutant variant of Gal
d 5 with reduced or no IgE-binding reactivity at all. In order to test the hypothesis,
we comparatively analysed the IgE binding capacity of recombinant based mutant
Gal d 5 and native Gal d 5 using patients’ sera. The mutant variant of Gal d 5 was
developed by deleting two DBs at Cys196-Cys205 and Cys388-Cys397 by replacing
cysteine residues at positions 205 and 397 with alanine, using SDM. The mutant Gal
d 5 (Gal d 5196/205-388/397) DNA sequence was generated using the pThcHis A-Gal d 5
construct as the template from Chapter 3. The Gal d 5196/205-388/397 DNA was
selectively amplified and subcloned into pKLAC2 expression vector to synthesise
pKLAC2- Gal d 5196/205-388/397 construct for expression in K. lactis yeast strain.
However, recombinant Gal d 5196/205-388/397 (rGal d 5196/205-388/397) was not expressed
by K. lactis despite successful cloning.
Therefore, we decided to express Gal d 5196/205-388/397 cDNA in an E. coli expression
system. The mutant plasmid pThcHis A-Gal d 5196/205-388/397 produced by SDM was
used to transform E. coli cells for expression of rGal d 5196/205-388/397. Here,
expression of rGal d 5196/205-388/397 as a soluble fraction by E. coli was successful. The
contribution of the combined effect of disrupting Cys196-Cys205 and Cys388-
Cys397 of Gal d 5 to human IgE binding was comparatively analysed with native
109

Gal d 5 expressed by E. coli and K. lactis in the previous chapters. The immunoassay
results showed that IgE binding capacity of rGal d 5196/205-388/397 has been completely
abolished due to disruption of DBs. Therefore, rGal d 5196/205-388/397 may contain a
therapeutic value as a hypoallergen. However, lack of IgE reactivity of a mutant
variant based on Western immunoassay does not necessarily confirm it as a
hypoallergen. Even with reduced IgE binding capacity, the allergenicity of some
mutant variants of allergens are known to be unaffected [148]. Therefore, the true
allergenicity of the mutant Gal d 5 produced in this chapter must be assessed using
techniques such as mediator release assays and T cell proliferation assays in order to
confirm its immune reactivity.
4.2 Materials and methods
4.2.1 Site-directed mutagenesis of Gal d 5 Gal d 5196/205-388/397 variant, with two Cys-Ala substitutions leading to the disruption
of the corresponding DB, were generated by using the QuickChange Lightning Multi
Site-Directed Mutagenesis kit (Agilent Technologies, Santa Clara, CA, USA). The
construct pTrcHis A-Gal d 5 synthesised in Section 3.2.1.4 was used as the template
for mutant strand synthesis. Mutagenic primers were designed using the web-based
QuickChange Primer Design Program available online at
www.agilent.comgenomics/qcpd. Two TGC codons corresponding for cysteine
residues at 205 and 397 (UniProt identifier #P19121) were changed to GCC codons
for alanine using primers Cys205 and Cys397 and their corresponding reverse
primers (Table 4.1).
110

Table 4.1: Mutagenic primers used for disruption of disulfide bridges in Gal d 5 (CSA). Substitutions of Cys by Ala residues are indicated by the codon GCC bolded and underlined.
Site-directed mutagenesis reaction was prepared by mixing 2.5 µL of 10×
QuickChange Lighting Multi reaction buffer, 16.08 µL of double-distilled water,
0.75 µL of QuikSolution, 100 ng of template DNA, 100 ng of each mutagenic
primer, 1 µL of dNTP and 1 µL of QuikChange Lighting Multi enzyme blend in a 25
µL total reaction volume in a sterile PCR tube. The site-directed mutagenesis
reaction was then subjected to PCR according to the cycling parameters outlined in
Table 4.2. Following temperature cycling, the reaction was placed on ice for 2
minutes to cool below 37°C. Then 1 µL of Dpn I restriction enzyme was added to the
amplification reaction and incubated at 37°C for 5 minutes to digest the parental non-
mutated double stranded DNA (ds-DNA).
Table 4.2: Thermal cycling conditions for mutant strand synthesis
Segment Cycles Temperature Time
1 1 95°C 2 minutes 2 30 95°C 20 seconds
55°C 30 seconds 65°C 30 seconds/kb of plasmid length
3 1 65°C 5 minutes
4.2.2 Transformation of XL10-Gold ultracompetent cells
Following digestion of parental ds-DNA, mutated single stranded DNA (ssDNA)
was transformed into XL10-Gold ultracompetent cells (Agilent Technologies, Santa
Primer name
Position of disulfide bond
Targeted cysteine residue
Mutagenic primers (5’-3’)
Cys205 196-205
205 GAGTGATGTCGGTGCTGCCCTGGACACCAAGG
Cys397 388-397
397 AACTGATAACCCTGCTGAGGCCTACGCAAATGCTCAAGAG
111

Clara, CA, USA). First, a tube of XL10-Gold ultracompetent cells was thawed on
ice. Then, 45 µL of ultracompetent cells were mixed with 2 µL of β-ME provided
with the kit in a pre-chilled Eppendorf tube and mixed by swirling. The tube was
incubated on ice for 10 minutes, swirling gently every 2 minutes. Then 1.5 µL of the
Dpn I treated DNA was transferred into the aliquot of ultracompetent cells and gently
mixed by swirling. The transformation reaction was incubated on ice for 30 minutes.
Following incubation, the tube was heat-pulsed at 42°C for 30 seconds in a heat-
block and incubated on ice for 2 minutes. Then, 0.5 mL of preheated (42°C) NZY+
broth was added to the tube and incubated at 37°C for 1 hour with shaking at 250
rpm. The transformation reaction was then spread on LB agar plates containing 50
µg/mL ampicillin and incubated overnight at 37°C.
4.2.3 Identifying colonies harbouring pTrcHis A-Gal d 5196/205-388/397 construct
E. coli colonies grown on LB agar plates were propagated in fresh LB containing 50
µg/mL ampicillin and plasmids were isolated according to the method outlined in
Section 2.2.2.6. Then, colonies containing pTrcHis A-Gal d 5196/205-388/397 were
verified by plasmid DNA sequencing using pTrcHis forward primer (5’-
GAGGTATATATTAATGTATCG-3’) and pTrcHis reverse primer (5’-
GATTTAATCTGTATCAGG-3’). The sequencing was carried out at Micromon,
Monash University.
4.2.4 Cloning and expression of rGal d 5196/205-388/397 in K. lactis
4.2.4.1 Cloning of Gal d 5196/205-388/397 in K. lactis
The Gal d 5196/205-388/397 gene was amplified using PCR technique with XhoI and NotI
restriction sites incorporated on 5’ and 3’ ends, respectively with a C-terminal HA
epitope tag to facilitate cloning into the pKLAC2 expression vector. The pTrcHis A-
112

Gal d 5196/205-388/397 construct was used as the template. The PCR was done using
QIAGEN Fast Cycling PCR kit according to the method outlined in Section 3.2.2.3.
The PCR amplified Gal d 5196/205-388/397gene was cloned into the XhoI and NotI sites
in frame with the α-MF secretion leader sequence of the pKLAC2 vector to yield
pKLAC2-Gal d 5196/205-388/397 construct according to the method outlined in Section
3.2.2.4. The pKLAC2-Gal d 5196/205-388/397 was then digested using SacII restriction
enzyme to produce the linearized expression cassette and desalted according to the
method outlined in Section 3.2.2.5. Then, linearized expression cassette containing
Gal d 5196/205-388/397 was chemically transformed into competent K. lactis cells
according to the method outlined in Section 3.2.2.6. The transformed K. lactis cells
were selected by growing on YCB agar medium containing 5 mM acetamide and
incubated at 30°C for 3.5 days until colonies formed. Then, K. lactis strains
harbouring tandem copies of expression cassette were scored by whole cell PCR
technique according to the method outlined in Section 3.2.2.7.
4.2.4.2 Detection of secreted rGal d 5196/205-388/397 by transformed K. lactis
Transformed K. lactis strains containing multi-copy integrants were screened for its
ability to secrete rGal d 5196/205-388/397 in YPGal medium. A small aliquot of frozen K.
lactis cells was revived on YCB agar medium containing 5 mM acetamide by
incubating at 30°C for 2 days. For expression, individual K. lactis colonies were
grown in 5 mL of YPGal medium at 30°C with shaking at 250 rpm for 2 days. Then,
culture supernatants were harvested by centrifugation and analysed by SDS-PAGE
and Western blot technique for the presence of secreted rGal d 5196/205-388/397
according to the method outlined in Section 3.2.2.8.
113

4.2.4.3 Cloning and expression of rGal d 5196/205-388/397 in E. coli
pTrcHis A- Gal d 5196/205-388/397 construct synthesised previously was chemically
transformed into NEB 5-alpha F’ Iq Competent E. coli cells according to NEB high
efficiency transformation protocol mentioned in Section 2.2.2.6. E. coli colonies
harbouring the pTrcHis A-Gal d 5196/205-388/397 construct were grown on LB agar
under ampicillin resistance. Then E. coli transformants were subjected to a time
course of expression study to determine the optimum recombinant protein expression
conditions. The time course of expression analysis was conducted through SDS-
PAGE and Western immunoblot technique according to the method outlined in
Section 2.2.2.9. Here, only soluble fractions of E. coli culture fractions were
analysed by SDS-PAGE and Western blot for the presence of rGal d 5196/205-388/397.
For the Western blot monoclonal Anti-Xpress™ antibody produced in mouse was
used as the detection antibody.
4.2.5 Immunological analysis of rGal d 5 and mutant rGal d 5196/205-388/397
A Western immunoassay was conducted to comparatively analyse the level of egg
white allergic patients’ IgE binding to rGal d 5 produced by K. lactis in Chapter 3,
rGal d 5 produced by E. coli as an insoluble fraction in Chapter 3 and mutant rGal d
5196/205-388/397 produced by E. coli in Chapter 4. Crude E. coli extracts containing rGal
d 5, mutant rGal d 5196/205-388/397 and purified K. lactis derived rGal d 5 were
electroblotted to a nitrocellulose membrane according to the method outlined in
Section 2.2.1.4.1. The identities of each rGal d 5 proteins were again verified through
Western blot technique using the relevant primary antibodies prior immunoassay
using the method outlined in Section 2.2.1.4.1. The protein immobilised
nitrocellulose membrane was stained with Ponceau S solution for visualization of
114

proteins. The regions containing rGal d 5 proteins were separated by cutting with a
scissor. The rGal d 5 immobilised nitrocellulose membranes were destained with 0.1
M NaOH and blocked with blocking solution. Protein immobilised membranes were
individually incubated overnight with pooled sera (diluted 1:10 in blocking solution)
from patients sensitized to nGal d 5 (patients 3, 10, 15, 16, 17, 19, 24 and 25) at 4°C.
As a negative control, all rGal d 5 immobilised membranes were incubated with non-
allergic patients’ sera (diluted 1:10 in blocking solution) as well. Then, all serum pre-
incubated nitrocellulose membranes were incubated with monoclonal anti-human
IgE antibody produced in goat labelled with alkaline phosphatase (diluted 1:1000 in
blocking solution) for 1 hour at room temperature. The signal was developed by
adding BCIP/NBT chromogenic substrate.
4.3 Results
4.3.1 Recombinant production of Gal d 5196/205-388/397 in K. lactis Transformed XL10-Gold ultracompetent cells with pTrcHis A-Gal d 5196/205-388/397
construct following SDM had growth under ampicillin resistance. Transformant
colonies were screened for plasmids bearing the mutation Cys to Ala at positions 205
and 397 by plasmid DNA sequence analysis. The Nucleotide BLAST search of the
derived plasmid DNA sequences produced Gallus gallus albumin (sequence ID:
refΙNM 205261.2) as the top match. Furthermore, sequence alignment comparison of
the mutant and non-mutant Gal d 5 DNA confirmed the successful mutations of
native sequence TGC into GCC at Cys 205 (Figure 4.1) and Cys397 (Figure 4.2).
The full-length Gal d 5196/205-388/397 gene amplified with restriction sites XhoI and
NotI and a C-terminal HA tag showed a single predominant band at approximately
2000 bp marker (expected size: 1827 bp) when electrophoresed on agarose gel
(Figure 4.3, A). NEB Express Iq Competent E. coli cells transformed with newly
115

synthesised pKLAC2-Gal d 5196/205-388/397 construct had growth when grown on LB
agar under ampicillin resistance. However, only one colony was able to grow on
transformation plates. When XhoI and NotI digested plasmid of the transformant
clone were electrophoresed on agarose gel, an insert at approximately 2000 bp
marker confirming the successful construction of pKLAC2-Gal d 5196/205-388/397
(expected size: 1827 bp) (Figure 4.3, B). Sequencing analysis of plasmids harbouring
the Gal d 5196/205-388/397 insert confirmed the ligation of Gal d 5196/205-388/397 in-frame
with the α-MF secretion signal of the pKLAC2 vector. The NCBI BLAST search of
the derived sequence produced Gallus gallus albumin (sequence ID: refΙNM
205261.2) as the top match with a 97% sequence similarity. Furthermore, sequence
alignment comparison of the mutant and non-mutant Gal d 5 DNA confirmed the
presence of mutations introduced to pTrcHis A- Gal d 5196/205-388/397 (Figure 4.4 and
Figure 4.5).
116

Figure 4.1: Nucleotide BLAST search result of the pTrcHis A-Gal d 5196/205-388/397
DNA sequence (plus strand) obtained from pTrcHis forward primer. The sequence in the box shows the nucleotide substitution that resulted by SDM on the plus strand. Nucleotides T and G of the codon TGC (Cys 205) substituted by nucleotides G and C resulting in codon GCC (Ala 205).
117
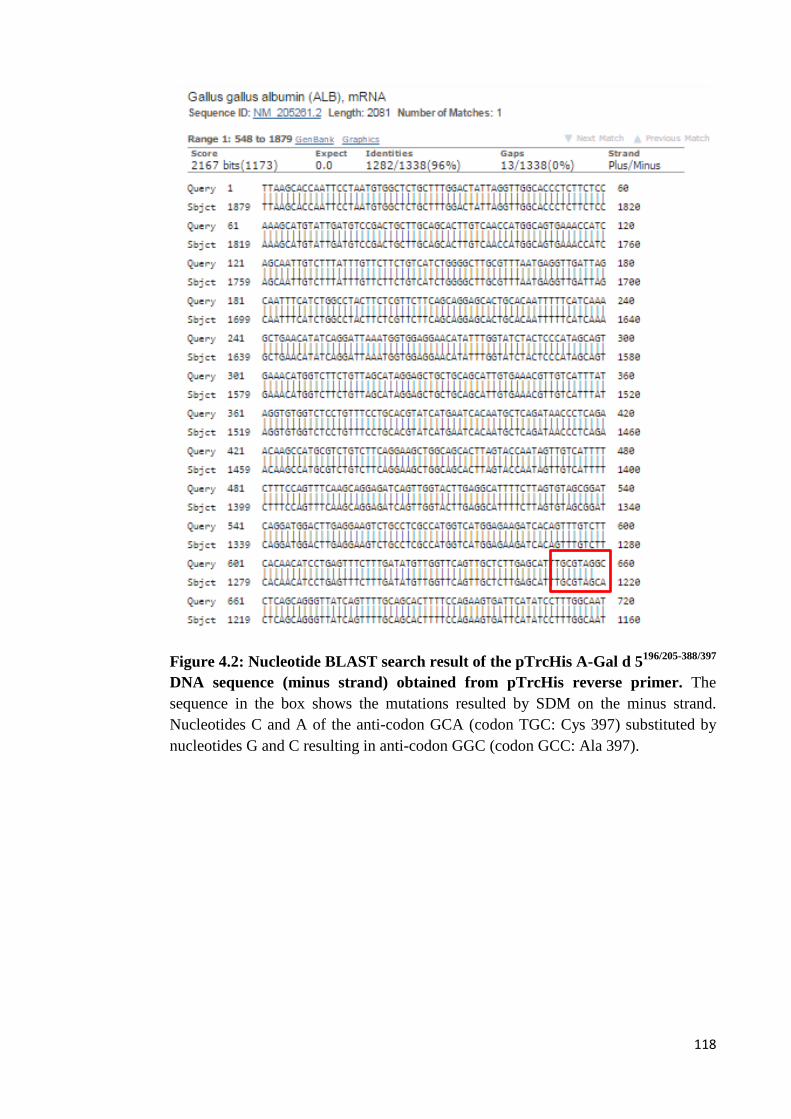
Figure 4.2: Nucleotide BLAST search result of the pTrcHis A-Gal d 5196/205-388/397
DNA sequence (minus strand) obtained from pTrcHis reverse primer. The sequence in the box shows the mutations resulted by SDM on the minus strand. Nucleotides C and A of the anti-codon GCA (codon TGC: Cys 397) substituted by nucleotides G and C resulting in anti-codon GGC (codon GCC: Ala 397).
118

Figure 4.3: (A) PCR of Gal d 5196/205-388/397. The PCR product was electrophoresed on E-Gel® CloneWell™ agarose gel with 0.8% SYBR Safe™ DNA Gel stain. Lane 1: PCR amplified Gal d 5196/205-388/397. The arrow indicates the PCR amplified Gal d 5196/205-388/397 (B) Restriction enzyme digest screening of the colony harbouring the pKLAC2- Gal d 5196/205-388/397 construct. Lane 1: XhoI and NotI digested pKLAC2- Gal d 5196/205-388/397 construct of the transformant clone. The arrow indicates the Gal d 5196/205-388/397. MW: molecular weight marker (Quick-Load Purple 2-Log DNA ladder).
MW MW MW 1 1
(A) (B)
119

Figure 4.4: Nucleotide BLAST search result of the pKLAC2- Gal d 5196/205-388/397
DNA sequence (plus strand) obtained from pTrcHis forward primer. The sequence in the box shows the nucleotide substitution that resulted by SDM on the plus strand. Nucleotides T and G of the codon TGC (Cys 205) substituted by nucleotides G and C resulting in codon GCC (Ala 205).
120

Figure 4.5: Nucleotide BLAST search result of the pKLAC2-Gal d 5196/205-388/397
DNA sequence (minus strand) obtained from pTrcHis reverse primer. The sequence in the box shows the mutations that resulted by SDM on the minus strand. Nucleotides C and A of the anti-codon GCA (codon TGC: Cys 397) substituted by nucleotides G and C resulting in anti-codon GGC (codon GCC: Ala 397).
121

The pKLAC2-Gal d 5196/205-388/397 construct was digested with SacII restriction
enzyme in order to facilitate insertion of the expression cassette into the K. lactis
genome by integrative transformation. Electrophoresis of SacII digested pKLAC2-
Gal d 5196/205-388/397 construct on 1% (w/v) agarose gel showed two bands
approximately at 2.8 kb and the other with a size of >6.2 kb confirming the
successful digestion of the plasmid (Figure 4.6). In this study, we only scored for K.
lactis strains harbouring multiple copies of the expression fragment by whole cell
PCR. Analysis of whole cell PCR products showed an amplification product
approximately at 2.3 kb in K. lactis clones when electrophoresed on 1% (w/v)
agarose gel (Figure 4.7). Only strains containing tandem copies of expression
fragment amplifies a PCR product of 2.3 kb. Our results show that the 87.5% (7 out
of 8) of the K. lactis transformant population to bear multi-copy integrants.
All the K. lactis strains bearing multi copy integrants were screened their ability to
secrete rGal d 5196/205-388/397 in YPGal medium. Analysis of culture supernatant
samples on SDS-PAGE showed multiple secreted proteins by K. lactis strains
(Figure 4.8). The Western blot analysis of the corresponding SDS-PAGE produced a
negative result (result not shown). Western blot analysis confirmed that all the K.
lactis strains tested did not secrete the rGal d 5196/205-388/397 into the culture media.
122

1 2 3 4 MW 5 6 7 8
Figure 4.6: SacII digest of the pKLAC2-Gal d 5196/205-388/397 construct. The digested plasmid was electrophoresed on E-Gel® CloneWell™ agarose gel with 0.8% SYBR Safe™ DNA Gel stain. Lane 1: SacII digest of the pKLAC2- Gal d 5196/205-
388/397 construct. Lane MW: molecular weight marker in kb (Quick-Load Purple 2-Log DNA ladder). Arrow a indicates the expression cassette containing the Gal d 5 gene. Arrow b indicates the remainder of the pKLAC2 vector.
Figure 4.7: Whole cell PCR analysis for screening of K. lactis strains containing multi-copy integrants. The PCR product was electrophoresed on E-Gel® CloneWell™ agarose gel with 0.8% SYBR Safe™ DNA Gel stain. Lane 1-7: K. lactis test strains harbouring multi-copy integrants. Arrow indicates the amplicon at 2.3 kb. Lane 8: K. lactis test strain without multi-copy integrants. MW: molecular weight marker (Quick-Load Purple 2-Log DNA ladder).
8.0
2.0
0.5
1.5
6.0 5.0 4.0
1.0
3.0
10.0
MW 1
a
b
123

Figure 4.8: SDS-PAGE analysis of spent culture media from K. lactis strains harbouring rGal d 5196/205-388/397. Lane 1-7: spent culture medium of K. lactis test strains harbouring multi-copy integrants. MW: molecular weight marker in kDa (SeeBlue Pre-Stained protein standard).
4.3.2 Recombinant production of rGal d 5196/205-388/397 in E. coli E. coli cells transformed with pTrcHisA-Gal d 5196/205-388/397 construct had growth
when grown on LB agar under ampicillin resistance. Pilot expression study
confirmed the expression of rGal d 5196/205-388/397 as a soluble fraction. The SDS-
PAGE analysis of soluble E. coli culture fractions showed multiple proteins (Figure
4.9, A). The corresponding Western blot analysis of soluble E. coli culture fractions
showed a predominant band in between 64 kDa and 98 kDa markers (expected size:
69 kDa) (Figure 4.9, B). The optimum recombinant protein production was seen at 4-
hour post IPTG induction.
98 64
50
36
30 16
6
MW 1 2 3 4 5 6 7
124

Figure 4.9: Time-course of expression of soluble E. coli cell culture fractions harbouring rGal d 5196/205-388/397. Lane 1: un-induced culture fractions. Lanes 2-4: IPTG induced culture fractions at time points 3rd, 4th and 5th hours, respectively analysed by (A) SDS-PAGE and (B) Western immunoassay probed with monoclonal Anti-Xpress™ antibody produced in mouse. MW: molecular weight marker in kDa (SeeBlue Pre-Stained protein standard). Arrows indicate rGal d 5196/205-388/397.
4.3.3 Immunological analysis of non-mutant and mutant rGal d 5 The identities of each rGal d 5 were confirmed prior immunoassay through Western
blot technique. The recombinant proteins on Ponceau S stained membrane and
antibody-probed membranes were comparable (Figure 4.10). Immunological
reactivity of rGal d 5 produced by K. lactis, insoluble rGal d 5 produced by E. coli
and mutant rGal d 5196/205-388/397 produced by E. coli were comparatively analysed in
terms of IgE binding capacity through Western immunoassay (Figure 4.11). Western
immunoassay performed with pooled patients’ sera showed that rGal d 5 expressed
by K. lactis to have the highest IgE reactivity. The insoluble rGal d 5 also had
detectable IgE reactivity however, at a very low level. Western immunoblot of rGal d
5196/205-388/397 showed no IgE reactivity at all. The control Western immunoblots
conducted with non-allergic individuals’ sera did not show IgE reactivity against any
rGal d 5.
(A) (B)
MW 1 2 3 4 MW 1 2 3 4
98
64
50
36 30
16
98 64 50
36
30
16
125

Figure 4.10: Western blot analysis of non-mutant rGal d 5 expressed by K. lactis and E. coli and mutant rGal d 5196/205-388/397 produced by E. coli. (A) Ponsceau S stained blot: Lane 1: purified rGal d 5 expressed by K. lactis. Lane 2: non-mutant rGal d 5 produced by E. coli as an insoluble fraction (crude cell culture extract). Lane 3: mutant rGal d 5196/205-388/397 produced by E. coli as a soluble fraction (crude cell culture extract). (B) Western blot of rGal d 5 expressed by K. lactis probed with monoclonal anti-HA antibody produced in mouse, Lane 1: immunoprecipitation purified rGal d 5. (C) Western blot of rGal d 5 expressed by E. coli. Lane 1: non-mutant rGal d 5 expressed by E. coli as an insoluble fraction (crude cell culture extract). Lane 2: mutant rGal d 5196/205-388/397 produced by E. coli as a soluble fraction (crude cell culture extract) probed with monoclonal Anti-Xpress™ antibody produced in mouse. MW: molecular weight marker in kDa (PageRuler Plus Prestained Protein Ladder).
Figure 4.11: Western immunoblots conducted using nGal d 5 sensitised patients’ sera against non-mutant rGal d 5 expressed by K. lactis and E. coli and mutant rGal d 5196/205-388/397 produced by E. coli. Lane 1: non-mutant rGal d 5 expressed by K. Lactis. Lane 2: non-mutant rGal d 5 expressed as an insoluble fraction by E. coli. Lane 3: mutant rGal d 5196/205-388/397 produced by E. coli as a soluble fraction. (A) Western immunoblot incubated with nGal d 5 sensitized patients’ sera. (B) Negative control Western immunoblot incubated with non-allergic sera. MW: molecular weight marker in kDa (PageRuler Plus Prestained Protein Ladder).
250 130 100 70 55 35 25
15 10
MW 1 2 3
(A)
MW 1
(B)
MW 1 2
(C)
MW 1 2 3
100
55
70
(A)
MW 1 2 3
(B)
126
4.4 Discussion In Chapter 3, we successfully cloned the cDNA for Gal d 5 and demonstrated that the
recombinant protein retained the human IgE binding reactivity. Furthermore, our
results in Chapter 3 confirmed that rGal d 5 retained the antigenic structure of the
native allergen, by quantitative IgE binding assays using sera from sensitised
patients. Therefore, these results indicate that the rGal d 5 is a suitable model system
for producing hypoallergenic variants and for investigating the antigenic
determinants of Gal d 5. The main objective of Chapter 4 was to produce a mutant
variant of Gal d 5 with reduced IgE binding capacity for development of a
hypoallergen, for potential future use in SIT.
The first challenge of this study was to successfully introduce mutations to the cDNA
sequence of Gal d 5, in order to reduce the IgE binding reactivity. However, linear
or conformational IgE-binding epitopes of Gal d 5 are not yet described. Therefore,
we simultaneously disrupted two randomly selected DBs via SDM. In certain
allergens the disruption of intramolecular DBs has been shown to induce protein
unfolding and decrease of allergenicity [148]. Using our mutagenesis strategy, one
cysteine from each pair of 2 selected DBs was replaced with alanine, preventing the
disulfide bond from forming at that position. When Cys196-Cys205 and Cys388-
Cys397 lacking Gal d 5 cDNA was cloned into the K. lactis, no secreted recombinant
protein was detected in the spent culture media. However, our results confirmed that
transformed K. lactis colonies grown under acetamide selection had multiple copies
of expression fragments containing rGal d 5196/205-388/397.
There could be several reasons why a recombinant protein is poorly expressed or not
expressing at all. Toxicity of the protein to the host cell, insolubility or mRNA
secondary structure preventing interactions with the cellular machinery and lack of
127
DB formation are some reasons causing difficulties with recombinant protein
expression [143, 149]. The mutant Gal d 5 cDNA was cloned in frame with α-MF
secretion leader sequence in order to facilitate secretion of the recombinant protein.
If protein expression was achieved, the α-MF domain directs the fusion protein to be
efficiently transported through the K. lactis secretory pathway into the growth
medium. Complete lack of secreted recombinant protein indicates that expression of
the fusion peptide was not directed by the K. lactis protein production machinery.
The most likely reason for this is that the mutated mRNA Gal d 5 secondary
structures may be blocking interactions with the cellular machinery and thereby
preventing translation of the recombinant protein. Furthermore, the mutant Gal d 5
proteins may have undergone incorrect folding due to DB disruption, and thereby not
being able to secrete into the growth media. If this is the case, the improperly folded
mutant Gal d 5 may exist in yeast cell pellets. The main goal of the project is to
produce a biologically active mutant Gal d 5 protein lacking IgE-reactivity. If mutant
Gal d 5 has been produced as IBs it is more likely to be non-functional and offer very
little or no biomedical value for experiments conducted in this PhD project and
future applications suggested [131, 132]. As a result, we did not attempt to extract
mutant Gal d 5 proteins from yeast cell pellets.
In order to achieve rGal d 5196/205-388/397 expression, pTrcHis A-Gal d 5196/205-388/397
construct generated from SDM was transformed into NEB 5-alpha F’ Iq Competent
E. coli strain. Here, the rGal d 5196/205-388/397 was expressed as fusion peptide with a
C-terminal 6×His tag. The Western blot of the IPTG induced soluble culture
fractions confirmed that the rGal d 5196/205-388/397 was expressed under the direction of
Ptrc as a soluble fraction. To retain the biomedical value, it is essential to produce
the recombinant protein as a soluble fraction in its native form [131, 132]. Therefore,
128

we did not analyse the insoluble culture fraction and therefore, our result does not
indicate the expression levels of insoluble rGal d 5196/205-388/397.
Previously E. coli failed to express wild type Gal d 5 as a soluble fraction. However,
E. coli cells were able to express mutant Gal d 5 as a soluble fraction. This again
proves the unpredictable nature of protein production host platforms [140]. A
possible explanation for this double nature of the E. coli host expression system may
attributed to the presence or absence of DBs. E. coli cells were only successful at
expressing mutant Gal d 5 which lacked two DBs as a soluble fraction. It is well
known that the cytoplasm of E. coli cells have a reducing effect on DBs, and thereby
preventing the formation of DBs resulting in IBs [143]. The lack of DBs in mutant
Gal d 5 may have contributed to undergo proper folding in the E. coli cytoplasm.
The Western immunoassay results confirmed that simultaneous deletion of Cys196-
Cys205 and Cys388-Cys397 DBs resulted in complete elimination of IgE reactivity.
As per the non-mutant recombinant Gal d 5, we analysed K. lactis and E. coli
expressed proteins as well. As expected, native rGal d 5 expressed by K. lactis as a
soluble fraction had very strong IgE reactivity when compared to E. coli derived
insoluble rGal d 5 and mutant rGal d 5196/205-388/397. This is mainly due to the fact that
K. lactis expressed native rGal d 5 had maintained the antigenic structure which
contributes towards IgE binding better than the latter two. Unlike E. coli, eukaryotic
systems like K. lactis may result in posttranslational modifications leading to better
conservation of the native structure of Gal d 5. Furthermore, expression of rGal d 5
as a soluble fraction by K. lactis guarantees the proper folding of the protein again
resulting higher structural similarity to the native protein.
Furthermore, this result validates the dot-blot immunoassay conducted with rGal d 5
in Chapter 3 where rGal d 5 was shown to be IgE reactive. Insoluble rGal d 5
expressed by E. coli had very low but detectable IgE reactivity. This confirmed that
129

the native rGal d 5 expressed as an IB has not completely lost its IgE reactivity.
However, when compared with non-mutant rGal d 5 expressed by K. lactis, it was
clear that significant level of IgE reactivity of E. coli derived rGal d 5 was lost due to
improper folding.
The elimination of IgE binding reactivity can be directly attributed to the disruption
of the two DBs. The disruption of two DBs may have altered the confirmation of
native Gal d 5 and lead to protein unfolding. Therefore, it is clear that the Cys196-
Cys205 and Cys388-Cys397 DBs together have a significant contribution to
maintaining the IgE binding structure of Gal d 5. However, this result does not reject
the existence and contribution of linear IgE binding epitopes to the IgE binding
reactivity. Sequential IgE binding epitopes may also require a certain structural
context for proper interactions with IgE antibodies. As a result, disruption of DBs
may have reduced or completely impaired access to sequential IgE binding epitopes
due to the modified confirmation [148]. However, another contributing factor leading
to lack of IgE-reactivity of mutant Gal d 5 could be the availability of less mutant
protein immobilized on the nitrocellulose membrane, compared to the natural Gal d
5. Reduced amount of mutant Gal d 5 may have resulted in less IgE-reactivity being
detected. According to the visual analysis of the Western blot there were reasonable
amount of mutant Gal d 5 available for IgE-reactivity. As a consequence, complete
lack of IgE-reactivity of shown by this experiment can still be considered reliable.
However, complete lack of IgE-reactivity may attribute to the combined effect of the
mutation along with reduced amount of mutant Gal d 5 on the nitrocellulose
membrane.
Although rGal d 5196/205-388/397 produced in this chapter confirms complete lack of IgE
reactivity, our results are not sufficient to verify it as a hypoallergen. Previous studies
130

have shown discrepancies between IgE-binding reactivity and allergenic potency.
Even with reduced IgE binding reactivity following DB elimination, some
recombinant mutants retained the allergenicity [148]. These results confirmed that
the disruption of DBs have no effect on the allergenic potency. Therefore, it is
important to further extend investigation of rGal d 5196/205-388/397 in order to evaluate
its allergenicity in comparison to its native counterparts. Analysis of allergenicity can
be conveniently performed by subjecting rGal d 5196/205-388/397 into mediator release
assays using cells expressing human FcεRI for IgE. Determination of levels of
mediator release induced by mutant rGal d 5 proteins can provide a better
understanding of the effect of deleting DBs on the allergenic nature. In addition, it is
important to show that such hypoallergens maintain their ability to proliferate T cells
so that they can modulate the non-allergenic (Th1 and Tr1) immune pathway.
In conclusion, our results provide some understanding of the contribution of Cys196-
Cys205 and Cys388-Cys397 to the IgE binding reactivity. The initial step of
producing a hypoallergen is successfully performed in this chapter. Therefore, the
mutant Gal d 5 designed in this chapter is a potential candidate for specific
immunotherapy applications. It would now be of great interest to further extend this
work to confirm the hypoallergenic nature of the rGal d 5196/205-388/397.
131

Chapter 5: General discussion
132

Allergy to hen’s egg is one of the most common forms of food allergies affecting
humans. Research conducted regarding food allergies generally investigates the
whole food source in order to understand the relationship between disease and the
causative allergens. Surprisingly, in allergy to hen’s egg, only the egg white
proteome has been subjected to investigation, leaving egg yolk proteome untouched
by vast majority of studies. The egg yolk was mainly excluded in research because
initially it was not found to cause severe allergic reactions like allergens from the egg
white. Therefore, knowledge regarding allergy to egg yolk did not have much
progression like egg white allergy. As a result, misunderstandings regarding hen’s
egg yolk allergy may have occurred especially with clinicians and other health care
workers. It is widely believed that allergy to egg yolk does not exist or at least
allergy to egg white is required in order to experience hypersensitivity reactions
against egg yolk proteins. The main scope of this PhD thesis was to subject hen’s egg
yolk proteome into immunological studies in relation to food allergy. In this PhD
project, various proteomic and molecular methods were employed in order to shed
light on to IgE-mediated hypersensitivity to hen’s egg yolk proteins. Furthermore,
the use of recombinant DNA technology has been very popular in the field of allergy.
Recombinant allergens have been successfully used in both diagnosis and treatment
of allergies. In addition, recombinant DNA technology has been a powerful tool to
investigate allergy at molecular level revealing many facts [116, 118]. As per our
knowledge, there are no known published reports regarding recombinant production
of Gal d 5 and Gal d 6, the two major allergens of hen’s egg yolk. Therefore, a
significant amount of knowledge can be uncovered with the application of
recombinant DNA technology to egg yolk allergens.
In Chapter 2, we first investigated if patients allergic to hen’s egg white would have
sensitisations to egg yolk proteins from hen, emu and quail. Western immunoassay
133

result confirmed that many patients tested had genuine sensitisation against multiple
egg yolk proteins from all the bird eggs. Interestingly, this finding is contrary to the
popular belief that reactivity to egg white is not associated with sensitisation to egg
yolk. Currently, there is no available literature regarding immunological studies on
any type of bird eggs other than hen’s egg. This result suggests that patients with
hen’s egg white allergy can have sensitisations to bird eggs from different species as
well. In such patients, sensitisation to those egg yolks may occur as a result of direct
exposure or due to common epitopes present among proteins due to high degree of
homology. As a result, those patients may develop IgE-mediated hypersensitivity
reactions in the event of exposure to those eggs. Therefore, such patients will not be
able to consider emu and quail eggs as an alternative to chicken eggs.
Sensitisation to allergens does not necessarily imply clinical hypersensitivity and
therefore, our result is unable to confirm clinical allergy in those patients. However,
sensitisation is found to be a risk factor for allergy and can be used to predict the
development of allergy as in allergy to egg white [3]. The actual state of clinical
reactivity to egg yolk in those patients is not known since egg yolk is not used for in
vitro or in vivo diagnosis of allergy. Findings of this result confirm that concomitant
sensitisation to egg white and egg yolk is not uncommon and emphasise hen’s egg
yolk as an important source of allergens. Therefore, our result suggests that including
both the egg white and the egg yolk during diagnosis of egg allergy is very
important. As a result, knowledge obtained by using both the egg white and the yolk
at diagnosis stage may help avoid unnecessary dietary restrictions and immensely
benefit managing egg allergy better.
A limitation of this study was the inability to identify the IgE-reactive egg yolk
proteins conclusively due to the use of crude egg yolk preparations. In order to
identify proteins precisely the use of purified proteins is essential. However, through
134

proteomic analysis we were able to identify that most IgE-reactive proteins belong to
major precursor proteins of the hen’s egg yolk namely; VTG-1, VTG-2 and Apo B.
YGP42 (Gal d 6), which is the C-terminal part of VTG-1, is already confirmed as an
allergen. Apovitellenin I and apovitellenin VI that are derived from Apo B are
reported to exhibit significant allergenicity in some patients [81, 96, 98, 150, 151].
However, those proteins are not yet confirmed as food allergens. A large number of
mature protein fragments derived from those precursors exist in the egg yolk, which
may have significant allergenic potential. Therefore, it would be of great interest to
subject each mature protein in its purified form to immunological analysis in order to
reveal their allergenicity.
The second major aim of this PhD project was to produce IgE-reactive recombinant
proteins of both Gal d 5 and Gal d 6. This PhD thesis for the first time presents the
successful production of recombinant versions of Gal d 5 and Gal d 6. In Chapter 2,
we first successfully cloned and expressed Gal d 6 in E. coli as a soluble fraction.
Producing recombinant proteins as a soluble fraction in its native form is a common
challenge faced by researchers very often. Majority of the rGal d 6 has been
produced as IBs. However, there were reasonable amount of soluble rGal d 6
produced by the E. coli cells that could be used for purification and other
downstream applications. Therefore, enhancement of bacterial cells to increase
production of rGal d 6 as a soluble fraction was not necessary.
A crucial stage in recombinant allergy research is the analysis the IgE-reactivity
profile of recombinant proteins in comparison to natural counterparts in a given
population. Here, we showed that rGal d 6 is IgE-reactive by inhibition ELISA
experiments. rGal d 6 and CEY of hen was able to inhibit binding of IgE to each
other in similar amounts (approximately 30%). However, it is not possible to
135

determine the exact IgE binding level of rGal d 6 with this experiment. In order to
determine the precise IgE-reactivity it is essential to compare the IgE-reactivity in
comparison to purified natural Gal d 6. However, our work confirms that rGal d 6
produced by E. coli is IgE-reactive and therefore, can be considered for in vitro and
in vivo diagnosis of egg yolk allergy after further validation of its immune reactivity.
Furthermore, rGal d 6 produced here can be used as a platform to develop
hypoallergenic variants with reduced IgE binding capacity for potential use in SIT
for patients suffering from hen’s egg yolk allergy.
In Chapter 3, we successfully produced an IgE-reactive version of Gal d 5 as a
soluble fraction. However, our first attempt to produce rGal d 5 as a soluble fraction
using NEB Express Iq Competent E. Coli failed. Although, rGal d 5 was expressed in
sufficient amounts, 100% of the recombinant protein was expressed as insoluble IBs.
Formation of IBs indicates irregular folding of the recombinant protein losing its
native conformation. As a result, rGal d 5 produced by E. coli may have lost its
immunological potency due to irregular folding, making it less useful for other
downstream applications. Gal d 5 is a secreted protein with 17 DBs stabilizing it
[142]. DBs are crucial for correct protein folding, stability and functionality. In
general, the cytoplasm of E. coli cells does not contain a favourable environment for
DB formation due to the presence of numerous DB reductases such as thioredoxins
and glutaredoxins. These DB reductases quickly reduce DBs formed between two
cysteine groups back to its thiolate state. Failure to form DBs in the recombinant
proteins, results in it being formed as inactive IBs. Therefore, it is highly possible
that the large number of DBs present in Gal d 5 haven’t been formed in the E. coli
cytoplasm and have undergone IB formation [141, 143].
As an alternative approach, we decided to use a different host strain to express rGal d
5 as a soluble fraction. In Chapter 3, we used the yeast strain K. lactis to produce
136

rGal d 5 as a secreted protein. Here, we successfully expressed rGal d 5 as a secreted
protein and isolated with high-level purity and confirmed it as IgE-reactive.
Furthermore, ELISA experiment conducted with patients’ sera confirmed that both
the nGal d 5 and rGal d 5 have very similar IgE-reactivity. These results suggest that
rGal d 5 produced by K. lactis is recognizable by the human immune system and
bears similar epitopes to that of nGal d 5. As a result, rGal d 5 presented in this PhD
project may be an excellent reagent for the use of in vitro and in vivo diagnosis of
allergy to egg yolk. Further confirmation of the results presented in Chapter 3 can be
accomplished by subjecting rGal d 5 to immunoassays with sera from patients
diagnosed with allergy to hen’s egg yolk.
rGal d 5 produced in Chapter 3 is a suitable model system for producing
hypoallergenic variants and for investigating the antigenic determinants of Gal d 5. A
large number of recombinant based hypoallergenic variants have been designed by
many researchers globally [116, 118, 147, 148]. However, to the best of our
knowledge, there are no known published reports on the production of a
hypoallergenic variant of Gal d 5. Therefore, in Chapter 4, the main objective was to
produce a recombinant-based mutant variant of Gal d 5 for the potential development
of a hypoallergen. Here, our mutagenesis strategy involved producing a mutant
variant of Gal d 5 by disruption of two DBs simultaneously. Usually, selection of
DBs for disruption is based on the IgE binding epitopes of the native allergen in
order to impair IgE-binding capacity. However, such information regarding Gal d 5
is not yet available. Therefore, we disrupted two randomly selected DBs in order to
induce change in the overall conformation. At this point, advantages of this approach
are two-fold. Potential reduction of IgE-reactivity due to DB disruption also indicates
the contribution of the targeted DBs to the maintenance of the antigenic structure of
137

Gal d 5. Previous studies have successfully used disruption of DBs to map
conformational epitopes of allergens [147].
In Chapter 4, our initial intention was to express mutant Gal d 5 as a secreted protein
using K. lactis. Unexpectedly, K. lactis cells failed to express and secrete the mutant
Gal d 5 despite successful cloning. Successful expression of a given protein is
dependent on the nature of the protein and the host system used and there is no
universal protein expression system or a predictive tool, which can guarantee the
desired outcome. Therefore, this result indicates that the change caused by the
mutation had resulted in blocking expression or secretion of the protein since the
non-mutant Gal d 5 DNA sequence was successfully expressed and secreted by K.
lactis. Isolating the exact reasons behind failure to express the mutant Gal d 5 in K.
lactis without further experimentation is difficult as there may be multiple factors
involved. The most likely reason for this may be that the mutated mRNA Gal d 5
secondary structures blocking interactions with the cellular machinery and thereby
preventing translation of the recombinant protein. Furthermore, the mutant Gal d 5
proteins may have undergone incorrect folding due to DB disruption, and thereby not
being able to secrete into the growth media. If this is the case the improperly folded
mutant Gal d 5 may exist in yeast cell pellets. The main goal of the project was to
produce a biologically active mutant Gal d 5 protein lacking IgE-reactivity. If mutant
Gal d 5 has been produced as IBs, it is more likely to be non-functional and offer
very little or no biomedical value for experiments conducted in this PhD project, and
future applications suggested in this thesis [131, 132].
As an alternative approach, we decided to express the mutant variant of Gal d 5 in
NEB 5-alpha F' Iq Competent E. coli strain as a soluble fraction. Here, the cloning
and expression of the mutant Gal d 5 as a soluble fraction was successfully achieved
by the E. coli protein production machinery. Previously E. coli failed to express wild
138

type Gal d 5 as a soluble fraction. However, E. coli cells were able to express mutant
Gal d 5 as a soluble fraction. This again proves the unpredictable nature of protein
production host platforms [140]. A possible explanation for this double nature of the
E. coli host expression system may attributed to the presence or absence of DBs. E.
coli cells were only successful at expressing mutant Gal d 5 which lacked two DBs
as a soluble fraction. It is well known that the cytoplasm of E. coli cells have a
reducing effect on DBs, and thereby preventing the formation of DBs resulting in IBs
[143]. The lack of DBs in mutant Gal d 5 may have contributed to undergo proper
folding in the E. coli cytoplasm.
The Western immunoblot conducted to assess the IgE-binding capacity confirmed
that the disruption of DBs have completely abolished the IgE-reactivity of mutant
Gal d 5 expressed in E. coli. Furthermore, this result confirms that major antigenic
epitopes of Gla d 5 are conformational and DBs Cys196-Cys205 and Cys388-Cys397
together are highly important in maintaining the IgE-binding structure of Gal d 5.
The ultimate goal of producing mutant variants with reduced IgE-reactivity is to
develop a hypoallergen for successful use in specific immunotherapy. Many research
groups have developed mutant variants of allergens with reduced IgE-reactivity
using the same strategy as described in this PhD project [147, 148]. However,
reduction in IgE-binding capacity does not always imply that the mutant variant is a
hypoallergen. This is due to the fact that not all mutants with reduced IgE-reactivity
are reported to exhibit reduced allergenicity in reality [148]. Therefore, the mutant
Gal d 5 produced in this PhD project must be subjected to further investigations such
as mediator release assays and T cell reactivity assays in order to confirm whether it
is a true hypoallergen.
In conclusion, the work presented in this PhD thesis provides some valuable insight
into IgE-mediated hypersensitivity to hen’s egg yolk, which is one of the least
139

investigated food allergies. Our initial investigation in Chapter 1 successfully set the
stage for entire PhD project by showing that sensitisation to hen’s egg yolk proteins
exists in many patients diagnosed with allergy to hen’s egg white. Most IgE reactive
proteins were identified as fragments of VTG-1, VTG-2 and Apo B precursors. This
shows that there could be potentially undiscovered allergens within the hen’s egg
yolk. The rGal d 6 expressed as a soluble fraction was shown to be IgE reactive.
However, in future work, it is important to subject rGal d 6 to IgE-binding assays in
comparison to natural Gal d 6 in order to confirm the exact level of IgE-reactivity.
The rGal d 5 produced as a secreted protein showed very similar IgE-binding
reactivity to nGal d 5. Therefore, rGal d 5 can be considered as an excellent reagent
for diagnosis of egg yolk allergy. For both of the recombinant allergens produced in
this PhD project, further validation for their IgE-reactivity profiles can be brought by
conducting immunoassays using sera from patients diagnosed with clinical allergy to
hen’s egg yolk. Finally, we produced a recombinant-based mutant variant of Gal d 5
with completely impaired IgE-reactivity. Therefore, mutant Gal d 5 may serve as an
excellent therapeutic agent for SIT as a hypoallergen. In order to validate mutant Gal
d 5 as a hypoallergen, it is essential to conduct further investigations such as
mediator release assays. Not using sera from patients’ allergic to hen’s egg yolk in
the immunoassays is a limitation in this PhD project. However, results of this PhD
project strongly suggest that allergy to hen’s egg yolk is more common than
previously thought and showed that allergy to egg yolk is equally important as
allergy to hen’s egg white. As a result, patients with IgE-mediated hypersensitivity to
hen’s egg must ideally undergo clinical examinations focusing both on the egg yolk
and the egg white, which would lead to better understanding and management of egg
allergy. Our work in this PhD has shown the importance of egg yolk as an important
140

source of food allergens. However, yet egg yolk allergy research can be considered
as a developing field and therefore further investigations on the subject is warranted.
141

References
1. Kalpaklioglu, A.F., et al., (Un)Awareness of allergy. The World Allergy Organization Journal, 2011. 4(11): p. 170-178.
2. McConnell, T.H., The Nature of Disease: Pathology for the health Professions. 1 ed. 2007, Baltimore, MD: Lippincott Williams & Wilkins.
3. Johansson, S.G., et al., A revised nomenclature for allergy. An EAACI position statement from the EAACI nomenclature task force. Allergy, 2001. 56(9): p. 813-824.
4. Pawankar, R., S.T. Holgate, and L.J. Rosenwasser, Allergy Frontiers: Classification and Pathomechanisms. 1 ed. Vol. 2. 2009, Tokyo, Japan: Springer.
5. Coombs, R.R.A., P.J. Lachmann, and P.G.H. Gell, Clinical Aspects of Immunology. 3rd ed. 1975, Oxford: Blackwell Scientific Publications. xvi, 1745 p.
6. Descotes, J. and G. Choquet-Kastylevsky, Gell and Coombs's classification: is it still valid? Toxicology, 2001. 158(1–2): p. 43-49.
7. Johansson, S.G.O., et al., Revised nomenclature for allergy for global use: Report of the Nomenclature Review Committee of the World Allergy Organization, October 2003. Journal of Allergy and Clinical Immunology, 2004. 113(5): p. 832-836.
8. Gell, P.G.H. and R.R.A. Coombs, Clinical Aspects of Immunology. 1 ed. 1963, Oxford, England: Blackwell.
9. Coca, A.F. and R.A. Cooke, On the Classification of the Phenomena of Hypersensitiveness. The Journal of Immunology, 1923. 8(3): p. 163-182.
10. Grant, J.A. and C.C. Horner, ALLERGY | Overview, in Encyclopedia of Respiratory Medicine, J.L. Geoffrey and D.S. Steven, Editors. 2006, Academic Press: Oxford. p. 65-72.
11. Bernard, A., L. Boumsell, and C. Hill, Joint Report of the First International Workshop on Human Leucocyte Differentiation Antigens by the Investigators of the Participating Laboratories, in Leucocyte Typing: Human Leucocyte Differentiation Antigens Detected by Monoclonal Antibodies. Specification — Classification — Nomenclature, A. Bernard, et al., Editors. 1984, Springer Berlin Heidelberg: Berlin, Heidelberg. p. 9-142.
12. Turner, M.J., J.B. Travers, and M.H. Kaplan, T helper cell subsets in the development of atopic dermatitis. Journal of Drugs in Dermatology, 2012. 11(10): p. 1174-8.
13. Abbas, A.K., K.M. Murphy, and A. Sher, Functional diversity of helper T lymphocytes. Nature, 1996. 383(6603): p. 787-93.
14. Isolauri, E. and A.W. Walker, Allergic Diseases and the Environment. 1 ed, ed. E. Isolauri and A.W. Walker. Vol. 53. 2004, Druck: Karger.
15. Romagnani, S., The role of lymphocytes in allergic disease. Journal of Allergy and Clinical Immunology, 2000. 105(3): p. 399-408.
16. Maggi, E., The TH1/TH2 paradigm in allergy. Immunotechnology, 1998. 3(4): p. 233-44.
17. Del Prete, G., Human Th1 and Th2 lymphocytes: their role in the pathophysiology of atopy. Allergy, 1992. 47(5): p. 450-5.
18. Erb, K.J., Helminths, allergic disorders and IgE-mediated immune responses: where do we stand? European Journal of Immunology, 2007. 37(5): p. 1170-3.
142
19. Miescher, S.M. and M. Vogel, Molecular aspects of allergy. Molecular
Aspects of Medicine, 2002. 23(6): p. 413-62. 20. Romagnani, S., Th1/Th2 cells. Inflammatory Bowel Diseases, 1999. 5(4): p.
285-94. 21. Prussin, C. and D.D. Metcalfe, 4. IgE, mast cells, basophils, and eosinophils.
Journal of Allergy and Clinical Immunology, 2003. 111(2, Supplement 2): p. S486-S494.
22. Aalberse, R.C., et al., Immunoglobulin G4: an odd antibody. Clinical & Experimental Allergy, 2009. 39(4): p. 469-77.
23. Swain, S.L., et al., IL-4 directs the development of Th2-like helper effectors. The Journal of Immunology, 1990. 145(11): p. 3796-806.
24. Maggi, E., et al., Reciprocal regulatory effects of IFN-gamma and IL-4 on the in vitro development of human Th1 and Th2 clones. The Journal of Immunology, 1992. 148(7): p. 2142-7.
25. Kopf, M., et al., Disruption of the murine IL-4 gene blocks Th2 cytokine responses. Nature, 1993. 362(6417): p. 245-8.
26. Akdis, M., Healthy immune response to allergens: T regulatory cells and more. Current Opinion in Immunology, 2006. 18(6): p. 738-44.
27. Akdis, M., et al., Immune responses in healthy and allergic individuals are characterized by a fine balance between allergen-specific T regulatory 1 and T helper 2 cells. Journal of Experimental Medicine, 2004. 199(11): p. 1567-75.
28. Hori, S., T. Nomura, and S. Sakaguchi, Control of regulatory T cell development by the transcription factor Foxp3. Science, 2003. 299(5609): p. 1057-61.
29. Zhao, Y., et al., Th17 immunity in patients with allergic asthma. International Archives of Allergy and Immunology, 2010. 151(4): p. 297-307.
30. Arshad, S.H., ALLERGY | Allergic Reactions, in Encyclopedia of Respiratory Medicine, G.J.L.D. Shapiro, Editor. 2006, Academic Press: Oxford. p. 72-80.
31. Pearlman, D.S., Pathophysiology of the inflammatory response. Journal of Allergy and Clinical Immunology, 1999. 104(4 Pt 1): p. S132-7.
32. Kumar, V., A.K. Abbas, and J.C. Aster, Robbins and Cotran pathologic basis of disease. 9 ed. 2014: Philadelphia, PA : Elsevier/Saunders.
33. Leung, D.Y., Molecular basis of allergic diseases. Molecular Genetics and Metabolism, 1998. 63(3): p. 157-67.
34. Chehade, M., IgE and non-IgE-mediated food allergy: treatment in 2007. Current Opinion In Allergy And Clinical Immunology, 2007. 7(3): p. 264-268.
35. Jyonouchi, H., Non-IgE mediated food allergy - update of recent progress in mucosal immunity. Inflammation & Allergy - Drug Targets 2012. 11(5): p. 382-96.
36. Nowak-Wegrzyn, A., et al., Non-IgE-mediated gastrointestinal food allergy. Journal of Allergy and Clinical Immunology, 2015. 135(5): p. 1114-24.
37. Caubet, J.C., et al., Clinical features and resolution of food protein-induced enterocolitis syndrome: 10-year experience. Journal of Allergy and Clinical Immunology, 2014. 134(2): p. 382-9.
38. Nomura, I., et al., Non-IgE-mediated gastrointestinal food allergies: distinct differences in clinical phenotype between Western countries and Japan. Current Allergy and Asthma Reports, 2012. 12(4): p. 297-303.
143

39. Heyman, M., et al., Mononuclear cells from infants allergic to cow's milk
secrete tumor necrosis factor alpha, altering intestinal function. Gastroenterology, 1994. 106(6): p. 1514-23.
40. Benlounes, N., et al., The time-course of milk antigen-induced TNF-alpha secretion differs according to the clinical symptoms in children with cow's milk allergy. Journal of Allergy and Clinical Immunology, 1999. 104(4 Pt 1): p. 863-9.
41. Benlounes, N., et al., The threshold for immune cell reactivity to milk antigens decreases in cow's milk allergy with intestinal symptoms. Journal of Allergy and Clinical Immunology, 1996. 98(4): p. 781-9.
42. Jyonouchi, H., Non-IgE mediated food allergy. Inflammation & Allergy - Drug Targets 2008. 7(3): p. 173-180.
43. Morita, H., et al., Antigen-specific T-cell responses in patients with non-IgE-mediated gastrointestinal food allergy are predominantly skewed to T(H)2. Journal of Allergy and Clinical Immunology, 2013. 131(2): p. 590-2 e1-6.
44. Berin, M.C., Immunopathophysiology of food protein-induced enterocolitis syndrome. Journal of Allergy and Clinical Immunology, 2015. 135(5): p. 1108-13.
45. Chung, H.L., et al., Expression of transforming growth factor beta1, transforming growth factor type I and II receptors, and TNF-alpha in the mucosa of the small intestine in infants with food protein-induced enterocolitis syndrome. Journal of Allergy and Clinical Immunology, 2002. 109(1): p. 150-4.
46. Bredehorst, R. and K. David, What establishes a protein as an allergen? Journal of Chromatography B: Biomedical Sciences and Applications, 2001. 756(1-2): p. 33-40.
47. Chung, C.H., et al., Cetuximab-induced anaphylaxis and IgE specific for galactose-alpha-1,3-galactose. The New England Journal of Medicine, 2008. 358(11): p. 1109-17.
48. Soh, J.Y., C.H. Huang, and B.W. Lee, Carbohydrates as food allergens. Asia Pacific Allergy Journal, 2015. 5(1): p. 17-24.
49. Bannon, G.A., What makes a food protein an allergen? Current Allergy and Asthma Reports, 2004. 4(1): p. 43-6.
50. Vila, L., et al., Role of conformational and linear epitopes in the achievement of tolerance in cow's milk allergy. Clinical and Experimental Allergy, 2001. 31(10): p. 1599-606.
51. Kaiser, H.B., Risk factors in allergy/asthma. Allergy & Asthma Proceedings, 2004. 25(1): p. 7-10.
52. Wang, D.Y., Risk factors of allergic rhinitis: genetic or environmental? Therapeutics and Clinical Risk Management, 2005. 1(2): p. 115-23.
53. Lundback, B., Epidemiology of rhinitis and asthma. Clinical and Experimental Allergy, 1998. 2: p. 3-10.
54. Dold, S., et al., Genetic risk for asthma, allergic rhinitis, and atopic dermatitis. Archives of Disease in Childhood, 1992. 67(8): p. 1018-22.
55. Kay, A.B., Overview of 'allergy and allergic diseases: with a view to the future'. British Medical Bulletin, 2000. 56(4): p. 843-64.
56. Meng, J.F. and L.J. Rosenwasser, Unraveling the genetic basis of asthma and allergic diseases. Allergy, Asthma & Immunology Research, 2010. 2(4): p. 215-27.
57. Marsh, D.G., et al., HLA-Dw2: a genetic marker for human immune response to short ragweed pollen allergen Ra5. I. Response resulting primarily from
144

natural antigenic exposure. The Journal of Experimental Medicine, 1982. 155(5): p. 1439-51.
58. Hill, M.R. and W.O. Cookson, A new variant of the beta subunit of the high-affinity receptor for immunoglobulin E (Fc epsilon RI-beta E237G): associations with measures of atopy and bronchial hyper-responsiveness. Human Molecular Genetics, 1996. 5(7): p. 959-62.
59. Marsh, D.G., et al., Linkage analysis of IL4 and other chromosome 5q31.1 markers and total serum immunoglobulin E concentrations. Science, 1994. 264(5162): p. 1152-6.
60. Moffatt, M.F. and W.O. Cookson, Tumour necrosis factor haplotypes and asthma. Human Molecular Genetics, 1997. 6(4): p. 551-4.
61. Allen, M., et al., Positional cloning of a novel gene influencing asthma from chromosome 2q14. Nature Genetics, 2003. 35(3): p. 258-63.
62. Balaci, L., et al., IRAK-M is involved in the pathogenesis of early-onset persistent asthma. The American Journal of Human Genetics, 2007. 80(6): p. 1103-14.
63. Chavanas, S., et al., Mutations in SPINK5, encoding a serine protease inhibitor, cause Netherton syndrome. Nature Genetics, 2000. 25(2): p. 141-2.
64. Laitinen, T., et al., Characterization of a common susceptibility locus for asthma-related traits. Science, 2004. 304(5668): p. 300-4.
65. Nicolae, D., et al., Fine mapping and positional candidate studies identify HLA-G as an asthma susceptibility gene on chromosome 6p21. The American Journal of Human Genetics, 2005. 76(2): p. 349-57.
66. Van Eerdewegh, P., et al., Association of the ADAM33 gene with asthma and bronchial hyperresponsiveness. Nature, 2002. 418(6896): p. 426-30.
67. Zhang, Y., et al., Positional cloning of a quantitative trait locus on chromosome 13q14 that influences immunoglobulin E levels and asthma. Nature Genetics, 2003. 34(2): p. 181-6.
68. Tripathi, P., et al., Genetic determinants in the development of sensitization to environmental allergens in early childhood. Immunity, Inflammation and Disease, 2014. 2(3): p. 193-204.
69. Ortiz, R.A. and K.C. Barnes, Genetics of Allergic Diseases. Immunology and Allergy Clinics. 35(1): p. 19-44.
70. von Mutius, E., Influences in allergy: Epidemiology and the environment. Journal of Allergy and Clinical Immunology, 2004. 113(3): p. 373-379.
71. Strachan, D.P., Hay fever, hygiene, and household size. The BMJ, 1989. 299(6710): p. 1259-60.
72. Strachan, D.P., Family size, infection and atopy: the first decade of the "hygiene hypothesis". Thorax, 2000. 55(1): p. S2-10.
73. Graham-Rowe, D., Lifestyle: When allergies go west. Nature, 2011. 479(7374): p. S2-S4.
74. Warner, J.A. and J.O. Warner, Early life events in allergic sensitisation. British Medical Bulletin, 2000. 56(4): p. 883-93.
75. Warner, J.O., The early life origins of asthma and related allergic disorders. Archives of Disease in Childhood, 2004. 89(2): p. 97-102.
76. von Mutius, E., et al., Increasing prevalence of hay fever and atopy among children in Leipzig, East Germany. Lancet, 1998. 351(9106): p. 862-6.
77. Eggesbo, M., et al., The prevalence of allergy to egg: a population-based study in young children. Allergy, 2001. 56(5): p. 403-11.
145

78. Mine, Y. and M. Yang, Recent advances in the understanding of egg
allergens: basic, industrial, and clinical perspectives. Journal of Agricultural and Food Chemistry, 2008. 56(13): p. 4874-900.
79. de Boissieu, D. and C. Dupont, Natural course of sensitization to hen's egg in children not previously exposed to egg ingestion. European Annals of Allergy and Clinical Immunology, 2006. 38(4): p. 113-7.
80. Caubet, J.C. and J. Wang, Current understanding of egg allergy. Pediatric Clinics of North America, 2011. 58(2): p. 427-43.
81. Amo, A., et al., Gal d 6 is the second allergen characterized from egg yolk. Journal of Agricultural and Food Chemistry, 2010. 58(12): p. 7453-7.
82. Quirce, S., et al., Chicken serum albumin (Gal d 5*) is a partially heat-labile inhalant and food allergen implicated in the bird-egg syndrome. Allergy, 2001. 56(8): p. 754-62.
83. Bleumink, E. and E. Young, Studies on the atopic allergen in hen's egg. II. Further characterization of the skin-reactive fraction in egg-white; immuno-electrophoretic studies. International Archives of Allergy and Applied Immunology, 1971. 40(1): p. 72-88.
84. Hoffman, D.R., Immunochemical identification of the allergens in egg white. Journal of Allergy and Clinical Immunology, 1983. 71(5): p. 481-6.
85. Holen, E. and S. Elsayed, Characterization of four major allergens of hen egg-white by IEF/SDS-PAGE combined with electrophoretic transfer and IgE-immunoautoradiography. International Archives of Allergy and Applied Immunology, 1990. 91(2): p. 136-41.
86. Langeland, T., A clinical and immunological study of allergy to hen's egg white. III. Allergens in hen's egg white studied by crossed radio-immunoelectrophoresis (CRIE). Allergy, 1982. 37(7): p. 521-30.
87. Miller, H. and D.H. Campbell, Skin test reactions to various chemical fractions of egg white and their possible clinical significance. Allergy, 1950. 21(6): p. 522-4.
88. de Maat-Bleeker, F., A.G. van Dijk, and L. Berrens, Allergy to egg yolk possibly induced by sensitization to bird serum antigens. Annals of Allergy, Asthma & Immunology, 1985. 54(3): p. 245-8.
89. Mandallaz, M.M., A.L. de Weck, and C.A. Dahinden, Bird-egg syndrome. Cross-reactivity between bird antigens and egg-yolk livetins in IgE-mediated hypersensitivity. International Archives of Allergy and Applied Immunology, 1988. 87(2): p. 143-50.
90. Szepfalusi, Z., et al., Egg yolk alpha-livetin (chicken serum albumin) is a cross-reactive allergen in the bird-egg syndrome. Journal of Allergy and Clinical Immunology, 1994. 93(5): p. 932-42.
91. Rubin, S.S., An allergic reaction following typhus-fever vaccine and yellow-fever vaccine due to egg yolk sensitivity. Allergy, 1946. 17: p. 21-3.
92. Williams, J., Serum proteins and the livetins of hen's-egg yolk. The Biochemical journal, 1962. 83: p. 346-55.
93. Rhijn, B., et al., Birch pollen sensitization with cross‐reactivity to food allergens predominates in adults with eosinophilic esophagitis. Allergy, 2013. 68(11): p. 1475-1481.
94. Bublin, M., et al., IgE cross-reactivity between the major peanut allergen Ara h 2 and the nonhomologous allergens Ara h 1 and Ara h 3. Journal of Allergy and Clinical Immunology, 2013. 132(1): p. 118-124. e12.
146

95. Lopata, A.L., et al., Qualitative and quantitative evaluation of bird-specific
IgG antibodies. International Archives of Allergy and Immunology, 2004. 134(2): p. 173-8.
96. Yamamura, J., et al., Precursor-product relationship between chicken vitellogenin and the yolk proteins: the 40 kDa yolk plasma glycoprotein is derived from the C-terminal cysteine-rich domain of vitellogenin II. Biochimica et Biophysica Acta, 1995. 1244(2-3): p. 384-94.
97. Anet, J., et al., Allergens in the white and yolk of hen's egg. A study of IgE binding by egg proteins. International Archives of Allergy and Applied Immunology, 1985. 77(3): p. 364-71.
98. Walsh, B.J., et al., New allergens from hen's egg white and egg yolk. In vitro study of ovomucin, apovitellenin I and VI, and phosvitin. International Archives of Allergy and Applied Immunology, 1988. 87(1): p. 81-6.
99. Heine, R.G., N. Laske, and D.J. Hill, The diagnosis and management of egg allergy. Current Allergy and Asthma Reports, 2006. 6(2): p. 145-52.
100. Benhamou, A.H., et al., State of the art and new horizons in the diagnosis and management of egg allergy. Allergy, 2010. 65(3): p. 283-9.
101. Clark, A.T., et al., British Society for Allergy and Clinical Immunology guidelines for the management of egg allergy. Clinical & Experimental Allergy, 2010. 40(8): p. 1116-29.
102. Benhamou, A.H., et al., State of the art and new horizons in the diagnosis and management of egg allergy. Journal of Allergy, 2010. 65(3): p. 283-9.
103. Clark, A.T., et al., British Society for Allergy and Clinical Immunology guidelines for the management of egg allergy. Clinical and Experimental Allergy, 2010. 40(8): p. 1116-29.
104. Martorell, A., et al., Position document: IgE-mediated allergy to egg protein. Allergologia Et Immunopathologia, 2013. 41(5): p. 320-36.
105. Caubet, J.C. and J. Wang, Current understanding of egg allergy. Pediatric Clinic of North America, 2011. 58(2): p. 427-43, xi.
106. Du Toit, G., et al., Early consumption of peanuts in infancy is associated with a low prevalence of peanut allergy. Journal of Allergy and Clinical Immunology, 2008. 122(5): p. 984-991.
107. Buchanan, A.D., et al., Egg oral immunotherapy in nonanaphylactic children with egg allergy. Journal of Allergy and Clinical Immunology, 2007. 119(1): p. 199-205.
108. Jutel, M. and C.A. Akdis, Immunological mechanisms of allergen-specific immunotherapy. Allergy, 2011. 66(6): p. 725-732.
109. Kundig, T.M., Immunotherapy concepts under investigation. Journal of Allergy, 2011. 66 Suppl 95: p. 60-62.
110. Rolland, J.M., L.M. Gardner, and R.E. O'Hehir, Allergen-related approaches to immunotherapy. Clinical Pharmacology and Therapeutics, 2009. 121(3): p. 273-284.
111. Bousquet, J., R. Lockey, and H.J. Malling, Allergen immunotherapy: therapeutic vaccines for allergic diseases. A WHO position paper. Journal of Allergy and Clinical Immunology, 1998. 102(4 Pt 1): p. 558-62.
112. Fitzhugh, D.J. and R.F. Lockey, History of immunotherapy: the first 100 years. Immunology and Allergy Clinics of North America, 2011. 31(2): p. 149-57, vii.
113. Nelson, H.S., et al., Treatment of anaphylactic sensitivity to peanuts by immunotherapy with injections of aqueous peanut extract. Journal of Allergy and Clinical Immunology, 1997. 99(6 Pt 1): p. 744-51.
147
114. Oppenheimer, J.J., et al., Treatment of peanut allergy with rush
immunotherapy. Journal of Allergy and Clinical Immunology, 1992. 90(2): p. 256-62.
115. Valenta, R., The future of antigen-specific immunotherapy of allergy. Nature Reviews Immunology, 2002. 2(6): p. 446-53.
116. Valenta, R. and V. Niederberger, Recombinant allergens for immunotherapy. Journal of Allergy and Clinical Immunology, 2007. 119(4): p. 826-30.
117. Linhart, B. and R. Valenta, Molecular design of allergy vaccines. Current Opinion in Immunology, 2005. 17(6): p. 646-55.
118. Valenta, R., et al., Recombinant allergens for allergen-specific immunotherapy: 10 years anniversary of immunotherapy with recombinant allergens. Allergy, 2011. 66(6): p. 775-83.
119. Niederberger, V., et al., Vaccination with genetically engineered allergens prevents progression of allergic disease. Proceedings of the National Academy of Sciences of the United States of America, 2004. 2: p. 14677-82.
120. Anibarro, B., et al., Allergy to eggs from duck and goose without sensitization to hen egg proteins. Journal of Allergy and Clinical Immunology, 2000. 105(4): p. 834-6.
121. Caubet, J.C., et al., Molecular diagnosis of egg allergy. Current Opinion in Allergy and Clinical Immunology, 2011. 11(3): p. 210-5.
122. Rona, R.J., et al., The prevalence of food allergy: A meta-analysis. Journal of Allergy and Clinical Immunology, 2007. 120(3): p. 638-646.
123. Osterballe, M., et al., The prevalence of food hypersensitivity in an unselected population of children and adults. Pediatric Allergy and Immunology, 2005. 16(7): p. 567-73.
124. Egger, M., et al., Is aboriginal food less allergenic? Comparing IgE-reactivity of eggs from modern and ancient chicken breeds in a cohort of allergic children. PLoS One, 2011. 6(4): p. 0019062.
125. Alessandri, C., et al., Anaphylaxis to quail egg. Allergy, 2005. 60(1): p. 128-9.
126. Caro Contreras, F.J., et al., Allergy to quail's egg without allergy to chicken's egg. case report. Allergologia Et Immunopathologia.
127. Guilmineau, F., I. Krause, and U. Kulozik, Efficient analysis of egg yolk proteins and their thermal sensitivity using sodium dodecyl sulfate polyacrylamide gel electrophoresis under reducing and nonreducing conditions. Journal of Agricultural and Food Chemistry, 2005. 53(24): p. 9329-36.
128. Evans, A.J. and R.W. Burley, Proteolysis of apoprotein B during the transfer of very low density lipoprotein from hens' blood to egg yolk. The Journal of Biological Chemistry, 1987. 262(2): p. 501-4.
129. Jolivet, P., et al., New insights into the structure of apolipoprotein B from low-density lipoproteins and identification of a novel YGP-like protein in hen egg yolk. Journal of Agricultural and Food Chemistry, 2008. 56(14): p. 5871-9.
130. Mann, K. and M. Mann, The chicken egg yolk plasma and granule proteomes. Proteomics, 2008. 8(1): p. 178-91.
131. Ventura, S. and A. Villaverde, Protein quality in bacterial inclusion bodies. Trends in Biotechnology, 2006. 24(4): p. 179-185.
132. Villaverde, A. and M.M. Carrio, Protein aggregation in recombinant bacteria: biological role of inclusion bodies. Biotechnology Letters, 2003. 25(17): p. 1385-95.
148

133. Rupa, P. and Y. Mine, Immunological comparison of native and recombinant
egg allergen, ovalbumin, expressed in Escherichia coli. Biotechnology Letters, 2003. 25(22): p. 1917-24.
134. Glenting, J., et al., Production of Recombinant Peanut Allergen Ara h 2 using Lactococcus lactis. Microbial Cell Factories, 2007. 6: p. 28.
135. Chruszcz, M., et al., Serum albumins-unusual allergens. Biochimica et Biophysica Acta, 2013. 12(81): p. 26.
136. Scala, E., et al., Cross-sectional survey on immunoglobulin E reactivity in 23,077 subjects using an allergenic molecule-based microarray detection system. Clinical and Experimental Allergy, 2010. 40(6): p. 911-21.
137. Spitzauer, S., et al., IgE cross-reactivities against albumins in patients allergic to animals. Journal of Allergy and Clinical Immunology, 1995. 96(6 Pt 1): p. 951-9.
138. Cromwell, O., D. Hafner, and A. Nandy, Recombinant allergens for specific immunotherapy. Journal of Allergy and Clinical Immunology, 2011. 127(4): p. 865-72.
139. Dhanapala, P., et al., Production and immunological analysis of IgE reactive recombinant egg white allergens expressed in Escherichia coli. Molecular Immunology, 2015. 65(1): p. 104-12.
140. PepTalk 2017. Recombinant Protein Expression and Production. 2017 [cited 2016 18/09/2016]; Available from: http://www.chi-peptalk.com/protein-expression-production/.
141. NEW ENGLAND BioLabs Inc. Disulphide-Bond Protein Expression. 2017 [cited 2017 10/04]; Available from: https://www.neb.com/applications/protein-expression-and-purification/expression-of-difficult-proteins/disulfide-bonded-protein-expression.
142. UniProt. UniProtKB - P19121 (ALBU_CHICK). 2016; Available from: http://www.uniprot.org/uniprot/P19121.
143. Kong, B. and G.L. Guo, Soluble expression of disulfide bond containing proteins FGF15 and FGF19 in the cytoplasm of Escherichia coli. PLoS One, 2014. 9(1).
144. UniProt. UniProtKB - P87498 (VIT1_CHICK). 2017 [cited 2017 10/04]; Available from: http://www.uniprot.org/uniprot/P87498.
145. Read, J.D., et al., Acetamide selection of Kluyveromyces lactis cells transformed with an integrative vector leads to high-frequency formation of multicopy strains. Applied and Environmental Microbiology, 2007. 73(16): p. 5088-96.
146. Feng, Z., et al., Codon optimization of the calf prochymosin gene and its expression in Kluyveromyces lactis. World Journal of Microbiology and Biotechnology, 2010. 26(5): p. 895-901.
147. Smith, A.M. and M.D. Chapman, Reduction in IgE binding to allergen variants generated by site-directed mutagenesis: contribution of disulfide bonds to the antigenic structure of the major house dust mite allergen Der p 2. Molecular Immunology, 1996. 33(4-5): p. 399-405.
148. Hazebrouck, S., et al., Trypsin resistance of the major peanut allergen Ara h 6 and allergenicity of the digestion products are abolished after selective disruption of disulfide bonds. Molecular Nutrition & Food Research, 2012. 56(4): p. 548-57.
149. NEW ENGLAND BioLabs Inc. Bypassing Common Obstacles in Protein Expression. 2017 [cited 2017; Available from: https://www.neb.com/tools-
149
and-resources/feature-articles/bypassing-common-obstacles-in-protein-expression.
150. Evans, M.I., R. Silva, and J.B. Burch, Isolation of chicken vitellogenin I and III cDNAs and the developmental regulation of five estrogen-responsive genes in the embryonic liver. Genes & Development, 1988. 2(1): p. 116-24.
151. Walsh, B.J., et al., Allergenic cross-reactivity of egg-white and egg-yolk proteins. An in vitro study. International Archives of Allergy and Applied Immunology, 1987. 84(3): p. 228-32.
150