Climate of Opportunity - doee development, ... sources of these gases and their global warming...
54
Climate of Opportunity A Climate Action Plan for the District of Columbia Draft for Public Discussion September 2010
Transcript of Climate of Opportunity - doee development, ... sources of these gases and their global warming...
Climate of OpportunityA Climate Action Planfor the District of Columbia
Draft for Public DiscussionSeptember 2010

What will a changing climate mean for each of us in the District of Columbia?Records show that our average temperatures and water levels are rising, and recenthistory shows just how much extreme weather can affect our daily lives.
But climate change can have another meaning as well: opportunity. For current res-idents, institutions and businesses, there are opportunities to save money and be-come more efficient consumers of energy and water. As new markets grow forrenewable energy, alternative fuel vehicles, and high efficiency buildings, additionalopportunities are created for new jobs and for businesses to expand and grow.
For all of us, there is the opportunity to envision what our city will be like in 2020 and2050. How will a network of streetcars, bus lines, bike stations and Metro change ourtravel habits? How will green and cool roofs and an enhanced tree canopy make ourneighborhoods cooler, more livable and more beautiful? How can we realize the op-portunity climate change presents to increase the wealth and health of our city?
Every day, our actions at home, school and work affect our emissions of carbondioxide and other greenhouse gases. Likewise, we have opportunities each day inthe way we commute and move around the city, the way we buy and use energy, andthe way we build (or rebuild) our city to maximize efficiency, build smarter, and plannot just for this year and next, but for the city we’ll leave to the next generation.
Last year, I tasked our District agencies to come up with an aggressive but achiev-able plan to reduce the “carbon footprint” of our government. This document con-tains a detailed list and the estimated impacts of these “government operationsactions.” I also asked them to put together an overview of actions that others out-side of the District government can take to address greenhouse gas emissions fromour community as a whole. This document contains an overview of these “commu-nity actions” to serve as a starting point for discussion of our collective efforts to re-duce our emissions.
I invite you to join us today in envisioning the opportunities for the future, and to en-gage with the Fenty Administration and people across our community as we worktogether to further our Green DC Agenda.
Mayor Adrian M. Fenty
Climate of Opportunity: A Climate Action Plan for the District of ColumbiaDraft for Community Discussion
Dear Residents, Business Ownersand Partners for a Green DC:

1
1 Executive Summary . . . . . . . . . . . . . . . . . . . . . . . . . . . . . . . . . . . . . . . . . . . . . . . 2
2 Introduction . . . . . . . . . . . . . . . . . . . . . . . . . . . . . . . . . . . . . . . . . . . . . . . . . . . . 14
3 The Greenhouse Gas Emissions Inventory . . . . . . . . . . . . . . . . . . . . . . . . . . . . 16
4 Emissions Growth Forecasts . . . . . . . . . . . . . . . . . . . . . . . . . . . . . . . . . . . . . . . 19
5 Greenhouse Gas Emissions Reduction Targets . . . . . . . . . . . . . . . . . . . . . . . . . 21
6 The Climate Action Plan . . . . . . . . . . . . . . . . . . . . . . . . . . . . . . . . . . . . . . . . . . . 23
6.1 Government Operations Actions . . . . . . . . . . . . . . . . . . . . . . . . . . . . . . . . . 23
6.2 Community Actions . . . . . . . . . . . . . . . . . . . . . . . . . . . . . . . . . . . . . . . . . . . 34
7 Other Benefits of Climate Protection Measures . . . . . . . . . . . . . . . . . . . . . . . . . 44
8 Next Steps . . . . . . . . . . . . . . . . . . . . . . . . . . . . . . . . . . . . . . . . . . . . . . . . . . . . . 46
List of Tables and Figures . . . . . . . . . . . . . . . . . . . . . . . . . . . . . . . . . . . . . . . . . . . . . 47
Credits and Acknowledgements . . . . . . . . . . . . . . . . . . . . . . . . . . . . . . . . . . . . . . . 48
Endnotes . . . . . . . . . . . . . . . . . . . . . . . . . . . . . . . . . . . . . . . . . . . . . . . . . . . . . . . . . . 49
What You Can Do . . . . . . . . . . . . . . . . . . . . . . . . . . . . . . . . . . . . . . . . . . . . . . . . . . . 51
Table of Contents
Climate of Opportunity: A Climate Action Plan for the District of ColumbiaDraft for Community Discussion
We Want Your Comments and Input
This document is a Draft for Community Discussion. You can contribute to theDistrict’s climate planning effort by providing input in two ways:
First, the District Department of the Environment (DDOE) is asking for publiccomments on the list of proposed Government Operations Actions (Section6.1) by November 15, 2010. You can submit comments via e-mail [email protected] or by mail to DDOE, Climate Action Comments, 1200First St NE, 5th Floor, Washington, DC 20002.
Second, you can participate in a series of public forums and meetings con-vened by DDOE to gather input and comments on the proposed GovernmentOperations Plan (Section 6.1) and the Community Discussion Draft (Section6.2). More information on the climate engagement process can be found atwww.green.dc.gov, by e-mailing [email protected], or calling 202-535-2600.

How efficient and competitive will the District be in 2020 and 2050? How will residentsand businesses adapt to a changing climate and economy? How can we ensure thatthe District remains the economic engine for our metropolitan area and the place wherepeople want to live and businesses want to grow?
When Mayor Fenty released the Green DC Agenda in April 2009, he called for devel-oping a visionary plan to address climate change in the nation’s capital. Planning forclimate change means identifying opportunities to live and work more efficiently andworking aggressively to create jobs and strengthen the local economy. The same ac-tions that will help reduce greenhouse gas emissions, such as retrofitting homes,schools and office buildings, will create jobs for people who design and build cutting-edge facilities, people who sell and install the latest green technologies, and peoplewho provide goods and services to those industries.
For the past year, agencies across the District Government have been working tomeasure the District’s “carbon footprint”—the amount of greenhouse gases we re-lease each year—and to draft a plan with specific targets and actions to reduce ouremissions. Our draft plan focuses on this “Climate of Opportunity” and will begin anopen, public engagement to help refine just what your District Government can do,and just what the city’s businesses and residents can do, to create a cooler, greener,and more efficient city for the 21st Century.
Challenges and Opportunities
Cities like Washington present both challenges and opportunities with respect to green-house gas emissions. As the hub of economic activity, transportation, and as a densepopulation center, our city produces significant greenhouse gas emissions. During cal-endar year 2006, the District’s greenhouse gas emissions totaled 10.5 million metric
2
Executive Summary
Climate of Opportunity: A Climate Action Plan for the District of ColumbiaDraft for Community Discussion
1
New Yo
rk
City
San F
rancis
co
Phila
delph
ia
Seatt
le
Boston
Housto
n
Baltim
ore
Denve
r
US ave
rage
Washin
gton,D
C
Figure ES.1 Per Capita CO2e Comparison (metric tons)
0
5
10
15
20
6.4 10.1 18.9 19.411.4 11.9 13.3 14.1 14.4 18.0
3
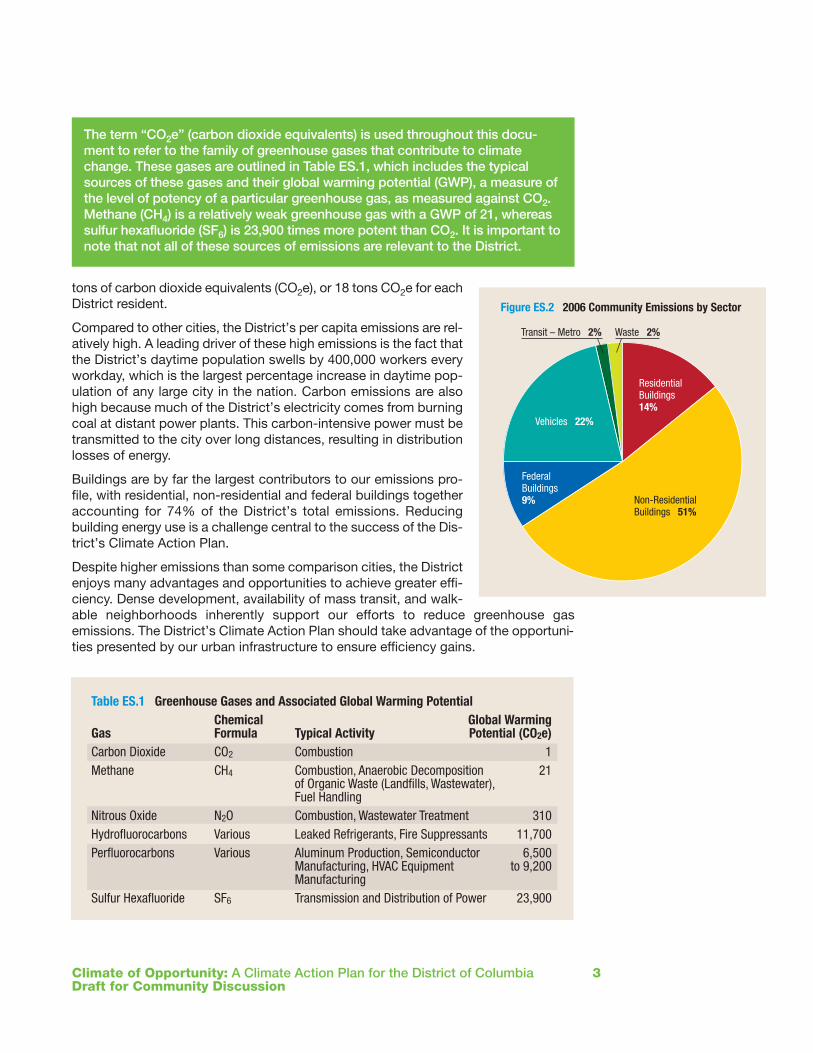
tons of carbon dioxide equivalents (CO2e), or 18 tons CO2e for eachDistrict resident.
Compared to other cities, the District’s per capita emissions are rel-atively high. A leading driver of these high emissions is the fact thatthe District’s daytime population swells by 400,000 workers everyworkday, which is the largest percentage increase in daytime pop-ulation of any large city in the nation. Carbon emissions are alsohigh because much of the District’s electricity comes from burningcoal at distant power plants. This carbon-intensive power must betransmitted to the city over long distances, resulting in distributionlosses of energy.
Buildings are by far the largest contributors to our emissions pro-file, with residential, non-residential and federal buildings togetheraccounting for 74% of the District’s total emissions. Reducingbuilding energy use is a challenge central to the success of the Dis-trict’s Climate Action Plan.
Despite higher emissions than some comparison cities, the Districtenjoys many advantages and opportunities to achieve greater effi-ciency. Dense development, availability of mass transit, and walk-able neighborhoods inherently support our efforts to reduce greenhouse gasemissions. The District’s Climate Action Plan should take advantage of the opportuni-ties presented by our urban infrastructure to ensure efficiency gains.
Climate of Opportunity: A Climate Action Plan for the District of ColumbiaDraft for Community Discussion
The term “CO2e” (carbon dioxide equivalents) is used throughout this docu-ment to refer to the family of greenhouse gases that contribute to climatechange. These gases are outlined in Table ES.1, which includes the typicalsources of these gases and their global warming potential (GWP), a measure ofthe level of potency of a particular greenhouse gas, as measured against CO2.Methane (CH4) is a relatively weak greenhouse gas with a GWP of 21, whereassulfur hexafluoride (SF6) is 23,900 times more potent than CO2. It is important tonote that not all of these sources of emissions are relevant to the District.
Table ES.1 Greenhouse Gases and Associated Global Warming Potential Chemical Global WarmingGas Formula Typical Activity Potential (CO2e)Carbon Dioxide CO2 Combustion 1Methane CH4 Combustion, Anaerobic Decomposition 21 of Organic Waste (Landfills, Wastewater), Fuel HandlingNitrous Oxide N2O Combustion, Wastewater Treatment 310Hydrofluorocarbons Various Leaked Refrigerants, Fire Suppressants 11,700 Perfluorocarbons Various Aluminum Production, Semiconductor 6,500 Manufacturing, HVAC Equipment to 9,200 Manufacturing Sulfur Hexafluoride SF6 Transmission and Distribution of Power 23,900
Non-ResidentialBuildings 51%
FederalBuildings9%
Vehicles 22%
Transit – Metro 2% Waste 2%
ResidentialBuildings14%
Figure ES.2 2006 Community Emissions by Sector

Significant Efforts Are Already Underway
The District has in place a number of progressive policies and programs that are re-ducing energy use and promoting renewable energy and alternative transportation,lowering our emissions of greenhouse gases. These policies have already elevated theDistrict to the top of many measures of urban sustainability. The Green Building Act,Clean and Affordable Energy Act, and 2008 Construction Codes set the stage forgreening our buildings, which account for 74% of our city’s greenhouse gas emis-sions. Thanks to strong adoption by the private sector, the District has more LEED andEnergy Star certified buildings than any city our size.
Green and “cool” roofs keep buildings more comfortable and save energy and the Dis-trict has one of the most aggressive green roof programs in the country. Our public andprivate buildings have over 800,000 square feet of green roofs (second in the nation be-hind Chicago). Green and cool roofs help cool our city, improve air quality, and reducegreenhouse gas emissions.
The federal Environmental Protection Agency (EPA) recently recognized the District asa national leader (third among cities nationwide) in purchasing renewable power. Thecity’s renewable portfolio standard, which will require electric power sold into the cityto be 20% renewable by 2020. The renewable energy incentive program is fundingmore than 200 residential and business photovoltaic installations each year.
Perhaps Washington’s strongest legacy of environmental stewardship is in the ac-ceptance and use of sustainable transportation. Thirty-nine percent of residents com-mute by mass transit and more than a third of households—37%—do not even owncars. Car-sharing, fleet-sharing by the District Government and bike sharing are all ex-panding and will allow us to be less and less reliant on fossil fuel and further decreaseour greenhouse gas emissions.
The Need for a Climate Action Plan
A wide array of business owners, institutions, neighborhood groups, and individual cit-izens has already made significant efforts to reduce greenhouse gas emissions in theDistrict, and we need to build on these successes. A comprehensive and community-wide Climate Action Plan will coordinate public and private sector efforts, foster dia-logue and learning opportunities among stakeholder groups, and maintain focus onhigh-impact actions. Having a climate action plan drives progress towards reductiontargets to achieve our goals in the short, medium and long-term.
Likewise, the Government of the District of Columbia is committed to meeting the chal-lenge of reducing greenhouse gas emissions from its Government Operations. The Dis-trict Government’s policies, practices and programs will contribute to a city-wide effortto dramatically reduce greenhouse gas emissions, and the city will lead by example.
Many efforts to reduce our emissions of greenhouse gases also have the added ben-efit of helping to prepare and protect the District from the negative impacts of climatechange, including sea level rise, flooding, and increasing urban heat. Shifting to lowcarbon strategies will help local residents and businesses grow in a clean energy econ-omy and position the District for future growth. Smarter use of energy means a moreefficient city and lower costs for government, residents, and businesses. A low-carbondevelopment strategy builds on our strengths as a transit-friendly, walkable city to pro-
4 Climate of Opportunity: A Climate Action Plan for the District of ColumbiaDraft for Community Discussion
5
vide a better quality of life for all District residents, workers andvisitors.
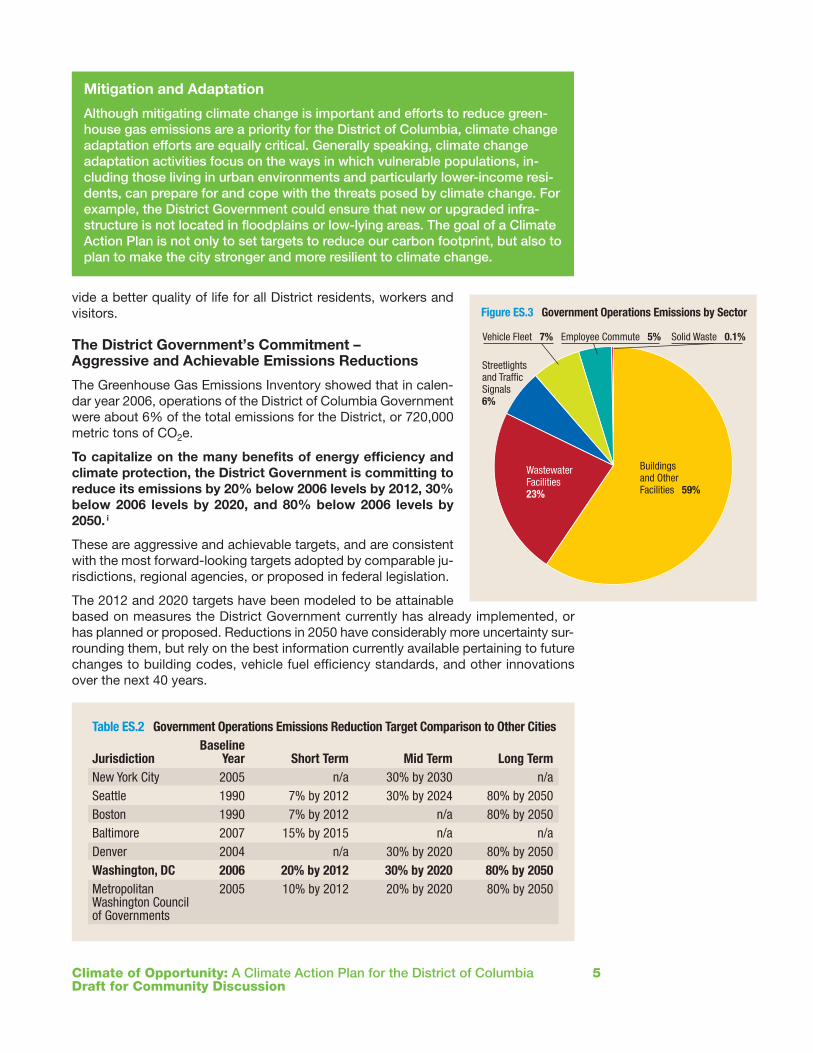
The District Government’s Commitment –Aggressive and Achievable Emissions Reductions
The Greenhouse Gas Emissions Inventory showed that in calen-dar year 2006, operations of the District of Columbia Governmentwere about 6% of the total emissions for the District, or 720,000metric tons of CO2e.
To capitalize on the many benefits of energy efficiency andclimate protection, the District Government is committing toreduce its emissions by 20% below 2006 levels by 2012, 30%below 2006 levels by 2020, and 80% below 2006 levels by2050. i
These are aggressive and achievable targets, and are consistentwith the most forward-looking targets adopted by comparable ju-risdictions, regional agencies, or proposed in federal legislation.
The 2012 and 2020 targets have been modeled to be attainablebased on measures the District Government currently has already implemented, orhas planned or proposed. Reductions in 2050 have considerably more uncertainty sur-rounding them, but rely on the best information currently available pertaining to futurechanges to building codes, vehicle fuel efficiency standards, and other innovationsover the next 40 years.
Climate of Opportunity: A Climate Action Plan for the District of ColumbiaDraft for Community Discussion
Mitigation and Adaptation
Although mitigating climate change is important and efforts to reduce green-house gas emissions are a priority for the District of Columbia, climate changeadaptation efforts are equally critical. Generally speaking, climate changeadaptation activities focus on the ways in which vulnerable populations, in-cluding those living in urban environments and particularly lower-income resi-dents, can prepare for and cope with the threats posed by climate change. Forexample, the District Government could ensure that new or upgraded infra-structure is not located in floodplains or low-lying areas. The goal of a ClimateAction Plan is not only to set targets to reduce our carbon footprint, but also toplan to make the city stronger and more resilient to climate change.
Buildingsand OtherFacilities 59%
WastewaterFacilities23%
Streetlightsand TrafficSignals6%
Vehicle Fleet 7% Employee Commute 5% Solid Waste 0.1%
Figure ES.3 Government Operations Emissions by Sector
Table ES.2 Government Operations Emissions Reduction Target Comparison to Other Cities BaselineJurisdiction Year Short Term Mid Term Long TermNew York City 2005 n/a 30% by 2030 n/aSeattle 1990 7% by 2012 30% by 2024 80% by 2050Boston 1990 7% by 2012 n/a 80% by 2050Baltimore 2007 15% by 2015 n/a n/aDenver 2004 n/a 30% by 2020 80% by 2050Washington, DC 2006 20% by 2012 30% by 2020 80% by 2050Metropolitan 2005 10% by 2012 20% by 2020 80% by 2050Washington Councilof Governments
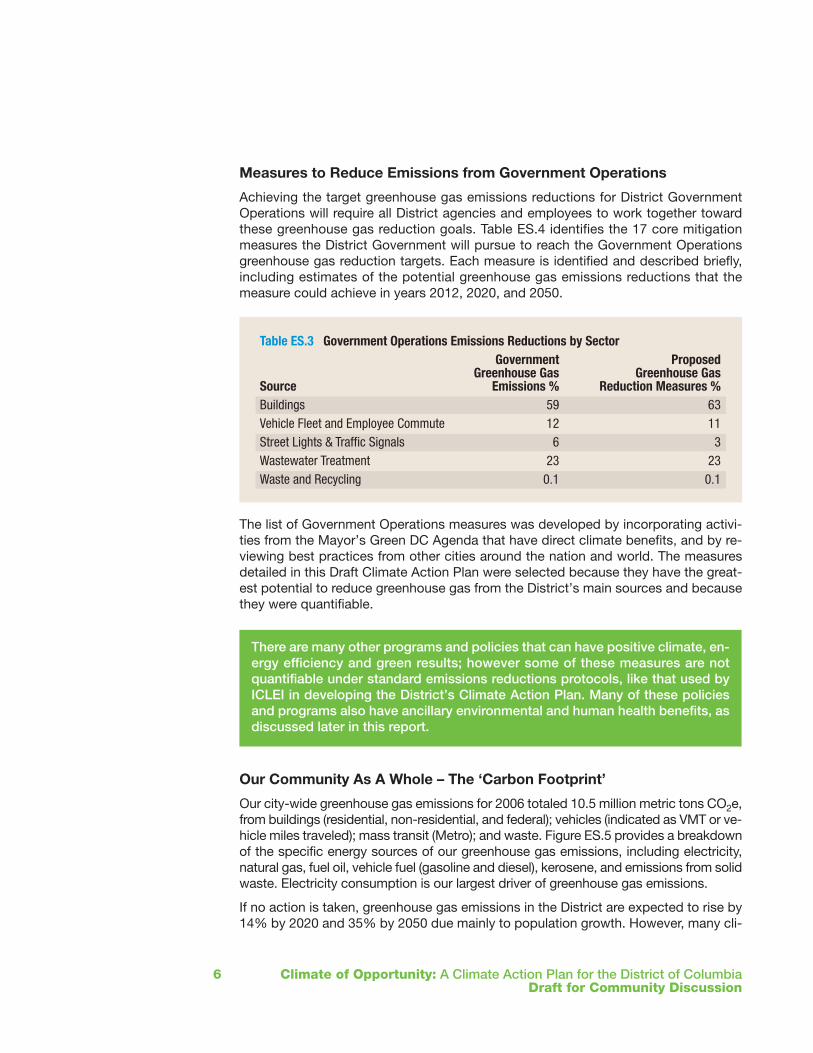
Measures to Reduce Emissions from Government Operations
Achieving the target greenhouse gas emissions reductions for District GovernmentOperations will require all District agencies and employees to work together towardthese greenhouse gas reduction goals. Table ES.4 identifies the 17 core mitigationmeasures the District Government will pursue to reach the Government Operationsgreenhouse gas reduction targets. Each measure is identified and described briefly,including estimates of the potential greenhouse gas emissions reductions that themeasure could achieve in years 2012, 2020, and 2050.
The list of Government Operations measures was developed by incorporating activi-ties from the Mayor’s Green DC Agenda that have direct climate benefits, and by re-viewing best practices from other cities around the nation and world. The measuresdetailed in this Draft Climate Action Plan were selected because they have the great-est potential to reduce greenhouse gas from the District’s main sources and becausethey were quantifiable.
Our Community As A Whole – The ‘Carbon Footprint’
Our city-wide greenhouse gas emissions for 2006 totaled 10.5 million metric tons CO2e,from buildings (residential, non-residential, and federal); vehicles (indicated as VMT or ve-hicle miles traveled); mass transit (Metro); and waste. Figure ES.5 provides a breakdownof the specific energy sources of our greenhouse gas emissions, including electricity,natural gas, fuel oil, vehicle fuel (gasoline and diesel), kerosene, and emissions from solidwaste. Electricity consumption is our largest driver of greenhouse gas emissions.
If no action is taken, greenhouse gas emissions in the District are expected to rise by14% by 2020 and 35% by 2050 due mainly to population growth. However, many cli-
6 Climate of Opportunity: A Climate Action Plan for the District of ColumbiaDraft for Community Discussion
Table ES.3 Government Operations Emissions Reductions by Sector Government Proposed Greenhouse Gas Greenhouse GasSource Emissions % Reduction Measures %Buildings 59 63Vehicle Fleet and Employee Commute 12 11Street Lights & Traffic Signals 6 3Wastewater Treatment 23 23Waste and Recycling 0.1 0.1
There are many other programs and policies that can have positive climate, en-ergy efficiency and green results; however some of these measures are notquantifiable under standard emissions reductions protocols, like that used byICLEI in developing the District’s Climate Action Plan. Many of these policiesand programs also have ancillary environmental and human health benefits, asdiscussed later in this report.

7
mate mitigating actions are under-way city-wide. Businesses, insti-tutions, and individuals across theDistrict are demonstrating regionaland national leadership in climatereduction and to maximizing costsavings and economic growthwhile minimizing greenhouse gasemissions.
Community Commitments toReduce Emissions –Regionaland National Leadership
What are the realistic options forcommunity targets and mitigationmeasures? These are the optionswe will develop together during thecommunity engagement process.There are, however, examples andguidelines for us to refer to. Em-ploying the measures discussed in the report (and others identified during the publicplanning process), the District as a community should meet or exceed the MetropolitanWashington Council of Governments recommended regional goals of reducing emis-sions by 10% in 2012, 20% in 2020, and 80% in 2050. ii
Climate of Opportunity: A Climate Action Plan for the District of ColumbiaDraft for Community Discussion
Electricity 58%
NaturalGas15%
VMT –gasoline18%
Fuel oil 4%
VMT – diesel 3% Municipal Solid Waste 2%
Figure ES.5 Community Emissions by Source
Met
ric to
ns C
O 2e
(mill
ions
)
1
0.8
0.6
0.4
0.2
02006
Forecasted GrowthImpact of Actions
2012 2020 2050
Figure ES.4 Forecasted Emissions Growth and Impact of Government Operations Actions
719,896
568,414
742,178
440,740
763,788
217,262
887,659
Measures to Reduce Emissions from the Community
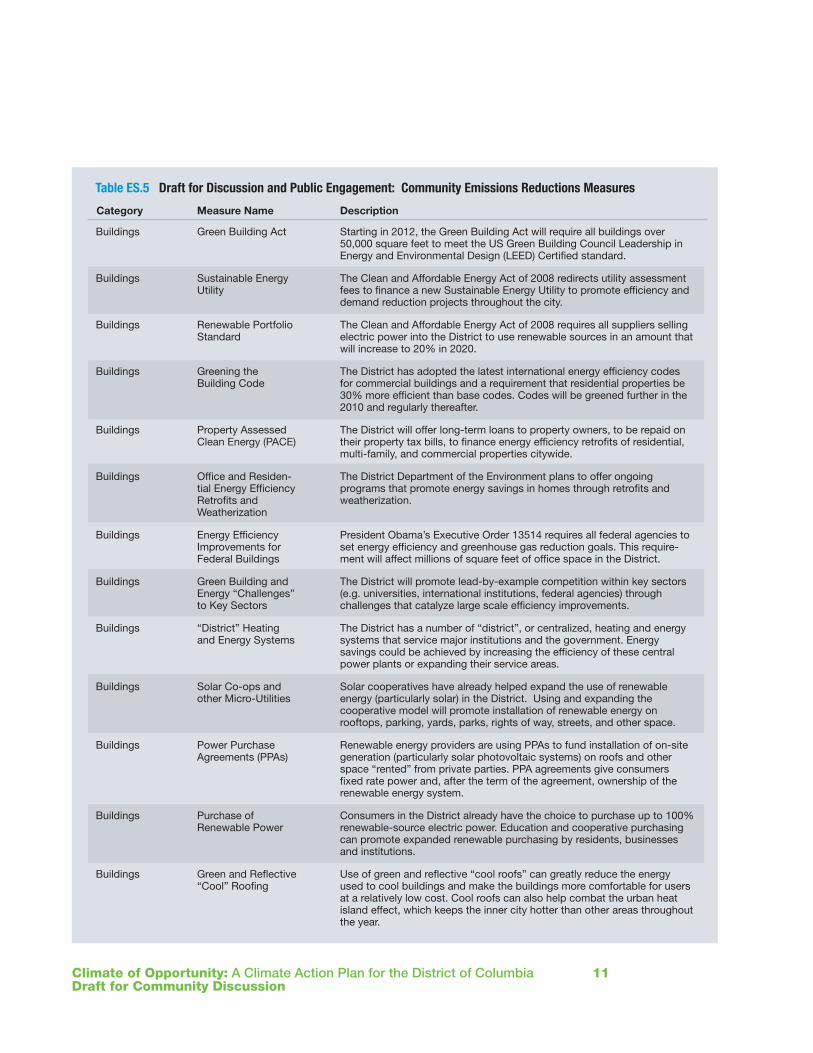
Achieving significant greenhouse gas emissions reductions will require all sectors of thecommunity to work together toward these common goals. Table ES.5 summarizes poli-cies and programs that could have quantifiable impacts on reducing greenhouse gasemissions. In Section 6.2, each proposed measure is identified and described in moredetail.
Reviewing this Draft Plan
This Draft Climate Action Plan is organized in eight sections. Sections 2 through 5present background information on climate change and provide data specific to theDistrict of Columbia. Section 6.1 presents a draft blueprint for greenhouse gas emis-sions reductions from District Government Operations. It includes targets for emis-sions reductions within short, medium and long-term timelines, and proposes the keyactions that will make these commitments a reality.
Section 6.2 presents a discussion draft of measures aimed at reducing greenhousegas emissions from the entire community. These include policies and programs al-ready in place, like the Green Building Act and Clean and Affordable Energy Act, andothers that could be put in place to achieve significant energy savings and emissionsreductions in the short, medium and long-term. Although many forward-looking ac-tions aimed at increasing energy efficiency and reducing greenhouse gas emissions arecurrently underway across the city, the community portion of this plan is intended tospur a wide-ranging dialogue and initiate a public process to develop comprehensive,community-wide targets and actions to reduce greenhouse gas emissions.
8 Climate of Opportunity: A Climate Action Plan for the District of ColumbiaDraft for Community Discussion
Met
ric to
ns C
O 2e
(mill
ions
)
1.6
1.4
1.2
1
0.8
0.6
0.4
0.2
02006
Forecasted GrowthImpact of Actions
2012 2020 2050
Figure ES.6 Forecasted Emissions Growth and Impact of Community Actions Using the Metropolitan Washington Council of Governments Regional Targets as Reduction Goals
10,505,946
9,455,3518,404,757
2,101,189
11,068,41611,986,095
14,284,067
We Want YourComments and Input
This document is a Draftfor Community Discus-sion. You can contributeto the District’s climateplanning effort by pro-viding input in two ways:
First, the District De-partment of the Environ-ment (DDOE) is askingfor public comments onthe list of proposedGovernment OperationsActions (Section 6.1) byNovember 15, 2010. Youcan submit commentsvia e-mail [email protected] orby mail to DDOE, Cli-mate Action Comments,1200 First St NE, 5thFloor, Washington, DC20002.
Second, you can partici-pate in a series of publicforums and meetingsconvened by DDOE togather input and com-ments on the proposedGovernment OperationsPlan (Section 6.1) andthe Community Discus-sion Draft (Section 6.2).More information on theclimate engagementprocess can be found atwww.green.dc.gov, by [email protected], orcalling 202-535-2600.

9Climate of Opportunity: A Climate Action Plan for the District of ColumbiaDraft for Community Discussion
Description 2012mTons CO2e Reduction in:
2020 2050Category Measure Name Measure No.
Conversion of all alley and street lights (not covered by federal highway regulations) to high efficiency light- emitting diode fixtures (LEDs)
Over 5-8 years, the District Government will systemati-cally update all District Public School facilities to meet US Green Building Council Leadership in Energy and Environmental Design (LEED) Silver standard or higher.
The District Government will continue to purchase electricity from renewable sources and will increase the renewable energy share.
The District Housing Authority will continue efforts to improve energy and water efficiency of public housing through heating and air conditioning upgrades, window restorations/ replacements, and building envelope improvements.
The District Government will install and implement building management systems to conserve energy and create a more comfortable indoor environment at District-owned buildings.
District Government agencies will increase education efforts and commit to more consistent enforcement of limits on personal electronic items in workspaces.
The Department of Real Estate Services is managing a significant turnover of leased space that will reduce the number of leased facilities, reduce energy consumption, and simplify administration.
The Office of the Chief Technology Officer will migrate equipment to new high efficiency servers that are approximately 30% more efficient than conventional servers.
Street Lighting
Buildings
Buildings
Buildings
Buildings
Buildings
Buildings
Buildings
Table ES.4 Draft for Public Review and Comment: Government Operations Emissions Reduction Measures Reductions in CO2e represent total cumulative reductions for the year indicated
Street Lighting Retrofits
School Facilities Modernization
Renewable Electricity Contract
Public Housing Retrofits
Building Management Systems & Commissioning
Staff Education & Training to Reduce Plug Load
Leased Space Efficiency Improvements
Server Consoli-dation
6.1.3.1
6.1.1.1
6.1.1.2
6.1.1.3
6.1.1.4
6.1.1.5
6.1.1.6
6.1.1.7
1,619
14,993
40,459
3,239
23,017
222
272
1,116
10,791
26,226
111,636
9,668
49,959
1,112
1,049
1,116
32,374
59,781
236,201
31,454
123,319
1,112
4,094
1,815

10 Climate of Opportunity: A Climate Action Plan for the District of ColumbiaDraft for Community Discussion
District Government specifica-tions require purchase of ENERGY STAR computers and government wide software will allow central control and shutdown of an increasing number of units.
District Government agencies will improve recycling rates to meet and exceed the 45% diversion requirement.
DC Water will install more efficient diffusers for use in its aerated wastewater treatment processes at Blue Plains.
DC Water will convert sewage organic matter to methane and generate an estimated 10 megawatts of electricity, offsetting its purchase from outside electric suppliers.
DC Water will install more efficient diffusers for use in its aerated wastewater treatment processes at the Blue Plains wastewater treatment facility.
The District Government will support use of alternative transportation modes and flexible work schedules among its employees to reduce vehicle miles traveled.
District Government agencies will increase car sharing use, visibility, convenience, and availability to District Govern-ment employees.
The District Government will pilot and expand use of electric vehicles and development of electric charging infrastructure. The District Department of Transportation and other agencies will begin pilots with commercially available electric vehicles.
The Metropolitan Police Department will downsize its cruiser fleet from V8-powered Ford Crown Victorias to more efficient V6-powered sedans and increase alternative vehicle use.
Description 2012mTons CO2e Reduction in:
2020 2050
Buildings
Waste and Recycling
Wastewater Treatment
Wastewater Treatment
Wastewater Treatment
Vehicle Fleet and Employee Commute
Vehicle Fleet and Employee Commute
Vehicle Fleet and Employee Commute
Vehicle Fleet and Employee Commute
Category
Computer Workstation Efficiency Projects
Recycling in District Government Facilities
Blue Plains Fine Bubble Diffuser Retrofit
Blue Plains Anaerobic Digester Project
Tidal Gate Improvements
District Government Employee Commute Benefit
District Government Employee Car Sharing Program
Electric Vehicle Usage
Metropolitan Police Department Cruiser Fleet Right-Sizing
Measure Name
6.1.1.8
6.1.5.1
6.1.4.1
6.1.4.2
6.1.4.3
6.1.2.1
6.1.2.2
6.1.2.3
6.1.2.4
572
240
--
36,746
17
4,674
658
61
780
1,144
400
37,096
36,746
17
9,349
1,280
69
2,601
4,577
400
64,706
64,706
17
14,490
3,611
193
4,878
Measure No.
11Climate of Opportunity: A Climate Action Plan for the District of ColumbiaDraft for Community Discussion
DescriptionCategory Measure Name
Starting in 2012, the Green Building Act will require all buildings over 50,000 square feet to meet the US Green Building Council Leadership in Energy and Environmental Design (LEED) Certified standard.
The Clean and Affordable Energy Act of 2008 redirects utility assessment fees to finance a new Sustainable Energy Utility to promote efficiency and demand reduction projects throughout the city.
The Clean and Affordable Energy Act of 2008 requires all suppliers selling electric power into the District to use renewable sources in an amount that will increase to 20% in 2020.
The District has adopted the latest international energy efficiency codes for commercial buildings and a requirement that residential properties be 30% more efficient than base codes. Codes will be greened further in the 2010 and regularly thereafter.
The District will offer long-term loans to property owners, to be repaid on their property tax bills, to finance energy efficiency retrofits of residential, multi-family, and commercial properties citywide.
The District Department of the Environment plans to offer ongoing programs that promote energy savings in homes through retrofits and weatherization.
President Obama’s Executive Order 13514 requires all federal agencies to set energy efficiency and greenhouse gas reduction goals. This require-ment will affect millions of square feet of office space in the District.
The District will promote lead-by-example competition within key sectors (e.g. universities, international institutions, federal agencies) through challenges that catalyze large scale efficiency improvements.
The District has a number of “district”, or centralized, heating and energy systems that service major institutions and the government. Energy savings could be achieved by increasing the efficiency of these central power plants or expanding their service areas.
Solar cooperatives have already helped expand the use of renewable energy (particularly solar) in the District. Using and expanding the cooperative model will promote installation of renewable energy on rooftops, parking, yards, parks, rights of way, streets, and other space.
Renewable energy providers are using PPAs to fund installation of on-site generation (particularly solar photovoltaic systems) on roofs and other space “rented” from private parties. PPA agreements give consumers fixed rate power and, after the term of the agreement, ownership of the renewable energy system.
Consumers in the District already have the choice to purchase up to 100% renewable-source electric power. Education and cooperative purchasing can promote expanded renewable purchasing by residents, businesses and institutions.
Use of green and reflective “cool roofs” can greatly reduce the energy used to cool buildings and make the buildings more comfortable for users at a relatively low cost. Cool roofs can also help combat the urban heat island effect, which keeps the inner city hotter than other areas throughout the year.
Buildings
Buildings
Buildings
Buildings
Buildings
Buildings
Buildings
Buildings
Buildings
Buildings
Buildings
Buildings
Buildings
Table ES.5 Draft for Discussion and Public Engagement: Community Emissions Reductions Measures
Green Building Act
Sustainable Energy Utility
Renewable Portfolio Standard
Greening the Building Code
Property Assessed Clean Energy (PACE)
Office and Residen-tial Energy Efficiency Retrofits and Weatherization
Energy Efficiency Improvements for Federal Buildings
Green Building and Energy “Challenges” to Key Sectors
“District” Heating and Energy Systems
Solar Co-ops and other Micro-Utilities
Power Purchase Agreements (PPAs)
Purchase of Renewable Power
Green and Reflective “Cool” Roofing

12 Climate of Opportunity: A Climate Action Plan for the District of ColumbiaDraft for Community Discussion
DescriptionCategory Measure Name
As older, dirtier power plants in the District go off-line, there is an opportunity to develop facilities as clean power sources using a combina-tion of renewable power sources, natural gas, or other options.
The Energy Independence and Security Act of 2007 mandates that all light bulbs use 25% to 30% less energy by 2012 to 2014. The phase-in will start with 100-watt bulbs in January 2012 and end with 40-watt bulbs in January 2014. By 2020, bulbs must be 70% more efficient.
Continued expansion of bus-rapid-transit routes will service more residents in the coming years, reducing the energy consumed by vehicles.
The District Department of Transportation is now installing the Anacostia and Benning Road Streetcar lines and will expand this system in phases to provide rail mass transit service to neighborhoods not served by Metro.
Continued expansion of the Capital Bikeshare system will provide convenient bike transit options to residents and visitors and reduce vehicle miles traveled.
Continued expansion of cycling facilities and bike lanes under the Bicycle Master Plan will increase the percent of commuters bicycling and reduce vehicle miles traveled.
Increasing the cost of parking in high demand areas reduces congestion and encourages drivers to use mass transit, bicycling, or walking.
The District’s incentives for hybrid vehicles have and will continue to speed adoption of hybrid vehicles and improve the collective fuel economy of cars in the city.
Installation of infrastructure to support electric vehicle charging at businesses, institutions, and homes will facilitate adoption of plug-in electric vehicles.
The District will promote education and infrastructure options to encour-age use of fuel efficient and clean running tour buses and reduce unnecessary idling of vehicles.
Car-sharing is already well established in the District and further efforts by businesses, institutions, and individuals can reduce reliance on cars and reduce vehicle miles traveled.
New federal combined average fuel economy (CAFE) standards will increase the overall fuel economy of vehicles in the District and reduce vehicle emissions.
The District of Columbia’s Comprehensive Plan supports compact, transit oriented development. Efficient land use policies bring residents closer to their destinations and transit opportunities, therefore increasing opportuni-ties for walking, biking, and public transit trips to replace motor vehicle trips
Small Area Plans guide development in more climate friendly patterns. Increasing the number and diversity of end-uses in a small area with compact and mixed-use buildings increases opportunities for district heating systems and co-generation.
Urban trees save energy and reduce emissions by shading buildings and reducing stormwater that would require treatment at the Blue Plains wastewater treatment plant.
Buildings
Buildings
Transportation
Transportation
Transportation
Transportation
Transportation
Transportation
Transportation
Transportation
Transportation
Transportation
Land Use
Land Use
Land Use
Industrial Scale Renewable Co-Generation
Federal Light Bulb Efficiency Standards
Bus Rapid Transit Expansion
Streetcar Project
Bike Share Program Expansion
Bicycle Master Plan Implementa-tion
Performance Based Parking
Incentives for Hybrid Vehicles
Electric Vehicle Plug-In Stations
Fuel Efficient Tour Buses and Anti-Idling
Promotion of Car Sharing Programs
Federal CAFE Standards
Land Use Patterns That Increase Transportation Choices
Small Area Plans
Increase Tree Canopy in the District

13Climate of Opportunity: A Climate Action Plan for the District of ColumbiaDraft for Community Discussion
The District actively supports the use of green building methods, like green roofs, in new construction and rehabilitation projects, as well as public realm designs that favor tree boxes, planting areas on public sidewalks, and reduction of impervious surfaces.
The Office of Planning has recommended changes to the zoning code to increase considerations of climate change; energy conservation and renewable energy production; integrating land use and mobility; water conservation and greywater; slopes, streams, stormwater and hydrology; food production/security and community health; and sustainable business and green jobs.
The Department of Public Works will expand programs for property managers and tenants to improve commercial recycling rates and reduce emissions.
The District plans to increase residential recycling through outreach and expansion of programs that make residential recycling more appealing.
A portion of the District’s municipal waste is incinerated in a waste-to-energy plant, reducing greenhouse gas (methane) emissions from landfills.
Increasing the amount of leaf matter, yard waste, and food waste collected for composting reduces greenhouse gas (methane) emissions from landfills.
A voluntary program would allow businesses, institutions or individuals to “purchase” additional greenhouse gas emissions through private donations to support projects that reduce greenhouse gas emissions within the District’s boundaries. Donations could be official carbon offsets or unofficial carbon benefits.
The use of these products reduces environmental impacts associated with the manufacture, use and disposal of many items in common daily use.
Description
Land Use
Land Use
Waste
Waste
Waste
Waste
Cross-Cutting
Cross-Cutting
Category
Green and Sustainable Land Use Patterns and Development Practices
Sustainable Zoning
Increase Commercial Recycling
Increase Residential Recycling
Waste to Energy
Organic Waste Composting
Local Climate Offset/Benefit Fund
Green Purchasing
Measure Name

Introduction
The District of Columbia is well positioned to play a leadership role in addressing thecauses and effects of climate change through actions at both the community and gov-ernment operations levels. The Government of the District of Columbia is committed toreducing greenhouse gas emissions from its operations, and is emerging as a national
leader in climate mitigation best practices such as green building, renew-able energy, and alternative transportation. The District Gov ern ment’spolicies, practices and programs will contribute to a city-wide effort todramatically reduce greenhouse gas emissions and help prepare the
District of Columbia for the anticipated impacts of climate change.
Outside of the District Government, individuals,businesses and institutions are taking action to
reduce emissions across the community, lead-ing by example to demonstrate how green-house gas emissions reductions makes sensefor our environment and for the bottom line.Achieving significant reductions in emissionswill require leadership from all sectors of the
community, including businesses, environmentaland public health organizations, neighborhood
groups and associations, and from each of us as indi-vidual citizens.
Climate Change Science Backgroundand Forecasted Local and Regional Impacts
The balance of naturally occurring gases dispersed inthe Earth’s atmosphere determines our climate by trap-
ping solar radiation—a phenomenon known as thegreenhouse effect. Overwhelming evidence indicates that
modern human activity is artificially intensifying the green-house gas effect, and that global average surface temperaturesare rising. This intensification is caused by natural processes andhuman activities that release carbon dioxide and other green-house gases into the atmosphere—most notably the burning offossil fuels for transportation, electricity, and heat generation. iii
Over the past 100 years, there have been noticeable effects ofglobal climate change in the District of Columbia. Increasing tem-peratures, sea and river level rise, altered precipitation trends andmore frequent and severe storms have all been recorded in theDistrict, and are projected to continue into the future. This sectionsummarizes environmental trends such as temperature and pre-cipitation in and around the District.
Since 1907, average annual temperatures in the District have in-creased by approximately 3.3°F. These local temperature trendscoincide with regional trends, although the magnitude of changein the Washington metro area is greater. Based on the averagetemperatures and depending on the emissions scenario, the en-
14 Climate of Opportunity: A Climate Action Plan for the District of ColumbiaDraft for Community Discussion
2
Milestone 1InventoryEmissions
Milestone 2Establish
Target
Milestone 3DevelopClimate
Action Plan
Milestone 4Implement
ClimateAction Plan
Milestone 5Monitor/EvaluateProgress
LeadershipCommitment
The District Government is using a climateplanning process developed by ICLEI—LocalGovernments for Sustainability. A non-profitmembership organization representing over500 cities and local governments, ICLEI hasglobal expertise in assessing climate im-pacts, devising specific measures to reduceemissions, and providing local jurisdictionswith comprehensive Climate Action Plans. InJanuary 2010, the District reached Milestone1 with the release of the Greenhouse Gas In-ventory detailing our “carbon footprint,”against which our efforts to reduce climateemissions will be measured. This draft Cli-mate Action Plan represents progress to-ward Milestones 2 and 3.

15
tire Mid-Atlantic region is ex-pected to warm by 2-3°F by2030 and 4-10°F by the end ofthe century. Temperature in-creases in the District of Co-lumbia are likely to be higherthan those in the surroundingregion due to the urban heatisland effect. iv
While there has been very littlechange in the amount of aver-age annual precipitation in theDistrict over the last 100 years,less precipitation is falling assnow. Both Maryland and Vir-ginia have experienced trendsof increasing precipitation overthe past 100 years, withgrowth rates of 0.27 inches perdecade and 0.31 inches perdecade, respectively. v Finally,the increasing intensity andfrequency of extreme weatherevents may be the most dramatic indicator of global climate change. Relative to theprevious century, there have been 12% to 20% more major weather events in the Mid-Atlantic region. vi
The global rate of sea level elevation, another ongoing result of global climate change,is 0.08 inches per year, while the Chesapeake Bay rate is 0.14 inches per year. vii Thehigher rate of sea level rise is the result of land subsidence or the erosion of land intothe sea, which accounts for roughly half the Mid-Atlantic regional sea level rise. The Po-tomac River has risen about one foot since 1933, most noticeably around the TidalBasin. viii Sea level rise is projected to increase by 24-48 inches over the next centuryalong the Chesapeake Bay as a result of the melting of polar ice caps combined withthe thermal expansion of sea water. A commensurate rise in sea level will occur alongthe Potomac and Anacostia Rivers as well as Rock Creek over the next century, as allthree waterways are tidal and respond to rises in sea levels. ix, x Between 1.74-2.55square miles of District land lies below 40 inches in elevation, land that is highly vul-nerable to sea level rise and could potentially become inundated by the year 2100. Atotal of 3.42 square miles are below 140 inches in elevation, and this land will be moresusceptible to episodic flooding and storm surges. xi For instance, land around the TidalBasin and the Jefferson Memorial in particular is in danger of inundation if long-termprojections are realized.
Climate of Opportunity: A Climate Action Plan for the District of ColumbiaDraft for Community Discussion
Source: http://www.epa.gov/climatechange/downloads/Climate_Basics.pdf

The District Department of the Environment, in partnershipwith ICLEI and sister agencies across the government,completed a District Greenhouse Gas Emissions Inventoryin January 2010. Also known as a “carbon footprint,” the In-ventory estimates the total amount of carbon dioxide andother greenhouse gas emissions released into the atmos-phere as a result of energy consumption, vehicle use andother activities. Evaluating our greenhouse gas inventory isbest understood as placing a “bubble” over the city andcounting greenhouse gas emissions attributed to activitiesthat occur within the bubble (i.e., the District’s boundaries).
The Inventory estimates emissions attributed to both gov-ernment operations and broader community activitieswithin the District during calendar year 2006 (selected asour “baseline” year because of superior data quality andaccuracy). The community inventory includes estimatedgreenhouse gas emissions from all building energy use, ve-hicles fuel use and transportation, and emissions fromwaste streams. The government operations inventory,which is a subset of the community inventory, provides amuch more in-depth analysis of emissions from the DistrictGovernment, including government-operated facilities andstreetlights, vehicle fleet and off-road equipment, andwaste generated by government operations.
3.1 Community Emissions Summary
In calendar year 2006, our city-wide greenhouse gas emis-sions from electricity consumption and other direct sourcestotaled 10.5 million metric tons of carbon dioxide equiva-lents (CO2e), or 18 tons per resident. This amount is belowthe U.S. Environmental Protection Agency’s national aver-age of 19.7 tons per person, but higher than other majorcities. Figure 3.1 provides a breakdown of emissions bysector, including: buildings (residential, non-residential, andfederal); vehicles (indicated as VMT or vehicle miles trav-eled); mass transit (Metro); and waste. With 75% of ourgreenhouse gas emissions linked to buildings, our most ef-fective emissions reduction actions will target comprehen-sive energy use reduction in buildings. Figure 3.2 providesa breakdown of the specific energy sources of our green-house gas emissions, including electricity, natural gas, fueloil, vehicle fuel (gasoline and diesel), kerosene, and emis-sions from solid waste. Electricity consumption is ourlargest driver of greenhouse gas emissions.
Of the total emissions accounted for in this inventory, emis-sions from the Non-Residential sector were the largest(51% as shown in Table 3.1 and Figure 3.1). The Residen-
16 Climate of Opportunity: A Climate Action Plan for the District of ColumbiaDraft for Community Discussion
Table 3.1 2006 CommunityEmissions by Sector Sector Total (metric tonsSector CO2e)Non-Residential 5,401,510Vehicle Miles Traveled 2,261,338Residential 1,517,011Federal - GSA 963,178Solid Waste 185,991Transit – Metro 176,918
Non-ResidentialBuildings 51%
FederalBuildings9%
Vehicles 22%
Transit – Metro 2% Waste 2%
ResidentialBuildings14%
Figure 3.1 2006 Community Emissions by Sector
Electricity 58%
NaturalGas15%
VMT –gasoline18%
Fuel oil 4%
VMT – diesel 3% Municipal Solid Waste 2%
Figure 3.2 Community Emissions by Source
3 The Greenhouse GasEmissions Inventory

17
tial sector was responsible for 14% of community emis-sions, with a total of 1.5 million metric tons of CO2e. Fed-eral facilities managed by GSA accounted for 9% ofemissions, with a total of 963,000 metric tons of CO2e. Be-tween Residential, Non-Residential, and Federal facilities,emissions from buildings consisted of 74% of communityemissions. Emissions from the Vehicles sector were 2.3 mil-lion metric tons of CO2e, or 22% of total community emis-sions. Emissions from Metro were culled from theNon-Residential sector and were 2% of the communitytotal, with 177,000 metric tons of CO2e. Finally, emissionsfrom the Solid Waste sector accounted for an estimated186,000 metric tons of CO2e, also 2% of the communitytotal.
3.2 Government Operations Emissions
During the 2006 calendar year, the District’s governmentoperations direct emissions, emissions from electricity con-sumption, and select indirect sources totaled 720,000 met-ric tons of CO2e. xii Of the total emissions accounted for inthis inventory, the greatest levels of emissions were from Buildings & Other Facilities(at 59%) and wastewater facilities (at 23%) of government operations emissions.
District Government agencies that reported costs and DC Water spent a cumulative$124,420,635 on energy for their operations in 2006 (the true figure is higher as cost in-formation was not universally reported). Of this total, 59% ($82,953,877) resulted fromBuildings & Other Facilities. See figures 3.3, 3.4, 3.5 and Table 3.2 for more detailed in-formation.
Climate of Opportunity: A Climate Action Plan for the District of ColumbiaDraft for Community Discussion
Buildingsand OtherFacilities 59%
WastewaterFacilities23%
Streetlightsand TrafficSignals6%
Vehicle Fleet 7% Employee Commute 5% Solid Waste 0.1%
Figure 3.3 Government Operations Emissions by Sector
Table 3.2 2006 District Government Operations Emissions by Sector Sector Total Percentage (metric tons of Total CO2e) Emissions Annual CostBuildings & Other Facilities 429,301 59% $82,953,877Wastewater Facilities 163,454 23% $26,178,745Streetlights & Traffic Signals 45,586 6% $6,371,499Vehicle Fleet & Off-Road Equipment 47,829 7% $8,916,514Employee Commute 33,101 5% n/aGovernment-Generated Solid Waste 625 0.1% n/aTotals 719,896 100% $124,420,635

In addition to reducing greenhouse gases, any future reductions in municipal energyconsumption will have the potential to reduce these costs, enabling the District to re-allocate funds toward other municipal services to support future energy conservationand environmental protection activities.
18 Climate of Opportunity: A Climate Action Plan for the District of ColumbiaDraft for Community Discussion
Electricity$40,422,83042%
Natural Gas$36,811,07937%
Fuel Oil$2,920,8973%
Steam$2,799,0713%
Vehicle Fuels$8,916,514 9%
Street Lighting and Traffic Signals$6,371,499 6%
Figure 3.5 2006 District Government Operations Energy Costs per Source
Electricity 63%Natural Gas18%
Gasoline8%
Steam 5% Solid Waste0.1%
Diesel 3%
Fuel Oil 3% Wastewater Treatment 1% Refrigerants 0.2%
CompressedNatural Gas 0.2%
Figure 3.4 Government Operations Emissions by Source
Foreground: The NationalAssociation of RealtorsHeadquarters, a LEED certifiedgreen building.

19
Forecasting emissions growth is an essential component of developing an emissions in-ventory —without a projection of emissions growth it is impossible to make the informeddecisions required to set reduction targets and develop a specific climate action plan.Emissions forecasts assume a “business as usual” scenario in which emissions per unitof energy stay constant, but overall emissions increase as population and employmentgrowth is factored in. Thus, any changes to vehicle fuel efficiency or electricity emissionsfactors, such as through the provision of renewable energy, are not included in the busi-ness as usual forecast. Rather, these measures are accounted for as part of the climateaction plan to meet the emissions reduction target.
4.1 Community Forecast
The District’s 2006 community emissions were estimated as a total of 10.5 million met-ric tons of CO2e. Table 4.1 and Figure 4.1 show projected growth in these emissions
Emissions Growth Forecasts
Climate of Opportunity: A Climate Action Plan for the District of ColumbiaDraft for Community Discussion
4
Table 4.1 Forecasted Community Greenhouse Gas Emissions (Metric Tons CO2e) 2006 2012 2020 2050 Non-Residential Buildings 5,401,510 5,694,599 6,136,174 7,099,214 Vehicles 2,261,338 2,379,896 2,596,876 3,232,046 Residential Buildings 1,517,011 1,596,545 1,742,106 2,168,208 Federal Buildings 963,178 1,015,441 1,094,181 1,265,907 Solid Waste 185,991 195,742 213,588 265,830 Transit - Metro 176,918 186,194 203,170 252,863 Totals 10,505,946 11,068,416 11,986,095 14,284,067
Figure 4.1 Business as Usual Forecast for Community Greenhouse Gas Emissions (metric tons CO2e)
0
3
9
12
15
2006
Mill
ions
of m
etric
tons
CO 2
e 10,505,94611,068,416
11,986,095
14,284,067■ Non-residential buildings ■ Vehicles ■ Residential buildings■ Federal buildings ■ Solid waste ■ Transit–metro
2012 2020 2050
DistrictPopulation 588,292 619,135 675,582 840,824

through 2050. Emissions are forecasted to increase by 2050 to 14 million metric tonsof CO2e, an increase of approximately 23% under a “business as usual” scenario. Thegrowth scenarios shown are based on projections of increases population, employ-ment and vehicle use developed by the Washington Metropolitan Council of Govern-ments.
4.2 Government Operations Forecast
The District’s 2006 government operations emissions were estimated as a total of720,000 metric tons of CO2e. Table 4.2 and Figure 4.2 show projected growth in theseemissions through 2050 using high, medium and low efficiency scenarios that incor-porate growth in population. Under the medium efficiency scenario, emissions are fore-casted to increase by 2050 to 888,000 metric tons of CO2e, an increase ofapproximately 27% under a “business as usual” scenario. xiii
The three growth scenarios shown in Table 4.2 are based, in part, on projections of in-creases in employee efficiency – 0.5% annually under high efficiency, 0.25% undermedium efficiency, and no increase in efficiency under the low efficiency scenario.
20 Climate of Opportunity: A Climate Action Plan for the District of ColumbiaDraft for Community Discussion
Table 4.2 Forecasted Greenhouse Gas Emissions for District Government Operations (Metric Tons CO2e) 2006 2012 2020 2050District Population 588,292 619,135 675,583 840,824District Government Emissions –Low Growth Scenario 719,896 731,087 737,421 794,866District Government Emissions –Medium Growth Scenario 719,896 742,178 763,788 887,659District Government Emissions –High Growth Scenario 719,896 753,408 791,028 991,011
Figure 4.2 Forecasted Greenhouse Gas Emissions for District Government Operations (metric tons CO2e)
6
DistrictPopulation
8
10
2006
Met
ric to
ns C
O 2e
(x10
0,00
0)
588,292 619,135 675,582 840,824
2012 2020 2050
Low Efficiency ScenarioMedium Efficiency ScenarioHigh Efficiency Scenario

21
Setting emissions reduction targets is Milestone 2 of ICLEI’s Five Milestones for Cli-mate Protection. The emissions reduction target is the percentage by which a localgovernment plans to reduce greenhouse gas emissions from government operationsbelow base year levels by selected future target years. The District has chosen to setaggressive short-term, mid-term and long-term targets. Short-term targets help toclosely monitor progress and build momentum, while long-term targets set the bar forthe ultimate achievement in emissions reductions.
The District’s proposed Government Operations plan would reduce emissions by20% below 2006 levels by 2012, 30% below 2006 levels by 2020, and 80% below2006 levels by 2050. These target years are consistent with local and national targetyears. The reduction targets are more aggressive than many peer jurisdictions in theshort term, and consistent with current scientific estimates of necessary emissions re-ductions in the long term. The 2012 and 2020 targets are aggressive but achievablebased on measures the District Government has implemented, planned or proposed.
Figure 5.1 (next page) depicts the relationship between the forecasted growth in emis-sions from 2006 to 2050 and the estimated impact the climate action plan measureswill have on reducing emissions.
Climate of Opportunity: A Climate Action Plan for the District of ColumbiaDraft for Community Discussion
Greenhouse Gas EmissionsReduction Targets
5
Table 5.1 Government Operations Emissions Reduction Target Comparison to Other Cities BaselineJurisdiction Year Short Term Mid Term Long TermNew York City 2005 n/a 30% by 2030 n/aSeattle 1990 7% by 2012 30% by 2024 80% by 2050Boston 1990 7% by 2012 n/a 80% by 2050Baltimore 2007 15% by 2015 n/a n/aWashington, DC 2006 20% by 2012 30% by 2020 80% by 2050Denver 2004 n/a 30% by 2020 80% by 2050Metropolitan 2005 10% by 2012 20% by 2020 80% by 2050Washington Councilof Governments

What are the realistic options for community targets and mitigation measures? Theseare the answers we will develop together during the community engagement process.There are, however, examples and guidelines for us to refer to. Based on the assump-tions and measures discussed in the report, the District as a community could striveto meet or exceed the regional goals already adopted by Metropolitan WashingtonCouncil of Governments to reduce emissions by 10% in 2012, 20% in 2020, and 80%in 2050. xiv
22 Climate of Opportunity: A Climate Action Plan for the District of ColumbiaDraft for Community Discussion
Met
ric to
ns C
O 2e
(mill
ions
)
1
0.8
0.6
0.4
0.2
02006
Forecasted GrowthImpact of Actions
2012 2020 2050
Figure 5.1 Forecasted Emissions Growth and Impact of Government Operations Actions
719,896
568,414
742,178
440,740
763,788
217,262
887,659
Met
ric to
ns C
O 2e
(mill
ions
)
1.6
1.4
1.2
1
0.8
0.6
0.4
0.2
02006
Forecasted GrowthImpact of Actions
2012 2020 2050
Figure 5.2 Forecasted Emissions Growth and Impact of Community Actions
10,505,946
9,455,3518,404,757
2,101,189
11,068,41611,986,095
14,284,067

23
Through the actions detailed in this plan, the District can reduce its emissions, be-come more energy independent, and ensure resiliency in the face of the climate changethat is already underway. The District Government has direct control over many sourcesof emissions that result from the daily operation of government buildings, vehicles,water and wastewater treatment facilities, street lights, and waste disposal. The Dis-trict Government is pursuing number of progressive initiatives, and this plan fo-cuses on the high-impact efforts that will allow the District of Columbia to meetgovernment operations emissions reduction targets of 20% by 2012, 30% by2020, and 80% by 2050.
6.1 Government Operations Measures to Reduce EmissionsThe Draft Climate Action Plan includes a combination of existing policies and pro-grams and new ideas based on best practices from around the country. They are di-vided into five categories that correspond to sectors examined as part of the District’sGreenhouse Gas Emissions Inventory:
• Buildings• Transportation• Street Lighting• Water and Wastewater• Solid Waste
Government operations measures are specific to the day-to-day operations of the Dis-trict Government. They apply to buildings the District Government owns or leases, ve-hicles used to provide services such as police protection and waste collection, lightingof roadways, water distribution and treatment of wastewater, and disposal of solidwaste generated at District Government facilities. Collectively, these activities resultedin emissions totaling 720,000 metric tons of CO2e in the 2006 base year.
The impact of the measures in each sector varies with the size of the sector. Table 6.1shows the relative impact of each sector towards the District Government’s overall re-duction. The figures below are for 2020, and the percentages for 2012 and 2050 arecomparable. As Table 6.1 indicates, the emissions reductions projected to be achievedby this draft plan in each sector are roughly proportional to the contribution of eachsector towards the emissions baseline (shown in Table 4.1 and Figure 4.1).
The Climate Action Plan
Climate of Opportunity: A Climate Action Plan for the District of ColumbiaDraft for Community Discussion
6
Table 6.1 Comparison of Government Operations Emissions Profile to Emission Reductions Achieved by Proposed Mitigation Measures Government Proposed Greenhouse Gas Greenhouse GasSource Emissions % Reduction Measures %Buildings 59 63Vehicle Fleet and Employee Commute 12 11Street Lights & Traffic Signals 6 3Wastewater Treatment 23 23Waste and Recycling 0.1 0.1
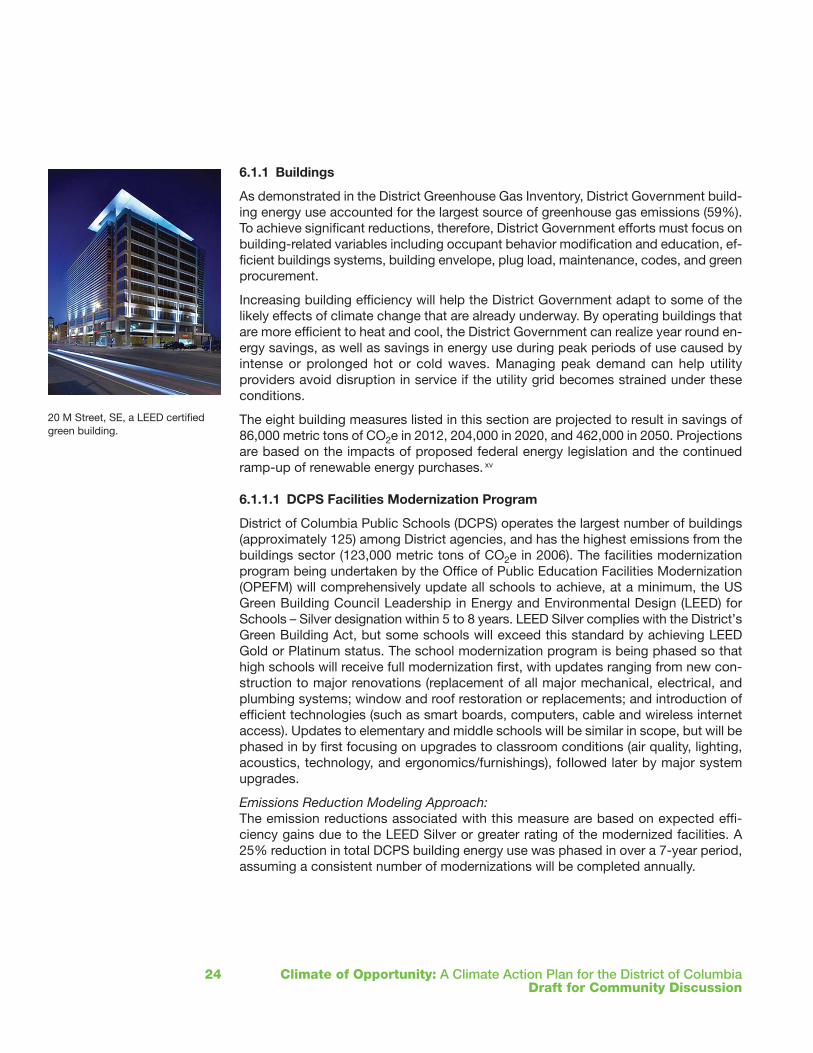
6.1.1 Buildings
As demonstrated in the District Greenhouse Gas Inventory, District Government build-ing energy use accounted for the largest source of greenhouse gas emissions (59%).To achieve significant reductions, therefore, District Government efforts must focus onbuilding-related variables including occupant behavior modification and education, ef-ficient buildings systems, building envelope, plug load, maintenance, codes, and greenprocurement.
Increasing building efficiency will help the District Government adapt to some of thelikely effects of climate change that are already underway. By operating buildings thatare more efficient to heat and cool, the District Government can realize year round en-ergy savings, as well as savings in energy use during peak periods of use caused byintense or prolonged hot or cold waves. Managing peak demand can help utilityproviders avoid disruption in service if the utility grid becomes strained under theseconditions.
The eight building measures listed in this section are projected to result in savings of86,000 metric tons of CO2e in 2012, 204,000 in 2020, and 462,000 in 2050. Projectionsare based on the impacts of proposed federal energy legislation and the continuedramp-up of renewable energy purchases. xv
6.1.1.1 DCPS Facilities Modernization Program
District of Columbia Public Schools (DCPS) operates the largest number of buildings(approximately 125) among District agencies, and has the highest emissions from thebuildings sector (123,000 metric tons of CO2e in 2006). The facilities modernizationprogram being undertaken by the Office of Public Education Facilities Modernization(OPEFM) will comprehensively update all schools to achieve, at a minimum, the USGreen Building Council Leadership in Energy and Environmental Design (LEED) forSchools – Silver designation within 5 to 8 years. LEED Silver complies with the District’sGreen Building Act, but some schools will exceed this standard by achieving LEEDGold or Platinum status. The school modernization program is being phased so thathigh schools will receive full modernization first, with updates ranging from new con-struction to major renovations (replacement of all major mechanical, electrical, andplumbing systems; window and roof restoration or replacements; and introduction ofefficient technologies (such as smart boards, computers, cable and wireless internetaccess). Updates to elementary and middle schools will be similar in scope, but will bephased in by first focusing on upgrades to classroom conditions (air quality, lighting,acoustics, technology, and ergonomics/furnishings), followed later by major systemupgrades.
Emissions Reduction Modeling Approach:The emission reductions associated with this measure are based on expected effi-ciency gains due to the LEED Silver or greater rating of the modernized facilities. A25% reduction in total DCPS building energy use was phased in over a 7-year period,assuming a consistent number of modernizations will be completed annually.
24 Climate of Opportunity: A Climate Action Plan for the District of ColumbiaDraft for Community Discussion
20 M Street, SE, a LEED certifiedgreen building.
25
6.1.1.2 50 Percent Renewable Electricity Contract
The Municipal Aggregation Program (MAP) is a reverse auction that allows Districtagencies and DC Water to buy electricity jointly. The current MAP is a two year con-tract that expires at the end of calendar year 2011. For a very small cost premium, thecurrent power contract boosts purchase of renewable electricity from the previous rateof 10% to 50%. The rate of renewable energy uptake beyond 2011 is not known.
Emissions Reduction Modeling Approach:The MAP was modeled at four different levels of renewable purchases – 5%, 10%,25%, and 50%. Emissions savings were arrived at by altering the eGRID emissionsfactor for the RFC East sub-region to increase the renewable energy proportion of theelectricity grid mix to a rate corresponding to the percentage purchased under theMAP. For calculation purposes, it was assumed that the renewable capacity being pur-chased under the MAP was being generated within the RFC East eGRID sub-region.
6.1.1.3 Public Housing Retrofits
As the District’s largest landlord, the District of Columbia Housing Authority (DCHA) hasundertaken an aggressive campaign to improve the energy efficiency of its 8,000 res-idential units. To date, the program, begun in 2004, has resulted in the retrofitting of ap-proximately 5,400 units in 31 properties.
Retrofits have included updated energy efficient boilers and chillers, low flow shower-heads and faucets, replacement or restored windows, low VOC paint, energy star ap-pliances, and high efficiency lighting. Additionally, one green roof with rain cisternsand photovoltaic water heat has been installed (at Regency House in Northwest). Theprojected energy savings from these improvements include a 13% reduction in elec-tricity usage, a 30% reduction in water usage, and a 26% reduction in gas usage, re-sulting in as much as $3.9 million in annual average utility savings. Projected operationsand maintenance savings from these improvements are projected to be $2.4 million.”
Emissions Reduction Modeling Approach:The emission reductions associated with this measure are based on measured effi-ciency gains of the modernized facilities, and projects that all 8,000 units will be mod-ernized to the same standards by 2020.
6.1.1.4 Building Management Systems & Commissioning
This measure capitalizes on American Reinvestment and Re-covery Act (ARRA) funding that the District Government hasreceived. Under ARRA, the District will receive more than $30million in energy efficiency and conservation funding including$22,022,000 through the State Energy Program (SEP), and$9,593,500 through the Energy Efficiency and ConservationBlock Grant program (EECBG). Of the combined funds,$23,729,690 will go to District Government agencies withbuildings and other infrastructure in their capital portfolios thatare in need of energy efficiency improvements.
The Department of Real Estate Services has contracted to con-duct energy audits of all buildings in the District government
Climate of Opportunity: A Climate Action Plan for the District of ColumbiaDraft for Community Discussion
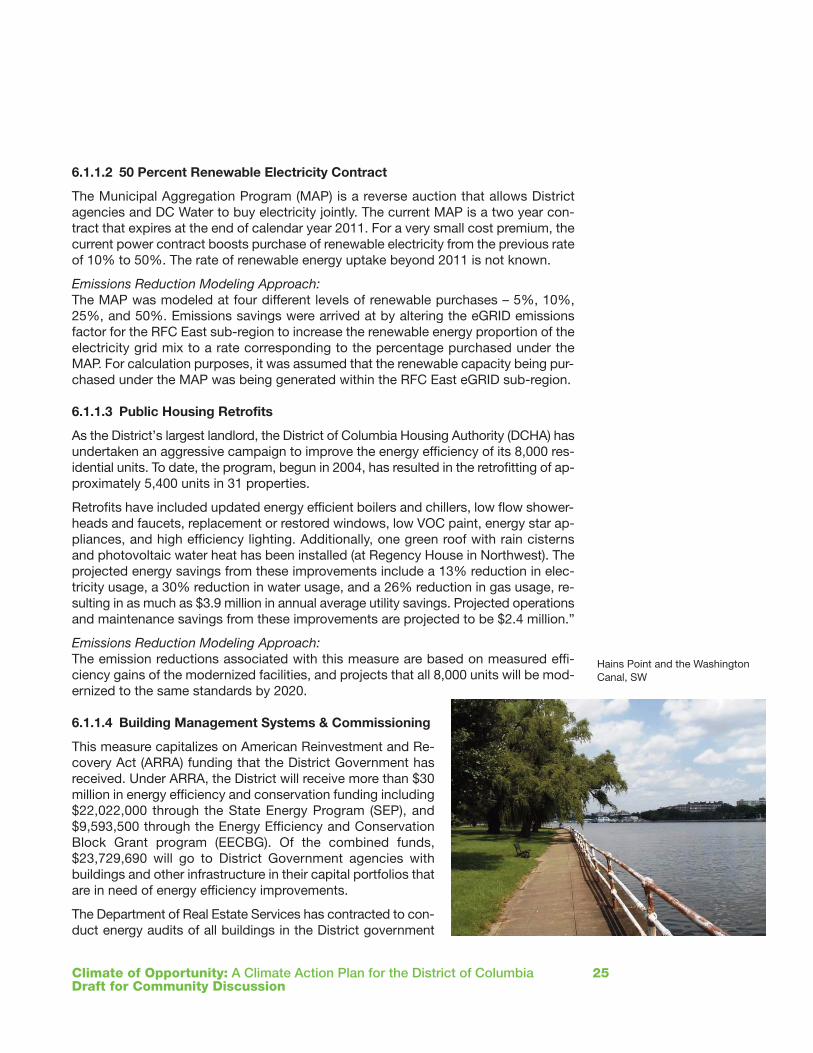
Hains Point and the WashingtonCanal, SW

portfolio by 2012. During the second phase of this measure upgrades and retrofits ofbuilding systems will be designed and installed.
Emissions Reduction Modeling Approach:This measure was modeled by compiling energy consumption for all District Govern-ment buildings (excluding DCHA and DC Water) and reducing consumption by 10%against the 2006 baseline in 2012 to reflect the impact of the SEP/EECBG funding.For 2020, the energy consumption was reduced by 25% against the 2006 baseline toreflect capital expenditures that could result from the findings of these comprehensiveaudits.
6.1.1.5 Staff Training & Education to Reduce Plug Load
District Government employees have a direct impact on the amount of energy beingused in the office environment, as employees can control the lights, computers andother electronic equipment at their work stations. More than a third of the District Gov-ernment's energy use comes from electronic equipment plugged into wall sockets, in-cluding devices such as fans and personal heaters that use significantly more energythan efficient desktop computers and desk lamps. This measure builds on training pro-grams managed by the Department of Real Estate Services (DRES) that are already un-derway to encourages occupant behavior modifications that encourage employees,teachers and students to reduce their energy consumption in District facilities. Thefocus of the DRES Energy Conservation Campaign is to reduce the number of per-sonal items being used in workspaces.
Emissions Reduction Modeling Approach:This measure was modeled based on a 50% reduction in plug load from personal de-vices in DRES facilities by 2020, or a 5% reduction annually. Personal devices were as-sumed to represent 5% of overall plug load.
6.1.1.6 Leased Space Efficiency Improvements
The Department of Real Estate Services (DRES) leases approximately four millionsquare feet of office space to house District Government personnel. The average lengthof a lease is ten years, so when leases expire there are opportunities to relocate staffinto more efficient office space. In 2010 and beyond, there will be significant turnoverin District government office space, providing opportunities to improve efficiencythrough the leasing of more energy efficient buildings.
Emissions Reduction Modeling Approach:DRES will be moving District Government staff into more than 518,000 square feet ofLEED office space in 2010, which is roughly 13% of total leased square footage. It isassumed that this space will be 25% more efficient than the space it is replacing. Thetotal amount of LEED leased space is modeled to increase to 50% in 2020 and 100%in 2050, yielding additional savings as new leases replace leases in less energy-efficientproperties.
6.1.1.7 Server Consolidation
Currently the District Government maintains information technology (IT) data serversin five locations throughout the city. An initiative currently underway will consolidatethese servers into two data centers, using new, highly efficient servers that will use
26 Climate of Opportunity: A Climate Action Plan for the District of ColumbiaDraft for Community Discussion

27
approximately 30% less energy. District Government staff will also have tighter controlover the servers, resulting in better energy management as servers can be cycled offwhen not being utilized and cooling systems can be configured more efficiently.
Emissions Reduction Modeling Approach:The quantification for this measure considers only the savings that will occur as a re-sult of installing more energy efficient IT servers. While other energy savings are antic-ipated with the consolidation, it is not possible to estimate these using available data.These estimated savings are considered conservative, since only a portion of the po-tential energy savings are included. The estimated energy savings are based upon cal-culating the existing server count and the expected consumption of each standardserver, and applying a 30% reduction to that figure to compute the energy savings.
6.1.1.8 Computer Workstation Efficiency Projects
Since 2007, new computers purchased by the District Government are required to beENERGY STAR rated as part of the District’s Environmentally Preferable Purchasing Pol-icy. When in use, these computers save substantial amounts of energy compared to stan-dard units. In addition, the Office of the Chief Technology Officer (OCTO) has initiated theLanDesk program, providing the capability to remotely enable any participating Districtagency computer’s “sleep” settings, or to power down the machine completely during pe-riods of disuse. The combined effect of these two measures will be to substantially reducethe energy used for District government computing during working hours, and to elimi-nate as much energy use as possible from computers that are not in operation.
Emissions Reduction Modeling Approach:Quantification of this measure takes into account the efficiency of the various types ofmachines (from desktop to laptop models) and the amount of time they typically spend
Climate of Opportunity: A Climate Action Plan for the District of ColumbiaDraft for Community Discussion
Watts Branch in MarvinGaye Park, NE
in use. The calculation for determining the total reductions from ENERGY STAR com-puters calculates the difference in the average wattage ENERGY STAR computersdraw in active mode (compared to a standard computer) and multiplies that amount bythe number of computers and the annual working hours per machine.
For the LanDesk program, reductions are based on totaling the number of computersin the program and calculating the difference in power consumption from “active” to“sleep” mode (during the period between 5:00am and 9:00pm), and the difference inpower consumption from “sleep” mode to “off” (between 9:00pm and 5:00am) for eachworkday and 24 hours for all non-workdays in a year. This calculation assumes that thenumber of users who had previously enabled the sleep settings on their computerswas 36% of the total, consistent with EPA assumptions. It also assumes that the pro-gram only affects desktop computers at each agency, since this is likely the majorityof participating computers and exact figures are not known. This model recognizesthe fact that as the District Government purchases more efficient computers, the mar-ginal benefit of this program will lessen, even though it still contributes to substantialsavings. Emissions benefits are calculated by applying the emissions factor for gridelectricity in the District to the amount of electricity saved.
6.1.2 Transportation
During the 2006 calendar year, emissions from the District Government vehicle fleetand mobile equipment were 48,000 metric tons of CO2e (7% of the total for all gov-ernment operations). Emissions from the Employee Commute sector (personal vehiclesused by District Government staff to commute to and from work) were estimated at
33,000 metric tons of CO2e (5% of government emissions).Strategies to reduce emissions from District Government ve-hicles can include reducing the size of the fleet, increasing fuelefficiency, and reducing miles traveled. The District Govern-ment is currently undertaking initiatives that pursue each ofthese strategies, and has made significant progress in reduc-ing emissions from the vehicles sector. The widespread avail-ability of transit in the District makes that mode an attractivealternative for employee commuting. Vehicle trips for Districtgovernment business average approximately 12 miles per trip,which makes electrification of the District Government’s light-duty fleet an attractive option once that technology maturesand becomes more cost-effective.
The five measures listed in the transportation section of thisplan are projected to result in savings of 29,000 metric tons ofCO2e in 2012, 36,000 in 2020, and 44,000 in 2050. Projections
are based on the impacts of tightened CAFE standards (and the continued ramp-up ofrenewable fuels purchases). The savings enumerated above include measures that willimpact both the vehicles and employee commute.
28 Climate of Opportunity: A Climate Action Plan for the District of ColumbiaDraft for Community Discussion
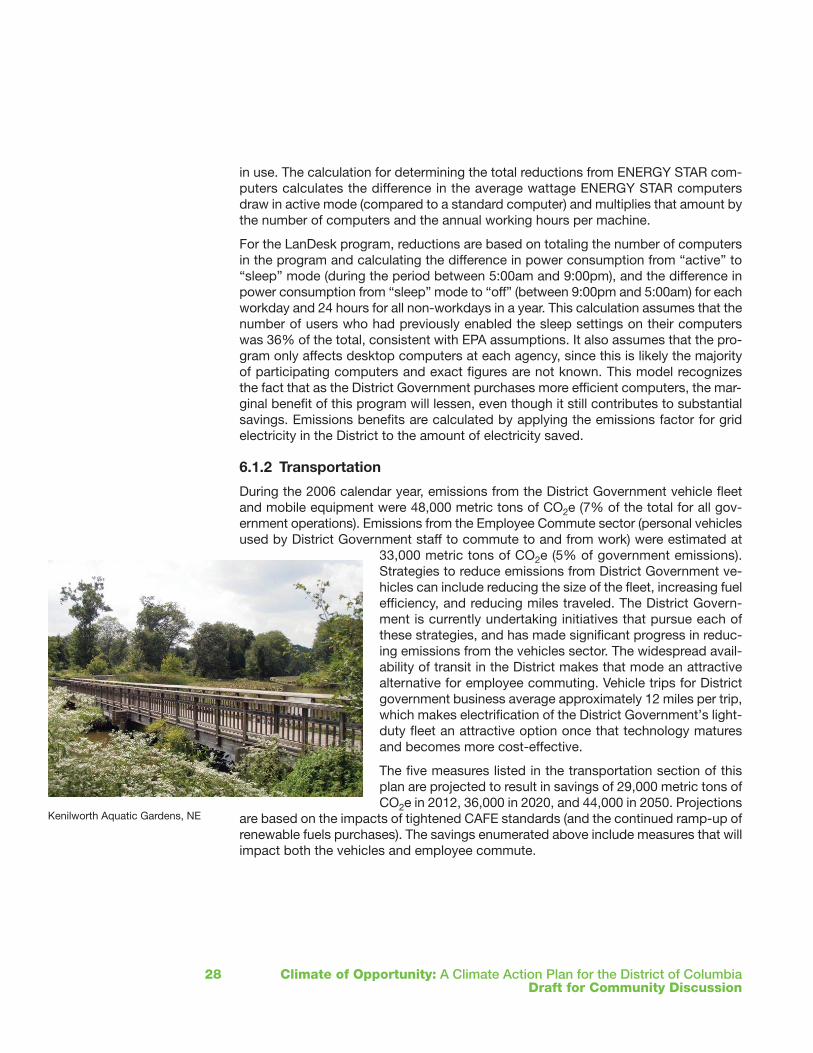
Kenilworth Aquatic Gardens, NE

29
6.1.2.1 District Government Employee Commute Benefit
District of Columbia Human Resources (DCHR) provides transit incentives, flexiblework schedules, virtual meetings/work-from-home options, carpool/vanpools, en-hanced bicycle access and parking and othermeasures to provide attractive alternatives tosingle-car-occupant driving and parking. Districtagencies will continue to choose locations thatare near mass transit to encourage more com-muting by bus, rail and streetcar, and will includeCapital Bikeshare stations near their leased andowned properties to encourage employee par-ticipation in the bike sharing network for us forshort trips. Financial incentives may include re-duced or free transit passes, reduced or freeparking for carpools, vanpools, and electric orhybrid vehicles.
Emissions Reduction Modeling Approach:Emissions reductions for this measure calculatethe amount of commuting vehicle miles traveledper year by District employees, using data fromthe District Government Employee CommuteSurvey, and projecting mode shifting by those in-dividuals in the amounts of 20% by 2012, 40%by 2020, and 62% by 2050, eventually matching the current participation rate amongunion employees to which the program is currently available.
6.1.2.2 Employee Car Sharing Program
The District Government now utilizes a Fleetshare vehicle sharing program for Districtbusiness travel, but can also facilitate private car sharing by District employees withaccess to street and public space parking and maintenance. The District can increasecar sharing through collaboration with car sharing organizations like Zipcar to make carsharing more visible, convenient, and available. Identification of the most appropriatelocations for the cars based on demand and proximity to public transportation hubs willhelp to grow the program. The District can further help by contributing start-up funds,assisting in promotion, and by providing increased free parking spaces.
Emissions Reduction Modeling Approach:For this calculation, reductions in total vehicle miles traveled (VMT) are estimated byincreasing the number of District employee carshare participants to 3,600 by year2050, multiplied by average commute length and the average percent reduction in driv-ing that carshare participants achieve when they give up owning a car. Emissions sav-ings in each analysis year are driven by both the reduction in VMT and the average fueleconomy of the cars in that year, totaling 658 metric tons CO2e in 2012. Projections to2020 and 2050 reflect higher anticipated fuel economy in those years which creates asmaller reduction per person. However with the number of anticipated additional par-ticipants in those years the total emissions reduction figures continue to grow to 861and 1,962 metric tons CO2e in 2020 and 2050 respectively.
Climate of Opportunity: A Climate Action Plan for the District of ColumbiaDraft for Community Discussion
Phelps High School WindGeneration Pilot, NE

6.1.2.3 Electric Vehicle Usage
The District Government will pilot and expand use of electric vehicles and developmentof electric charging infrastructure. The District Department of Transportation and otheragencies will begin pilots when electric vehicles are commercially available. DC Waterplans to replace 79 utility vehicles used on the Blue Plains campus with neighborhoodelectric vehicles (NEVs). To date, 10 utility vehicles have been converted, 20 are bud-geted for conversion in 2010, and 20 more in 2011, bringing the total conversion toabout 65% of the utility vehicles by 2012. For this calculation it is projected that therewill have been 200 replacements by 2020 and 350 replacements by 2050 throughoutthe rest of the District Government Fleet.
Emissions Reduction Modeling Approach:Calculations for this measure include first determining the amount of gasoline relatedemissions that would be saved by replacing gasoline powered vehicles with electricones. For this estimation, the 2012 calculation is based on the average annual mileageof District fleet vehicles and their current average fuel economy. The reduction in gaso-line emissions is tempered by increased emissions associated with using electricityas a substitute fuel. This is calculated using the same number of miles traveled and angasoline equivalent miles per gallon of an electric vehicle in terms of kWh per mile.The total reduction in 2012 is estimated at 61 metric tons of CO2e. In projecting to2020 and 2050, changes in the base fuel economy of the vehicles replaced as well asthe carbon intensity of grid electricity must be included. The best reference for both ofthese changes comes from the VISION model from Argonne National Labs. In 2020, thebase vehicle fuel economy increases to 28.22 mpg, while there is no significant changereported in the carbon intensity of the grid. The result is that the incremental benefit ofeach vehicle replacement is less and thus the total reduction (69 metric tons of CO2e)is only slightly more with now 200 electric vehicles than it was for the 79 initial vehi-cles. In 2050 the VISION model projects an average on road mpg of 34.98. Under the“renewables” scenario, which is in line with other projections in this report, the carboncontent of grid electricity has decreased by 61%. With cleaner grid electricity, thedownside of increasing electricity use is much less, which explains the much moresignificant impact of 193 metric tons of CO2e from the action in 2050.
6.1.2.4 Metropolitan Police Department Cruiser Fleet Right-Sizing
The Metropolitan Police Department (MPD) operates the largest fleet in the Districtgovernment, both in terms of absolute number of vehicles (1,686 in 2006) and gallonsof fuel consumed (1,714,000 gallons of gasoline). This measure addresses marked andunmarked cruisers (1,184 in 2006) in the patrol fleet that use the majority of the fuel(1,350,000 gallons of gasoline). The “right-sizing” of this fleet consists of replacing V8-powered Ford Crown Victoria cruisers with more fuel efficient V6-powered ChevroletImpalas, and with more fuel efficient models in future years.
Emissions Reduction Modeling Approach:Several assumptions were made in modeling the emissions reductions associated withthis measure. It was assumed that 85% of the MPD cruiser fleet in 2006 was comprisedof Ford Crown Victorias, and that 30% of Crown Victorias would be phased out in 2012,increasing to 100% by 2020. Additionally, reductions in fuel use were calculated by ap-plying the difference in EPA average fuel efficiency between the two models (Impalas are26% more efficient) to the projected vehicle mix in a given year.
30 Climate of Opportunity: A Climate Action Plan for the District of ColumbiaDraft for Community Discussion

31
6.1.3 Street Lighting
During the 2006 calendar year, streetlights and traffic signals accounted for 6% of thetotal District Government operations direct emissions (46,000 metric tons of CO2e). Anumber of innovative emerging technologies, such as induction, light-emitting diode(LED) and solar lighting, have the potential to cut street lighting energy use substan-tially over time. Reductions in street lighting may be comparable to those seen whenthe District converted to LED traffic signals in 2005. The lighting conversion processis projected to result in savings of 1,700 metric tons of CO2e in 2012, 10,800 in 2020,and 32,000 in 2050. As a result of these conversions, emissions from street lighting areestimated to decrease by over 70%, but the exact reductions will depend on the mixof technologies selected by the District Department of Transportation (DDOT) at theconclusion of the current pilot programs being conducted.
6.1.3.1 Street Lighting Retrofits
The District Department of Transportation (DDOT) is responsible for the installation andrepair of all street lighting in the District and is currently engaged in a pilot program toidentify the next-generation lighting technology it will deploy to replace the current mixof high pressure sodium, incandescent, mercury vapor, and metal halide street lights.
Emissions Reduction Modeling Approach:The model assumes that the replacement lighting technology will be 70% more effi-cient than the existing technology mix, a conservative figure that gives DDOT flexibil-ity in choosing the best technology for a given application. The model projects 5%conversion in 2012, 33% conversion in 2020, and 100% conversion in 2050.
Climate of Opportunity: A Climate Action Plan for the District of ColumbiaDraft for Community Discussion
Wind energy pilot at the U.S.Botanical Garden, SW

6.1.4 Water and Wastewater
In 2006, wastewater facilities were responsible for 23% of government operations emis-sions, with a total of 163,000 metric tons of CO2e. Emissions from wastewater treatmentcan be reduced by decreasing flow volumes, reducing energy consumption throughprocess innovation, and finding ways to re-use process by-products.
Upgrades to the water distribution and wastewater treatment systems are projected toresult in savings of 36,700 metric tons of CO2e in 2012, 73,800 in 2020, and 129,500 in2050. The actions listed in this plan highlight several major initiatives being undertakenby DC Water, but the authority is beginning a comprehensive, organization-wide as-sessment of energy use that is likely to identify further opportunities. Even so, the itemslisted in this plan will cut emissions from DC Water facilities by nearly 50% by 2020.
6.1.4.1 Blue Plains Fine Bubble Diffuser Retrofit
DC Water has installed highly efficient fine bubble diffusers for use in its aerated waste-water treatment processes at Blue Plains. With finer bubbles, more of the oxygen sup-plied to the process will dissolve into the water and facilitate the treatment process.With more effective aeration, less overall pumping of air is needed to achieve the sametreatment effect. This change will conserve an estimated 70 gigawatt hours of elec-tricity per year.
32 Climate of Opportunity: A Climate Action Plan for the District of ColumbiaDraft for Community Discussion

33
Emissions Reduction Modeling Approach:The energy savings for this measure were computed by DC Water as part of an engi-neering study for the project. The emission factor for electricity generation is then ap-plied to the energy savings to compute the emissions reduction.
6.1.4.2 Blue Plains Anaerobic Digester Project
DC Water plans to implement an anaerobic digestion system to further treat biosolidsand sludge from the Blue Plains Wastewater Treatment Facility. Anaerobic digestion uti-lizes microbes to breakdown the solids, producing several beneficial by-products whileconsiderably reducing the volume of solids that must be hauled away and landfilled.Digested sludge material is safer to handle, and can be marketed as a soil amend-ment rather than disposed of as a hazardous waste product. In addition, the volumeof sludge material is reduced by approximately 50%, requiring substantially less trucktraffic to transport it. Another by-product ofanaerobic digestion is methane gas whichcan then be burned to provide heat for thefacility and to run a turbine to create non-fossil fuel electricity.
Emissions Reduction Modeling Approach:Engineering studies of the co-generationpotential proposed by DC Water projectthat the methane produced will generate aminimum of 10 megawatts of electricity.Emissions reductions are calculated by ap-plying the emissions factor for grid elec-tricity in the District to that amount ofelectricity that would not need to be pro-duced by the fossil fuel based electricitygrid.
6.1.5 Solid Waste
Emissions from government-generatedsolid waste accounted for an estimated625 metric tons of CO2e during the 2006calendar year, just 0.1% of the District government operations total of 720,000 metrictons of CO2e. For many reasons that go beyond the direct climate emissions reduc-tions goals of this report, the District Government is engaging in a widespread effortto provide receptacles, educate staff, and improve tracking that will significantly in-crease recycling participation rates.
6.1.5.1 Recycling in District Government Facilities
Greenhouse gas emissions from solid waste occur when organic material degradesanaerobically in a landfill resulting in the formation of methane, a potent greenhouse gas.By increasing the recycling rate, less of this material will be entering the landfill and cre-
Climate of Opportunity: A Climate Action Plan for the District of ColumbiaDraft for Community Discussion
Expanded growth and improvedgreen space helps cool the city

ating emissions. Currently the District Government facilities are recycling at an averagerate of at 22%. The goal is to increase this rate to 30% by 2012 and 50% by 2020.
Emissions Reduction Modeling Approach:Due to a lack of data on the subject, it is assumed that the composition of District fa-cility waste is similar to other commercial waste streams. It is also assumed that recy-cling occurs for each material type in proportion to the generation rate for that materialtype. With increasing recycling rates the methane producing portions of the wastestream are reduced from what was headed for a landfill, avoiding those emissions.
6.2 Community Measures to Reduce Emissions
Section 6.1 provides a detailed proposal for reducing emissions from the operationsof the District Government. However, the District Government’s share of our total emis-sions from the District of Columbia community is only 6%. It will take an effective andextensive partnership between government and all sectors of our community to ad-dress the 94% of emissions coming from actions not under the direct control of theDistrict Government. The District Government has a role to play – by setting policiesand establishing programs to reduce energy use and greenhouse gas emissions in ourcity – but the solution to the challenges of climate change will require everyone’s par-ticipation.
6.2.1 Community Engagement
This Draft Climate Action Plan provides a starting point for dialog to identify commu-nity-wide measures that, together with the government operations measures describedin this report, will allow the District to meet emissions reduction targets. Over the com-ing months, the District Government will convene public forums to engage communitymembers, businesses, institutions, and other stakeholders in the effort to establishcommunity reduction targets and identify specific measures and commitments neededto achieve those targets.
The goal of the public engagement process is to identify how each member of ourcommunity, from the individual resident to the largest institutions, can do their part toreduce greenhouse gas emissions. The District Government will do its part to encour-age emissions reductions across the community by establishing policies and programsthat promote efficient building design, reduce energy consumption, provide trans-portation alternatives, encourage smart land use patterns, provide waste managementalternatives, and allocation of District Government and federal financial resourceswisely.
6.2.2 Community Target Setting
An emissions reduction target represents the percentage by which a community will re-duce total greenhouse gas emissions below its base year levels. What are the realis-tic options for community targets and mitigation measures? These are the options wewill develop together during the community engagement process. There are, however,examples and guidelines for us to refer to. Employing the measures discussed in thereport (and others identified during the public planning process), the District as a com-
34 Climate of Opportunity: A Climate Action Plan for the District of ColumbiaDraft for Community Discussion
We Want YourComments and Input
This document is a Draftfor Community Discus-sion. You can contributeto the District’s climateplanning effort by pro-viding input in two ways:
First, the District De-partment of the Environ-ment (DDOE) is askingfor public comments onthe list of proposedGovernment OperationsActions (Section 6.1) byNovember 15, 2010. Youcan submit commentsvia e-mail [email protected] orby mail to DDOE, Cli-mate Action Comments,1200 First St NE, 5thFloor, Washington, DC20002.
Second, you can partici-pate in a series of publicforums and meetingsconvened by DDOE togather input and com-ments on the proposedGovernment OperationsPlan (Section 6.1) andthe Community Discus-sion Draft (Section 6.2).More information on theclimate engagementprocess can be found atwww.green.dc.gov, by [email protected], orcalling 202-535-2600.

35
munity should strive to meet or exceed the Metropolitan Washington Council of Gov-ernments recommended regional goals of reducing emissions by 10% in 2012, 20%in 2020, and 80% in 2050. xvi
Typically, several reduction targets are selected to correspond with a series of futuretarget years. Setting targets for the District of Columbia community will first require anestimation of future emissions totals, which is presented below under “business asusual” projections. Second, estimates of the impacts of actions that are already un-derway, combined with the effects of external factors such as thecarbon intensity of the electric utility grid, national fuel economystandards for automobiles, and technology improvements, are takeninto account. Third, through the community engagement process,residents, government and private sector experts, businesses andinstitutions will explore the potential impacts of actions they can taketo reduce climate emissions Emission reduction goals for the Com-munity will be set based on the overall assessment of these threefactors.
As depicted in Table 4.1 and Figure 4.1, “business as usual” pro-jections anticipate that the District’s community greenhouse gasemissions will grow by approximately 3.7 million annual tons (or35%) by the year 2050. Reducing emissions to a point below the2006 baseline will require additional emissions reductions to counter anticipated in-creases in emissions over time.
Table ES.5 summarizes proposed community-wide measures that can reduce the Dis-trict’s greenhouse gas emissions. Some of the measures listed have already been ini-tiated and are in the process of implementation, such as the DC Green Building Act,the Clean and Affordable Energy Act, and the updated 2008 Building Code. Othersrepresent programs now being planned or discussed, such as further greening of theBuilding Code, programs for financing energy efficiency retrofits (also known as“PACE”), and expanded mass transit, bicycle and pedestrian options. Others representbest practices taken from other private sector or community-wide actions in other ju-risdictions that could be considered for application here within the District.
Climate of Opportunity: A Climate Action Plan for the District of ColumbiaDraft for Community Discussion
How was the proposed list of Community measures developed?
The list of proposed measures to reduce community emissions was derivedfrom a review of the actions and commitments in the Green DC Agenda and areview of best practices from other cities. This list was refined to isolate meas-ures that would provide the most significant emissions reductions. Significantinput and guidance also came from the work of the Metropolitan WashingtonCouncil of Governments (MWCOG), whose Board approved regional climateguidance in December 2008.
Wooded lands along the C&OCanal, NW

6.2.3 Proposed Measures for Discussion
Buildings
Buildings are responsible for 75% of greenhouse gas emissions in the District and aretherefore the right place to start making reductions. Many factors determine how much
energy a building uses, including building construction, usage,energy systems and load and occupant behavior. The actionstaken at the community scale will help to address all of these as-pects to significantly reduce building energy consumption withinthe District.
As the District works to mitigate climate change by reducing itsemissions, these same measures occasionally have adaptationbenefits for changes in climate that will occur even with preven-tative measures. For example, creating high performance build-ings throughout the District will do a great deal to insulate thebusinesses and residents from the financial effects of extremeweather events such as heat waves. Measures aimed at vulner-able populations will help to reduce the human impact of suchextreme events. By increasing efficiency broadly, utility providerswill be better able to manage peak loads during extreme weatherevents and help to avoid service disruption at critical times. With
less spending on energy for businesses and residents in the District, more money willbe available for other purposes, improving the local economic outlook.
Green Building Act (GBA)The GBA will require that beginning in 2012 non-residential new construction over50,000 square feet in size meet the LEED Certified standard. This measure will be im-plemented as new large scale developments occur within the District. The benefit ofthis measure is largely dependent on the amount of development that is likely to occurunder these guidelines. Looking towards 2050, the GBA is likely to be revisited andstrengthened in the future.
Clean and Affordable Energy Act of 2008 (CAEA)Sustainable Energy Utility: the CAEA redirects existing utility assessment fees to a newSustainable Energy Trust Fund that will be used to promote and catalyze energy effi-ciency projects throughout the city. These projects are aimed at efficiency, renewablegeneration, peak load management, and the creation of green-collar jobs. Specific tar-get areas include energy intensive enterprises and services for low-income residents.
Renewable Portfolio Standard: the CAEA sets a standard for the amount of renewableenergy that all electricity suppliers to the District must meet. The percentage of re-newable energy increases each year up to 20% in 2020.
Greening the Building CodeBy revising our building codes to include higher energy and water efficiency standards,the District will ensure that all new buildings and redevelopment will be more efficient,including buildings that are smaller than the 50,000 square feet threshold of the GreenBuilding Act. In 2008, the District became one of the few jurisdictions to adopt the lat-
36 Climate of Opportunity: A Climate Action Plan for the District of ColumbiaDraft for Community Discussion
The District is a national leader inGreen and Cool Roof installation.

37
est energy and water conservation codes, and the District will revise the codes againin 2010 and regularly after that.
Property Assessed Clean Energy (PACE)The District will offer long-term loans to property owners, to be repaid on their prop-erty tax bills, to finance energy efficiency retrofits of residential, multi-family, and com-mercial properties citywide.
With recent passage of legislation to authorize a property assessed clean energy(“PACE”) program and authorize issuance of $250 million of non-recourse bonds, theDistrict is poised to lead the nation in implementing a major retrofit finance programthat will save properties owners millions of dollars on energy, improve the comfort,condition and marketability of properties across our city, and create green jobs andbusiness opportunities for District residents.
Office and Residential Energy Efficiency Retrofits and WeatherizationThe District Department of the Environment offers programs that promote energy sav-ings in homes through retrofits and weatherization. The energy and climate emissionssavings that will result from these programs will be dependent upon the number andtype of retrofit actions that will occur under the program. This information, combinedwith published reports on how these measures have performed under similar pro-grams, will be used to compute the total energy savings.
Energy Efficiency Improvements for Federal Buildings in the DistrictFederal Executive Orders require all federal agencies to reach a minimum 30% reduc-tion in energy intensity (a measure of energy use) by 2015, while significantly increas-ing the amount of energy derived from renewable sources. A target of 16% reductionin water consumption is also required. These orders apply to all federal buildings in theDistrict, and represent a significant component of our overall community emissions.
Green Building and Energy Challenges to Key Sectors Competition motivates people to change their ways. There are a number of examplesof climate reduction challenges among business sectors, universities and other insti-tutions, and neighborhoods that have delivered significant reductions in energy use.The District Government will help facilitate these sector challenges building on theleadership of sector leaders citywide.
“District” Heating and Energy SystemsThe District already has a several “district,” or centralized, heating and energy sys-tems in place (for example, the federal General Services Administration, Soldiers andAirmen’s Home, U.S. Capitol complex, White House/Old Executive Office Building ,and several universities). District heating or energy systems use a central plant to pro-duce heat, chilled water, or energy for distribution across many buildings. Increasingthe efficiency of these large heating and cooling systems could save energy. In othercommunities, particularly in Europe, cities are promoting expansion of these districtsystems to provide efficient heating and cooling to other buildings nearby.
Solar Co-ops and Other Micro-utilitiesUse of renewable electric systems, high efficiency heating or other efficient practicescan be promoted through co-ops at the neighborhood-level. Rooftops, parking lots,yards, parks, rights of way, streets, and other public and private space can be utilized
Climate of Opportunity: A Climate Action Plan for the District of ColumbiaDraft for Community Discussion

in very creative means to create decentralized power sources across the District. Co-ordinated design, community organization, and implementation models are key to suc-cess on a site/neighborhood basis. A strong foundation for this work exists in thecitizen-organized solar co-ops already in place. These efforts could be enhanced andfacilitated by an effective and replicable financing plan and streamlined administrativeprocessing.
Power Purchase AgreementsA Power Purchase Agreement, or PPA, is a long-term contract to buy power from aspecific energy provider. Solar PPAs are agreements between a home or businessproperty owner and a buyer who will purchase solar power generated at the propertyat a long-term rate, often equal to or less than market rates. Under a PPA, a solar elec-tric facility is installed on a customer’s roof without the customer needing to purchaseany hardware—making going solar as easy as paying a regular power bill. District gov-ernment can take a leading role in easing the adoption of PPAs within the commercialand residential sectors.
Purchase of Renewable PowerConsumers in the District already have the choice to purchase up to 100% renewable-source electric power through several vendors. Education and cooperative purchas-ing can promote expanded renewable purchasing by residents, businesses andinstitutions. Information is available at www.greenenergy.dc.gov.
Green and Reflective “Cool” RoofingUse of green and reflective “cool” roofs can greatly reduce the energy needed to coolbuildings and make buildings more comfortable for occupants at a relatively low cost.Cool roofs can also help combat the urban “heat island effect,” which keeps the innercity hotter than surrounding areas due to heat retention of pavement and roofing ma-
38 Climate of Opportunity: A Climate Action Plan for the District of ColumbiaDraft for Community Discussion

39
terials. The District Building Code now incorporates cool roof requirements, but edu-cation and incentives can help to speed adoption of these technologies.
Industrial Scale Renewable Co-GenerationSeveral small generation plants in the District are scheduled to go off-line in the nextseveral years. Exploring opportunities to open cleaner burning facilities using naturalgas or a combination of renewable sources could provide opportunities for expansionof high efficiency, locally-generated power to provide cleaner, more reliable power forthe District.
Federal Light Bulb Efficiency StandardsUnder the Energy Independence and Security Act of 2007, all light bulbs must use25% to 30% less energy than today's products by 2012 to 2014. The phase-in willstart with 100-watt bulbs in January 2012 and end with 40-watt bulbs in January 2014.By 2020, bulbs must be 70% more efficient. Compact fluorescent bulbs already meetthe 70% efficiency standard. The average U.S. household has more than 40 socketsfor light bulbs, ranging from table lamps to ceiling fixtures. Larger homes can haveeven more. In Washington, DC, our 285,000 homes could have as many as 11,400,000light bulbs. Lighting accounts for about 20% of annual household electricity bills, orover $200 per year in the average household. Replacing incandescent bulbs with EN-ERGY STAR qualified light bulbs provides significant benefits for consumers.
Transportation
Transportation emissions represent the second largest emissions class in the District,accounting for nearly one quarter of all emissions. The District’s transportation emis-sions come from a wide array of sources, including vehicles driven by District resi-dents, hundreds of thousands of daily commuters from outside of the city, and visitingtourists and business travelers. By expanding opportunities for both residents andcommuters to take public transit and encouraging fuel efficient vehicles, the Districtcan both reduce vehicle emissions and create a healthier environment.
Bus Rapid Transit ExpansionThrough a number of individual projects and initiatives, the Washington Area Metro-politan Transit Authority (WMATA) and the District Department of Transportation willexpand Bus Rapid Transit routes such as express buses and the Circulator systemthroughout the city and provide a higher level of transit service to an increased num-ber of residents. Parts of this system are already in place. By 2030, an additional118,000 weekday riders are expected to use public transit.
Streetcar Project The Anacostia Streetcar Project represents the first step in the District’s commitmentto redevelop streetcar lines along some of the city’s highly-traveled corridors. Street-car lines will bring a high level of service transit system to areas of the District previ-ously poorly connected to the rest of the Metro and other parts of the transit system.The first segment of the Anacostia streetcar line is expected to begin revenue serviceby late 2012, with the H Street/Benning Road streetcar line starting shortly thereafter.The remainder of the system plan will be implemented as funding becomes available.
Capital Bikeshare Program ExpansionThe District is among the first cities in North America to launch a publicly available, self-
Climate of Opportunity: A Climate Action Plan for the District of ColumbiaDraft for Community Discussion

serve bike sharing program. The Introduction and expansion of bike sharing increasesthe number of alternative transportation modes available to District residents and al-lows for people to be able to take transit to the city core while having the mobility torun short errands throughout the day. Currently the program is expanding from 100 tomore than 1,000 bikes and from 10 stations to more than 100 in the District and North-ern Virginia. According to a survey of bike share program users, approximately 16% ofthe trips taken on a smart bike were replacing a car trip.
Bicycle Master Plan Implementation The District Bicycle Master Plan has been in place for more than 10 years and hasmade significant improvements in cycling conditions. With better routes, facilities andmore options for parking bikes in safe and convenient locations, more District resi-dents are expected to take advantage of the low cost and health benefits of bicyclecommuting. The District Government has already begun implementation of the mas-ter plan. In 2009 the number of miles of bike lanes in the District rose to 39.5 miles andthere are at least 1,000 public racks available. In 2009, the Union Station Bike Stationopened, providing premium parking, retail and repair services, and bike rentals.
Performance Based ParkingIn order to move more trips to transit and active transportation, the District Depart-ment of Transportation will continue to implement “performance based parking” with
increased rates during high demand periods and areas tosupport further adoption of other modes of travel and re-duce congestion.
Incentives for Hybrid VehiclesIncreasing the rate of hybrid vehicle adoption will reduceemissions by improving the collective fuel economy ofthe vehicles in the District. The District Government al-ready has incentives in place to encourage hybrid vehi-cle purchases including the elimination of sales tax onhybrids and a 50% discount in registration fees.
Electric Vehicle Plug-In StationsExpansion of public and private infrastructure to supportelectric vehicle charging in various stations around thecity will facilitate the adoption of plug-in electric vehicles.
As residents and companies shift to electric vehicles, reductions in gasoline con-sumption will result in lower emissions from the passenger car sector. Net emissionsreductions from this measure can be calculated by estimating the increased amountof grid electricity that will be consumed and subtracting the resultant emissions fromthe reduction in gasoline consumption.
Fuel Efficient Tour Buses and Anti-Idling Working with the wide variety of tour bus operators from within and outside of the city,the District can provide incentives for fuel efficient and clean running tour buses to re-duce the impact of tourism related emissions in the District.
Promotion of Car Sharing ProgramsThe District already has one of the highest rates of car share participation in the coun-try and opportunity for expansion. The District Department of Transportation facilitates
40 Climate of Opportunity: A Climate Action Plan for the District of ColumbiaDraft for Community Discussion
Restored wetlands alongthe Anacostia River, NE

41
usage by providing car share parking spaces at key loca-tions across the city. Public education and promotion bygovernment and business will help drive demand and in-crease usage.
Federal CAFE StandardsThe National Highway Traffic Safety Administration and theEnvironmental Protection Agency (EPA) have proposed an in-crease in the Corporate Average Fuel Economy (CAFE) stan-dards for all passenger and light truck models for 2012 to2016. Current CAFE standards are set at 27.5 MPG. The newCAFE standards require an estimated combined averagemiles per gallon (MPG) of 34.1 by 2016. Improving fuel econ-omy will reduce the District's greenhouse gas emissions as vehicles use less fuel. Asvehicles are regularly replaced on a variable timeframe, it is estimated that the full effectsof implementing a federal CAFE standard will not be experienced for 8 to 10 years.
Land Use
The way that the District has developed over time has shaped where residents live,work and play in the city. Smart growth policies, such as mixed-use development, canbring these destinations closer together, and provide more transportation choices forresidents, like walking, biking or transit. Land use practices that favor walkable com-munities and development near transit can reduce vehicle miles traveled, which helpsmitigate greenhouse gas emissions while also improving air quality and health out-comes.
Efficient land use practices in the city and measures that increase vegetation can in-crease the environmental performance of the urban environment. Green space andurban trees provide cooling benefits that reduce energy costs and render the city moreresilient to the urban heat island effect and heat waves.
Land Use Patterns That Increase Transportation ChoicesThe District of Columbia’s Comprehensive Plan supports compact, transit orienteddevelopment. Efficient land use policies bring residents closer to their destinations andtransit opportunities, therefore increasing opportunities for walking, biking, and publictransit trips to replace motor vehicle trips.
Small Area PlansThe District of Columbia is in the process of implementing 20 Small Area Plans (SAPs)city-wide. These plans, along with other planning documents like the ComprehensivePlan, guide development in more climate friendly patterns. Increasing the number anddiversity of end-uses in a small area with compact and mixed-use buildings increasesopportunities for district heating systems and co-generation.
Increased Tree Canopy in the District Mature trees serve to shade buildings and act as wind breaks, reducing energy use inthe District. Trees also reduce the amount of stormwater runoff that is generated dur-ing large rain events, and by reducing the water treatment load on the Blue Plainswastewater treatment facility thereby reducing energy use at the facility. The District’sgoal is to increase its urban tree canopy to 40% by 2036.
Climate of Opportunity: A Climate Action Plan for the District of ColumbiaDraft for Community Discussion
Preserving green spacebenefits residents and theenvironment

Green and Sustainable Land Use Patterns and Development PracticesTo promote green development, the District of Columbia actively supports the use ofgreen building methods, like green roofs, in new construction and rehabilitation proj-ects. Green roofs not only insulate buildings and subsequently reduce energy usagefor heating and cooling, but they also absorb and reduce the flow of storm water intothe sewer system. Additionally, public realm designs in the District favor tree boxes,planting areas on public sidewalks, and reduction in impervious surfaces.
Sustainable ZoningThe comprehensive update process for the District of Columbia’s zoning code includedan in-depth examination of elements of sustainability. In order to enable and encour-age sustainability through the regulations guiding the built environment of the District,the Office of Planning has recommended changes to the zoning code. Major topicscovered include climate change; energy conservation and renewable energy produc-tion; integrating land use and mobility; water conservation and greywater; slopes,streams, stormwater and hydrology; food production/security and community health;and sustainable business and ‘green’ jobs.
Waste and Recycling
Municipal solid waste results in greenhouse gas emissions when organic material de-grades in a landfill. These waste measures divert material entering the landfill and thusprevent emissions that would have been released from the degradation process.
Increase Commercial RecyclingThe majority of the District’s waste comes from the commercial sector. The Departmentof Public Works will expand programs to work with both property managers and ten-ants to improve commercial recycling rates to 45% diversion. Reductions calculationsin this case will be based upon the amount of organic material that would be divertedfrom the landfill by increasing overall diversion rates to 45%. Emissions reductions arebased upon the amount of methane materials would have generated in the landfill hadthey not been diverted.
Increase Residential Recycling Current residential recycling rates are at 24%. The District plans to increase this per-centage to 45% by 2050 through outreach and other programs (such as expandingmaterial collected and incentives for recycling).
Waste to EnergyBeginning in 2007, a portion of the District’s municipal waste has been incinerated ina waste-to-energy plant rather than landfilled. Burning municipal solid waste (MSW)produces energy and emissions, which offset alternative emissions from utility elec-tricity production.
Organic Waste CompostingOrganic matter such as yard waste is the key component of solid waste that leads tothe formation of methane in landfills. By increasing the amount of leaf matter that is col-lected for composting rather than being landfilled, these emissions are avoided. TheDistrict plans to increase the diversion of leaves and Christmas trees from current lev-els of 54% to 100% by 2050.
42 Climate of Opportunity: A Climate Action Plan for the District of ColumbiaDraft for Community Discussion

43
Cross-Cutting Efforts
Climate Benefit ProgramOther cities around the nation have established volun-tary programs to allow businesses, institutions or indi-viduals to “purchase” additional greenhouse gasemissions through private donations to support projectsthat reduce greenhouse gas emissions within the Dis-trict’s boundaries. Donations could be official carbon off-sets or unofficial carbon benefits and are run in somecases by governments or in others by private non-profitentities. Local actions that could be funded could includeweatherization of low income properties, installation ofsolar energy systems, composting, large scale tree plant-ing projects and more.
Green PurchasingDistrict Government, local businesses and associations, and residents can reduce theirgreenhouse gas emissions by choosing to purchase and use less carbon-intensiveproducts. The use of these products reduces environmental impacts associated withthe manufacture, use and disposal of many items in common daily use. The DistrictGovernment is adopting Environmentally Preferable Purchasing (EPP) practices forDistrict Government agencies. A number of government and private sector EPP pro-gram models are available to guide businesses and individuals on EPP, such as the EPAComprehensive Procurement Guidelines (CPG) for recycled content, and Energy Starand EPEAT Silver ranked computers. Examples of target products include: office sup-plies; computers and peripherals; copiers; vending machines; lighting; carpet; andcleaning supplies and chemicals.
Climate of Opportunity: A Climate Action Plan for the District of ColumbiaDraft for Community Discussion

Many of the actions taken to mitigate climate change also contribute other communitygoals, like strengthening the local economy, reducing other types of urban pollution,improved health, and increased quality of life.
As we improve building efficiency and quality with buildings that are more energy effi-cient, costs will decrease with lower energy and water bills, freeing up money for in-
vestment. In 2006, the District Government spent over$100 million on energy to power buildings and operate itsvehicle fleet. Many of the measures in this plan haveshort-term payback periods, and save on both direct andindirect costs. For instance, a “right-sized” vehicle fleetis less expensive to purchase and fuel, while also beingless costly to maintain.
A key side-benefit of climate change mitigation activitiesis enhanced energy security and reliability of locally gen-erated power, an issue that is especially relevant to theDistrict given the critical government business that isconducted here.
Green building standards and codes that enhance en-ergy efficiency and reduce costs also improve indoor airquality, which can reduce occupants’ exposure to harm-
ful chemicals and other irritants. Improved air quality, along with increased natural light,has been shown to improve productivity among workers and students which will inturn yield positive economic benefits.
As Washington, DC, invests in safe and convenient forms of alternative transportation,and becomes less dependent on the automobile, the flow of local dollars out of the Dis-trict to pay for fuel (often from foreign suppliers) will decrease. Automobiles are a sig-nificant source of local air pollution including ozone, particulate matter, and carbonmonoxide, which have negative health effects and can lead to asthma and otherbreathing disorders. Less automobile dependence is correlated with an increased num-ber of people choosing active lifestyles that include regular walking and cycling toreach their destinations. Investments in alternative transportation that reduce emis-sions from commuters will also yield increased mobility benefits in the form of betterlevels of service in transit systems and better viability for modes like walking and bik-ing to reach needed destinations for the 36% of District residents who do not owncars. xvii
Restoring our tree canopy and increasing the amount of green vegetated space will notonly shade buildings, cool streets and reduce energy usage, but will also reducestormwater runoff, combined sewer overflows and other non-point source water pol-lution, leading to healthier waterways including the Anacostia and Potomac Rivers,Rock Creek and the Chesapeake Bay. Urban trees and green space also create morewelcoming and memorable locations and have been linked to increases in spendingin retail locations and overall increased property values. xix
The effect of these additional benefits is magnified when viewed through the lens of cli-mate adaptation—the steps we can take to prepare for the effects of a changing cli-mate. In light of the considerable past and ongoing emissions of greenhouse gas herein the District and worldwide, we have already set the planet on a course for some de-
44 Climate of Opportunity: A Climate Action Plan for the District of ColumbiaDraft for Community Discussion
Other Benefits of Climate Protection7
Kingman IslandRestoration by theMayor’s Green SummerJobs Corps
45
gree of climate change. Extreme weather events, volatility in energy prices and relia-bility, heat driven poor air quality days, and flooding of low-lying areas are all likely toincrease with climate change. Many of the actions identified here to mitigate green-house gas emissions will also help the District’s government, businesses and resi-dents to adapt to a changing climate. For example, extreme and prolonged heat wavescan put considerable strain on the reliability of energy delivery in peak periods; possi-bly leading to service disruption during times when cooling is most needed. By in-creasing efficiency across the city, such service disruptions are less likely and the citywill be able to better cope with those situations. Additional measures aimed solely atclimate adaptation, such as modifying flood protection and heat emergency responseprograms will also be addressed in this Draft Climate Action Plan.
While some of the actions to fight climate change may involve additional upfront costs,such expenses are very often outweighed by long-term savings in energy use or pro-vide other significant community benefits to improve quality of life for District residents.For example, the State of California has cut the energy use required to cool new homesby approximately two thirds since the 1970s through building codes, despite ever in-creasing home size. Total energy savings achieved are valued at over $30 billion. xx
Climate of Opportunity: A Climate Action Plan for the District of ColumbiaDraft for Community Discussion

The government operations and community measures described in this plan could es-tablish the District as a national leader in areas of renewable energy, alternative fuels,and energy efficient wastewater treatment practices.
Following the public comment period, the District will finalize the Climate Action Planwith final targets and measures. For the final set of Government Operations measures,the District Government will refine emissions reductions estimates and, wherever pos-sible, estimate the cost of the measures and related costs savings and projected pay-back periods.
To develop a final set of community emissions reduction targets and specific mitiga-tion and adaptation measures, the District Government will engage with communitymembers, businesses, institutions, and other stakeholders through public forums andmeetings, and by gathering comments from the community.
46 Climate of Opportunity: A Climate Action Plan for the District of ColumbiaDraft for Community Discussion
Next Steps8
We Want Your Comments and Input
This document is a Draft for Community Discussion. You can contribute to theDistrict’s climate planning effort by providing input in two ways:
First, the District Department of the Environment (DDOE) is asking for publiccomments on the list of proposed Government Operations Actions (Section6.1) by November 15, 2010. You can submit comments via e-mail [email protected] or by mail to DDOE, Climate Action Comments, 1200First St NE, 5th Floor, Washington, DC 20002.
Second, you can participate in a series of public forums and meetings con-vened by DDOE to gather input and comments on the proposed GovernmentOperations Plan (Section 6.1) and the Community Discussion Draft (Section6.2). More information on the climate engagement process can be found atwww.green.dc.gov, by e-mailing [email protected], or calling 202-535-2600.

47
Figures
ES.1 2006 Community Emissions by Sector . . . . . . . . . . . . . . . . . . . . . . . . . . . . . 2ES.2 Per Capita CO2e Comparison (metric tons) . . . . . . . . . . . . . . . . . . . . . . . . . 3ES.3 Government Operations Emissions by Sector . . . . . . . . . . . . . . . . . . . . . . . 5ES.4 Forecasted Emissions Growth and Impact
of Government Operations Actions . . . . . . . . . . . . . . . . . . . . . . . . . . . . . . . . 7ES.5 Community Emissions by Source . . . . . . . . . . . . . . . . . . . . . . . . . . . . . . . . . 7ES.6 Forecasted Emissions Growth and Impact of Community Actions . . . . . . . 83.1 2006 Community Emissions by Sector . . . . . . . . . . . . . . . . . . . . . . . . . . . . 163.2 Community Emissions by Source . . . . . . . . . . . . . . . . . . . . . . . . . . . . . . . . 163.3 Government Operations Emissions by Sector . . . . . . . . . . . . . . . . . . . . . . 173.4 Government Operations Emissions by Sector . . . . . . . . . . . . . . . . . . . . . . 183.5 2006 District Government Operations Energy Costs per Sector . . . . . . . . 184.1 Business as Usual Forecast for Community Greenhouse Gas
Emissions (metric tons CO2e) . . . . . . . . . . . . . . . . . . . . . . . . . . . . . . . . . . . 194.2 Forecasted Greenhouse Gas Emissions for District Government
Operations (metric tons CO2e) . . . . . . . . . . . . . . . . . . . . . . . . . . . . . . . . . . 205.1 Forecasted Emissions Growth and Impact of Government
Operations Actions . . . . . . . . . . . . . . . . . . . . . . . . . . . . . . . . . . . . . . . . . . . 225.2 Forecasted Emissions Growth and Impact of Community Actions . . . . . . 22
Tables
ES.1 Greenhouse Gases and Associated Global Warming Potential . . . . . . . . . . 3ES.2 Government Operations Emissions Reduction Target
Comparison to Other Cities . . . . . . . . . . . . . . . . . . . . . . . . . . . . . . . . . . . . . . 5ES.3 Government Operations Emissions Reductions by Sector . . . . . . . . . . . . . . 6ES.4 Draft for Public Review and Comment:
Government Operations Emissions Reduction Measures . . . . . . . . . . . . . . 9ES.5 Draft for Discussion and Public Engagement:
Community Emissions Reductions Measures . . . . . . . . . . . . . . . . . . . . . . . 113.1 2006 Community Emissions by Sector . . . . . . . . . . . . . . . . . . . . . . . . . . . . 163.2 2006 District Government Operations Emissions by Sector . . . . . . . . . . . . 174.1 Forecasted Community Greenhouse Gas Emissions (Metric Tons CO2e) . 194.2 Forecasted Greenhouse Gas Emissions
for District Government Operations (Metric Tons CO2e) . . . . . . . . . . . . . . . 205.1 Government Operations Emissions Reduction Target
Comparison to Other Cities . . . . . . . . . . . . . . . . . . . . . . . . . . . . . . . . . . . . . 216.1 Comparison of Government Operations Emissions Profile
to Emission Reductions Achieved by Proposed Mitigation Measures . . . . 23
List of Tables and Figures
Climate of Opportunity: A Climate Action Plan for the District of ColumbiaDraft for Community Discussion

District of ColumbiaChristophe A.G. Tulou, Acting Director, District Department of the EnvironmentHarriet Tregoning, Director, District of Columbia Office of Planning Brendan Shane, Chief, Office of Policy and Sustainability, District Department of the
EnvironmentAdriana Hochberg, Special Assistant, District Department of the Environment George Hawkins, General Manager, DC Water Daniel Barry, Climate Policy Analyst, District Department of the EnvironmentEmma Hetnar, Policy Analyst, District Department of the Environment
ICLEI–Local Governments for Sustainability, USAJennifer Ewing-Thiel, Project ManagerJonathan Knauer, Program OfficerKara Reeve, Technical Innovation ManagerMike Steinhoff, Program OfficerBrita Pagels, Program OfficerJamie O’Connell, Program Associate
48
Credits and Acknowledgements
Climate of Opportunity: A Climate Action Plan for the District of ColumbiaDraft for Community Discussion

49
i Reduction targets are relative to the forecasted medium-growth scenarios,under which greenhouse gas emissions from Government Operations are antic-ipated to rise to 887,659 metric tons of CO2e or 27% by 2050.
ii The District’s emissions have been projected out to 2050 under three scenarios:low, medium, and high growth. Based on expected growth in the District’s pop-ulation and employment, it is expected that greenhouse gas emission will in-crease 14% in the District by 2020 and 35% by 2050. Under the mediumgrowth scenario, emissions are forecasted to rise to 14,284,067 metric tons ofCO2e, an increase of approximately 35% by 2050. These scenarios presumegreenhouse gas emission levels if the District takes no action to reduce emis-sions.
iii Intergovernmental Panel on Climate Change, http://www.ipcc.ch/.
iv Boesch, D.F. (editor). 2008. Global Warming and the Free State: ComprehensiveAssessment of Climate Change Impacts in Maryland. Report of the Scientificand Technical Working Group of the Maryland Commission on Climate Change.University of Maryland Center for Environmental Science, Cambridge, Mary-land. This report is a component of the Plan of Action of the Maryland Commis-sion on Climate Change, submitted to the Governor and General Assemblypursuant to Executive Order 01.10.2007.07.
v NOAA. 2008. Satellite and Information Service. Maryland and Virginia. AvailableOnline: http://www.ncdc.noaa.gov/oa/climate/research/cag3/md.html.
vi NOAA. 2004. Service Assessment: Hurricane Isabel, September 18-19, 2003.Available Online: http://www.weather.gov/os/assessments/pdfs/isabel.pdf.
vii Maryland Department of Natural Resources (MDNR). 2008. DNR AnswersQuestions About Sea Level Rise in Response to IPCC Report. Available Online:http://www.dnr.state.md.us/dnrnews/infocus/sealevel_rise.asp.
viii National Capital Planning Commission (NCPC). 2008. Report on Flooding andStormwater in Washington, DC, pg. 3. Available Online:http://www.ncpc.gov/UserFiles/File/publications_press/Report%20on%20Flooding%20and%20Stormwater%20in%20Washington,%20DC_.pdf.
ix Parker, G., et al. 2004. Modeling the Effect of Rising Sea Level on River Deltasand Long Profiles of Rivers, pg. 10. Available Online:http://cee.uiuc.edu/people/parkerg/_private/ConferenceProceedings/SeaLevelRiseHiroshima04Cit.pdf.
x MDNR. 2008. DNR Answers Questions About Sea Level Rise in Response toIPCC Report. Available Online:http://www.dnr.state.md.us/dnrnews/infocus/sealevel_rise.asp.
xi Titus, J.G. and Richman, C. 2000. Maps of Lands Vulnerable to Sea Level Rise.United States Environmental Protection Agency. Available Online:http://yosemite.epa.gov/oar/globalwarming.nsf/content/ResourceCenterPublicationsSLRMapsIndex.html.
xii This number represents a “roll-up” of emissions, and is not intended to repre-sent a complete picture of emissions from the District’s operations. This roll-upnumber should not be used for comparison with other local government roll-upnumbers without a detailed analysis of the basis for this total.
Endnotes
Climate of Opportunity: A Climate Action Plan for the District of ColumbiaDraft for Community Discussion

xiii For buildings, the forecast uses the Energy Information Administration (EIA) es-timate of 1.1% annual increase in commercial building energy consumption.The building forecast contains an additional correction to account for the antici-pated increase in energy use in modernized school facilities. Vehicles and em-ployee commute emissions are projected to grow at 0.4% annually, accordingto the EIA. DCWASA does not expect its service population to increase, but theforecast does account for the energy consumption of known expansions ofDCWASA operations. Emissions from traffic signals and street lighting are notexpected to increase, while emissions from solid waste are forecast to increasewith increases in employment.
xiv See note ii.
xv Savings exceed 100% of the 2006 totals because buildings emissions are pro-jected to grow significantly under a “business as usual scenario”, and also dueto the renewable energy purchases listed in this section applying to other sec-tors.
xvi See note ii.
xvii McGurkin and Srinivasan. 2003. Journey to Work Trends, 1960-2000. Chapter5. USDOT, FWHA Publication No. FHWA-EP-03-058. Available Online:http://www.fhwa.dot.gov/ctpp/jtw/
xviii Wolf, Kathleen. 2005. Business District Streetscapes, Trees, and Consumer Re-sponse. Journal of Forestry, Vol 103 (8).
xix Wolf, Kathleen. 2007. City Trees and Property Values. Arborist News. AvailableOnline: http://www.cfr.washington.edu/research.envmind/Policy/Hedonics.pdf
xx American Physical Society. 2008. Energy Future, Think Efficiency. Available On-line: http://www.aps.org/energyefficiencyreport/
50 Climate of Opportunity: A Climate Action Plan for the District of ColumbiaDraft for Community Discussion

We Want Your Comments and Input
This document is a Draft for Community Discussion. You can contribute to theDistrict’s climate planning effort by providing input in two ways:
First, the District Department of the Environment (DDOE) is asking for publiccomments on the list of proposed Government Operations Actions (Section6.1) by November 15, 2010. You can submit comments via e-mail [email protected] or by mail to DDOE, Climate Action Comments, 1200First St NE, 5th Floor, Washington, DC 20002.
Second, you can participate in a series of public forums and meetings con-vened by DDOE to gather input and comments on the proposed GovernmentOperations Plan (Section 6.1) and the Community Discussion Draft (Section6.2). More information on the climate engagement process can be found atwww.green.dc.gov, by e-mailing [email protected], or calling 202-535-2600.
Climate of Opportunity: A Climate Action Plan for the District of ColumbiaDraft for Community Discussion
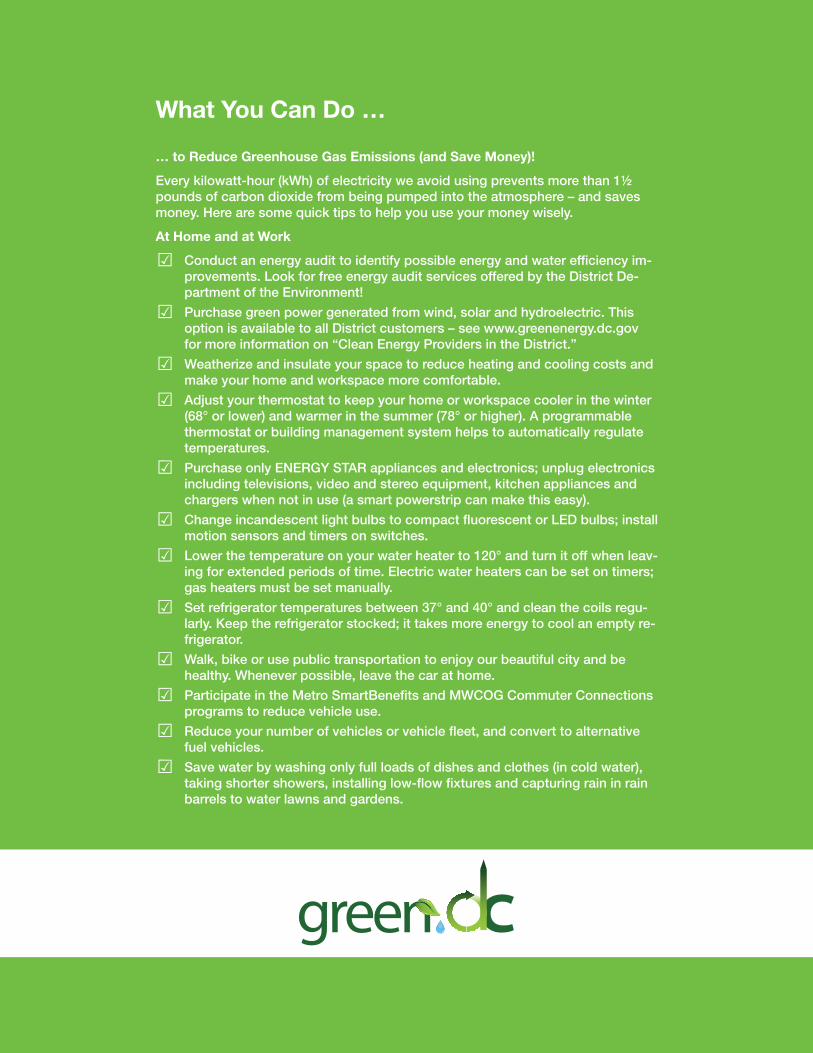
… to Reduce Greenhouse Gas Emissions (and Save Money)!
Every kilowatt-hour (kWh) of electricity we avoid using prevents more than 1½pounds of carbon dioxide from being pumped into the atmosphere – and savesmoney. Here are some quick tips to help you use your money wisely.
At Home and at Work
☑ Conduct an energy audit to identify possible energy and water efficiency im-provements. Look for free energy audit services offered by the District De-partment of the Environment!
☑ Purchase green power generated from wind, solar and hydroelectric. Thisoption is available to all District customers – see www.greenenergy.dc.govfor more information on “Clean Energy Providers in the District.”
☑ Weatherize and insulate your space to reduce heating and cooling costs andmake your home and workspace more comfortable.
☑ Adjust your thermostat to keep your home or workspace cooler in the winter(68° or lower) and warmer in the summer (78° or higher). A programmablethermostat or building management system helps to automatically regulatetemperatures.
☑ Purchase only ENERGY STAR appliances and electronics; unplug electronicsincluding televisions, video and stereo equipment, kitchen appliances andchargers when not in use (a smart powerstrip can make this easy).
☑ Change incandescent light bulbs to compact fluorescent or LED bulbs; installmotion sensors and timers on switches.
☑ Lower the temperature on your water heater to 120° and turn it off when leav-ing for extended periods of time. Electric water heaters can be set on timers;gas heaters must be set manually.
☑ Set refrigerator temperatures between 37° and 40° and clean the coils regu-larly. Keep the refrigerator stocked; it takes more energy to cool an empty re-frigerator.
☑ Walk, bike or use public transportation to enjoy our beautiful city and behealthy. Whenever possible, leave the car at home.
☑ Participate in the Metro SmartBenefits and MWCOG Commuter Connectionsprograms to reduce vehicle use.
☑ Reduce your number of vehicles or vehicle fleet, and convert to alternativefuel vehicles.
☑ Save water by washing only full loads of dishes and clothes (in cold water),taking shorter showers, installing low-flow fixtures and capturing rain in rainbarrels to water lawns and gardens.
What You Can Do …