Climate Change and Energy in Asia - KEEI Slides for Discussion (3) 28 ... Report 113 (2004) Europe:...
35
Climate Change and Energy in Asia Sergey Paltsev Expert Workshop on Energy and Climate Change Modeling Korea Energy Economics Institute Seoul, Korea November 17, 2011 Questions or comments? Contact: Sergey Paltsev [email protected]
Transcript of Climate Change and Energy in Asia - KEEI Slides for Discussion (3) 28 ... Report 113 (2004) Europe:...

Climate Change and Energy in Asia
Sergey Paltsev
Expert Workshop on Energy and Climate Change Modeling
Korea Energy Economics Institute
Seoul, Korea
November 17, 2011
0
Questions or comments?
Contact: Sergey Paltsev

Purpose
1
An illustration of capabilities of the MIT Integrated Global System Model (IGSM) Framework Projections of energy mix in Asia Climate impacts Economic component – The MIT Emissions Prediction and Policy Analysis (EPPA) Model Combining Top-Down with Bottom-Up Modeling Air Pollution Health Effects

Major Points
2
Temperature increases are substantial. Most emissions growth is in developing regions. Emissions in developed regions are flat, so a smaller lever to further impact global emissions. Transition to alternative energy is starting in developed countries and China, but the Copenhagen targets will not complete it. Vehicle growth is substantial in Asia. Land emissions are important. A lot more work is needed if the world wants to avoid substantial climate change.

MIT Integrated Global Systems Model (IGSM)
3

4
Global Emissions
Scenario: Copenhagen
pledges by 2020 – no
further policy
Fossil CO2 is a major part
But other GHGs are
important
Increased role of HFC
(air conditioning)
Land use CO2
Industrial and Cement CO2

5
EPPA regions
16 regions
USA
EU
Rest of Eurasia
Canada
Japan
Aus. & N.Z.
Russia
China
India
Mexico
Brazil
Middle East
Africa
Rest of Latin America
Dynamic Asia
Rest of Asia

6
Fossil CO2 Emissions by major group
Developed regions
(USA, CAN, EUR, ANZ) have
a smaller share over time
Even if they cut to zero –
limited impact
Asia’s regions
(CHN, IND, JPN, ASI, REA)
grow substantially even
with intensity targets in
China and India
Rest of the world regions
grow substantially
Focusing on G20 only will
miss a lot of opportunities

7
GHG Emissions by major group
For GHGs the picture
is similar
Developed regions
have even smaller
share for GHGs
Share of developed
regions:
2010 – 30%,
2100 – 15%
Share of Asia’s
regions:
2010 – 45%,
2050 – 60%,
2100 – 55%

8
Global Energy Use
Scenario:
Copenhagen
pledges by 2020 –
no further policy
Reliance of fossil
fuels dominated by
developing regions
Coal levels off
Larger role of
natural gas and oil
Renewables
increase 2.5 times
by 2050
We have not forced
renewables by RPS
or other mandates
Nuclear power
growth in
developing regions

9
Energy Use by major group
Developed
ROW
Asia

Global Population
10
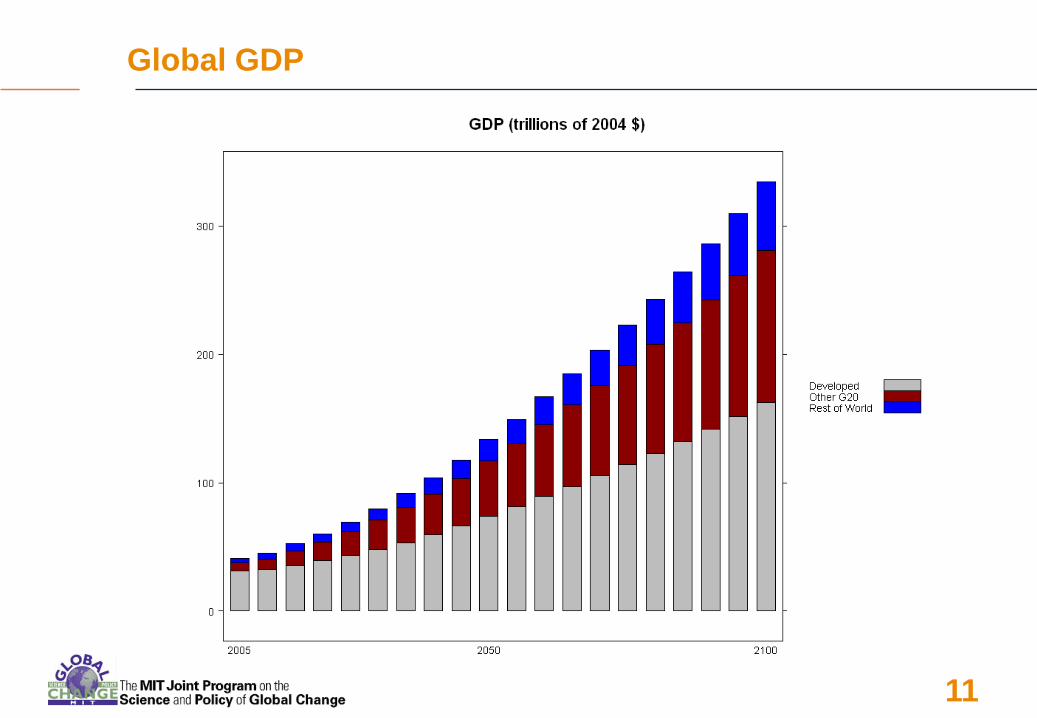
Global GDP
11

12
Energy Intensity by EPPA Region
Energy use
per unit of
GDP

13
Vehicle Stock
Private
Vehicles:
cars and light
trucks
millions

14
Vehicle Stock by EPPA Region
Private
Vehicles:
cars and
light trucks
millions

15
Land Use
Global Land Use
Megahectares
(Mha)

16
Land Use by major group
Megahectares
(Mha)

17
CO2 and GHG Concentrations P
art
s p
er
mil
lio
n (
pp
m)

18
Climate Sensitivity

19
Temperature Increase
Global average surface temperature change relative to 2000
Black line - observations
20
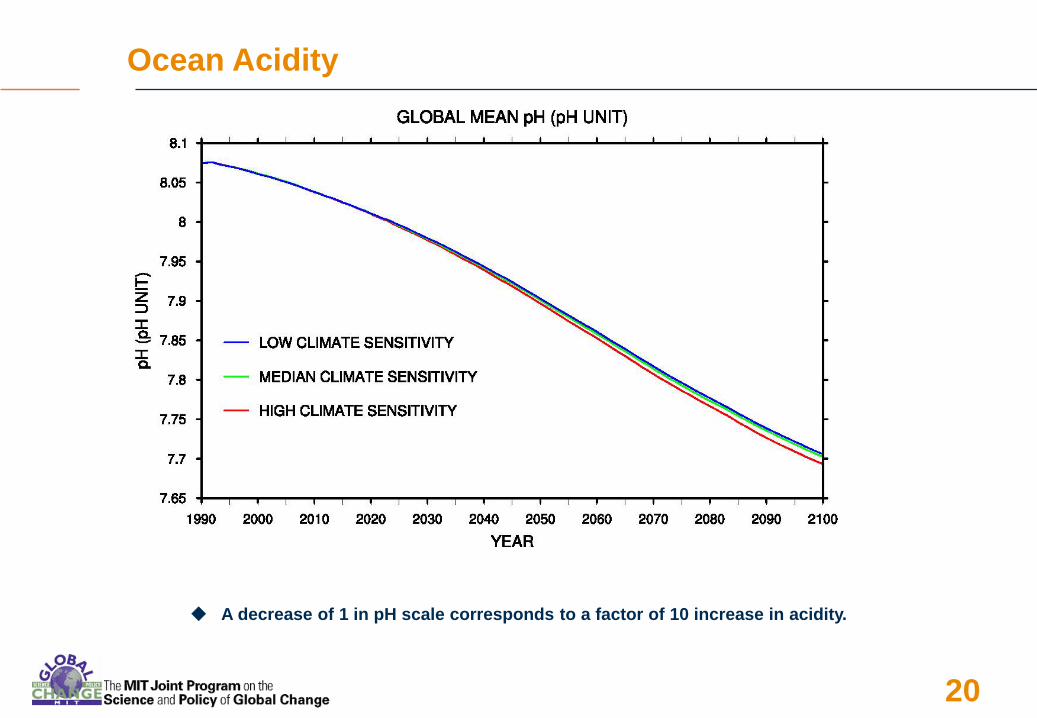
Ocean Acidity
A decrease of 1 in pH scale corresponds to a factor of 10 increase in acidity.

21
Regional Temperature Change
22
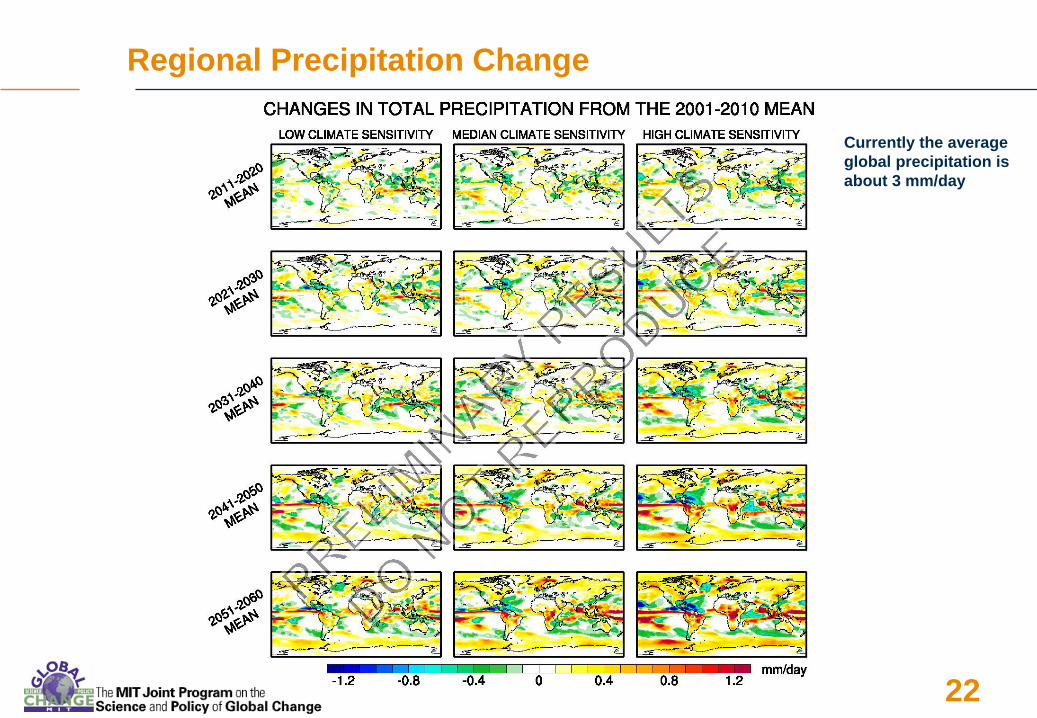
Regional Precipitation Change
Currently the average
global precipitation is
about 3 mm/day

23
Regional Ocean Acidity

Major Points
24
Temperature increases are substantial. Most emissions growth is in developing regions. Emissions in developed regions are flat, so a smaller lever to further impact global emissions. Transition to alternative energy is starting in developed countries and China, but the Copenhagen targets will not complete it. Vehicle growth is substantial in Asia. Land emissions are important. A lot more work is needed if the world wants to avoid substantial climate change.

25
Additional information available at:
http://globalchange.mit.edu
Thank you!

Additional Slides for Discussion (1)
26

Additional Slides for Discussion (2)
27

Additional Slides for Discussion (3)
28
Energy Use in China
No Climate Policy
Energy Use in China
550 ppm Stabilization
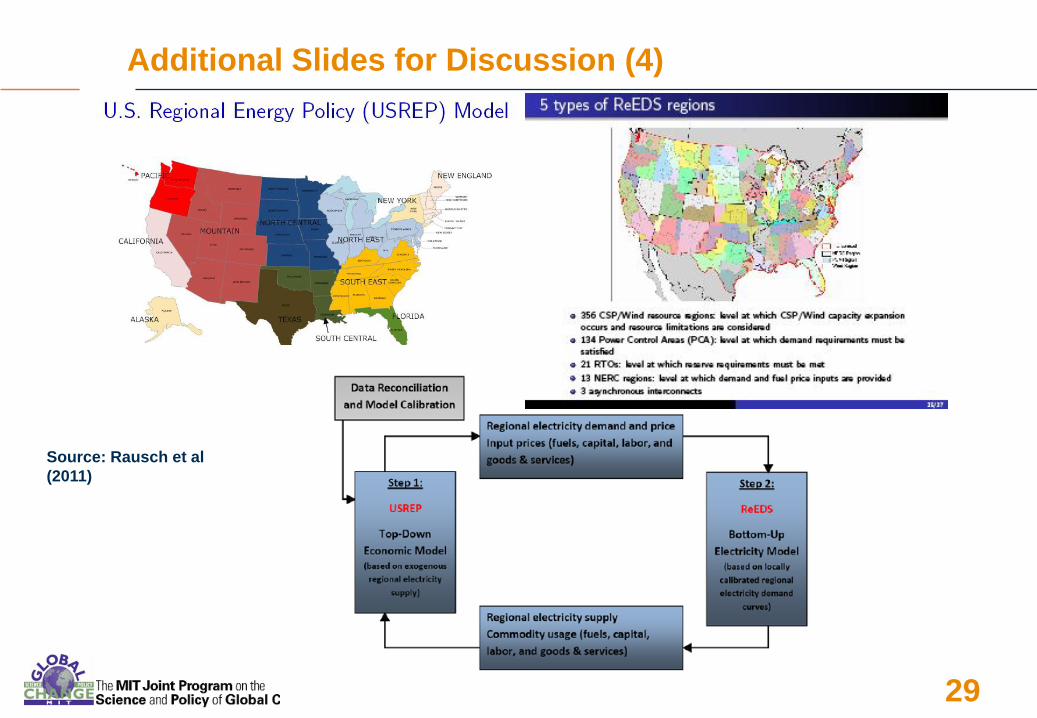
Additional Slides for Discussion (4)
29
Source: Rausch et al
(2011)

Additional Slides for Discussion (5)
30

Sectors Non-Energy Agriculture Energy Intensive Ind. Other Industry Services Industrial Transport Household Transport Other Household Cons. Fuels Supply Crude oil Refined oil Biofuel Shale oil Coal Natural gas Synthetic gas (from coal) Electric Generation
Crops
Livestock
Forestry
Biofuel crops
Fossil (oil, gas & coal)
Coal with CCS
Gas with CCS
Adv. gas without CCS
Nuclear
Hydro
Wind and solar
Biomass
Private Transport
Gasoline & diesel
PHEV, EV, Hydrogen,
Biofuels, CNG
Crude slate &
gasoline,
diesel,
petcoke
heavy oil,
biodiesel,
ethanol,
NGLs &
explicit
upgrading
31
EPPA Model Sectoral Structure

gas
gas
Input-Output Table provides information about production structure (inputs to production – green line) and output use (blue
line).
Additional information about elasticities is needed for a
CGE model: in contrast to input-output models,
consumers respond to price changes, firms change output
and inputs as markets shift.
Full accounting (examples): Expansion of biofuels leads to expansion of agriculture production that uses
fertilizer and energy inputs; Expansion of solar panel or wind mills production requires energy and capital.
32
Input-Output Table
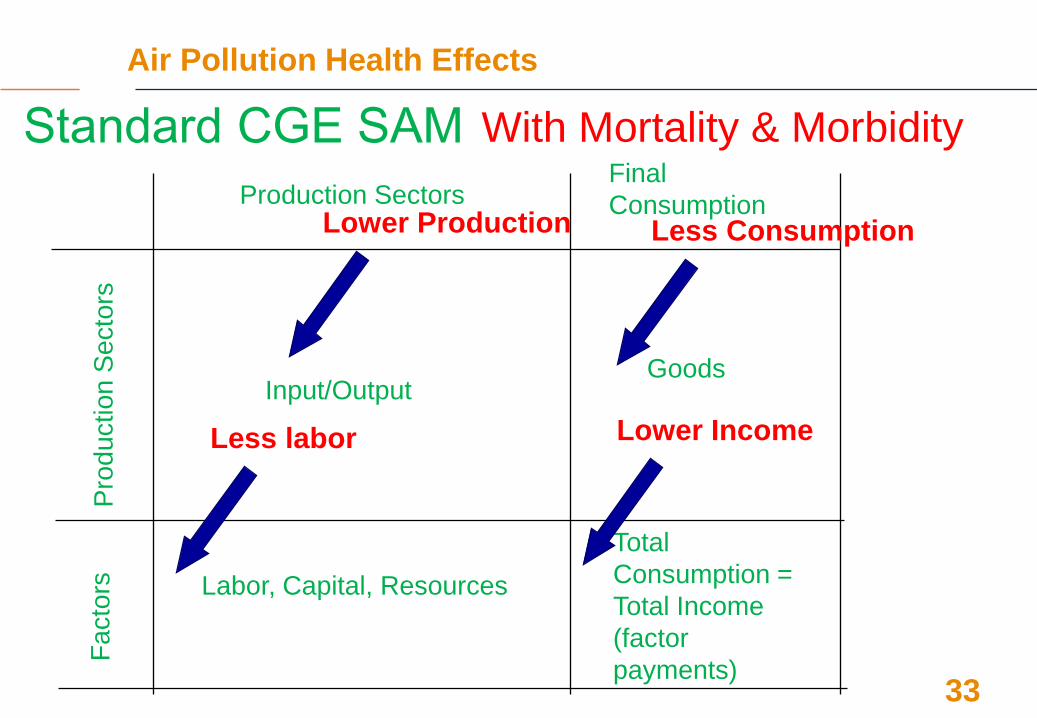
Standard CGE SAM
Production Sectors
Pro
du
ctio
n S
ecto
rs
Fa
cto
rs
Input/Output
Final
Consumption
Labor, Capital, Resources
Goods
Total
Consumption =
Total Income
(factor
payments)
Less labor
Lower Production Less Consumption
Lower Income
With Mortality & Morbidity
Air Pollution Health Effects
33

Air Pollution Health Effects
34
http://globalchange.mit.edu
USA: Report 113 (2004)
Europe: Report 178 (2009)
China: Report 196 (2011)
Global Aerosol: Report 203 (2011)