Climate Change 2007: The Physical Science Basis · A Paleoclimatic Perspective. CO 2 ... the global...
47
Climate Change 2007: The Physical Science Basis Working Group I Contribution to the IPCC Fourth Assessment Report Presented by R.K. Pachauri, IPCC Chair and Bubu Jallow, WG 1 Vice Chair Nairobi, 6 February 2007
Transcript of Climate Change 2007: The Physical Science Basis · A Paleoclimatic Perspective. CO 2 ... the global...
Climate Change 2007: The Physical Science Basis
Working Group I Contribution to the IPCC Fourth Assessment Report
Presented by R.K. Pachauri, IPCC Chair
andBubu Jallow, WG 1 Vice Chair
Nairobi, 6 February 2007
DIRECT OBSERVATIONS OF RECENT CLIMATE CHANGE
Since the TAR, progress in understanding how climate is changing in space and in time has been gained through:
•• improvements and extensions of numerous improvements and extensions of numerous datasets and data analysesdatasets and data analyses
•• broader geographical coveragebroader geographical coverage•• better understanding of uncertainties, andbetter understanding of uncertainties, and•• a wider variety of measurementsa wider variety of measurements
Warming of the climate system is unequivocal, as is now evident from observations of increases in global average air and ocean temperatures, widespread melting of snow and ice, and rising global mean sea level.
Direct Observations of Recent Climate Change
Direct Observations of Recent Climate Change
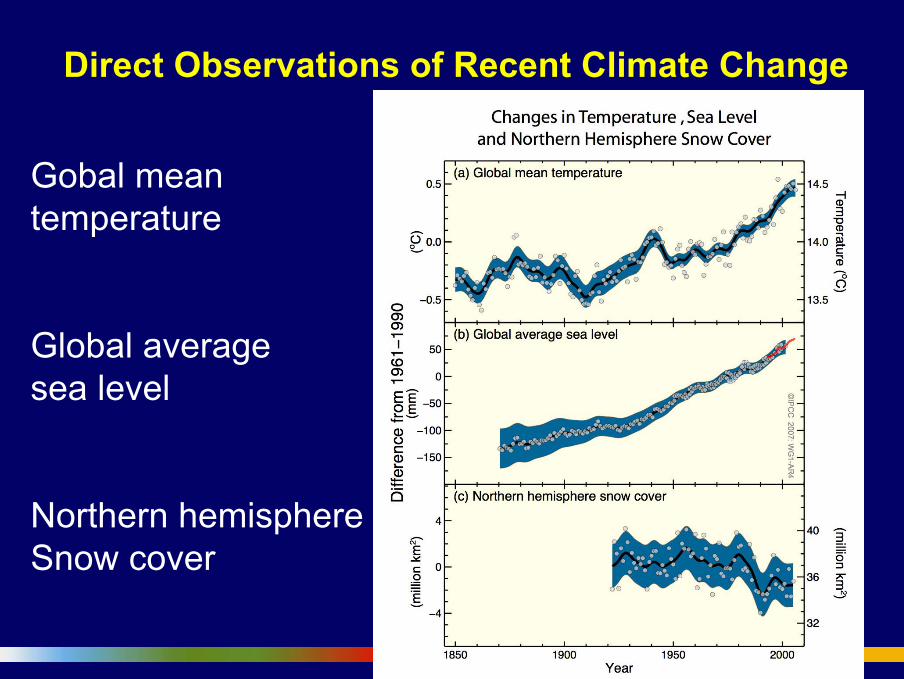
Gobal mean temperature
Global averagesea level
Northern hemisphereSnow cover
Direct Observations of Recent Climate Change
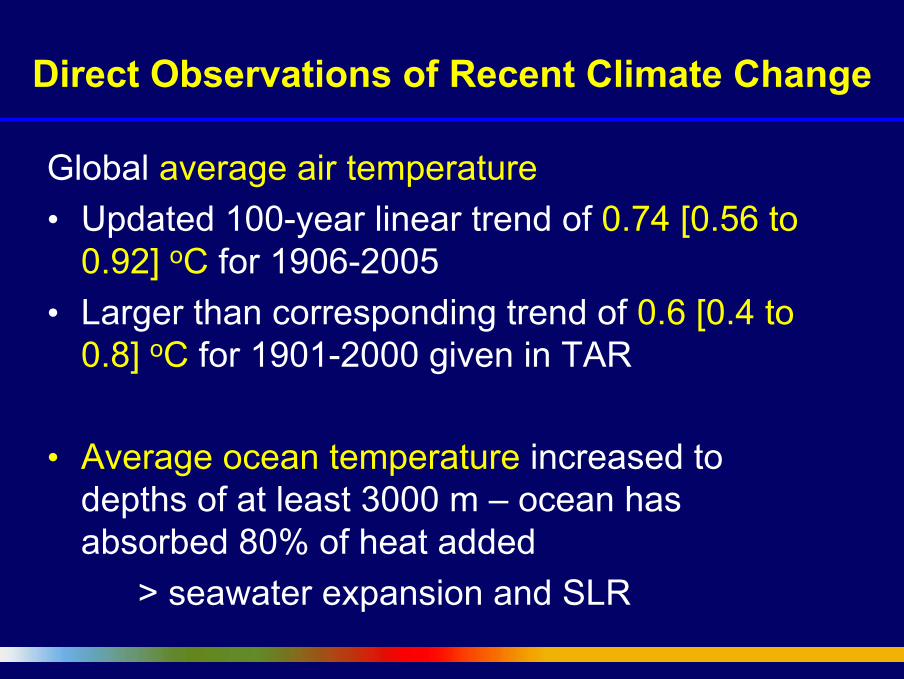
Global average air temperature• Updated 100-year linear trend of 0.74 [0.56 to
0.92] oC for 1906-2005 • Larger than corresponding trend of 0.6 [0.4 to
0.8] oC for 1901-2000 given in TAR
• Average ocean temperature increased to depths of at least 3000 m – ocean has absorbed 80% of heat added
> seawater expansion and SLR
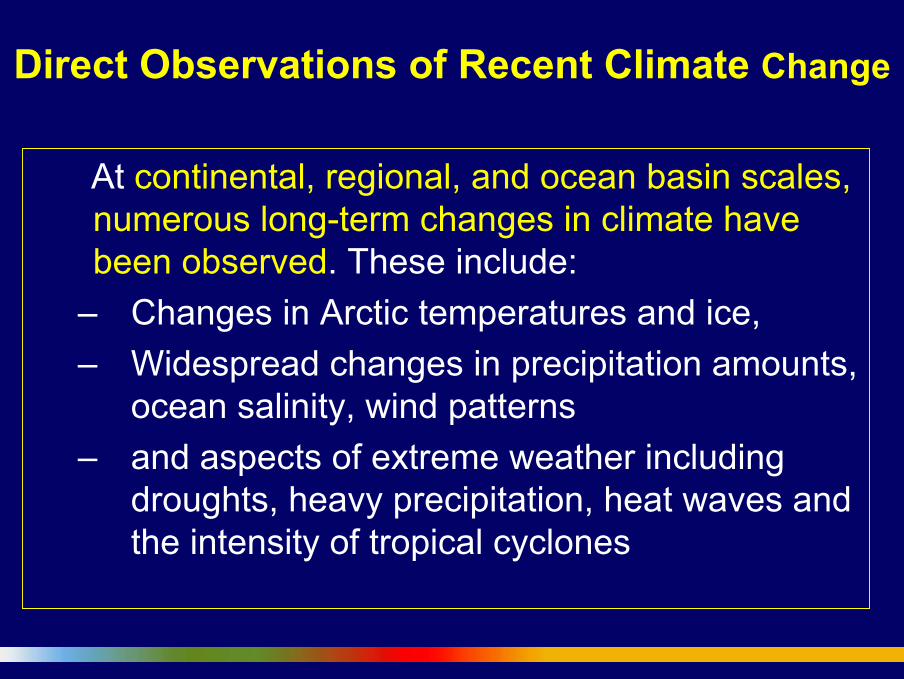
At continental, regional, and ocean basin scales, numerous long-term changes in climate have been observed. These include:
– Changes in Arctic temperatures and ice, – Widespread changes in precipitation amounts,
ocean salinity, wind patterns – and aspects of extreme weather including
droughts, heavy precipitation, heat waves and the intensity of tropical cyclones
Direct Observations of Recent Climate Change
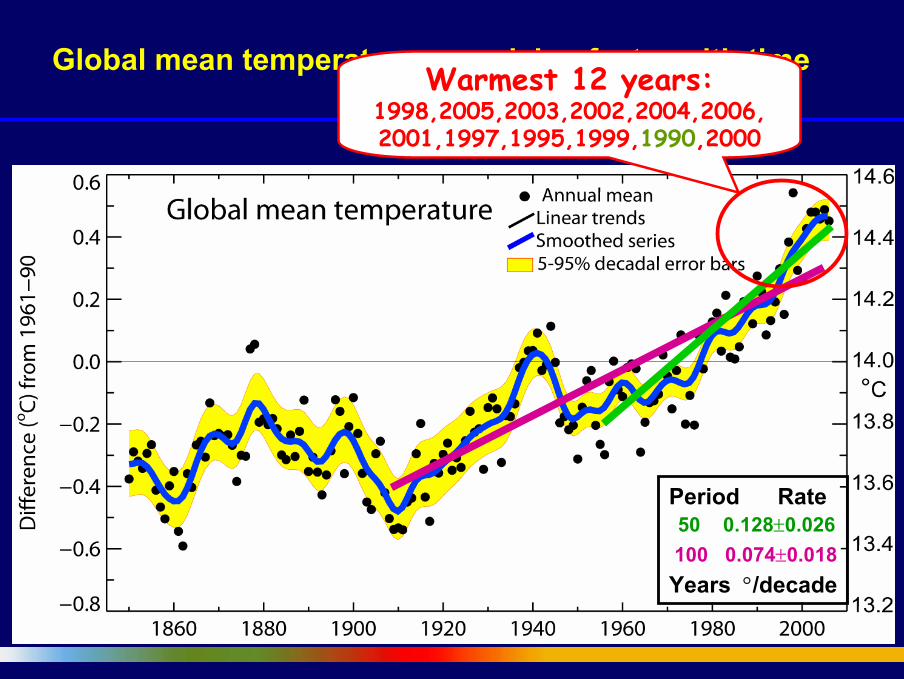
Global mean temperatures are rising faster with time
100 0.074±0.01850 0.128±0.026
Warmest 12 years:1998,2005,2003,2002,2004,2006, 2001,1997,1995,1999,1990,2000
Period Rate
Years °/decade
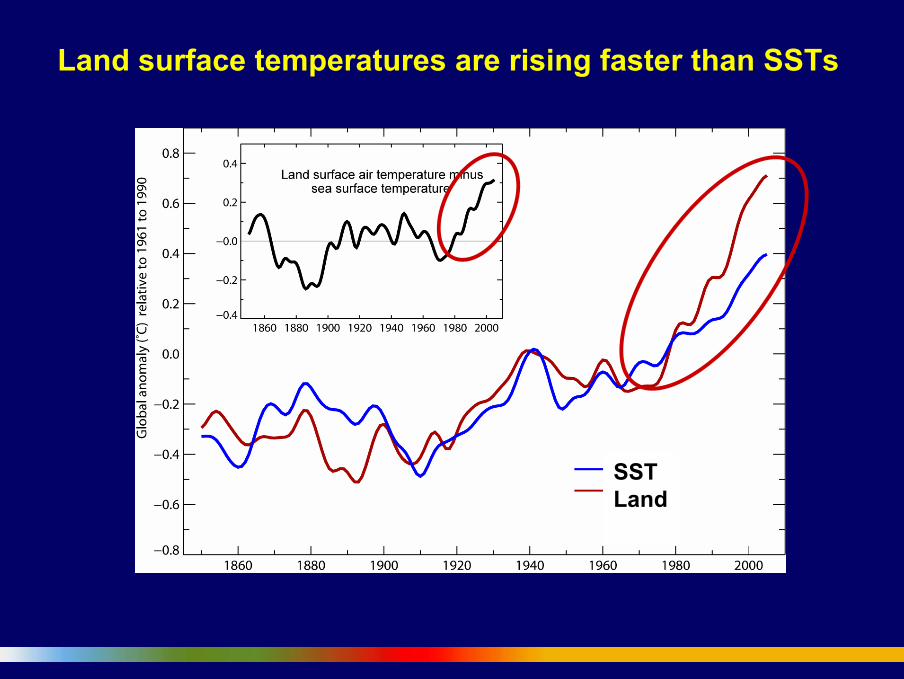
SSTLand
Land surface temperatures are rising faster than SSTs
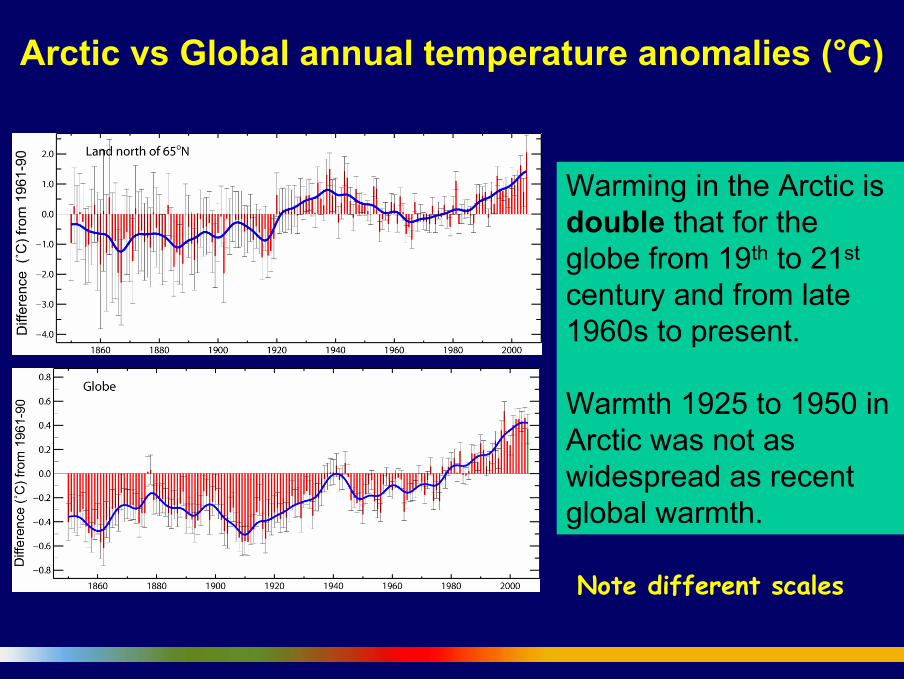
Warming in the Arctic is double that for the globe from 19th to 21st
century and from late 1960s to present.
Warmth 1925 to 1950 in Arctic was not as widespread as recent global warmth.
Note different scales
Arctic vs Global annual temperature anomalies (°C)
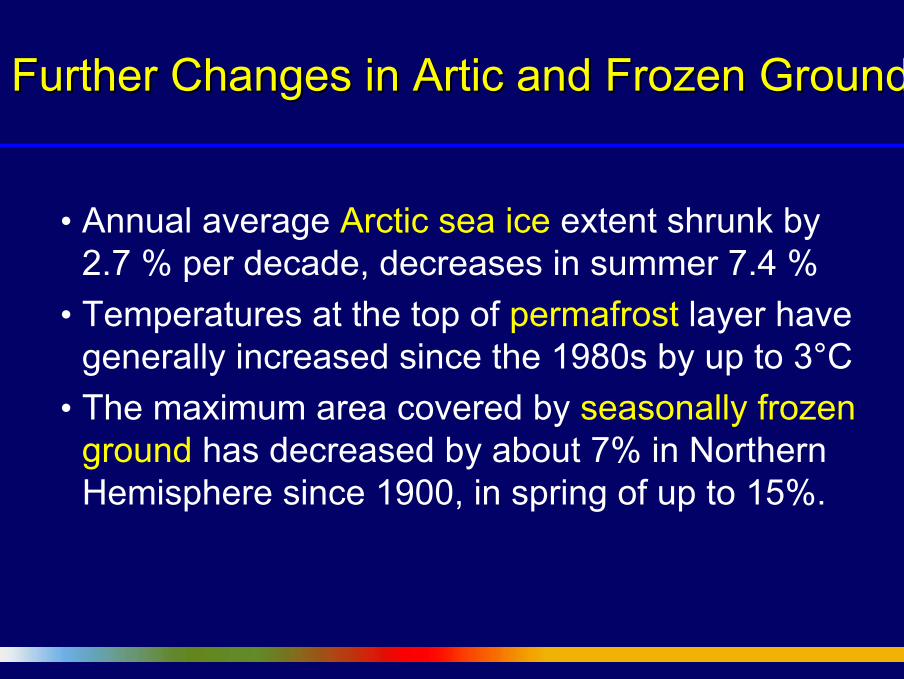
Further Changes in Artic and Frozen GroundFurther Changes in Artic and Frozen Ground
• Annual average Arctic sea ice extent shrunk by 2.7 % per decade, decreases in summer 7.4 %
• Temperatures at the top of permafrost layer have generally increased since the 1980s by up to 3°C
• The maximum area covered by seasonally frozen ground has decreased by about 7% in Northern Hemisphere since 1900, in spring of up to 15%.
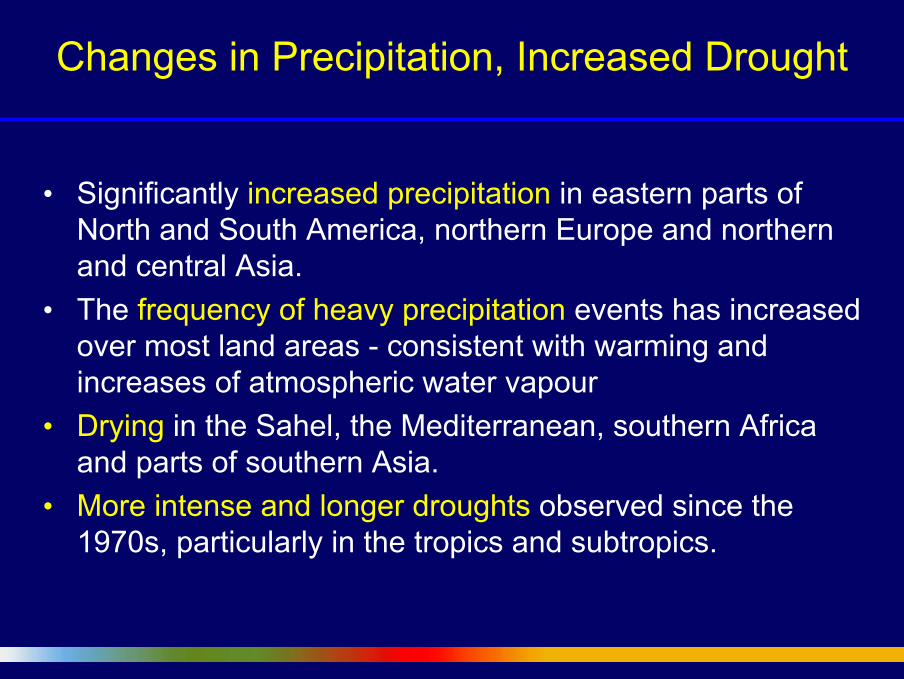
Changes in Precipitation, Increased Drought
• Significantly increased precipitation in eastern parts of North and South America, northern Europe and northern and central Asia.
• The frequency of heavy precipitation events has increased over most land areas - consistent with warming and increases of atmospheric water vapour
• Drying in the Sahel, the Mediterranean, southern Africa and parts of southern Asia.
• More intense and longer droughts observed since the 1970s, particularly in the tropics and subtropics.
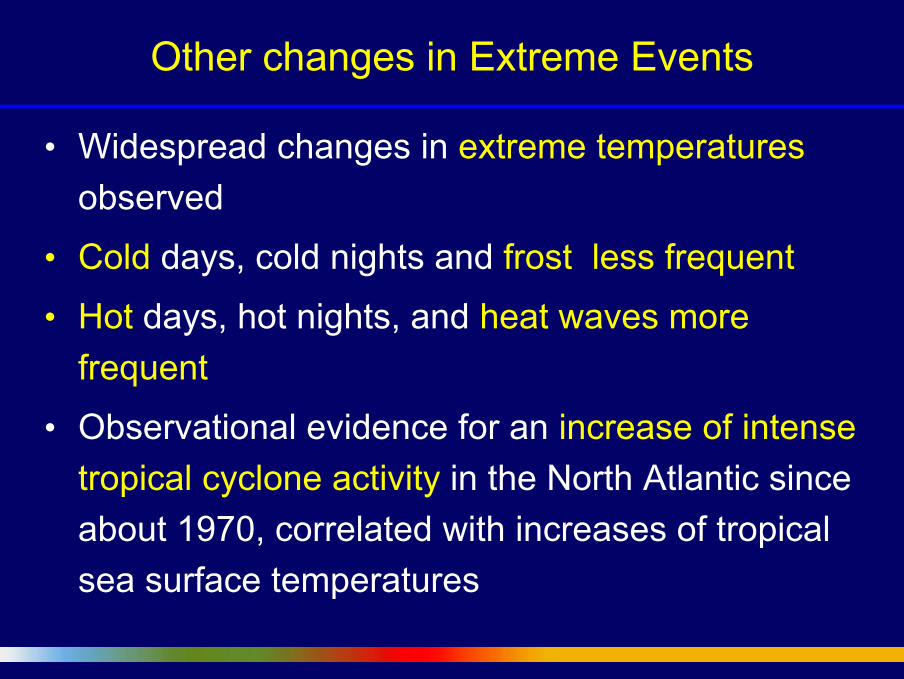
• Widespread changes in extreme temperaturesobserved
• Cold days, cold nights and frost less frequent
• Hot days, hot nights, and heat waves more frequent
• Observational evidence for an increase of intense tropical cyclone activity in the North Atlantic since about 1970, correlated with increases of tropical sea surface temperatures
Other changes in Extreme Events
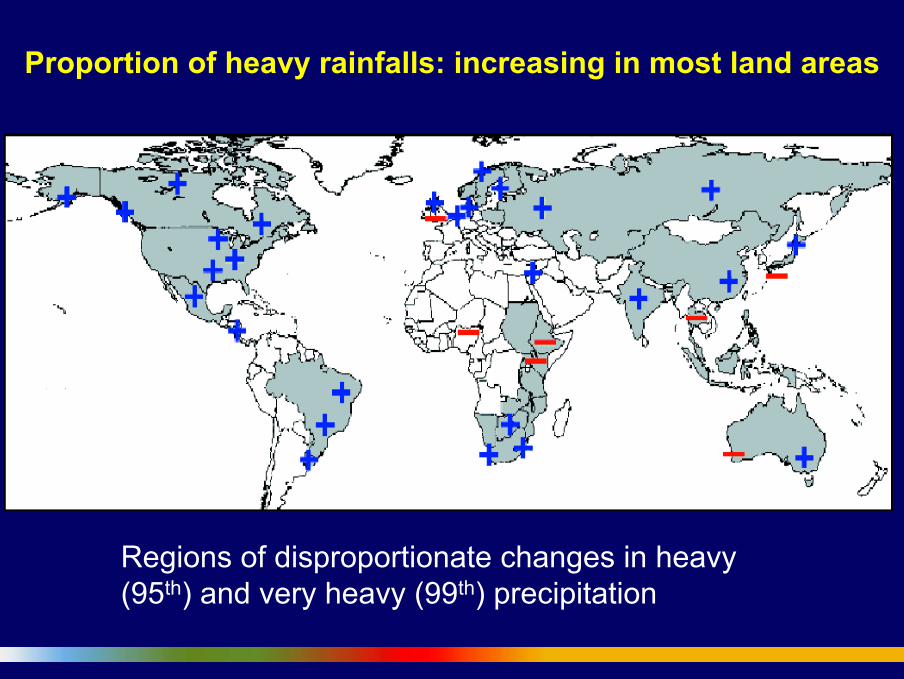
Regions of disproportionate changes in heavy (95th) and very heavy (99th) precipitation
Proportion of heavy rainfalls: increasing in most land areas
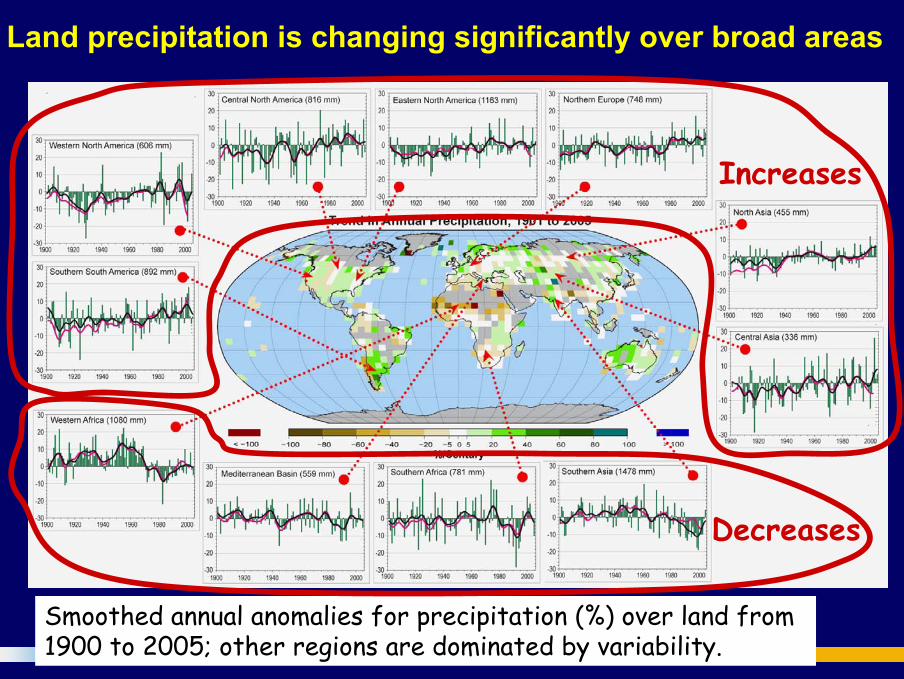
Smoothed annual anomalies for precipitation (%) over land from 1900 to 2005; other regions are dominated by variability.
Land precipitation is changing significantly over broad areas
Increases
Decreases
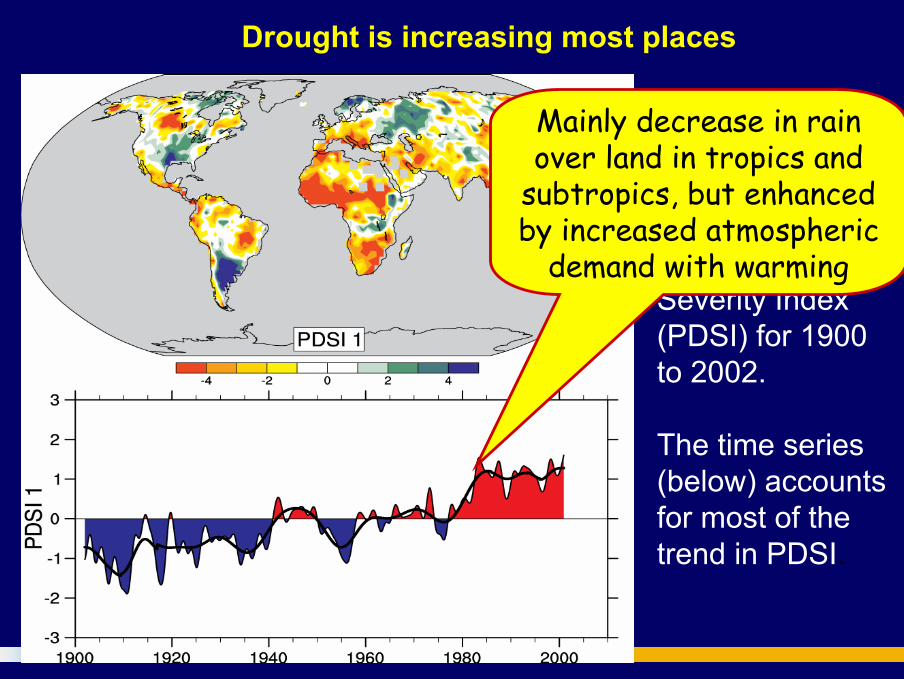
The most important spatial pattern (top) of the monthly Palmer Drought Severity Index (PDSI) for 1900 to 2002.
The time series (below) accounts for most of the trend in PDSI.
Drought is increasing most places
Mainly decrease in rain over land in tropics and
subtropics, but enhanced by increased atmospheric
demand with warming
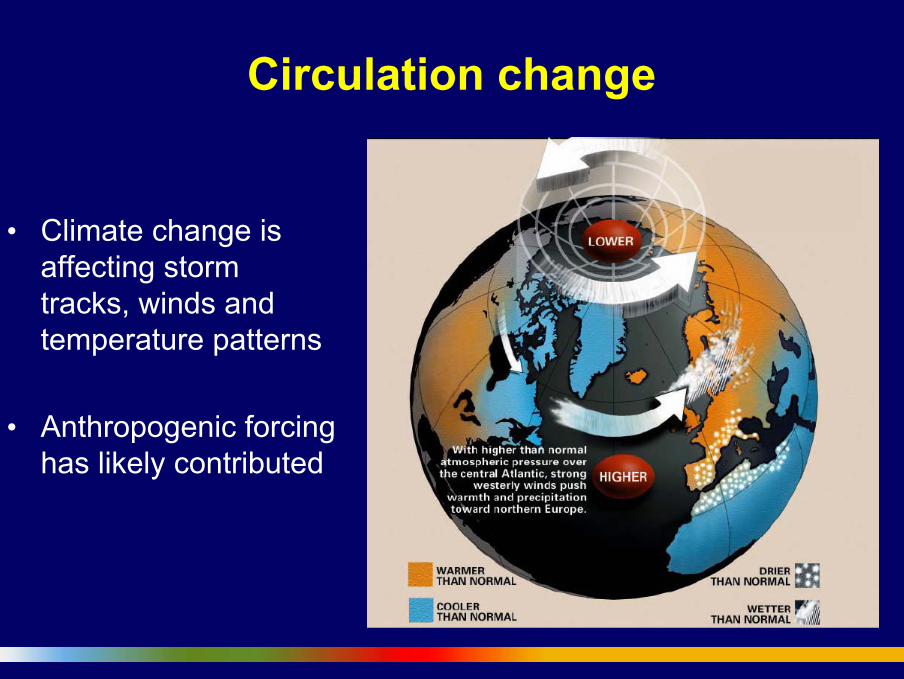
Circulation change
• Climate change is affecting storm tracks, winds and temperature patterns
• Anthropogenic forcing has likely contributed
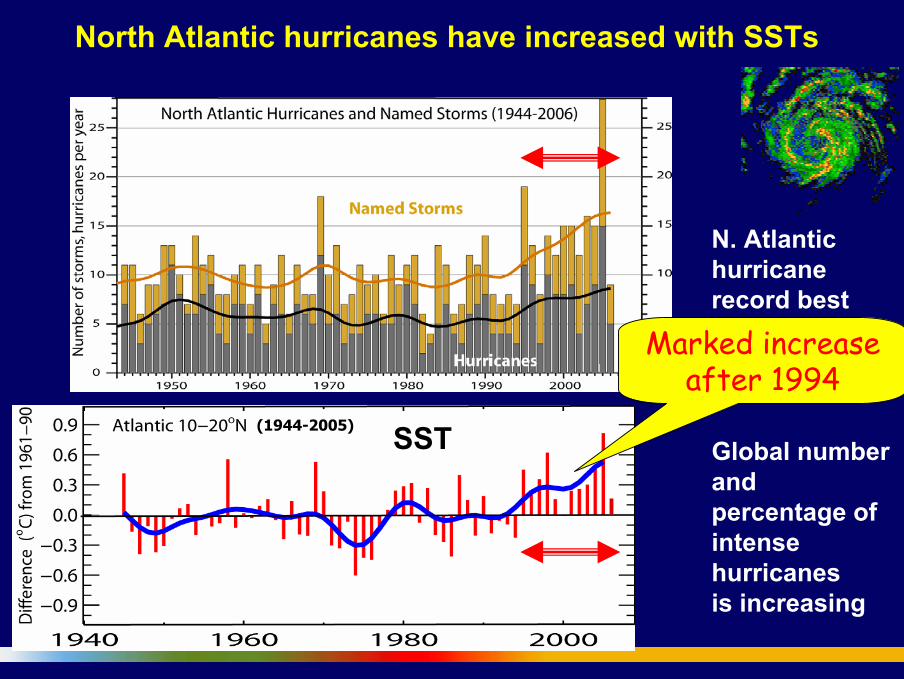
N. Atlantic hurricane record best after 1944 with aircraft surveillance.
Global number and percentage of intense hurricanes is increasing
North Atlantic hurricanes have increased with SSTs
SST(1944-2005)
Marked increase after 1994
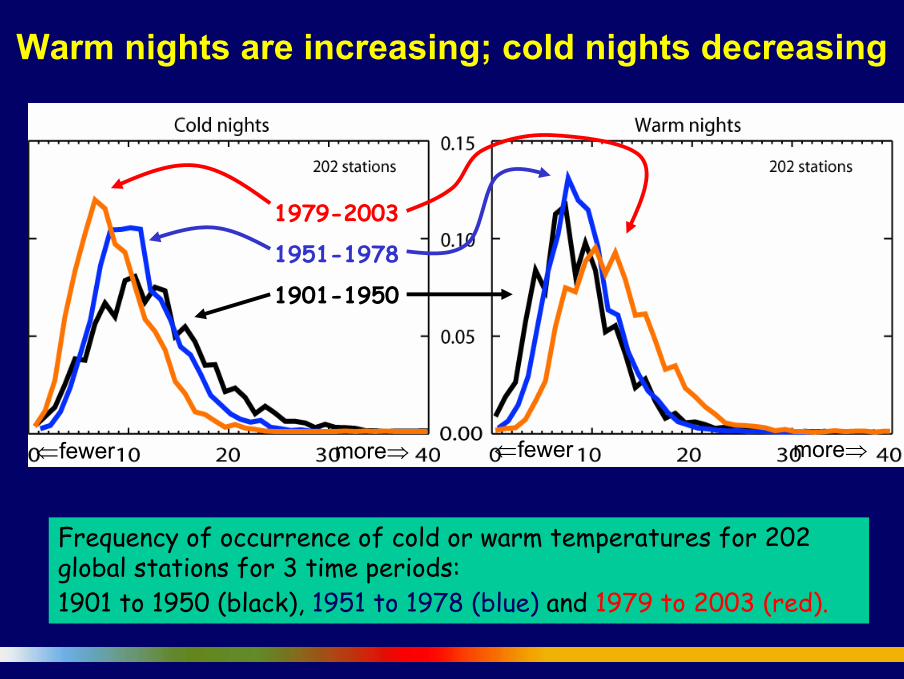
Frequency of occurrence of cold or warm temperatures for 202 global stations for 3 time periods: 1901 to 1950 (black), 1951 to 1978 (blue) and 1979 to 2003 (red).
1979-2003
1951-1978
1901-1950
Warm nights are increasing; cold nights decreasing
⇐fewer more⇒ ⇐fewer more⇒
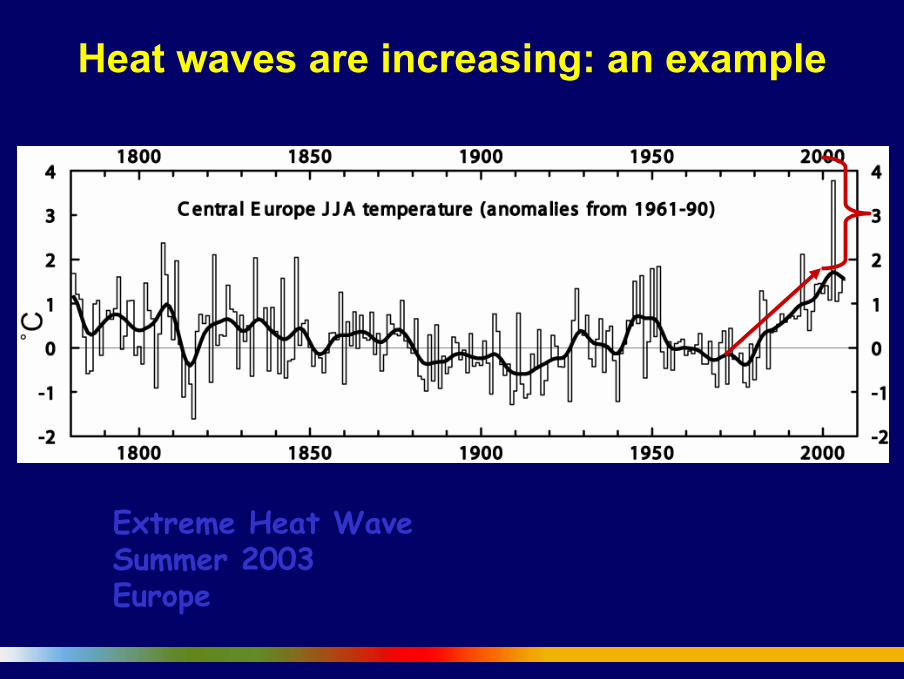
Extreme Heat WaveSummer 2003Europe
Heat waves are increasing: an example
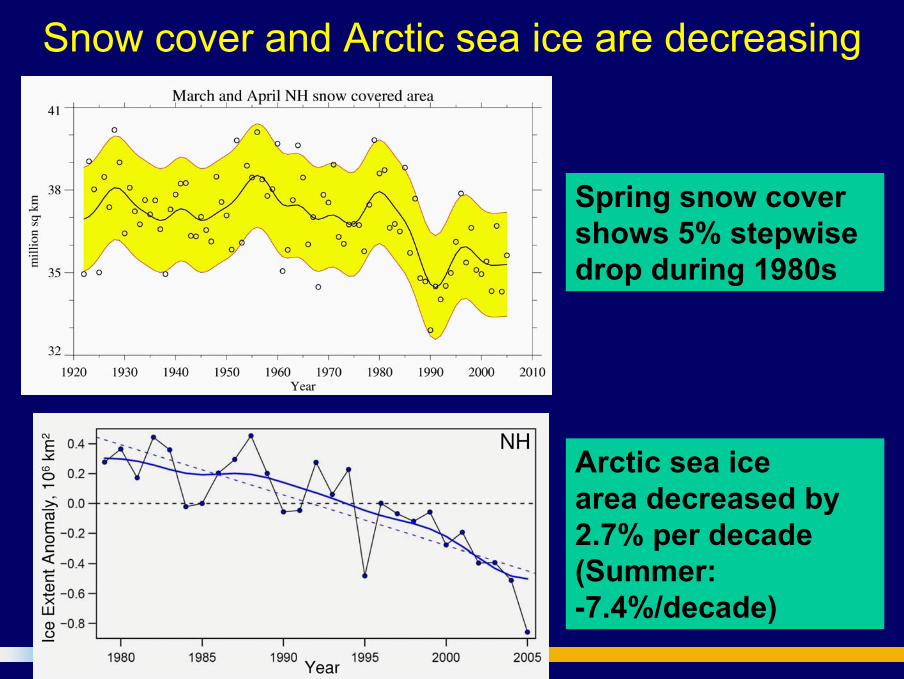
Snow cover and Arctic sea ice are decreasing
Spring snow covershows 5% stepwise drop during 1980s
Arctic sea ice area decreased by 2.7% per decade(Summer: -7.4%/decade)
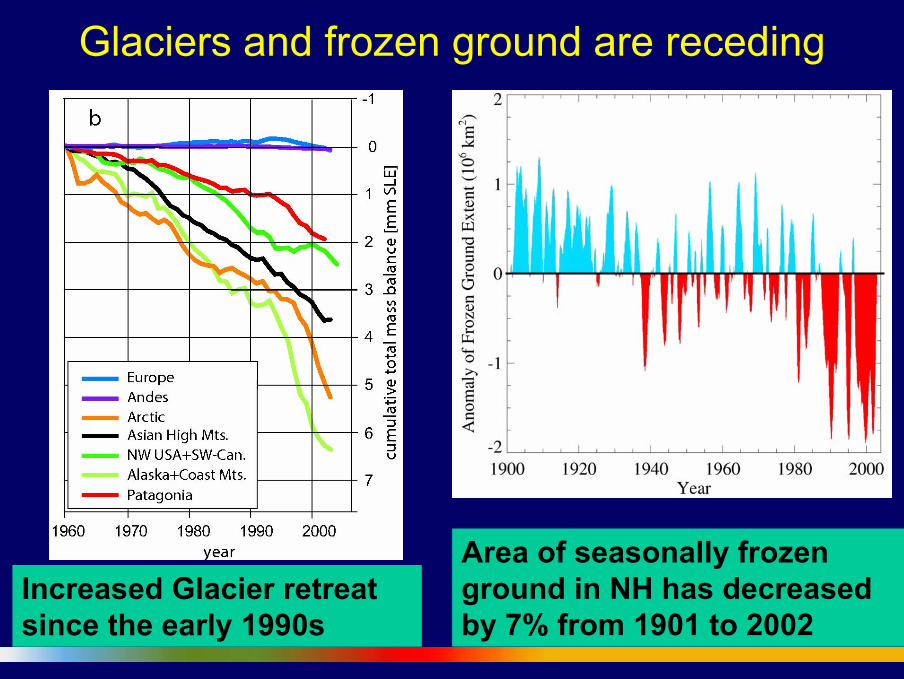
Glaciers and frozen ground are receding
Area of seasonally frozen ground in NH has decreasedby 7% from 1901 to 2002
Increased Glacier retreat since the early 1990s
Some aspects of climate have not been observed to change:
• Tornadoes
• Dust-storms
• Hail
• Lightning
• Antarctic sea ice
Direct Observations of Recent Climate Change
Paleoclimate information supports the interpretation that the warmth of the last half century is unusual in at least the previous 1300 years. The last time the polar regions were significantly warmer than present for an extended period (about 125,000 years ago), reductions in polar ice volume led to 4 to 6 metres of sea level rise.
A Paleoclimatic Perspective
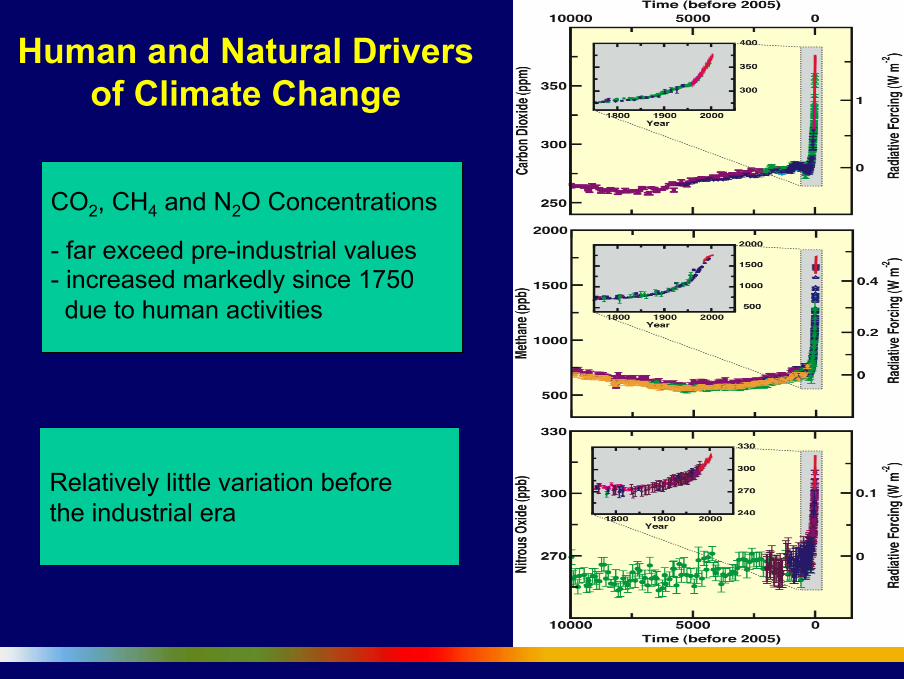
CO2, CH4 and N2O Concentrations
- far exceed pre-industrial values- increased markedly since 1750due to human activities
Relatively little variation beforethe industrial era
Human and Natural Drivers of Climate Change
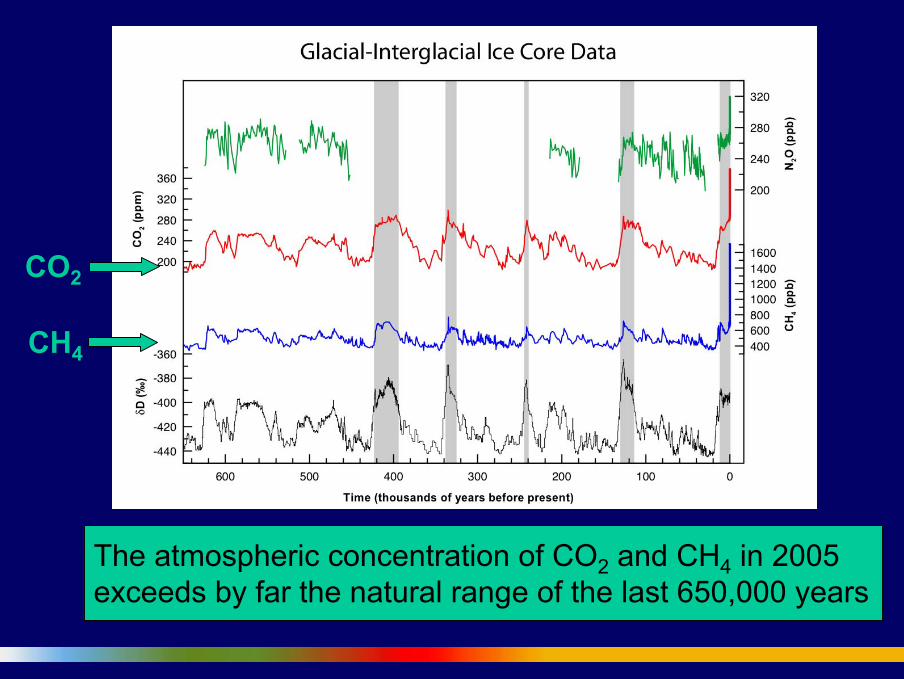
The atmospheric concentration of CO2 and CH4 in 2005 exceeds by far the natural range of the last 650,000 years
CO2
CH4
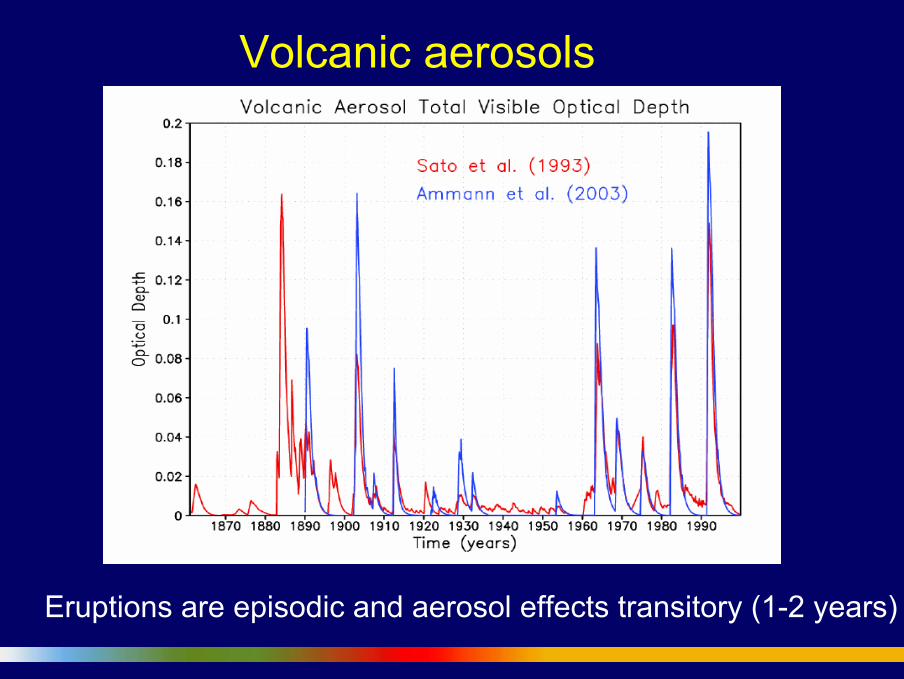
Volcanic aerosols
Eruptions are episodic and aerosol effects transitory (1-2 years)
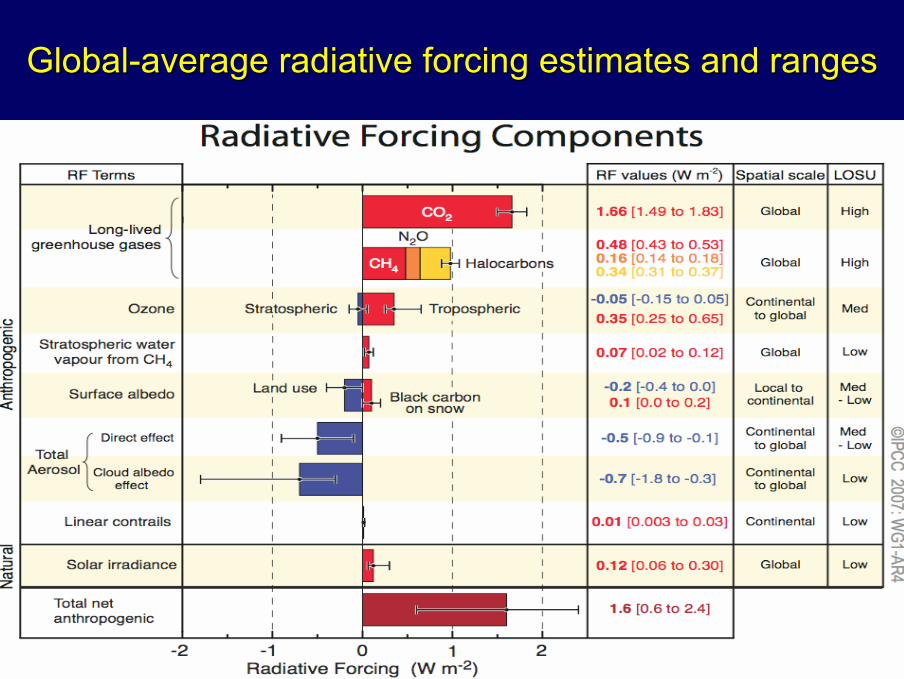
GlobalGlobal--average radiative forcing estimates and rangesaverage radiative forcing estimates and ranges
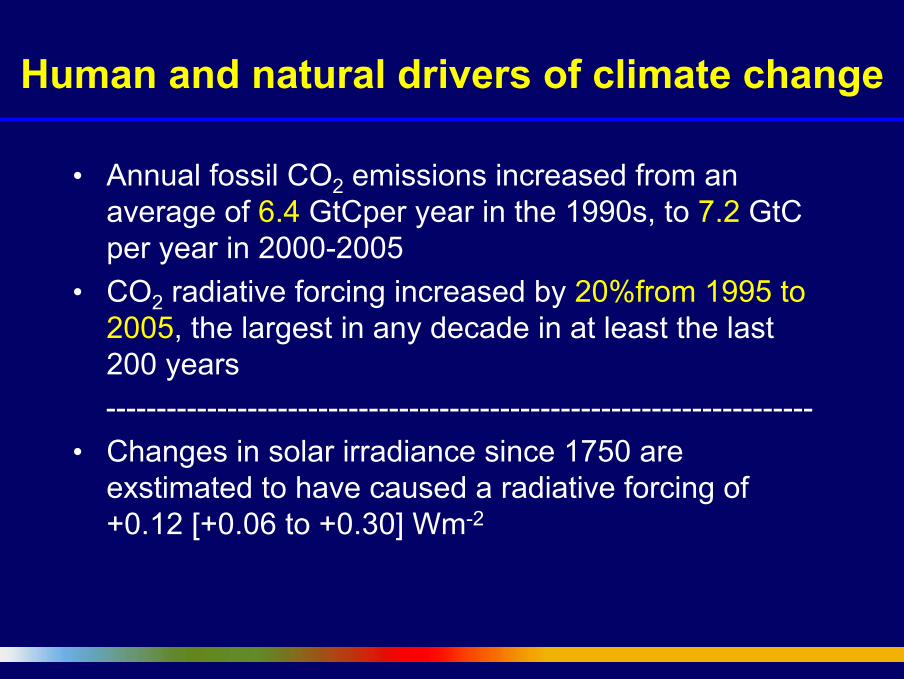
Human and natural drivers of climate change
• Annual fossil CO2 emissions increased from an average of 6.4 GtCper year in the 1990s, to 7.2 GtC per year in 2000-2005
• CO2 radiative forcing increased by 20%from 1995 to 2005, the largest in any decade in at least the last 200 years ----------------------------------------------------------------------
• Changes in solar irradiance since 1750 are exstimated to have caused a radiative forcing of +0.12 [+0.06 to +0.30] Wm-2
Human and Natural Drivers of Climate Change
The understanding of anthropogenic warming and cooling influences on climate has improved since the Third Assessment Report (TAR), leading to very high confidence that the globally averaged net effect of human activities since 1750 has been one of warming, with a radiative forcing of +1.6 [+0.6 to +2.4] W m-2.

• extremely unlikely without external forcing
• very unlikely due to known natural causes alone
Observed widespread warming
Global ocean
1955 20051980
Annual Trend 1979 to 2005
Surface Troposphere
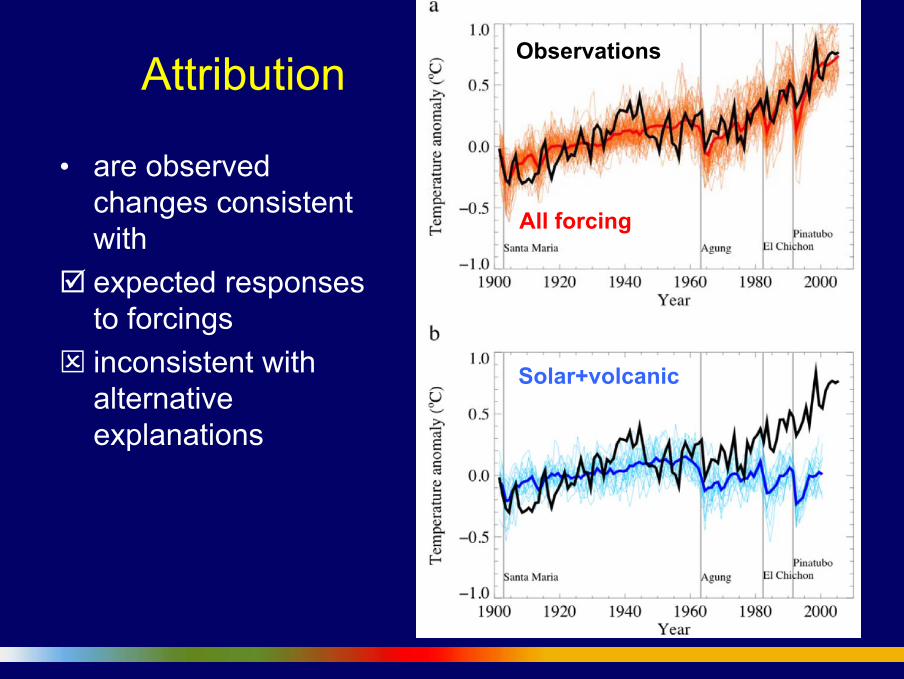
Attribution
• are observed changes consistent with expected responses to forcings inconsistent with alternative explanations
Observations
All forcing
Solar+volcanic

Understanding and Attributing Climate Change
Continental warming likely shows a significant anthropogenic contribution over the past 50 years
Understanding and Attributing Climate Change
Most of the observed increase in globally averaged temperatures since the mid-20th century is very likely due to the observed increase in anthropogenic greenhouse gas concentrations.This is an advance since the TAR’s conclusion that “most of the observed warming over the last 50 years is likely to have been due to the increase in greenhouse gas concentrations”. Discernible human influences now extend to other aspects of climate, including ocean warming, continental-average temperatures, temperature extremes and wind patterns
Understanding Climate ChangeClimate Sensitivity
Analysis of climate models together with constraints from observations enables an assessed likely range for climate sensitivity and provides increased confidence in the understanding of climate system response to radiative forcing.
• Assumes doubling of carbon dioxide concentration
• Model experiment - not a projection
• Estimates equilibrium response to sustained radiative forcing
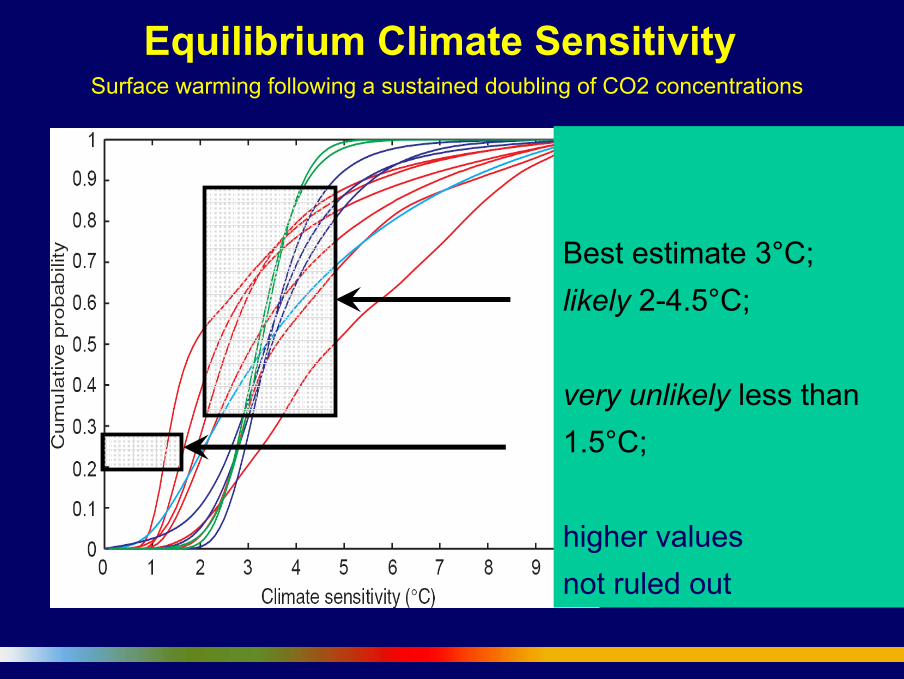
Equilibrium Climate SensitivitySurface warming following a sustained doubling of CO2 concentrations
Best estimate 3°C; likely 2-4.5°C;
very unlikely less than 1.5°C;
higher valuesnot ruled out
Projections of Future Changes in Climate
Continued greenhouse gas emissions at or above current rates would cause further warming and induce many changes in the global climate system during the 21st century that would very likely be larger than those observed during the 20th century.
• Best estimate and assessed likelihood range for future temperature projections for first time
• Broadly similar to the TAR but not directly comparable
Projections of Future Changes in Climate
• For the next two decades a warming of about 0.2°C per decade is projected for a range of SRES emission scenarios.
• Even if the concentrations of all greenhouse gases and aerosols had been kept constant at year 2000 levels, a further warming of about 0.1°C per decade would be expected.
• Earlier IPCC projections of 0.15 to 0.3 oC per decade can now be compared with observed values of 0.2 oC
Projections of Future Changes in Climate
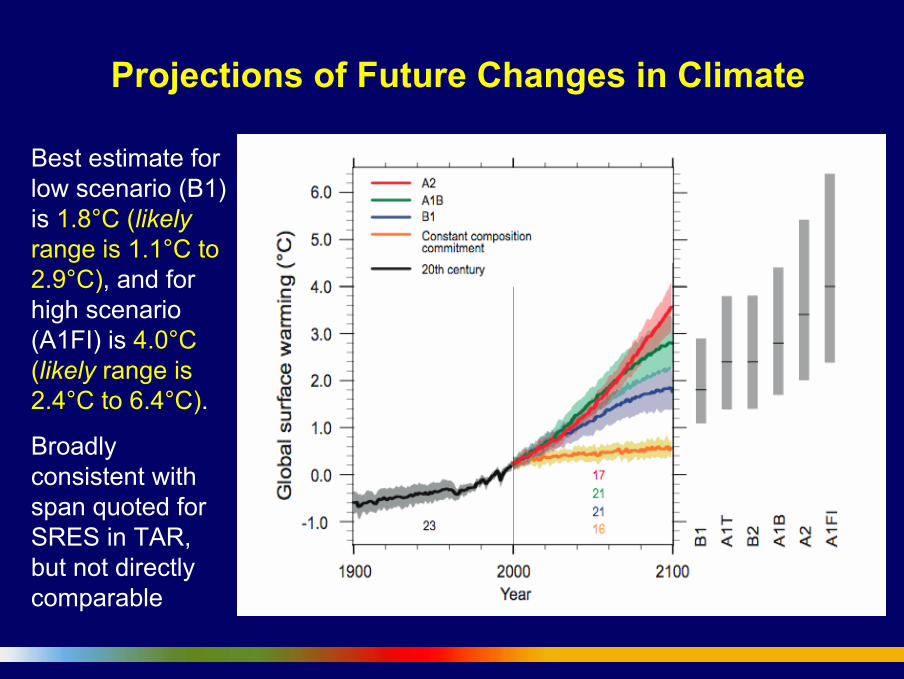
Best estimate for low scenario (B1) is 1.8°C (likely range is 1.1°C to 2.9°C), and for high scenario (A1FI) is 4.0°C (likely range is 2.4°C to 6.4°C).
Broadly consistent with span quoted for SRES in TAR, but not directly comparable
Projections of Future Changes in Climate
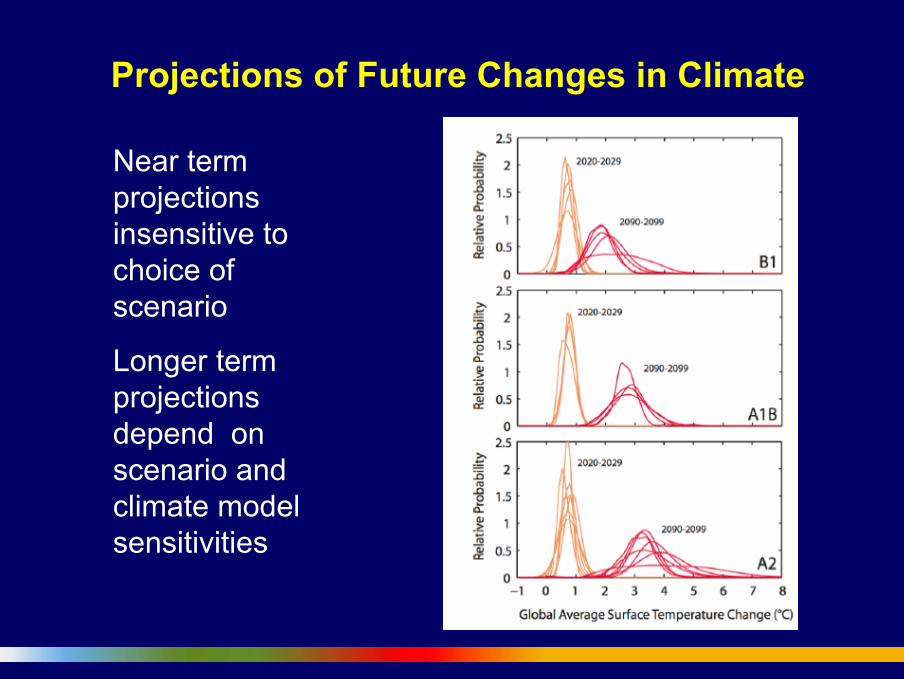
Near term projections insensitive to choice of scenario
Longer term projections depend on scenario and climate model sensitivities
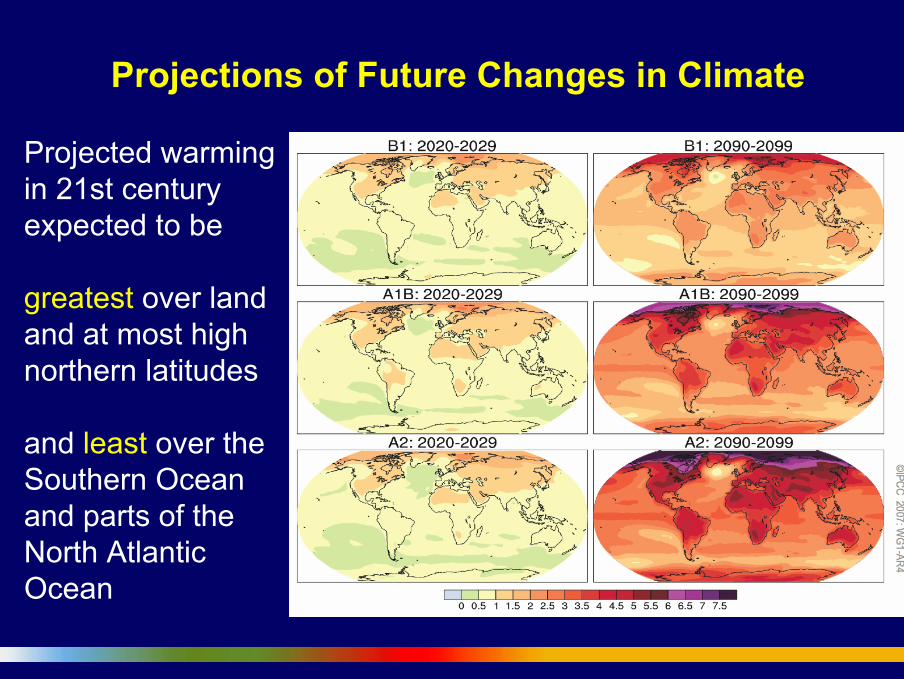
Projected warmingin 21st century expected to be
greatest over land and at most high northern latitudes
and least over the Southern Ocean and parts of the North Atlantic Ocean
Projections of Future Changes in Climate
Projections of Future Changes in Climate
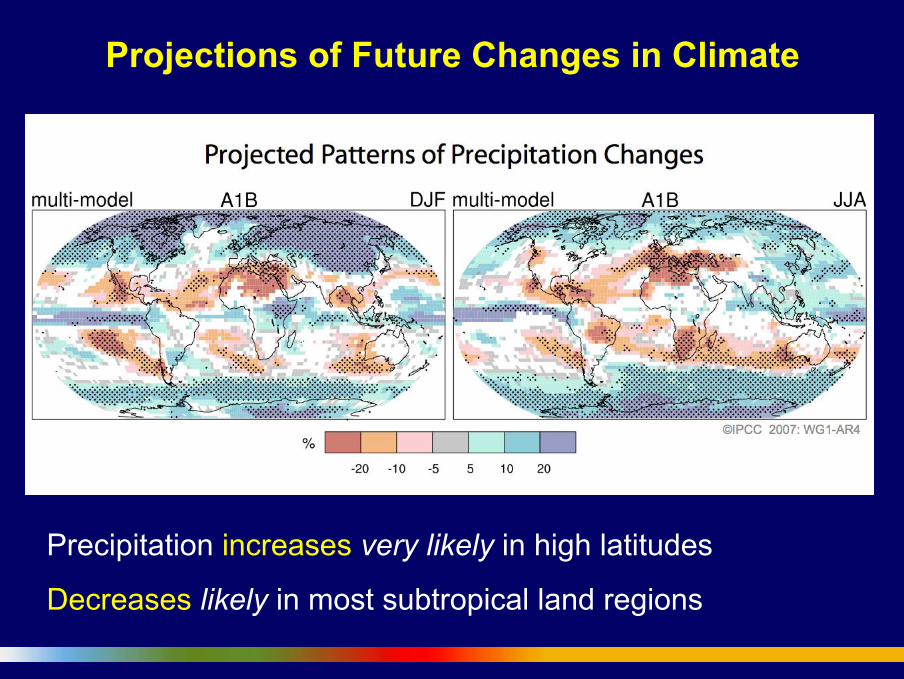
Precipitation increases very likely in high latitudes
Decreases likely in most subtropical land regions
Projections of Future Changes in Climate
There is now higher confidence in projected patterns of warming and other regional-scale features, including changes in wind patterns, precipitation, and some aspects of extremes and of ice.
• Snow cover is projected to contract• Widespread increases in thaw depth most
permafrost regions• Sea ice is projected to shrink in both the
Arctic and Antarctic• In some projections, Arctic late-summer
sea ice disappears almost entirely by the latter part of the 21st century
PROJECTIONS OF FUTURE PROJECTIONS OF FUTURE CHANGES IN CLIMATEIN CLIMATE
• Very likely that hot extremes, heat waves, and heavy precipitation events will continue to become more frequent
• Likely that future tropical cyclones will become more intense, with larger peak wind speeds and more heavy precipitation • less confidence in decrease of total number
• Extra-tropical storm tracks projected to move poleward with consequent changes in wind, precipitation, and temperature patterns
PROJECTIONS OF FUTURE CHANGES IN CLIMATEPROJECTIONS OF FUTURE CHANGES IN CLIMATE
• Based on current model simulations, it is very likely that the meridional overturning circulation (MOC) of the Atlantic Ocean will slow down during the 21st century. • longer term changes not assessed with confidence
• Temperatures in the Atlantic region are projected to increase despite such changes due to the much larger warming associated with projected increases of greenhouse gases.
PROJECTIONS OF FUTURE CHANGES IN CLIMATE
• Anthropogenic warming and sea level rise would continue for centuries due to the timescales associated with climate processes and feedbacks, even if greenhouse gas concentrations were to be stabilized.
• Temperatures in excess of 1.9 to 4.6°C warmer than pre-industrial sustained for millennia…eventual melt of the Greenland ice sheet. Would raise sea level by 7 m. Comparable to 125,000 years ago.
PROJECTIONS OF FUTURE CHANGES IN CLIMATE

Watch out for …
• Working Group 2Brussels, Belgium; 2-5 April 2007
• Working Group 3Bangkok,Thailand; 30 April – 3 May 2007
• Synthesis ReportValencia, Spain; 12-16 November