Clean water grows
19
Clean Water Grows Soil and Water Conservation Society Lara Bryant, National Wildlife Federation July 28, 2014 1
-
Upload
soil-and-water-conservation-society -
Category
Environment
-
view
105 -
download
0
Transcript of Clean water grows
Clean Water GrowsSoil and Water Conservation Society
Lara Bryant, National Wildlife FederationJuly 28, 2014
1
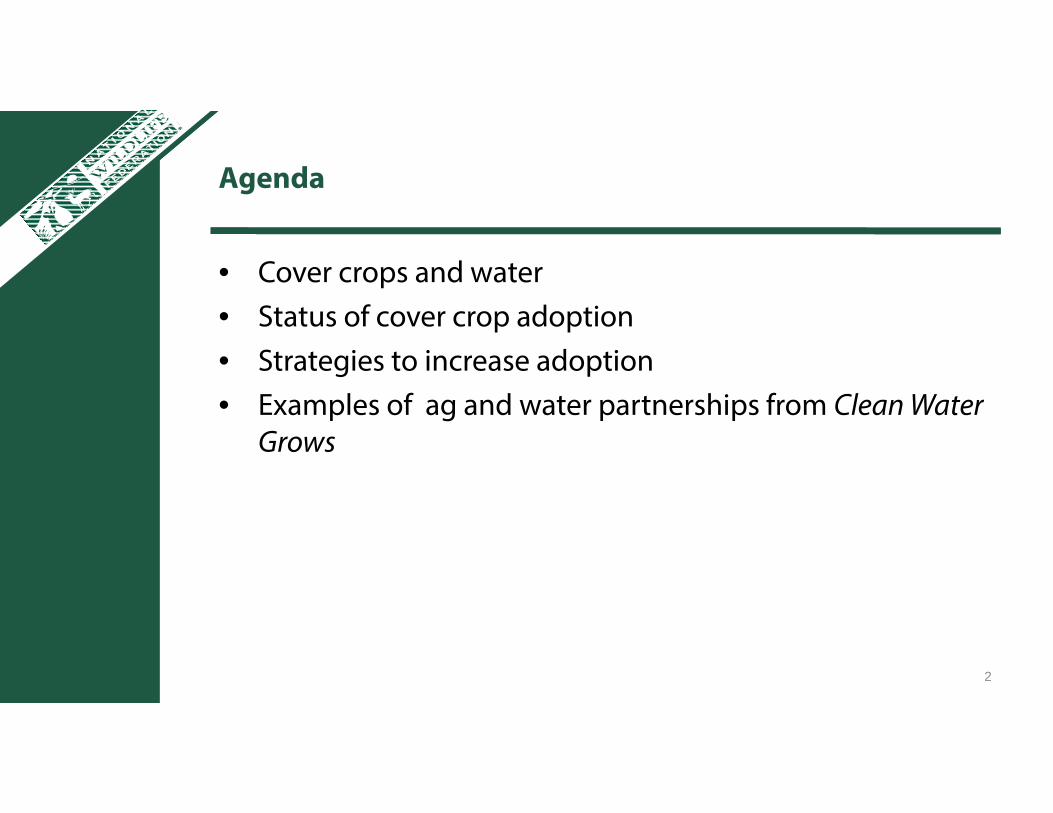
Agenda
• Cover crops and water• Status of cover crop adoption• Strategies to increase adoption• Examples of ag and water partnerships from Clean Water
Grows
2
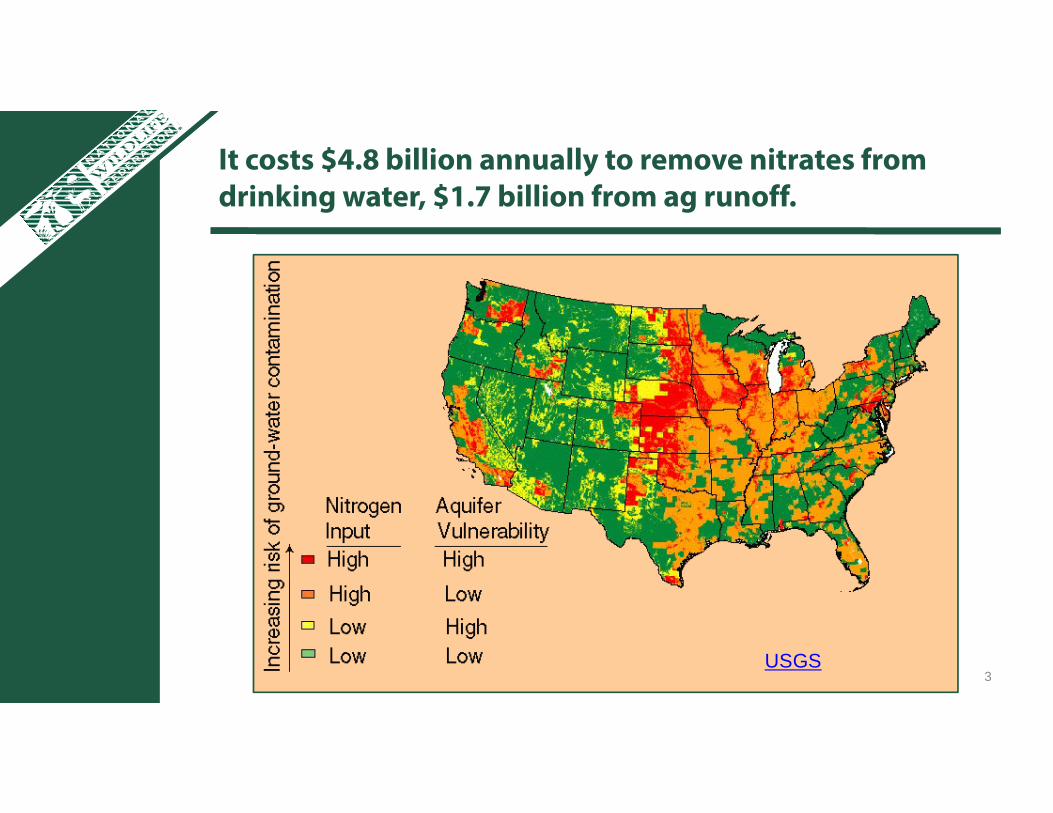
It costs $4.8 billion annually to remove nitrates from drinking water, $1.7 billion from ag runoff.
3USGS
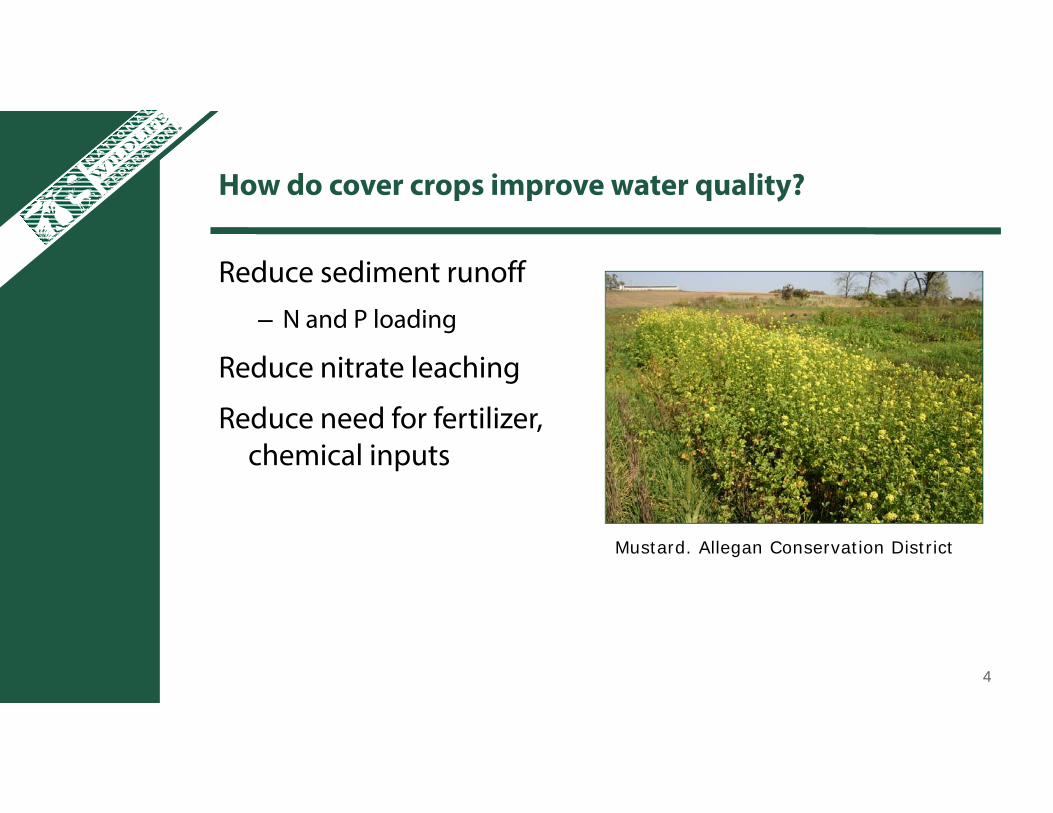
How do cover crops improve water quality?
Reduce sediment runoff– N and P loading
Reduce nitrate leaching
Reduce need for fertilizer, chemical inputs
Mustard. Allegan Conservation District
4
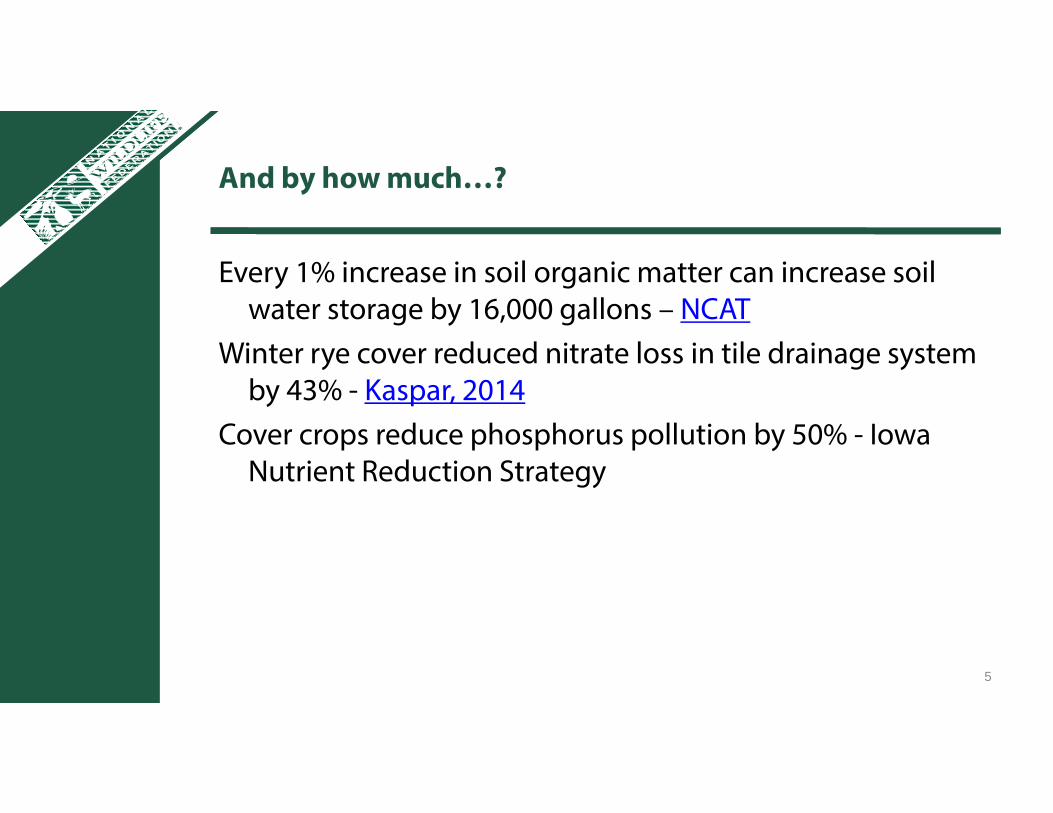
And by how much…?
Every 1% increase in soil organic matter can increase soil water storage by 16,000 gallons – NCAT
Winter rye cover reduced nitrate loss in tile drainage system by 43% - Kaspar, 2014
Cover crops reduce phosphorus pollution by 50% - Iowa Nutrient Reduction Strategy
5
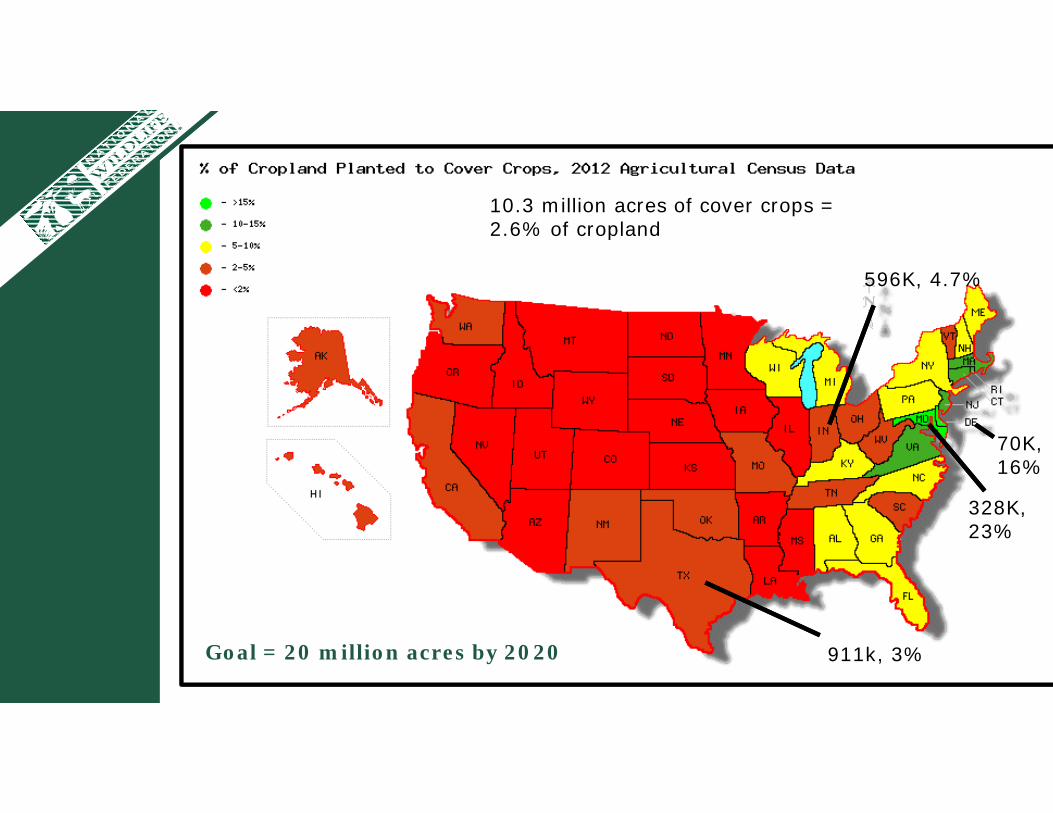
Goal = 20 million acres by 2020
10.3 million acres of cover crops = 2.6% of cropland
911k, 3%
596K, 4.7%
328K, 23%
70K, 16%
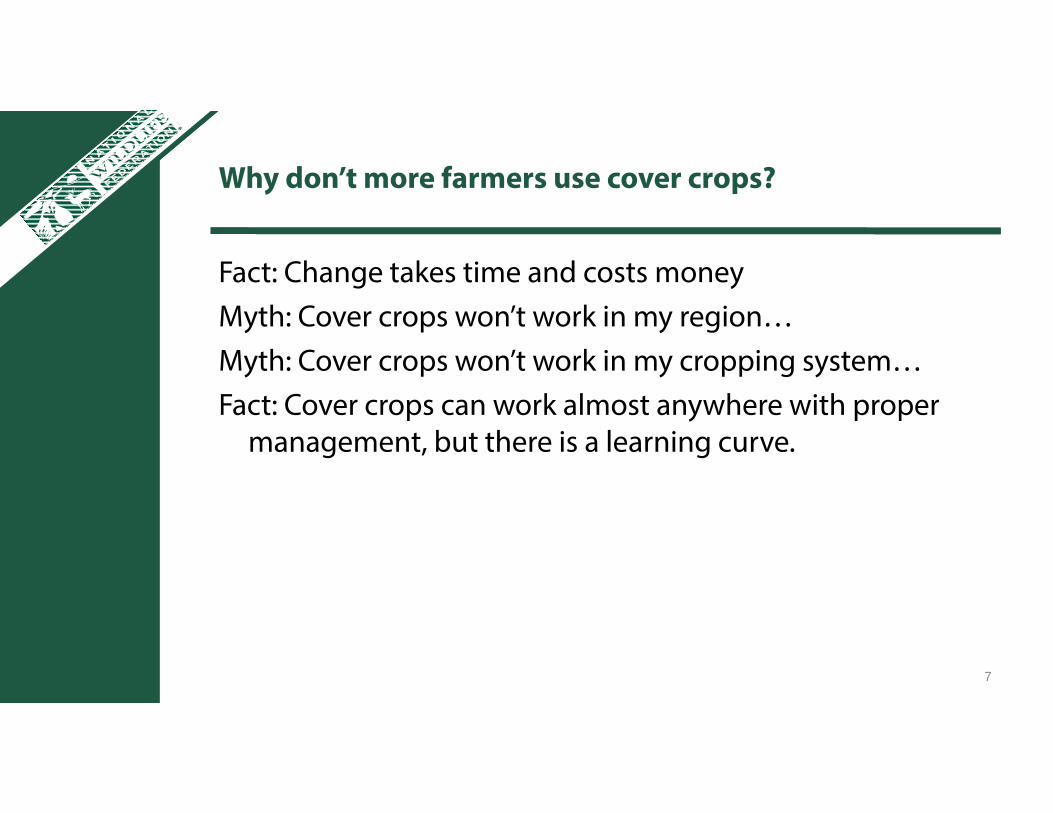
Why don’t more farmers use cover crops?
Fact: Change takes time and costs moneyMyth: Cover crops won’t work in my region…Myth: Cover crops won’t work in my cropping system…Fact: Cover crops can work almost anywhere with proper
management, but there is a learning curve.
7
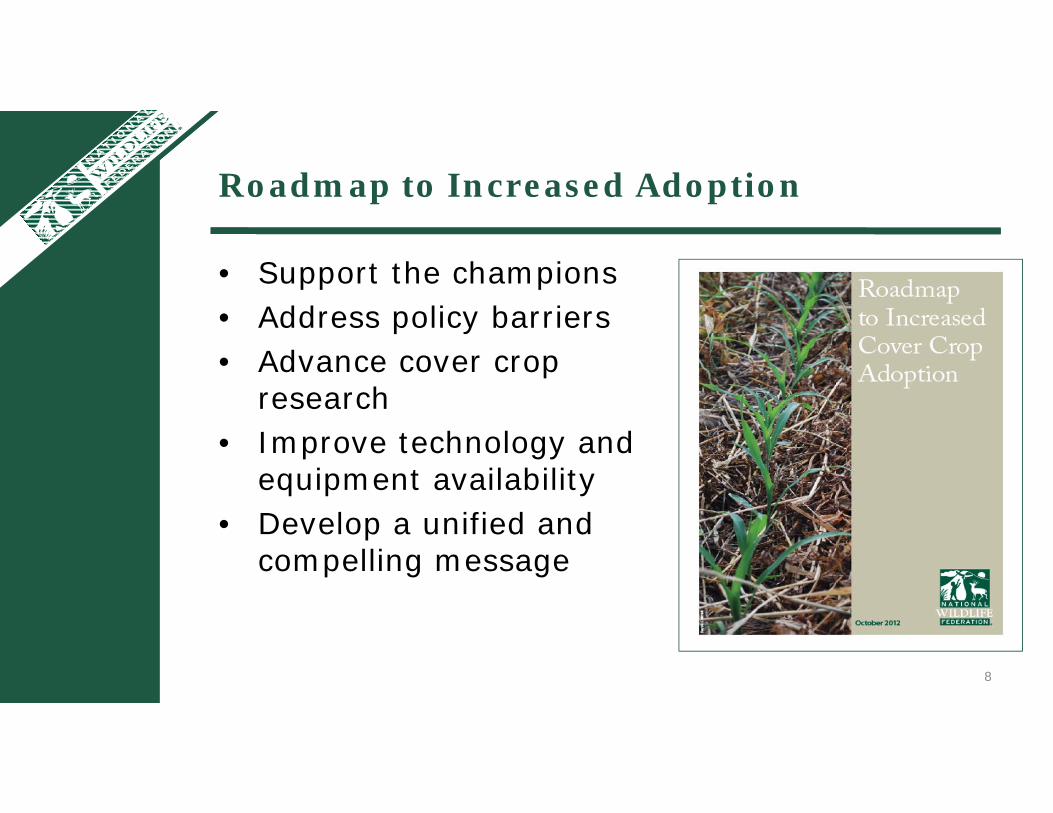
Roadmap to Increased Adoption
• Support the champions• Address policy barriers• Advance cover crop
research• Improve technology and
equipment availability• Develop a unified and
compelling message
8
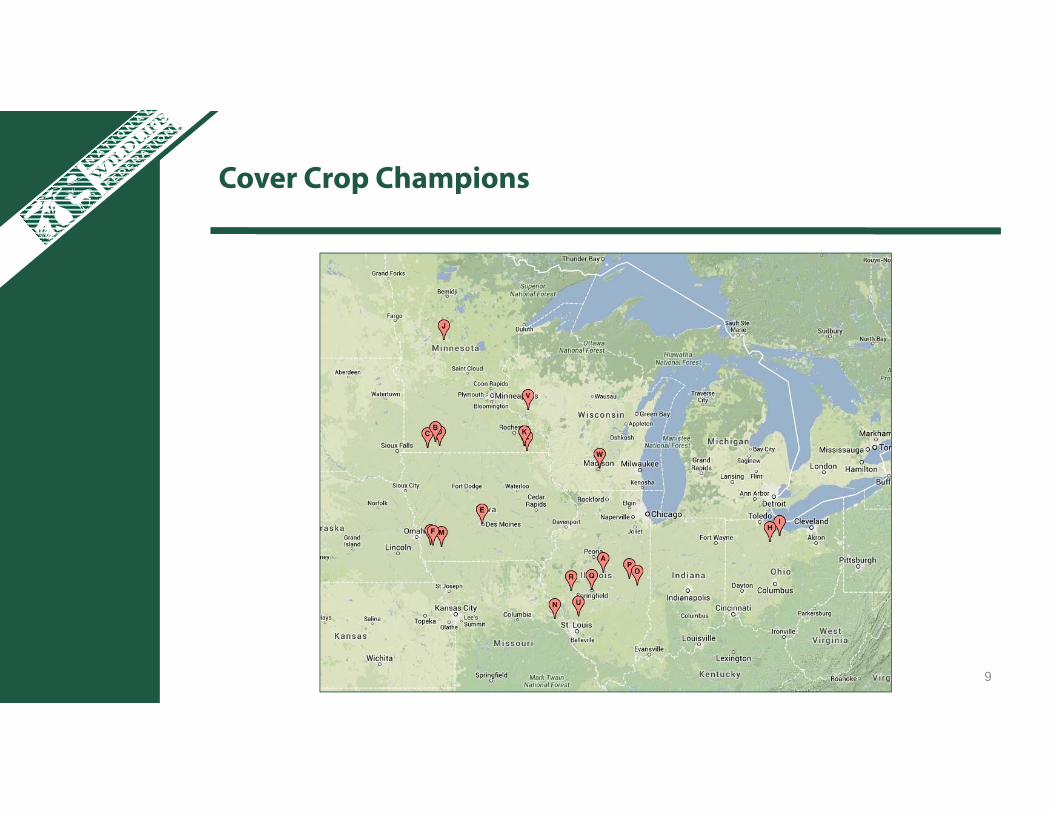
Cover Crop Champions
9
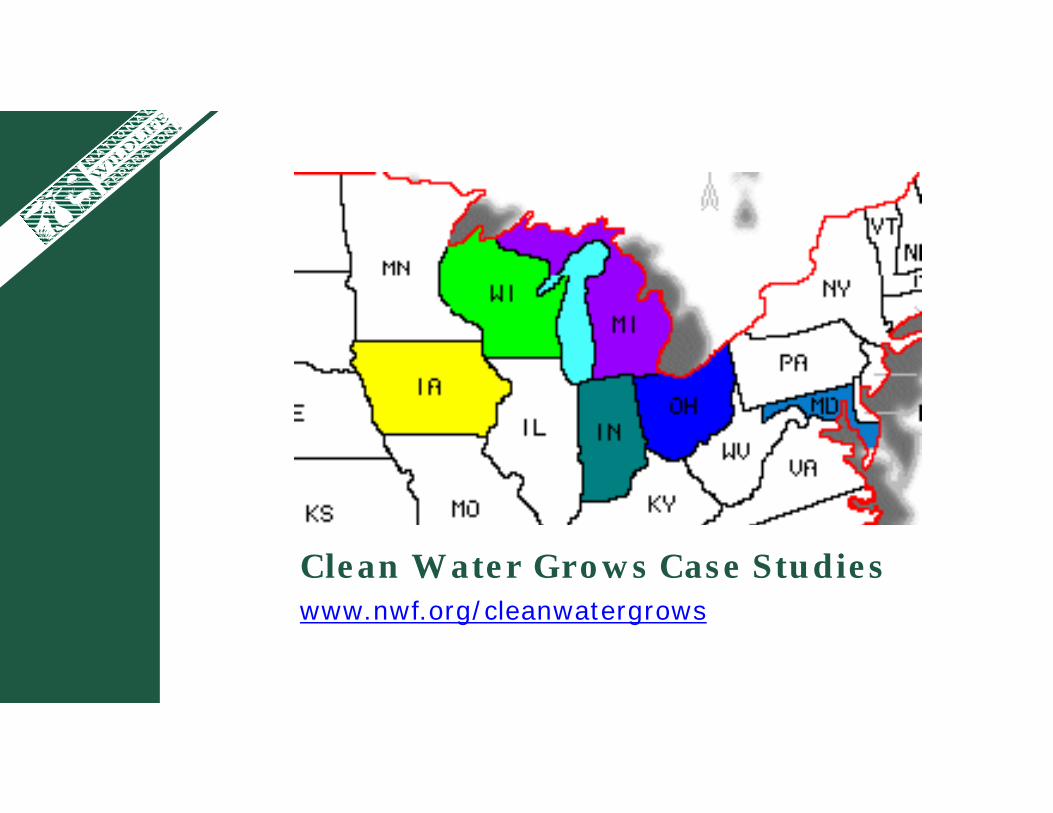
Clean Water Grows Case Studieswww.nwf.org/cleanwatergrows
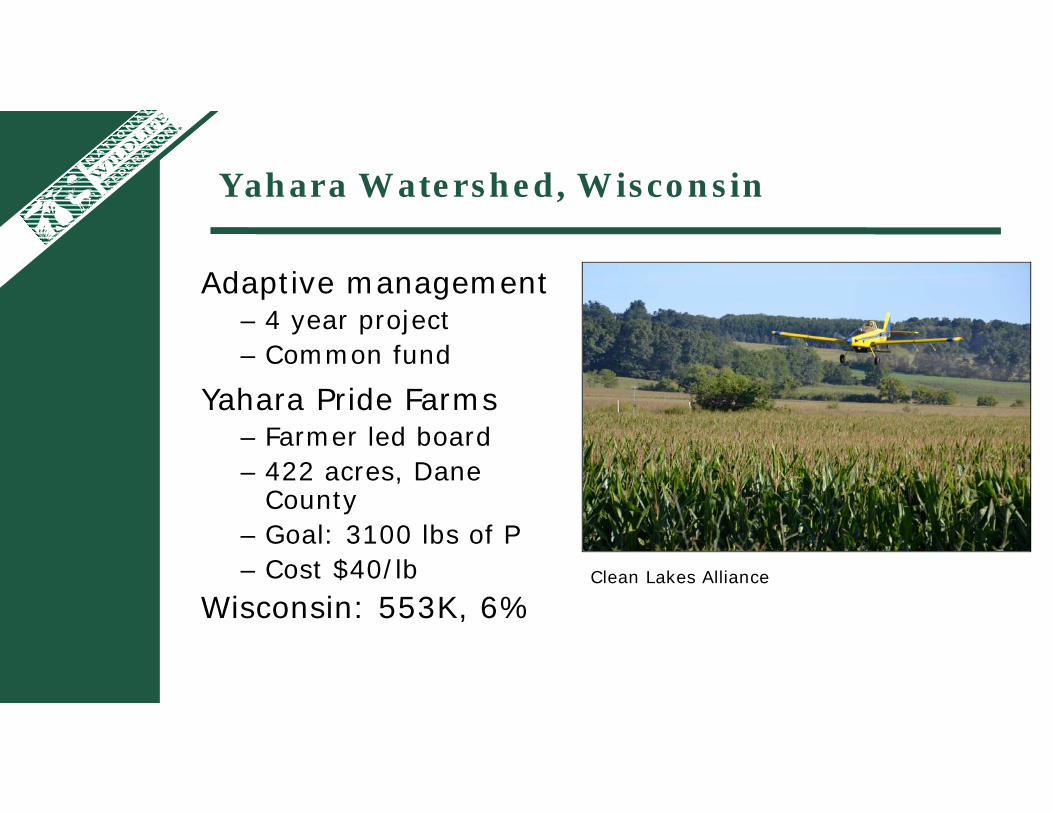
Yahara Watershed, Wisconsin
Adaptive management– 4 year project– Common fund
Yahara Pride Farms– Farmer led board– 422 acres, Dane
County– Goal: 3100 lbs of P – Cost $40/lb
Wisconsin: 553K, 6%Clean Lakes Alliance
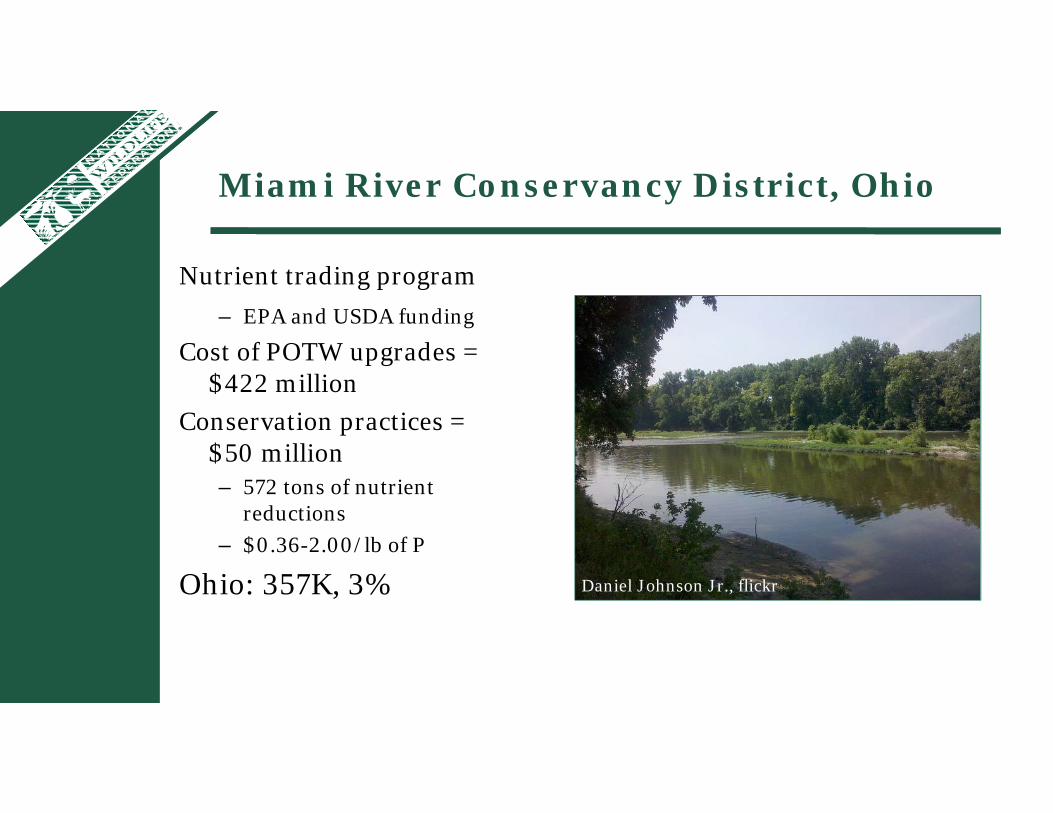
Miami River Conservancy District, Ohio
Nutrient trading program– EPA and USDA funding
Cost of POTW upgrades = $422 million
Conservation practices = $50 million– 572 tons of nutrient
reductions – $0.36-2.00/lb of P
Ohio: 357K, 3% Daniel Johnson Jr., flickr
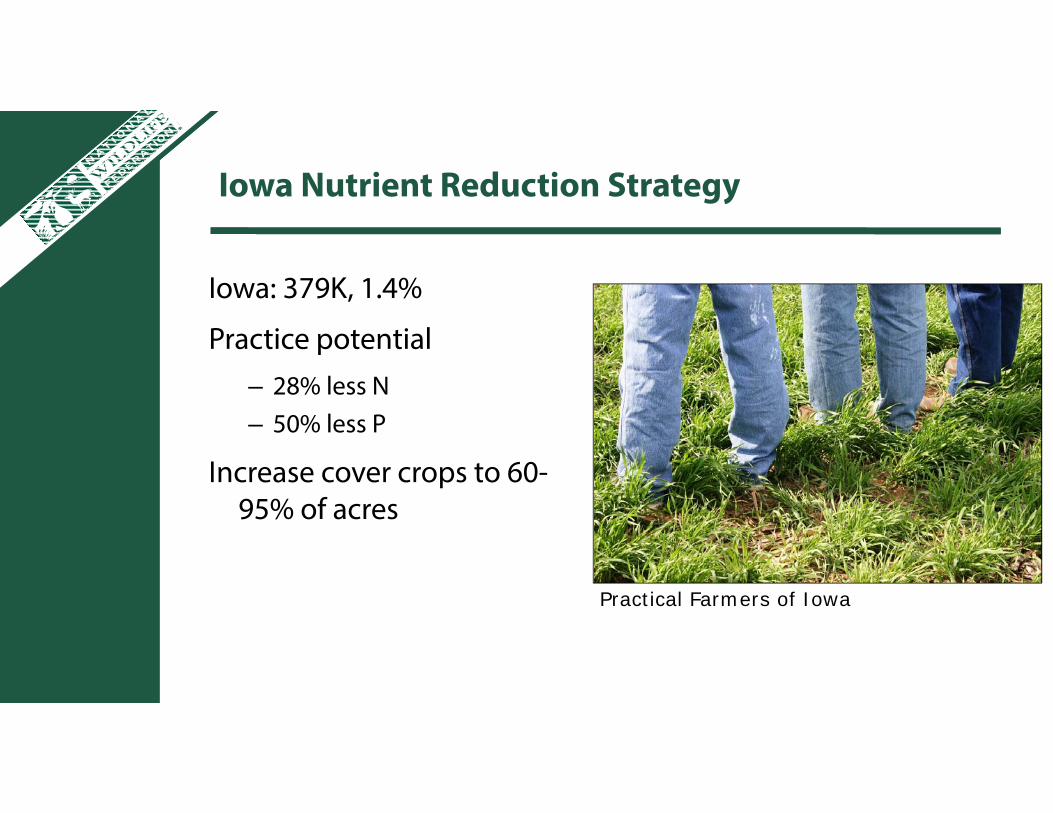
Iowa Nutrient Reduction Strategy
Iowa: 379K, 1.4%
Practice potential– 28% less N– 50% less P
Increase cover crops to 60-95% of acres
Practical Farmers of Iowa
Great Lakes Cover Crop Initiative
Funded through GLRI
Goal: Increase cover crop acreage by 15,000 in 3 years
Achieved: 20,000 cover crop acres in 18 months
Reductions:– 68,000 lbs N
– 22,000 lbs P
– 2,700,000 lbs sediment
Michigan: 437K, 6%
14
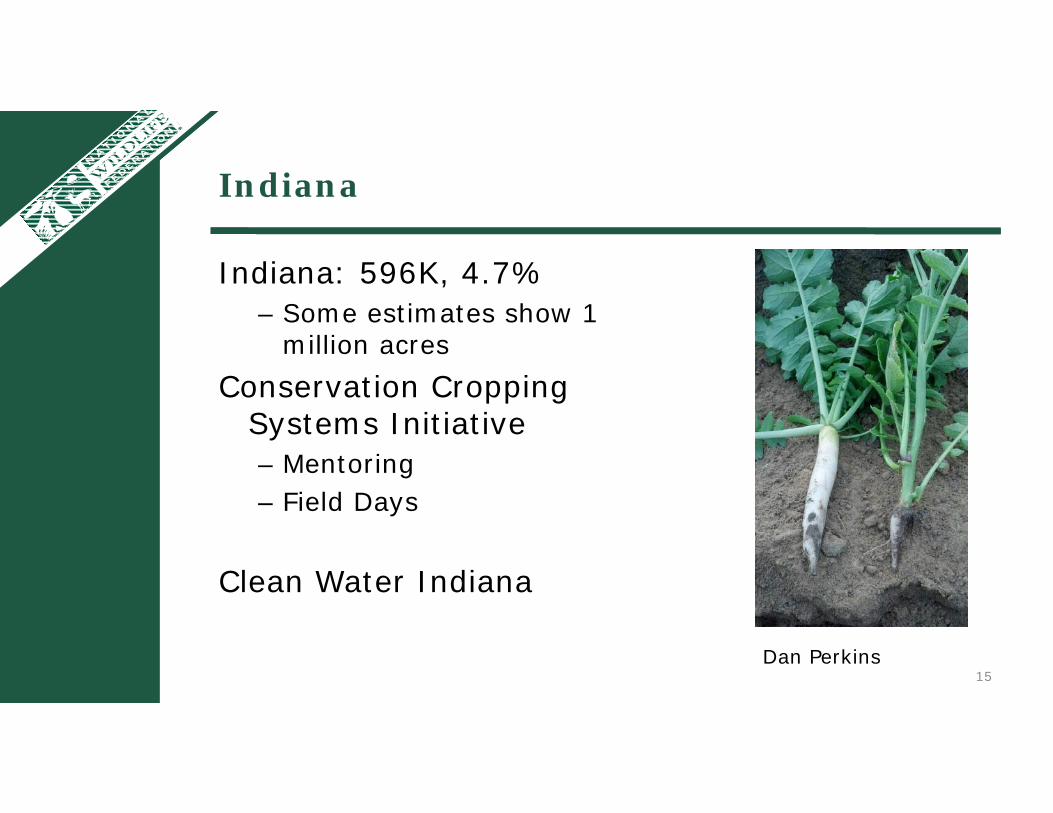
Indiana
Indiana: 596K, 4.7%– Some estimates show 1
million acresConservation Cropping
Systems Initiative– Mentoring– Field Days
Clean Water Indiana
15Dan Perkins
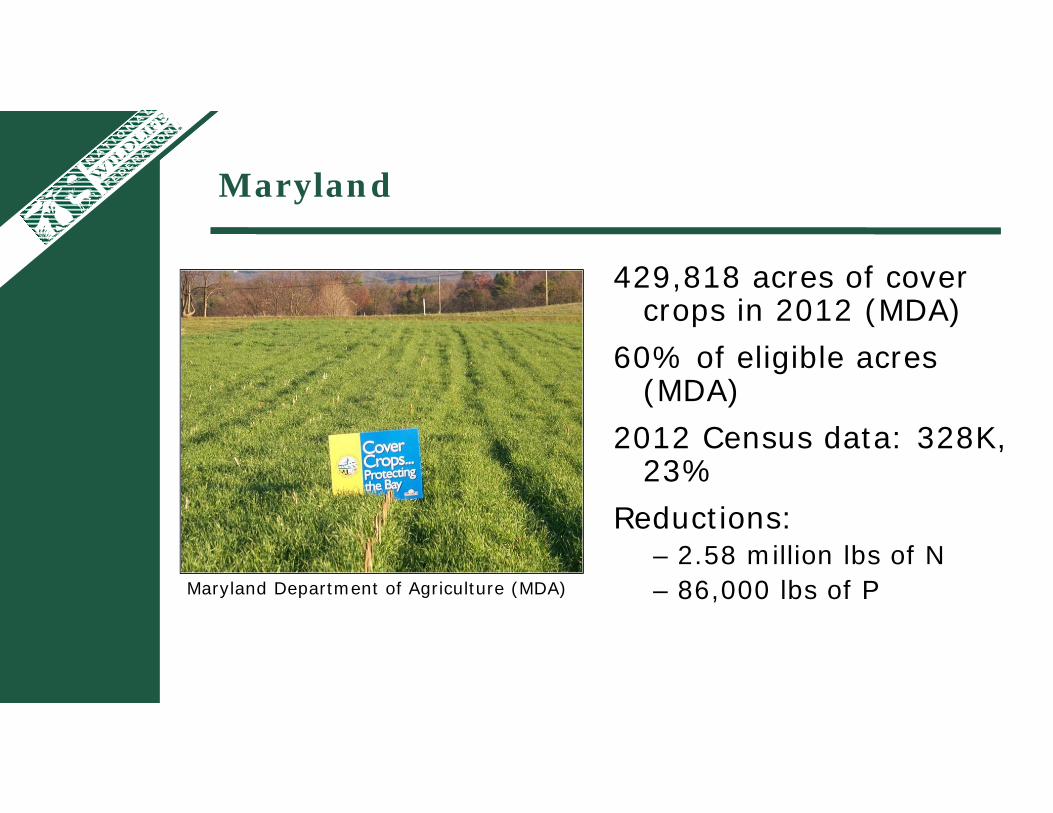
Maryland
429,818 acres of cover crops in 2012 (MDA)
60% of eligible acres (MDA)
2012 Census data: 328K, 23%
Reductions:– 2.58 million lbs of N– 86,000 lbs of PMaryland Department of Agriculture (MDA)
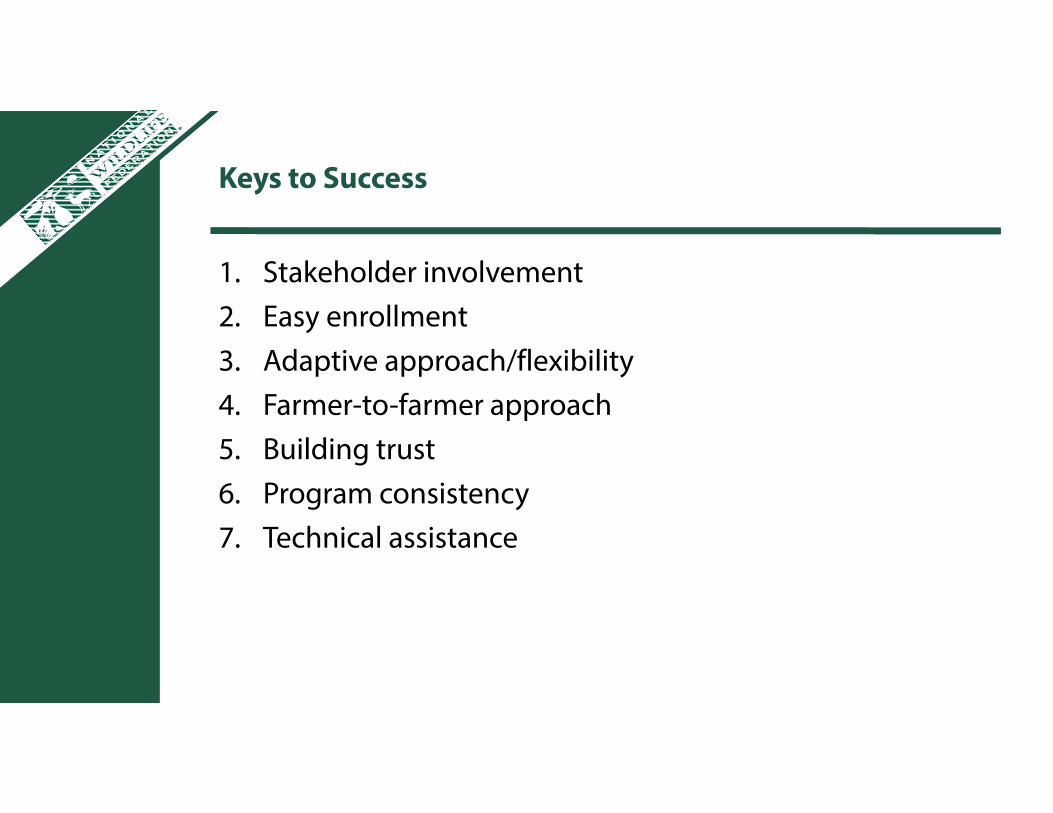
Keys to Success
1. Stakeholder involvement2. Easy enrollment3. Adaptive approach/flexibility4. Farmer-to-farmer approach5. Building trust6. Program consistency7. Technical assistance
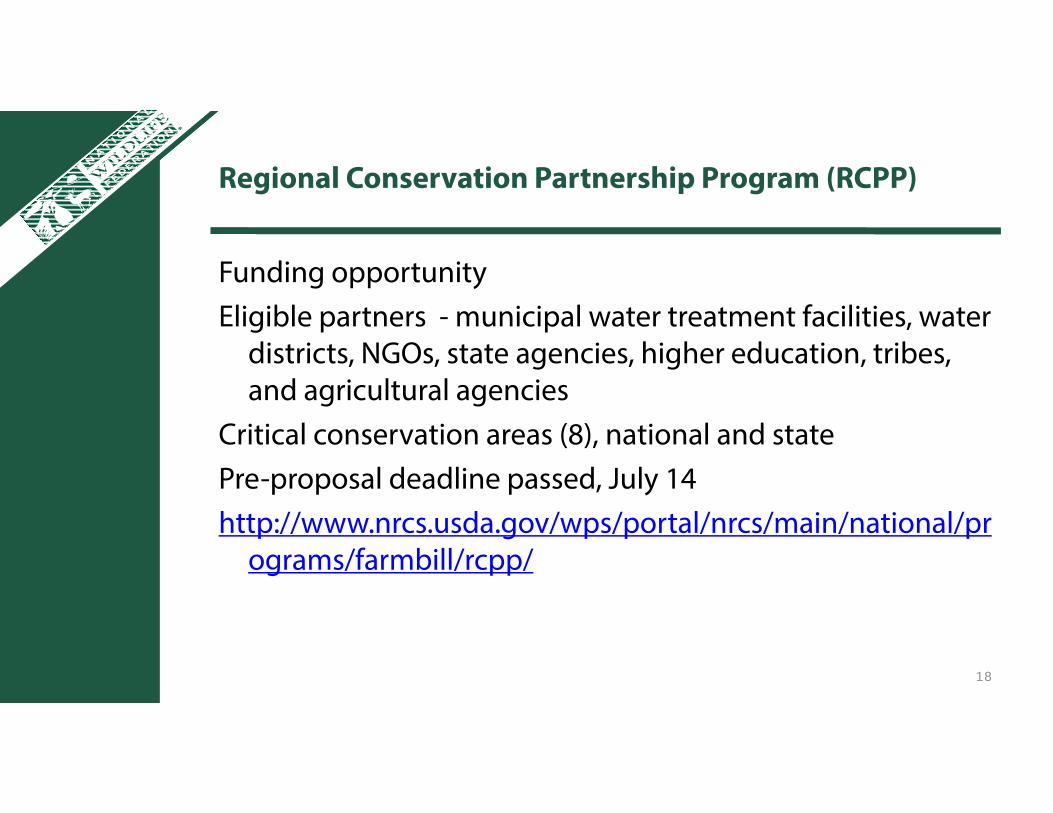
Regional Conservation Partnership Program (RCPP)
Funding opportunityEligible partners - municipal water treatment facilities, water
districts, NGOs, state agencies, higher education, tribes, and agricultural agencies
Critical conservation areas (8), national and statePre-proposal deadline passed, July 14http://www.nrcs.usda.gov/wps/portal/nrcs/main/national/pr
ograms/farmbill/rcpp/
18
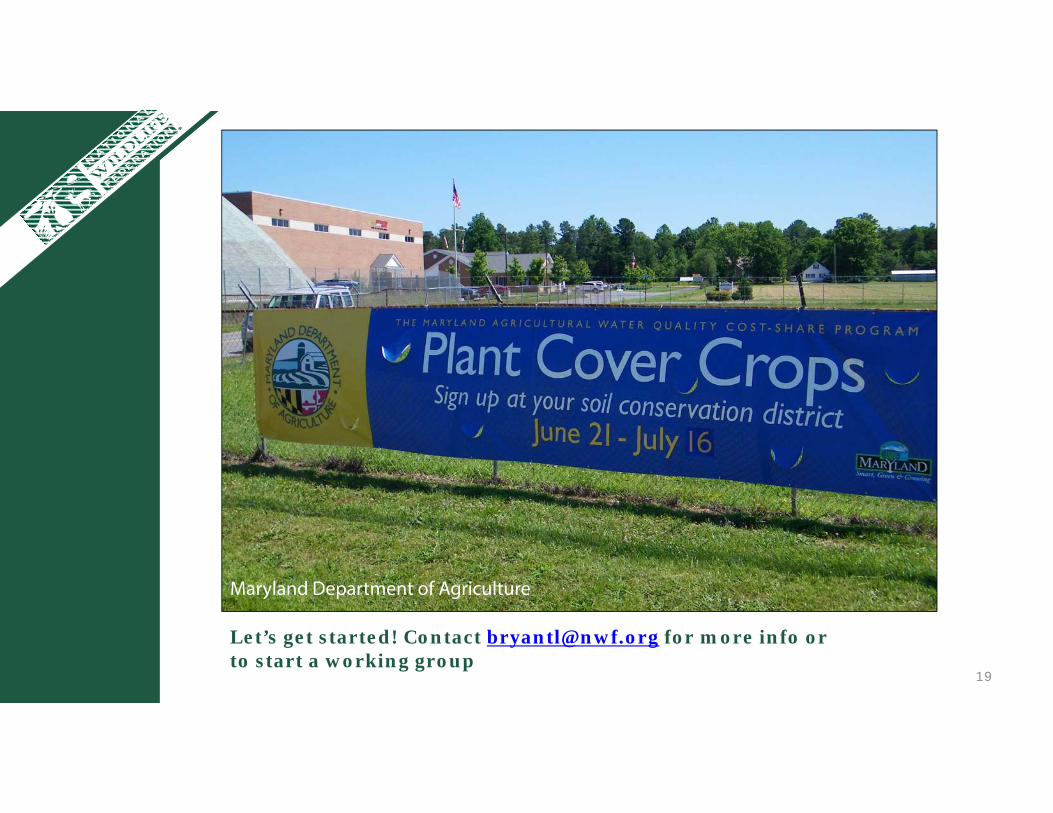
Let’s get started! Contact [email protected] for more info or to start a working group
19
Maryland Department of Agriculture