Class 6 - MGD School,Jaipur
50
1 Class 6 Learning Outcomes 1. History and components of Computers i.) Brief history of computer ii.) Different I/O Devices iii.) Computer Memory. iv.) Types of Software 1. Flow charts and Number System i.) Binary Number System ii.) Decimal Number System iii.) Octal Number System iv.) Hexadecimal Number System v.) Conversion of Decimal number into binary number vi.) Conversion of Binary number into decimal number vii.) Introduction to Algorithm & Flow chart 2. Advanced features of MS Word i.) Using Shapes and drawing tools ii.) Creating columns, column break, page break iii.) Paragraph formatting iv.) Page formatting v.) Mail Merge 3. Advanced features of MS Excel i.) Inserting and deleting rows and iii.) Commonly used charts Iv.) Using simple functions 5.Advanced features of MS Power Point i.) Different views of MS PowerPoint ii.) Animation and Transition effects iii.) Applying Design and Theme to presentation iv.) Inserting various objects in your presentation v.) Various options for running a presentation 6. Basics of Networking i.) What is network, internet and WWW? ii.) Popular services on internet iii.) Searching information iv.) E-mail
Transcript of Class 6 - MGD School,Jaipur

1
Class 6
Learning Outcomes
1. History and components of Computers
i.) Brief history of computer
ii.) Different I/O Devices
iii.) Computer Memory.
iv.) Types of Software
1. Flow charts and Number System
i.) Binary Number System
ii.) Decimal Number System
iii.) Octal Number System
iv.) Hexadecimal Number System
v.) Conversion of Decimal number into
binary number
vi.) Conversion of Binary number into
decimal number
vii.) Introduction to Algorithm &
Flow chart
2. Advanced features of MS Word
i.) Using Shapes and drawing tools
ii.) Creating columns, column break, page
break
iii.) Paragraph formatting
iv.) Page formatting
v.) Mail Merge
3. Advanced features of MS Excel
i.) Inserting and deleting rows and
columns.
ii.) Cell formatting
iii.) Creating charts, chart components
iii.) Commonly used charts
Iv.) Using simple functions
5.Advanced features of MS Power Point
i.) Different views of MS PowerPoint
ii.) Animation and Transition effects
iii.) Applying Design and Theme to
presentation
iv.) Inserting various objects in your
presentation
v.) Various options for running a
presentation
6. Basics of Networking
i.) What is network, internet and WWW?
ii.) Popular services on internet
iii.) Searching information
iv.) E-mail

2
Unit 1
In the 1980's manufacturing of semiconductor chips was done, The Intel and Motorola Corporations were very
competitive into the 1980s, although Japanese firms were making strong economic advances, especially in
History and Components of Computer
Learning Objective: Brief history of computer, Basic components of
computer, Different I/O Devices, Computer Language, Software
definition and its types, Computer Memory.
Review of brief history of Computer
1. The history of computers starts out about 2000 years ago in
Babylonia (Mesopotamia), at the birth of the abacus, a wooden rack
holding two horizontal wires with beads strung on them.
2. Blaise Pascal has credited the first digital computer in 1642. The
basic principle of his calculator is still used today in water meters
and modern-day odometers.
3. Punched cards, which were first successfully used with computers
in 1890 by Herman Hollerith and James Powers. They developed
devices that could read the information that had been punched
into the cards automatically, without human help.
4. In 1942, John P. Eckert, John W. Mauchly, and their associates at the
Moore school of Electrical Engineering of University of Pennsylvania
decided to build a high - speed electronic computer to do the job.
This machine became known as ENIAC (Electrical Numerical
Integrator and Calculator) and it occupied the entire thirty by fifty
feet room.
5. ENIAC was therefore about 1,000 times faster than the previous
generation of relay computers. ENIAC used 18,000 vacuum tubes
about 1,800 square feet of floor space, and consumed about 180,000
watts of electrical power.
6. In 1950 magnetic core memory and the Transistor - Circuit
Element of digital computers. RAM capacities increased from
8,000 to 64,000 words in commercially available machines by the
1960s, with access times of 2 to 3 MS (Milliseconds).
Abacus
First Digital Computer
(Ist Generation)
ENIAC (2nd Generation)
(3rd Generation)
3
thearea of memory chips. By the late 1980s, some personal computers were run by microprocessors that,
handling 32 bits of data at a time.
Input Devices
The devices which are used to input the data and programs in the computer are known as "Input Devices". Input unit accepts instructions and data from the user and converts these instructions and data in computer acceptable format which are sent to computer system for processing.
Keyboard: Keyboard is most common input device. The data and
instructions are input by typing on the keyboard. The message typed on
the keyboard reaches the memory unit of a computer. It is connected to
a computer via a cable. Apart from alphabet and numeral keys, it has
other function keys for performing different functions.
Mouse: It is a pointing device. The mouse is rolled over the mouse
pad, which in turn controls the movement of the cursor in the screen.
You can click, double click or drag the mouse. Its sensor notifies the
speed of its movements to the computer, which in turn moves the
cursor/pointer on the screen.
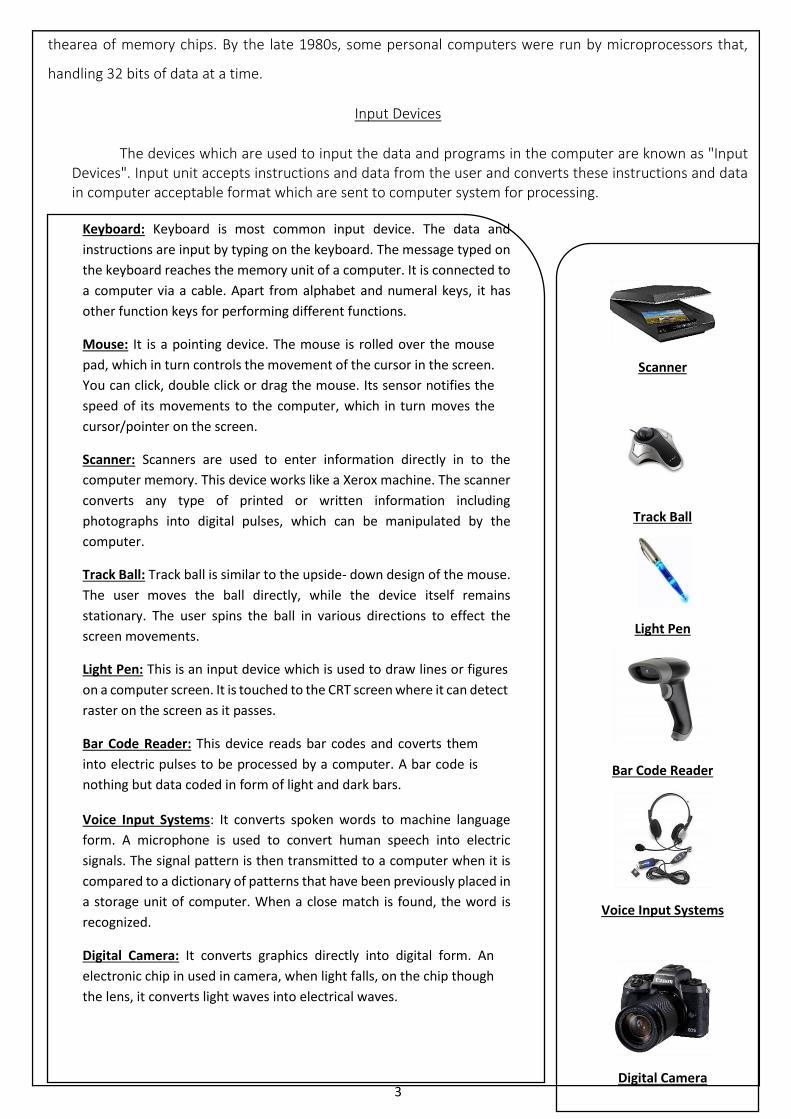
Scanner: Scanners are used to enter information directly in to the
computer memory. This device works like a Xerox machine. The scanner
converts any type of printed or written information including
photographs into digital pulses, which can be manipulated by the
computer.
Track Ball: Track ball is similar to the upside- down design of the mouse.
The user moves the ball directly, while the device itself remains
stationary. The user spins the ball in various directions to effect the
screen movements.
Light Pen: This is an input device which is used to draw lines or figures
on a computer screen. It is touched to the CRT screen where it can detect
raster on the screen as it passes.
Bar Code Reader: This device reads bar codes and coverts them
into electric pulses to be processed by a computer. A bar code is
nothing but data coded in form of light and dark bars.
Voice Input Systems: It converts spoken words to machine language
form. A microphone is used to convert human speech into electric
signals. The signal pattern is then transmitted to a computer when it is
compared to a dictionary of patterns that have been previously placed in
a storage unit of computer. When a close match is found, the word is
recognized.
Digital Camera: It converts graphics directly into digital form. An
electronic chip in used in camera, when light falls, on the chip though
the lens, it converts light waves into electrical waves.
Scanner
Track Ball
Light Pen
Bar Code Reader
Voice Input Systems
Digital Camera
4
Output Devices
Output Device produces the final results of computer into human understandable form. Output unit accepts
the results produced by the computer which are in coded form and it converts these coded results to human
readable form.
Printer: A printer is used for transferring data from the computer to the paper. There are colour printers as
well as black and white printers. The different types of printers are Dot Matrix Printers, Inkjet Printer and Laser
Printers.
Dot Matrix Printer Inkjet Printer Laser Printer
Prints characters in the
form of dots.
Prints fully formed
characters.
Prints fully formed characters.
Speed: 200-540 characters
per second.
Speed: 4-8 pages per
minute.
Speed: 4-20 pages per minute.
Not very expensive. Moderately priced. Expensive.
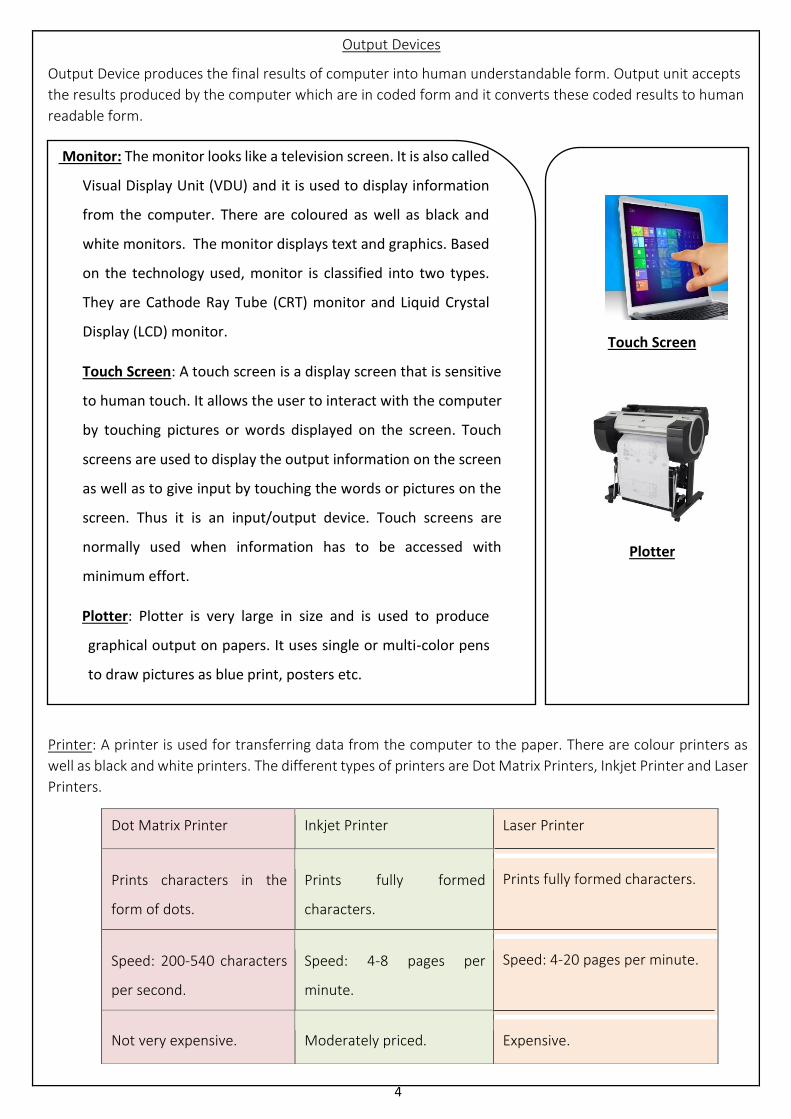
Monitor: The monitor looks like a television screen. It is also called
Visual Display Unit (VDU) and it is used to display information
from the computer. There are coloured as well as black and
white monitors. The monitor displays text and graphics. Based
on the technology used, monitor is classified into two types.
They are Cathode Ray Tube (CRT) monitor and Liquid Crystal
Display (LCD) monitor.
Touch Screen: A touch screen is a display screen that is sensitive
to human touch. It allows the user to interact with the computer
by touching pictures or words displayed on the screen. Touch
screens are used to display the output information on the screen
as well as to give input by touching the words or pictures on the
screen. Thus it is an input/output device. Touch screens are
normally used when information has to be accessed with
minimum effort.
Plotter: Plotter is very large in size and is used to produce
graphical output on papers. It uses single or multi-color pens
to draw pictures as blue print, posters etc.
Touch Screen
Plotter

5
Storage Devices
A storage device is any computing hardware that is used for storing, porting and extracting data
files and objects. It can hold and store information both temporarily and permanently, and can be internal
or external to a computer, server or any similar computing device.
There are two different types of storage devices:
• Primary storage devices: Generally smaller in size, these are designed to hold data temporarily and are
internal to the computer. They have the fastest data access speed, and include RAM and cache
memory.
• Secondary storage devices: These usually have large storage capacity, and they store data
permanently. They can be either internal or external to the computer, and they include the hard disk,
optical disk drive and USB storage device.
Central Processing Unit (CPU)
The main unit inside the computer is the CPU. This unit is responsible for all events inside the
computer. It consists of Control Unit and Arithmetic and Logic unit. The CPU is the brain of any computer
system. In a human body, all major decisions are taken by the brain and the other parts of the body function
as directed by the brain. Similarly, in a computer system, all major calculations and comparisons are made
inside the CPU and it activates and controls the operations of other units like Hard disk, Printer etc. of a
computer system.
Arithmetic and Logic Unit (ALU): The arithmetic and logic unit (ALU) is the part where actual computations
take place. It consists of circuits that perform arithmetic operations (e.g. addition, subtraction,
multiplication, division over data received from memory and capable to compare numbers (less than, equal
to, or greater than etc.).
Control Unit: The control unit acts as a central nervous system for the components of the computer. It
manages and coordinates the entire computer system. It obtains instructions from the program stored in
main memory, interprets the instructions, and issues signals that cause other units of the system to
execute them. the control unit directs and controls the activities of the internal and external devices.
Computer Memory:
A memory is just like a human brain. It is used to store data and instructions. Computer memory is
the storage space in computer where data is to be processed and instructions required for processing are
stored.
Memory is primarily of three types
6
Cache Memory
Primary Memory or Main Memory
Secondary Memory
Cache Memory: Cache memory is a very high speed semiconductor memory which can speed up CPU. It
acts as a buffer between the CPU and main memory. It is used to hold those parts of data and program
which are most frequently used by CPU. The parts of data and programs are transferred from disk to cache
memory by operating system from where CPU can access them.
Advantages
The advantages of cache memory are as follows:
• Cache memory is faster than main memory.
• It stores the program that can be executed within a short period of time.
• It stores data for temporary use.
Disadvantages
The disadvantages of cache memory are as follows:
• Cache memory has limited capacity.
• It is very expensive.
Primary Memory (Main Memory): Primary memory is also known as main memory. It holds only those
data and instructions on which computer is currently working. It has limited capacity and data is lost when
power is switched off. It is generally made up of semiconductor device.
Characteristics of Main Memory
• These are semiconductor memories
• It is known as main memory.
• Usually volatile memory.
• Data is lost in case power is switched off.
• Faster than secondary memories.
• A computer cannot run without primary memory.
Primary memory can be divided into RAM (Random Access Memory) and ROM (Read Only Memory).
Secondary Memory: -It is also known as external memory or non-volatile memory. It is slower than main
memory. These are used for storing data or information permanently. For example: hard disk, CD-ROM,
DVD etc. Characteristic of Secondary memory
• These are magnetic and optical memories
• It is non-volatile memory which is used for storage of data in a computer.

7
• Data is permanently stored even if power is switched off.
• Computer may run without secondary memory.
• Slower than primary memories.
Software
Software, in its most general sense, is a set of instructions or programs instructing a computer to do specific
tasks. Software is a generic term used to describe computer programs. Scripts, applications, programs and a
set of instructions are all terms often used to describe software.
Types of Software
System software: Software that directly operates the computer hardware to provide basic functionality
needed by users and other software and to provide a platform for running application software. System
software includes:
• Operating system (OS): Operating system manages resources of computer system like memory, CPU,
hard disk, printer etc. also provides an interface between user and computer system & provides various
services to other software.
• Language Processor & Device drivers: All the devices like mouse, keyboard, modem etc. needs at least
one corresponding device driver. A device driver is a program that controls a device. A language
processor is a hardware device designed or used to perform tasks, such as processing program code to
machine code. Language processors are found in languages such as Fortran and COBOL
Application software: Software that performs special functions or provides entertainment functions beyond
the basic operation of the computer itself. There are many different types of application software.
• General purpose: Microsoft Word, Microsoft Excel, MS PowerPoint, Photoshop etc.
• Customized: Invoice Management System, Airline Reservation System etc.
• Utilities: Antivirus, Memory tester, Disk partitioning and Disk defragmenter etc.

8
Unit 2
Concept of Bits and Bytes
Binary numbers can be added together and subtracted just like decimal numbers with the result being
combined into one of several size ranges depending upon the number of bits being used. Binary numbers come
in three basic forms – a bit, a byte and a word, where a bit is a single binary digit, a byte is eight binary digits,
and a word is 16 binary digits.
The classification of individual bits into larger groups are generally referred to by the following more common
names of:
Number of Binary Digits
(bits) Common Name
1 Bit
4 Nibble
8 Byte
16 Word
32 Double Word
64 Quad Word
Today, as micro-controller or microprocessor systems become increasingly larger, the individual binary digits
(bits) are now grouped together into 8’s to form a single BYTE with most computer hardware such as hard
drives and memory modules commonly indicate their size in Megabytes or even Gigabytes.
Flow Chart and Number System
Learning Objective: - Binary Number System,concept of bits and bytes,Conversion of Decimal number
into binary number, Conversion of Binary number into decimal number, Introduction to Algorithm and
Flow Chart
9
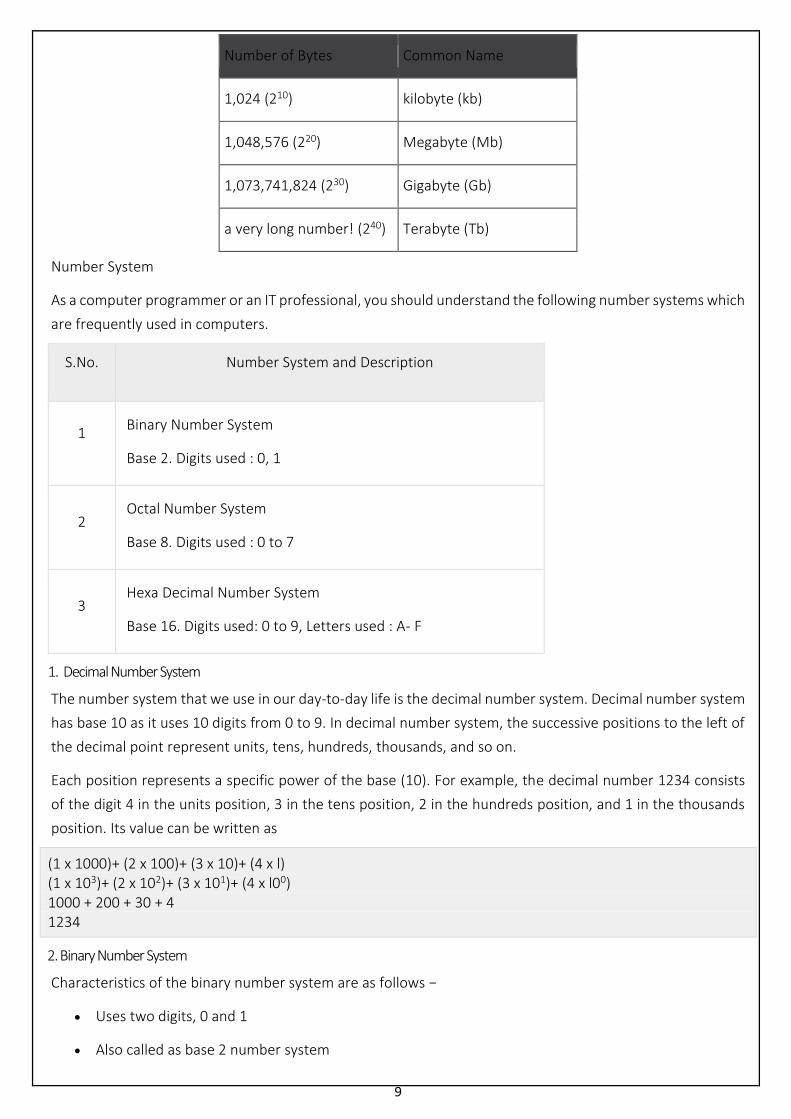
Number of Bytes Common Name
1,024 (210) kilobyte (kb)
1,048,576 (220) Megabyte (Mb)
1,073,741,824 (230) Gigabyte (Gb)
a very long number! (240) Terabyte (Tb)
Number System
As a computer programmer or an IT professional, you should understand the following number systems which
are frequently used in computers.
S.No. Number System and Description
1 Binary Number System
Base 2. Digits used : 0, 1
2 Octal Number System
Base 8. Digits used : 0 to 7
3 Hexa Decimal Number System
Base 16. Digits used: 0 to 9, Letters used : A- F
1. Decimal Number System
The number system that we use in our day-to-day life is the decimal number system. Decimal number system
has base 10 as it uses 10 digits from 0 to 9. In decimal number system, the successive positions to the left of
the decimal point represent units, tens, hundreds, thousands, and so on.
Each position represents a specific power of the base (10). For example, the decimal number 1234 consists
of the digit 4 in the units position, 3 in the tens position, 2 in the hundreds position, and 1 in the thousands
position. Its value can be written as
(1 x 1000)+ (2 x 100)+ (3 x 10)+ (4 x l) (1 x 10³)+ (2 x 10²)+ (3 x 101)+ (4 x l00) 1000 + 200 + 30 + 4 1234
2. Binary Number System
Characteristics of the binary number system are as follows −
• Uses two digits, 0 and 1
• Also called as base 2 number system

10
• Each position in a binary number represents a 0 power of the base (2). Example 20
• Last position in a binary number represents a x power of the base (2). Example 2x where x represents
the last position - 1.
Example
Binary Number: 101012
Calculating Decimal Equivalent –
Step Binary Number Decimal Number
Step 1 101012 ((1 x 24) + (0 x 23) + (1 x 22) + (0 x 21) + (1 x 20))10
Step 2 101012 (16 + 0 + 4 + 0 + 1)10
Step 3 101012 2110
Note − 101012 is normally written as 10101.
3. Octal Number System
Characteristics of the octal number system are as follows −
• Uses eight digits, 0,1,2,3,4,5,6,7
• Also called as base 8 number system
• Each position in an octal number represents a 0 power of the base (8). Example 80
• Last position in an octal number represents a x power of the base (8). Example 8x where x represents
the last position - 1
Example
Octal Number: 125708
Calculating Decimal Equivalent −
Step Octal Number Decimal Number
Step 1 125708 ((1 x 84) + (2 x 83) + (5 x 82) + (7 x 81) + (0 x 80))10
Step 2 125708 (4096 + 1024 + 320 + 56 + 0)10
Step 3 125708 549610
Note − 125708 is normally written as 12570.

11
4. Hexadecimal Number System
Characteristics of hexadecimal number system are as follows −
• Uses 10 digits and 6 letters, 0, 1, 2, 3, 4, 5, 6, 7, 8, 9, A, B, C, D, E, F
• Letters represent the numbers starting from 10. A = 10. B = 11, C = 12, D = 13, E = 14, F = 15
• Also called as base 16 number system
• Each position in a hexadecimal number represents a 0power of the base (16). Example, 160
• Last position in a hexadecimal number represents a xpower of the base (16). Example
16x where x represents the last position - 1
Example
Hexadecimal Number: 19FDE16
Calculating Decimal Equivalent −
Step Binary
Number
Decimal Number
Step 1 19FDE16 ((1 x 164) + (9 x 163) + (F x 162) + (D x 161) + (E x 160))10
Step 2 19FDE16 ((1 x 164) + (9 x 163) + (15 x 162) + (13 x 161) + (14 x
160))10
Step 3 19FDE16 (65536+ 36864 + 3840 + 208 + 14)10
Step 4 19FDE16 10646210
Note − 19FDE16 is normally written as 19FDE.
Conversion of Decimal number into binary number
Decimal Number System: -
Decimal is a term that describes the base-10 number system, probably the most commonly used number
system. The decimal number system consists of ten single- digit numbers: 0, 1, 2, 3, 4, 5, 6, 7, 8, and 9. The
number after 9 is 10. The number after 19 is 20 and so forth. Additional powers of 10 require the addition of
another positional digit.
The value of any decimal number will be equal to the sum of its digits multiplied by their respective weights.
For example: N = 616310 (Six Thousand One Hundred and Sixty-Three) in a decimal format is equal to:
6000 + 100 + 60 + 3 = 6163
or it can be written reflecting the weight of each digit as:
12
(6×1000) + (1×100) + (6×10) + (3×1) = 6163
In computing, the binary , octal , or hexadecimal number system may be used instead of the decimal system.
All these schemes have a number of digits that is a power of 2. This is an advantage in systems that use high
and low digital states.
Conversion of Binary number into decimal number
Binary Number System: -
The Binary Numbering System is the most fundamental numbering system in all digital and computer based
systems and binary numbers follow the same set of rules as the decimal numbering system. But unlike the
decimal system which uses powers of ten, the binary numbering system works on powers of two giving a binary
to decimal conversion from base-2 to base-10
Digital logic and computer systems use just two values or states to represent a condition, a logic level “1” or a
logic level “0”, and each “0” and “1” is considered to be a single digit in a Base-of-2 (bi) or “binary numbering
system”.
In the binary numbering system, a binary number such as 101100101 is expressed with a string of “1’s” and
“0’s” with each digit along the string from right to left having a value twice that of the previous digit. But as it
is a binary digit it can only have a value of either “1” or “0” therefore, q is equal to “2” (0 or 1) with its position
indicating its weight within the string.
As the decimal number is a weighted number, converting from decimal to binary (base 10 to base 2) will also
produce a weighted binary number with the right-hand most bit being the Least Significant Bit or LSB, and the
left-hand most bit being the Most Significant Bit or MSB, and we can represent this as:
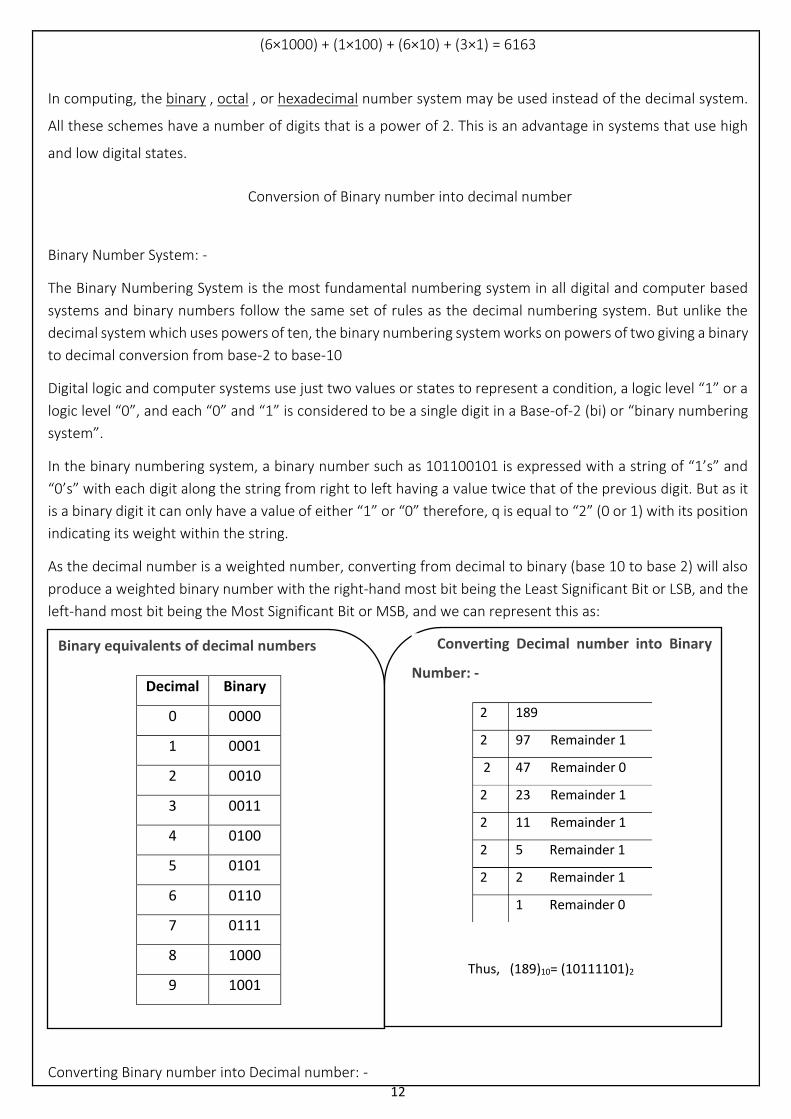
Converting Binary number into Decimal number: -
Binary equivalents of decimal numbers
Decimal Binary
0 0000
1 0001
2 0010
3 0011
4 0100
5 0101
6 0110
7 0111
8 1000
9 1001
Converting Decimal number into Binary
Number: -
2 189
2 97 Remainder 1
2 47 Remainder 0
2 23 Remainder 1
2 11 Remainder 1
2 5 Remainder 1
2 2 Remainder 1
1 Remainder 0
Thus, (189)10= (10111101)2

13
We saw above that in the decimal number system, the weight of each digit to the left increases by a factor of
10. In the binary number system, the weight of each digit increases by a factor of 2 as shown. Then the first
digit has a weight of 1 ( 20 ), the second digit has a weight of 2 ( 21 ), the third a weight of 4 ( 22 ), the fourth
a weight of 8( 23 ) and so on.
Decimal Digit Value 256 128 64 32 16 8 4 2 1
Binary Digit Value 1 0 1 1 0 0 1 0 1
By adding together ALL the decimal number values from right to left at the positions that are represented by
a “1” gives us: (256) + (64) + (32) + (4) + (1) = 35710 or three hundred and fifty-seven as a decimal number.
Then, we can convert binary to decimal by finding the decimal equivalent of the binary array of
digits 1011001012and expanding the binary digits into a series with a base of 2 giving an equivalent of 35710 in
decimal or denary.
Ex. 11001102 = 1×26 + 1×25 + 0×24 + 0*23 + 1*22 + 1×21 + 0*20 = 64 + 32 + 4 + 2 = 102.
MSB Binary Digit LSB
28 27 26 25 24 23 22 21 20
256 128 64 32 16 8 4 2 1
14
Unit 3
Algorithm
Algorithm can be defined as: “A sequence of activities to be processed for getting desired output from a
given input.”
Defines an algorithm as: “A formula or set of steps for solving a particular problem. To be an algorithm, a set
of rules must be unambiguous and have a clear stopping point”. There may be more than one way to solve a
problem, so there may be more than one algorithm for a problem.
Now, if we take definition of algorithm as: “A sequence of activities to be processed for getting desired
output from a given input.” Then we can say that:
1. Getting specified output is essential after algorithm is executed.
2. One will get output only if algorithm stops after finite time.
3. Activities in an algorithm to be clearly defined in other words for it to be unambiguous.
Before writing an algorithm for a problem, one should find out what is/are the inputs to the algorithm and
what is/are expected output after running the algorithm. Now let us take some exercises to develop an
algorithm for some simple problems: While writing algorithms we will use following symbol for different
operations:
‘+’ for Addition
‘-’ for Subtraction
‘*’ for Multiplication
‘/’ for Division and
‘ ’ for assignment. For example A X*3 means A will have a value of X*3.
Example of Algorithm
Problem 1: Find the area of a Circle of radius r.
Inputs to the algorithm:
Radius r of the Circle.
Expected output:
Area of the Circle
Algorithm:
Step1: Read\input the Radius r of the Circle
Step2: Area PI*r*r // calculation of area
Step3: Print Area
Problem2: Write an algorithm to read two numbers and find their sum.
Inputs to the algorithm:
First num1.
Introduction to Algorithm and Flowchart
Chart

15
Second num2.
Expected output: Sum of the two numbers.
Algorithm:
Step1: Start
Step2: Read\input the first num1.
Step3: Read\input the second num2.
Step4: Sum num1+num2 // calculation of sum
Step5: Print Sum
Step6: End
Problem 3: Convert temperature Fahrenheit to Celsius
Inputs to the algorithm:
Temperature in Fahrenheit
Expected output:
Temperature in Celsius
Algorithm:
Step1: Start
Step 2: Read Temperature in Fahrenheit F
Step 3: C 5/9*(F32)
Step 4: Print Temperature in Celsius: C Step5: End
Properties of algorithm
1) Finiteness: An algorithm must always terminate after a finite number of steps. It means after every
step one reach closer to solution of the problem and after a finite number of steps algorithm reaches to an
end point.
2) Definiteness: Each step of an algorithm must be precisely defined. It is done by well thought actions to
be performed at each step of the algorithm. Also the actions are defined unambiguously for each activity in
the algorithm.
3) Input: Any operation you perform need some beginning value/quantities associated with different
activities in the operation. So the value/quantities are given to the algorithm before it begins.
4) Output: One always expects output/result (expected value/quantities) in terms of output from an
algorithm. The result may be obtained at different stages of the algorithm. If some result is from the
intermediate stage of the operation then it is known as intermediate result and result obtained at the end of
algorithm is known as end result. The output is expected value/quantities always have a specified relation to
the inputs
5) Effectiveness: Algorithms to be developed/written using basic operations. Actually operations should
be basic, so that even they can in principle be done exactly and in a finite amount of time by a person, by using
paper and pencil

16
FLOWCHART
The flowchart is a diagram which visually presents the flow of data through processing systems. This
means by seeing a flow chart one can know the operations performed and the sequence of these operations
in a system. Algorithms are nothing but sequence of steps for solving problems. So a flow chart can be used
for representing an algorithm. A flowchart, will describe the operations (and in what sequence) are required
to solve a given problem. You can see a flow chart as a blueprint of a design you have made for solving a
problem.
For example suppose you are going for a picnic with your friends then you plan for the activities you will do
there. If you have a plan of activities then you know clearly when you will do what activity. Similarly when
you have a problem to solve using computer or in other word you need to write a computer program for a
problem then it will be good to draw a flowchart prior to writing a computer program. Flowchart is drawn
according to defined rules.
Flowchart Symbols
There are 6 basic symbols commonly used in flowcharting of assembly language Programs: Terminal,
Process, input/output, Decision, Connector and Predefined Process. This is not a complete list of all the
possible flowcharting symbols, it is the ones used most often in the structure of Assembly language
programming.

17
Symbol Name Function
Process
Indicates any type of internal operation inside the Processor
or Memory
input/output
Used for any Input / Output (I/O) operation. Indicates that the computer is to obtain data
or output results
Decision
Used to ask a question that can be
answered in a binary format
(Yes/No, True/False)
Connector
Allows the flowchart to be drawn
without intersecting lines or
without a reverse flow.
Predefined Process Used to invoke a subroutine or an
Interrupt program.
Terminal
Indicates the starting or ending of
the program, process, or interrupt
program
Flow Lines Shows direction of flow.
General Rules for flowcharting
1. All boxes of the flowchart are connected with Arrows. (Not lines)
2. Flowchart symbols have an entry point on the top of the symbol with no other entry points. The exit point
for all flowchart symbols is on the bottom except for the Decision symbol.
3. The Decision symbol has two exit points; these can be on the sides or the bottom and one side.
4. Generally a flowchart will flow from top to bottom. However, an upward flow can be shown as long as it
does not exceed 3 symbols.
5. Connectors are used to connect breaks in the flowchart. Examples are:
• From one page to another page.
• From the bottom of the page to the top of the same page.
18
• An upward flow of more then 3 symbols
6. Subroutines and Interrupt programs have their own and independent flowcharts.
7. All flow charts start with a Terminal or Predefined Process (for interrupt programs or subroutines) symbol.
8. All flowcharts end with a terminal or a contentious loop.
Flowcharting uses symbols that have been in use for a number of years to represent the type of operations
and/or processes being performed. The standardized format provides a common method for people to
visualize problems together in the same manner. The use of standardized symbols makes the flow charts
easier to interpret, however, standardizing symbols is not as important as the sequence of activities that
make up the process.
Some examples of Flowcharts
Now, we will discuss some examples on flowcharting. These examples will help in proper
understanding of flowcharting technique. This will help you in program development process in next unit of
this block.
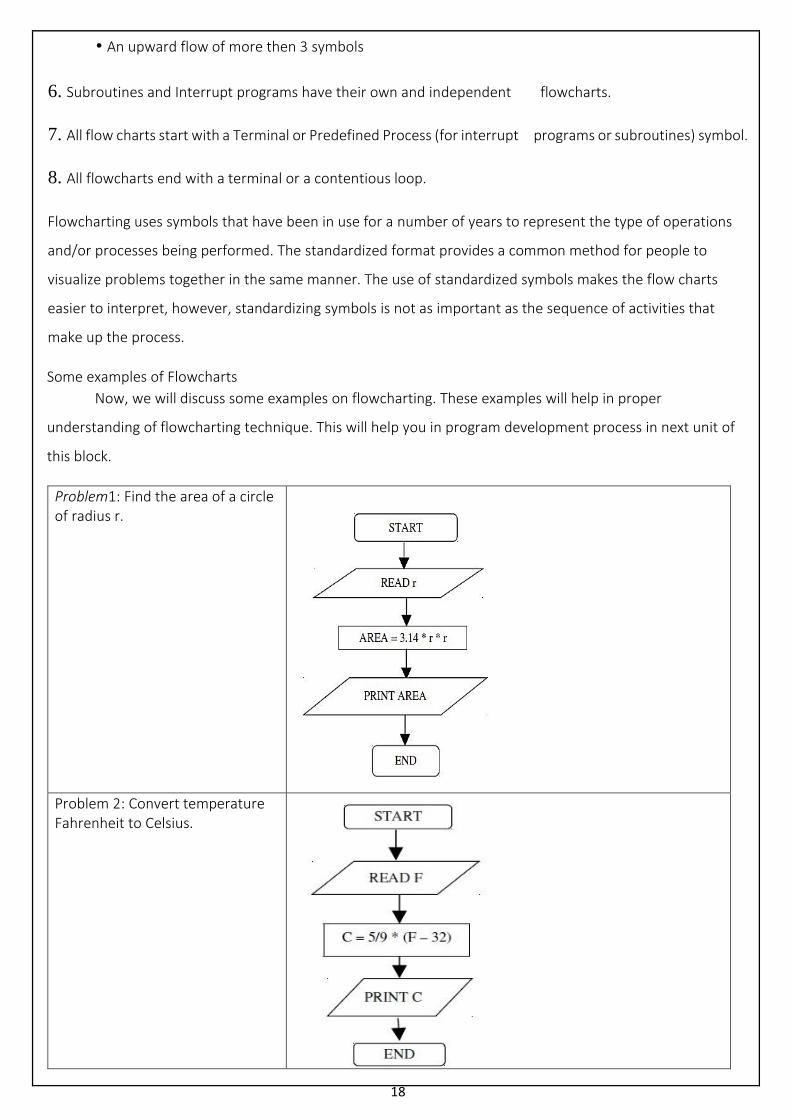
Problem1: Find the area of a circle of radius r.
Problem 2: Convert temperature Fahrenheit to Celsius.

19
Problem3: Flowchart for an algorithm which gets two numbers and prints sum of their value
Problem4: Algorithm for find the greater number between two numbers.
Problem5: Flowchart for the problem of printing even numbers between 9 and 100:
True False
Start
Read A,B
Print A
If A>B
Print B
END

20
Problem5: Flowchart for the problem of printing even numbers between 9 and 100:
Advantages of using Flowcharts
As we discussed flow chart is used for representing algorithm in pictorial form. This pictorial
representation of a solution/system is having many advantages.These advantages are as follows:
1) Communication: A Flowchart can be used as a better way of communication of the logic of a system
and steps involve in the solution, to all concerned particularly to the client of system.
2) Effective analysis: A flowchart of a problem can be used for effective analysis of the problem.
3) Documentation of Program/System: Program flowcharts are a vital part of a good program
documentation. Program document is used for various purposes like knowing the components in the program,
complexity of the program etc.
4) Efficient Program Maintenance: Once a program is developed and becomes operational it needs time
to time maintenance. With help of flowchart maintenance become easier.
5) Coding of the Program: Any design of solution of a problem is finally converted into computer program.
Writing code referring the flowchart of the solution become easy.
21
Unit – 4
Word Processor is a Software package that enables you to create, edit, print and save documents for future
retrieval and reference. Creating a document involves typing by using a keyboard and saving it. Editing a
document involves correcting the spelling mistakes, if any, deleting or moving words sentences or
paragraphs.Microsoft word or MS-Word (often called word) is a graphical word processing program by
Microsoft Corporation. The purpose of the MS Word is to allow the users to type and save documents.
Similar to other word processors, it has various helpful tools to make documents.
MS-WORD is a part of the bigger package called MS OFFICE, which can do much more than word processing.
In fact when you open up MS OFFICE you will find four main components in it. They are MS-WORD (for word
processing), MS EXCEL (for spreadsheet), MS ACCESS (for database management) and MS POWERPOINT (for
presentation purposes). However, we will limit ourselves to MS-WORD only in this lesson.
a) Advantages of Word Processing
One of the main advantages of a word processor over a conventional typewriter is that a word processor enables you to make changes to a document without retyping the entire document.
b) Features of Word Processing
Most Word Processor available today allows more than just creating and editing documents. They have wide range of other tools and functions, which are used in formatting the documents. The following are the main features of a Word Processor. .
✓ Text is typing into the computer, which allows alterations to be made easily. ✓ Words and sentences can be inserted, amended or deleted. ✓ Paragraphs or text can be copied /moved throughout the document. ✓ Margins and page length can be adjusted as desired. ✓ Spelling can be checked and modified through the spell check facility. ✓ Multiple document/files can be merged. ✓ Multiple copies of letters can be generated with different addresses through the mail-merge facility.
(c) Some Common Word Processing Packages Followings are examples of some popular word processor available · Softword · WordStar · Word perfect · Microsoft word
Let us discuss the important components of the screen of Ms Word . (a) Title Bar
The title bar displays the name of the currently active word document. Like other WINDOWS , it can be used to alter the size and location of the word window. (b) Tool Bars Word has a number of tool bars that help you perform task faster and with great ease. Two of the most commonly tool bars are the formatting tool bar and the standard tool bar. These two toolbars are displayed just below the title bar. At any point of time any tool bar can be made ON or OFF through the tool bar option of View Menu.
Advanced features of Ms-Word
22
(c) Ruler Bar The Ruler Bar allows you to format the vertical alignment of text in a document. (d) Status Bar The Status Bar displays information about the currently active document. This includes the page number that you are working, the column and line number of the cursor position and so on. (e) Scroll Bar The Scroll Bar helps you scroll the content or body of document. You can do so by moving the elevator button along the scroll bar, or by click in on the buttons with the arrow marked on them to move up and down and left and right of a page. (f) Workspace The Workspace is the area in the document window were you enter/type the text of your document.
d) CUTTING, COPYING, AND PASTING TEXT-It is often necessary to copy or move text from one
location in a document and place it in another. When you use the copy or cut command, the
Clipboard stores the items for you to paste in another location of the document or another Office
file.
When you cut text, Word removes it from the original location and places the text in the
Clipboard collection. When you copy text, Word places a duplicate copy in the Clipboard. The
Paste command then pastes text from the Clipboard to a new location in either the original
document or a new document.
e) Header and Footer
✓ Working with Headers and Footers Headers and footers can help keep longer documents
organized and make them easier to read. Text entered in the header or footer will appear on
each page of the document. Let us see a demonstration.
1. Find Header and Footer
2. Click on Header and select Blank (Three Columns) option The Design tab will appear on the
Ribbon, and the header or footer will appear in the document. Here you can place Date &
Time, Page number, Picture ,clip Art and other desired information. When you have finished
editing, click Close Header and Footer in the Design tab, or hit the Esc key. After you
close the header or footer, it will still be visible, but it will be locked. To edit it again, just
double-click anywhere on the header or footer margin and it will become unlocked for editing. To
insert the date or time into a header or footer:
1. Double-click anywhere on the header or footer to unlock it. The Design tab will appear.
2. From the Design tab, click the Date & Time command.
3. Select a date format in the dialog box that appears.
4. Place a check mark in the Update Automatically box if you would like it to always reflect the
current date. Otherwise, it will not change when the document is opened at a later date.
5. Click OK.
f) Using Shapes and drawing tools

23
• 1. On the Insert tab, click Shapes.
• 2. Click the shape you want, click anywhere in the workspace, and then drag to place the shape. To create a perfect square or circle (or constrain the dimensions of other shapes), press and hold Shift while you drag.
Note:-
Word has many useful shapes (called AutoShapes) ready to insert into your documents. Basic shapes such as lines, bubbles, curves, and more can add a necessary visual element to your document. Learn how to take advantage of Word's AutoShapes feature with the following articles and utilize shapes with ease.
1. Creating a Drawing Object Word documents can contain more than just words—they can also contain drawing objects such as lines and simple shapes. Word provides an easy way to add such objects to a document.
2. Displaying the AutoShapes Menu AutoShapes are very useful for adding common drawing shapes to your document. You can make the AutoShapes easier to select and use by displaying the AutoShapes menu, as described in this tip.
3. Drawing a Curve Ever wonder how to add a curved line to your document? With a little practice, adding curves is simple.
4. Drawing Lines Lines are one of the most common graphic elements to be added to documents. Here's how you can add the lines you want.
5. Filling A Drawing Object Creating a drawing object can be just the first step in putting together your masterpiece drawing. This tip explains how you can fill the object with a color of your choosing.
6. Inserting Multiple Drawing Objects If you need to add more than one particular drawing object to your document, you can do it most easily by "tearing off" the drawing object menu that you need. This forces the menu to remain visible for as long as you need.
7. Moving an AutoShape Connector Once you have connectors established between different AutoShapes on your drawing canvas, you may need to move the connector line in some fashion. Word provides the tools you need to make the change.
8. Using AutoShape Connectors If you add AutoShapes to the drawing canvas, you can use connector lines between those shapes. Here's how to add them to your drawing efforts.
Steps:-
1.Click in your document where you want to create the drawing.
2.On the Insert tab, in the Illustrations group, click Shapes.
3.When you find the shape you want to insert, double-click to insert it automatically, or click and drag to draw it in your document.

24
f) Formatting refers to the appearance or presentation of your essay. Another word for
formatting is layout. Most essays contain at least four different kinds of text: headings, ordinary
paragraphs, quotations and bibliographic references
Why is formatting important?Types of it?
Formatting is important for two reasons:
• It makes your essay look like an essay (rather than a letter or a note to a friend). • It helps to make your essay more readable.
Lecturers do not usually give extra marks for the formatting of an essay. They are more interested in the content. But all readers are influenced by the presentation of a text. If your essay looks like an essay and is easy to read, the reader will be more likely to have a favourable attitude to what you have written.
4.1) Page formatting
4.2)Paragraph Formatting
4.1) Page formatting
4.1.1 Page Margins Page margins are the white space around the top, bottom, left, and right of your document. Margins let Word know where to start placing text at the top of a document, when to move on to the next page at the bottom, where to start typing text on the left side, and where to stop and move to the next line on the right.Changing or setting page margins in Word only requires a few simple steps. It really doesn't take any time at all once you know where to go and what to do.
✓ To change or set the page margins, click the Layout tab on the ribbon, then go to the Page
Setup group.

25
✓ Click the Margins button. It looks like this:
✓ Normal margins are one inch margins at the top, bottom, left, and right.
✓ To set your own margin, click Custom Margins at the bottom of the dropdown menu.
✓ You will then see the Page Setup dialogue box.
✓ Enter the margin measurement in inches for the top, bottom, left, and right margins.
✓ Click OK when you're finished.
4.1.2) How to Change the Orientation of a Page
26
When we talk about page orientation, there are two different orientations: landscape and portrait.
Landscape and portrait refer to how the document will be displayed on screen and printed. Choose
Landscape and your document will be printed horizontally. This is the most common orientation. If
you select Portrait, it will be printed from top to bottom (vertically). This is best for professional
photos of several people. If your document contains several photos, you may want to choose
Portrait.
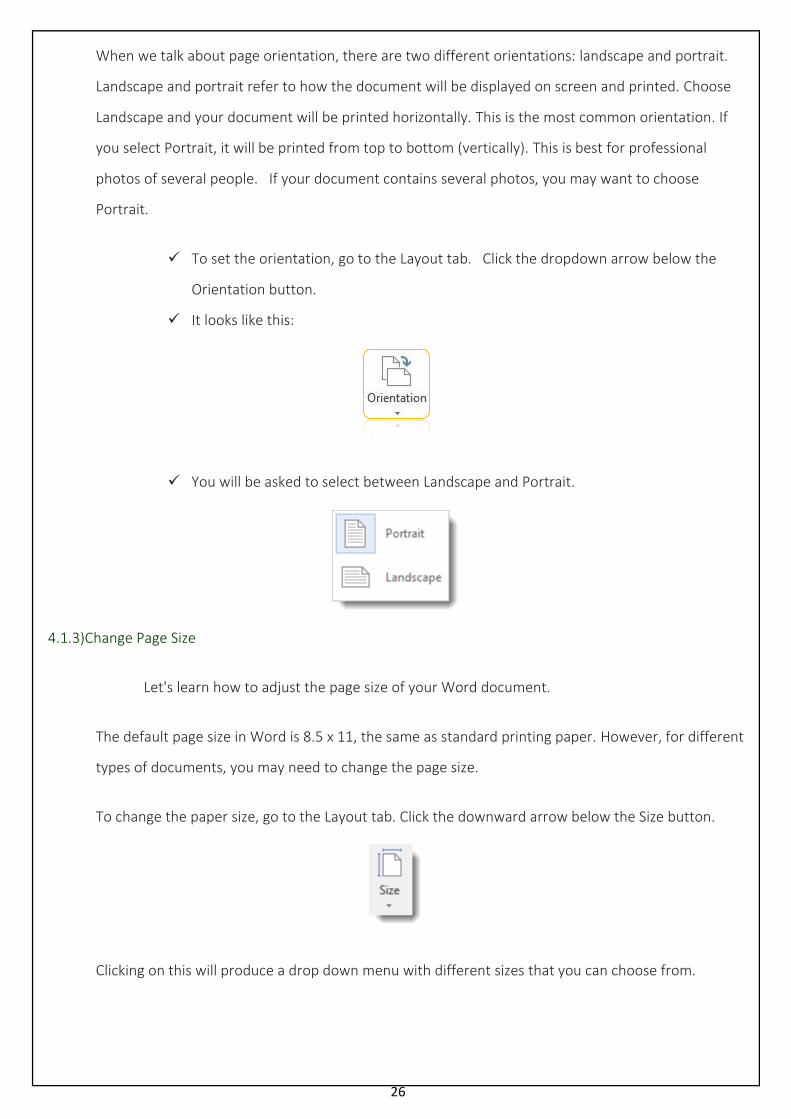
✓ To set the orientation, go to the Layout tab. Click the dropdown arrow below the
Orientation button.
✓ It looks like this:
✓ You will be asked to select between Landscape and Portrait.
4.1.3)Change Page Size
Let's learn how to adjust the page size of your Word document.
The default page size in Word is 8.5 x 11, the same as standard printing paper. However, for different
types of documents, you may need to change the page size.
To change the paper size, go to the Layout tab. Click the downward arrow below the Size button.
Clicking on this will produce a drop down menu with different sizes that you can choose from.

27
Choose the size of your final document. You can choose legal, A4, credit card size, etc.
4.1.4) Page Colors
✓ To do so, click the Design tab and then the Page Color button.
✓ Simply select a color from the menu.
✓ To create your own color, click "More Colors."

28
➢ Under the Standard tab, you can click on a color to select it, as shown above.
➢ If you click the Custom tab, you can use the color picker by clicking your mouse anywhere on
the color that you want, then use the slider to adjust the color to create the exact shade you
want.
➢ To add a gradient, texture, pattern, or picture
➢ click "Fill Effects" in the Page Color dropdown menu.

29
✓ In the Fill Effects dialogue box, you can add a gradient, texture, pattern, or image to use as a
background for your document.
4.1.5) Borders and Shading
Borders can be applied to an entire page, an entire document, or just certain sections of the
document. A border can also be applied to paragraphs.
To put a border around a page or a paragraph, go to the Design tab and click the Page Borders button
in the Page Background group. It looks like this:
When you click the Page Borders button, a new dialogue box opens.

30
Use this window to define the attributes of your border. You can choose to remove a border by
clicking the None box. Select a style, width, and color. You can even select some predefined artwork
from the Art dropdown box.
Using the Apply To dropdown, you can choose whether to apply these settings to the entire
document or just certain pages or sections.
Now take a look in the lower right hand corner of the window where it says "Options." Click that for
even more control over your border and shading options.

31
From here, you can choose the margins of your border, and whether or not to measure that from the
edge of the page or the edge of the text. Click OK when you're finished.
window. Select a color from the Fill dropdown menu, and a style. Click OK when finished.
4.2 Paragraph Formatting
A paragraph in Word is any text that ends with a hard return. ... Paragraph formatting lets you control
the appearance if individual paragraphs. For example, you can change the alignment of text from left
to center or the spacing between lines form single to double.
4.2.1 )To format line spacing:
1)Select the text you want to format. Selecting text to format.
2)On the Home tab, click the Line and Paragraph Spacing command. A drop-down menu will appear.
3)Move the mouse over the various options. ...
4)The line spacing will change in the document.
4.2.2) Align Paragraphs in Word:
1) To left align paragraphs in Word, select the paragraph you want to align.
2) Click the “Left Align” button in the “Paragraph” button group on the “Home” tab in the Ribbon.
3) To center align paragraphs in Word, select the paragraph you want to align.
4.2.3) The default line spacing in Word is 1.15. By default, paragraphs are followed by a blank line and
headings have a space above them. Here's how to change thedefault settings. On the Home tab,
Line and Paragraph Spacing.
4.2.4) Add numbering to existing paragraphs
1. If you already have a document with paragraphs and subparagraphs, select the paragraphs and subparagraphs you want to number (or press Ctrl + A to select all text in the document).
2. Click Home, and in the Paragraph group, click the Multilevel List icon.
4.2.5) First-line indent by default
1)Put the cursor anywhere in the paragraph.
2)On the Home tab, right-click the Normal style, and choose Modify.
3)Select Format, and then choose Paragraph.
4)On the Indents and Spacing tab, under Indentation, select First line.
5)Select OK.
6)Select OK again.
4.2.6) Bullets and Numbering is a paragraph level attribute that applies a bullet character or a numeral to the start of the paragraph. Applying a bullet is straightforward; numbering is a bit more complicated.
To do this, follow the steps below.
32
1)Position the cursor where you want to insert the number list.
2)Either click on the number button or bullet button or click Format and then Bullets and Numbering.
www.tutorialspoint.com We can create bullets use the following steps:
1. Position the insertion point where you want the bulletto appear.
2.Choose Symbol from the Insert menu. ...
3. Use the Font drop-down list to select the font you want to use for the bullet.
4. click on the bullet character you want inserted.
1. 5 Click on Close.
5.Using and Formatting Multiple Columns
By default, a blank document contains one column. The text begins at the left margin and runs
straight across the document to the right margin. However, if you're creating a newsletter or
brochure, you might want to add multiple columns
There are several benefits to using multiple columns. They can:
• Make your documents easier to read
• Make them visually interesting
• Make them look professional
• Allow you to use space more efficiently
Below is an example of a document that was made more interesting simply by breaking the text up
into columns.
33
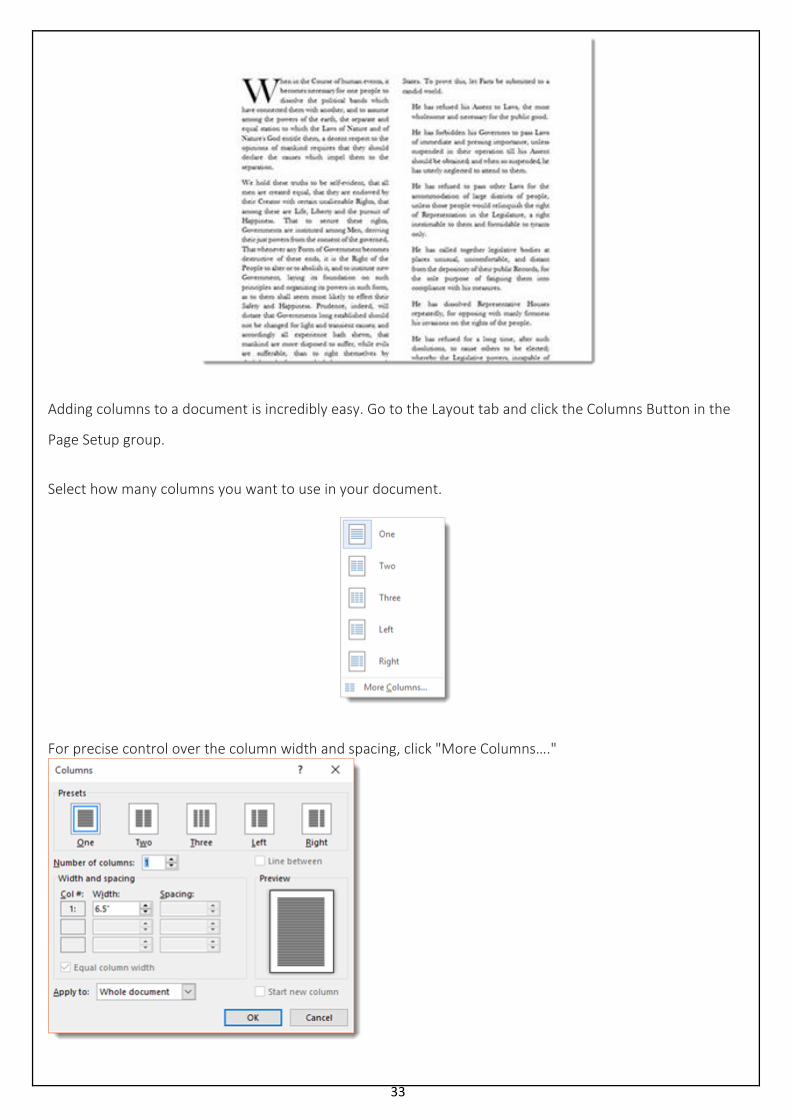
Adding columns to a document is incredibly easy. Go to the Layout tab and click the Columns Button in the
Page Setup group.
Select how many columns you want to use in your document.
For precise control over the column width and spacing, click "More Columns…."

34
In the dialogue box pictured above, you can adjust the width of the column, as well as the amount of space
between columns. You can also decide if you want the columns to apply to the whole document or from the
current point in the document forward.
Click OK when finished.
6. How to Add or Remove Page Breaks in Word 2016
1. Place the cursor where you want to start a new page. ...
2 . Go to Insert > Pages > Page Break. ...
3. Click on the Show/Hide symbol, which appears as a paragraph mark (¶) on the Home tab. ...
4. Double-click the break you want to remove.
5. Hit Delete.
6. Highlight the paragraphs or lines you want to keep together.
Mail Merge
A mail merge is a capability of word processors, and some e-mail programs. Mail merge takes a standard
form e-mail and populates it with personal information such as e-mail address, name, address, and phone
number of the recipient. The resulting messages will be unique for each person in a database or other source
of structured data.
Example of a mail merge
For example, a standard mail merge form may look like the example below. In this example, each of the
bracketed words (e.g., [address]) are the fields merged during the mail merge.
[address]
Dear [username],
We would like to thank you [username] for purchasing our product.
Sincerely,
Some company
With a program capable of mail merge, the program would pull the personal information and place the
appropriate information into the above fields. So, one of the final outputted or sent results may look like the
example below.

35
1234 some street
City, State Zip
Dear Bob Smith,
We would like to thank you Bob Smith for purchasing our product.
Sincerely,
Some company
How to mail merge and print in Microsoft Word
Step one and two
In Word on the Office Ribbon click Mailings, Start Mail Merge.
Step three
After the mail have been created click the Select Recipients button in Mailings and then click Use
Existing List. In the Select Data Source window, point Word to the location of your file and click OK.
If the file inserts properly, you should now have <<Next Record>> on each of your letter.
Step four
Next, click the Address Block Button and verify the address is properly formatted. If the address is not
being displayed properly, click the Match Fields button and change how the fields are being matched.
Once the address is being displayed properly click the OK button. This should put the
<<AddressBlock>> field into the first letter .
.
Step five
Finally, click the all fields. The first mail should have only the <<AddressBlock>> field and all
othershould have <<Next Record>><<AddressBlock>> to step through each address field and print
the address block in each mail.

36
Step six
To make sure everything looks ok, click the Preview Results button, which should show each mail and
a different address for each label. If you want to preview more than just the first page click the arrow
pointing to the right while still in preview mode to show other pages
Step seven
If everything looks ok click the Finish & Merge button and then Print Documents to print the letters.
37
Unit 5
What is MS Excel?
❖ MS Excel is spreadsheet program used for performing calculations on data and advanced features like
filtration, sorting, searching etc.
❖ MS Excel file is called workbook and this file consist of number of sheets.
❖ MS Excel file format is .xls
What are columns and columns header?
Vertical lines are called ‘columns’ in excel and each column has specified name called ‘column Header’. Like
(A, B, C…………. Z…. AA,AB..)
There are 16384 columns in one sheet.
What are Rows and Row headers.?
Horizontal lines are called “Rows” in excel and each row has a specified name which is called “Row header”
like (1,2, 3….) there are 10,48,576 rows in one sheet.
What are Cells?
Intersection point of row and column in called ‘cell’.
What is cell address?
Combination of column name and row name make “cell address” like column A and Row 100 will make cell
A100.
What is name box?
The cell address of the active cell is shown in the name box which is on top left side.
What is Sheet tab?
In excel each sheet has a specified name like sheet1, sheet 2 known as sheet tab, we can change sheet name
and insert or delate sheets.
What is the difference between sheet and the workbook?
Combination of cell is called “sheet” and combination of sheets is called “workbook”.
What is Range?
More than two selected cells are called “Range” like (A1: A10)
How can we insert / delete column / Row?
Home >cell >insert /delete (row or column).
How can we create name of range?
Yes, we can, select cells >Type name in name box > press enter.
What are operators?
Specified signs to perform specified actions are called ‘operators’.
MS Excel

38
How many types of operators are there?
There are two types of operators:
1.Arithmatic operators:
Sign Name Description
+ Plus used for addition of numeric values.
- minus used for subtraction.
* Asterisk multiplication between numeric values
/ forward slash Used for division
^ Exponentiation To create power
2. Logical (comparison) operators
Sign Name
= Equal to
> Greater than
< Less than
>= Greater than or equal to
<= less than or equal to
<> not equal to
What is a Formula?
Any expression created by the user is called a ‘Formula.’
There are two parts of any formula.
1. Operand: cell name is called operand like A1, B6, D3, G6 etc.
2. Operator: like =, +, -, etc.
Eg.= 5000 +500 =? Or =A1 + B1 -?
What is a function?
Predefined equations are called ‘Function’ like = Sum, = count, =Max etc.
There are three parts of any function:
1. operand
2. Operator
3. Function name: Sum, count, maximum, min. etc.
Each function or formula will start with an equal to (=) sign.
Functions:
Sum used for addition, just numeric values and ignore test values:
= Sum (Number 1, 2, 3, 4……….)

39
=Sum (cell 1: cell 2)
Max Shows largest number in the range and ignores text values.
=max. (Number1,2, 3,)
=max. (cell1: cell2)
Min Shows smallest values in the range and ignores test values:
=min (Number1,2,3. …….)
=min (cell1: cell2)
Average Return average of the given range:
=Average (Number1,2,3. …….)
=Average (cell1: cell2)
Count used to count the number of cells which have a values:
= count (Number1,2,3. …….)
=count (cell1: cell2)
Count A: used for a count of all values (text numbers and special characters.
=countA ( Number1,2,3. …….)
=countA (cell1: cell2)
Count blank: used to count just blank cells:
=Count blank (San tosh)
=Count blank (cell1: cell2)
Countif: counts the number of cells with a range that meets a given condition:
=Countif (Range, “criteria”)
=Count if (cell1: cell2., “operator --value.”)
What is a series operation?
This is used to create series of number, date etc.
Home > Edit >Fill >Series> column/ row
Line growth
Date Autofill
What is custom list?
Office button >Excel option >Popular
- Edit custom list >import >
- Add / delete > ok.

40
Unit -5
➢ Advance features of MS power point
What are the different views of a presentation?
Word documents have normal view and page layout view. Database tables have design view and datasheet view. It only seems fair that PowerPoint documents have their own views. In PowerPoint you can work with presentations in five different views:
1. Slide 2. Outline 3. Slide Sorter 4. Notes Page 5. Slide Show
Each view optimized for a specific purpose. (In the lower left-hand corner of the images below, notice how
the view icons change for each view. You can quickly switch between views by clicking on the view icons.)
Slide View shows one slide at a time Slide view is optimized for editing. You can edit not only the text of a slide but also any graphics, sounds, and animations that might be included on the slide. This is usually the best view when you are working with an individual slide.
Slide View
Outline View
Outline View shows the contents of your presentation in outline format. This view is optimized for organizing and arranging the content of your presentation.
Because the contents of all slides (that will fit on the page) are shown at once, you can easily view and change the order of topics and subtopics. This view is also probably the most efficient for entering the contents of your presentation.
Slide Sorter View shows a thumbnail image of each slide in your presentation. This view is best when you want to rearrange the order of your slides or just want to see each slide in your presentation with the formats and colors you have chosen. In Slide Sorter View you can't edit the contents of a slide, but you can quickly switch to Slide View were you can edit the contents.
Slide Sorter View
Advanced Features of Powerpoint

41
Notes Page View
Notes Page View shows one slide at a time with speaker's notes. This view is best when you are entering or reviewing the notes you made for slides.
Slide Show View shows your presentation as it will look to the audience when you run it. This view displays one slide at a time in full-screen mode.
Using Animation and Slide Transition Effects on PowerPoint Slides Adding movement to your slides through the use of animation or slide transition effects is risky. Movement distracts the audience from your message. Here are suggested approaches for using animation and slide transitions in a professional presentation. Animation Effects A number of organizations have “banned” animation and animation has a poor reputation amongst many presenters and audiences. Why has this happened? Because too often presenters use fancy animation effects like twirling, flying, or bouncing in an effort to “keep the audience paying attention”. These effects do not keep the audience paying attention, they annoy and distract the audience. Is animation ever appropriate? Yes. It is useful when you want to build the different parts of a slide in order to focus the audience as you explain your point. Instead of having all of the elements appear on the slide at the start, you build each piece as you speak about it so you can give context before they come to a conclusion. Use only simple animation effects, such as Appear, Fade, Dissolve, and Wipe instead of the crazy motion effects. This way the effect does not distract from the message you are delivering. Slide Transition Effects Some presenters use slide transition effects between their slides in an attempt to keep the audience visually interested by using movement. These effects don’t help the audience, they are distracting and take away from the audience paying attention to the presenter.

42
The only slide transition I suggest you consider is a quick (0.5 second) Fade between slides if you want to have something other than a quick appearance of the next slide. It is subtle and does not distract the audience. Every element of your presentation, including the use of animation or slide transition effects should be tested to make sure they add to your message, not detract from it. Keep this in mind when you consider the use of animation or slide transitions in your presentation. Applying Design Templates in PowerPoint
PowerPoint has the ability to use templates to create presentations. These templates are designed to give
your slide presentations a consistent appearance. Templates are ready-to-use presentations into which you
put your own information. You can use the templates provided or create your own.
Design templates
Design templates contain color schemes, slide and title masters with custom formatting, and styled fonts designed for a particular "look." When you apply a design template to your presentation, the slide master and color scheme of the new template replace the slide master and color scheme of the original presentation. After you apply a design template, each slide you add, regardless of the AutoLayout has the same custom look.
Create your own design template
1. Open a presentation you wish to use a basic design template or create a presentation for this purpose.
2. Click on File in the ribbon, click on Save As and choose where to save it.
3. In the Save As dialog box, under File name, type in a name for your template.
4. Click Design Template from the Save as type: dropdown menu (bottom of screen).
5. Click the Save button.
Apply a design template
1. Open your presentation.
2. Click the Design tab on the ribbon.
Click the design you want - the design is applied to the presentation. Design themes make it easy to apply a set of coordinating features to each and every one of your slides. The slide backgrounds, and font styles, colors and sizes are retained in the design theme. By default, only one design theme can be applied to a presentation. At times though, it is advantageous to have an additional one or more design themes available in the same presentation. This can be achieved by adding a new design theme to the slide master, which contains all the information about the slide layouts and styles in this presentation.
➢ Accessing the PowerPoint Slide Master for First Design Theme
1. Click on the Slide Master button, in the Master Views section of the ribbon. The Slide Master tab on the ribbon opens.
2. In the Edit Theme section of the ribbon, click the drop-down arrow below the Themes button. This will reveal the available design themes to apply.
3. Click on a theme of your choice to apply to all of the slide layouts. Note - To apply the design theme to only a specific slide layout, click on the thumbnail view of that layout before applying the design theme.
• Add an Additional Slide Master to the PowerPoint Presentation
Select the location of the new slide masters:
43
1. On the left side of the screen, in the Slides/Outline pane, scroll down to a blank space after the last slide layout.
2. Click in the blank space below the last thumbnail of the slide layout.
• Add an Additional Design Theme to the PowerPoint Slide Master
Select an additional design theme for this presentation:
1. Once again, click the drop-down arrow under the Themes button on the ribbon. 2. Click on a different theme from what you chose earlier.
• New Design Theme Added to Additional PowerPoint Slide Masters
A new complete set of slide masters will appear, in the Slides/Outline pane, below the original set.
• Close PowerPoint Slide Master View
Once all the additional slide masters have been added to the presentation file, click on the Close Master View button on the ribbon.
• Choose Which Design Theme to Apply to New PowerPoint Slides
Once you have chosen the additional design themes to apply to slides in this presentation, it is time to add a new slide.
1. Click on the Home tab of the ribbon. 2. Click the New Slide button. A drop-down list of all the different slide layouts with the different design
themes will appear.
Scroll in the list and click on the slide layout of your choice in the correct design theme. The new slide will
appear with this design theme applied, ready for your input.
➢ Import content from other applications into PowerPoint
You can import content from other programs into your presentation. This includes files created by other Microsoft Office programs, as well as files from other programs that support Object Linking and Embedding (OLE).
• There are two ways to insert content objects into a PowerPoint presentation:
• Linked objects A linked object is updated if its source file is changed. For example, a linked chart built from data in Microsoft Excel is changed if the source Excel data changes. The source file must be available on your computer or network to maintain the link between the inserted object and the source data. Inserting a linked object is recommended if the source data set is large or complex. • Embedded objects The source data is embedded in the presentation. You can view the embedded object on another computer, because the source data is part of the presentation file. Embedded objects typically require more disk space than linked objects.
➢ Easily Create a Self-Running PowerPoint Slide Show
You can set up self-running PowerPoint presentations to run automatically at trade shows, conventions, events or as web-based presentations. Prior to setting up a self-running show, apply your preferred animations to text and objects as well as any slide transitions and they can be included in the show (unless
44
specified otherwise in the Set Up Show dialog box). When you create automatic slide shows, you will also have the option of including slide timings, narrations or voice over and ink. Ink can be included only if you have PowerPoint 2013 or 2016.
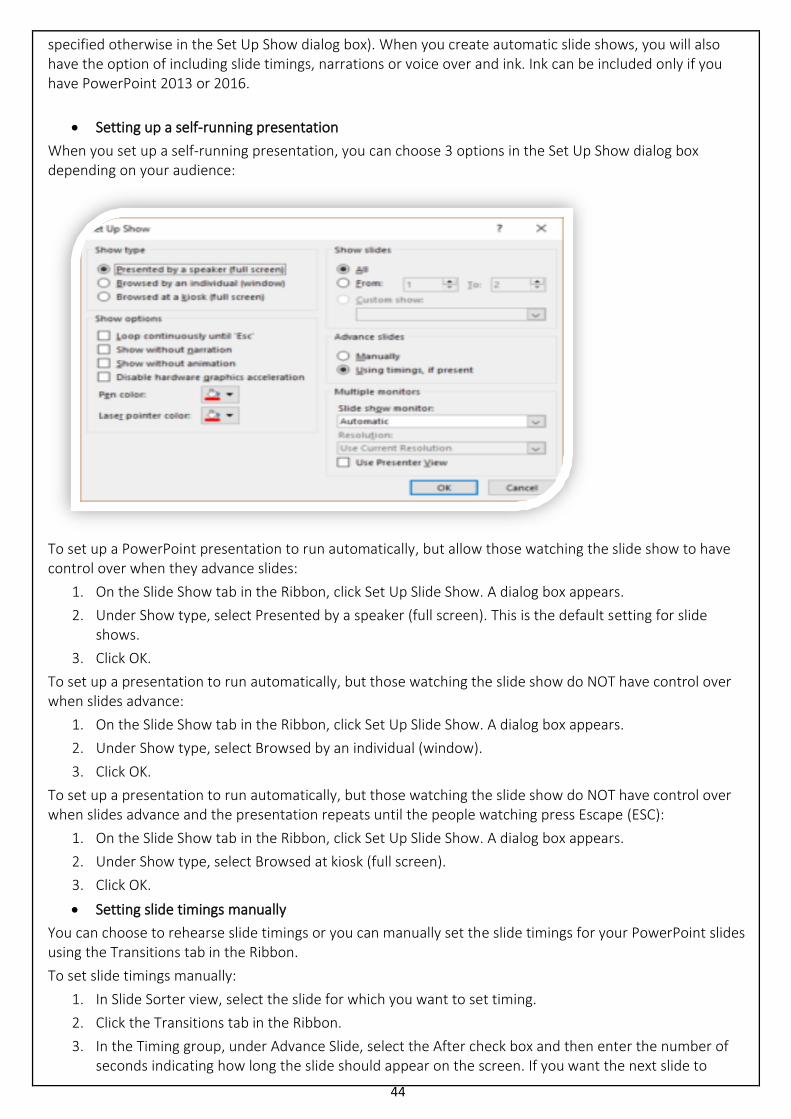
• Setting up a self-running presentation
When you set up a self-running presentation, you can choose 3 options in the Set Up Show dialog box depending on your audience:
To set up a PowerPoint presentation to run automatically, but allow those watching the slide show to have control over when they advance slides:
1. On the Slide Show tab in the Ribbon, click Set Up Slide Show. A dialog box appears.
2. Under Show type, select Presented by a speaker (full screen). This is the default setting for slide shows.
3. Click OK.
To set up a presentation to run automatically, but those watching the slide show do NOT have control over when slides advance:
1. On the Slide Show tab in the Ribbon, click Set Up Slide Show. A dialog box appears.
2. Under Show type, select Browsed by an individual (window).
3. Click OK.
To set up a presentation to run automatically, but those watching the slide show do NOT have control over when slides advance and the presentation repeats until the people watching press Escape (ESC):
1. On the Slide Show tab in the Ribbon, click Set Up Slide Show. A dialog box appears.
2. Under Show type, select Browsed at kiosk (full screen).
3. Click OK.
• Setting slide timings manually
You can choose to rehearse slide timings or you can manually set the slide timings for your PowerPoint slides using the Transitions tab in the Ribbon.
To set slide timings manually:
1. In Slide Sorter view, select the slide for which you want to set timing.
2. Click the Transitions tab in the Ribbon.
3. In the Timing group, under Advance Slide, select the After check box and then enter the number of seconds indicating how long the slide should appear on the screen. If you want the next slide to

45
appear either when you click the mouse or automatically after the number of seconds that you enter (whichever comes first), select both the On Mouse Click and the After check boxes.
4. Repeat the process for each slide for which you want to set timing.
• Rehearsing and recording slide timings
If you choose Browsed by an individual (window) or Browsed at a kiosk (full screen) in the Set Up Show dialog box, you can rehearse and record timings for animations, transitions and advancing slides.
To rehearse timings, you’ll use the Rehearsal toolbar shown below:
The toolbar includes the following buttons from left to right:
• Next (advance to next slide)
• Pause
• Slide time
• Repeat
• Total presentation time
Click the buttons in the Rehearsal toolbar to perform the following actions:
• Click Next to advance to the next slide.
• To temporarily stop recording the time, click Pause.
• To restart recording the time after pausing, click Pause.
• To set an exact length of time for a slide to appear, type the length of time in the Slide Time box.
• To restart recording the time for the current slide, click Repeat.
To rehearse timings:
1. On the Slide Show tab in the Ribbon, click Rehearse Timings. The Rehearsal toolbar appears and the timer begins immediately. The presentation appears in full screen recording mode.
2. Click the desired buttons. Click Next to advance to the next slide or press the right arrow on your keyboard. To temporarily stop recording the time, click Pause. To restart recording the time after pausing, click Pause. To set an exact length of time for a slide to appear, type the length of time in the Slide Time box. To restart recording the time for the current slide, click Repeat.
3. Continue clicking on the appropriate buttons until you are satisfied with the timings. The total presentation time appears on the top right of the Rehearsal toolbar.
4. After you set the time for the last slide, a dialog box displays the total time for the presentation and another dialog box appears.
5. To keep the recorded slide timings, click Yes. To discard the recorded slide timings, click No.
The presentation appears. If you view the presentation in Slide Sorter view, the slide timing is displayed below each slide.
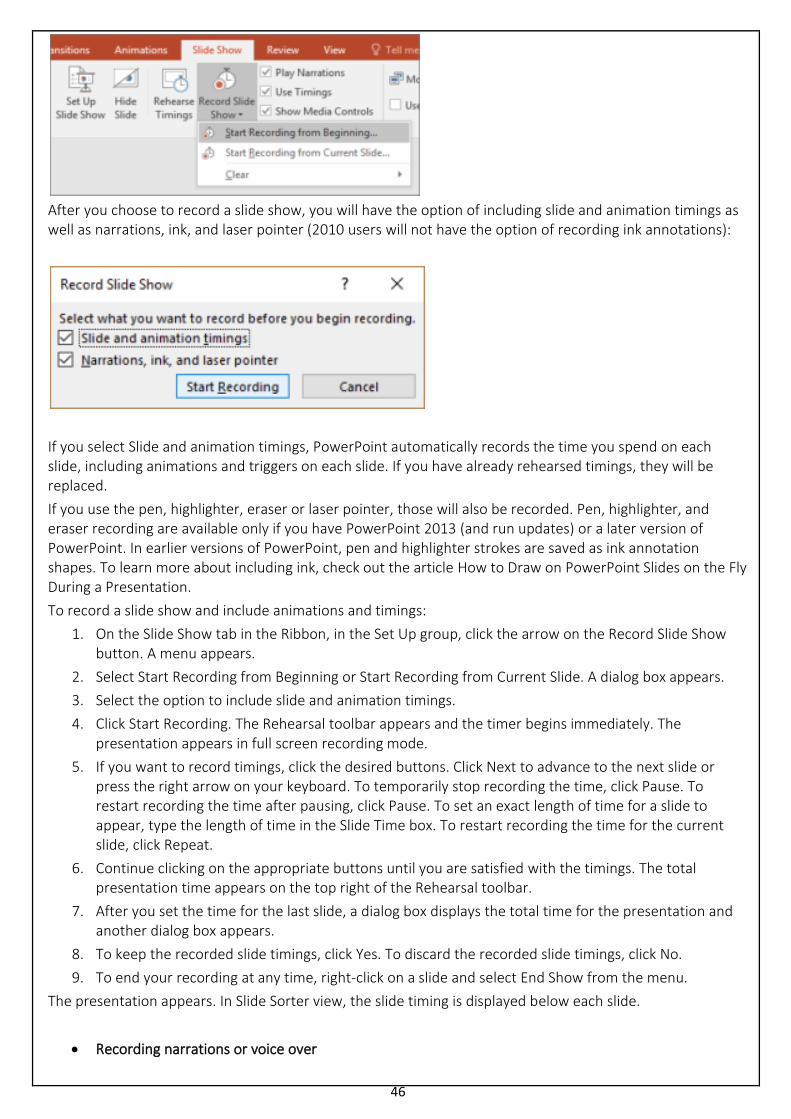
• Recording a slide show with timings
Instead of using the Rehearse Timings button, you can record timings (and narrations or voice over) as you record a show. The Record Slide Show button appears on the Slide Show tab in the Ribbon. When you record a slide show, you can start from the beginning or the current slide:
46
After you choose to record a slide show, you will have the option of including slide and animation timings as well as narrations, ink, and laser pointer (2010 users will not have the option of recording ink annotations):
If you select Slide and animation timings, PowerPoint automatically records the time you spend on each slide, including animations and triggers on each slide. If you have already rehearsed timings, they will be replaced.
If you use the pen, highlighter, eraser or laser pointer, those will also be recorded. Pen, highlighter, and eraser recording are available only if you have PowerPoint 2013 (and run updates) or a later version of PowerPoint. In earlier versions of PowerPoint, pen and highlighter strokes are saved as ink annotation shapes. To learn more about including ink, check out the article How to Draw on PowerPoint Slides on the Fly During a Presentation.
To record a slide show and include animations and timings:
1. On the Slide Show tab in the Ribbon, in the Set Up group, click the arrow on the Record Slide Show button. A menu appears.
2. Select Start Recording from Beginning or Start Recording from Current Slide. A dialog box appears.
3. Select the option to include slide and animation timings.
4. Click Start Recording. The Rehearsal toolbar appears and the timer begins immediately. The presentation appears in full screen recording mode.
5. If you want to record timings, click the desired buttons. Click Next to advance to the next slide or press the right arrow on your keyboard. To temporarily stop recording the time, click Pause. To restart recording the time after pausing, click Pause. To set an exact length of time for a slide to appear, type the length of time in the Slide Time box. To restart recording the time for the current slide, click Repeat.
6. Continue clicking on the appropriate buttons until you are satisfied with the timings. The total presentation time appears on the top right of the Rehearsal toolbar.
7. After you set the time for the last slide, a dialog box displays the total time for the presentation and another dialog box appears.
8. To keep the recorded slide timings, click Yes. To discard the recorded slide timings, click No.
9. To end your recording at any time, right-click on a slide and select End Show from the menu.
The presentation appears. In Slide Sorter view, the slide timing is displayed below each slide.
• Recording narrations or voice over

47
In addition to timings, you may want to add narrations or voice over. You can record narrations before you run a presentation or you can record narrations during a presentation and include audience comments. When you add narrations, PowerPoint automatically records your slide timings. Alternatively, you can set the slide timings first. Be sure to test the microphone first. If you do not want narrations throughout your entire presentation, you can record separate sounds or comments on selected slides or objects.
To record narrations, your computer requires a sound card, microphone, speakers and a webcam (optionally). You will also need a microphone connector if the microphone is not part of your computer.
It’s not a bad idea to create a script first in Microsoft Word to improve flow and avoid filler words such as “um”. You may also want to practice before recording although you can always re-record narration.
To record a slide show with narrations:
1. On the Slide Show tab in the Ribbon, in the Set Up group, click the arrow on the Record Slide Show button. A menu appears.
2. Select Start Recording from Beginning or Start Recording from Current Slide. A dialog box appears.
3. In the Record Slide Show dialog box, select the check box for Narrations and laser pointer and, if required, select or deselect the Slide and animation timings check box.
4. Click Start Recording. A Rehearsal toolbar appears.
5. Speak into the microphone to record a narration.
6. To pause the narration, in the Rehearsal toolbar, click Pause. To resume the narration, click Resume Recording.
7. To end your slide show recording at any time, right-click on the slide and then select End Show.
The recorded slide show timings and narrations are saved. If you view the presentation in Slide Sorter view, timings appear beneath each slide. A sound icon also appears in the lower-right corner of each slide that has narration.
If you re-record your narration (including audio, ink, and laser pointer), PowerPoint erases your previously recorded narration (including audio, ink, and laser pointer) when you start recording again on the same slide.
To use ink, eraser, or the laser pointer during your recording, right-click on the slide, select Pointer options and choose the laser pointer, pen, highlighter or eraser. Ink is not available for 2010 users. If you want to display a laser pointer while you’re recording, press Control and your pointer will appear as a small red circle on your screen.
• Previewing narration
If you want to listen to the narration on a slide:
1. In Normal view, click the sound icon in the lower-right corner of the slide.
2. Click Play.
• Running a recorded slide show
To run a recorded slide show in Normal view:
1. If necessary, on the Slide Show tab in the Ribbon, click Set Up Slide Show. A dialog box appears.
2. Under Show type, select the desired option.
3. Click OK.
4. On the Slide Show tab, click From Beginning or From Current Slide. During playback, your animations, inking actions, laser pointer, audio and video play in sync.
5. To end the show, press Escape.
• Turning timings or narrations off
You can turn off timings and narrations and then turn them on again at any time.
To turn off recorded slide timings, on the Slide Show tab, deselect the Use Timings check box.
To turn off recorded narrations, ink, and the laser pointer, on the Slide Show tab, deselect the Play Narrations check box.

48
• Deleting timings or narration
You can use the Clear command to permanently delete timings or narration from your slide show recording. You have 4 options:
• Delete timings on the current slide
• Delete timings on all slides
• Delete narration on the current slide
• Delete narration on all slides
To clear timings or narrations:
1. On the Slide Show tab, click the arrow below Record Slide Show. A menu appears.
2. Select Clear and then the appropriate clear option.
49
Unit 6
Network, Internet and WWW
➢ A network is interconnection between computer and various devices. ➢ Combination of many networks is called as internet. Network devices can be connected to
With cables or without cables
➢ Why do we need a network?
• To share hardware and software resources.
• Cost effective
• It is reliable
• Fasted and cheapest way to communication. ➢ Protocols: It is a set of rules through which computers in a network can communicate with each
other.
Inside Internet
1. Network: It is a group of interconnected computers and devices. These may be connected by a cable or wireless.
2. Internet : It is a network of networks i.e. it is a group of interconnected networks.
3. Protocols : It is a set of rules, through which computers in a network can communicate with each other. For example:-
a. TCP : Transmission control protocol
b. IP : Internet Protocol
c. HTTP : Hypertext transfer protocol.
4. Search Engine : It is a software which is used to reach for a document or a file in world wide web (www). Ex. Google, yahoo.
5. Browser: It is a software which is used to navigate or move through the web pages. It also helps in displaying the web page. E.g. google chrome, Firefox, internet explorer, Mozilla, Netscape navigator, safari (apple safari) etc
Different types of network
Ans. There are 3 types of network
a. LAN : Local area network: It is a group of interconnected computers and devices; spread over a small area. For example a room, building or a campus. If the network is connected without cables, then it is called as WLAN (wireless LAN)
b. MAN (Metro political area network): it is a combination of many groups of LANs. Eg. Cable, television network.
c. WAN (wide area network): It is the group of many LANs and MANs. It spans entire cities and countries. Eg. www. internet etc
WWW
Basics of Networking
50
The World Wide Web (WWW) is combination of all resources and users on the Internet that are using the Hypertext Transfer Protocol (HTTP). A broader definition comes from the World Wide Web Consortium (W3C): "The World Wide Web is the universe of network-accessible information, an embodiment of human knowledge
Popular services of internet
Internet is the global computer network and is the interconnected network by using a standardized communication protocol. It provide many information to the users. Internet provide many services these services are used for business, download files, interactions, marketing, etc. The services are:
1. Web Services 2. Communication Services 3. World Wide web 4. Video conferencing 5. Electronic Mail 6. Chat Rooms, etc
Internet provide many benefits to our life that is: Improve our knowledge, Skill and learning capacity , Banking , Billing , Address mapping, etc.
Searching information
Most information is found on the Internet by utilizing search engines. A search engine is a web service that uses web robots to query millions of pages on the Internet and creates an index of those web pages. Internet users can then use these services to find information on the Internet.
Electronic mail (email or e-mail) is a method of exchanging messages ("mail") between people using electronic
devices. Email operates across computer networks, which today is primarily the Internet. In other words messages distributed by electronic means from one computer user to one or more recipients via a network.
The following steps to send an email are:-
1. On your computer, go to Gmail. 2. In the top left, click Compose. 3. In the "To" field, add recipients. If you want, you can also add recipients in the "cc" and "bcc" fields. 4. Add a subject. 5. Write your message. 6. At the bottom of the page, click Send.