Civil Service Fast Stream and Fast Track: Annual Report 2015 · departments – won the 2015 Best...
71
Civil Service Fast Stream and Fast Track: Annual Report 2015
Transcript of Civil Service Fast Stream and Fast Track: Annual Report 2015 · departments – won the 2015 Best...

Civil Service Fast Stream and Fast Track: Annual Report 2015

2
FAST STREAM AND FAST TRACK ANNUAL REPORT 2015
Foreword
The UK is changing and so must the Civil Service change with it. In order to meet ever rising public expectations and take advantage of new technologies, it is vital that the Civil Service continues to bring in the best and brightest individuals who both reflect the society they serve and can collaborate and innovate to transform the relationship between the citizen and the state.
The Civil Service exists to serve the citizens of this country – and the best way to do so is better to understand the challenges that people face. A dynamic, modern and diverse workforce boosts the legitimacy of the Civil Service in the eyes of the public and also allows us to tap into the riches of the country and draw from the full and varied talents of the people of the United Kingdom.
That is why we are committed to ensuring that the Civil Service continues to attract the highest possible calibre of applicants in
both of our flagship entry level programmes: the Fast Stream Graduate scheme and the Fast Track Apprenticeship scheme. We are especially determined to ensure that the schemes are more representative in terms of socio-economic background – a crucial part of our 2014 Talent Action Plan which sets out measures to remove the barriers preventing talented people succeeding.
The Fast Stream is designed to equip determined graduates with the skills and attributes they need to shape and lead a modern, dynamic Civil Service. Following
the launch of the new look Fast Stream graduate development programme in 2013, a range of specialist schemes have been added, such as Science and Engineering and Digital and Technology.
In 2015, we continued to develop the Fast Stream even further. It was an award-winning year as the programme continued to attract industry and student accolades,
including The Times Graduate Employer of Choice for the public sector. The barrier-breaking Early and Summer Diversity Internship Programmes – which put talented graduates and undergraduates from less advantaged backgrounds into fascinating work placements in government departments – won the 2015 Best Diversity Initiative in Work Experience National Employability Award.
Fast Stream application and success rates for under-represented groups have continued to rise; individuals from Black, Asian and Minority Ethnic (BAME) backgrounds made up 20.6% of successful applicants this year. But other areas need improvement, which is why the Government commissioned the Bridge Group to look at socio-economic diversity in the Fast Stream. The final Bridge Group Report, published in February 2016, contained important findings about social mobility in the Fast Stream: just 4.4% of successful
applicants to the Fast Stream are from lower socio-economic backgrounds, compared to 24% of University students. That makes the Fast Stream less diverse than Oxbridge in terms of socio-economic diversity.
As the Prime Minister made clear on the steps of Downing Street, it is burning injustices such as these that this Government is determined to tackle. It is only by measuring diversity in its current form that we can identify where the problems lie and take the necessary steps to address them. That is why the Civil

Civil Service Fast Stream and Fast Track: Annual Report 2015
3
Service has committed to our Talent Action Plan that sets out what we will do to make sure that no person’s background has a bearing on their prospects of joining the Civil Service. For the Fast Stream, this will include:
identifying and increasing our visibility on campuses with under-represented students;
introducing regional assessment centres outside London, starting with one in 2016 and more planned
thereafter; and working more closely with partner
organisations such Rare Recruitment to reach underrepresented groups.
This year, the Cabinet Office also took on responsibility for the Fast Track Apprenticeship scheme and the Schools and College Outreach Programmes both of which will continue to expand over the coming year. Apprenticeships offer a fantastic alternative to university and give school leavers the opportunity to earn and learn at the same time. We have grown the scheme year on year and expect that the numbers entering via Fast Track Apprenticeships will soon match the Fast Stream entry as we look to grow the scheme even further. The success of Fast Track – included here in the annual report for the first time – marks another positive step towards broadening access and creating a diverse, modern civil service with
the skills and capability needed to help lead and deliver vital public services.
We have had the opportunity to meet many Fast Streamers and Fast Track Apprentices – and we can tell you that they are intelligent, dedicated and determined to help shape a modern, dynamic Civil Service. Within weeks of joining they find themselves doing fascinating and stretching
work: from working with Ministers on key policy decisions to supporting the implementation of multi-billion pound programmes, they are instantly making a difference by serving the public.
Only by identifying and nurturing the best, diverse talent can the Civil Service be better representative of the UK and responsive to the needs of its citizens. 2015 was a time of considerable change and improvement for the Fast Stream and Fast Track Apprenticeship schemes. We look
forward with confidence to another exciting year ahead.
Rt Hon Ben Gummer MP
Minister for Cabinet Office
Sir Jeremy Heywood
Cabinet Secretary and Head of the Civil Service
November 2016

Civil Service Fast Stream and Fast Track: Annual Report 2015
5
CONTENTS INTRODUCTION ............................................................................................. 6
THE 2015 FAST STREAM OPTIONS ............................................................. 6
THE FAST STREAM SELECTION PROCESS ............................................... 7
CASE STUDY – CALLUM STAFF .................................................................. 8
CASE STUDY – SHERENE CAESAR-JOHNSON .......................................... 9
THE FAST STREAM INTERNSHIP PROGRAMMES ..................................... 9
THE INTERNSHIP SELECTION PROCESS ................................................. 10
CASE STUDY – SHANNON TURNER .......................................................... 10
THE 2015 CIVIL SERVICE FAST TRACK APPRENTICESHIP SCHEME OPTIONS ....................................................................................................... 11
CIVIL SERVICE FAST TRACK APPRENTICESHIP SCHEME ..................... 11
THE FAST TRACK SELECTION PROCESS ................................................ 11
CASE STUDY – MOHAMMED AHMED ........................................................ 12
CIVIL SERVICE SCHOOLS OUTREACH PROGRAMMES .......................... 12
OUTREACH ACTIVITY ................................................................................. 14
THE FAST STREAM IN 2015 – A SNAPSHOT ............................................ 14
THE CORPORATE FAST STREAM ............................................................. 15
CASE STUDY – CAMILLA THOMPSELL ..................................................... 16
CASE STUDY – JOHN STEWART ............................................................... 17
LOOKING AHEAD ........................................................................................ 17 New Fast Stream programmes 17 Growing the centrally managed model 18 Progressing the Bridge Report recommendations 18 Civil Service Fast Track Apprenticeship Expansion 19
FAST STREAM RECRUITMENT IN 2015 – HEADLINE FIGURES .............. 19 Applications 19 Diversity 19 (i) Gender 20 (ii) Ethnicity 20 (iii) Disability 21 (iv) Socio-economic background 21 (v) Sexual orientation 21 (vi) Academic background 21 Summer Diversity Internship Programme 22 Early Diversity Internship Programme 22
CIVIL SERVICE FAST TRACK APPRENTICESHIP SCHEME RECRUITMENT IN 2015 – HEADLINE FIGURES ........................................ 23 (i) Gender 23 (ii) Ethnicity 23 (iii) Disability 23 (iv) Socio-economic background 23 (v) LGBT 23
DETAILED ANALYSIS …………………………………………………………...30
Civil Service Fast Stream and Fast Track: Annual Report 2015
6
INTRODUCTION
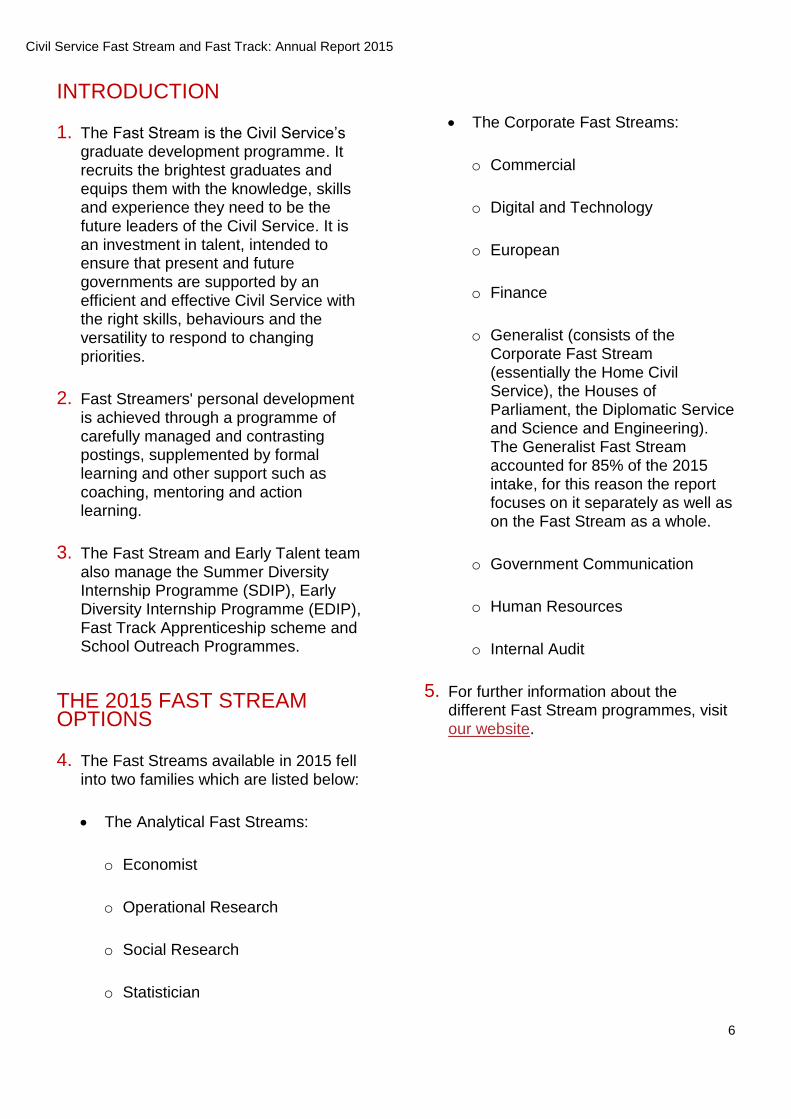
1. The Fast Stream is the Civil Service’s graduate development programme. It recruits the brightest graduates and equips them with the knowledge, skills and experience they need to be the future leaders of the Civil Service. It is an investment in talent, intended to ensure that present and future governments are supported by an efficient and effective Civil Service with the right skills, behaviours and the versatility to respond to changing priorities.
2. Fast Streamers' personal development is achieved through a programme of carefully managed and contrasting postings, supplemented by formal learning and other support such as coaching, mentoring and action learning.
3. The Fast Stream and Early Talent team also manage the Summer Diversity Internship Programme (SDIP), Early Diversity Internship Programme (EDIP), Fast Track Apprenticeship scheme and School Outreach Programmes.
THE 2015 FAST STREAM OPTIONS
4. The Fast Streams available in 2015 fell into two families which are listed below:
The Analytical Fast Streams:
o Economist
o Operational Research
o Social Research
o Statistician
The Corporate Fast Streams:
o Commercial
o Digital and Technology
o European
o Finance
o Generalist (consists of the Corporate Fast Stream (essentially the Home Civil Service), the Houses of Parliament, the Diplomatic Service and Science and Engineering). The Generalist Fast Stream accounted for 85% of the 2015 intake, for this reason the report focuses on it separately as well as on the Fast Stream as a whole.
o Government Communication
o Human Resources
o Internal Audit
5. For further information about the different Fast Stream programmes, visit our website.

Civil Service Fast Stream and Fast Track: Annual Report 2015
7
THE FAST STREAM SELECTION PROCESS
6. The Civil Service recruits to the Fast Stream strictly on the basis of fair and open competition and selection on merit, in line with the Civil Service Commissioners’ Recruitment Principles.
7. The Fast Stream and Early Talent team, in partnership with Parity plc managed the development and delivery of the 2015 competition. As always, our priority was to recruit the best talent available to us, while building on past achievements to make Fast Stream recruitment as fair, inclusive and efficient as possible.
8. The Civil Service maintains the highest standards of open and fair recruitment. The Fast Stream selection process is subject to a thorough annual check on compliance with the Civil Service Commissioners’ principles of merit, fairness and openness. We do everything possible to ensure that our assessment methods are scientifically robust, able to identify relevant attributes and are objective and capable of withstanding close scrutiny.
9. We use the latest online selection technology, and seek constantly to develop it and maximise its effectiveness. We aim to complete the selection process in the shortest possible time, and to make job offers to the best candidates as quickly as possible. By ensuring that key stages are online, we achieve greater transparency and objectivity, while allowing candidates to drive themselves through each stage of the process using a personalised management support system. We are constrained in getting all job offers out as quickly as we would like by our strict application of merit, which means that we gradually finalise
pass marks to ensure that we still have places remaining at the end of the recruitment year for high scoring candidates who we see late in the schedule. We have maintained this approach for 2016 but are exploring different ways of doing this for 2017 to respond to the need to get offers out quicker.
10. The selection process in 2015 consisted of the following stages:
Registration on Fast Stream website
Online self-assessment
Application and online tests
Online in-tray exercise (the “e-Tray”)
Fast Stream Assessment Centre.
11. The Economist, Statistician, Social Research and Operational Research Fast Streams also test professional aptitude in a separate assessment centre. Individuals entering any Fast Stream option have to pass the generic Fast Stream Assessment Centre.
12. Some Fast Stream options apply a final selection procedure after the assessment centre before deciding who to recommend for appointment. However, all candidates who achieve the pass mark at the assessment centre have reached the required standard, and are guaranteed a place in the Corporate Fast Stream if they have expressed it as one of their preferences at the application stage.
13. Candidates are ranked in order of merit, based on a final mark awarded at the assessment centre. All candidates receive detailed feedback on their

Civil Service Fast Stream and Fast Track: Annual Report 2015
8
performance at the assessment centre in the form of a development report.
14. The Bridge Report made important recommendations about how the Fast Stream recruitment process could be refined to ensure we attract candidates from lower socio-economic backgrounds. We have already begun the work to deliver these recommendations, to ensure that the Fast Stream is made up of the best and brightest graduates from all sectors of society.
CASE STUDY – CALLUM STAFF
OPERATIONAL RESEARCH ANALYST, FOOD STANDARDS AGENCY
“I joined the Civil Service straight from university in September 2014, having graduated with a Masters in Civil Engineering from University College London that summer. I’m coming to the end of my second posting on the Operational Research Fast Stream: both postings have been at the Food Standards Agency
The role of an operational researcher is a broad one. We support policy and delivery colleagues through modelling the options they can choose and decisions they can make in order for them to make the most informed decision possible. The methods we use range from massive mathematical models to helping to shape people’s
approaching through mapping systems. The breadth of work I’ve been able to be involved in is varied from helping to map out the impact scientific research has on policy areas to designing a model to predict rises in the foodborne disease Norovirus by using Tweets about feeling sick.
The Civil Service Operational Research Fast Stream fitted my two real passions in a job. I use the mathematical, scientific and engineering skills and knowledge from my Civil Engineering degree. I also work in a role where decisions have the potential to profoundly benefit people’s lives. I can’t think of another area of work where as someone straight out of university, I would have had both the exposure to opportunities and the responsibility as I have on the Fast Stream.
I am moving to the Department for Education soon, where I am looking forward to applying my developed knowledge from the Food Standards Agency in a far larger department. Once I feel ready to come off the Fast Stream and apply for managerial positions, I hope I will have developed both my skills as an analyst, but also possess strong communication, leadership and decision-making skills – I would love to become a leader in the Civil Service and I think an analyst who is a strong communicator is a valuable contributor to any team. However, wherever I end up I don’t want to lose the feeling I get at the
moment when I very occasionally get a quiet moment to stop, and grin, and think ‘this is a huge project, and I helped shape that’.”

Civil Service Fast Stream and Fast Track: Annual Report 2015
9
CASE STUDY – SHERENE CAESAR-JOHNSON
STRATEGIC RESOURCING CONSULTANT, HM REVENUE AND CUSTOMS
“I joined the Corporate Generalist Fast Stream Programme three years ago. I am based in the North West, currently working for HMRC in Salford as a Strategic Resourcing Consultant. I am leading work to understand the impact HMRC’s £1.3 billion change programme is likely to have on the workforce over the next five years. My work is focused on impacting changes to the size, shape (grade-mix and diversity), skills, professions and location of the workforce. I identify when these changes will happen and if there are any additional cost implications. I am really enjoying this role as it is dynamic and challenging, whilst providing me with skills that will be invaluable in the future.
Prior to joining the Fast Stream, I worked for the Department for Education for almost three years. During this time I participated in the Civil Service Local (North West) Academy for Leaders of the Future and this provided me with the opportunity to push myself outside of my comfort zone and to work with colleagues from a range of departments. It was this experience that inspired me to think seriously about my development and motivated me to apply for the Fast Stream as an ‘In-Service’ candidate.
Over the past three years, I have had the opportunity to work in variety of roles, none of which I would have chosen for myself but all of which have given me the opportunity to stretch myself, learn new skills and meet new people. Each has come with its challenges but I have been given a good level of autonomy and been empowered to make effective decisions within supportive working environments. I have been able to offer a different perspective and in many cases this has helped to shape the direction of work.
The Fast Stream has accelerated my development and I feel like a more resilient, well-rounded Civil Servant as a result of it.”
THE FAST STREAM INTERNSHIP PROGRAMMES
15. The Fast Stream offers two internship programmes that are exclusively for students from under-represented groups. These schemes are central to our commitment to make the Civil Service a more diverse place, offering people from diverse backgrounds insight into the career opportunities available in Government.
16. The Summer Diversity Internship Programme (SDIP) is a multi-award winning, paid internship scheme that puts talented undergraduates and graduates on a six to nine week work placement in a government department over the summer.
17. 310 students were offered a place on the SDIP programme in 2015. Many also undertook a follow-on coaching programme to support them with their applications to the Fast Stream. Approximately 70% of the 2015 SDIP cohort applied for Fast Stream.
18. The Early Diversity Internship Programme (EDIP) provides talented first year undergraduates from black and

Civil Service Fast Stream and Fast Track: Annual Report 2015
10
minority ethnic and/or disadvantaged social backgrounds a one-week placement in a government environment. Successful applicants partake in network sessions, skills workshops and shadow Fast Streamers as they work.
19. The EDIP programme took place for the first time in 2015, with 82 students taking part and many taking an interest in applying for the SDIP and then the Fast Stream.
20. For further information about the internship programmes, visit our website.
THE INTERNSHIP SELECTION PROCESS
21. The SDIP and EDIP selection processes are fair, objective and efficient, consisting of the following stages:
Online tests (verbal, numerical, a situational judgement questionnaire and competency-based multiple choice questionnaire)
Online application form used to shortlist candidates
Telephone interview against competency and motivational areas
CASE STUDY – SHANNON TURNER
SUMMER DIVERSITY INTERN, HM
REVENUE AND CUSTOMS
“I was drawn to the Summer Diversity Internship Programme because it offered far more responsibility and diversity of experience than I’d seen anywhere else. I was interested in the public sector but wasn’t sure what a career there would actually entail. I still had a year left at university and I wanted an internship that could help me decide what I wanted to do when I graduated.
During my internship at HM Revenue and Customs, I got to contribute to tax policy, project manage a new venture and deliver a presentation to the Senior Management Team. The SDIP was completely accommodating of my needs; for example by finding me a placement in Edinburgh so I didn’t have to move. It also allowed me to shape my internship in line with my
interests, so I had a truly unique, tailored experience. The SDIP proved to me that the Civil Service had exactly the kind of work, people and values that I wanted in an employer. By the time I’d completed my nine weeks in a government department, I knew without any doubt that I wanted to join the Fast Stream.
The SDIP gave me the support, information and confidence I needed to apply to the Fast Stream. Most importantly, the SDIP gave me a true insight into what the Fast Stream
Civil Service Fast Stream and Fast Track: Annual Report 2015
11
involved and a real passion for that job, which shone through at my Assessment Centre. I’m now about to join the Diplomatic Service Fast Stream in the Foreign & Commonwealth Office, which is a dream come true. The Fast Stream has been a fantastic employer so far and I can’t wait to see where it takes me next.”
THE 2015 CIVIL SERVICE FAST TRACK APPRENTICESHIP SCHEME OPTIONS
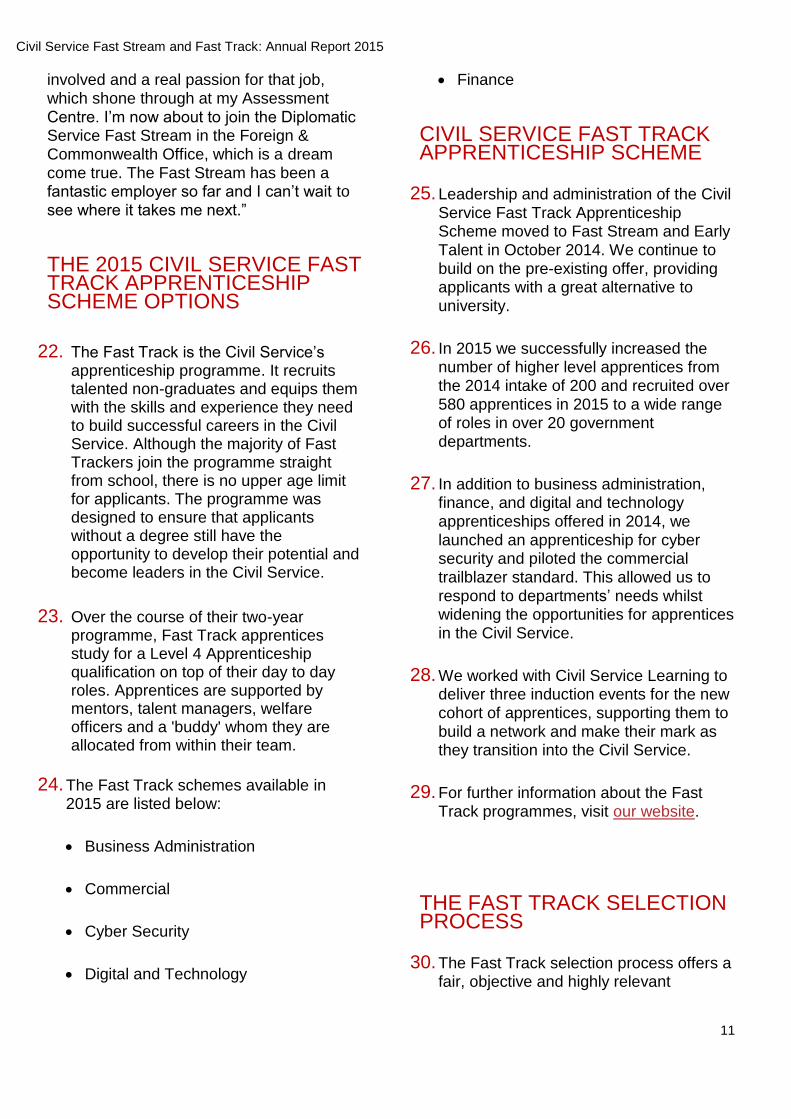
22. The Fast Track is the Civil Service’s apprenticeship programme. It recruits talented non-graduates and equips them with the skills and experience they need to build successful careers in the Civil Service. Although the majority of Fast Trackers join the programme straight from school, there is no upper age limit for applicants. The programme was designed to ensure that applicants without a degree still have the opportunity to develop their potential and become leaders in the Civil Service.
23. Over the course of their two-year programme, Fast Track apprentices study for a Level 4 Apprenticeship qualification on top of their day to day roles. Apprentices are supported by mentors, talent managers, welfare officers and a 'buddy' whom they are allocated from within their team.
24. The Fast Track schemes available in
2015 are listed below:
Business Administration
Commercial
Cyber Security
Digital and Technology
Finance
CIVIL SERVICE FAST TRACK APPRENTICESHIP SCHEME
25. Leadership and administration of the Civil Service Fast Track Apprenticeship Scheme moved to Fast Stream and Early Talent in October 2014. We continue to build on the pre-existing offer, providing applicants with a great alternative to university.
26. In 2015 we successfully increased the number of higher level apprentices from the 2014 intake of 200 and recruited over 580 apprentices in 2015 to a wide range of roles in over 20 government departments.
27. In addition to business administration, finance, and digital and technology apprenticeships offered in 2014, we launched an apprenticeship for cyber security and piloted the commercial trailblazer standard. This allowed us to respond to departments’ needs whilst widening the opportunities for apprentices in the Civil Service.
28. We worked with Civil Service Learning to deliver three induction events for the new cohort of apprentices, supporting them to build a network and make their mark as they transition into the Civil Service.
29. For further information about the Fast Track programmes, visit our website.
THE FAST TRACK SELECTION PROCESS
30. The Fast Track selection process offers a fair, objective and highly relevant

Civil Service Fast Stream and Fast Track: Annual Report 2015
12
process, consisting of the following stages in 2015:
Online application form
Online tests
Fast Track Assessment centre
CASE STUDY – MOHAMMED AHMED
POLICY ADVISER, DEPARTMENT FOR EDUCATION.
“Before joining the Civil Service as a Fast Track Apprentice, I studied A Levels at college and then began a university course, with the eventual aim of applying to the Fast Stream. I took an interruption from my studies as I felt the course wasn’t right for me. I then came across the Civil Service Fast Track Apprenticeship and made an application, in the hope that I could enter the Civil Service through an alternative route.
I started my apprenticeship working as a Case Manager at the Department for Education in Manchester. I quickly became responsible for managing ministerial and public correspondence and investigating complaints about schools. The challenging role provided me with an insight into the breadth of the Department’s work but also gave me a chance to engage with stakeholders whom our policies affect.
The social impact of any job is important to me. I really wanted to have a career in a diverse organisation whose work makes a difference to the lives of others. I was also attracted to the apprenticeship, as it was an opportunity to work and gain a qualification, as part of a structured development programme. Knowing that career progression would be based solely on merit and capability sealed the deal.
I was impressed at how diversity, inclusion and social mobility are all high on the agenda for senior leaders. I’m from an ethnic minority background and I was on free school meals at an underperforming comprehensive school so I’m acutely aware of the barriers disadvantaged young people can face in life. To ensure these words are matched with action, I recently signed up to a mentoring scheme which matches civil servants to pupils at a school with high levels of disadvantaged children. I want to use this opportunity to help spread the message to other talented young people that there could be a career ahead for them in the Civil Service.
Within three months of completing my apprenticeship, I was recently promoted to a Policy Adviser role along with four out of five apprentices in my team. I now wish to remain in the Civil Service so I can continue to develop my policy-making and leadership skills, perhaps in other departments.”
CIVIL SERVICE SCHOOLS OUTREACH PROGRAMMES
31. The Schools and Colleges Outreach Programmes were established in September 2015. They work to broaden horizons and increase representation of individuals from lower socio-economic status backgrounds in the Civil Service. Key programme objectives support the Government’s Diversity and Inclusion Agenda and the Civil Service

Civil Service Fast Stream and Fast Track: Annual Report 2015
13
Social Mobility plan as set out in the Talent Action Plan 2016. We aim to ensure that no one should be prevented from fulfilling their potential by the circumstances of their birth.
32. The Bridge report recognised that outreach is “key to breaking down stereotypes, associations and pre-conceptions as to the type of individual who works in the Civil Service, and in particular the type of individual the Fast Stream programme is looking for”. It
noted that currently this work was not translating into a truly representative Fast Stream. We are currently exploring the best way to enhance and strengthen our programmes to better deliver this ambition.
33. There are three Schools and Colleges programmes:
The Schools Mentoring Programme - The aim of the schools mentoring programme is to raise awareness of the Civil Service amongst pupils from a lower socio-economic background. Three mentors at different points in their career are assigned to each school and they mentor six students between them. The mentors aim to provide broad employability skills, raise aspirations and improve confidence for the selected mentees. The programme is in its pilot year and
is presently working with 24 schools and 144 mentees, in Manchester, Leicester, Wolverhampton, Kent and North and South London.
The Work Experience Programme offers an opportunity for participants to consider the Civil Service as a future employer of choice. 16-18 year old students from disadvantaged backgrounds complete a one to three week placement that provides an insight into working in a government
department. In 2015, Fast Stream and Early Talent, in partnership with the Social Mobility Foundation, placed 100 students in placements in London and Glasgow (80 in London and 20 in Glasgow).
The Discovery Events Programme provides interactive day long events for school students. The aim is to showcase the diverse Civil Service opportunities on offer to the students from lower socio-economic and
under-represented groups. In 2015, the Fast Stream and Early Talent team delivered five separate events across the country to more than 400 of our youngest target group pupils.
34. In response to the Bridge report we are enhancing these programmes to ensure that they deliver the representative workforce we are committed to:
The Schools and Colleges programme will expand to 200 schools over the course of this Parliament which will lead to around 1,200 mentees by summer 2020. A public commitment to this was made by the Minister for the Cabinet Office in the Talent Action Plan 2016.
In 2016 the Work Experience programme will double the number of participants from last year and will offer 200 places to target students around the UK to further increase the numbers of placements outside London. The opportunities will have more flexibility and will be between one to three weeks during the summer. They will no longer be residential in order to achieve the broader reach of towns and cities.
The Discovery Events Programme will also expand by increasing the audience size to at least 500 in 2016.
Civil Service Fast Stream and Fast Track: Annual Report 2015
14
OUTREACH ACTIVITY 35. Marketing activity forms an integral part
of the Fast Stream and Fast Track recruitment process. In 2015, we doubled outreach events by expanding the range of locations where we held events. This approach allowed us to target a broader audience compared to previous outreach events; locations were selected on the basis of evidence
and data on: diversity demographics, academic performance and historical data on success rates. Although universities historically remain our main source of recruitment for Fast Stream, we collaborated with Senior Civil Servants and continued to build partnerships to facilitate sessions with universities, business schools and professional bodies. These included Q&A panels, presentations, networking events, drop-in sessions and skills sessions.
36. We also sustained our work with universities' online platforms and social media. The programme of engagement included more than 125 events and 31 universities from the 1st of September to the 30th of November - our recruitment window for the Fast Stream. We worked hard to also arrange events in a wider range of venues such as job fairs and graduate career events.
37. The reach of our official Fast Stream Facebook page continues to be effective as it connects potential candidates with current Fast Streamers. We have existing Fast Streamers from all of the schemes on hand to answer questions in real time on each working day of the month. These Fast Streamers personally encourage, advise and support prospective applicants through the different phases and give insight into
the day-to-day work and development they are undertaking.
38. Our use of social media has resulted in a higher number of clicks through to our Gov.uk recruitment page through both Twitter and Facebook. Our Facebook page had an increase of 235% more clicks through to Gov.uk, and our Twitter posts had an increase of 57% of clicks through to Gov.uk compared with 2014.
39. Furthermore, this year marketing for the
Fast Track involved a series of social media campaigns as well as outreach events held at local colleges and schools. Marketing through social media has proven popular, and for 2016 we have extended this to Snapchat to provide an insight into a day in the life of different Fast Track Apprentices. See our Fast Track Facebook page.
THE FAST STREAM IN 2015 – A SNAPSHOT
40. On 31st March 2015, there were 2,298 Fast Streamers in total, accounting for 0.53% of the Civil Service.
41. Of this total, 48.5% were female, 12.6% were from an ethnic minority and 10.9% were disabled.
42. About 36% of Fast Streamers were occupying policy posts. Half were in the largest programme, the Generalist Fast Stream.
43. The largest employers of Fast Streamers were, in the following order, the Foreign and Commonwealth Office, the Department for Work and Pensions, the Department for Business, Innovation and Skills, HM Revenue and Customs, the Home Office and the Ministry of
.usticeJ

Civil Service Fast Stream and Fast Track: Annual Report 2015
15
44. The percentage of Fast Streamers leaving the Fast Stream in the year ending 31 March 2015 was 6.7%. The figure for those leaving the Civil Service all together was 4.1%.
THE CORPORATE FAST STREAM
45. The Corporate Fast Stream scheme develops core skills and exposes participants to a broad range of work across the Civil Service through postings across different functions, departments and regions, as well as secondments. The following Fast Streams are currently part of the centrally managed model: Generalist, European, Digital and Technology, Government Communications, Science and Engineering, Internal Audit, Finance and Commercial (and Statisticians and Project Delivery will be joining from the 2016 intake).
46. In 2015 we successfully organised more than 1,300 placements for fast streamers in challenging and satisfying roles in government departments and across the private, public and charitable sectors.
47. We also invested heavily in the second residential induction for the Corporate Fast Stream. We developed a four day experiential induction event, using technology and gamification to support practical learning on areas such as personal impact and communication skills. This was underpinned by a programme of pre-learning content about the Civil Service which was debated and discussed at the event with experts and senior leaders. New entrants were able to settle into their departments very quickly with a foundation of understanding in the Civil
Service. The induction programme won the AGR Best Induction award at the beginning of 2016.
48. We are continuing to offer four specialist options to Corporate Generalist Fast Streamers who would prefer to specialise in a particular field whilst completing the programme: the No.10/Economic and Domestic Affairs Secretariat, Security and Defence, International and Finance options. These popular options are available to Generalists after joining the Corporate Fast Stream and after successfully completing a highly competitive selection process.
49. In response to Fast Streamer feedback, we have taken action to improve how we communicate and as part of this we launched a digital platform for all centrally managed Fast Streamers in October 2015, following a successful initial pilot in spring 2015. At present over 750 Fast Streamers use the platform to communicate and collaborate both within the Fast Stream and with the wider digital community.
50. This year, in close collaboration with government functional heads, we launched four new schemes, to allow Fast Streamers to specialise in the Finance, Internal Audit, Commercial and Government Communication professions as well as launching a re-modelled version of the Science and Engineering scheme. The new schemes allow for a centrally managed model offering the leadership development whilst at the same time developing the technical skills required by the relevant profession for their future senior leaders.

Civil Service Fast Stream and Fast Track: Annual Report 2015
16
CASE STUDY – CAMILLA THOMPSELL
POLICY AND PROJECT MANAGER, DEPARTMENT FOR INTERNATIONAL DEVELOPMENT.
"I joined the Generalist Fast Stream having studied geography at Queen’s University Belfast. Following university, I wasn’t certain what to do next but I knew I wanted to make a difference and give back to society. Whilst I didn’t know much at all about the Civil Service when I joined, the Fast Stream appealed to me because it offered the chance to develop many different skills and experience a range of opportunities across government departments.
Since joining the Fast Stream, I’ve worked on early years policy and launched a public consultation in Ofsted; led policy input into a £160 million tender exercise for the Fit For Work service at the Department for Work and Pensions; worked on international trade
facilitation and negotiations at the Department for Environment, Food and Rural Affairs; and moved up to Newcastle on secondment to work as an Operational Services Manager for Northumbria NHS Trust.
I’m now in my first year long placement on the international in-scheme option on the generalist scheme. I am working in the Department for International Development’s North Africa team. Here I’m managing the Arab Women’s Enterprise Fund, a
programme to promote women’s economic empowerment; working with colleagues across Government on Egypt’s Conflict Security and Stability Fund; and helping to develop a new approach for the North Africa region as a whole.
The scheme is hugely developmental and I’ve been amazed at just how stretching my placements have been. The breadth of roles that I’ve got to experience - including in areas and subjects that I’d never imagined - have helped to shape my career plans and develop a wide range of skills.
My journey on the Fast Stream has been incredibly rewarding and challenging and has left an indelible impression on me. One of the best things about the Fast Stream is that you’re given huge amounts of responsibility from the off-set and provided the opportunity to take decisions and shape projects and policies which really matter. You are given a real opportunity to make a difference. When I reflect on the projects I’ve been involved in, it has been amazing to see what a real impact our work has on people and how much people care about what we do. "

Civil Service Fast Stream and Fast Track: Annual Report 2015
17
CASE STUDY – JOHN STEWART
COMMERCIAL ADVISOR, DEPARTMENT OF HEALTH
“Prior to joining the Civil Service Fast Stream I studied Management Sciences at Loughborough University, gaining my place on the scheme directly after graduation. Having studied a business degree, I felt it a natural step to apply for a commercial scheme, and having researched how highly regarded the Fast Stream was, it was a simple decision to apply. Coupling the prestige of the scheme, with the opportunity to increase my employability through the undertaking of professional qualifications – paid for by the Civil Service – it seemed a perfect fit for me. Although I studied a business degree, a vast number of people on the Commercial Stream I know didn’t, and they are at no disadvantage because of
that.
I am currently five months into my first posting with the Department of Health, in the Corporate Advisory team. The key selling point for me about the type of work I have been doing, and what I will do in the future, is how extremely interesting it is. The variety and highly sensitive nature of the work means that every day is different and I find myself in very surreal situations – working on high priority projects and meeting very senior people. A key worry of most is that
they will not be invested in and valued for the skills that they possess; I can categorically say that the Fast Stream as a whole is very good at making sure that each individual is challenged and valued. You hit the ground running and your opinion is taken into account in all decisions.
The Commercial Fast Stream is a diverse environment; you may find yourself in a procurement role, or you may be in the wider commercial environment like myself, having meetings with numerous private sector partners. In the future I hope to gain promotion and continue to work in the wider commercial environment.”
LOOKING AHEAD New Fast Stream programmes
51. 2016 saw the launch of our new Project Delivery Fast Stream which will build Project Delivery capability within the Civil Service. The scheme will give participants experience in the wide variety of projects handled by the Civil Service. These range from infrastructure projects, such as delivering new roads, railways, schools and hospitals, to digital transformation programmes that will permanently change the way people connect with government.
52. From the 2016 intake the Finance and Internal Audit Fast Stream schemes will be merged into one scheme, the Finance Fast Stream. The decision to merge the two schemes was taken in recognition of the fact that Government Finance and Internal Audit functions are intrinsically linked. Making this change will provide greater clarity to prospective candidates in order to attract higher candidate numbers and provide an opportunity for greater collaboration between the Government Finance and Internal Audit functions.

Civil Service Fast Stream and Fast Track: Annual Report 2015
18
Growing the centrally managed model
53. The Government Statisticians Fast Stream is transferring to the central management model in Fast Stream and Early Talent from September 2016. This will allow for a central model to ensure the learning and development offer is consistent across postings. We hope that this will attract more graduates who see themselves working in this profession in the future. The key benefit of this will be to allow Statistician Fast Streamers to have a cross-departmental experience applying their professional statistical knowledge in varied and fast paced roles.
54. We are continuously reviewing and measuring the success of the new Corporate Fast Stream scheme. Two years into this scheme we have found widespread satisfaction, with line managers of Corporate Fast Streamers reporting that they are impressed by the high calibre.
55. The end of scheme assessment for the
Corporate Fast Stream scheme is also being developed in order to assess Fast Streamers as widely deployable future leaders ready to undertake their first Grade 7 postings. Fast Streamers who successfully complete the end of scheme assessment will formally
graduate from the Fast Stream programme and a Fast Stream Graduation Ceremony will mark the end of their time on the programme
Progressing the Bridge Report recommendations
56. Following a competitive tendering process the Cabinet Office invited the Bridge Group to carry out social mobility research on the Fast Stream scheme in 2015. This research was undertaken
over the autumn to understand the factors behind the socio-economic patterning in the Fast Stream and why applicants from lower socio-economic backgrounds are less likely to apply and, are less likely to succeed. The research provided insight for the wider civil service and evidence to build on and make recommendations to improve socio-economic diversity.
57. We have welcomed this constructive assessment of our performance on diversity and continue to be committed to making the Fast Stream more representative. The Fast Stream and Early Talent Team has developed an action plan in response to the report which we are now taking forward.
58. Key recommendations of the report include to:
Introduce a new, enhanced approach to measuring and monitoring socio-economic diversity.
Establish clearer accountability for socio-economic diversity in the Fast Stream.
Mobilise the Fast Stream workforce to be involved in attraction activities, driven by support from senior leaders.
Deliver more curriculum-based interactions with universities, and engage actively with widening participation teams.
Introduce enhanced data insights for:
Targeting universities;
Evaluating the impact of outreach activity;

Civil Service Fast Stream and Fast Track: Annual Report 2015
19
Iterative use of live recruitment data to inform attraction strategies.
Increase the availability and visibility of key messages that will support lower socio-economic applications.
Establish a route to fast tracking lower socio-economic successful participants on summer diversity internship programme, through to the final stage Fast Stream assessment centre.
Undertake further research to understand why there is a high drop-out rate at the registration stage among candidates from under-represented groups.
Develop resources and outreach modules that can be delivered remotely by teachers, and Fast Streamers, in schools and colleges.
Deliver a critical review of the way in which the Fast Stream defines and identifies ‘talent’, working towards more inclusive methods of identifying potential that have a clearer link to the strengths required to perform in the job.
59. For further information regarding the findings, please see the Bridge Report.
Civil Service Fast Track Apprenticeship Expansion
60. The Civil Service Fast Track Apprenticeship scheme will be expanding to recruit 750 apprentices in 2016, to help meet the Government commitment to increase the number of quality apprenticeships across England. When expanding, we will continue to build on the existing offering, providing
applicants with a great alternative to university. We will be using a new Fast Track page on GOV.UK to direct future applicants to a redesigned application portal.
61. The Fast Track scheme is also undergoing a strategic review to shape the programme from 2017 to 2020. This will seek to ensure that the scheme continues to offer a high quality apprenticeship, that we are meeting the needs of departments and professions and that we are aligned to the wider Civil Service apprenticeship and talent agendas.
FAST STREAM RECRUITMENT IN 2015 – HEADLINE FIGURES Applications
62. The number of registrations (i.e. initial
expressions of interest, prior to taking the online tests) on the Fast Stream website fell by 1.8% (from 38,908 to 38,175).
63. However, the number of applications
(we define an applicant as someone who takes the online tests, which is the first sift stage) increased from 20,072 in 2014 to 21,135 in 2015.
64. Chart 1 shows the number of
applications submitted to the Fast Stream each year since 1998. The fall in 2004 reflects the introduction of online self-assessment to discourage unrealistic applications.
Diversity
65. The role of the Civil Service is to serve the government of the day and we must have the best people to provide the best possible service. A longstanding

Civil Service Fast Stream and Fast Track: Annual Report 2015
20
core principle of the Civil Service is that recruitment must be based on merit, regardless of background. However, the Fast Stream needs to ensure that the best candidates from diverse backgrounds are attracted to join the scheme. The refreshed Talent Action Plan published on 24 March this year outlines how to widen access to talent schemes in the Civil Service for under-represented groups.
66. Talent Action Plan 2016 stated that the Government will accept the Bridge Group recommendations for the Fast Stream. The Fast Stream team has developed an action plan to take forward initiatives flowing from the recommendations in the Bridge Group Report. These actions are being taken forward as apart of the wider set of actions in the Talent Action Plan 2016 to increase social mobility in the civil service.
67. The 2015 approach for reporting diversity representation is the same as in 2014. Figures are calculated as a percentage of those that declared their status.
68. Tables showing the diversity of the Fast
Stream intake every year since 1998 are in the main statistical analysis at the end of this report. The following are headline figures from the 2015 competition, including comparisons with 2014 using the new methodology.
(i) Gender
69. In 2015 the proportion of applications from females remained roughly the same (48.1% in 2015 and 48.3% in 2014). Although this proportion was comparable, the number of applications from females increased from 9,600 to 10,055, a 4.7% increase.
70. The proportion of successful female applicants increased from 48.0% to 49.6%. The success rate for females was slightly higher than males at 4.7% compared to 4.4%. In 2014 the pattern was reversed in that the success rate of males was slightly higher than the success rate of females.
71. In line with previous data, the
application and appointment proportions by gender vary across the different schemes. In the Statistics, Social
Research, Government Communications, HR, and European schemes the majority of applications came from females. Whereas applicants from males were in the majority for the Generalist, Economist, Operational Research, Digital and Technology, Commercial, Finance, Internal Audit, and Northern Ireland schemes.
(ii) Ethnicity
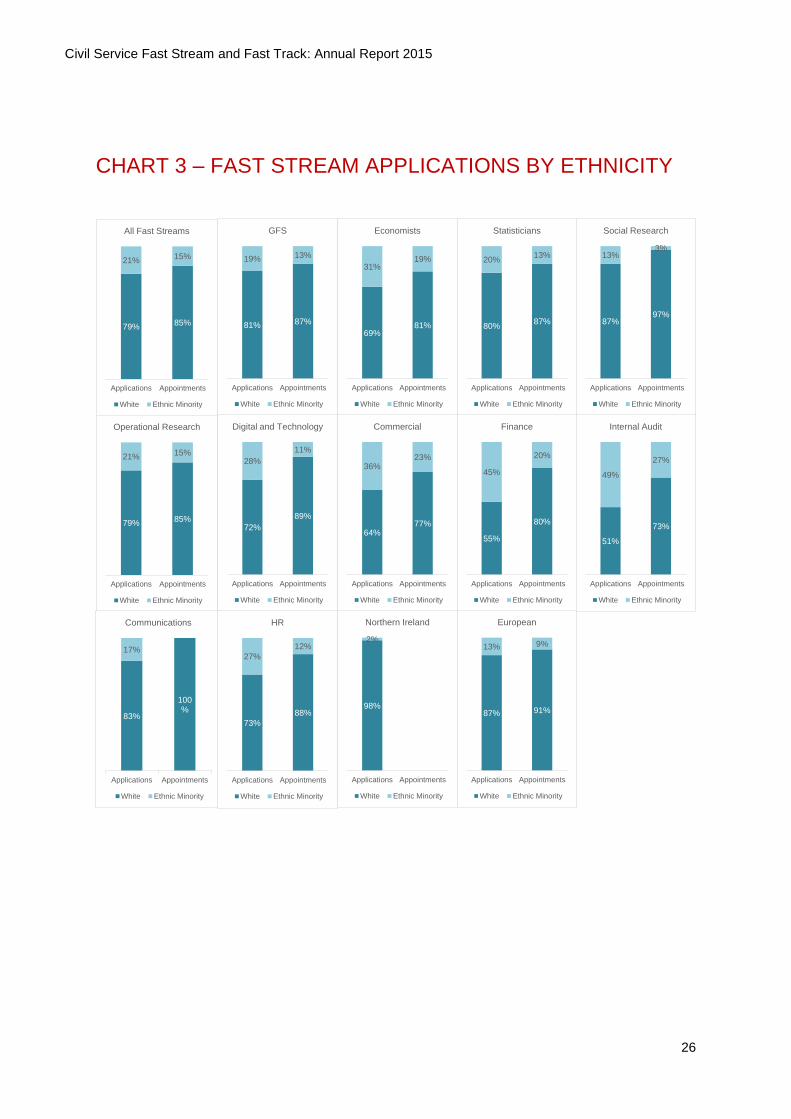
72. In 2015 the proportion of applicants from ethnic minority groups increased to 20.6% from 19.4%. Similarly, the proportion of successful applications from ethnic minority groups rose slightly to 14.6% from 14.2% in 2014. This is the highest ever proportion of successful applicants from ethnic minority groups –137 candidates – compared to 127 in 2014.
73. However, the success rate of ethnic
minority applicants fell slightly to 3.2% from 3.3%. This compares to a success rate of 4.9% for white applicants. The Internal Audit Fast Stream received the highest proportion of ethnic minority applicants at 49.1%. Percentages appointed varied across schemes as shown in Chart 3.

Civil Service Fast Stream and Fast Track: Annual Report 2015
21
(iii) Disability
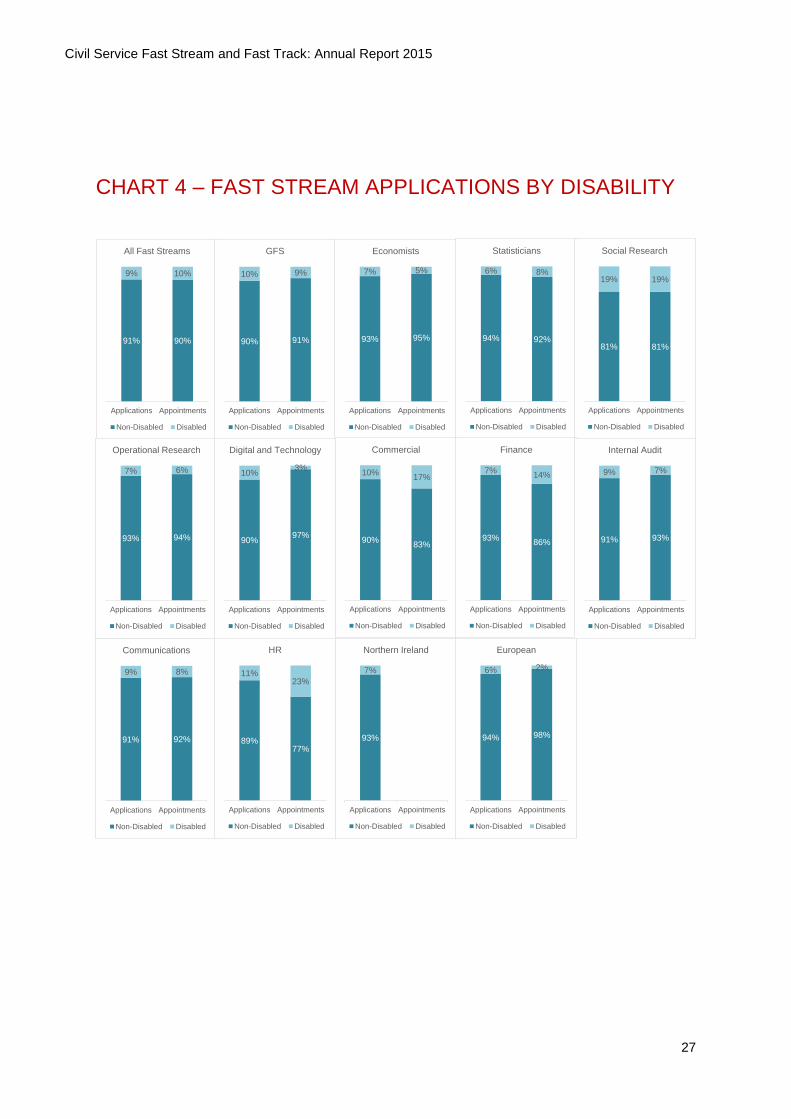
74. The proportion of applicants with a disability increased to 9.4% from 8.5%. The number of applicants with a disability rose from 1,661 to 1,949, an increase of 17.3%. The proportion of successful applicants with a disability fell very slightly to 9.6%, from 9.8% in 2014. See Chart 4. Adjustments were made for all candidates who requested them.
75. The success rate of disabled applicants fell from 5.2% in 2014 to 4.6% in 2015. This compares to a success rate of 4.5% for non-disabled applicants, which remained static between 2014 and 2015.
(iv) Socio-economic background
76. Monitoring of the socio-economic background of applicants to the Fast Stream began in 2011. The occupational background of applicants’ parents was used as the main basis of measurement – however other metrics were also collected.
77. In 2015, the proportion of applicants
from the routine and manual occupation background fell slightly to 7.9% from 8.1% in 2014. The proportion of successful applicants from the group was 4.4%, the same as 2014.
78. In respect to other socio-economic
measures, in 2015 40.2% of applications came from applicants whose parents were educated to below degree level. Of successful applications, 29.1% came from applicants whose parents were educated to below degree level.
79. The success rate for applicants whose parents were educated to below degree level was 3.4% compared to 5.6% amongst those who had at least one parent with a degree.
80. 65.7% of successful applicants were
educated in state schools, compared to 65% in 2014. A total of 25.2% were educated in independent schools, compared to 22% in 2014. The remainder were either educated abroad or declined to provide the information.
81. 13.3% of applicants and 8.6% of
successful applicants had at some point been eligible for free school meals. This is a success rate of 3.0% compared to 4.9% of those that had never been eligible for free school meals.
(v) Sexual orientation
82. Monitoring of the sexual orientation of applications began in 2014. In 2015 the proportion of applications from lesbian/gay/bisexual (LGB) applicants increased to 6.9% from 6.0%. The proportion of successful LGB applicants fell slightly from 8.5% to 7.8%.
83. The success rate for LGB applicants fell
to 5.1% from 6.3% in 2014. This compares to 4.4% for heterosexual/straight applicants.
(vi) Academic background
84. Applications from Oxford and Cambridge Universities remained generally static at 9.1%, compared to 9.2% last year. The proportion of successful applicants from those Universities fell to 20.1% from 21.0%. This represents the lowest proportion of successful applicants from Oxford or
Civil Service Fast Stream and Fast Track: Annual Report 2015
22
Cambridge universities since the Fast Stream started to collect data on this metric.
85. Amongst successful applicants the most
common degree disciplines were humanities (23.4%), economics (20.5%) and social sciences (20.4%).
Summer Diversity Internship Programme
86. The proportion of applications from ethnic minority groups fell to 76.8% from
94.1% in 2014. The proportion of successful applications from ethnic minority groups was 75.6%, a fall from 91%. Nevertheless, the number of ethnic minority interns appointed was the highest ever, at 233, up from 172 in 2014.
87. The proportion of applicants from a
routine or manual occupational background fell to 19.9%, from 26.7% in 2014. The proportion of successful applicants from this group was 13.2%.
88. Overall, 18.4% of applicants were
disabled. Of those that were successful, 22.9% were disabled. This represents a success rate of 29.4% for disabled applicants compared to 22.2% for non-disabled applicants.
Early Diversity Internship Programme
89. For the first time the Annual Report is able to report data from the Early Diversity Internship Programme, which launched in 2015. The proportion of applications received from ethnic minority groups was 79.4%. The proportion of successful applicants from this group was slightly lower at 76.8%.
90. 22.7% of applicants came from a routine
& manual occupations background. The
proportion of successful applications from this group was 23.5%.
91. Overall, 4.7% of applicants were
disabled. Of those that were successful 6.1% were disabled. The success rate for disabled applicants was 100% compared to 75.5% for non-disabled applicants.

Civil Service Fast Stream and Fast Track: Annual Report 2015
23
CIVIL SERVICE FAST TRACK APPRENTICESHIP SCHEME RECRUITMENT IN 2015 – HEADLINE FIGURES
92. For the first time the Annual Report includes information on the Fast Track apprenticeship recruitment scheme.
Applications
93. In 2015 5,793 applications were received for the Fast Track, an increase from 2,947 in 2015. In total 684 applicants were recommended for appointment, this represents an overall success rate of 11.8%. In 2014 204 appointments were made, a success rate of 6.9%
(i) Gender
94. In 2015 39.7% of applicants for the Fast Track were females, a decrease from 46.8% in 2014.
95. Females accounted for 40.6% of those recommended for appointment, which is a decrease from 45.5% in 2014. The female success rate was 12.1%, compared to 11.7% for men.
(ii) Ethnicity
96. 19.4% of applicants to the Fast Track came from ethnic minority groups. This is identical to the proportion of ethnic minority applicants in 2014. Ethnic minority groups accounted for 14.3% of successful applicants, and this was also an increase on last year. The success rate for ethnic minority applicants was 8.8%, compared to 12.6% for white applicants.
1 Due to difference in how data was collected it is not possible to produce figures for the Fast Track that are comparable to the Fast Stream for sexual orientation.
(iii) Disability
97. In 2015, 3.6% of applicants to the Fast Track were disabled, a slight increase on 2.3% last year. The proportion of successful applicants with a disability was 2.8%, a slight decrease from 3.5% in 2014. The success rate for disabled applicants was 9.1%, compared to 12.0% for non-disabled applicants.
(iv) Socio-economic background
98. In 2015, 21.7% of applicants came from Routine-Manual occupational backgrounds. The proportion of successful applicants from this group was 18.2%.
99. 95.1% of successful applicants were
educated in state schools. This is a success rate of 12.1%, compared to an overall success rate of 11.8%.
100. 21.7% of applicants had at some point been eligible for free school meals. Of successful applicants, 17.2% had at some point been eligible for free school meals The success rate was 9.3%, compared to 12.5% among those who were never eligible for free school meals.
(v) LGBT1
101. In 2015 4.2% of applicants were lesbian/gay/bisexual/transgender (LGBT). The proportion of successful applicants who were LGBT was 4.6%. The success rate for LGBT applicants was 12.9%, compared to 11.8% for heterosexual/straight applicants.
Instead, data is presented in terms of LGBT status. In 2016, comparable data will be reported.

Civil Service Fast Stream and Fast Track: Annual Report 2015
24
CHART 1 – APPLICATIONS TO THE FAST STREAM
9,0
37
9,8
14
14
,40
9
11
,77
7
14
,32
8
20
,03
2
8,5
98
12
,95
7
13
,94
5
13
,61
9
14
,49
4
14
,91
1
21
,76
1
18
,36
1
21
,54
2
17
,96
6
20
,07
2
21
,13
5
Applications to the Fast Stream (excluding In-Service Streams ) 1998-2015

Civil Service Fast Stream and Fast Track: Annual Report 2015
25
CHART 2 – FAST STREAM APPLICATIONS BY GENDER
52% 50%
48% 50%
Applications Appointments
All Fast Streams
Male Female
54%47%
46%53%
Applications Appointments
GFS
Male Female
67% 65%
33% 35%
Applications Appointments
Economists
Male Female
48%38%
52%62%
Applications Appointments
Social Research
Male Female
39% 33%
61% 67%
Applications Appointments
Communications
Male Female
33%25%
67%75%
Applications Appointments
HR
Male Female
62% 56%
38% 44%
Applications Appointments
Operational Research
Male Female
64% 60%
36% 40%
Applications Appointments
Internal Audit
Male Female
50%37%
50%63%
Applications Appointments
Statisticians
Male Female
69% 66%
31% 34%
Applications Appointments
Digital and Technology
Male Female
63% 68%
37% 32%
Applications Appointments
Commercial
Male Female
61%47%
39%53%
Applications Appointments
Finance
Male Female
48%
52%
Applications Appointments
Northern Ireland
Male Female
42% 42%
58% 58%
Applications Appointments
European
Male Female
Civil Service Fast Stream and Fast Track: Annual Report 2015
26
CHART 3 – FAST STREAM APPLICATIONS BY ETHNICITY
79%85%
21%15%
Applications Appointments
All Fast Streams
White Ethnic Minority
81% 87%
19% 13%
Applications Appointments
GFS
White Ethnic Minority
69%81%
31%19%
Applications Appointments
Economists
White Ethnic Minority
80%87%
20%13%
Applications Appointments
Statisticians
White Ethnic Minority
87%97%
13%3%
Applications Appointments
Social Research
White Ethnic Minority
79% 85%
21% 15%
Applications Appointments
Operational Research
White Ethnic Minority
72%
89%
28%
11%
Applications Appointments
Digital and Technology
White Ethnic Minority
64%77%
36%23%
Applications Appointments
Commercial
White Ethnic Minority
55%
80%
45%
20%
Applications Appointments
Finance
White Ethnic Minority
83%
100%
17%
Applications Appointments
Communications
White Ethnic Minority
73%
88%
27%
12%
Applications Appointments
HR
White Ethnic Minority
98%
2%
Applications Appointments
Northern Ireland
White Ethnic Minority
51%
73%
49%
27%
Applications Appointments
Internal Audit
White Ethnic Minority
87% 91%
13% 9%
Applications Appointments
European
White Ethnic Minority
Civil Service Fast Stream and Fast Track: Annual Report 2015
27
CHART 4 – FAST STREAM APPLICATIONS BY DISABILITY
91% 90%
9% 10%
Applications Appointments
All Fast Streams
Non-Disabled Disabled
90% 91%
10% 9%
Applications Appointments
GFS
Non-Disabled Disabled
93% 94%
7% 6%
Applications Appointments
Operational Research
Non-Disabled Disabled
91% 92%
9% 8%
Applications Appointments
Communications
Non-Disabled Disabled
93% 95%
7% 5%
Applications Appointments
Economists
Non-Disabled Disabled
94% 92%
6% 8%
Applications Appointments
Statisticians
Non-Disabled Disabled
81% 81%
19% 19%
Applications Appointments
Social Research
Non-Disabled Disabled
90%97%
10%3%
Applications Appointments
Digital and Technology
Non-Disabled Disabled
90%83%
10%17%
Applications Appointments
Commercial
Non-Disabled Disabled
93%86%
7%14%
Applications Appointments
Finance
Non-Disabled Disabled
91% 93%
9% 7%
Applications Appointments
Internal Audit
Non-Disabled Disabled
89%77%
11%23%
Applications Appointments
HR
Non-Disabled Disabled
93%
7%
Applications Appointments
Northern Ireland
Non-Disabled Disabled
94% 98%
6% 2%
Applications Appointments
European
Non-Disabled Disabled

Civil Service Fast Stream and Fast Track: Annual Report 2015
28
CHART 5 – FAST STREAM APPLICATIONS BY SOCIO-ECONOMIC STATUS
93% 92%
7% 8%
Applications Appointments
All Fast Streams
Other
Bisexual/Gay Man/GayWoman/LesbianHeterosexual/Straight
92% 93%
8% 7%
Applications Appointments
GFS
Other
Bisexual/Gay Man/GayWoman/LesbianHeterosexual/Straight
97% 93%
3% 7%
Applications Appointments
Economists
Other
Bisexual/Gay Man/GayWoman/LesbianHeterosexual/Straight
94% 94%
5% 6%
Applications Appointments
Operational Research
Other
Bisexual/Gay Man/GayWoman/LesbianHeterosexual/Straight
95% 92%
5% 8%
Applications Appointments
Statisticians
Other
Bisexual/Gay Man/GayWoman/LesbianHeterosexual/Straight
91% 91%
8% 6%
Applications Appointments
Social Research
Other
Bisexual/Gay Man/GayWoman/LesbianHeterosexual/Straight
90%81%
10%19%
Applications Appointments
Digital and Technology
Other
Bisexual/Gay Man/GayWoman/LesbianHeterosexual/Straight
94% 89%
6% 11%
Applications Appointments
Commercial
Other
Bisexual/Gay Man/GayWoman/LesbianHeterosexual/Straight
98% 96%
2% 4%
Applications Appointments
Finance
Other
Bisexual/Gay Man/GayWoman/LesbianHeterosexual/Straight
96%86%
4% 14%
Applications Appointments
Internal Audit
Other
Bisexual/Gay Man/GayWoman/LesbianHeterosexual/Straight
93% 87%
6% 13%
Applications Appointments
Communications
Other
Bisexual/Gay Man/GayWoman/LesbianHeterosexual/Straight
94% 89%
6% 11%
Applications Appointments
HR
Other
Bisexual/Gay Man/GayWoman/LesbianHeterosexual/Straight
96%
3%
Applications Appointments
Northern Ireland
Other
Bisexual/Gay Man/GayWoman/LesbianHeterosexual/Straight
89%98%
10% 2%
Applications Appointments
European
Other
Bisexual/Gay Man/GayWoman/LesbianHeterosexual/Straight
78%85%
15%11%
8% 4%
Applications Appointments
All Fast Streams
Routine and Manual occupations
Intermediate occupations
Higher managerial, administrativeand professional occupations
80%88%
13%8%
7% 4%
Applications Appointments
GFS
Routine and Manual occupations
Intermediate occupations
Higher managerial, administrativeand professional occupations
77%84%
15%9%
8% 6%
Applications Appointments
Operational Research
Routine and Manual occupations
Intermediate occupations
Higher managerial, administrativeand professional occupations
76% 78%
15% 16%
9% 5%
Applications Appointments
Digital and Technology
Routine and Manual occupations
Intermediate occupations
Higher managerial, administrativeand professional occupations
80% 78%
14% 17%
6% 4%
Applications Appointments
Communications
Routine and Manual occupations
Intermediate occupations
Higher managerial, administrativeand professional occupations
77% 83%
17%13%
6% 3%
Applications Appointments
Economists
Routine and Manual occupations
Intermediate occupations
Higher managerial, administrativeand professional occupations
74% 77%
19%23%
7%0%
Applications Appointments
Statisticians
Routine and Manual occupations
Intermediate occupations
Higher managerial, administrativeand professional occupations
73%87%
17%
9%10% 4%
Applications Appointments
Commercial
Routine and Manual occupations
Intermediate occupations
Higher managerial, administrativeand professional occupations
69%78%
16%12%
15% 10%
Applications Appointments
Finance
Routine and Manual occupations
Intermediate occupations
Higher managerial, administrativeand professional occupations
71%82%
17%
11%11% 7%
Applications Appointments
HR
Routine and Manual occupations
Intermediate occupations
Higher managerial, administrativeand professional occupations
62%
0%
23%
0%
15%
Applications Appointments
Northern Ireland
Routine and Manual occupations
Intermediate occupations
Higher managerial, administrativeand professional occupations
85%
95%
11%
2%5%
2%
Applications Appointments
European
Routine and Manual occupations
Intermediate occupations
Higher managerial, administrativeand professional occupations
64% 67%
20%27%
16%7%
Applications Appointments
Internal Audit
Routine and Manual occupations
Intermediate occupations
Higher managerial, administrativeand professional occupations
80%91%
12%6%8% 3%
Applications Appointments
Social Research
Routine and Manual occupations
Intermediate occupations
Higher managerial, administrativeand professional occupations

Civil Service Fast Stream and Fast Track: Annual Report 2015
29
CHART 6 – APPLICATIONS TO THE FAST TRACK

Fast Stream Recruitment in 2015: Detailed Analysis
All Fast Stream Schemes (excluding In-Service Fast Stream Competition)
VacanciesApplications by
first preference
Ratio of
applications to
vacancies
Recommended for
appointment
Overall success rate
(as % of applicants)
Declined
appointment
Grand Total 1077 21,135 19.6 967 4.6% 237
Graduate Fast Stream
VacanciesApplications by
first preference
Ratio of
applications to
vacancies
Recommended for
appointment
Overall success rate
(as % of applicants)
Declined
appointment
278 7,071 25.4 319 4.5% 104
6 649 108.2 7 1.1% 0
27 2,071 76.7 26 1.3% 5
16 180 11.3 13 7.2% 3
327 9,971 30.5 365 3.7% 112
Other Fast Stream Schemes
VacanciesApplications by
first preference
Ratio of
applications to
vacancies
Recommended for
appointment
Overall success rate
(as % of applicants)
Declined
appointment
229 1,087 4.7 180 16.6% 16
62 314 5.1 38 12.1% 7
46 306 6.7 37 12.1% 6
63 453 7.2 34 7.5% 5
76 1,091 14.4 38 3.5% 7
80 1,906 23.8 68 3.6% 15
75 675 9.0 71 10.5% 21
52 612 11.8 51 8.3% 22
9 284 31.6 15 5.3% 13
Communications 23 790 34.3 24 3.0% 1
Northern Ireland 0 1,391 - 0 0.0% 0
35 2,255 64.4 46 2.0% 12
750 11,164 15 602 5.4% 125
* Digital and Technology changed its name from Technology in Business mid-way through 2014.
Central Departments
Houses of Parliament
Diplomatic Service
European
Total
Finance
Internal Audit
Total
Economists
Statisticians
Social Research
Operational Research
Digital and Technology*
HR
Commercial
Science / Engineering

Fast Stream Recruitment 2015 - In-Service Fast Stream Competition*
Total
Declined
appointment
3.7% 12
Gender
Number % of known Number % of known Number % of total
Candidates 510 66.1% 261 33.9% 16 2.0% 787
19 65.5% 10 34.5% 0 0.0% 29
Ethnic origin
Number % of known Number % of known Number % of total
548 71.6% 217 28.4% 22 2.8% 787
23 79.3% 6 20.7% 0 0.0% 29
Disability
Number % of known Number % of known Number % of total
644 85.5% 109 14.5% 34 4.3% 787
23 79.3% 6 20.7% 0 0.0% 29
* In Service Fast Stream Competition includes those in the Generalist, Digital and Technology, Commercial and Finance Streams
CandidatesRecommended for
appointment
Overall success rate (as
% of applicants)
787 29
Recommended for Appointment
White Ethnic Minority Non-RespondentsTotal
Disabled Non-RespondentsTotal
Male Female Non-RespondentsTotal
Candidates
Recommended for Appointment
Candidates
Recommended for Appointment
Non-Disabled

Applications by University
A blank cell indicates zero
ApplicantsSuccessful
CandidatesApplicants
Successful
CandidatesApplicants
Successful
CandidatesApplicants
Successful
CandidatesApplicants
Successful
CandidatesApplicants
Successful
CandidatesApplicants
Successful
CandidatesApplicants
Successful
CandidatesApplicants
Successful
CandidatesApplicants
Successful
CandidatesApplicants
Successful
CandidatesApplicants
Successful
CandidatesApplicants
Successful
CandidatesApplicants
Successful
Candidates
University of Aberdeen 51 4 16 1 1 1 1 5 8 1 2 1 2 9 17 8 16 1 137 8 5.8%
University of Abertay 8 1 1 3 4 17 - 0.0%
Anglia Ruskin University 15 2 1 2 5 3 1 1 11 1 1 43 - 0.0%
Aston University 30 1 4 3 2 4 6 8 2 3 2 18 2 10 92 3 3.3%
University of Bath 107 7 12 2 6 1 1 1 10 3 8 2 3 10 2 10 1 1 43 1 213 18 8.5%
Bath Spa University 6 1 1 2 2 4 1 16 1 6.3%
University of Bedfordshire 4 1 1 1 1 2 3 1 7 2 22 1 4.5%
University of Birmingham 243 2 21 2 5 8 8 1 18 1 12 2 11 2 10 23 1 39 3 1 58 457 14 3.1%
Birmingham City University 15 1 2 5 6 4 11 3 47 - 0.0%
University College Birmingham 6 1 6 13 - 0.0%
Bishop Grosseteste University College Lincoln 2 1 3 - 0.0%
University of Bolton 1 2 3 1 2 9 - 0.0%
Bournemouth University 13 1 3 2 3 4 1 4 4 34 1 2.9%
BPP University College of Professional Studies 6 1 2 1 1 11 - 0.0%
University of Bradford 26 1 14 2 8 6 5 3 2 8 1 5 80 1 1.3%
University of Brighton 21 1 4 2 3 2 3 1 1 10 3 51 - 0.0%
University of Bristol 274 13 26 9 6 1 3 2 26 1 14 2 6 2 3 1 25 1 11 1 3 72 2 471 33 7.0%
Brunel University 51 1 22 1 4 2 1 4 10 5 2 9 2 5 22 1 1 137 6 4.4%
Buckinghamshire New University 6 1 1 2 1 1 1 1 2 15 1 6.7%
University of Cambridge 553 46 23 9 7 2 6 4 13 1 31 2 10 7 1 1 1 24 1 9 1 9 145 8 838 76 9.1%
Canterbury Christ Church University 28 1 1 1 1 2 3 21 2 60 - 0.0%
Cardiff University 158 6 21 3 13 3 4 1 15 3 20 15 2 11 2 7 15 1 40 4 37 360 21 5.8%
University of Central Lancashire 22 2 1 3 1 5 1 1 5 16 1 7 63 2 3.2%
University of Chester 13 1 2 1 1 6 5 3 2 7 1 6 48 - 0.0%
University of Chichester 1 2 1 4 - 0.0%
City University 24 7 2 1 2 6 4 4 6 3 3 11 2 1 74 2 2.7%
Coventry University 52 28 4 2 1 3 1 10 3 3 1 3 23 1 12 141 6 4.3%
University for the Creative Arts 2 2 - 0.0%
University of Cumbria 5 2 1 2 1 11 - 0.0%
De Montfort University 28 4 1 4 2 5 1 4 13 61 1 1.6%
University of Derby 14 1 2 1 2 1 5 3 1 30 - 0.0%
University of Dundee 41 1 3 1 1 2 5 1 1 1 2 9 11 9 87 1 1.1%
Durham University 418 13 18 5 7 3 10 3 15 3 29 1 12 3 10 2 4 1 37 1 42 5 5 97 2 704 42 6.0%
University of East Anglia 110 3 18 3 2 1 3 3 9 10 1 5 3 11 17 1 3 20 1 214 10 4.7%
University of East London 17 1 3 8 2 6 1 17 1 56 - 0.0%
Edge Hill University 7 1 3 4 4 2 8 29 - 0.0%
University of Edinburgh 230 14 21 8 6 1 3 7 4 13 1 10 2 1 1 15 1 24 1 4 68 1 404 32 7.9%
Edinburgh College of Art 1 1 2 - 0.0%
University of Essex 66 8 4 1 10 6 9 3 8 20 1 3 13 151 1 0.7%
University of Exeter 308 9 28 11 7 3 5 16 15 3 9 4 27 3 29 3 78 1 529 30 5.7%
University College Falmouth 1 1 1 3 - 0.0%
University of Glamorgan 15 4 1 3 8 5 3 2 2 11 1 55 - 0.0%
University of Glasgow 132 5 11 1 3 1 4 8 11 10 6 1 6 19 2 7 39 257 9 3.5%
Glasgow Caledonian University 14 2 1 2 1 1 2 5 1 4 2 4 2 1 11 5 2 54 6 11.1%
University of Gloucestershire 10 3 2 2 1 4 2 24 - 0.0%
Glyndwr University 1 1 1 3 - 0.0%
University of Greenwich 36 6 3 5 5 8 12 4 5 19 2 105 - 0.0%
Heriot-Watt University 16 6 3 4 2 3 1 3 3 8 49 - 0.0%
University of Hertfordshire 31 6 2 3 7 4 11 1 9 13 5 92 - 0.0%
University of Huddersfield 10 1 2 6 9 1 3 3 5 1 40 1 2.5%
University of Hull 89 16 1 3 3 5 15 1 8 2 9 1 7 1 8 30 2 16 211 6 2.8%
Keele University 38 1 3 1 3 7 2 2 2 1 2 14 2 75 3 4.0%
University of Kent 169 2 31 5 7 5 17 16 4 20 2 8 1 12 34 1 4 27 355 10 2.8%
Kingston University 51 1 5 3 1 2 13 3 12 5 4 20 5 124 1 0.8%
Lancaster University 115 1 17 2 5 6 5 14 7 7 1 4 12 38 2 5 23 258 6 2.3%
University of Leeds 283 10 20 6 9 1 12 11 1 23 1 15 3 8 4 20 1 33 2 1 54 2 493 27 5.5%
Leeds Metropolitan University 28 4 1 6 3 4 2 2 14 4 6 74 - 0.0%
Leeds College of Music 1 1 - 0.0%
Leeds Trinity University College 5 1 1 1 3 1 12 - 0.0%
University of Leicester 163 4 14 4 2 3 3 11 1 6 1 6 1 10 29 1 2 26 276 11 4.0%
University of Lincoln 25 1 4 6 2 1 1 14 3 57 - 0.0%
University of Liverpool 99 3 3 4 6 1 10 10 17 3 9 5 10 26 6 17 222 7 3.2%
Liverpool Hope University 9 2 1 9 5 26 - 0.0%
Liverpool John Moores University 30 1 1 11 7 12 5 6 20 24 6 123 - 0.0%
London Metropolitan University 34 6 3 6 3 11 4 3 4 16 1 8 99 - 0.0%
University of London - - -
Birkbeck College 19 3 1 1 4 1 4 2 7 1 2 43 2 4.7%
External System (Distance Learning) 7 1 1 1 2 12 - 0.0%
Central School of Speech and Drama 1 1 - 0.0%
Courtauld Institute of Art 2 1 1 4 - 0.0%
Goldsmiths College 25 1 3 1 5 3 5 9 2 54 - 0.0%
Heythrop College 13 1 1 1 2 1 1 18 2 11.1%
Imperial College London 91 3 1 2 9 2 14 4 2 5 3 3 1 1 11 141 11 7.8%
Institute in Paris 2 1 5 8 - 0.0%
Institute of Education 1 1 - 0.0%
King's College London 248 7 1 1 1 4 8 26 10 1 7 2 16 1 19 1 1 66 409 11 2.7%
London School of Economics and Political Science 160 12 21 2 4 3 1 4 12 1 2 4 1 1 5 1 8 1 34 258 19 7.4%
London School of Hygiene and Tropical Medicine 1 1 - 0.0%
Queen Mary 112 15 2 5 4 8 13 11 13 1 6 1 10 1 17 1 18 232 6 2.6%
Royal Academy of Music 1 1 - 0.0%
Royal Holloway 106 2 20 1 5 4 1 4 10 11 6 2 14 21 1 25 229 4 1.7%
Royal Veterinary College 1 1 - 0.0%
School of Advanced Study 2 2 - 0.0%
School of Oriental and African Studies 95 9 11 1 6 2 2 3 7 1 17 1 145 10 6.9%
St. George's Hospital Medical School 1 1 2 - 0.0%
University College London 288 7 18 6 4 1 10 1 9 1 30 1 13 3 8 1 5 1 17 2 13 1 79 1 495 25 5.1%
University of the Arts 4 1 1 1 1 8 - 0.0%
University of London Marine Biological Station 1 1 - 0.0%
London Southbank University 15 1 5 1 5 2 7 1 37 - 0.0%
Loughborough University 70 2 6 1 1 1 5 2 9 10 3 10 2 3 10 19 2 3 147 12 8.2%
University of Manchester 299 10 23 1 8 1 6 1 19 1 35 3 23 2 18 3 9 24 50 2 6 63 1 583 25 4.3%
Manchester Metropolitan University 44 8 2 2 2 1 7 8 8 2 2 26 2 9 7 126 4 3.2%
Middlesex University 18 1 2 4 3 5 5 5 19 1 63 - 0.0%
UHI Millennium Institute 2 2 - 0.0%
Napier University 5 1 2 1 1 4 2 1 17 - 0.0%
University of Newcastle 135 8 15 3 10 4 7 1 7 1 11 10 3 6 2 14 1 27 2 10 28 282 23 8.2%
Newman University College 1 1 2 - 0.0%
University of Northampton 15 1 1 1 1 1 8 1 1 29 1 3.4%
Northumbria University 49 2 1 2 9 1 6 4 1 1 6 37 7 5 129 2 1.6%
Not applicable as existing Civil Servant 6 1 2 1 1 1 1 3 1 3 19 1 5.3%
University of Nottingham 362 11 25 7 11 11 1 17 24 1 20 3 13 3 5 35 1 37 2 3 73 1 636 30 4.7%
Nottingham Trent University 71 8 7 1 5 12 6 10 1 7 4 29 1 7 166 3 1.8%
Open University 56 3 7 2 1 1 6 5 3 1 2 22 1 12 6 125 3 2.4%
Open University in Scotland 1 1 2 - 0.0%
Communications
University
GFS Economists Statisticians Social Research Operational Research Digital and Technology Commercial Finance Internal Audit HR Northern Ireland European Total Overall
Success
Rate

Open University in Wales 1 1 - 0.0%
Others (UK) including Colleges and Institutions of Higher Education 26 7 1 1 1 2 6 6 2 2 11 16 4 84 1 1.2%
Oxford University 733 67 35 16 4 1 11 2 17 5 47 4 10 2 2 28 2 9 5 7 188 14 1,091 118 10.8%
Oxford Brookes University 36 5 1 1 5 5 8 1 4 5 8 3 11 91 2 2.2%
Overseas 365 8 131 19 32 5 21 2 41 77 4 35 2 24 1 16 1 28 84 3 48 211 4 1,113 49 4.4%
University of Plymouth 41 1 9 1 1 2 5 9 9 1 5 2 18 1 3 5 109 4 3.7%
University of Portsmouth 50 12 5 1 5 6 5 9 7 2 6 18 5 130 1 0.8%
Queen Margaret University 2 1 1 1 1 3 4 1 13 1 7.7%
Queen's University Belfast 74 2 3 6 3 4 15 1 6 1 3 1 3 1 6 21 1 624 21 789 7 0.9%
Ravensbourne College of Design and Communication 1 2 1 1 5 - 0.0%
University of Reading 82 9 1 4 5 9 4 2 1 11 16 1 13 157 1 0.6%
Robert Gordon University 4 1 2 1 2 3 13 - 0.0%
Roehampton University 13 2 4 8 27 - 0.0%
Rose Bruford College 2 1 1 4 - 0.0%
Royal Agricultural College 1 1 - 0.0%
Royal Scottish Academy of Music & Drama 1 1 - 0.0%
University of Salford 15 1 2 6 2 7 3 1 4 1 5 45 2 4.4%
University of Sheffield 262 6 38 11 5 2 13 4 6 36 6 10 1 8 3 3 23 39 2 1 59 503 35 7.0%
Sheffield Hallam University 43 1 2 2 9 3 9 4 4 25 1 1 2 105 1 1.0%
University of Southampton 179 8 13 2 8 1 3 2 6 19 9 7 4 15 23 3 2 36 324 16 4.9%
Southampton Solent University 6 1 2 4 13 - 0.0%
University of St Andrews 174 9 9 1 5 5 8 11 7 2 2 2 5 11 9 59 3 307 15 4.9%
St. Mary's University College 4 1 1 2 6 14 - 0.0%
Staffordshire University 13 3 3 1 1 5 3 8 36 1 2.8%
Stirling University 27 1 5 3 3 1 4 1 1 1 1 12 8 9 75 2 2.7%
University of Strathclyde 44 2 17 2 1 2 7 1 8 2 6 1 2 3 16 1 15 124 6 4.8%
University of Sunderland 13 1 7 2 2 4 8 1 38 - 0.0%
Suffolk, University Campus 1 1 2 - 0.0%
University of Surrey 42 2 21 4 3 5 2 4 3 2 2 1 1 12 8 104 8 7.7%
University of Sussex 95 3 25 4 5 7 10 5 4 3 4 2 3 2 11 37 1 2 21 229 15 6.6%
University of Swansea 60 1 17 1 5 5 1 5 9 7 7 4 2 22 1 1 8 152 4 2.6%
University of Teesside 9 1 3 5 2 7 1 28 - 0.0%
Thames Valley University 7 5 7 4 1 2 1 27 - 0.0%
Trinity College, Carmarthen 1 1 - 0.0%
University of Ulster 23 1 1 1 8 3 3 2 5 23 433 7 510 - 0.0%
University of Wales - - -
Aberystwyth 77 1 4 1 2 3 4 10 5 2 2 1 4 11 2 17 142 4 2.8%
Bangor 27 1 1 2 1 1 2 3 1 2 1 12 1 2 7 60 4 6.7%
Cardiff Institute 2 1 1 2 1 2 2 2 13 - 0.0%
Cardiff Metropolitan 5 1 2 2 1 2 6 1 19 1 5.3%
Lampeter 6 1 7 - 0.0%
Newport 4 4 2 3 3 6 1 23 - 0.0%
Swansea Metropolitan 2 2 - 0.0%
Trinity Saint David 2 1 1 5 1 10 - 0.0%
University of Warwick 264 10 32 7 9 4 9 2 23 4 29 2 14 2 4 1 2 22 22 1 8 77 515 33 6.4%
University of the West of England 54 1 11 2 1 1 6 8 6 2 3 17 111 1 0.9%
University of the West of Scotland 4 2 1 1 2 2 3 8 1 24 - 0.0%
University of Westminster 58 6 1 3 1 15 4 1 14 1 4 1 5 19 1 9 140 3 2.1%
University of Winchester 14 1 1 6 22 - 0.0%
University of Wolverhampton 12 1 1 4 2 2 1 4 11 1 38 1 2.6%
University of Worcester 8 1 1 1 6 17 - 0.0%
Writtle College 1 1 - 0.0%
University of York 273 19 34 6 6 10 2 4 1 25 2 9 2 10 2 3 24 2 21 1 36 2 455 39 8.6%
York St. John University 4 1 1 1 8 15 - 0.0%
Grand Total 9,971 365 1,087 180 314 38 306 37 453 34 1,091 38 675 71 612 51 284 15 790 24 1,906 68 1,391 - 2,255 46 21,135 967 4.6%
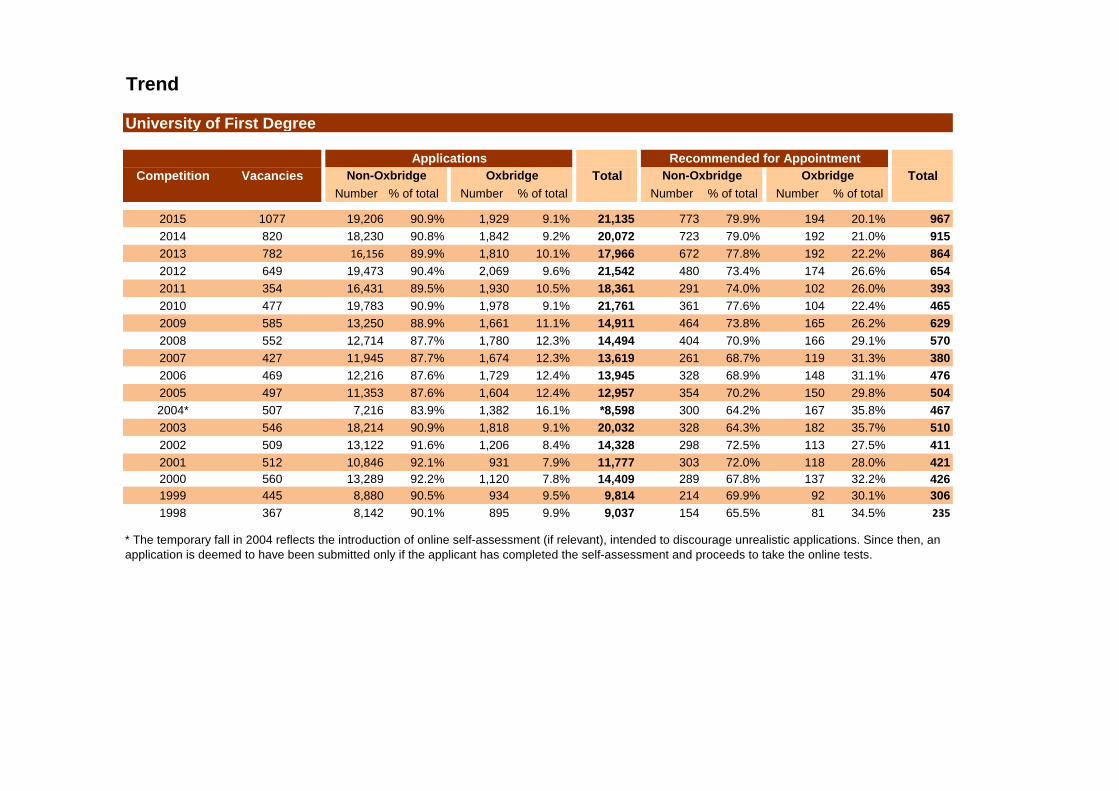
Trend
University of First Degree
Number % of total Number % of total Number % of total Number % of total
2015 1077 19,206 90.9% 1,929 9.1% 21,135 773 79.9% 194 20.1% 967
2014 820 18,230 90.8% 1,842 9.2% 20,072 723 79.0% 192 21.0% 915
2013 782 16,156 89.9% 1,810 10.1% 17,966 672 77.8% 192 22.2% 864
2012 649 19,473 90.4% 2,069 9.6% 21,542 480 73.4% 174 26.6% 654
2011 354 16,431 89.5% 1,930 10.5% 18,361 291 74.0% 102 26.0% 393
2010 477 19,783 90.9% 1,978 9.1% 21,761 361 77.6% 104 22.4% 465
2009 585 13,250 88.9% 1,661 11.1% 14,911 464 73.8% 165 26.2% 629
2008 552 12,714 87.7% 1,780 12.3% 14,494 404 70.9% 166 29.1% 570
2007 427 11,945 87.7% 1,674 12.3% 13,619 261 68.7% 119 31.3% 380
2006 469 12,216 87.6% 1,729 12.4% 13,945 328 68.9% 148 31.1% 476
2005 497 11,353 87.6% 1,604 12.4% 12,957 354 70.2% 150 29.8% 504
2004* 507 7,216 83.9% 1,382 16.1% *8,598 300 64.2% 167 35.8% 467
2003 546 18,214 90.9% 1,818 9.1% 20,032 328 64.3% 182 35.7% 510
2002 509 13,122 91.6% 1,206 8.4% 14,328 298 72.5% 113 27.5% 411
2001 512 10,846 92.1% 931 7.9% 11,777 303 72.0% 118 28.0% 421
2000 560 13,289 92.2% 1,120 7.8% 14,409 289 67.8% 137 32.2% 426
1999 445 8,880 90.5% 934 9.5% 9,814 214 69.9% 92 30.1% 306
1998 367 8,142 90.1% 895 9.9% 9,037 154 65.5% 81 34.5% 235
* The temporary fall in 2004 reflects the introduction of online self-assessment (if relevant), intended to discourage unrealistic applications. Since then, an
application is deemed to have been submitted only if the applicant has completed the self-assessment and proceeds to take the online tests.
Competition Vacancies
Applications
Total
Recommended for Appointment
TotalNon-Oxbridge Oxbridge Non-Oxbridge Oxbridge

Trend
University of First Degree
ApplicationsRecommended
for AppointmentSuccess Rate Applications
Recommended
for AppointmentSuccess Rate Applications
Recommended
for AppointmentSuccess Rate
2015 1077 19,206 773 4.0% 1,929 194 10.1% 21,135 967 4.6%
2014 820 18,230 723 4.0% 1,842 192 10.4% 20,072 915 4.6%
2013 782 16,156 672 4.2% 1,810 192 10.6% 17,966 864 4.8%
2012 649 19,473 480 2.5% 2,069 174 8.4% 21,542 654 3.0%
2011 354 16,431 291 1.8% 1,930 102 5.3% 18,361 393 2.1%
2010 477 19,783 361 1.8% 1,978 104 5.3% 21,761 465 2.1%
2009 585 13,250 464 3.5% 1,661 165 9.9% 14,911 629 4.2%
2008 552 12,714 404 3.2% 1,780 166 9.3% 14,494 570 3.9%
2007 427 11,945 261 2.2% 1,674 119 7.1% 13,619 380 2.8%
2006 469 12,216 328 2.7% 1,729 148 8.6% 13,945 476 3.4%
2005 497 11,353 354 3.1% 1,604 150 9.4% 12,957 504 3.9%
2004* 507 7,216 300 4.2% 1,382 167 12.1% 8,598 467 5.4%
2003 546 18,214 328 1.8% 1,818 182 10.0% 20,032 510 2.5%
2002 509 13,122 298 2.3% 1,206 113 9.4% 14,328 411 2.9%
2001 512 10,846 303 2.8% 931 118 12.7% 11,777 421 3.6%
2000 560 13,289 289 2.2% 1,120 137 12.2% 14,409 426 3.0%
1999 445 8,880 214 2.4% 934 92 9.9% 9,814 306 3.1%
1998 367 8,142 154 1.9% 895 81 9.1% 9,037 235 2.6%
* The temporary fall in 2004 reflects the introduction of online self-assessment (if relevant), intended to discourage unrealistic
applications. Since then, an application is deemed to have been submitted only if the applicant has completed the self-assessment and
proceeds to take the online tests.
Total
Competition Vacancies
Non-Oxbridge Oxbridge

Analysis by Degree Class
All Fast Stream Schemes
Number % of totalSuccess
RateNumber % of total
Success
RateNumber % of total
Success
RateNumber % of total
Success
RateNumber
Success
Rate
Applications 5,310 25.1% - 13,093 61.9% - 2,411 11.4% - 321 1.5% - 21,135 -
Recommended for Appointment 395 40.8% 7.4% 534 55.2% 4.1% 26 2.7% 1.1% 12 1.2% 3.7% 967 4.6%
INDIVIDUAL SCHEMES
Graduate Fast Stream
Number % of totalSuccess
RateNumber % of total
Success
RateNumber % of total
Success
RateNumber % of total
Success
RateNumber
Success
Rate
2,524 25.3% - 6,184 62.0% - 1,145 11.5% - 118 1.2% - 9,971 -
Recommended for Appointment 140 38.4% 5.5% 204 55.9% 3.3% 17 4.7% 1.5% 4 1.1% 3.4% 365 3.7%
Economists
Number % of totalSuccess
RateNumber % of total
Success
RateNumber % of total
Success
RateNumber % of total
Success
RateNumber
Success
Rate
438 40.3% - 588 54.1% - 35 3.2% - 26 2.4% - 1,087 -
Recommended for Appointment 92 51.1% 21.0% 86 47.8% 14.6% 1 0.6% 2.9% 1 0.6% 3.8% 180 16.6%
Statisticians
Number % of totalSuccess
RateNumber % of total
Success
RateNumber % of total
Success
RateNumber % of total
Success
RateNumber
Success
Rate
Applications 132 42.0% - 165 52.5% - 8 2.5% - 9 2.9% - 314 -
Recommended for Appointment 20 52.6% 15.2% 17 44.7% 10.3% 0 0.0% 0.0% 1 2.6% 11.1% 38 12.1%
Social Research
Number % of totalSuccess
RateNumber % of total
Success
RateNumber % of total
Success
RateNumber % of total
Success
RateNumber
Success
Rate
Applications 100 32.7% - 196 64.1% - 7 2.3% - 3 1.0% - 306 -
Recommended for Appointment 16 43.2% 16.0% 20 54.1% 10.2% 0 0.0% 0.0% 1 2.7% 33.3% 37 12.1%
Operational Research
Number % of totalSuccess
RateNumber % of total
Success
RateNumber % of total
Success
RateNumber % of total
Success
RateNumber
Success
Rate
Applications 196 43.3% - 218 48.1% - 28 6.2% - 11 2.4% - 453 -
Recommended for Appointment 30 88.2% 15.3% 4 11.8% 1.8% 0 0.0% 0.0% 0 0.0% 0.0% 34 7.5%
Digital and Technology
Number % of totalSuccess
RateNumber % of total
Success
RateNumber % of total
Success
RateNumber % of total
Success
RateNumber
Success
Rate
Applications 261 23.9% - 727 66.6% - 79 7.2% - 24 2.2% - 1,091 -
Recommended for Appointment 6 15.8% 2.3% 29 76.3% 4.0% 0 0.0% 0.0% 3 7.9% 12.5% 38 3.5%
Commercial
Number % of totalSuccess
RateNumber % of total
Success
RateNumber % of total
Success
RateNumber % of total
Success
RateNumber
Success
RateApplications 157 23.3% - 488 72.3% - 17 2.5% - 13 1.9% - 675 -
Recommended for Appointment 21 29.6% 13.4% 50 70.4% 10.2% 0 0.0% 0.0% 0 0.0% 0.0% 71 10.5%
Finance
Number % of totalSuccess
RateNumber % of total
Success
RateNumber % of total
Success
RateNumber % of total
Success
RateNumber
Success
RateApplications 183 29.9% - 407 66.5% - 15 2.5% - 7 1.1% - 612 -
Recommended for Appointment 15 29.4% 8.2% 36 70.6% 8.8% 0 0.0% 0.0% 0 0.0% 0.0% 51 8.3%
Internal Audit
Number % of totalSuccess
RateNumber % of total
Success
RateNumber % of total
Success
RateNumber % of total
Success
RateNumber
Success
RateApplications 75 26.4% - 200 70.4% - 3 1.1% - 6 2.1% - 284 -
Recommended for Appointment 6 40.0% 8.0% 9 60.0% 4.5% 0 0.0% 0.0% 0 0.0% 0.0% 15 5.3%
1 2:1 2:2 Other* Total
1 2:1 2:2 Other* Total
1 2:1 2:2 Other* Total
1 2:1 2:2 Other* Total
1 2:1 2:2 Other* Total
Total
1 2:1 2:2 Other* Total
1 2:1 2:2 Other* Total
Applications
1 2:1 2:2 Other*
1 2:1 2:2 Other*
Total
Applications
Please note that this data is based partly on degree class predicted at time of application. In future Reports, it will reflect class actually achieved. No candidate is admitted to the Fast Stream without having achieved the
required 2:2 or above.
1 2:1 2:2 Other* Total
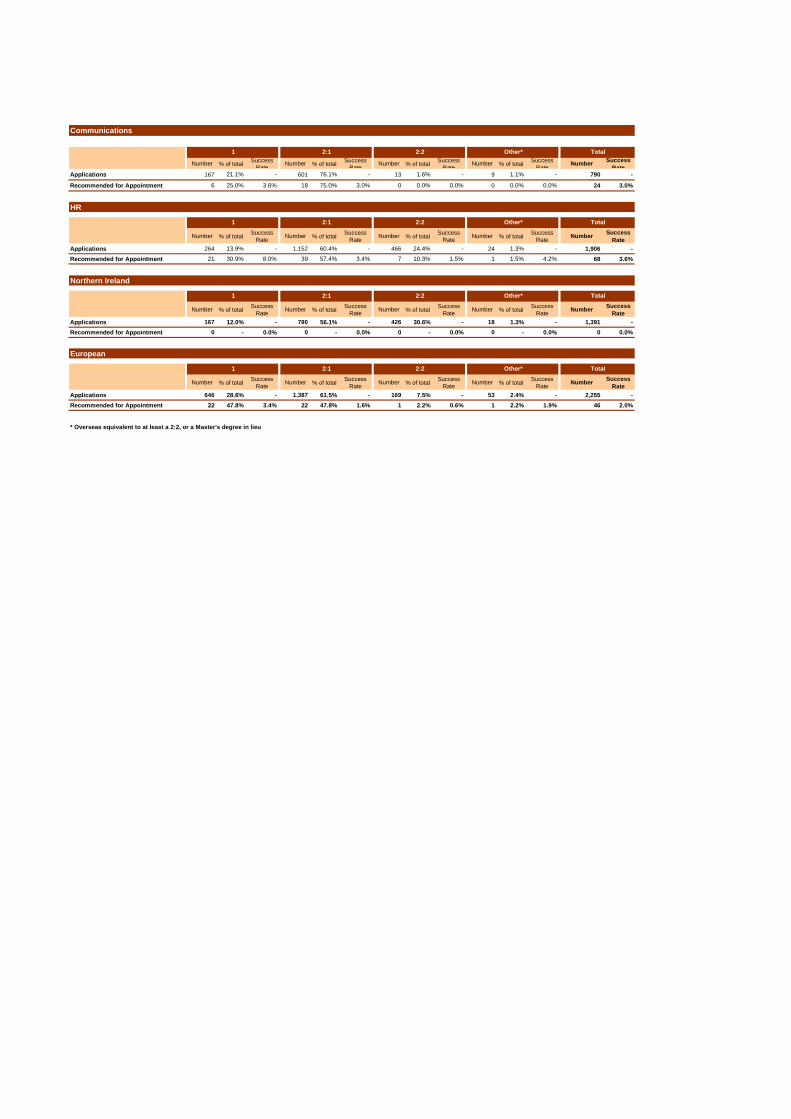
Communications
Number % of totalSuccess
RateNumber % of total
Success
RateNumber % of total
Success
RateNumber % of total
Success
RateNumber
Success
RateApplications 167 21.1% - 601 76.1% - 13 1.6% - 9 1.1% - 790 -
Recommended for Appointment 6 25.0% 3.6% 18 75.0% 3.0% 0 0.0% 0.0% 0 0.0% 0.0% 24 3.0%
HR
Number % of totalSuccess
RateNumber % of total
Success
RateNumber % of total
Success
RateNumber % of total
Success
RateNumber
Success
Rate
Applications 264 13.9% - 1,152 60.4% - 466 24.4% - 24 1.3% - 1,906 -
Recommended for Appointment 21 30.9% 8.0% 39 57.4% 3.4% 7 10.3% 1.5% 1 1.5% 4.2% 68 3.6%
Northern Ireland
Number % of totalSuccess
RateNumber % of total
Success
RateNumber % of total
Success
RateNumber % of total
Success
RateNumber
Success
Rate
Applications 167 12.0% - 780 56.1% - 426 30.6% - 18 1.3% - 1,391 -
Recommended for Appointment 0 - 0.0% 0 - 0.0% 0 - 0.0% 0 - 0.0% 0 0.0%
European
Number % of totalSuccess
RateNumber % of total
Success
RateNumber % of total
Success
RateNumber % of total
Success
RateNumber
Success
Rate
Applications 646 28.6% - 1,387 61.5% - 169 7.5% - 53 2.4% - 2,255 -
Recommended for Appointment 22 47.8% 3.4% 22 47.8% 1.6% 1 2.2% 0.6% 1 2.2% 1.9% 46 2.0%
* Overseas equivalent to at least a 2:2, or a Master's degree in lieu
1 2:1 2:2 Other* Total
1 2:1 2:2 Other* Total
1 2:1 2:2 Other* Total
1 2:1 2:2 Other* Total

Applications by Degree Type
ApplicantsSuccessful
CandidatesApplicants
Successful
CandidatesApplicants
Successful
CandidatesApplicants
Successful
CandidatesApplicants
Successful
CandidatesApplicants
Successful
CandidatesApplicants
Successful
CandidatesApplicants
Successful
CandidatesApplicants
Successful
CandidatesApplicants
Successful
CandidatesApplicants
Successful
CandidatesApplicants
Successful
CandidatesApplicants
Successful
CandidatesApplicants
Successful
Candidates
Allied Medicine 43 1 1 8 2 3 1 1 6 21 4 89 2 2.2%
Architecture 20 1 1 3 4 8 2 38 1 2.6%
Biological Sciences 523 18 2 31 8 13 1 12 1 58 2 36 4 26 5 8 1 17 2 98 7 78 44 1 946 50 5.3%
Business 280 2 23 3 3 1 8 59 114 9 100 9 50 2 43 371 9 203 48 1,303 34 2.6%
Creative Arts 96 1 2 1 2 36 8 2 2 24 61 40 13 287 1 0.3%
Economics 341 17 938 163 44 6 27 2 27 1 40 66 3 76 3 30 1 12 41 1 31 64 1 1,737 198 11.4%
Education 22 1 1 1 1 3 2 2 3 23 2 19 1 79 2 2.5%
Engineering 184 8 2 2 1 29 2 53 2 18 3 10 7 4 21 42 6 2 379 17 4.5%
Financial 59 1 4 3 2 12 52 4 160 8 63 5 1 16 1 39 4 415 19 4.6%
Humanities 3,217 133 10 7 45 3 17 260 11 130 22 51 4 28 2 355 17 458 19 279 499 15 5,356 226 4.2%
Languages 1,024 45 3 2 5 3 60 5 24 2 7 3 6 1 47 2 66 5 48 832 9 2,125 74 3.5%
Librarian 47 2 1 6 1 1 14 10 3 4 1 87 3 3.4%
Mathematical Science 165 5 15 1 121 10 3 1 194 25 36 1 26 2 71 4 30 1 1 15 25 24 1 726 51 7.0%
Medicine & Dentistry 27 2 1 1 3 1 2 3 10 2 50 2 4.0%
Multi Discipline 573 24 31 5 13 3 12 9 53 2 28 1 23 1 10 41 1 76 3 66 174 1 1,109 41 3.7%
Not applicable as existing
Civil Servant32 1 2 2 2 3 3 1 1 6 16 12 7 87 1 1.1%
Physical Sciences 622 16 5 27 3 1 108 5 98 6 30 2 34 8 14 1 8 41 1 75 55 1 1,118 43 3.8%
Social Science 2,634 87 47 6 60 8 192 30 31 235 9 128 17 42 4 29 207 2 561 20 362 463 14 4,991 197 3.9%
Technology 53 2 5 67 6 1 3 1 5 1 4 17 27 9 198 3 1.5%
Veterinary Sciences 9 1 1 1 2 3 15 2 13.3%
Total 9,971 365 1,087 180 314 38 306 37 453 34 1,091 38 675 71 612 51 284 15 790 24 1,906 68 1,391 0 2,255 46 21,135 967 4.6%
Digital and Technology HR Northern Ireland European TotalOverall
Success
Rate
Commercial Finance Internal Audit CommunicationsOperational Research
Degree Type
GFS Economists Statisticians Social Research

Analysis by Gender
All Fast Stream Schemes
Number % of knownSuccess
RateNumber % of known
Success
RateNumber % of total
Success
RateNumber Success Rate
Applications 10,855 51.9% - 10,055 48.1% 225 1.1% - 21,135 -
Recommended for Appointment 480 50.4% 4.4% 472 49.6% 4.7% 15 1.6% 6.7% 967 4.6%
INDIVIDUAL SCHEMES
Graduate Fast Stream
Number % of knownSuccess
RateNumber % of known
Success
RateNumber % of total
Success
RateNumber Success Rate
5,327 54.1% - 4,519 45.9% - 125 1.3% - 9,971 -
Recommended for Appointment 168 47.3% 3.2% 187 52.7% 4.1% 10 2.7% 8.0% 365 3.7%
Economists
Number % of knownSuccess
RateNumber % of known
Success
RateNumber % of total
Success
RateNumber Success Rate
717 66.7% - 358 33.3% - 12 1.1% - 1,087 -
Recommended for Appointment 116 65.2% 16.2% 62 34.8% 17.3% 2 1.1% 16.7% 180 16.6%
Statisticians
Number % of knownSuccess
RateNumber % of known
Success
RateNumber % of total
Success
RateNumber Success Rate
Applications 155 49.8% - 156 50.2% - 3 1.0% - 314 -
Recommended for Appointment 14 36.8% 9.0% 24 63.2% 15.4% 0 0.0% 0.0% 38 12.1%
Social Research
Number % of knownSuccess
RateNumber % of known
Success
RateNumber % of total
Success
RateNumber Success Rate
Applications 145 47.5% - 160 52.5% - 1 0.3% - 306 -
Recommended for Appointment 14 37.8% 9.7% 23 62.2% 14.4% 0 0.0% 0.0% 37 12.1%
Operational Research
Number % of knownSuccess
RateNumber % of known
Success
RateNumber % of total
Success
RateNumber Success Rate
Applications 278 62.5% - 167 37.5% - 8 1.8% - 453 -
Recommended for Appointment 18 56.3% 6.5% 14 43.8% 8.4% 2 5.9% 25.0% 34 7.5%
Digital and Technology
Number % of knownSuccess
RateNumber % of known
Success
RateNumber % of total Number Success Rate
Applications 746 69.5% - 328 30.5% - 17 1.6% - 1,091 -
Recommended for Appointment 25 65.8% 3.4% 13 34.2% 4.0% 0 0.0% 0.0% 38 3.5%
Commercial
Number % of knownSuccess
RateNumber % of known
Success
RateNumber % of total Number Success Rate
Applications 420 62.8% - 249 37.2% - 6 0.9% - 675 -
Recommended for Appointment 48 67.6% 11.4% 23 32.4% 9.2% 0 0.0% 0.0% 71 10.5%
Finance
Number % of knownSuccess
RateNumber % of known
Success
RateNumber % of total Number Success Rate
Applications 370 61.0% - 237 39.0% - 5 0.8% - 612 -
Recommended for Appointment 24 47.1% 6.5% 27 52.9% 11.4% 0 0.0% 0.0% 51 8.3%
Internal Audit
Number % of knownSuccess
RateNumber % of known
Success
RateNumber % of total Number Success Rate
Applications 180 63.8% - 102 36.2% - 2 0.7% - 284 -
Recommended for Appointment 9 60.0% 5.0% 6 40.0% 5.9% 0 0.0% 0.0% 15 5.3%
Male Female Non-respondents Total
Male Female
Male Female Non-respondents Total
Male Female Non-respondents Total
Non-respondents Total
Male Female Non-respondents Total
Male Female Non-respondents Total
Male Female Non-respondents Total
Applications
Male Female Non-respondents Total
Male Female Non-respondents Total
Applications
Male Female Non-respondents Total

Communications
Number % of knownSuccess
RateNumber % of known
Success
RateNumber % of total Number Success Rate
Applications 302 38.5% - 482 61.5% - 6 0.8% - 790 -
Recommended for Appointment 8 33.3% 2.6% 16 66.7% 3.3% 0 0.0% 0.0% 24 3.0%
HR
Number % of knownSuccess
RateNumber % of known
Success
RateNumber % of total
Success
RateNumber Success Rate
Applications 618 32.5% - 1,282 67.5% - 6 0.3% - 1,906 -
Recommended for Appointment 17 25.0% 2.8% 51 75.0% 4.0% 0 0.0% 0.0% 68 3.6%
Northern Ireland
Number % of knownSuccess
RateNumber % of known
Success
RateNumber % of total
Success
RateNumber Success Rate
Applications 673 48.5% - 716 51.5% - 2 0.1% - 1,391 -
Recommended for Appointment 0 - 0.0% 0 - 0.0% 0 - 0.0% 0 0.0%
European
Number % of knownSuccess
RateNumber % of known
Success
RateNumber % of total
Success
RateNumber Success Rate
Applications 924 41.6% - 1,299 58.4% - 32 1.4% - 2,255 -
Recommended for Appointment 19 42.2% 2.1% 26 57.8% 2.0% 1 2.2% 3.1% 46 2.0%
Male Female Non-respondents Total
Male Female Non-respondents Total
Male Female Non-respondents Total
Male Female Non-respondents Total

Trend
Gender
Number % of known* Number % of known* Number % of total Number % of known* Number % of known* Number % of total
2015 1,077 10,855 51.9% 10,055 48.1% 225 1.1% 21,135 480 50.4% 472 49.6% 15 1.6% 967
2014 820 10,265 51.7% 9,600 48.3% 207 1.0% 20,072 468 52.0% 432 48.0% 15 1.6% 915
2013 782 9,579 53.8% 8,227 46.2% 160 0.9% 17,966 425 49.9% 427 50.1% 12 1.4% 864
2012 649 11,158 52.3% 10,177 47.7% 207 1.0% 21,542 314 48.5% 334 51.5% 6 0.9% 654
2011 354 9,612 52.7% 8,622 47.3% 127 0.7% 18,361 193 49.5% 197 50.5% 3 0.8% 393
2010 477 11,586 53.6% 10,020 46.4% 155 0.7% 21,761 245 53.3% 215 46.7% 5 1.1% 465
2009 585 8,333 56.2% 6,489 43.8% 89 0.6% 14,911 357 57.0% 269 43.0% 3 0.5% 629
2008 552 7,981 55.3% 6,444 44.7% 69 0.5% 14,494 292 51.5% 275 48.5% 3 0.5% 570
2007 427 7,343 54.1% 6,229 45.9% 47 0.3% 13,619 208 54.9% 171 45.1% 1 0.3% 380
2006 469 7,637 55.0% 6,246 45.0% 62 0.4% 13,945 233 49.3% 240 50.7% 3 0.6% 476
2005 497 7,376 57.2% 5,508 42.8% 73 0.6% 12,957 280 56.0% 220 44.0% 4 0.8% 504
2004** 507 5,255 61.1% 3,343 38.9% .. .. *8,598 273 58.5% 194 41.5% .. .. 467
2003 546 10,676 53.3% 9,356 46.7% .. .. 20,032 256 50.2% 254 49.8% .. .. 510
2002 509 7,181 50.1% 7,147 49.9% .. .. 14,328 197 47.9% 214 52.1% .. .. 411
2001 512 6,175 52.4% 5,602 47.6% .. .. 11,777 204 48.5% 217 51.5% .. .. 421
2000 560 7,487 52.0% 6,922 48.0% .. .. 14,409 223 52.3% 203 47.7% .. .. 426
1999 445 5,220 53.2% 4,594 46.8% .. .. 9,814 153 50.0% 153 50.0% .. .. 306
1998 367 4,931 54.6% 4,106 45.4% .. .. 9,037 144 61.3% 91 38.7% .. .. 235
Female Non-respondent
* In previous reports, percentages were calculated as a percentage of the total. From 2014 onwards percentages are calculated of the candidates that have declared their gender. Historical data has
been adjusted to reflect this change and enable like-for-like comparison.
** The temporary fall in 2004 reflects the introduction of online self-assessment (if relevant), intended to discourage unrealistic applications. Since then, an application is deemed to have been
submitted only if the applicant has completed the self-assessment and proceeds to take the online tests.
Recommended for Appointment
TotalMale Female Non-respondent MaleCompetition Vacancies
Applications
Total

Trend
Gender
ApplicationsRecommended
for AppointmentSuccess Rate Applications
Recommended
for AppointmentSuccess Rate Applications
Recommended
for AppointmentSuccess Rate Applications
Recommended
for AppointmentSuccess Rate
2015 1077 10,855 480 4.4% 10,055 472 4.7% 225 15 6.7% 21,135 967 4.6%
2014 820 10,265 468 4.6% 9,600 432 4.5% 207 15 7.2% 20,072 915 4.6%
2013 782 9,579 425 4.4% 8,227 427 5.2% 160 12 7.5% 17,966 864 4.8%
2012 649 11,158 314 2.8% 10,177 334 3.3% 207 6 2.9% 21,542 654 3.0%
2011 354 9,612 193 2.0% 8,622 197 2.3% 127 3 2.4% 18,361 393 2.1%
2010 477 11,586 245 2.1% 10,020 215 2.1% 155 5 3.2% 21,761 465 2.1%
2009 585 8,333 357 4.3% 6,489 269 4.1% 89 3 3.4% 14,911 629 4.2%
2008 552 7,981 292 3.7% 6,444 275 4.3% 69 3 4.3% 14,494 570 3.9%
2007 427 7,343 208 2.8% 6,229 171 2.7% 47 1 2.1% 13,619 380 2.8%
2006 469 7,637 233 3.1% 6,246 240 3.8% 62 3 4.8% 13,945 476 3.4%
2005 497 7,376 280 3.8% 5,508 220 4.0% 73 4 5.5% 12957 504 3.9%
2004* 507 5,255 273 5.2% 3,343 194 5.8% .. .. .. 8,598 467 5.4%
2003 546 10,676 256 2.4% 9,356 254 2.7% .. .. .. 20032 510 2.5%
2002 509 7,181 197 2.7% 7,147 214 3.0% .. .. .. 14,328 411 2.9%
2001 512 6,175 204 3.3% 5,602 217 3.9% .. .. .. 11777 421 3.6%
2000 560 7,487 223 3.0% 6,922 203 2.9% .. .. .. 14,409 426 3.0%
1999 445 5,220 153 2.9% 4,594 153 3.3% .. .. .. 9814 306 3.1%
1998 367 4,931 144 2.9% 4,106 91 2.2% .. .. .. 9,037 235 2.6%
Total
* The temporary fall in 2004 reflects the introduction of online self-assessment (if relevant), intended to discourage unrealistic applications. Since then, an application is deemed to have been submitted only if the applicant has completed
the self-assessment and proceeds to take the online tests.
Competition VacanciesMale Female Non-respondents
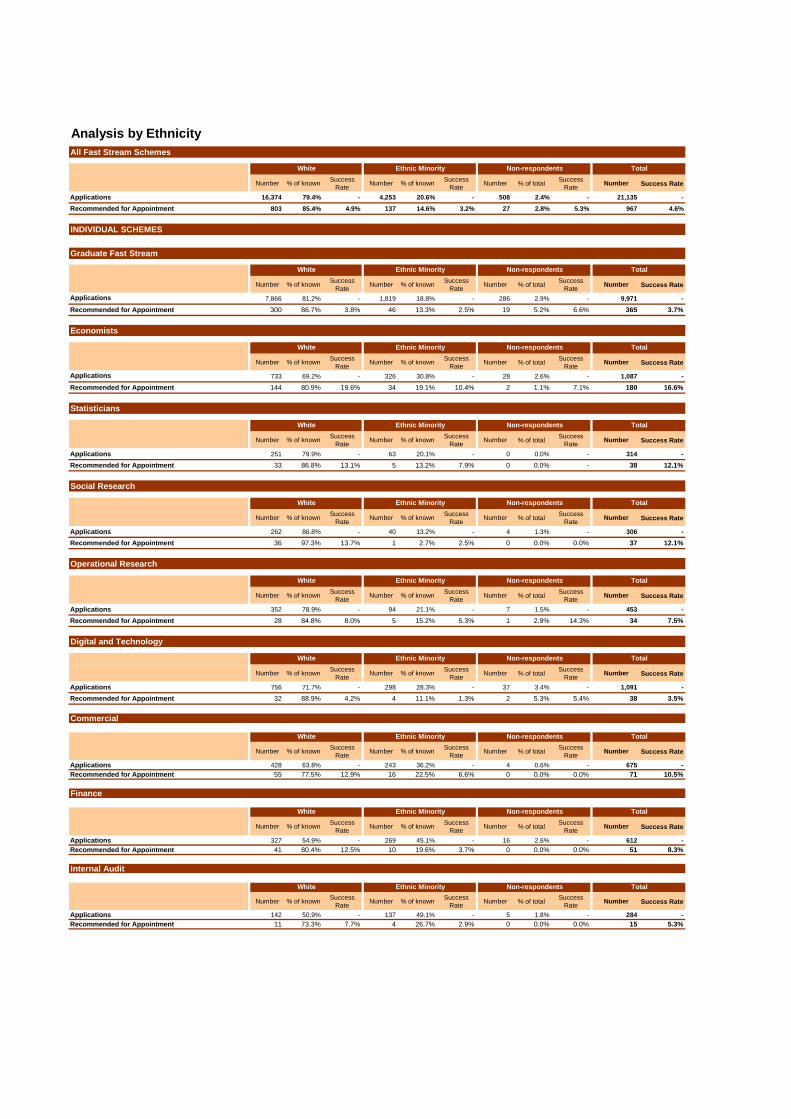
Analysis by Ethnicity
All Fast Stream Schemes
Number % of knownSuccess
RateNumber % of known
Success
RateNumber % of total
Success
RateNumber Success Rate
Applications 16,374 79.4% - 4,253 20.6% - 508 2.4% - 21,135 -
Recommended for Appointment 803 85.4% 4.9% 137 14.6% 3.2% 27 2.8% 5.3% 967 4.6%
INDIVIDUAL SCHEMES
Graduate Fast Stream
Number % of knownSuccess
RateNumber % of known
Success
RateNumber % of total
Success
RateNumber Success Rate
7,866 81.2% - 1,819 18.8% - 286 2.9% - 9,971 -
Recommended for Appointment 300 86.7% 3.8% 46 13.3% 2.5% 19 5.2% 6.6% 365 3.7%
Economists
Number % of knownSuccess
RateNumber % of known
Success
RateNumber % of total
Success
RateNumber Success Rate
733 69.2% - 326 30.8% - 28 2.6% - 1,087 -
Recommended for Appointment 144 80.9% 19.6% 34 19.1% 10.4% 2 1.1% 7.1% 180 16.6%
Statisticians
Number % of knownSuccess
RateNumber % of known
Success
RateNumber % of total
Success
RateNumber Success Rate
Applications 251 79.9% - 63 20.1% - 0 0.0% - 314 -
Recommended for Appointment 33 86.8% 13.1% 5 13.2% 7.9% 0 0.0% - 38 12.1%
Social Research
Number % of knownSuccess
RateNumber % of known
Success
RateNumber % of total
Success
RateNumber Success Rate
Applications 262 86.8% - 40 13.2% - 4 1.3% - 306 -
Recommended for Appointment 36 97.3% 13.7% 1 2.7% 2.5% 0 0.0% 0.0% 37 12.1%
Operational Research
Number % of knownSuccess
RateNumber % of known
Success
RateNumber % of total
Success
RateNumber Success Rate
Applications 352 78.9% - 94 21.1% - 7 1.5% - 453 -
Recommended for Appointment 28 84.8% 8.0% 5 15.2% 5.3% 1 2.9% 14.3% 34 7.5%
Digital and Technology
Number % of knownSuccess
RateNumber % of known
Success
RateNumber % of total
Success
RateNumber Success Rate
Applications 756 71.7% - 298 28.3% - 37 3.4% - 1,091 -
Recommended for Appointment 32 88.9% 4.2% 4 11.1% 1.3% 2 5.3% 5.4% 38 3.5%
Commercial
Number % of knownSuccess
RateNumber % of known
Success
RateNumber % of total
Success
RateNumber Success Rate
Applications 428 63.8% - 243 36.2% - 4 0.6% - 675 -
Recommended for Appointment 55 77.5% 12.9% 16 22.5% 6.6% 0 0.0% 0.0% 71 10.5%
Finance
Number % of knownSuccess
RateNumber % of known
Success
RateNumber % of total
Success
RateNumber Success Rate
Applications 327 54.9% - 269 45.1% - 16 2.6% - 612 -
Recommended for Appointment 41 80.4% 12.5% 10 19.6% 3.7% 0 0.0% 0.0% 51 8.3%
Internal Audit
Number % of knownSuccess
RateNumber % of known
Success
RateNumber % of total
Success
RateNumber Success Rate
Applications 142 50.9% - 137 49.1% - 5 1.8% - 284 -
Recommended for Appointment 11 73.3% 7.7% 4 26.7% 2.9% 0 0.0% 0.0% 15 5.3%
White Ethnic Minority Non-respondents Total
White Ethnic Minority
White Ethnic Minority Non-respondents Total
White Ethnic Minority Non-respondents Total
Non-respondents Total
White Ethnic Minority Non-respondents Total
White Ethnic Minority Non-respondents Total
White Ethnic Minority Non-respondents Total
Applications
White Ethnic Minority Non-respondents Total
White Ethnic Minority Non-respondents Total
Applications
White Ethnic Minority Non-respondents Total

Communications
Number % of knownSuccess
RateNumber % of known
Success
RateNumber % of total
Success
RateNumber Success Rate
Applications 638 82.7% - 133 17.3% - 19 2.4% - 790 -
Recommended for Appointment 24 100.0% 3.8% 0 0.0% 0.0% 0 0.0% 0.0% 24 3.0%
HR
Number % of knownSuccess
RateNumber % of known
Success
RateNumber % of total
Success
RateNumber Success Rate
Applications 1,366 72.6% - 516 27.4% - 24 1.3% - 1,906 -
Recommended for Appointment 58 87.9% 4.2% 8 12.1% 1.6% 2 2.9% 8.3% 68 3.6%
Northern Ireland
Number % of knownSuccess
RateNumber % of known
Success
RateNumber % of total
Success
RateNumber Success Rate
Applications 1,359 98.0% - 28 2.0% - 4 0.3% - 1,391 -
Recommended for Appointment 0 - 0.0% 0 - 0.0% 0 - 0.0% 0 0.0%
European
Number % of knownSuccess
RateNumber % of known
Success
RateNumber % of total
Success
RateNumber Success Rate
Applications 1,894 86.8% - 287 13.2% - 74 3.3% - 2,255 -
Recommended for Appointment 41 91.1% 2.2% 4 8.9% 1.4% 1 2.2% 1.4% 46 2.0%
White Ethnic Minority Non-respondents Total
White Ethnic Minority Non-respondents Total
White Ethnic Minority Non-respondents Total
White Ethnic Minority Non-respondents Total

Trend
Ethnic Origin
Number % of known* Number % of known* Number % of total Number % of known* Number % of known* Number % of total
2015 1077 16,374 79.4% 4,253 20.6% 508 2.4% 21,135 803 85.4% 137 14.6% 27 2.8% 967
2014 820 15,794 80.6% 3,809 19.4% 469 2.3% 20,072 766 85.8% 127 14.2% 22 2.4% 915
2013 782 14,415 82.0% 3,159 18.0% 392 2.2% 17,966 724 86.4% 114 13.6% 26 3.0% 864
2012 649 17,485 83.1% 3,558 16.9% 499 2.3% 21,542 557 87.2% 82 12.8% 15 2.3% 654
2011 354 14,768 82.3% 3,182 17.7% 411 2.2% 18,361 335 86.8% 51 13.2% 7 1.8% 393
2010 477 16,650 78.2% 4,640 21.8% 471 2.2% 21,761 397 87.4% 57 12.6% 11 2.4% 465
2009 585 11,932 81.4% 2,724 18.6% 255 1.7% 14,911 550 89.1% 67 10.9% 12 1.9% 629
2008 552 12,092 84.9% 2,159 15.1% 243 1.7% 14,494 505 90.5% 53 9.5% 12 2.1% 570
2007 427 11,625 86.3% 1,838 13.7% 156 1.1% 13,619 339 90.4% 36 9.6% 5 1.3% 380
2006 469 11,849 86.1% 1,912 13.9% 184 1.3% 13,945 416 88.7% 53 11.3% 7 1.5% 476
2005 497 10,857 84.9% 1,937 15.1% 163 1.3% 12,957 461 92.8% 36 7.2% 7 1.4% 504
2004** 507 7,140 85.0% 1,259 15.0% 199 2.3% *8,598 428 94.5% 25 5.5% 14 3.0% 467
2003 546 15,702 82.7% 3,275 17.3% 1055 5.3% 20,032 455 91.9% 40 8.1% 15 2.9% 510
2002 509 11,671 82.8% 2,432 17.2% 225 1.6% 14,328 363 90.1% 40 9.9% 8 2.0% 411
2001 512 9,683 83.3% 1,941 16.7% 153 1.3% 11,777 383 92.3% 32 7.7% 6 1.4% 421
2000 560 12,076 84.9% 2,154 15.1% 179 1.2% 14,409 392 93.1% 29 6.9% 5 1.2% 426
1999 445 8,412 86.7% 1,296 13.3% 106 1.1% 9,814 287 94.1% 18 5.9% 1 0.3% 306
1998 367 7,884 87.8% 1,098 12.2% 55 0.6% 9,037 226 96.6% 8 3.4% 1 0.4% 235
Ethnic Minority Non-respondent
* In previous reports, percentages were calculated as a percentage of the total. From 2014 onwards percentages are calculated of the candidates that have declared their ethnicity. Historical data has
been adjusted to reflect this change and enable like-for-like comparison.
** The temporary fall in 2004 reflects the introduction of online self-assessment (if relevant), intended to discourage unrealistic applications. Since then, an application is deemed to have been submitted
only if the applicant has completed the self-assessment and proceeds to take the online tests.
Recommended for Appointment
TotalWhite Ethnic Minority Non-respondent WhiteCompetition Vacancies
Applications
Total
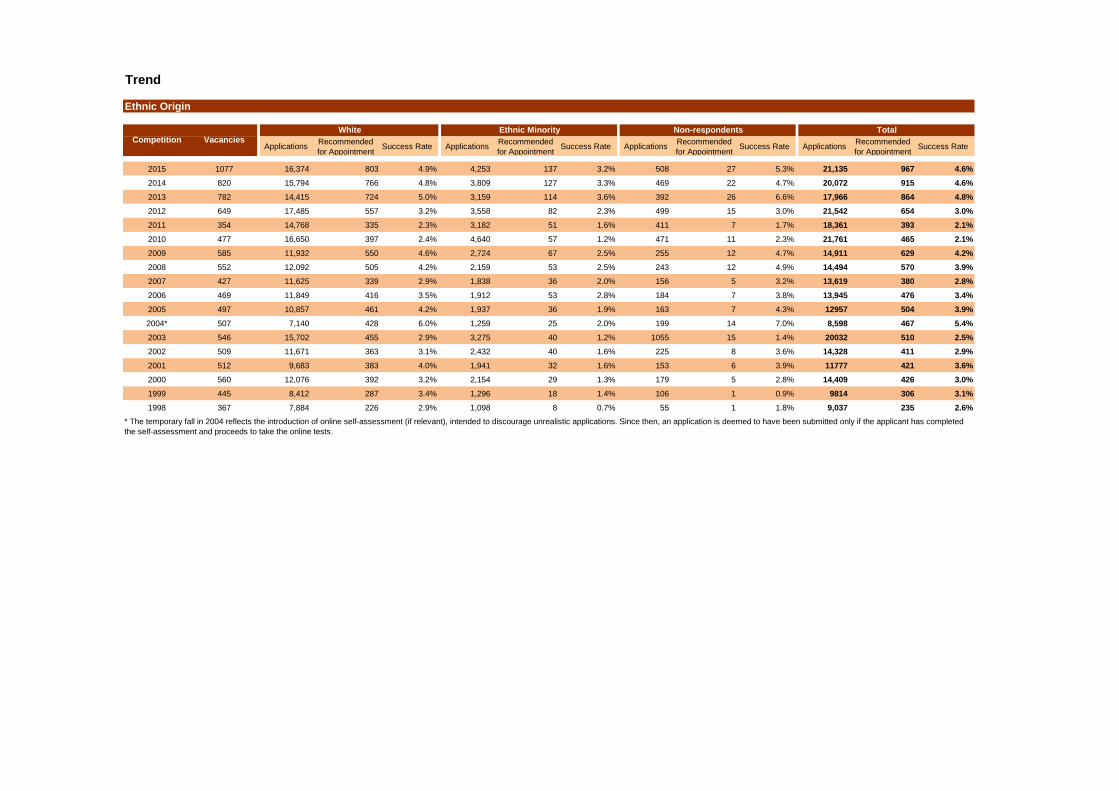
Trend
Ethnic Origin
ApplicationsRecommended
for AppointmentSuccess Rate Applications
Recommended
for AppointmentSuccess Rate Applications
Recommended
for AppointmentSuccess Rate Applications
Recommended
for AppointmentSuccess Rate
2015 1077 16,374 803 4.9% 4,253 137 3.2% 508 27 5.3% 21,135 967 4.6%
2014 820 15,794 766 4.8% 3,809 127 3.3% 469 22 4.7% 20,072 915 4.6%
2013 782 14,415 724 5.0% 3,159 114 3.6% 392 26 6.6% 17,966 864 4.8%
2012 649 17,485 557 3.2% 3,558 82 2.3% 499 15 3.0% 21,542 654 3.0%
2011 354 14,768 335 2.3% 3,182 51 1.6% 411 7 1.7% 18,361 393 2.1%
2010 477 16,650 397 2.4% 4,640 57 1.2% 471 11 2.3% 21,761 465 2.1%
2009 585 11,932 550 4.6% 2,724 67 2.5% 255 12 4.7% 14,911 629 4.2%
2008 552 12,092 505 4.2% 2,159 53 2.5% 243 12 4.9% 14,494 570 3.9%
2007 427 11,625 339 2.9% 1,838 36 2.0% 156 5 3.2% 13,619 380 2.8%
2006 469 11,849 416 3.5% 1,912 53 2.8% 184 7 3.8% 13,945 476 3.4%
2005 497 10,857 461 4.2% 1,937 36 1.9% 163 7 4.3% 12957 504 3.9%
2004* 507 7,140 428 6.0% 1,259 25 2.0% 199 14 7.0% 8,598 467 5.4%
2003 546 15,702 455 2.9% 3,275 40 1.2% 1055 15 1.4% 20032 510 2.5%
2002 509 11,671 363 3.1% 2,432 40 1.6% 225 8 3.6% 14,328 411 2.9%
2001 512 9,683 383 4.0% 1,941 32 1.6% 153 6 3.9% 11777 421 3.6%
2000 560 12,076 392 3.2% 2,154 29 1.3% 179 5 2.8% 14,409 426 3.0%
1999 445 8,412 287 3.4% 1,296 18 1.4% 106 1 0.9% 9814 306 3.1%
1998 367 7,884 226 2.9% 1,098 8 0.7% 55 1 1.8% 9,037 235 2.6%
Total
* The temporary fall in 2004 reflects the introduction of online self-assessment (if relevant), intended to discourage unrealistic applications. Since then, an application is deemed to have been submitted only if the applicant has completed
the self-assessment and proceeds to take the online tests.
Competition VacanciesWhite Ethnic Minority Non-respondents

Detailed Breakdown of Ethnicity
Number % of known % of total Number % of known % of total
White - British 14,249 69.08% 718 76.38%
White - Irish 697 3.38% 21 2.23%
White - Gypsy or Irish Traveller 6 0.03% 0 0.00%
White - Any other White background 1,422 6.89% 64 6.81%
Asian - Bangladeshi 224 1.09% 5 0.53%
Asian - Indian 857 4.15% 44 4.68%
Asian - Pakistani 465 2.25% 15 1.60%
Asian - Any other Asian background 251 1.22% 3 0.32%
Black - African 842 4.08% 10 1.06%
Black - Caribbean 156 0.76% 3 0.32%
Black - Any other Black background 49 0.24% 0 0.00%
Chinese - Any Chinese background 261 1.27% 15 1.60%
Mixed - Asian and White 427 2.07% 20 2.13%
Mixed - Black African and White 90 0.44% 3 0.32%
Mixed - Black Caribbean and White 144 0.70% 6 0.64%
Mixed - Any other mixed ethnic background 257 1.25% 8 0.85%
Other - Arab 88 0.43% 1 0.11%
Any other ethnic background 142 0.69% 4 0.43%
Prefer not to say 508 2.40% 27 2.79%
Total 21,135 100% 967 100%
All Fast Stream Schemes (excluding In-Service Fast Stream Competition)
EthnicityApplications Recommended for Appointment

Analysis by Disability
All Fast Stream Schemes
Number % of knownSuccess
RateNumber % of known
Success
RateNumber % of total
Success
RateNumber Success Rate
Applications 18,738 90.6% - 1,949 9.4% - 448 2.1% - 21,135 -
Recommended for Appointment 852 90.4% 4.5% 90 9.6% 4.6% 25 2.6% 5.6% 967 4.6%
INDIVIDUAL SCHEMES
Graduate Fast Stream
Number % of knownSuccess
RateNumber % of known
Success
RateNumber % of total
Success
RateNumber Success Rate
8,717 89.5% - 1,020 10.5% - 234 2.3% - 9,971 -
Recommended for Appointment 322 91.5% 3.7% 30 8.5% 2.9% 13 3.6% 5.6% 365 3.7%
Economists
Number % of knownSuccess
RateNumber % of known
Success
RateNumber % of total
Success
RateNumber Success Rate
989 93.0% - 74 7.0% - 24 2.2% - 1,087 -
Recommended for Appointment 167 94.9% 16.9% 9 5.1% 12.2% 4 2.2% 16.7% 180 16.6%
Statisticians
Number % of knownSuccess
RateNumber % of known
Success
RateNumber % of total
Success
RateNumber Success Rate
Applications 292 93.9% - 19 6.1% - 3 1.0% - 314 -
Recommended for Appointment 35 92.1% 12.0% 3 7.9% 15.8% 0 0.0% 0.0% 38 12.1%
Social Research
Number % of knownSuccess
RateNumber % of known
Success
RateNumber % of total
Success
RateNumber Success Rate
Applications 244 81.3% - 56 18.7% - 6 2.0% - 306 -
Recommended for Appointment 30 81.1% 12.3% 7 18.9% 12.5% 0 0.0% 0.0% 37 12.1%
Operational Research
Number % of knownSuccess
RateNumber % of known
Success
RateNumber % of total
Success
RateNumber Success Rate
Applications 412 92.6% - 33 7.4% - 8 1.8% - 453 -
Recommended for Appointment 30 93.8% 7.3% 2 6.3% 6.1% 2 5.9% 25.0% 34 7.5%
Digital and Technology
Number % of knownSuccess
RateNumber % of known
Success
RateNumber % of total
Success
RateNumber Success Rate
Applications 949 89.7% - 109 10.3% - 33 3.0% - 1,091 -
Recommended for Appointment 37 97.4% 3.9% 1 2.6% 0.9% 0 0.0% 0.0% 38 3.5%
Commercial
Number % of knownSuccess
RateNumber % of known
Success
RateNumber % of total
Success
RateNumber Success Rate
Applications 595 89.7% - 68 10.3% - 12 1.8% - 675 -
Recommended for Appointment 58 82.9% 9.7% 12 17.1% 17.6% 1 1.4% 8.3% 71 10.5%
Finance
Number % of knownSuccess
RateNumber % of known
Success
RateNumber % of total
Success
RateNumber Success Rate
Applications 558 92.8% - 43 7.2% - 11 1.8% - 612 -
Recommended for Appointment 44 86.3% 7.9% 7 13.7% 16.3% 0 0.0% 0.0% 51 8.3%
Internal Audit
Number % of knownSuccess
RateNumber % of known
Success
RateNumber % of total
Success
RateNumber Success Rate
Applications 255 90.7% - 26 9.3% - 3 1.1% - 284 -
Recommended for Appointment 14 93.3% 5.5% 1 6.7% 3.8% 0 0.0% 0.0% 15 5.3%
Non-Disabled Disabled Non-respondents Total
Non-Disabled Disabled
Non-Disabled Disabled Non-respondents Total
Non-Disabled Disabled Non-respondents Total
Non-respondents Total
Non-Disabled Disabled Non-respondents Total
Non-Disabled Disabled Non-respondents Total
Non-Disabled Disabled Non-respondents Total
Applications
Non-Disabled Disabled Non-respondents Total
Non-Disabled Disabled Non-respondents Total
Applications
Non-Disabled Disabled Non-respondents Total
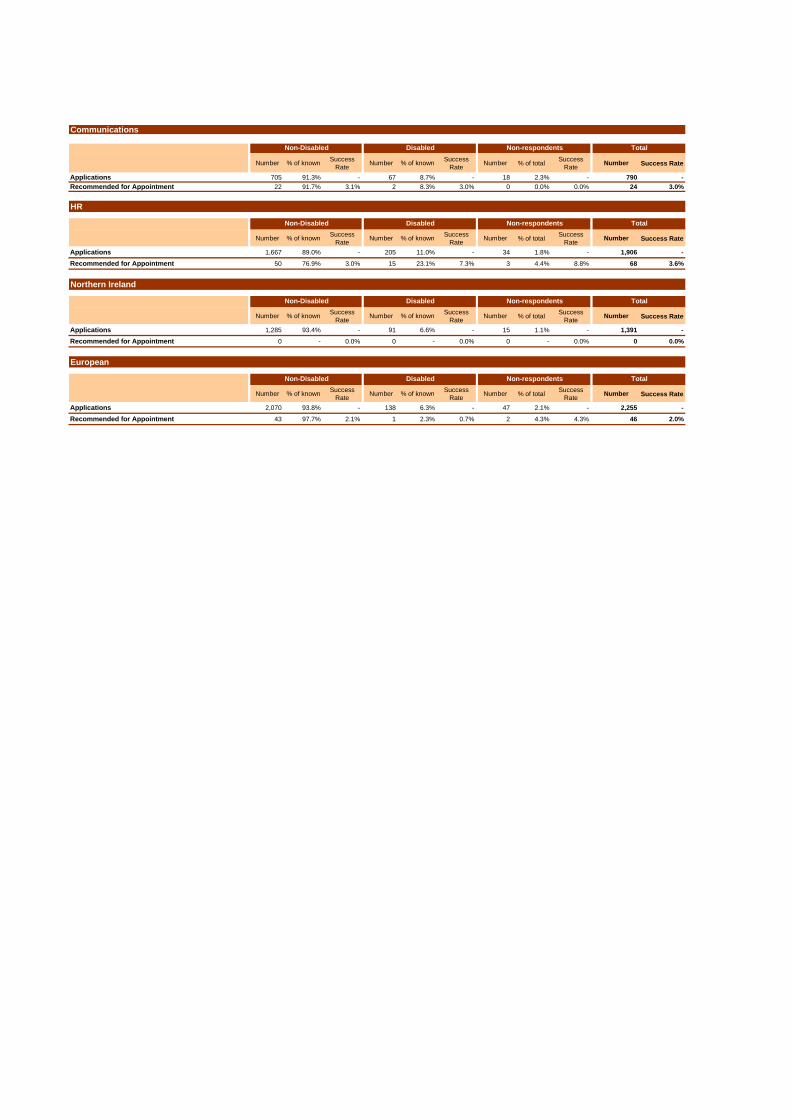
Communications
Number % of knownSuccess
RateNumber % of known
Success
RateNumber % of total
Success
RateNumber Success Rate
Applications 705 91.3% - 67 8.7% - 18 2.3% - 790 -
Recommended for Appointment 22 91.7% 3.1% 2 8.3% 3.0% 0 0.0% 0.0% 24 3.0%
HR
Number % of knownSuccess
RateNumber % of known
Success
RateNumber % of total
Success
RateNumber Success Rate
Applications 1,667 89.0% - 205 11.0% - 34 1.8% - 1,906 -
Recommended for Appointment 50 76.9% 3.0% 15 23.1% 7.3% 3 4.4% 8.8% 68 3.6%
Northern Ireland
Number % of knownSuccess
RateNumber % of known
Success
RateNumber % of total
Success
RateNumber Success Rate
Applications 1,285 93.4% - 91 6.6% - 15 1.1% - 1,391 -
Recommended for Appointment 0 - 0.0% 0 - 0.0% 0 - 0.0% 0 0.0%
European
Number % of knownSuccess
RateNumber % of known
Success
RateNumber % of total
Success
RateNumber Success Rate
Applications 2,070 93.8% - 138 6.3% - 47 2.1% - 2,255 -
Recommended for Appointment 43 97.7% 2.1% 1 2.3% 0.7% 2 4.3% 4.3% 46 2.0%
Non-Disabled Disabled Non-respondents Total
Non-Disabled Disabled Non-respondents Total
Non-Disabled Disabled Non-respondents Total
Non-Disabled Disabled Non-respondents Total

Trend
Disability
Number % of known* Number % of known* Number % of total Number % of known* Number % of known* Number % of total
2015 1077 18,738 90.6% 1,949 9.4% 448 2.1% 21,135 852 90.4% 90 9.6% 25 2.6% 967
2014 820 17,994 91.5% 1,661 8.5% 417 2.1% 20,072 803 90.2% 87 9.8% 25 2.7% 915
2013 782 16,345 92.5% 1,330 7.5% 291 1.6% 17,966 774 91.3% 74 8.7% 16 1.9% 864
2012 649 19,806 93.3% 1,414 6.7% 322 1.5% 21,542 556 86.3% 88 13.7% 10 1.5% 654
2011 354 17,252 94.9% 918 5.1% 191 1.0% 18,361 338 86.7% 52 13.3% 3 0.8% 393
2010 477 20,402 94.7% 1,136 5.3% 223 1.0% 21,761 398 86.3% 63 13.7% 4 0.9% 465
2009 585 14,091 95.3% 697 4.7% 123 0.8% 14,911 532 85.3% 92 14.7% 5 0.8% 629
2008 552 13,633 94.9% 738 5.1% 123 0.8% 14,494 490 87.2% 72 12.8% 8 1.4% 570
2007 427 13,132 96.4% 486 3.6% 1 0.0% 13,619 347 91.3% 33 8.7% 0 0.0% 380
2006 469 13,502 97.4% 356 2.6% 87 0.6% 13,945 438 92.6% 35 7.4% 3 0.6% 476
2005 497 12,546 97.5% 323 2.5% 88 0.7% 12,957 466 93.2% 34 6.8% 4 0.8% 504
2004** 507 8,324 96.8% 274 3.2% .. .. *8,598 433 92.7% 34 7.3% .. .. 467
2003 546 19,550 97.6% 482 2.4% .. .. 20,032 492 96.5% 18 3.5% .. .. 510
2002 509 14,061 98.1% 267 1.9% .. .. 14,328 395 96.1% 16 3.9% .. .. 411
2001 512 11,510 97.7% 267 2.3% .. .. 11,777 409 97.1% 12 2.9% .. .. 421
2000 560 14,210 98.6% 199 1.4% .. .. 14,409 418 98.1% 8 1.9% .. .. 426
1999 445 9,627 98.1% 187 1.9% .. .. 9,814 299 97.7% 7 2.3% .. .. 306
1998 367 8,875 98.2% 162 1.8% .. .. 9,037 223 94.9% 12 5.1% .. .. 235
Disabled Non-respondent
* In previous reports, percentages were calculated as a percentage of the total. From 2014 onwards percentages are calculated of the candidates that have declared their disability status. Historical
data has been adjusted to reflect this change and enable like-for-like comparison.
** The temporary fall in 2004 reflects the introduction of online self-assessment (if relevant), intended to discourage unrealistic applications. Since then, an application is deemed to have been
submitted only if the applicant has completed the self-assessment and proceeds to take the online tests.
Recommended for Appointment
TotalNon-Disabled Disabled Non-respondent Non-DisabledCompetition Vacancies
Applications
Total

Trend
Disability
ApplicationsRecommended
for AppointmentSuccess Rate Applications
Recommended
for AppointmentSuccess Rate Applications
Recommended
for AppointmentSuccess Rate Applications
Recommended
for AppointmentSuccess Rate
2015 1077 18,738 852 4.5% 1,949 90 4.6% 448 25 5.6% 21,135 967 4.6%
2014 820 17,994 803 4.5% 1,661 87 5.2% 417 25 6.0% 20,072 915 4.6%
2013 782 16,345 774 4.7% 1,330 74 5.6% 291 16 5.5% 17,966 864 4.8%
2012 649 19,806 556 2.8% 1,414 88 6.2% 322 10 3.1% 21,542 654 3.0%
2011 354 17,252 338 2.0% 918 52 5.7% 191 3 1.6% 18,361 393 2.1%
2010 477 20,402 398 2.0% 1,136 63 5.5% 223 4 1.8% 21,761 465 2.1%
2009 585 14,091 532 3.8% 697 92 13.2% 123 5 4.1% 14,911 629 4.2%
2008 552 13,633 490 3.6% 738 72 9.8% 123 8 6.5% 14,494 570 3.9%
2007 427 13,132 347 2.6% 486 33 6.8% 1 0 0.0% 13,619 380 2.8%
2006 469 13,502 438 3.2% 356 35 9.8% 87 3 3.4% 13,945 476 3.4%
2005 497 12,546 466 3.7% 323 34 10.5% 88 4 4.5% 12957 504 3.9%
2004* 507 8,324 433 5.2% 274 34 12.4% .. .. .. 8,598 467 5.4%
2003 546 19,550 492 2.5% 482 18 3.7% .. .. .. 20032 510 2.5%
2002 509 14,061 395 2.8% 267 16 6.0% .. .. .. 14,328 411 2.9%
2001 512 11,510 409 3.6% 267 12 4.5% .. .. .. 11777 421 3.6%
2000 560 14,210 418 2.9% 199 8 4.0% .. .. .. 14,409 426 3.0%
1999 445 9,627 299 3.1% 187 7 3.7% .. .. .. 9814 306 3.1%
1998 367 8,875 223 2.5% 162 12 7.4% .. .. .. 9,037 235 2.6%
Total
* The temporary fall in 2004 reflects the introduction of online self-assessment (if relevant), intended to discourage unrealistic applications. Since then, an application is deemed to have been submitted only if the applicant has completed
the self-assessment and proceeds to take the online tests.
Competition VacanciesNon-Disabled Disabled Non-respondents
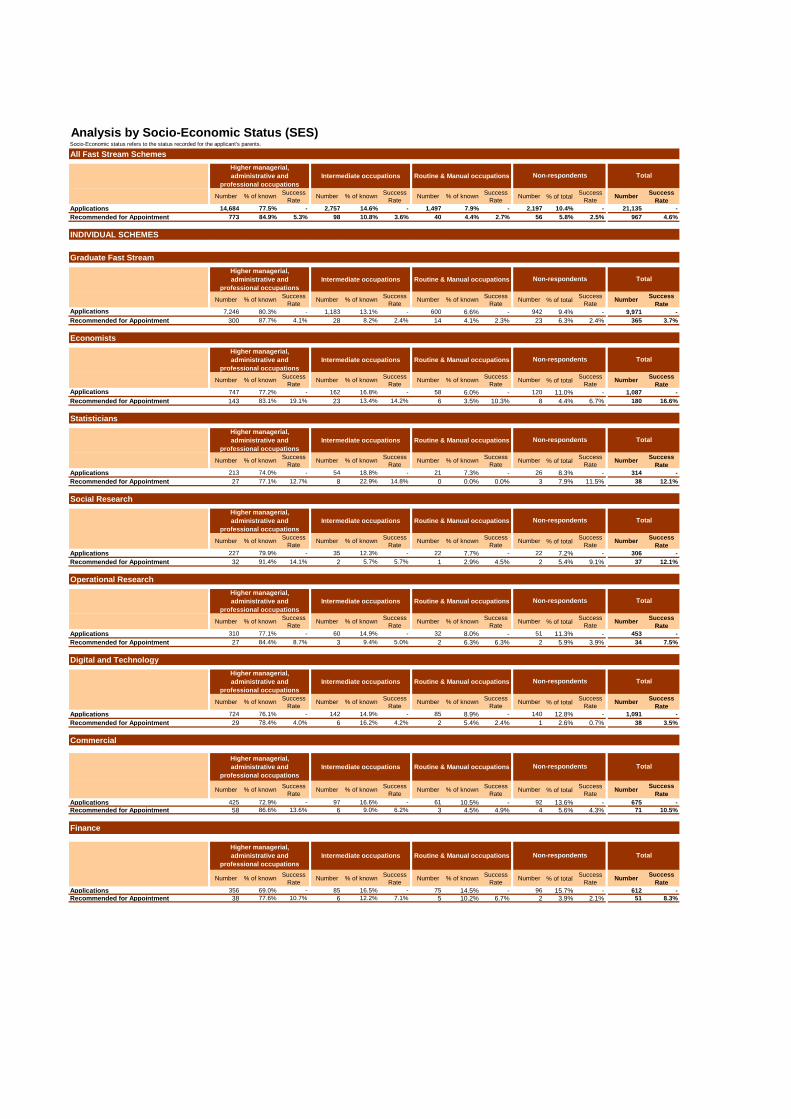
Analysis by Socio-Economic Status (SES)Socio-Economic status refers to the status recorded for the applicant's parents.
All Fast Stream Schemes
Number % of knownSuccess
RateNumber % of known
Success
RateNumber % of known
Success
RateNumber % of total
Success
RateNumber
Success
Rate
Applications 14,684 77.5% - 2,757 14.6% - 1,497 7.9% - 2,197 10.4% - 21,135 -
Recommended for Appointment 773 84.9% 5.3% 98 10.8% 3.6% 40 4.4% 2.7% 56 5.8% 2.5% 967 4.6%
INDIVIDUAL SCHEMES
Graduate Fast Stream
Number % of knownSuccess
RateNumber % of known
Success
RateNumber % of known
Success
RateNumber % of total
Success
RateNumber
Success
Rate
7,246 80.3% - 1,183 13.1% - 600 6.6% - 942 9.4% - 9,971 -
Recommended for Appointment 300 87.7% 4.1% 28 8.2% 2.4% 14 4.1% 2.3% 23 6.3% 2.4% 365 3.7%
Economists
Number % of knownSuccess
RateNumber % of known
Success
RateNumber % of known
Success
RateNumber % of total
Success
RateNumber
Success
Rate
747 77.2% - 162 16.8% - 58 6.0% - 120 11.0% - 1,087 -
Recommended for Appointment 143 83.1% 19.1% 23 13.4% 14.2% 6 3.5% 10.3% 8 4.4% 6.7% 180 16.6%
Statisticians
Number % of knownSuccess
RateNumber % of known
Success
RateNumber % of known
Success
RateNumber % of total
Success
RateNumber
Success
Rate
Applications 213 74.0% - 54 18.8% - 21 7.3% - 26 8.3% - 314 -
Recommended for Appointment 27 77.1% 12.7% 8 22.9% 14.8% 0 0.0% 0.0% 3 7.9% 11.5% 38 12.1%
Social Research
Number % of knownSuccess
RateNumber % of known
Success
RateNumber % of known
Success
RateNumber % of total
Success
RateNumber
Success
Rate
Applications 227 79.9% - 35 12.3% - 22 7.7% - 22 7.2% - 306 -
Recommended for Appointment 32 91.4% 14.1% 2 5.7% 5.7% 1 2.9% 4.5% 2 5.4% 9.1% 37 12.1%
Operational Research
Number % of knownSuccess
RateNumber % of known
Success
RateNumber % of known
Success
RateNumber % of total
Success
RateNumber
Success
Rate
Applications 310 77.1% - 60 14.9% - 32 8.0% - 51 11.3% - 453 -
Recommended for Appointment 27 84.4% 8.7% 3 9.4% 5.0% 2 6.3% 6.3% 2 5.9% 3.9% 34 7.5%
Digital and Technology
Number % of knownSuccess
RateNumber % of known
Success
RateNumber % of known
Success
RateNumber % of total
Success
RateNumber
Success
Rate
Applications 724 76.1% - 142 14.9% - 85 8.9% - 140 12.8% - 1,091 -
Recommended for Appointment 29 78.4% 4.0% 6 16.2% 4.2% 2 5.4% 2.4% 1 2.6% 0.7% 38 3.5%
Commercial
Number % of knownSuccess
RateNumber % of known
Success
RateNumber % of known
Success
RateNumber % of total
Success
RateNumber
Success
Rate
Applications 425 72.9% - 97 16.6% - 61 10.5% - 92 13.6% - 675 -
Recommended for Appointment 58 86.6% 13.6% 6 9.0% 6.2% 3 4.5% 4.9% 4 5.6% 4.3% 71 10.5%
Finance
Number % of knownSuccess
RateNumber % of known
Success
RateNumber % of known
Success
RateNumber % of total
Success
RateNumber
Success
Rate
Applications 356 69.0% - 85 16.5% - 75 14.5% - 96 15.7% - 612 -
Recommended for Appointment 38 77.6% 10.7% 6 12.2% 7.1% 5 10.2% 6.7% 2 3.9% 2.1% 51 8.3%
Higher managerial,
administrative and
professional occupations
Intermediate occupations Routine & Manual occupations Non-respondents Total
Higher managerial,
administrative and
professional occupations
Intermediate occupations Routine & Manual occupations Non-respondents Total
Higher managerial,
administrative and
professional occupations
Intermediate occupations Routine & Manual occupations Non-respondents Total
Higher managerial,
administrative and
professional occupations
Intermediate occupations Routine & Manual occupations Non-respondents Total
Higher managerial,
administrative and
professional occupations
Intermediate occupations Routine & Manual occupations Non-respondents Total
Total
Applications
Higher managerial,
administrative and
professional occupations
Intermediate occupations Routine & Manual occupations Non-respondents Total
Applications
Higher managerial,
administrative and
professional occupations
Intermediate occupations Routine & Manual occupations Non-respondents
Higher managerial,
administrative and
professional occupations
Intermediate occupations Routine & Manual occupations Non-respondents Total
Higher managerial,
administrative and
professional occupations
Intermediate occupations Routine & Manual occupations Non-respondents Total
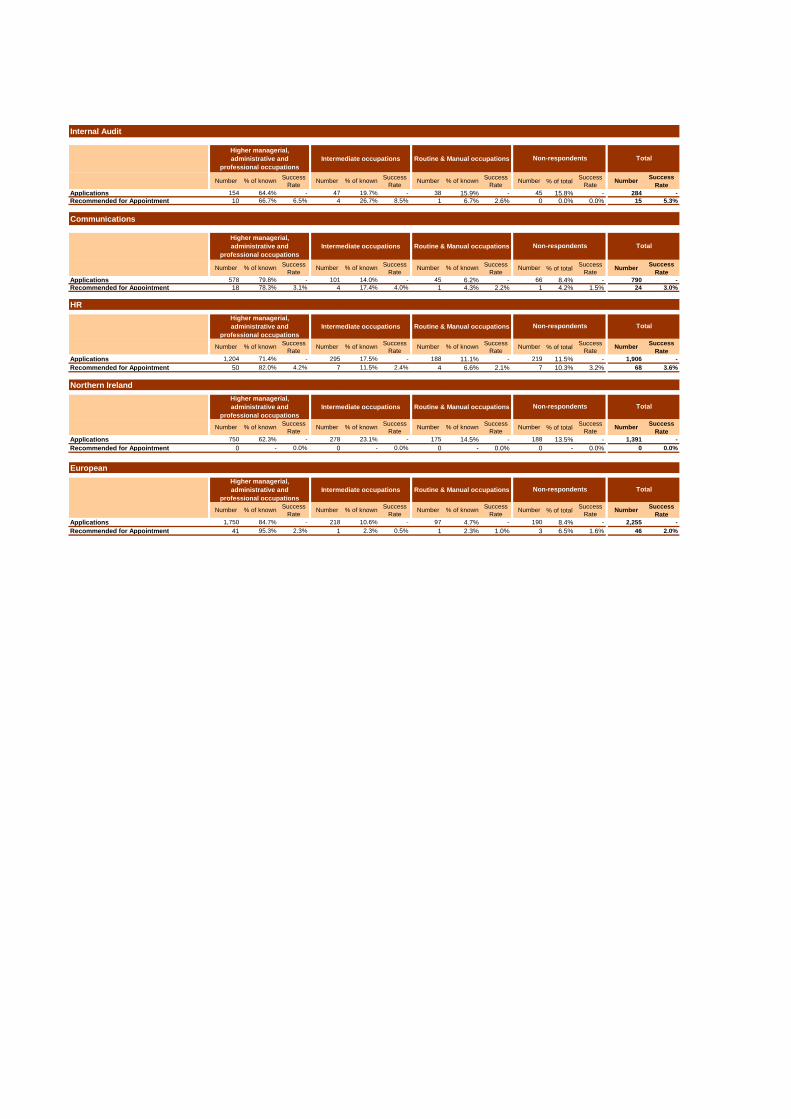
Internal Audit
Number % of knownSuccess
RateNumber % of known
Success
RateNumber % of known
Success
RateNumber % of total
Success
RateNumber
Success
Rate
Applications 154 64.4% - 47 19.7% - 38 15.9% - 45 15.8% - 284 -
Recommended for Appointment 10 66.7% 6.5% 4 26.7% 8.5% 1 6.7% 2.6% 0 0.0% 0.0% 15 5.3%
Communications
Number % of knownSuccess
RateNumber % of known
Success
RateNumber % of known
Success
RateNumber % of total
Success
RateNumber
Success
Rate
Applications 578 79.8% - 101 14.0% - 45 6.2% - 66 8.4% - 790 -
Recommended for Appointment 18 78.3% 3.1% 4 17.4% 4.0% 1 4.3% 2.2% 1 4.2% 1.5% 24 3.0%
HR
Number % of knownSuccess
RateNumber % of known
Success
RateNumber % of known
Success
RateNumber % of total
Success
RateNumber
Success
Rate
Applications 1,204 71.4% - 295 17.5% - 188 11.1% - 219 11.5% - 1,906 -
Recommended for Appointment 50 82.0% 4.2% 7 11.5% 2.4% 4 6.6% 2.1% 7 10.3% 3.2% 68 3.6%
Northern Ireland
Number % of knownSuccess
RateNumber % of known
Success
RateNumber % of known
Success
RateNumber % of total
Success
RateNumber
Success
Rate
Applications 750 62.3% - 278 23.1% - 175 14.5% - 188 13.5% - 1,391 -
Recommended for Appointment - 0 - 0.0% 0 - 0.0% 0 - 0.0% 0 - 0.0% 0 0.0%
European
Number % of knownSuccess
RateNumber % of known
Success
RateNumber % of known
Success
RateNumber % of total
Success
RateNumber
Success
Rate
Applications 1,750 84.7% - 218 10.6% - 97 4.7% - 190 8.4% - 2,255 -
Recommended for Appointment 41 95.3% 2.3% 1 2.3% 0.5% 1 2.3% 1.0% 3 6.5% 1.6% 46 2.0%
Higher managerial,
administrative and
professional occupations
Intermediate occupations Routine & Manual occupations Non-respondents Total
Higher managerial,
administrative and
professional occupations
Intermediate occupations Routine & Manual occupations Non-respondents Total
Higher managerial,
administrative and
professional occupations
Intermediate occupations Routine & Manual occupations Non-respondents Total
Higher managerial,
administrative and
professional occupations
Intermediate occupations Routine & Manual occupations Non-respondents Total
Higher managerial,
administrative and
professional occupations
Intermediate occupations Routine & Manual occupations Non-respondents Total

Trend
Socio-Economic Status
Number % of known* Number % of known* Number % of known* Number % of total Number % of known* Number % of known* Number % of known* Number % of total
2015 1077 14,684 77.5% 2,757 14.6% 1,497 7.9% 2,197 10.4% 21,135 773 84.9% 98 10.8% 40 4.4% 56 5.8% 967
2014 820 14,052 77.4% 2,646 14.6% 1,464 8.1% 1,910 9.5% 20,072 711 83.2% 106 12.4% 38 4.4% 60 6.6% 915
2013 782 12,746 78.4% 2,284 14.0% 1,238 7.6% 1,698 9.5% 17,966 678 83.9% 100 12.4% 30 3.7% 56 6.5% 864
2012 649 15,202 78.0% 2,754 14.1% 1,522 7.8% 2,064 9.6% 21,542 531 86.3% 59 9.6% 25 4.1% 39 6.0% 654
2011 354 12,916 79.1% 2,294 14.1% 1,117 6.8% 2,034 11.1% 18,361 310 87.3% 35 9.9% 10 2.8% 38 9.7% 393
* In previous reports, percentages were calculated as a percentage of the total. From 2014 onwards percentages are calculated of the candidates that have declared their ethnicity. Historical data has been adjusted to reflect this change and
enable like-for-like comparison.
Higher managerial,
administrative and
professional
occupations
Intermediate
occupations
Routine & Manual
occupationsCompetition Vacancies
Recommended for Appointment
Total
Higher managerial,
administrative and
professional
occupations
Intermediate
occupationsTotal Non-respondents
Routine & Manual
occupationsNon-respondents
Applications
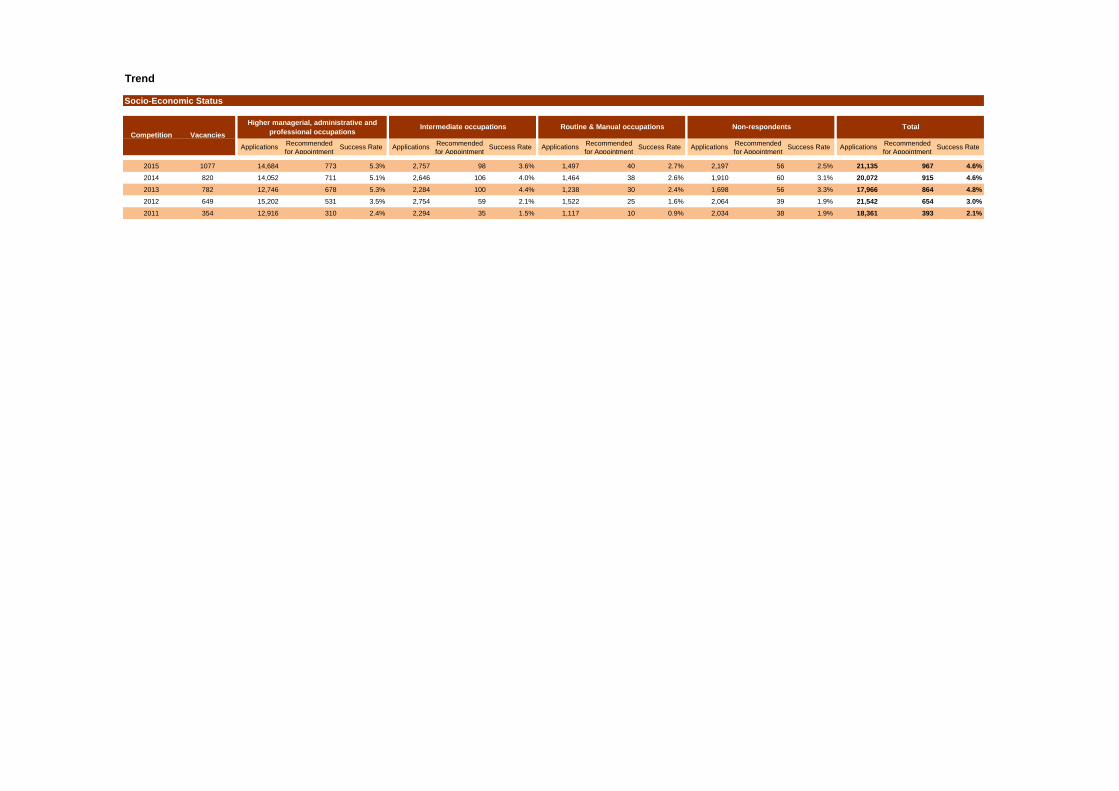
Trend
Socio-Economic Status
ApplicationsRecommended
for AppointmentSuccess Rate Applications
Recommended
for AppointmentSuccess Rate Applications
Recommended
for AppointmentSuccess Rate Applications
Recommended
for AppointmentSuccess Rate Applications
Recommended
for AppointmentSuccess Rate
2015 1077 14,684 773 5.3% 2,757 98 3.6% 1,497 40 2.7% 2,197 56 2.5% 21,135 967 4.6%
2014 820 14,052 711 5.1% 2,646 106 4.0% 1,464 38 2.6% 1,910 60 3.1% 20,072 915 4.6%
2013 782 12,746 678 5.3% 2,284 100 4.4% 1,238 30 2.4% 1,698 56 3.3% 17,966 864 4.8%
2012 649 15,202 531 3.5% 2,754 59 2.1% 1,522 25 1.6% 2,064 39 1.9% 21,542 654 3.0%
2011 354 12,916 310 2.4% 2,294 35 1.5% 1,117 10 0.9% 2,034 38 1.9% 18,361 393 2.1%
Non-respondents TotalCompetition Vacancies
Higher managerial, administrative and
professional occupationsIntermediate occupations Routine & Manual occupations
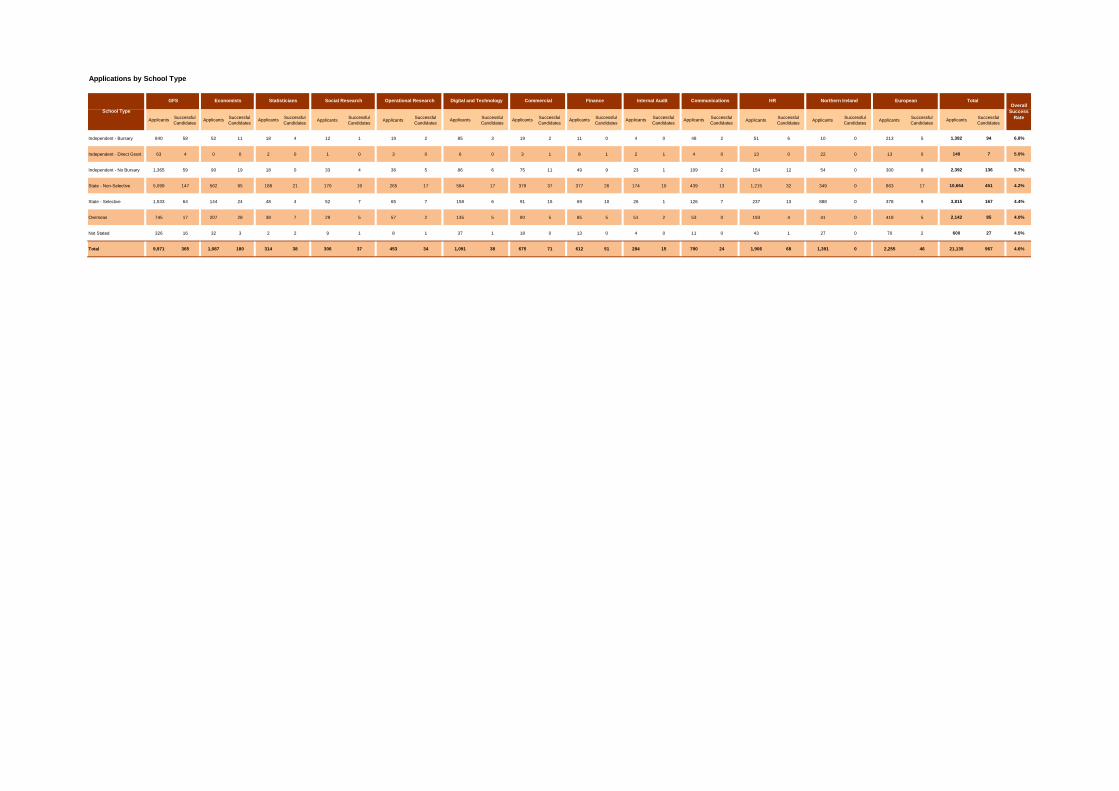
Applications by School Type
ApplicantsSuccessful
CandidatesApplicants
Successful
CandidatesApplicants
Successful
CandidatesApplicants
Successful
CandidatesApplicants
Successful
CandidatesApplicants
Successful
CandidatesApplicants
Successful
CandidatesApplicants
Successful
CandidatesApplicants
Successful
CandidatesApplicants
Successful
CandidatesApplicants
Successful
CandidatesApplicants
Successful
CandidatesApplicants
Successful
CandidatesApplicants
Successful
Candidates
Independent - Bursary 840 58 52 11 18 4 12 1 19 2 85 3 19 2 11 0 4 0 48 2 51 6 10 0 213 5 1,382 94 6.8%
Independent - Direct Grant 63 4 0 0 2 0 1 0 3 0 6 0 3 1 8 1 2 1 4 0 13 0 22 0 13 0 140 7 5.0%
Independent - No Bursary 1,365 59 90 19 18 0 33 4 36 5 86 6 75 11 49 9 23 1 109 2 154 12 54 0 300 8 2,392 136 5.7%
State - Non-Selective 5,099 147 562 95 188 21 170 19 265 17 584 17 379 37 377 26 174 10 439 13 1,215 32 349 0 863 17 10,664 451 4.2%
State - Selective 1,533 64 144 24 48 4 52 7 65 7 158 6 91 15 69 10 26 1 126 7 237 13 888 0 378 9 3,815 167 4.4%
Overseas 745 17 207 28 38 7 29 5 57 2 135 5 90 5 85 5 51 2 53 0 193 4 41 0 418 5 2,142 85 4.0%
Not Stated 326 16 32 3 2 2 9 1 8 1 37 1 18 0 13 0 4 0 11 0 43 1 27 0 70 2 600 27 4.5%
Total 9,971 365 1,087 180 314 38 306 37 453 34 1,091 38 675 71 612 51 284 15 790 24 1,906 68 1,391 0 2,255 46 21,135 967 4.6%
Digital and Technology HR Northern Ireland European TotalOverall
Success
Rate
Commercial Finance Internal Audit CommunicationsOperational Research
School Type
GFS Economists Statisticians Social Research

Analysis by Sexual Orientation
All Fast Stream Schemes
Number% of
known
Success
RateNumber
% of
known
Success
RateNumber
% of
known
Success
RateNumber % of total
Success
RateNumber
Success
Rate
Applications 1,337 6.9% - 18,068 92.8% - 63 0.3% - 1,667 7.9% - 21,135 -
Recommended for Appointment 68 7.8% 5.1% 803 91.9% 4.4% 3 0.3% 4.8% 93 9.6% 5.6% 967 4.6%
INDIVIDUAL SCHEMES
Graduate Fast Stream
Number% of
known
Success
RateNumber
% of
known
Success
RateNumber
% of
known
Success
RateNumber % of total
Success
RateNumber
Success
Rate
682 7.5% - 8,335 92.1% - 33 0.4% - 921 9.2% - 9,971 -
Recommended for Appointment 21 6.5% 3.1% 300 92.9% 3.6% 2 0.6% 6.1% 42 11.5% 4.6% 365 3.7%
Economists
Number% of
known
Success
RateNumber
% of
known
Success
RateNumber
% of
known
Success
RateNumber % of total
Success
RateNumber
Success
Rate
35 3.5% - 978 96.5% - 0 0.0% - 74 6.8% - 1,087 -
Recommended for Appointment 12 7.5% 34.3% 149 92.5% 15.2% 0 0.0% - 19 10.6% 25.7% 180 16.6%
Statisticians
Number% of
known
Success
RateNumber
% of
known
Success
RateNumber
% of
known
Success
RateNumber % of total
Success
RateNumber
Success
Rate
Applications 14 4.6% - 287 95.0% - 1 0.3% - 12 3.8% - 314 -
Recommended for Appointment 3 8.3% 21.4% 33 91.7% 11.5% 0 0.0% 0.0% 2 5.3% 16.7% 38 12.1%
Social Research
Number% of
known
Success
RateNumber
% of
known
Success
RateNumber
% of
known
Success
RateNumber % of total
Success
RateNumber
Success
Rate
Applications 23 8.1% - 259 91.2% - 2 0.7% - 22 7.2% - 306 -
Recommended for Appointment 2 6.1% 8.7% 30 90.9% 11.6% 1 3.0% 50.0% 4 10.8% 18.2% 37 12.1%
Operational Research
Number% of
known
Success
RateNumber
% of
known
Success
RateNumber
% of
known
Success
RateNumber % of total
Success
RateNumber
Success
Rate
Applications 23 5.5% - 394 94.0% - 2 0.5% - 34 7.5% - 453 -
Recommended for Appointment 2 6.5% 8.7% 29 93.5% 7.4% 0 0.0% 0.0% 3 8.8% 8.8% 34 7.5%
Digital and Technology
Number% of
known
Success
RateNumber
% of
known
Success
RateNumber
% of
known
Success
RateNumber % of total
Success
RateNumber
Success
Rate
Applications 97 10.0% - 873 89.8% - 2 0.2% - 119 10.9% - 1,091 -
Recommended for Appointment 6 18.8% 6.2% 26 81.3% 3.0% 0 0.0% 0.0% 6 15.8% 5.0% 38 3.5%
Commercial
Number% of
known
Success
RateNumber
% of
known
Success
RateNumber
% of
known
Success
RateNumber % of total
Success
RateNumber
Success
Rate
Applications 35 5.5% - 601 94.5% - 0 0.0% - 39 5.8% - 675 -
Recommended for Appointment 7 10.6% 20.0% 59 89.4% 9.8% 0 0.0% - 5 7.0% 12.8% 71 10.5%
Finance
Number% of
known
Success
RateNumber
% of
known
Success
RateNumber
% of
known
Success
RateNumber % of total
Success
RateNumber
Success
Rate
Applications 12 2.0% - 578 98.0% - 0 0.0% - 22 3.6% - 612 -
Recommended for Appointment 2 4.0% 16.7% 48 96.0% 8.3% 0 0.0% - 1 2.0% 4.5% 51 8.3%
Internal Audit
Number% of
known
Success
RateNumber
% of
known
Success
RateNumber
% of
known
Success
RateNumber % of total
Success
RateNumber
Success
Rate
Applications 10 3.6% - 265 96.4% - 0 0.0% - 9 3.2% - 284 -
Recommended for Appointment 2 14.3% 20.0% 12 85.7% 4.5% 0 0.0% - 1 6.7% 11.1% 15 5.3%
Bisexual/Gay Man/Gay
Woman/LesbianHeterosexual/Straight Other Prefer Not to Say Total
Bisexual/Gay Man/Gay
Woman/LesbianHeterosexual/Straight Other Prefer Not to Say Total
Bisexual/Gay Man/Gay
Woman/LesbianHeterosexual/Straight Other Prefer Not to Say Total
Bisexual/Gay Man/Gay
Woman/LesbianHeterosexual/Straight Other Prefer Not to Say Total
Bisexual/Gay Man/Gay
Woman/LesbianHeterosexual/Straight Other Prefer Not to Say Total
Bisexual/Gay Man/Gay
Woman/LesbianHeterosexual/Straight Other Prefer Not to Say Total
Total
Applications
Bisexual/Gay Man/Gay
Woman/LesbianHeterosexual/Straight Other Prefer Not to Say Total
Applications
Bisexual/Gay Man/Gay
Woman/LesbianHeterosexual/Straight Other Prefer Not to Say
Bisexual/Gay Man/Gay
Woman/LesbianHeterosexual/Straight Other Prefer Not to Say Total
Bisexual/Gay Man/Gay
Woman/LesbianHeterosexual/Straight Other Prefer Not to Say Total

Communications
Number% of
known
Success
RateNumber
% of
known
Success
RateNumber
% of
known
Success
RateNumber % of total
Success
RateNumber
Success
Rate
Applications 47 6.4% - 685 93.1% - 4 0.5% - 54 6.8% - 790 -
Recommended for Appointment 3 13.0% 6.4% 20 87.0% 2.9% 0 0.0% 0.0% 1 4.2% 1.9% 24 3.0%
HR
Number% of
known
Success
RateNumber
% of
known
Success
RateNumber
% of
known
Success
RateNumber % of total
Success
RateNumber
Success
Rate
Applications 107 5.8% - 1,726 93.8% - 7 0.4% - 66 3.5% - 1,906 -
Recommended for Appointment 7 10.9% 6.5% 57 89.1% 3.3% 0 0.0% 0.0% 4 5.9% 6.1% 68 3.6%
Northern Ireland
Number% of
known
Success
RateNumber
% of
known
Success
RateNumber
% of
known
Success
RateNumber % of total
Success
RateNumber
Success
Rate
Applications 47 3.5% - 1,297 96.4% - 1 0.1% - 46 3.3% - 1,391 -
Recommended for Appointment - 0 - 0.0% 0 - 0.0% 0 - 0.0% 0 - 0.0% 0 0.0%
European
Number% of
known
Success
RateNumber
% of
known
Success
RateNumber
% of
known
Success
RateNumber % of total
Success
RateNumber
Success
Rate
Applications 205 10.2% - 1,790 89.2% - 11 0.5% - 249 11.0% - 2,255 -
Recommended for Appointment 1 2.4% 0.5% 40 97.6% 2.2% 0 0.0% 0.0% 5 10.9% 2.0% 46 2.0%
Bisexual/Gay Man/Gay
Woman/LesbianHeterosexual/Straight Other Prefer Not to Say Total
Bisexual/Gay Man/Gay
Woman/LesbianHeterosexual/Straight Other Prefer Not to Say Total
Bisexual/Gay Man/Gay
Woman/LesbianHeterosexual/Straight Other Prefer Not to Say Total
Bisexual/Gay Man/Gay
Woman/LesbianHeterosexual/Straight Other Prefer Not to Say Total

Trend
Sexual Orientation
Number % of known* Number % of known* Number % of known* Number % of total Number % of known* Number % of known* Number % of known* Number % of total
2015 1077 1,337 6.9% 18,068 92.8% 63 0.3% 1,667 7.9% 21,135 68 7.8% 803 91.9% 3 0.3% 93 9.6% 967
2014 820 1,116 6.0% 17,359 93.7% 45 0.2% 1,552 7.7% 20,072 70 8.5% 752 91.0% 4 0.5% 89 9.7% 915
Total Prefer not to sayOther Prefer not to say
Applications
* In previous reports, percentages were calculated as a percentage of the total. From 2014 onwards percentages are calculated of the candidates that have declared their ethnicity. Historical data has been adjusted to reflect this change and
enable like-for-like comparison.
Bisexual/Gay Man/Gay
Woman/Lesbian
Heterosexual/
StraightOtherCompetition Vacancies
Recommended for Appointment
TotalBisexual/Gay Man/Gay
Woman/Lesbian
Heterosexual/
Straight

Trend
Sexual Orientation
ApplicationsRecommended
for AppointmentSuccess Rate Applications
Recommended
for AppointmentSuccess Rate Applications
Recommended
for AppointmentSuccess Rate Applications
Recommended
for AppointmentSuccess Rate Applications
Recommended
for AppointmentSuccess Rate
2015 1077 1,337 68 5.1% 18,068 803 4.4% 63 3 4.8% 1,667 93 5.6% 21,135 967 4.6%
2014 820 1,116 70 6.3% 17,359 752 4.3% 45 4 8.9% 1,552 89 5.7% 20,072 915 4.6%
Prefer not to say Total
Competition VacanciesBisexual/ Gay Man/ Gay Woman/ Lesbian Heterosexual/Straight Other
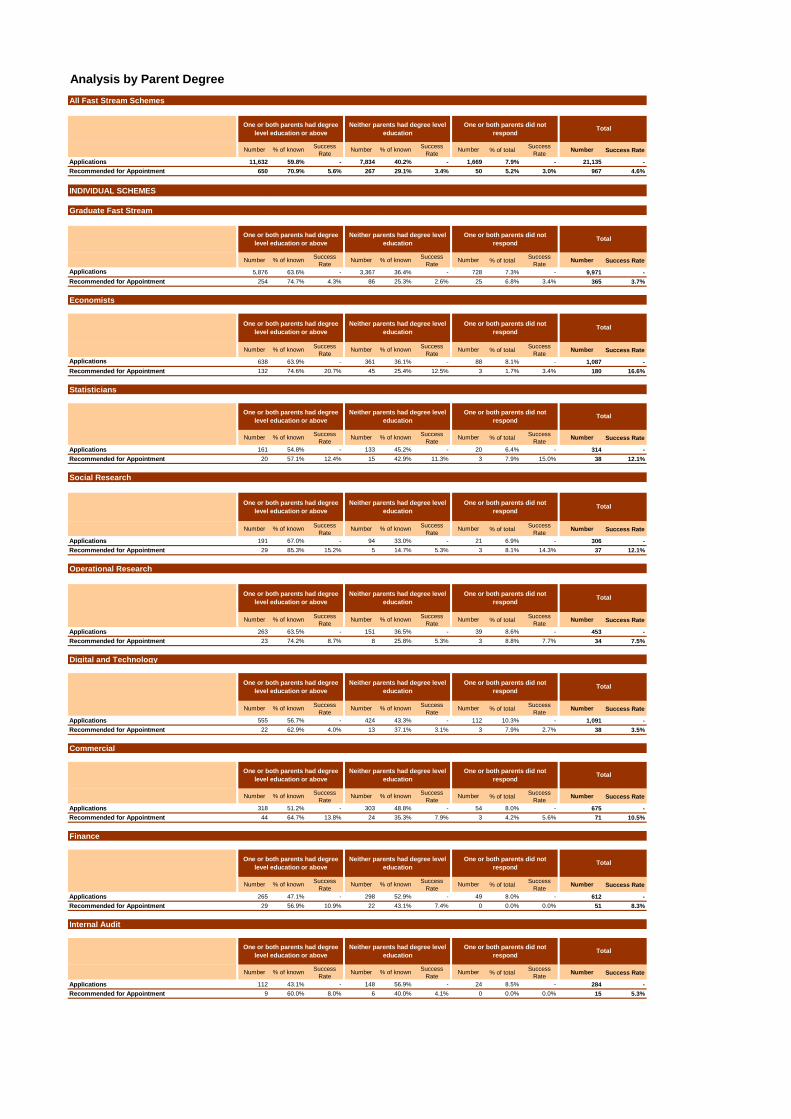
Analysis by Parent Degree
All Fast Stream Schemes
Number % of knownSuccess
RateNumber % of known
Success
RateNumber % of total
Success
RateNumber Success Rate
Applications 11,632 59.8% - 7,834 40.2% - 1,669 7.9% - 21,135 -
Recommended for Appointment 650 70.9% 5.6% 267 29.1% 3.4% 50 5.2% 3.0% 967 4.6%
INDIVIDUAL SCHEMES
Graduate Fast Stream
Number % of knownSuccess
RateNumber % of known
Success
RateNumber % of total
Success
RateNumber Success Rate
5,876 63.6% - 3,367 36.4% - 728 7.3% - 9,971 -
Recommended for Appointment 254 74.7% 4.3% 86 25.3% 2.6% 25 6.8% 3.4% 365 3.7%
Economists
Number % of knownSuccess
RateNumber % of known
Success
RateNumber % of total
Success
RateNumber Success Rate
638 63.9% - 361 36.1% - 88 8.1% - 1,087 -
Recommended for Appointment 132 74.6% 20.7% 45 25.4% 12.5% 3 1.7% 3.4% 180 16.6%
Statisticians
Number % of knownSuccess
RateNumber % of known
Success
RateNumber % of total
Success
RateNumber Success Rate
Applications 161 54.8% - 133 45.2% - 20 6.4% - 314 -
Recommended for Appointment 20 57.1% 12.4% 15 42.9% 11.3% 3 7.9% 15.0% 38 12.1%
Social Research
Number % of knownSuccess
RateNumber % of known
Success
RateNumber % of total
Success
RateNumber Success Rate
Applications 191 67.0% - 94 33.0% - 21 6.9% - 306 -
Recommended for Appointment 29 85.3% 15.2% 5 14.7% 5.3% 3 8.1% 14.3% 37 12.1%
Operational Research
Number % of knownSuccess
RateNumber % of known
Success
RateNumber % of total
Success
RateNumber Success Rate
Applications 263 63.5% - 151 36.5% - 39 8.6% - 453 -
Recommended for Appointment 23 74.2% 8.7% 8 25.8% 5.3% 3 8.8% 7.7% 34 7.5%
Digital and Technology
Number % of knownSuccess
RateNumber % of known
Success
RateNumber % of total
Success
RateNumber Success Rate
Applications 555 56.7% - 424 43.3% - 112 10.3% - 1,091 -
Recommended for Appointment 22 62.9% 4.0% 13 37.1% 3.1% 3 7.9% 2.7% 38 3.5%
Commercial
Number % of knownSuccess
RateNumber % of known
Success
RateNumber % of total
Success
RateNumber Success Rate
Applications 318 51.2% - 303 48.8% - 54 8.0% - 675 -
Recommended for Appointment 44 64.7% 13.8% 24 35.3% 7.9% 3 4.2% 5.6% 71 10.5%
Finance
Number % of knownSuccess
RateNumber % of known
Success
RateNumber % of total
Success
RateNumber Success Rate
Applications 265 47.1% - 298 52.9% - 49 8.0% - 612 -
Recommended for Appointment 29 56.9% 10.9% 22 43.1% 7.4% 0 0.0% 0.0% 51 8.3%
Internal Audit
Number % of knownSuccess
RateNumber % of known
Success
RateNumber % of total
Success
RateNumber Success Rate
Applications 112 43.1% - 148 56.9% - 24 8.5% - 284 -
Recommended for Appointment 9 60.0% 8.0% 6 40.0% 4.1% 0 0.0% 0.0% 15 5.3%
Applications
One or both parents had degree
level education or above
Neither parents had degree level
education
One or both parents did not
respondTotal
One or both parents had degree
level education or above
Neither parents had degree level
education
One or both parents did not
respondTotal
Applications
One or both parents had degree
level education or above
Neither parents had degree level
education
One or both parents did not
respondTotal
One or both parents had degree
level education or above
Neither parents had degree level
education
One or both parents did not
respondTotal
One or both parents had degree
level education or above
Neither parents had degree level
education
One or both parents did not
respondTotal
One or both parents had degree
level education or above
Neither parents had degree level
education
One or both parents did not
respondTotal
One or both parents had degree
level education or above
Neither parents had degree level
education
One or both parents did not
respondTotal
One or both parents had degree
level education or above
Neither parents had degree level
education
One or both parents did not
respondTotal
One or both parents had degree
level education or above
Neither parents had degree level
education
One or both parents did not
respondTotal
One or both parents had degree
level education or above
Neither parents had degree level
education
One or both parents did not
respondTotal

Communications
Number % of knownSuccess
RateNumber % of known
Success
RateNumber % of total
Success
RateNumber Success Rate
Applications 441 60.4% - 289 39.6% - 60 7.6% - 790 -
Recommended for Appointment 13 56.5% 2.9% 10 43.5% 3.5% 1 4.2% 1.7% 24 3.0%
HR
Number % of knownSuccess
RateNumber % of known
Success
RateNumber % of total
Success
RateNumber Success Rate
Applications 806 46.6% - 922 53.4% - 178 9.3% - 1,906 -
Recommended for Appointment 36 56.3% 4.5% 28 43.8% 3.0% 4 5.9% 2.2% 68 3.6%
Northern Ireland
Number % of knownSuccess
RateNumber % of known
Success
RateNumber % of total
Success
RateNumber Success Rate
Applications 476 38.6% - 758 61.4% - 157 11.3% - 1,391 -
Recommended for Appointment 0 - 0.0% 0 - 0.0% 0 - 0.0% 0 0.0%
European
Number % of knownSuccess
RateNumber % of known
Success
RateNumber % of total
Success
RateNumber Success Rate
Applications 1,530 72.3% - 586 27.7% - 139 6.2% - 2,255 -
Recommended for Appointment 39 88.6% 2.5% 5 11.4% 0.9% 2 4.3% 1.4% 46 2.0%
One or both parents had degree
level education or above
Neither parents had degree level
education
One or both parents did not
respondTotal
One or both parents had degree
level education or above
Neither parents had degree level
education
One or both parents did not
respondTotal
One or both parents had degree
level education or above
Neither parents had degree level
education
One or both parents did not
respondTotal
One or both parents had degree
level education or above
Neither parents had degree level
education
One or both parents did not
respondTotal

Analysis by Eligibility for Free School Meals
All Fast Stream Schemes
Number % of knownSuccess
RateNumber % of known
Success
RateNumber % of total
Success
RateNumber Success Rate
Applications 17,042 86.7% - 2,612 13.3% - 1,481 7.0% - 21,135 -
Recommended for Appointment 828 91.4% 4.9% 78 8.6% 3.0% 61 6.3% 4.1% 967 4.6%
INDIVIDUAL SCHEMES
Graduate Fast Stream
Number % of knownSuccess
RateNumber % of known
Success
RateNumber % of total
Success
RateNumber Success Rate
8,085 87.5% - 1,150 12.5% - 736 7.4% - 9,971 -
Recommended for Appointment 305 91.0% 3.8% 30 9.0% 2.6% 30 8.2% 4.1% 365 3.7%
Economists
Number % of knownSuccess
RateNumber % of known
Success
RateNumber % of total
Success
RateNumber Success Rate
886 88.1% - 120 11.9% - 81 7.5% - 1,087 -
Recommended for Appointment 159 92.4% 17.9% 13 7.6% 10.8% 8 4.4% 9.9% 180 16.6%
Statisticians
Number % of knownSuccess
RateNumber % of known
Success
RateNumber % of total
Success
RateNumber Success Rate
Applications 271 92.2% - 23 7.8% - 20 6.4% - 314 -
Recommended for Appointment 33 97.1% 12.2% 1 2.9% 4.3% 4 10.5% 20.0% 38 12.1%
Social Research
Number % of knownSuccess
RateNumber % of known
Success
RateNumber % of total
Success
RateNumber Success Rate
Applications 253 90.0% - 28 10.0% - 25 8.2% - 306 -
Recommended for Appointment 35 100.0% 13.8% 0 0.0% 0.0% 2 5.4% 8.0% 37 12.1%
Operational Research
Number % of knownSuccess
RateNumber % of known
Success
RateNumber % of total
Success
RateNumber Success Rate
Applications 369 88.1% - 50 11.9% - 34 7.5% - 453 -
Recommended for Appointment 30 93.8% 8.1% 2 6.3% 4.0% 2 5.9% 5.9% 34 7.5%
Digital and Technology
Number % of knownSuccess
RateNumber % of known
Success
RateNumber % of total
Success
RateNumber Success Rate
Applications 816 83.2% - 165 16.8% - 110 10.1% - 1,091 -
Recommended for Appointment 32 91.4% 3.9% 3 8.6% 1.8% 3 7.9% 2.7% 38 3.5%
Commercial
Number % of knownSuccess
RateNumber % of known
Success
RateNumber % of total
Success
RateNumber Success Rate
Applications 520 82.4% - 111 17.6% - 44 6.5% - 675 -
Recommended for Appointment 58 84.1% 11.2% 11 15.9% 9.9% 2 2.8% 4.5% 71 10.5%
Finance
Number % of knownSuccess
RateNumber % of known
Success
RateNumber % of total
Success
RateNumber Success Rate
Applications 470 82.5% - 100 17.5% - 42 6.9% - 612 -
Recommended for Appointment 44 89.8% 9.4% 5 10.2% 5.0% 2 3.9% 4.8% 51 8.3%
Internal Audit
Number % of knownSuccess
RateNumber % of known
Success
RateNumber % of total
Success
RateNumber Success Rate
Applications 204 77.0% - 61 23.0% - 19 6.7% - 284 -
Recommended for Appointment 13 86.7% 6.4% 2 13.3% 3.3% 0 0.0% 0.0% 15 5.3%
Applications
Not Eligible for Free School
MealsEligible for Free School Meals Non-respondents Total
Not Eligible for Free School
MealsEligible for Free School Meals Non-respondents Total
Applications
Not Eligible for Free School
MealsEligible for Free School Meals Non-respondents Total
Not Eligible for Free School
MealsEligible for Free School Meals Non-respondents Total
Not Eligible for Free School
MealsEligible for Free School Meals Non-respondents Total
Not Eligible for Free School
MealsEligible for Free School Meals Non-respondents Total
Not Eligible for Free School
MealsEligible for Free School Meals Non-respondents Total
Not Eligible for Free School
MealsEligible for Free School Meals Non-respondents Total
Not Eligible for Free School
MealsEligible for Free School Meals Non-respondents Total
Not Eligible for Free School
MealsEligible for Free School Meals Non-respondents Total

Communications
Number % of knownSuccess
RateNumber % of known
Success
RateNumber % of total
Success
RateNumber Success Rate
Applications 670 89.5% - 79 10.5% - 41 5.2% - 790 -
Recommended for Appointment 19 79.2% 2.8% 5 20.8% 6.3% 0 0.0% 0.0% 24 3.0%
HR
Number % of knownSuccess
RateNumber % of known
Success
RateNumber % of total
Success
RateNumber Success Rate
Applications 1,519 83.9% - 291 16.1% - 96 5.0% - 1,906 -
Recommended for Appointment 58 90.6% 3.8% 6 9.4% 2.1% 4 5.9% 4.2% 68 3.6%
Northern Ireland
Number % of knownSuccess
RateNumber % of known
Success
RateNumber % of total
Success
RateNumber Success Rate
Applications 1,093 81.8% - 243 18.2% - 55 4.0% - 1,391 -
Recommended for Appointment 0 - 0.0% 0 - 0.0% 0 - 0.0% 0 0.0%
European
Number % of knownSuccess
RateNumber % of known
Success
RateNumber % of total
Success
RateNumber Success Rate
Applications 1,886 90.8% - 191 9.2% - 178 7.9% - 2,255 -
Recommended for Appointment 42 100.0% 2.2% 0 0.0% 0.0% 4 8.7% 2.2% 46 2.0%
Not Eligible for Free School
MealsEligible for Free School Meals Non-respondents Total
Not Eligible for Free School
MealsEligible for Free School Meals Non-respondents Total
Not Eligible for Free School
MealsEligible for Free School Meals Non-respondents Total
Not Eligible for Free School
MealsEligible for Free School Meals Non-respondents Total

Trend
Free School Meals
Number % of known Number % of known Number % of total Number % of known Number % of known Number % of total
2015 1077 17,042 86.7% 2,612 13.3% 1,481 7.0% 21,135 828 91.4% 78 8.6% 61 6.3% 967
2014 820 16,301 87.3% 2,382 12.7% 1,389 6.9% 20,072 760 90.2% 83 9.8% 72 7.9% 915
TotalNot Eligible for Free
School Meals
Eligible for Free
School MealsNon-respondents
Not Eligible for Free
School Meals
Eligible for Free
School MealsNon-respondents
Recommended for Appointment
Competition Vacancies
Applications
Total

Trend
Free School Meals
ApplicationsRecommended
for AppointmentSuccess Rate Applications
Recommended
for AppointmentSuccess Rate Applications
Recommended
for AppointmentSuccess Rate Applications
Recommended
for AppointmentSuccess Rate
2015 1077 17,042 828 4.9% 2,612 78 3.0% 1,481 61 4.1% 21,135 967 4.6%
2014 820 16,301 760 4.7% 2,382 83 3.5% 1,389 72 5.2% 20,072 915 4.6%
TotalCompetition Vacancies
Not Eligible for Free School Meals Eligible for Free School Meals Non-respondents
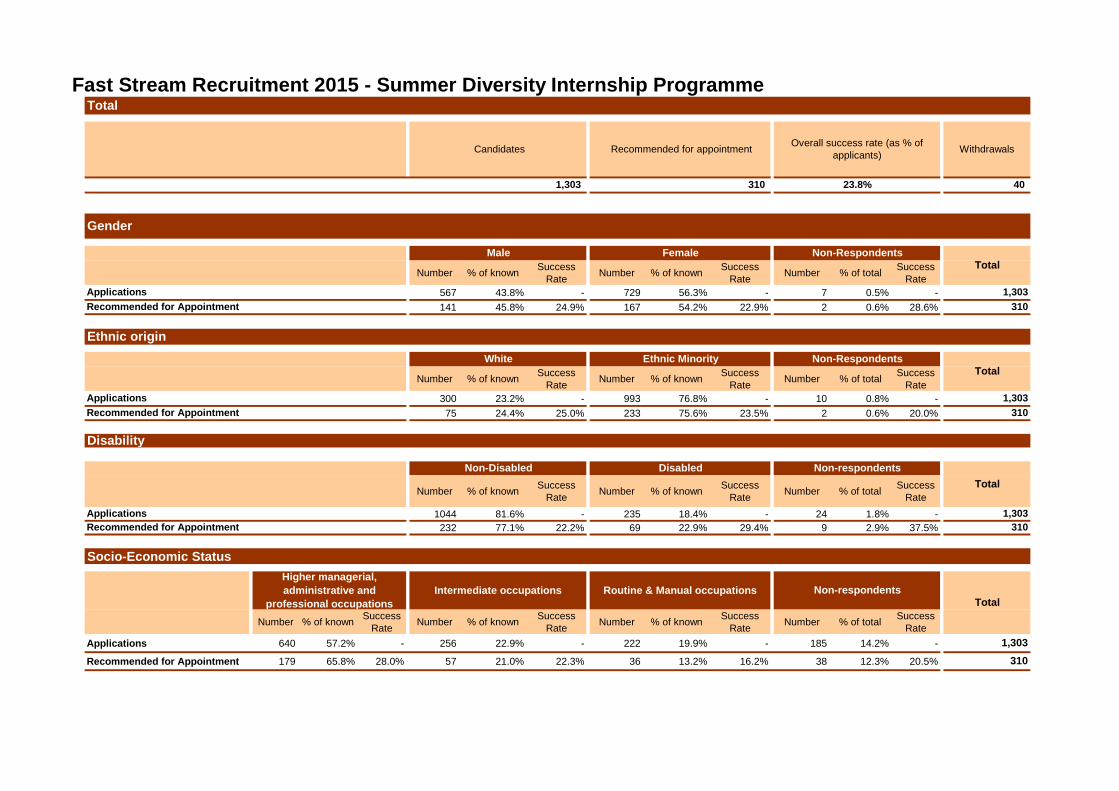
Fast Stream Recruitment 2015 - Summer Diversity Internship Programme
Number % of knownSuccess
RateNumber % of known
Success
RateNumber % of total
Success
Rate
567 43.8% - 729 56.3% - 7 0.5% -
141 45.8% 24.9% 167 54.2% 22.9% 2 0.6% 28.6%
Number % of knownSuccess
RateNumber % of known
Success
RateNumber % of total
Success
Rate
300 23.2% - 993 76.8% - 10 0.8% -
75 24.4% 25.0% 233 75.6% 23.5% 2 0.6% 20.0%
Number % of knownSuccess
RateNumber % of known
Success
RateNumber % of total
Success
Rate
1044 81.6% - 235 18.4% - 24 1.8% -
232 77.1% 22.2% 69 22.9% 29.4% 9 2.9% 37.5%
Socio-Economic Status
Number % of knownSuccess
RateNumber % of known
Success
RateNumber % of known
Success
RateNumber % of total
Success
Rate
Applications 640 57.2% - 256 22.9% - 222 19.9% - 185 14.2% -
Recommended for Appointment 179 65.8% 28.0% 57 21.0% 22.3% 36 13.2% 16.2% 38 12.3% 20.5%
1,303
310
Applications 1,303
Recommended for Appointment 310
Higher managerial,
administrative and
professional occupations
Intermediate occupations Routine & Manual occupations Non-respondentsTotal
Disability
Non-Disabled Disabled Non-respondents
Applications 1,303
Recommended for Appointment 310
Ethnic origin
White Ethnic Minority Non-RespondentsTotal
Gender
Male Female Non-RespondentsTotal
40
Total
Candidates Recommended for appointment Overall success rate (as % of
applicants)Withdrawals
1,303 310 23.8%
Total
Applications 1,303
Recommended for Appointment 310

Applications by School Type
ApplicantsSuccessful
Candidates
Independent - Bursary 77 28 36.4%
Independent - Direct Grant 9 1 11.1%
Independent - No Bursary 105 34 32.4%
State - Non-Selective 792 166 21.0%
State - Selective 165 50 30.3%
Overseas 131 18 13.7%
Not Stated 24 13 54.2%
Total 1,303 310 23.8%
Fast Stream Recruitment 2015 - Summer
Diversity Internship Programme
School Type
SDIP Overall
Success
Rate

Fast Stream Recruitment 2015 - Early Diversity Internship Programme
Number % of knownSuccess
RateNumber % of known
Success
RateNumber % of total
Success
Rate
47 43.9% - 60 56.1% - 0 0.0% -
35 42.7% 74.5% 47 57.3% 78.3% 0 0.0% -
Number % of knownSuccess
RateNumber % of known
Success
RateNumber % of total
Success
Rate
22 20.6% - 85 79.4% - 0 0.0% -
19 23.2% 86.4% 63 76.8% 74.1% 0 0.0% -
Number % of knownSuccess
RateNumber % of known
Success
RateNumber % of total
Success
Rate
102 95.3% - 5 4.7% - 0 0.0% -
77 93.9% 75.5% 5 6.1% 100.0% 0 0.0% -
Socio-Economic Status
Number % of knownSuccess
RateNumber % of known
Success
RateNumber % of known
Success
RateNumber % of total
Success
Rate
Applications 43 48.9% - 25 28.4% - 20 22.7% - 19 17.8% -
Recommended for Appointment 34 50.0% 79.1% 18 26.5% 72.0% 16 23.5% 80.0% 14 17.1% 73.7%
107
82
Applications 107
Recommended for Appointment 82
Higher managerial,
administrative and
professional occupations
Intermediate occupations Routine & Manual occupations Non-respondentsTotal
Disability
Non-Disabled Disabled Non-respondents
Applications 107
Recommended for Appointment 82
Ethnic origin
White Ethnic Minority Non-RespondentsTotal
Gender
Male Female Non-RespondentsTotal
-
Total
Candidates Recommended for appointment Overall success rate (as % of
applicants)Withdrawals
107 82 76.6%
Total
Applications 107
Recommended for Appointment 82

Applications by School Type
ApplicantsSuccessful
Candidates
Independent - Bursary 10 9 90.0%
Independent - Direct Grant 0 0 -
Independent - No Bursary 6 4 66.7%
State - Non-Selective 68 52 76.5%
State - Selective 15 13 86.7%
Overseas 7 3 42.9%
Not Stated 1 1 100.0%
Total 107 82 76.6%
Fast Stream Recruitment 2015 - Early
Diversity Internship Programme
School Type
SDIP Overall
Success
Rate

Grand Total
Number % of known Success Rate Number % of known Success Rate Number % of total Success Rate Number Success Rate
Applications 3458 60.3% - 2275 39.7% - 60 1.0% - 5793 -
Recommended for Appointment 404 59.4% 11.7% 276 40.6% 12.1% 4 0.6% 6.7% 684 11.8%
Number % of known Success Rate Number % of known Success Rate Number % of total Success Rate Number Success Rate
Applications 4589 80.6% - 1104 19.4% - 100 1.7% - 5793 -
Recommended for Appointment 579 85.7% 12.6% 97 14.3% 8.8% 8 1.2% 8.0% 684 11.8%
Detailed Breakdown of Ethnicity
Ethnic Origin
Number % of known % of total Number % of known % of total
Asian or Asian British - Any other Asian background 76 1.3% 8 1.2%
Asian or Asian British - Bangladeshi 118 2.1% 8 1.2%
Asian or Asian British - Indian 207 3.6% 19 3.0%
Asian or Asian British - Pakistani 231 4.1% 14 2.2%
Black or Black British - African 153 2.7% 13 2.0%
Black or Black British - Any other Black background 13 0.2% 1 0.2%
Black or Black British - Caribbean 83 1.5% 3 0.5%
Chinese or other ethnic group - Chinese 14 0.2% 1 0.2%
Chinese or other ethnic group -Any other 7 0.1% 1 0.2%
Mixed - Any other Mixed background 50 0.9% 8 1.2%
Mixed - White and Asian 44 0.8% 6 0.9%
Mixed - White and Black African 16 0.3% 2 0.3%
Mixed - White and Black Caribbean 92 1.6% 10 1.6%
White - Any other White background 112 2.0% 8 1.2%
White - British 4448 78.1% 538 83.7%
White - Irish 29 0.5% 3 0.5%
Non-Respondents 100 1.7% 41 6.0%
Total 5793 100% 684 100%
Number % of known Success Rate Number % of known Success Rate Number % of total Success Rate Number Success Rate
Applications 5536 96.4% - 208 3.6% - 49 0.8% - 5793 -
Recommended for Appointment 662 97.2% 12.0% 19 2.8% 9.1% 3 0.4% 6.1% 684 11.8%
Number % of total Success Rate Number % of total Success Rate Number % of total Success Rate Number % of total Success Rate Number % of total Success Rate Number % of totalSuccess
RateNumber % of total
Success
RateNumber % of total
Success
RateNumber % of total
Success
RateNumber % of total
Success
RateNumber
Success
Rate
Applications 150 2.6% - 468 8.1% - 1591 27.5% - 844 14.6% - 593 10.2% - 486 8.4% - 356 6.1% - 277 4.8% - 216 3.7% - 812 14.0% - 5793 -
Recommended for Appointment 4 0.6% 2.7% 49 7.2% 10.5% 236 34.5% 14.8% 111 16.2% 13.2% 64 9.4% 10.8% 47 6.9% 9.7% 34 5.0% 9.6% 25 3.7% 9.0% 17 2.5% 7.9% 97 14.2% 11.9% 684 11.8%
Number % of known Success Rate Number % of known Success Rate Number % of total Success Rate Number Success Rate
Applications 5268 95.8% - 233 4.2% - 292 5.0% - 5793 -
Recommended for Appointment 621 95.4% 11.8% 30 4.6% 12.9% 33 4.8% 11.3% 684 11.8%
Heterosexual Lesbian, Gay, Bi sexual, Transgender Non-Respondents Total
22 23 24 25 and over Total
Sexual orientation
Age
16 17 18 19 20 21
Disability
Non-Disabled Disabled Non-Respondents Total
White Ethnic Minority Non-Respondents Total
Ethnicity
Recommended for
AppointmentApplications
Fast Track 2015 Diversity Statistics
Ethnic Origin
Total
CandidatesRecommended for
appointment
Overall success rate (as
% of applicants)
Declined
appointment
5793 684 11.8% 9
Gender
Male Female Non-Respondents Total
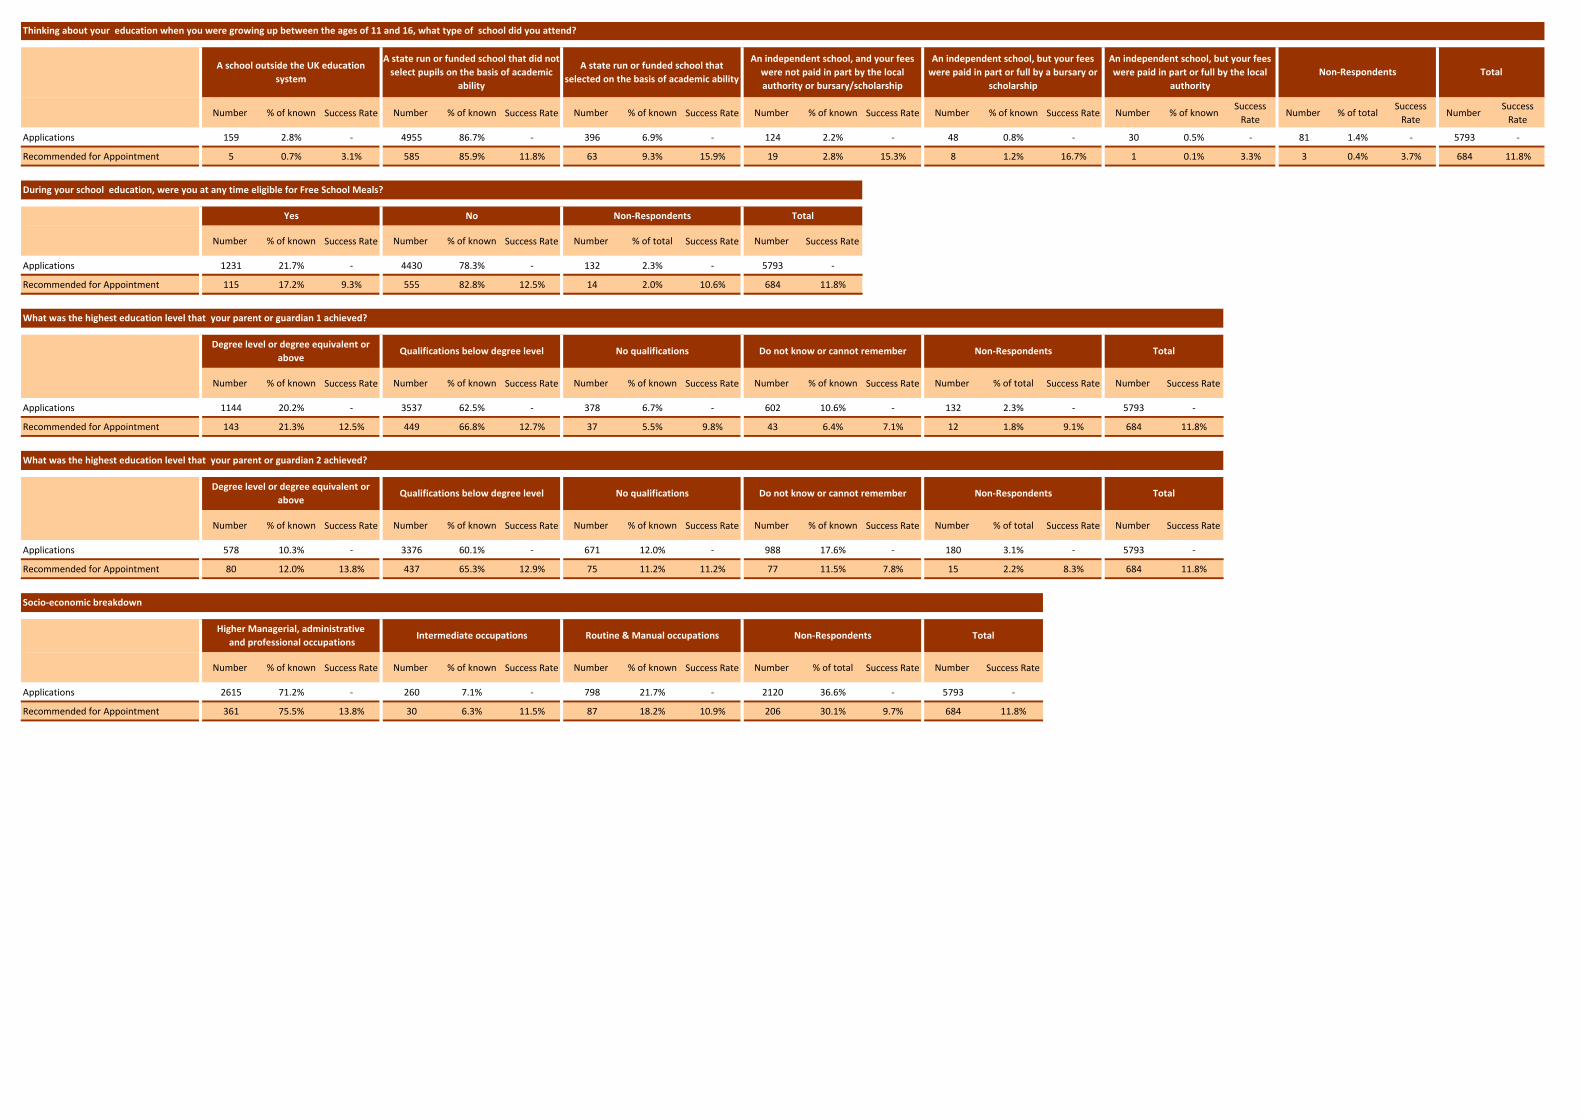
Number % of known Success Rate Number % of known Success Rate Number % of known Success Rate Number % of known Success Rate Number % of known Success Rate Number % of knownSuccess
RateNumber % of total
Success
RateNumber
Success
Rate
Applications 159 2.8% - 4955 86.7% - 396 6.9% - 124 2.2% - 48 0.8% - 30 0.5% - 81 1.4% - 5793 -
Recommended for Appointment 5 0.7% 3.1% 585 85.9% 11.8% 63 9.3% 15.9% 19 2.8% 15.3% 8 1.2% 16.7% 1 0.1% 3.3% 3 0.4% 3.7% 684 11.8%
Number % of known Success Rate Number % of known Success Rate Number % of total Success Rate Number Success Rate
Applications 1231 21.7% - 4430 78.3% - 132 2.3% - 5793 -
Recommended for Appointment 115 17.2% 9.3% 555 82.8% 12.5% 14 2.0% 10.6% 684 11.8%
Number % of known Success Rate Number % of known Success Rate Number % of known Success Rate Number % of known Success Rate Number % of total Success Rate Number Success Rate
Applications 1144 20.2% - 3537 62.5% - 378 6.7% - 602 10.6% - 132 2.3% - 5793 -
Recommended for Appointment 143 21.3% 12.5% 449 66.8% 12.7% 37 5.5% 9.8% 43 6.4% 7.1% 12 1.8% 9.1% 684 11.8%
Number % of known Success Rate Number % of known Success Rate Number % of known Success Rate Number % of known Success Rate Number % of total Success Rate Number Success Rate
Applications 578 10.3% - 3376 60.1% - 671 12.0% - 988 17.6% - 180 3.1% - 5793 -
Recommended for Appointment 80 12.0% 13.8% 437 65.3% 12.9% 75 11.2% 11.2% 77 11.5% 7.8% 15 2.2% 8.3% 684 11.8%
Number % of known Success Rate Number % of known Success Rate Number % of known Success Rate Number % of total Success Rate Number Success Rate
Applications 2615 71.2% - 260 7.1% - 798 21.7% - 2120 36.6% - 5793 -
Recommended for Appointment 361 75.5% 13.8% 30 6.3% 11.5% 87 18.2% 10.9% 206 30.1% 9.7% 684 11.8%
Socio-economic breakdown
Higher Managerial, administrative
and professional occupationsIntermediate occupations Routine & Manual occupations Non-Respondents Total
What was the highest education level that your parent or guardian 2 achieved?
Degree level or degree equivalent or
aboveQualifications below degree level No qualifications Do not know or cannot remember Non-Respondents Total
Total
During your school education, were you at any time eligible for Free School Meals?
Yes No Non-Respondents Total
What was the highest education level that your parent or guardian 1 achieved?
Degree level or degree equivalent or
aboveQualifications below degree level No qualifications Do not know or cannot remember Non-Respondents
Thinking about your education when you were growing up between the ages of 11 and 16, what type of school did you attend?
A school outside the UK education
system
A state run or funded school that did not
select pupils on the basis of academic
ability
A state run or funded school that
selected on the basis of academic ability
An independent school, and your fees
were not paid in part by the local
authority or bursary/scholarship
An independent school, but your fees
were paid in part or full by a bursary or
scholarship
An independent school, but your fees
were paid in part or full by the local
authority
Non-Respondents Total