City Systems in South Asian Urbanization and Growth · City Systems in South Asian Urbanization and...
25
City Systems in South Asian Urbanization and Growth Surajit Deb University of Delhi, India Paper prepared for the IARIW-ICIER Conference New Delhi, India, November 23-25, 2017 Session 6: Income and Growth Time: Friday, November 24, 2017 [Morning]
Transcript of City Systems in South Asian Urbanization and Growth · City Systems in South Asian Urbanization and...
City Systems in South Asian Urbanization and Growth
Surajit Deb
University of Delhi India
Paper prepared for the IARIW-ICIER Conference
New Delhi India November 23-25 2017
Session 6 Income and Growth
Time Friday November 24 2017 [Morning]
1
30102017
City Systems in South Asian Urbanization and Growth
Surajit Deb
debsurajitgmailcom
Institutional Affiliation Associate Professor in Economics
Aryabhatta College (University of Delhi)
Abstract While the urbanization process has undoubtedly contributed to the economic growth in South
Asia the cities are facing challenges of population pressures on infrastructure housing basic
services and the environment This paper examines the comparative growth of secondary and
primary cities among major economies of south-Asia and subsequently examine whether the
system of city growth bear any implication for the divergences in regional economic growth We
carry out the analysis using data from four major economies from South Asia viz Bangladesh
India Pakistan and Sri Lanka during the period from 1970 to 2015 The majority of the urban
agglomerations in Bangladesh India and Pakistan are in fact medium or small sized cities with
less than 5 million or even lesser number of inhabitants Correspondingly the highest share of
urban populations in Bangladesh India Pakistan and Sri Lanka are located in small sized
agglomerations with less than 300 000 inhabitants Our results indicate that small and medium
cities yielded positive impacts on economic growth while the impacts of primary or large cities
remain statistically insignificant across countries There is also an indication that the impacts of
medium and small cities impacted significantly on the economic growth for India (197 words)
JEL R1 0 R12 C21 O11 O53
Keyword Urbanization City Growth Cross Sectional Model Economic Growth South Asia
Paper for the IARIW-ICRIER Conference
Experiences and Challenges in Measuring Income Inequality and
Poverty in South Asia
Delhi India November 23-25 2017
2
1 Introduction and Objective
A well-managed urbanization process is crucial for sustainable economic growth and economic
prosperity of countries According to Ellis and Roberts 2016) urbanization in South Asia has
remained messy hidden and underleveraged It is messy due to poor livability and widespread
prevalence of slums hidden because the dimensions are not picked up due to limitations in
official statistical definitions and underleveraged due to its slow relative rates of growth in
comparison to other regions The pattern of South Asian urbanization has remained uneven both
in terms of its degree and pace in comparison to other economic regions such as the south-east
Asia or Latin America (UN 2014) Interestingly this region is identified as the least urbanized
region of the world in terms of the share of people living in urban areas But the magnitude and
rate of urban population growth remains so high that a major portion of the increase in global
urban population is projected to occur in this region A major element of the South Asian
urbanization growth has also been the disproportionate rise of urban population and the wide
disparities in the growth of primary and secondary cities across economies in the region
According to some analysts these aspects remain pertinent for realizing the regionrsquos potential
benefits from urbanization to economic growth
In the present day rapid urbanization is identified as one defining feature of the growth
strategies The positive relationship between urbanization and economic growth can be traced in
several well-known lines of economic research viz cities as engines of economic growth
(Lucas 1988 World Bank 1991 Duranton 2008 Spence et al 2009) spatial economy or new
economic geography that emphasizes the benefits of agglomeration (Fujita 1988 Krugman 1991
Venables 1996 Martin and Ottaviano 2001) or the literature on productivity of larger cities
(Duranton and Puga 2004 Combes 2012) The large increase in urban population of this region
is often linked to the rising prosperity of the urban segments due to productivity gains and higher
per capita gross domestic product (GDP) But studies have found that the urban population
growth in South Asian countries has primarily been driven by natural increase in population and
the reclassification of rural settlements rather than any large-scale rural-urban migration It may
also be noticed that the character of city systems viz the relative growth of primary and
secondary cities and its interactions with the economic growth process has rarely been attempted
in the south-Asian region In this backdrop the main objective of this paper is to examine the
3
comparative growth of secondary and primary cities among major economies of South-Asia and
subsequently examine whether the system of city growth bear any implication for the growth
level of countries
With the main objective set to survey the evolution of secondary and primary cities and
subsequently examining their growth implications in Bangladesh India Pakistan and Sri Lanka
the remaining part of this paper is structured as follows Section 2 deliberate on how the system
of cities impact on the urbanization and economic growth process In section 3 we examine the
pattern of urbanization in each of the major South-Asian economies Section 4 provides a
comparative picture of growth in primary and secondary cities of these four countries in the
region Section 5 provides the empirical analysis that contains the structure of the econometric
model data description and comments on the estimation results The empirical analysis is
performed using country-specific cross-sectional data on 10 points of time at 5-years of interval
during the time period 1970-2015 from these 4 countries Section 6 summarizes and concludes
on the main findings
2 Role of City Systems
Most countries have system of cities starting at the primary city and going down to the secondary
city and then small urban towns The primary cities are usually characterized by large
metropolitan areas and defined as the leading city in its country or region that is larger than any
other urban cities Since there are multiple primary cities in countries like USA Australia China
and India it is difficult to apply the concept of primacy in these places (Roberts 2014) On the
other hand primary cities can range from a few hundred thousand populations in countries with
low population base According to the definitions of UN-Habitat megacities are agglomerations
exceeding 10 million inhabitants and secondary cities are urban area having a population of
between 100000 and 500000 However a secondary city today can have a population of several
million people and in some countries like India secondary cities have been found to include
populations of over five million As a matter of fact the secondary cities describe the second-tier
level of the city system which are determined by their population size function and economic
status In its original definition by Rondinelli [1970] secondary cities refer to urban settlements
with a population of 01 Million or more but not including the largest city in the country These
cities largely become known due to their potential to lead the urbanization process in the coming
4
years as well as the urban growth constraints of the existing primary cities It is also argued that
the secondary cities are capable of generating greater impacts upon economic growth by
facilitating the localized production or transfer of goods and services However there are many
factors that could influence the expansion of secondary cities in a country There have been
studies to assess the economic competitiveness or livability of secondary cities in the recent
literature Generally the results indicate that secondary cities remain less competitive than
primary cities and it is often argued that secondary cities face the challenges of urbanization
with respect to housing health and sanitation environment and transport infrastructures
The megacities were once exceptional in South-Asia but are now beginning to grow in
the region While the megacities (exceeding 10 million inhabitants) or large cities (with 5 to 10
million inhabitants) are frequently distinguished for their size and concentration of economic
activities an insignificant proportion of the urban population are found to live in them At the
same time many secondary cities are continuing to fulfill the primary city functions within the
context of the countries in which they are located These secondary cities are performing vital
production governance and logistical functions at the sub-national or regional level in South
Asia Usually these cities have inhabitants between 05-3 million and remain relatively unknown
outside the national or regional context The medium sized cities (with 1 to 5 million inhabitants)
are found to have been growing in South Asia both in terms of numbers and in terms of
proportion of urban populations UN [2014] has indicates that medium-sized cities or cities with
less than 1 million inhabitants would be the fastest growing urban agglomeration located in Asia
3 Urbanization in South Asia
According to UN [2014] the levels of urbanization varied significantly across different world
regions in the year 2014 Thus a high urbanization level of around 80 per cent was observed in
Latin America and the Caribbean or in the Northern America whereas 73 per cent of urban
population was located in Europe In contrast Africa and Asia recorded 40 and 48 per cent of
their respective populations living in urban areas in the same year The rates of urbanization have
currently become slower in Europe Northern America and Oceania whereas it declined
regularly in the Latin America and Caribbean during the past two decades The level of
urbanization is expected to increase in all the regions with a leading role from Africa and Asia
which are projected to be the fastest urbanizing region during 2020-50 The levels of
5
urbanization in the South Asian region increased from about 17 percent in 1950 to 24 percent in
1980 and finally to 35 per cent in 2015 (Figure 1) The proportion of urban population among the
countries in the region ranged from a low of 18 per cent in Sri Lanka to 73 per cent in Iran in
2015 Iran remains as the most urbanized country in South Asia with around 73 per cent of the
population residing in urban areas in 2015 This is followed by Maldives and Pakistan with
around 45 and 38 per cent of the urban population respectively in the same year The
urbanization proportion in India and Bangladesh constituted above 30 per cent of the total
country population In contrast Sri Lanka and Nepal are the least urbanized countries with about
18 per cent of the population living in urban areas
(Insert Figure 1)
The average annual rates of change in the percentage of urban population for the major
South Asian countries are provided in Figure 2 during 1980-2015 at five-year intervals It can be
seen that the rate of urbanization in Bangladesh has remained higher than other countries of the
region Both India and Pakistan indicates moderate rates of urban growth whereas Sri Lanka
revealed a pattern low urban growth rates The future projections on the growth of global urban
population has indicated that China India and Nigeria are going to account for 37 per cent of the
increase of nearly 25 billion urban population growth during 2014-2050 The urbanization
trends in South Asia have remained very irregular where India dominates the regional
urbanization trends The share of urban population in India as percentage of total South Asian
urban population declined from about 81 percent in 1950 to 70 percent in 1990 and subsequently
to 67 per cent in 2015 (Figure 3) Some significant variations can be observed between
Bangladesh or Pakistan and Sri Lanka as regards the country-wise share of urban population in
the total South Asian urban population Despite the lower level of urbanization South Asia in the
present day contained about 16 percent and Asia about 53 percent of the global urban population
respectively in 2015 Although the scale and rate of urbanization remains relatively low in India
the number of people living in urban areas has increased due to the large base of urban
population Thus with about 33 per cent of the countryrsquos total population residing in urban areas
India still accounts for 67 per cent of the South Asiarsquos urban population
(Insert Figure 2 and Figure 3)
6
The recent population projections have claimed that highly urbanized regions are
expected to grow at a slower pace whereas the rate of urbanization in Africa and Asia could
grow faster and reach around 56 and 64 per cent urban respectively by mid-2050 However
even after contributing nearly 90 per cent of the increase in worldrsquos urban population in the
coming years Asia and Africa would still remain as comparatively less urbanized The future
growth of the global urban population between 2014 and 2050 is expected to be concentrated in
11 countries of the world and three South Asian countries viz India Bangladesh and Pakistan
figure in the list On the contrary Nepal and Sri Lanka are projected to remain Asiarsquos least
urbanized countries and are expected to urbanize to above 30 per cent in the year 2050
4 Mega and Secondary Cities
There were 7 agglomerations with more than 10 million inhabitants in the world during 1985
which represented less than 6 per cent of the global urban population But the number of
megacities has gone up to 29 accounting for approximately 12 per cent of the worldrsquos urban
population in 2015 At the same time there was just 1 agglomeration with more than 10 million
populations in South Asia that constituted less than 4 per cent of the regional population in the
same year However the number of megacities has gone up to 6 accounting for 17 per cent of the
south Asian urban population in the corresponding years In the year 2015 the number of
agglomeration with 10 million or more and 5 million or more inhabitants constituted just 3
percent each of the total 239 urban agglomerations of different sizes (Figure 4) On the other
hand agglomerations between 1 to 5 million and between 500 000 to 1 million represented
about 28 and 29 percent respectively of the total urban agglomerations in South Asia The
highest share of the total number of agglomeration in South Asia is however signified by
agglomerations comprising 300 000 to 500 000 inhabitants In terms of the percentage of urban
population agglomeration with 10 million or more 5 million or more and 1-5 million inhabitants
contained 17 9 and 20 percent respectively of the total urban population in South Asia during
the year 2015 (Figure 5) On the other hand agglomerations between 500 000 to 1 million and
between 300 000 to 500 000 inhabitants included around 7 and 5 per cent of the total urban
population The largest proportion of the urban population in South Asia can however be located
in agglomerations with less than 300 000 inhabitants
7
(Insert Figure 4 and Figure 5)
The percentage distribution of urban agglomerations classified by different sizes are
analyzed in Figure 4 for the four major countries of South Asia viz Bangladesh India Pakistan
and Sri Lanka It can be clearly observed that the majority of the urban agglomerations in
Bangladesh India and Pakistan are in fact medium or small sized cities of less than 5 million or
even lesser number of inhabitants The majority of the urban agglomerations in Sri Lanka can be
distinguished as small sized agglomerations of less than 1 million inhabitants In actual fact it is
only in Bangladesh that the highest proportion of megacities (cities exceeding 10 million
inhabitants) is found to exist in this region The percentage of urban population classified as
living in different agglomeration sizes are provided in Figure 5 We find that that highest share
of urban populations in Bangladesh India Pakistan and Sri Lanka are located in small sized
agglomerations with less than 300 000 inhabitants The megacities (cities exceeding 10 million
inhabitants) constituted about 32 per cent of the total urban population in Bangladesh which
incidentally is the highest estimate for the megacity agglomeration in the region On the contrary
small agglomerations (cities with less than 300 000 inhabitants) formed 82 per cent of the total
urban population in Sri Lanka that incidentally is the highest estimate for the small city
agglomeration in the region Figure 6 illustrates how the percentage of population living in
agglomerations with more than 300 000 inhabitants are rising for Bangladesh India and
Pakistan but not for Sri Lanka
(Insert Figure 6)
The megacities in South-Asia were uncommon in the past but are now beginning to grow
in the region Today the four major countries of South Asia are home to at least 7 megacities
while 5 of them are in India Bangladesh Pakistan contains one each The only mega city of
Bangladesh Dhaka with its current population of 15 million bears the distinction of being the
fastest growing agglomeration in the world According to projections the city by the year 2025
will be home to more than 20 million people which is bigger than the Mexico City Beijing or
Shanghai In India New Delhi is the capital city having a population of 265 million people
Mumbai is the financial hub having a population of 214 million people Kolkata is an important
trading hub with 15 million people Bengaluru is the information technology hub with 105
million people and Chennai with its motor industry contains 102 million people Other urban
8
areas in India are growing rapidly and it is projected that India would have two more megacities
by the year 2030 viz Hyderabad with 128 million and Ahmedabad with 105 million
population As one of the populous countries in the world Pakistan is also home to some of the
worlds cities Its most populous city Karachi is not only the largest in Pakistan but is also the
7th most populous city in the world comprising about 11 Million people Pakistan also contains
Lahore as the second most populous city with about 63 million people and six other cities that
have crossed the one million population mark Sri Lanka at present has zero cities with more
than a million people but 10 cities with between 100000 and 1 million people Colombo happens
to be the largest city in Sri Lanka with a population of 648034 people and is possibly the only
megacity in the making The description of urban agglomerations with 300 000 or more inhabitants
during the year 2015 is provided in Table 1 for Bangladesh India Pakistan and Sri Lanka
(Insert Table 1)
5 Empirical Analysis
The urban transition and economic growth are often linked with each other because of the fact
that economic development has been found to promote urbanization while at the same time
rapid urbanization also led to higher economic growth It is argued in the literature that
individuals are drawn to cities that provide better education as well as employment in the
secondary and tertiary sectors The model by Eaton and Eckstein [1994] predicted that larger
cities could have higher levels of human capital and wages per worker Subsequently Becker
[2008] claimed that urbanization has led to the higher per capita GDP through higher
productivity levels Quigley [2013] suggests that the urbanization can positively impact upon
productivity through the localization of industries On the other hand Turok and McGranahan
[2013] clarified that it is not urbanization or the city size per se that induces economic growth
but the infrastructure base and institutional arrangements that matters for the success of the
urbanization story Castells-Quintana [2011] elaborated that the urbanization outcome on growth
could depend on several factors such as the stage of urbanization and nature of economic
activities Thus there could be many factors that ultimately determine the size and growth of
urban agglomerations in a country Similarly there could be many aspects other than
urbanization that could impact on the economic growth levels Consequently the examination of
9
the relative impacts of primary and secondary cities became an important subject in the applied
literature
However the empirical evidence on the relationship between urbanization and economic
growth has not remained uniform While Friedberg and Hunt [1995] claimed that economic
development is closely related with urbanization Bloom Canning and Fink [2008] argued that
there is no evidence that urbanization level affects economic growth rate Further while
urbanization had been found to bear a positive impact on economic growth in the case of
developed countries some studies have found a weak or negative relationship between
urbanization and economic growth in developing countries (Shabu 2010 Frick and Rodriguez-
Pose 2016 2017) Recent attempts on the relationship between urban population growth and
economic growth in have found no relationship between the variables and therefore inferred that
urban population growth did not impact upon the economic growth in developing countries (Fay
and Opal 2000 Polese 2005 Sarker et al 2016) The World Development Report by World Bank
[2013] indicated that not all countries that experienced higher levels of GDP are the ones with a
large share of urban population According to United Nations [2013] the positive relationship
between urbanization growth and per capita GDP levels remained apparent among the developed
countries However the relationship has been found to be lesser evidenced for the countries of
Latin America and the Caribbean and almost missing for the countries in sub-Saharan Africa
(United Nations 2013) While countries in the Eastern and South-eastern Asia such as China
Indonesia Malaysia Thailand and Vietnam experienced a steady increase in GDP per capita as
people moved to cities a similar increase in GDP per capita with urbanization was not observed
in individual nations of sub-Saharan Africa Thus the connection between per capita GDP and
the process of urbanization has been argued to be complex and the requirement of corresponding
planning and coordinating policies are highlighted for the urbanization process to aid economic
growth
The relationship between urbanization and economic growth in developing countries is
complex and may run in both directions The strong positive relationship between economic
growth measured by per capita gross domestic product (USD) and urbanization is confirmed for
Bangladesh India and Pakistan through the correlation coefficients referring to the period 1970-
2015 (Table 2) Sri Lanka however indicated a negative correlation during the same time period
While examining the link between average city size and aggregate economic growth Frick and
10
Rodriguez-Pose [2016] found no universal positive relationship between average city size and
economic growth for a sample of 114 countries during the period 1960-2010 Further their
results varied between the high-income and developing countries Thus while there is consistent
evidence of a positive link between city size and economic growth in high-income countries the
relationship did not hold for developing countries Figure 7 indicates how the percentage of
urban population in the South Asia is comparatively declining in small agglomerations and rising
toward large agglomerations during the time period 1950-2015
51 Methodology
Our objective is to examine as to how the pattern of primary and secondary city growth along
with control variables such as levels of urbanization impacted upon the economic growth
captured by the per capita GDP in the three major economies of South Asia viz Bangladesh
India and Pakistan We could not include Sri Lanka in this part of analysis due to data
limitations We begin by specifying a single-equation econometric model to explain the level of
per capita real GDP at 2005 prices (PCGDP) in USD in terms of the growth in cities of different
sizes We use variables for three city sizes ie number of cities with a population size above 5
million (CITY1) between 1 and 5 million (CITY2) and less than 1 million (CITY3) in these
three countries For our analysis we consider CITY1 and CITY2 as primary cities and CITY3
and CITY4 as secondary cities We also include the percentage of urban population (URBAN) as
a control variable to the cross-sectional data-set The regression equation is as follows
PCGDP= f (CITY1 CITY2 CITY3 URBAN)
with f prime CITY i gt 0 f prime URBAN gt 0
We subsequently add country dummies (D1 and D2) to combine the ten observations from each
of the three country samples with data ranging from 1970 to 2015 available at five-year
intervals The coefficients of the intercept dummies (D1 and D2) provide the difference in
intercepts of the country regression lines for the variable relationships We estimate the
regression equation as given in Equation (1) that focuses on whether the country characteristics
influenced the strength of the relationships
11
PCGDP = α + β1CITY1 + β2CITY2 + β3CITY3 + β4URBAN + β5D1 + β6D2 (1)
The inclusion of intercept dummy assumes parallel regressions across the three nations to
capture the influence of the explanatory variables in the model But if the intercept dummies
capturing country characteristics interact with one or more of the quantitative explanatory
variables then the regression lines would not be parallel To examine this aspect we
subsequently include the possibility of changes in the slope of the variable relationship by
including the interaction variables in Equation (2) This regression equation contains slope
dummies which are the product of intercept dummy variables and each of the continuous
explanatory variables in the model
PCGDP = α + β1CITY1 + β2CITY2 + β3CITY3 + β4URBAN + β5D1 + β6D2 + β7D1timesCITY1 +
β8D1timesCITY2 + β9D1timesCITY3 + β10D1timesURBAN + β11D2timesCITY1 + β12D2timesCITY2 +
β13D2timesCITY3 + β14D2timesURBAN (2)
Thus Equation (3) that includes the slope dummy variables in the regression model would
analyze whether the impacts of growth in urban agglomeration of different sizes on economic
growth differed across the three major economies in South Asia
52 Data Base
The basic data on urban population and distribution of cities grouped by year-end population in
urban agglomerates at the country level are derived from the lsquoWorld Urbanization Prospectsrsquo
2014 Revisionrsquo Population Division Department of Economic and Social Affairs United
Nations On the other hand the information on per capita GDP (in USD) for the countries are
accessed from the lsquoNational Accounts Statistics Version 2016rsquo Statistical Division Economic
and Social Development Division Department of Economic and Social Affairs United Nations)
53 Results
The results obtained from estimating the regression equations are provided in Table 2 Since the
OLS estimation generated autocorrelation problem as evident from the low Durbin-Watson test
statistic we have provided the results from Cochrane-Orcutt estimation after correcting the
serial-correlation problem The explanatory variables that turn out to be statistically significant
12
bear correct signs in all the equations In Equation (1a) and (1b) the levels of urbanization turned
out to be statistically significant and positive determinant of per capita GDP across the three
countries This is indicative of the fact that higher is the percentage of urban population the
higher is the level of per capita GDP among the three major South Asian countries of
Bangladesh India and Pakistan Our results indicate that cities with dissimilar population sizes
impacted differently on the levels of economic growth captured by per capita GDP in these three
countries Our results from Equation (1a) and (1b) suggest that the growth in secondary cities -
small and medium sized cities with population size less than 1 million and between 1-5 million
respectively - bear statistically significant impacts on the per capita GDP growth On the
contrary the impact of growth in primary or large cities with population size of more than 5
million did not turn out to be statistically significant across the economies The two intercept
dummies for India and Pakistan did not turn out to be significantly different from the benchmark
country Bangladesh The estimation of Equation (2a) and (2b) which includes the interaction
dummies for individual countries indicate that the coefficients remain mostly statistically
insignificant although bearing correct signs on the variable relationships Since the degrees of
freedom are really poor due to large number of explanatory variables we mainly focus on the
serial correlation corrected estimation of Equation 2(b) As before the impacts of the
urbanization level turned out to be statistically significant and positive determinant of per capita
GDP across the three countries The individual impacts of the disparate pattern of growth in
cities with different population size bear the correct positive signs for all the countries but turned
out to be statistically significant only in the case of India at 10 significance level for the
secondary cities of medium and small sizes Thus there is a clear indication that the individual
impacts of the growth in medium and small cities with population size between 1 to 5 million
and less than 1 million impacted positively on the economic growth for India As far as the
individual impact of the growth in primary cities with population size above 5 million on the
economic growth is concerned the evidence remains statistically insignificant in all the three
major countries from South Asia It may be noted that Frick and Rodriguez-Pose [2017] have
recently observed that small cities of up to 3 million inhabitants are more conducive to economic
growth for a majority of countries in the panel of 113 countries during the time period 1980 and
2010
13
6 Summary and Implications
It has been projected that the global urbanization process would remain a developing-country
phenomenon centered largely in Africa and Asia In the recent decades the urbanization process
has produced significant economic and social changes by creating jobs and reducing poverty
levels in many South Asian countries It is therefore argued that urbanization provides an
opportunity to for these countries to deliver employment livelihood and economic prosperity
(Ellis and Roberts 2016) However the story of South Asian urbanization remains distinctive due
to the scarcity of physical infrastructure high population density of megacities and adverse
environmental conditions The urbanization process of the region also remains hidden for the
discrepancies in the countryrsquos official definition or due to the existence of settlements that are
administered as rural entities In this background the main task of this paper was to focus on the
urbanization pattern of primary and secondary cities among the major South Asian countries and
subsequently examine their growth potentials Our analysis was carried out on the basis of using
cross-sectional data from Bangladesh India Pakistan and Sri Lanka during 1970-2015
Secondary cities in South Asia have undergone massive expansions in the previous
decade Our results indicate that the formation of city system according to population size has
remained uneven across the countries in the region The levels of South Asian urbanization
increased from about 24 percent in 1980 to 35 per cent in 2015 The proportion of urban
population constituted about 38 per cent in Pakistan above 30 per cent in India and Bangladesh
and about 18 per cent in Sri Lanka Despite the lower urbanization levels South Asia comprised
about 53 percent of the global urban population in the same year One can observe that
Bangladesh recorded a high urbanization rate and India is found to dominate the regional
urbanization trends due to its large population base The number of megacities (with 10 million
or more population) has gone up in South Asia comprising about 17 per cent of the urban
population whereas agglomeration between 5-10 million and 1-5 million inhabitants contained
about 9 and 20 percent of the total urban population respectively in the year 2015 The largest
proportion of the urban population in South Asia can however be located in the agglomerations
with less than 300 000 inhabitants The majority of the urban agglomerations in Bangladesh
India and Pakistan are in fact medium or small sized cities of less than 5 million or even lesser
number of inhabitants whereas Sri Lanka can be distinguished for small sized cities of less than
14
1 million inhabitants as leading agglomerations The highest share of urban populations in
Bangladesh India Pakistan and Sri Lanka are located in small sized agglomerations with less
than 300 000 inhabitants The megacities constituted about 32 per cent of the total urban
population in Bangladesh whereas small agglomerations (cities with less than 300 000
inhabitants) formed 82 per cent of the total urban population in Sri Lanka Our regression results
suggest that small (less than 1 million population) and medium (between 1-5 million
populations) cities yielded statistically significant impacts on per capita GDP growth whereas
the impacts of primary or large cities (more than 5 million population) remain statistically
insignificant across countries There is also an indication that the impacts of medium and small
cities impacted positively on the economic growth for India Thus in contrast to the prevailing
view that mega or large cities are growth-inducing our results suggest that small and medium
cities are more responsive to economic growth for the major economies in South Asia
The urbanization process provides the opportunity to realize the growth potential and
improve economic prosperity in the South Asian region UN [2016] in the review of world cities
has indicated that big cities can create wealth generate employment and drive human progress
but are also responsible for driving climate change inequality and exclusion Since the evidence
for positive city size effect on economic growth is weak in our major South Asian country
sample the policy focus on agglomeration and the benefit of large cities in this region would
appear inappropriate The majority of urban populations in South Asian countries are found to
residing in cities of less than one million Today the city growth in many South Asian countries
remains disorganized where urban population pressures on infrastructure basic services and
environment are already severe The region therefore faces real challenge with its urbanization
process and there is a need for developing specific policies for each of these countries for
removing the megacity constraints as well as developing the secondary cities It appears that a
balanced progress in primary and secondary cities can generate a more stable urban
agglomeration system in the region
15
Bibliography
Annez PC and RM Buckley [2009] Urbanization and Growth Setting the Context in M
Spence PC Annez and RM Buckley [Edited] Urbanization and Growth World Bank
Washington DC
Chen N P Valente and Z Zlotnik [1998] What Do We Know about Recent Trends in
Urbanization in RE Billsborrow [Edited] Migration Urbanization and Development New
Directions and Issues United Nations Population Fund and Kluwer Academic Publishers
Massachusetts 1998
Combes P G Duranton L Gobillon D Puga and S Roux [2012] The Productivity
Advantages of Large Cities Distinguishing Agglomeration from Firm Selection Econometrica
80 (6) November
Duranton G [2008] Cities Engines of Growth and Prosperity for Developing Countries
World Bank Washington DC
Duranton G and D Puga [2004] Micro Foundations of Urban Agglomeration Economies in J
V Henderson and J F Thisse (Edt) Handbook of Regional and Urban Economics Volume 4
Elsevier
Ellis P and M Roberts [2016] Leveraging Urbanization in South Asia World Bank
Washington DC
Eaton J and Z Eckstein [1994] Cities and Growth Theory and Evidence from France and
Japan National Bureau of Economic Research (NBER) Working Paper No 4612
Fay M and C Opal [2000] Urbanization without Growth A not so uncommon Phenomenon
Policy Research Working Paper No 2412 World Bank Washington DC
Frick S A and A Rodriguez-Pose [2016] Average City Size and Economic Growth
Cambridge Journal of Regions Economy and Society Volume 9 Issue 2 1 July 2016 Pages
301ndash318
Frick S A and A Rodriguez-Pose [2017] Big or Small Cities Centre for Economic Policy
Research (CEPR) Discussion Paper No DP-12324
Fujita M [1988] A Monopolistic Competition Model of Spatial Agglomeration A
Differentiated Product Approach Regional Science and Urban Economics Volume 18 pp 87ndash
124
Hamer AS J F Linn [2000] Urbanization in the Developing World Patterns Issues and
Policies in ES Mills [Edited] Handbook of Regional and Urban Economics Volume 2 North
Holland Amsterdam
16
Krugman P [1991] Geography and Trade MIT Press Cambridge
Lucas R E [1988] On the Mechanics of Economic Development Journal of Monetary
Economics Volume 22 pp 3ndash42
Mahbub ul Haq Human Development Centre [2014] Human Development in South Asia 2014
Urbanization Challenges and Opportunities Lahore University of Management Sciences
Lahore Pakistan
Martin P and G Ottaviano [2001] Growth and Agglomeration International Economic
Review Vol 42 No 4 November pp 947-968
Polegravese Mario [2005] Cites and National Economic Growth A Reappraisal Urban Studies
42(8) pp 1429-1451
Quigley JM [2013] Agglomeration Regional Growth and Economic Development In
Klaesson J Johansson B Karlsson C (Edited) Metropolitan Regions Advances in Spatial
Science Springer Berlin
Roberts BH [2014] Managing Systems of Secondary Cities Cities Alliance Brussels
Roberts B and T Kanaley [Edited 2006] Urbanization and Sustainability in Asia Case
Studies of Good Practices Asian Development Bank Manila
Sarker S A Khan and M M Mannan [2016] Urban Population and Economic Growth South
Asia Perspective European Journal of Government and Economics Volume 5 Number 1 June
2016
Shabu Terwase [2010] The Relationship between Urbanization and Economic Development in
Developing Countries International Journal of Economic Development Research and
Investment 1(2) pp 30-36
Spence M P Annez and R Buckley [2009] Urbanization and Growth World Bank
Washington DC
Turok I and G McGranahan [2013] Urbanization and Economic Growth The Arguments and
Evidence for Africa and Asia Environment and Urbanization 25(1) pp 465-482
Venables AJ [1996] Equilibrium Locations of Vertically Linked Industries International
Economic Review Volume 37 pp 341-59
United Nations [2014] World Urbanization Prospects Population Division Department of
Economic and Social Affairs United Nations New York
17
United Nations [2016a] Policies on Spatial Distribution and Urbanization Data Booklet No
STESASERA394 Population Division Department of Economic and Social Affairs UN
New York
United Nations [2016b] The Worldrsquos Cities in 2016 Population Division Department of
Economic and Social Affairs UN New York
United Nations Human Settlements Programme (UN-Habitat) and United Nations Economic and
Social Commission for Asia and the Pacific (ESCAP) [2015] The State of Asian and Pacific
Cities 2015
World Bank [1991] Urban Policy and Economic Development An Agenda for the 1990s World
Bank Washington DC
World Bank [2013] Urbanization Beyond Municipal Boundaries Nurturing Metropolitan
Economies and Connecting Peri-Urban Areas in India World Bank Washington DC
18
Table 1 Urban Agglomerations (with 300 000 or more Inhabitants) in South Asian Countries 2015
Bangladesh Barisal Bogra Chittagong Comilla Dhaka Khulna Mymensingh Rajshahi
Rangpur and Sylhet (10)
India Agartala Agra Ahmadabad Ahmadnagar Aizawl Ajmer Akola Aligarh
Allahabad Alwar Amravati Amritsar Anand Anantapur Asansol Aurangabad
Baharampur Bangalore Barddhaman Bareilly Bathinda Begusarai Belgaum
Bellary Bhagalpur Bhavnagar Bhilwara Bhiwandi Bhopal Bhubaneswar Bihar
Sharif Bijapur Bikaner Bilaspur Bokaro Steel City Brahmapur Chandigarh
Chandrapur Chennai (Madras) Cherthala Coimbatore Cuttack Darbhanga
Davangere Dehradun Delhi Dewas Dhanbad Dhule Dindigul Durgapur Durg-
Bhilainagar English Bazar Erode Farrukhabad Firozabad Gaya Gorakhpur
Gulbarga Guntur Guwahati (Gauhati) Gwalior Habra Hardwar Hisar Hosur
Hubli-Dharwad Hyderabad Ichalakaranji Imphal Indore Jabalpur Jaipur
Jalandhar Jalgaon Jalna Jammu Jamnagar Jamshedpur Jhansi Jodhpur
Junagadh Kadapa Kakinada Kannur Kanpur Karimnagar Kayamkulam Kochi
(Cochin) Kolhapur Kolkata (Calcutta) Kollam Korba Kota Kottayam
Kozhikode (Calicut) Kurnool Latur Lucknow Ludhiana Madurai Malappuram
Malegaon Mangalore Mathura Maunath Bhanjan Meerut Moradabad Mumbai
(Bombay) Muzaffarnagar Muzaffarpur Mysore Nagpur Nanded Waghala
Nashik Navsari Nellore Nizamabad Palakkad Panipat Parbhani Patiala Patna
Puducherry Pune (Poona) Purnia Raipur Rajahmundry Rajkot Rampur Ranchi
Ranipet Raurkela Rohtak Roorkee Sagar Saharanpur Salem Sangali Santipur
Satna Shahjahanpur Shillong Shimoga Siliguri Solapur Srinagar Surat
Thanjavur Thiruvananthapuram Thoothukkudi (Tuticorin) Thrissur
Tiruchirappalli Tirunelveli Tirupati Tiruppur Tumkur Udaipur Ujjain
Vadodara Varanasi (Benares) Vellore Vijayawada Visakhapatnam Warangal and
Yamunanagar (166)
Pakistan Bahawalpur Dera Ghazikhan Faisalabad Gujranwala Gujrat Hyderabad
Islamabad Jhang Karachi Kasur Lahore Larkana Mardan Multan Nawabshah
Okara Peshawar Quetta Rahim Yar Khan Rawalpindi Sargodha Sheikhupura
Sialkot Sukkur and Wah (27)
Sri Lanka Colombo (1)
Note The number in parentheses indicate the number of such agglomerations in 2015
19
Table 2 Correlation of Urbanization amp Per Capita GDP in South Asian Countries (1970- 2015)
Bangladesh India Pakistan Sri Lanka
Correlation between PCGDP (USD) amp
Percentage of Total Urban Population
+089 +088 +095 -056
Correlation between PCGDP (USD) amp
Percentage of Population Living in 300000
plus Agglomeration
+086 +089 +098 -066
20
Table 3 Regression Results Dependent Variable Per Capita GDP (USD) at Constant (= 2005
Prices) in Bangladesh India amp Pakistan (sample 1970-2015 at 5-year intervals = 30 observations)
Explanatory Variables darr OLS (1a) Cochrane-Orcutt
(AR2) (1b)
OLS (2a) Cochrane-
Orcutt (AR2) (2b)
Constant -459
(-055)
-4402
(-111)
1670
(176)
1190
(067)
Percentage of Urban Population
(URBAN)
1690
(439)
2399
(287)
104
(010)
1896
(195)
Number of cities with Population
above 5 Million (CITY1)
1269
(030)
-762
(-066)
-682
(-007)
5210
(-035)
Number of cities with Population
between 1to 5 Million (CITY2)
1959
(279)
1013
(286)
-022
(-003)
-2420
(-070)
Number of cities with Population
less than 1 Million (CITY3)
-243
(-073)
683
(273)
5308
(265)
-2164
(-077)
Dummy 1 (D1) -17386
(-126)
-2370
(-139)
3639
(246)
40780
(042)
Dummy 2 (D2) 3888
(076)
1416
(057)
-50270
(-071)
-59060
(-103)
Dummy 1 times URBAN -24420
(-250)
-7313
(-124)
Dummy 1 times CITY1 -202
(-001)
3650
(052)
Dummy 1 times CITY2 4160
(061)
4032
(136)
Dummy 1 times CITY3 -2201
(-092)
3813
(135)
Dummy 2 times URBAN 2460
(074)
881
(033)
Dummy 2 times CITY1 1524
(012)
6553
(077)
Dummy 2 times CITY2 1543
(021)
4085
(096)
Dummy 2 times CITY3 -4418
(-157
3353
(110)
R-Squarred 091 098 097 098
R-Bar-Squarred 089 098 095 097
DW Statistic 090 185 161 191
F-Statistic 4182 13811 4050 6250
Note and indicate statistical significance at 5 and 10 level of significance respectively
21
South Asia 348
Afghanistan 267
Bangladesh 342
Bhutan 386
India 327
Iran 733
Maldives 455
Nepal 186
Pakistan 387
Sri Lanka 183
0
10
20
30
40
50
60
70
80
Source UN [2014]
Figure 1 Percentage of Urban Population in
South Asia 1950-2015
SouthAsia 122
Bangladesh 236
India 114
Pakistan 115
Sri Lanka 004
-050
0
050
100
150
200
250
300
350
1980-85 1985-90 1990-95 1995-2000 2000-05 2005-10 2010-15
Source UN [2014]
Figure 2 Average Annual Rate of Change in Percentage of
Urban Population 1980-2015
22
Bngladesh 88
India 673
Pakistan 117
Srilanka 0600
100
200
300
400
500
600
700
800
900
1950 1955 1960 1965 1970 1975 1980 1985 1990 1995 2000 2005 2010 2015
Source Derived from UN [2014]
Figure 3 Country Share of Urban Population in South Asia
0
10
20
30
40
50
60
70
80
90
100
Asia South Asia Bangladesh India Pakistan Srilanka
24 28
18
28 32
0
3328 27
2924
100
36 3745
36 36
0
Source Derived from UN [2014]
Figure 4 Percentage Distribution of Cities Classified by
Size of Urban Agglomerations 2015
10 million or more 5 to 10 million
1 to 5 million 500 000 to 1 million
300 000 to 500 000
23
0
10
20
30
40
50
60
70
80
90
Asia South Asia Bangladesh India Pakistan Srilanka
138 169
320
170227
0
410 421
504
412331
821
Source Derived from UN [2014]
Figure 5 Percentage of Urban Population Classified by
Agglomeration Size 2015
10 million or more 5 to 10 million
1 to 5 million 500 000 to 1 million
300 000 to 500 000 Fewer than 300 000
Bangladsh-10 17
India-166 19
Pakistan-25 26
Sri Lanka-1 3
0
5
10
15
20
25
30
Source Derived from UN [2014]
Figure 6 Percentage of Population Living in Urban
Agglomerations with 300 000 or more Inhabitants as of
Total Population 1950-2015
24
World (5 million or more) 197
World (Less than 1 million) 589
Asia (5 million or more) 232
Asia (Less than 1 million) 506
SAsia (5 million or more) 257
SAsia (Less than 1 million) 546
00
100
200
300
400
500
600
700
800
900
1950 1955 1960 1965 1970 1975 1980 1985 1990 1995 2000 2005 2010 2015
Source Derived from UN [2014]
Figure 7 Percentage of Urban Population in Small amp Large
Agglomerations 1950-2015
- Annez PC and RM Buckley [2009] Urbanization and Growth Setting the Context in M Spence PC Annez and RM Buckley [Edited] Urbanization and Growth World Bank Washington DC
- Combes P G Duranton L Gobillon D Puga and S Roux [2012] The Productivity Advantages of Large Cities Distinguishing Agglomeration from Firm Selection Econometrica 80 (6) November
-
5
urbanization in the South Asian region increased from about 17 percent in 1950 to 24 percent in
1980 and finally to 35 per cent in 2015 (Figure 1) The proportion of urban population among the
countries in the region ranged from a low of 18 per cent in Sri Lanka to 73 per cent in Iran in
2015 Iran remains as the most urbanized country in South Asia with around 73 per cent of the
population residing in urban areas in 2015 This is followed by Maldives and Pakistan with
around 45 and 38 per cent of the urban population respectively in the same year The
urbanization proportion in India and Bangladesh constituted above 30 per cent of the total
country population In contrast Sri Lanka and Nepal are the least urbanized countries with about
18 per cent of the population living in urban areas
(Insert Figure 1)
The average annual rates of change in the percentage of urban population for the major
South Asian countries are provided in Figure 2 during 1980-2015 at five-year intervals It can be
seen that the rate of urbanization in Bangladesh has remained higher than other countries of the
region Both India and Pakistan indicates moderate rates of urban growth whereas Sri Lanka
revealed a pattern low urban growth rates The future projections on the growth of global urban
population has indicated that China India and Nigeria are going to account for 37 per cent of the
increase of nearly 25 billion urban population growth during 2014-2050 The urbanization
trends in South Asia have remained very irregular where India dominates the regional
urbanization trends The share of urban population in India as percentage of total South Asian
urban population declined from about 81 percent in 1950 to 70 percent in 1990 and subsequently
to 67 per cent in 2015 (Figure 3) Some significant variations can be observed between
Bangladesh or Pakistan and Sri Lanka as regards the country-wise share of urban population in
the total South Asian urban population Despite the lower level of urbanization South Asia in the
present day contained about 16 percent and Asia about 53 percent of the global urban population
respectively in 2015 Although the scale and rate of urbanization remains relatively low in India
the number of people living in urban areas has increased due to the large base of urban
population Thus with about 33 per cent of the countryrsquos total population residing in urban areas
India still accounts for 67 per cent of the South Asiarsquos urban population
(Insert Figure 2 and Figure 3)
6
The recent population projections have claimed that highly urbanized regions are
expected to grow at a slower pace whereas the rate of urbanization in Africa and Asia could
grow faster and reach around 56 and 64 per cent urban respectively by mid-2050 However
even after contributing nearly 90 per cent of the increase in worldrsquos urban population in the
coming years Asia and Africa would still remain as comparatively less urbanized The future
growth of the global urban population between 2014 and 2050 is expected to be concentrated in
11 countries of the world and three South Asian countries viz India Bangladesh and Pakistan
figure in the list On the contrary Nepal and Sri Lanka are projected to remain Asiarsquos least
urbanized countries and are expected to urbanize to above 30 per cent in the year 2050
4 Mega and Secondary Cities
There were 7 agglomerations with more than 10 million inhabitants in the world during 1985
which represented less than 6 per cent of the global urban population But the number of
megacities has gone up to 29 accounting for approximately 12 per cent of the worldrsquos urban
population in 2015 At the same time there was just 1 agglomeration with more than 10 million
populations in South Asia that constituted less than 4 per cent of the regional population in the
same year However the number of megacities has gone up to 6 accounting for 17 per cent of the
south Asian urban population in the corresponding years In the year 2015 the number of
agglomeration with 10 million or more and 5 million or more inhabitants constituted just 3
percent each of the total 239 urban agglomerations of different sizes (Figure 4) On the other
hand agglomerations between 1 to 5 million and between 500 000 to 1 million represented
about 28 and 29 percent respectively of the total urban agglomerations in South Asia The
highest share of the total number of agglomeration in South Asia is however signified by
agglomerations comprising 300 000 to 500 000 inhabitants In terms of the percentage of urban
population agglomeration with 10 million or more 5 million or more and 1-5 million inhabitants
contained 17 9 and 20 percent respectively of the total urban population in South Asia during
the year 2015 (Figure 5) On the other hand agglomerations between 500 000 to 1 million and
between 300 000 to 500 000 inhabitants included around 7 and 5 per cent of the total urban
population The largest proportion of the urban population in South Asia can however be located
in agglomerations with less than 300 000 inhabitants
7
(Insert Figure 4 and Figure 5)
The percentage distribution of urban agglomerations classified by different sizes are
analyzed in Figure 4 for the four major countries of South Asia viz Bangladesh India Pakistan
and Sri Lanka It can be clearly observed that the majority of the urban agglomerations in
Bangladesh India and Pakistan are in fact medium or small sized cities of less than 5 million or
even lesser number of inhabitants The majority of the urban agglomerations in Sri Lanka can be
distinguished as small sized agglomerations of less than 1 million inhabitants In actual fact it is
only in Bangladesh that the highest proportion of megacities (cities exceeding 10 million
inhabitants) is found to exist in this region The percentage of urban population classified as
living in different agglomeration sizes are provided in Figure 5 We find that that highest share
of urban populations in Bangladesh India Pakistan and Sri Lanka are located in small sized
agglomerations with less than 300 000 inhabitants The megacities (cities exceeding 10 million
inhabitants) constituted about 32 per cent of the total urban population in Bangladesh which
incidentally is the highest estimate for the megacity agglomeration in the region On the contrary
small agglomerations (cities with less than 300 000 inhabitants) formed 82 per cent of the total
urban population in Sri Lanka that incidentally is the highest estimate for the small city
agglomeration in the region Figure 6 illustrates how the percentage of population living in
agglomerations with more than 300 000 inhabitants are rising for Bangladesh India and
Pakistan but not for Sri Lanka
(Insert Figure 6)
The megacities in South-Asia were uncommon in the past but are now beginning to grow
in the region Today the four major countries of South Asia are home to at least 7 megacities
while 5 of them are in India Bangladesh Pakistan contains one each The only mega city of
Bangladesh Dhaka with its current population of 15 million bears the distinction of being the
fastest growing agglomeration in the world According to projections the city by the year 2025
will be home to more than 20 million people which is bigger than the Mexico City Beijing or
Shanghai In India New Delhi is the capital city having a population of 265 million people
Mumbai is the financial hub having a population of 214 million people Kolkata is an important
trading hub with 15 million people Bengaluru is the information technology hub with 105
million people and Chennai with its motor industry contains 102 million people Other urban
8
areas in India are growing rapidly and it is projected that India would have two more megacities
by the year 2030 viz Hyderabad with 128 million and Ahmedabad with 105 million
population As one of the populous countries in the world Pakistan is also home to some of the
worlds cities Its most populous city Karachi is not only the largest in Pakistan but is also the
7th most populous city in the world comprising about 11 Million people Pakistan also contains
Lahore as the second most populous city with about 63 million people and six other cities that
have crossed the one million population mark Sri Lanka at present has zero cities with more
than a million people but 10 cities with between 100000 and 1 million people Colombo happens
to be the largest city in Sri Lanka with a population of 648034 people and is possibly the only
megacity in the making The description of urban agglomerations with 300 000 or more inhabitants
during the year 2015 is provided in Table 1 for Bangladesh India Pakistan and Sri Lanka
(Insert Table 1)
5 Empirical Analysis
The urban transition and economic growth are often linked with each other because of the fact
that economic development has been found to promote urbanization while at the same time
rapid urbanization also led to higher economic growth It is argued in the literature that
individuals are drawn to cities that provide better education as well as employment in the
secondary and tertiary sectors The model by Eaton and Eckstein [1994] predicted that larger
cities could have higher levels of human capital and wages per worker Subsequently Becker
[2008] claimed that urbanization has led to the higher per capita GDP through higher
productivity levels Quigley [2013] suggests that the urbanization can positively impact upon
productivity through the localization of industries On the other hand Turok and McGranahan
[2013] clarified that it is not urbanization or the city size per se that induces economic growth
but the infrastructure base and institutional arrangements that matters for the success of the
urbanization story Castells-Quintana [2011] elaborated that the urbanization outcome on growth
could depend on several factors such as the stage of urbanization and nature of economic
activities Thus there could be many factors that ultimately determine the size and growth of
urban agglomerations in a country Similarly there could be many aspects other than
urbanization that could impact on the economic growth levels Consequently the examination of
9
the relative impacts of primary and secondary cities became an important subject in the applied
literature
However the empirical evidence on the relationship between urbanization and economic
growth has not remained uniform While Friedberg and Hunt [1995] claimed that economic
development is closely related with urbanization Bloom Canning and Fink [2008] argued that
there is no evidence that urbanization level affects economic growth rate Further while
urbanization had been found to bear a positive impact on economic growth in the case of
developed countries some studies have found a weak or negative relationship between
urbanization and economic growth in developing countries (Shabu 2010 Frick and Rodriguez-
Pose 2016 2017) Recent attempts on the relationship between urban population growth and
economic growth in have found no relationship between the variables and therefore inferred that
urban population growth did not impact upon the economic growth in developing countries (Fay
and Opal 2000 Polese 2005 Sarker et al 2016) The World Development Report by World Bank
[2013] indicated that not all countries that experienced higher levels of GDP are the ones with a
large share of urban population According to United Nations [2013] the positive relationship
between urbanization growth and per capita GDP levels remained apparent among the developed
countries However the relationship has been found to be lesser evidenced for the countries of
Latin America and the Caribbean and almost missing for the countries in sub-Saharan Africa
(United Nations 2013) While countries in the Eastern and South-eastern Asia such as China
Indonesia Malaysia Thailand and Vietnam experienced a steady increase in GDP per capita as
people moved to cities a similar increase in GDP per capita with urbanization was not observed
in individual nations of sub-Saharan Africa Thus the connection between per capita GDP and
the process of urbanization has been argued to be complex and the requirement of corresponding
planning and coordinating policies are highlighted for the urbanization process to aid economic
growth
The relationship between urbanization and economic growth in developing countries is
complex and may run in both directions The strong positive relationship between economic
growth measured by per capita gross domestic product (USD) and urbanization is confirmed for
Bangladesh India and Pakistan through the correlation coefficients referring to the period 1970-
2015 (Table 2) Sri Lanka however indicated a negative correlation during the same time period
While examining the link between average city size and aggregate economic growth Frick and
10
Rodriguez-Pose [2016] found no universal positive relationship between average city size and
economic growth for a sample of 114 countries during the period 1960-2010 Further their
results varied between the high-income and developing countries Thus while there is consistent
evidence of a positive link between city size and economic growth in high-income countries the
relationship did not hold for developing countries Figure 7 indicates how the percentage of
urban population in the South Asia is comparatively declining in small agglomerations and rising
toward large agglomerations during the time period 1950-2015
51 Methodology
Our objective is to examine as to how the pattern of primary and secondary city growth along
with control variables such as levels of urbanization impacted upon the economic growth
captured by the per capita GDP in the three major economies of South Asia viz Bangladesh
India and Pakistan We could not include Sri Lanka in this part of analysis due to data
limitations We begin by specifying a single-equation econometric model to explain the level of
per capita real GDP at 2005 prices (PCGDP) in USD in terms of the growth in cities of different
sizes We use variables for three city sizes ie number of cities with a population size above 5
million (CITY1) between 1 and 5 million (CITY2) and less than 1 million (CITY3) in these
three countries For our analysis we consider CITY1 and CITY2 as primary cities and CITY3
and CITY4 as secondary cities We also include the percentage of urban population (URBAN) as
a control variable to the cross-sectional data-set The regression equation is as follows
PCGDP= f (CITY1 CITY2 CITY3 URBAN)
with f prime CITY i gt 0 f prime URBAN gt 0
We subsequently add country dummies (D1 and D2) to combine the ten observations from each
of the three country samples with data ranging from 1970 to 2015 available at five-year
intervals The coefficients of the intercept dummies (D1 and D2) provide the difference in
intercepts of the country regression lines for the variable relationships We estimate the
regression equation as given in Equation (1) that focuses on whether the country characteristics
influenced the strength of the relationships
11
PCGDP = α + β1CITY1 + β2CITY2 + β3CITY3 + β4URBAN + β5D1 + β6D2 (1)
The inclusion of intercept dummy assumes parallel regressions across the three nations to
capture the influence of the explanatory variables in the model But if the intercept dummies
capturing country characteristics interact with one or more of the quantitative explanatory
variables then the regression lines would not be parallel To examine this aspect we
subsequently include the possibility of changes in the slope of the variable relationship by
including the interaction variables in Equation (2) This regression equation contains slope
dummies which are the product of intercept dummy variables and each of the continuous
explanatory variables in the model
PCGDP = α + β1CITY1 + β2CITY2 + β3CITY3 + β4URBAN + β5D1 + β6D2 + β7D1timesCITY1 +
β8D1timesCITY2 + β9D1timesCITY3 + β10D1timesURBAN + β11D2timesCITY1 + β12D2timesCITY2 +
β13D2timesCITY3 + β14D2timesURBAN (2)
Thus Equation (3) that includes the slope dummy variables in the regression model would
analyze whether the impacts of growth in urban agglomeration of different sizes on economic
growth differed across the three major economies in South Asia
52 Data Base
The basic data on urban population and distribution of cities grouped by year-end population in
urban agglomerates at the country level are derived from the lsquoWorld Urbanization Prospectsrsquo
2014 Revisionrsquo Population Division Department of Economic and Social Affairs United
Nations On the other hand the information on per capita GDP (in USD) for the countries are
accessed from the lsquoNational Accounts Statistics Version 2016rsquo Statistical Division Economic
and Social Development Division Department of Economic and Social Affairs United Nations)
53 Results
The results obtained from estimating the regression equations are provided in Table 2 Since the
OLS estimation generated autocorrelation problem as evident from the low Durbin-Watson test
statistic we have provided the results from Cochrane-Orcutt estimation after correcting the
serial-correlation problem The explanatory variables that turn out to be statistically significant
12
bear correct signs in all the equations In Equation (1a) and (1b) the levels of urbanization turned
out to be statistically significant and positive determinant of per capita GDP across the three
countries This is indicative of the fact that higher is the percentage of urban population the
higher is the level of per capita GDP among the three major South Asian countries of
Bangladesh India and Pakistan Our results indicate that cities with dissimilar population sizes
impacted differently on the levels of economic growth captured by per capita GDP in these three
countries Our results from Equation (1a) and (1b) suggest that the growth in secondary cities -
small and medium sized cities with population size less than 1 million and between 1-5 million
respectively - bear statistically significant impacts on the per capita GDP growth On the
contrary the impact of growth in primary or large cities with population size of more than 5
million did not turn out to be statistically significant across the economies The two intercept
dummies for India and Pakistan did not turn out to be significantly different from the benchmark
country Bangladesh The estimation of Equation (2a) and (2b) which includes the interaction
dummies for individual countries indicate that the coefficients remain mostly statistically
insignificant although bearing correct signs on the variable relationships Since the degrees of
freedom are really poor due to large number of explanatory variables we mainly focus on the
serial correlation corrected estimation of Equation 2(b) As before the impacts of the
urbanization level turned out to be statistically significant and positive determinant of per capita
GDP across the three countries The individual impacts of the disparate pattern of growth in
cities with different population size bear the correct positive signs for all the countries but turned
out to be statistically significant only in the case of India at 10 significance level for the
secondary cities of medium and small sizes Thus there is a clear indication that the individual
impacts of the growth in medium and small cities with population size between 1 to 5 million
and less than 1 million impacted positively on the economic growth for India As far as the
individual impact of the growth in primary cities with population size above 5 million on the
economic growth is concerned the evidence remains statistically insignificant in all the three
major countries from South Asia It may be noted that Frick and Rodriguez-Pose [2017] have
recently observed that small cities of up to 3 million inhabitants are more conducive to economic
growth for a majority of countries in the panel of 113 countries during the time period 1980 and
2010
13
6 Summary and Implications
It has been projected that the global urbanization process would remain a developing-country
phenomenon centered largely in Africa and Asia In the recent decades the urbanization process
has produced significant economic and social changes by creating jobs and reducing poverty
levels in many South Asian countries It is therefore argued that urbanization provides an
opportunity to for these countries to deliver employment livelihood and economic prosperity
(Ellis and Roberts 2016) However the story of South Asian urbanization remains distinctive due
to the scarcity of physical infrastructure high population density of megacities and adverse
environmental conditions The urbanization process of the region also remains hidden for the
discrepancies in the countryrsquos official definition or due to the existence of settlements that are
administered as rural entities In this background the main task of this paper was to focus on the
urbanization pattern of primary and secondary cities among the major South Asian countries and
subsequently examine their growth potentials Our analysis was carried out on the basis of using
cross-sectional data from Bangladesh India Pakistan and Sri Lanka during 1970-2015
Secondary cities in South Asia have undergone massive expansions in the previous
decade Our results indicate that the formation of city system according to population size has
remained uneven across the countries in the region The levels of South Asian urbanization
increased from about 24 percent in 1980 to 35 per cent in 2015 The proportion of urban
population constituted about 38 per cent in Pakistan above 30 per cent in India and Bangladesh
and about 18 per cent in Sri Lanka Despite the lower urbanization levels South Asia comprised
about 53 percent of the global urban population in the same year One can observe that
Bangladesh recorded a high urbanization rate and India is found to dominate the regional
urbanization trends due to its large population base The number of megacities (with 10 million
or more population) has gone up in South Asia comprising about 17 per cent of the urban
population whereas agglomeration between 5-10 million and 1-5 million inhabitants contained
about 9 and 20 percent of the total urban population respectively in the year 2015 The largest
proportion of the urban population in South Asia can however be located in the agglomerations
with less than 300 000 inhabitants The majority of the urban agglomerations in Bangladesh
India and Pakistan are in fact medium or small sized cities of less than 5 million or even lesser
number of inhabitants whereas Sri Lanka can be distinguished for small sized cities of less than
14
1 million inhabitants as leading agglomerations The highest share of urban populations in
Bangladesh India Pakistan and Sri Lanka are located in small sized agglomerations with less
than 300 000 inhabitants The megacities constituted about 32 per cent of the total urban
population in Bangladesh whereas small agglomerations (cities with less than 300 000
inhabitants) formed 82 per cent of the total urban population in Sri Lanka Our regression results
suggest that small (less than 1 million population) and medium (between 1-5 million
populations) cities yielded statistically significant impacts on per capita GDP growth whereas
the impacts of primary or large cities (more than 5 million population) remain statistically
insignificant across countries There is also an indication that the impacts of medium and small
cities impacted positively on the economic growth for India Thus in contrast to the prevailing
view that mega or large cities are growth-inducing our results suggest that small and medium
cities are more responsive to economic growth for the major economies in South Asia
The urbanization process provides the opportunity to realize the growth potential and
improve economic prosperity in the South Asian region UN [2016] in the review of world cities
has indicated that big cities can create wealth generate employment and drive human progress
but are also responsible for driving climate change inequality and exclusion Since the evidence
for positive city size effect on economic growth is weak in our major South Asian country
sample the policy focus on agglomeration and the benefit of large cities in this region would
appear inappropriate The majority of urban populations in South Asian countries are found to
residing in cities of less than one million Today the city growth in many South Asian countries
remains disorganized where urban population pressures on infrastructure basic services and
environment are already severe The region therefore faces real challenge with its urbanization
process and there is a need for developing specific policies for each of these countries for
removing the megacity constraints as well as developing the secondary cities It appears that a
balanced progress in primary and secondary cities can generate a more stable urban
agglomeration system in the region
15
Bibliography
Annez PC and RM Buckley [2009] Urbanization and Growth Setting the Context in M
Spence PC Annez and RM Buckley [Edited] Urbanization and Growth World Bank
Washington DC
Chen N P Valente and Z Zlotnik [1998] What Do We Know about Recent Trends in
Urbanization in RE Billsborrow [Edited] Migration Urbanization and Development New
Directions and Issues United Nations Population Fund and Kluwer Academic Publishers
Massachusetts 1998
Combes P G Duranton L Gobillon D Puga and S Roux [2012] The Productivity
Advantages of Large Cities Distinguishing Agglomeration from Firm Selection Econometrica
80 (6) November
Duranton G [2008] Cities Engines of Growth and Prosperity for Developing Countries
World Bank Washington DC
Duranton G and D Puga [2004] Micro Foundations of Urban Agglomeration Economies in J
V Henderson and J F Thisse (Edt) Handbook of Regional and Urban Economics Volume 4
Elsevier
Ellis P and M Roberts [2016] Leveraging Urbanization in South Asia World Bank
Washington DC
Eaton J and Z Eckstein [1994] Cities and Growth Theory and Evidence from France and
Japan National Bureau of Economic Research (NBER) Working Paper No 4612
Fay M and C Opal [2000] Urbanization without Growth A not so uncommon Phenomenon
Policy Research Working Paper No 2412 World Bank Washington DC
Frick S A and A Rodriguez-Pose [2016] Average City Size and Economic Growth
Cambridge Journal of Regions Economy and Society Volume 9 Issue 2 1 July 2016 Pages
301ndash318
Frick S A and A Rodriguez-Pose [2017] Big or Small Cities Centre for Economic Policy
Research (CEPR) Discussion Paper No DP-12324
Fujita M [1988] A Monopolistic Competition Model of Spatial Agglomeration A
Differentiated Product Approach Regional Science and Urban Economics Volume 18 pp 87ndash
124
Hamer AS J F Linn [2000] Urbanization in the Developing World Patterns Issues and
Policies in ES Mills [Edited] Handbook of Regional and Urban Economics Volume 2 North
Holland Amsterdam
16
Krugman P [1991] Geography and Trade MIT Press Cambridge
Lucas R E [1988] On the Mechanics of Economic Development Journal of Monetary
Economics Volume 22 pp 3ndash42
Mahbub ul Haq Human Development Centre [2014] Human Development in South Asia 2014
Urbanization Challenges and Opportunities Lahore University of Management Sciences
Lahore Pakistan
Martin P and G Ottaviano [2001] Growth and Agglomeration International Economic
Review Vol 42 No 4 November pp 947-968
Polegravese Mario [2005] Cites and National Economic Growth A Reappraisal Urban Studies
42(8) pp 1429-1451
Quigley JM [2013] Agglomeration Regional Growth and Economic Development In
Klaesson J Johansson B Karlsson C (Edited) Metropolitan Regions Advances in Spatial
Science Springer Berlin
Roberts BH [2014] Managing Systems of Secondary Cities Cities Alliance Brussels
Roberts B and T Kanaley [Edited 2006] Urbanization and Sustainability in Asia Case
Studies of Good Practices Asian Development Bank Manila
Sarker S A Khan and M M Mannan [2016] Urban Population and Economic Growth South
Asia Perspective European Journal of Government and Economics Volume 5 Number 1 June
2016
Shabu Terwase [2010] The Relationship between Urbanization and Economic Development in
Developing Countries International Journal of Economic Development Research and
Investment 1(2) pp 30-36
Spence M P Annez and R Buckley [2009] Urbanization and Growth World Bank
Washington DC
Turok I and G McGranahan [2013] Urbanization and Economic Growth The Arguments and
Evidence for Africa and Asia Environment and Urbanization 25(1) pp 465-482
Venables AJ [1996] Equilibrium Locations of Vertically Linked Industries International
Economic Review Volume 37 pp 341-59
United Nations [2014] World Urbanization Prospects Population Division Department of
Economic and Social Affairs United Nations New York
17
United Nations [2016a] Policies on Spatial Distribution and Urbanization Data Booklet No
STESASERA394 Population Division Department of Economic and Social Affairs UN
New York
United Nations [2016b] The Worldrsquos Cities in 2016 Population Division Department of
Economic and Social Affairs UN New York
United Nations Human Settlements Programme (UN-Habitat) and United Nations Economic and
Social Commission for Asia and the Pacific (ESCAP) [2015] The State of Asian and Pacific
Cities 2015
World Bank [1991] Urban Policy and Economic Development An Agenda for the 1990s World
Bank Washington DC
World Bank [2013] Urbanization Beyond Municipal Boundaries Nurturing Metropolitan
Economies and Connecting Peri-Urban Areas in India World Bank Washington DC
18
Table 1 Urban Agglomerations (with 300 000 or more Inhabitants) in South Asian Countries 2015
Bangladesh Barisal Bogra Chittagong Comilla Dhaka Khulna Mymensingh Rajshahi
Rangpur and Sylhet (10)
India Agartala Agra Ahmadabad Ahmadnagar Aizawl Ajmer Akola Aligarh
Allahabad Alwar Amravati Amritsar Anand Anantapur Asansol Aurangabad
Baharampur Bangalore Barddhaman Bareilly Bathinda Begusarai Belgaum
Bellary Bhagalpur Bhavnagar Bhilwara Bhiwandi Bhopal Bhubaneswar Bihar
Sharif Bijapur Bikaner Bilaspur Bokaro Steel City Brahmapur Chandigarh
Chandrapur Chennai (Madras) Cherthala Coimbatore Cuttack Darbhanga
Davangere Dehradun Delhi Dewas Dhanbad Dhule Dindigul Durgapur Durg-
Bhilainagar English Bazar Erode Farrukhabad Firozabad Gaya Gorakhpur
Gulbarga Guntur Guwahati (Gauhati) Gwalior Habra Hardwar Hisar Hosur
Hubli-Dharwad Hyderabad Ichalakaranji Imphal Indore Jabalpur Jaipur
Jalandhar Jalgaon Jalna Jammu Jamnagar Jamshedpur Jhansi Jodhpur
Junagadh Kadapa Kakinada Kannur Kanpur Karimnagar Kayamkulam Kochi
(Cochin) Kolhapur Kolkata (Calcutta) Kollam Korba Kota Kottayam
Kozhikode (Calicut) Kurnool Latur Lucknow Ludhiana Madurai Malappuram
Malegaon Mangalore Mathura Maunath Bhanjan Meerut Moradabad Mumbai
(Bombay) Muzaffarnagar Muzaffarpur Mysore Nagpur Nanded Waghala
Nashik Navsari Nellore Nizamabad Palakkad Panipat Parbhani Patiala Patna
Puducherry Pune (Poona) Purnia Raipur Rajahmundry Rajkot Rampur Ranchi
Ranipet Raurkela Rohtak Roorkee Sagar Saharanpur Salem Sangali Santipur
Satna Shahjahanpur Shillong Shimoga Siliguri Solapur Srinagar Surat
Thanjavur Thiruvananthapuram Thoothukkudi (Tuticorin) Thrissur
Tiruchirappalli Tirunelveli Tirupati Tiruppur Tumkur Udaipur Ujjain
Vadodara Varanasi (Benares) Vellore Vijayawada Visakhapatnam Warangal and
Yamunanagar (166)
Pakistan Bahawalpur Dera Ghazikhan Faisalabad Gujranwala Gujrat Hyderabad
Islamabad Jhang Karachi Kasur Lahore Larkana Mardan Multan Nawabshah
Okara Peshawar Quetta Rahim Yar Khan Rawalpindi Sargodha Sheikhupura
Sialkot Sukkur and Wah (27)
Sri Lanka Colombo (1)
Note The number in parentheses indicate the number of such agglomerations in 2015
19
Table 2 Correlation of Urbanization amp Per Capita GDP in South Asian Countries (1970- 2015)
Bangladesh India Pakistan Sri Lanka
Correlation between PCGDP (USD) amp
Percentage of Total Urban Population
+089 +088 +095 -056
Correlation between PCGDP (USD) amp
Percentage of Population Living in 300000
plus Agglomeration
+086 +089 +098 -066
20
Table 3 Regression Results Dependent Variable Per Capita GDP (USD) at Constant (= 2005
Prices) in Bangladesh India amp Pakistan (sample 1970-2015 at 5-year intervals = 30 observations)
Explanatory Variables darr OLS (1a) Cochrane-Orcutt
(AR2) (1b)
OLS (2a) Cochrane-
Orcutt (AR2) (2b)
Constant -459
(-055)
-4402
(-111)
1670
(176)
1190
(067)
Percentage of Urban Population
(URBAN)
1690
(439)
2399
(287)
104
(010)
1896
(195)
Number of cities with Population
above 5 Million (CITY1)
1269
(030)
-762
(-066)
-682
(-007)
5210
(-035)
Number of cities with Population
between 1to 5 Million (CITY2)
1959
(279)
1013
(286)
-022
(-003)
-2420
(-070)
Number of cities with Population
less than 1 Million (CITY3)
-243
(-073)
683
(273)
5308
(265)
-2164
(-077)
Dummy 1 (D1) -17386
(-126)
-2370
(-139)
3639
(246)
40780
(042)
Dummy 2 (D2) 3888
(076)
1416
(057)
-50270
(-071)
-59060
(-103)
Dummy 1 times URBAN -24420
(-250)
-7313
(-124)
Dummy 1 times CITY1 -202
(-001)
3650
(052)
Dummy 1 times CITY2 4160
(061)
4032
(136)
Dummy 1 times CITY3 -2201
(-092)
3813
(135)
Dummy 2 times URBAN 2460
(074)
881
(033)
Dummy 2 times CITY1 1524
(012)
6553
(077)
Dummy 2 times CITY2 1543
(021)
4085
(096)
Dummy 2 times CITY3 -4418
(-157
3353
(110)
R-Squarred 091 098 097 098
R-Bar-Squarred 089 098 095 097
DW Statistic 090 185 161 191
F-Statistic 4182 13811 4050 6250
Note and indicate statistical significance at 5 and 10 level of significance respectively
21
South Asia 348
Afghanistan 267
Bangladesh 342
Bhutan 386
India 327
Iran 733
Maldives 455
Nepal 186
Pakistan 387
Sri Lanka 183
0
10
20
30
40
50
60
70
80
Source UN [2014]
Figure 1 Percentage of Urban Population in
South Asia 1950-2015
SouthAsia 122
Bangladesh 236
India 114
Pakistan 115
Sri Lanka 004
-050
0
050
100
150
200
250
300
350
1980-85 1985-90 1990-95 1995-2000 2000-05 2005-10 2010-15
Source UN [2014]
Figure 2 Average Annual Rate of Change in Percentage of
Urban Population 1980-2015
22
Bngladesh 88
India 673
Pakistan 117
Srilanka 0600
100
200
300
400
500
600
700
800
900
1950 1955 1960 1965 1970 1975 1980 1985 1990 1995 2000 2005 2010 2015
Source Derived from UN [2014]
Figure 3 Country Share of Urban Population in South Asia
0
10
20
30
40
50
60
70
80
90
100
Asia South Asia Bangladesh India Pakistan Srilanka
24 28
18
28 32
0
3328 27
2924
100
36 3745
36 36
0
Source Derived from UN [2014]
Figure 4 Percentage Distribution of Cities Classified by
Size of Urban Agglomerations 2015
10 million or more 5 to 10 million
1 to 5 million 500 000 to 1 million
300 000 to 500 000
23
0
10
20
30
40
50
60
70
80
90
Asia South Asia Bangladesh India Pakistan Srilanka
138 169
320
170227
0
410 421
504
412331
821
Source Derived from UN [2014]
Figure 5 Percentage of Urban Population Classified by
Agglomeration Size 2015
10 million or more 5 to 10 million
1 to 5 million 500 000 to 1 million
300 000 to 500 000 Fewer than 300 000
Bangladsh-10 17
India-166 19
Pakistan-25 26
Sri Lanka-1 3
0
5
10
15
20
25
30
Source Derived from UN [2014]
Figure 6 Percentage of Population Living in Urban
Agglomerations with 300 000 or more Inhabitants as of
Total Population 1950-2015
24
World (5 million or more) 197
World (Less than 1 million) 589
Asia (5 million or more) 232
Asia (Less than 1 million) 506
SAsia (5 million or more) 257
SAsia (Less than 1 million) 546
00
100
200
300
400
500
600
700
800
900
1950 1955 1960 1965 1970 1975 1980 1985 1990 1995 2000 2005 2010 2015
Source Derived from UN [2014]
Figure 7 Percentage of Urban Population in Small amp Large
Agglomerations 1950-2015
- Annez PC and RM Buckley [2009] Urbanization and Growth Setting the Context in M Spence PC Annez and RM Buckley [Edited] Urbanization and Growth World Bank Washington DC
- Combes P G Duranton L Gobillon D Puga and S Roux [2012] The Productivity Advantages of Large Cities Distinguishing Agglomeration from Firm Selection Econometrica 80 (6) November
-
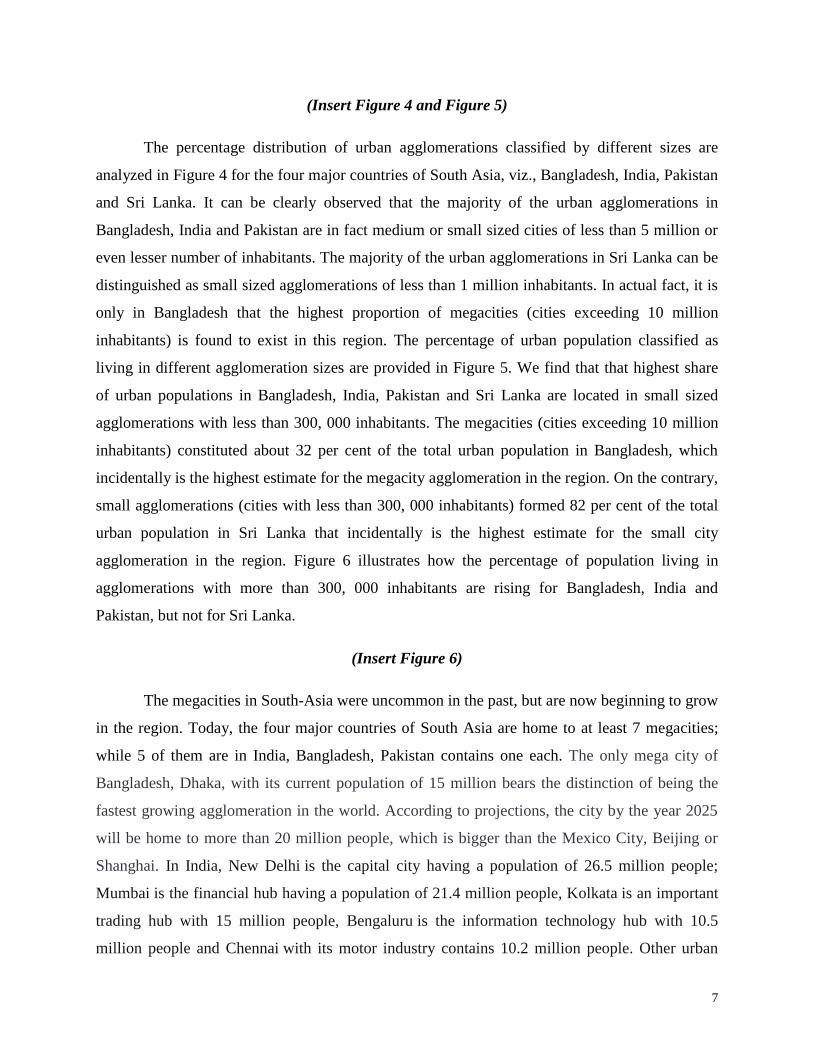
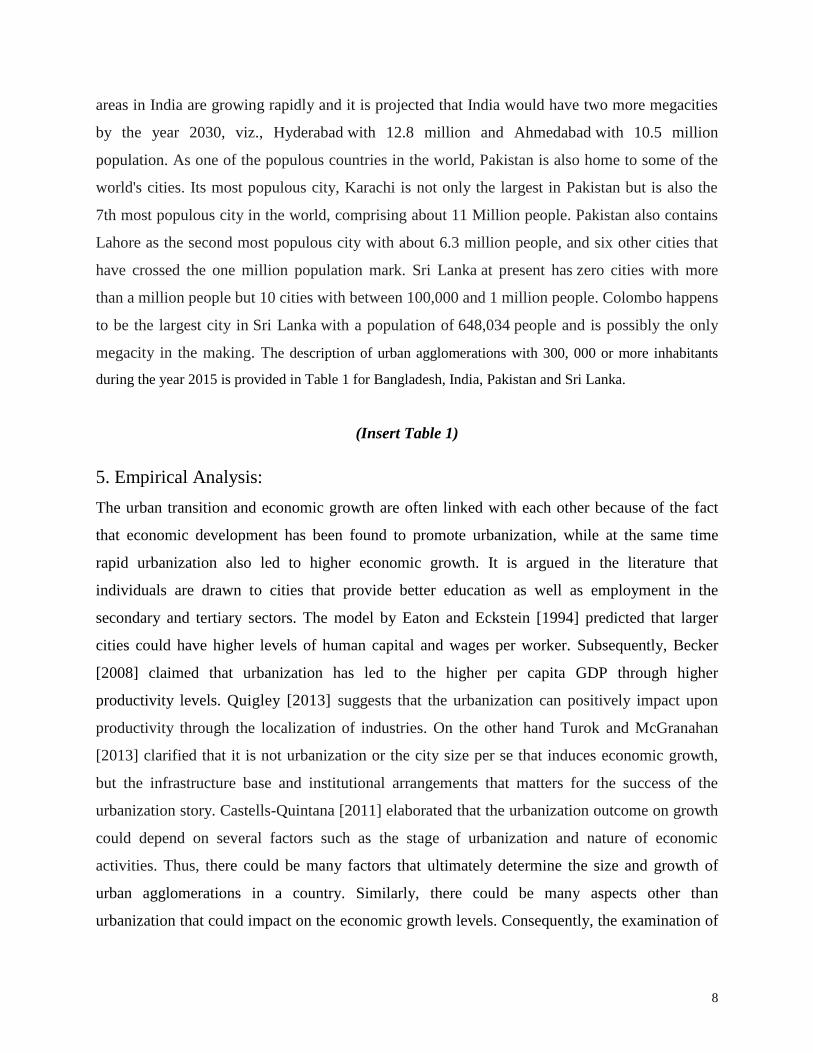
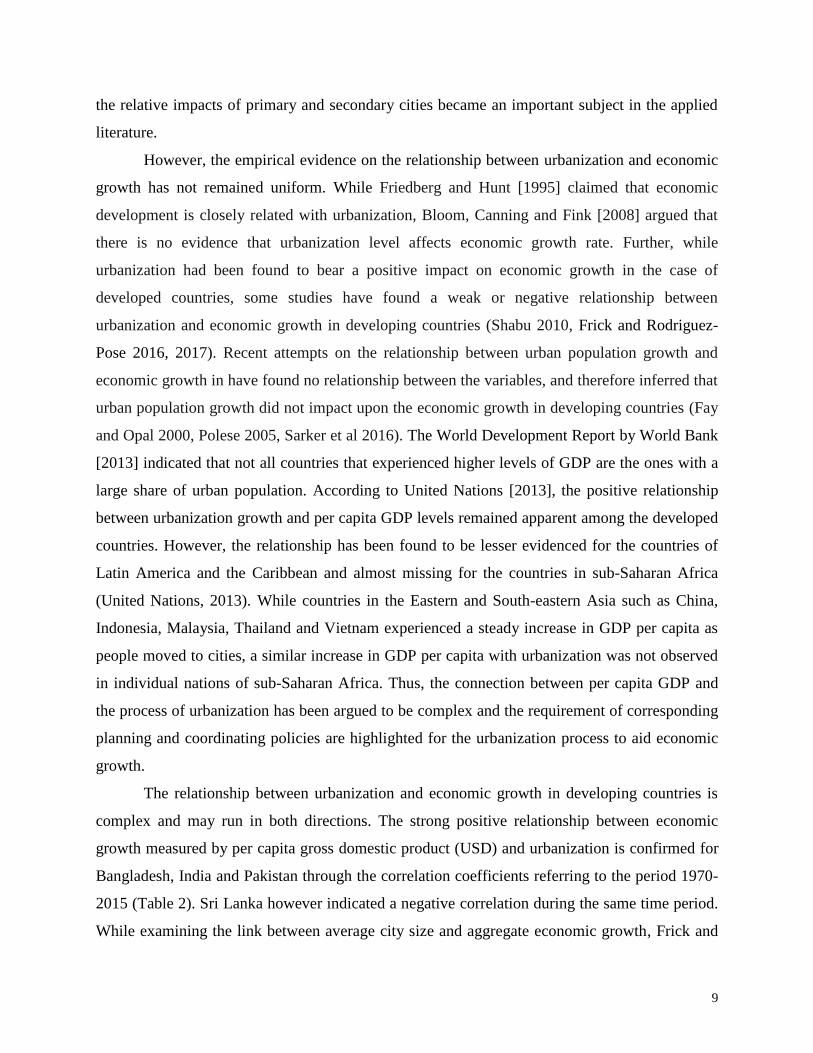
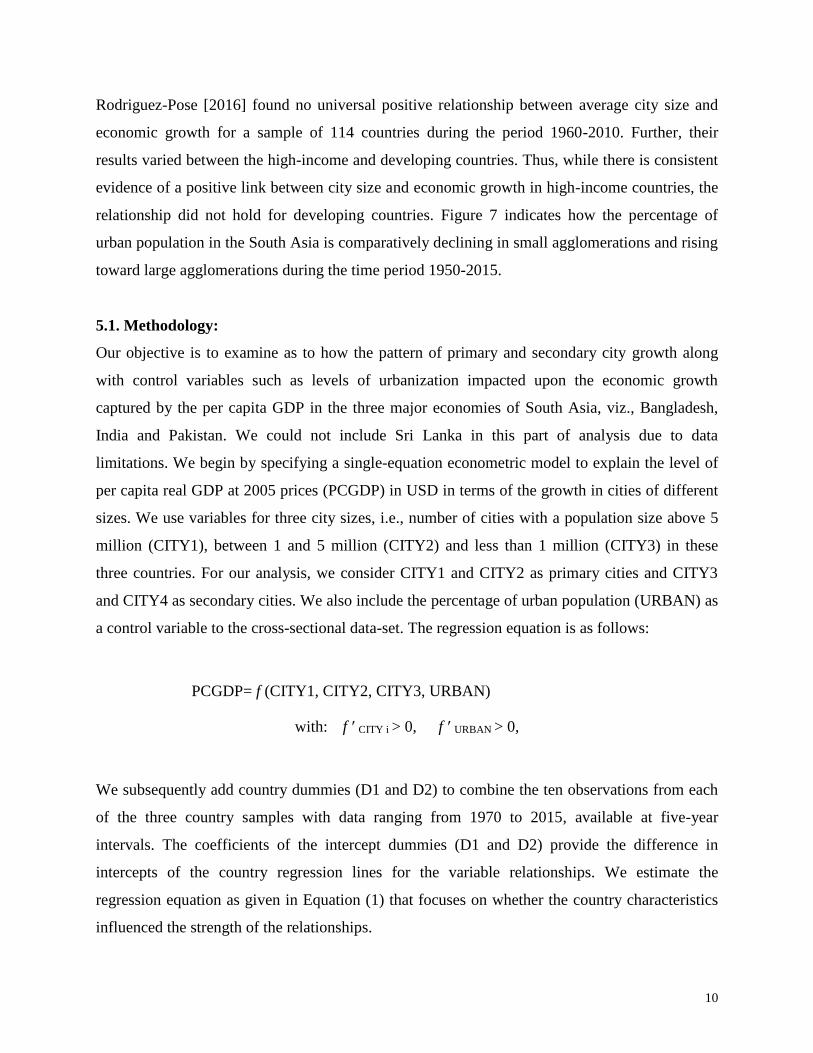
10
Rodriguez-Pose [2016] found no universal positive relationship between average city size and
economic growth for a sample of 114 countries during the period 1960-2010 Further their
results varied between the high-income and developing countries Thus while there is consistent
evidence of a positive link between city size and economic growth in high-income countries the
relationship did not hold for developing countries Figure 7 indicates how the percentage of
urban population in the South Asia is comparatively declining in small agglomerations and rising
toward large agglomerations during the time period 1950-2015
51 Methodology
Our objective is to examine as to how the pattern of primary and secondary city growth along
with control variables such as levels of urbanization impacted upon the economic growth
captured by the per capita GDP in the three major economies of South Asia viz Bangladesh
India and Pakistan We could not include Sri Lanka in this part of analysis due to data
limitations We begin by specifying a single-equation econometric model to explain the level of
per capita real GDP at 2005 prices (PCGDP) in USD in terms of the growth in cities of different
sizes We use variables for three city sizes ie number of cities with a population size above 5
million (CITY1) between 1 and 5 million (CITY2) and less than 1 million (CITY3) in these
three countries For our analysis we consider CITY1 and CITY2 as primary cities and CITY3
and CITY4 as secondary cities We also include the percentage of urban population (URBAN) as
a control variable to the cross-sectional data-set The regression equation is as follows
PCGDP= f (CITY1 CITY2 CITY3 URBAN)
with f prime CITY i gt 0 f prime URBAN gt 0
We subsequently add country dummies (D1 and D2) to combine the ten observations from each
of the three country samples with data ranging from 1970 to 2015 available at five-year
intervals The coefficients of the intercept dummies (D1 and D2) provide the difference in
intercepts of the country regression lines for the variable relationships We estimate the
regression equation as given in Equation (1) that focuses on whether the country characteristics
influenced the strength of the relationships
11
PCGDP = α + β1CITY1 + β2CITY2 + β3CITY3 + β4URBAN + β5D1 + β6D2 (1)
The inclusion of intercept dummy assumes parallel regressions across the three nations to
capture the influence of the explanatory variables in the model But if the intercept dummies
capturing country characteristics interact with one or more of the quantitative explanatory
variables then the regression lines would not be parallel To examine this aspect we
subsequently include the possibility of changes in the slope of the variable relationship by
including the interaction variables in Equation (2) This regression equation contains slope
dummies which are the product of intercept dummy variables and each of the continuous
explanatory variables in the model
PCGDP = α + β1CITY1 + β2CITY2 + β3CITY3 + β4URBAN + β5D1 + β6D2 + β7D1timesCITY1 +
β8D1timesCITY2 + β9D1timesCITY3 + β10D1timesURBAN + β11D2timesCITY1 + β12D2timesCITY2 +
β13D2timesCITY3 + β14D2timesURBAN (2)
Thus Equation (3) that includes the slope dummy variables in the regression model would
analyze whether the impacts of growth in urban agglomeration of different sizes on economic
growth differed across the three major economies in South Asia
52 Data Base
The basic data on urban population and distribution of cities grouped by year-end population in
urban agglomerates at the country level are derived from the lsquoWorld Urbanization Prospectsrsquo
2014 Revisionrsquo Population Division Department of Economic and Social Affairs United
Nations On the other hand the information on per capita GDP (in USD) for the countries are
accessed from the lsquoNational Accounts Statistics Version 2016rsquo Statistical Division Economic
and Social Development Division Department of Economic and Social Affairs United Nations)
53 Results
The results obtained from estimating the regression equations are provided in Table 2 Since the
OLS estimation generated autocorrelation problem as evident from the low Durbin-Watson test
statistic we have provided the results from Cochrane-Orcutt estimation after correcting the
serial-correlation problem The explanatory variables that turn out to be statistically significant
12
bear correct signs in all the equations In Equation (1a) and (1b) the levels of urbanization turned
out to be statistically significant and positive determinant of per capita GDP across the three
countries This is indicative of the fact that higher is the percentage of urban population the
higher is the level of per capita GDP among the three major South Asian countries of
Bangladesh India and Pakistan Our results indicate that cities with dissimilar population sizes
impacted differently on the levels of economic growth captured by per capita GDP in these three
countries Our results from Equation (1a) and (1b) suggest that the growth in secondary cities -
small and medium sized cities with population size less than 1 million and between 1-5 million
respectively - bear statistically significant impacts on the per capita GDP growth On the
contrary the impact of growth in primary or large cities with population size of more than 5
million did not turn out to be statistically significant across the economies The two intercept
dummies for India and Pakistan did not turn out to be significantly different from the benchmark
country Bangladesh The estimation of Equation (2a) and (2b) which includes the interaction
dummies for individual countries indicate that the coefficients remain mostly statistically
insignificant although bearing correct signs on the variable relationships Since the degrees of
freedom are really poor due to large number of explanatory variables we mainly focus on the
serial correlation corrected estimation of Equation 2(b) As before the impacts of the
urbanization level turned out to be statistically significant and positive determinant of per capita
GDP across the three countries The individual impacts of the disparate pattern of growth in
cities with different population size bear the correct positive signs for all the countries but turned
out to be statistically significant only in the case of India at 10 significance level for the
secondary cities of medium and small sizes Thus there is a clear indication that the individual
impacts of the growth in medium and small cities with population size between 1 to 5 million
and less than 1 million impacted positively on the economic growth for India As far as the
individual impact of the growth in primary cities with population size above 5 million on the
economic growth is concerned the evidence remains statistically insignificant in all the three
major countries from South Asia It may be noted that Frick and Rodriguez-Pose [2017] have
recently observed that small cities of up to 3 million inhabitants are more conducive to economic
growth for a majority of countries in the panel of 113 countries during the time period 1980 and
2010
13
6 Summary and Implications
It has been projected that the global urbanization process would remain a developing-country
phenomenon centered largely in Africa and Asia In the recent decades the urbanization process
has produced significant economic and social changes by creating jobs and reducing poverty
levels in many South Asian countries It is therefore argued that urbanization provides an
opportunity to for these countries to deliver employment livelihood and economic prosperity
(Ellis and Roberts 2016) However the story of South Asian urbanization remains distinctive due
to the scarcity of physical infrastructure high population density of megacities and adverse
environmental conditions The urbanization process of the region also remains hidden for the
discrepancies in the countryrsquos official definition or due to the existence of settlements that are
administered as rural entities In this background the main task of this paper was to focus on the
urbanization pattern of primary and secondary cities among the major South Asian countries and
subsequently examine their growth potentials Our analysis was carried out on the basis of using
cross-sectional data from Bangladesh India Pakistan and Sri Lanka during 1970-2015
Secondary cities in South Asia have undergone massive expansions in the previous
decade Our results indicate that the formation of city system according to population size has
remained uneven across the countries in the region The levels of South Asian urbanization
increased from about 24 percent in 1980 to 35 per cent in 2015 The proportion of urban
population constituted about 38 per cent in Pakistan above 30 per cent in India and Bangladesh
and about 18 per cent in Sri Lanka Despite the lower urbanization levels South Asia comprised
about 53 percent of the global urban population in the same year One can observe that
Bangladesh recorded a high urbanization rate and India is found to dominate the regional
urbanization trends due to its large population base The number of megacities (with 10 million
or more population) has gone up in South Asia comprising about 17 per cent of the urban
population whereas agglomeration between 5-10 million and 1-5 million inhabitants contained
about 9 and 20 percent of the total urban population respectively in the year 2015 The largest
proportion of the urban population in South Asia can however be located in the agglomerations
with less than 300 000 inhabitants The majority of the urban agglomerations in Bangladesh
India and Pakistan are in fact medium or small sized cities of less than 5 million or even lesser
number of inhabitants whereas Sri Lanka can be distinguished for small sized cities of less than
14
1 million inhabitants as leading agglomerations The highest share of urban populations in
Bangladesh India Pakistan and Sri Lanka are located in small sized agglomerations with less
than 300 000 inhabitants The megacities constituted about 32 per cent of the total urban
population in Bangladesh whereas small agglomerations (cities with less than 300 000
inhabitants) formed 82 per cent of the total urban population in Sri Lanka Our regression results
suggest that small (less than 1 million population) and medium (between 1-5 million
populations) cities yielded statistically significant impacts on per capita GDP growth whereas
the impacts of primary or large cities (more than 5 million population) remain statistically
insignificant across countries There is also an indication that the impacts of medium and small
cities impacted positively on the economic growth for India Thus in contrast to the prevailing
view that mega or large cities are growth-inducing our results suggest that small and medium
cities are more responsive to economic growth for the major economies in South Asia
The urbanization process provides the opportunity to realize the growth potential and
improve economic prosperity in the South Asian region UN [2016] in the review of world cities
has indicated that big cities can create wealth generate employment and drive human progress
but are also responsible for driving climate change inequality and exclusion Since the evidence
for positive city size effect on economic growth is weak in our major South Asian country
sample the policy focus on agglomeration and the benefit of large cities in this region would
appear inappropriate The majority of urban populations in South Asian countries are found to
residing in cities of less than one million Today the city growth in many South Asian countries
remains disorganized where urban population pressures on infrastructure basic services and
environment are already severe The region therefore faces real challenge with its urbanization
process and there is a need for developing specific policies for each of these countries for
removing the megacity constraints as well as developing the secondary cities It appears that a
balanced progress in primary and secondary cities can generate a more stable urban
agglomeration system in the region
15
Bibliography
Annez PC and RM Buckley [2009] Urbanization and Growth Setting the Context in M
Spence PC Annez and RM Buckley [Edited] Urbanization and Growth World Bank
Washington DC
Chen N P Valente and Z Zlotnik [1998] What Do We Know about Recent Trends in
Urbanization in RE Billsborrow [Edited] Migration Urbanization and Development New
Directions and Issues United Nations Population Fund and Kluwer Academic Publishers
Massachusetts 1998
Combes P G Duranton L Gobillon D Puga and S Roux [2012] The Productivity
Advantages of Large Cities Distinguishing Agglomeration from Firm Selection Econometrica
80 (6) November
Duranton G [2008] Cities Engines of Growth and Prosperity for Developing Countries
World Bank Washington DC
Duranton G and D Puga [2004] Micro Foundations of Urban Agglomeration Economies in J
V Henderson and J F Thisse (Edt) Handbook of Regional and Urban Economics Volume 4
Elsevier
Ellis P and M Roberts [2016] Leveraging Urbanization in South Asia World Bank
Washington DC
Eaton J and Z Eckstein [1994] Cities and Growth Theory and Evidence from France and
Japan National Bureau of Economic Research (NBER) Working Paper No 4612
Fay M and C Opal [2000] Urbanization without Growth A not so uncommon Phenomenon
Policy Research Working Paper No 2412 World Bank Washington DC
Frick S A and A Rodriguez-Pose [2016] Average City Size and Economic Growth
Cambridge Journal of Regions Economy and Society Volume 9 Issue 2 1 July 2016 Pages
301ndash318
Frick S A and A Rodriguez-Pose [2017] Big or Small Cities Centre for Economic Policy
Research (CEPR) Discussion Paper No DP-12324
Fujita M [1988] A Monopolistic Competition Model of Spatial Agglomeration A
Differentiated Product Approach Regional Science and Urban Economics Volume 18 pp 87ndash
124
Hamer AS J F Linn [2000] Urbanization in the Developing World Patterns Issues and
Policies in ES Mills [Edited] Handbook of Regional and Urban Economics Volume 2 North
Holland Amsterdam
16
Krugman P [1991] Geography and Trade MIT Press Cambridge
Lucas R E [1988] On the Mechanics of Economic Development Journal of Monetary
Economics Volume 22 pp 3ndash42
Mahbub ul Haq Human Development Centre [2014] Human Development in South Asia 2014
Urbanization Challenges and Opportunities Lahore University of Management Sciences
Lahore Pakistan
Martin P and G Ottaviano [2001] Growth and Agglomeration International Economic
Review Vol 42 No 4 November pp 947-968
Polegravese Mario [2005] Cites and National Economic Growth A Reappraisal Urban Studies
42(8) pp 1429-1451
Quigley JM [2013] Agglomeration Regional Growth and Economic Development In
Klaesson J Johansson B Karlsson C (Edited) Metropolitan Regions Advances in Spatial
Science Springer Berlin
Roberts BH [2014] Managing Systems of Secondary Cities Cities Alliance Brussels
Roberts B and T Kanaley [Edited 2006] Urbanization and Sustainability in Asia Case
Studies of Good Practices Asian Development Bank Manila
Sarker S A Khan and M M Mannan [2016] Urban Population and Economic Growth South
Asia Perspective European Journal of Government and Economics Volume 5 Number 1 June
2016
Shabu Terwase [2010] The Relationship between Urbanization and Economic Development in
Developing Countries International Journal of Economic Development Research and
Investment 1(2) pp 30-36
Spence M P Annez and R Buckley [2009] Urbanization and Growth World Bank
Washington DC
Turok I and G McGranahan [2013] Urbanization and Economic Growth The Arguments and
Evidence for Africa and Asia Environment and Urbanization 25(1) pp 465-482
Venables AJ [1996] Equilibrium Locations of Vertically Linked Industries International
Economic Review Volume 37 pp 341-59
United Nations [2014] World Urbanization Prospects Population Division Department of
Economic and Social Affairs United Nations New York
17
United Nations [2016a] Policies on Spatial Distribution and Urbanization Data Booklet No
STESASERA394 Population Division Department of Economic and Social Affairs UN
New York
United Nations [2016b] The Worldrsquos Cities in 2016 Population Division Department of
Economic and Social Affairs UN New York
United Nations Human Settlements Programme (UN-Habitat) and United Nations Economic and
Social Commission for Asia and the Pacific (ESCAP) [2015] The State of Asian and Pacific
Cities 2015
World Bank [1991] Urban Policy and Economic Development An Agenda for the 1990s World
Bank Washington DC
World Bank [2013] Urbanization Beyond Municipal Boundaries Nurturing Metropolitan
Economies and Connecting Peri-Urban Areas in India World Bank Washington DC
18
Table 1 Urban Agglomerations (with 300 000 or more Inhabitants) in South Asian Countries 2015
Bangladesh Barisal Bogra Chittagong Comilla Dhaka Khulna Mymensingh Rajshahi
Rangpur and Sylhet (10)
India Agartala Agra Ahmadabad Ahmadnagar Aizawl Ajmer Akola Aligarh
Allahabad Alwar Amravati Amritsar Anand Anantapur Asansol Aurangabad
Baharampur Bangalore Barddhaman Bareilly Bathinda Begusarai Belgaum
Bellary Bhagalpur Bhavnagar Bhilwara Bhiwandi Bhopal Bhubaneswar Bihar
Sharif Bijapur Bikaner Bilaspur Bokaro Steel City Brahmapur Chandigarh
Chandrapur Chennai (Madras) Cherthala Coimbatore Cuttack Darbhanga
Davangere Dehradun Delhi Dewas Dhanbad Dhule Dindigul Durgapur Durg-
Bhilainagar English Bazar Erode Farrukhabad Firozabad Gaya Gorakhpur
Gulbarga Guntur Guwahati (Gauhati) Gwalior Habra Hardwar Hisar Hosur
Hubli-Dharwad Hyderabad Ichalakaranji Imphal Indore Jabalpur Jaipur
Jalandhar Jalgaon Jalna Jammu Jamnagar Jamshedpur Jhansi Jodhpur
Junagadh Kadapa Kakinada Kannur Kanpur Karimnagar Kayamkulam Kochi
(Cochin) Kolhapur Kolkata (Calcutta) Kollam Korba Kota Kottayam
Kozhikode (Calicut) Kurnool Latur Lucknow Ludhiana Madurai Malappuram
Malegaon Mangalore Mathura Maunath Bhanjan Meerut Moradabad Mumbai
(Bombay) Muzaffarnagar Muzaffarpur Mysore Nagpur Nanded Waghala
Nashik Navsari Nellore Nizamabad Palakkad Panipat Parbhani Patiala Patna
Puducherry Pune (Poona) Purnia Raipur Rajahmundry Rajkot Rampur Ranchi
Ranipet Raurkela Rohtak Roorkee Sagar Saharanpur Salem Sangali Santipur
Satna Shahjahanpur Shillong Shimoga Siliguri Solapur Srinagar Surat
Thanjavur Thiruvananthapuram Thoothukkudi (Tuticorin) Thrissur
Tiruchirappalli Tirunelveli Tirupati Tiruppur Tumkur Udaipur Ujjain
Vadodara Varanasi (Benares) Vellore Vijayawada Visakhapatnam Warangal and
Yamunanagar (166)
Pakistan Bahawalpur Dera Ghazikhan Faisalabad Gujranwala Gujrat Hyderabad
Islamabad Jhang Karachi Kasur Lahore Larkana Mardan Multan Nawabshah
Okara Peshawar Quetta Rahim Yar Khan Rawalpindi Sargodha Sheikhupura
Sialkot Sukkur and Wah (27)
Sri Lanka Colombo (1)
Note The number in parentheses indicate the number of such agglomerations in 2015
19
Table 2 Correlation of Urbanization amp Per Capita GDP in South Asian Countries (1970- 2015)
Bangladesh India Pakistan Sri Lanka
Correlation between PCGDP (USD) amp
Percentage of Total Urban Population
+089 +088 +095 -056
Correlation between PCGDP (USD) amp
Percentage of Population Living in 300000
plus Agglomeration
+086 +089 +098 -066
20
Table 3 Regression Results Dependent Variable Per Capita GDP (USD) at Constant (= 2005
Prices) in Bangladesh India amp Pakistan (sample 1970-2015 at 5-year intervals = 30 observations)
Explanatory Variables darr OLS (1a) Cochrane-Orcutt
(AR2) (1b)
OLS (2a) Cochrane-
Orcutt (AR2) (2b)
Constant -459
(-055)
-4402
(-111)
1670
(176)
1190
(067)
Percentage of Urban Population
(URBAN)
1690
(439)
2399
(287)
104
(010)
1896
(195)
Number of cities with Population
above 5 Million (CITY1)
1269
(030)
-762
(-066)
-682
(-007)
5210
(-035)
Number of cities with Population
between 1to 5 Million (CITY2)
1959
(279)
1013
(286)
-022
(-003)
-2420
(-070)
Number of cities with Population
less than 1 Million (CITY3)
-243
(-073)
683
(273)
5308
(265)
-2164
(-077)
Dummy 1 (D1) -17386
(-126)
-2370
(-139)
3639
(246)
40780
(042)
Dummy 2 (D2) 3888
(076)
1416
(057)
-50270
(-071)
-59060
(-103)
Dummy 1 times URBAN -24420
(-250)
-7313
(-124)
Dummy 1 times CITY1 -202
(-001)
3650
(052)
Dummy 1 times CITY2 4160
(061)
4032
(136)
Dummy 1 times CITY3 -2201
(-092)
3813
(135)
Dummy 2 times URBAN 2460
(074)
881
(033)
Dummy 2 times CITY1 1524
(012)
6553
(077)
Dummy 2 times CITY2 1543
(021)
4085
(096)
Dummy 2 times CITY3 -4418
(-157
3353
(110)
R-Squarred 091 098 097 098
R-Bar-Squarred 089 098 095 097
DW Statistic 090 185 161 191
F-Statistic 4182 13811 4050 6250
Note and indicate statistical significance at 5 and 10 level of significance respectively
21
South Asia 348
Afghanistan 267
Bangladesh 342
Bhutan 386
India 327
Iran 733
Maldives 455
Nepal 186
Pakistan 387
Sri Lanka 183
0
10
20
30
40
50
60
70
80
Source UN [2014]
Figure 1 Percentage of Urban Population in
South Asia 1950-2015
SouthAsia 122
Bangladesh 236
India 114
Pakistan 115
Sri Lanka 004
-050
0
050
100
150
200
250
300
350
1980-85 1985-90 1990-95 1995-2000 2000-05 2005-10 2010-15
Source UN [2014]
Figure 2 Average Annual Rate of Change in Percentage of
Urban Population 1980-2015
22
Bngladesh 88
India 673
Pakistan 117
Srilanka 0600
100
200
300
400
500
600
700
800
900
1950 1955 1960 1965 1970 1975 1980 1985 1990 1995 2000 2005 2010 2015
Source Derived from UN [2014]
Figure 3 Country Share of Urban Population in South Asia
0
10
20
30
40
50
60
70
80
90
100
Asia South Asia Bangladesh India Pakistan Srilanka
24 28
18
28 32
0
3328 27
2924
100
36 3745
36 36
0
Source Derived from UN [2014]
Figure 4 Percentage Distribution of Cities Classified by
Size of Urban Agglomerations 2015
10 million or more 5 to 10 million
1 to 5 million 500 000 to 1 million
300 000 to 500 000
23
0
10
20
30
40
50
60
70
80
90
Asia South Asia Bangladesh India Pakistan Srilanka
138 169
320
170227
0
410 421
504
412331
821
Source Derived from UN [2014]
Figure 5 Percentage of Urban Population Classified by
Agglomeration Size 2015
10 million or more 5 to 10 million
1 to 5 million 500 000 to 1 million
300 000 to 500 000 Fewer than 300 000
Bangladsh-10 17
India-166 19
Pakistan-25 26
Sri Lanka-1 3
0
5
10
15
20
25
30
Source Derived from UN [2014]
Figure 6 Percentage of Population Living in Urban
Agglomerations with 300 000 or more Inhabitants as of
Total Population 1950-2015
24
World (5 million or more) 197
World (Less than 1 million) 589
Asia (5 million or more) 232
Asia (Less than 1 million) 506
SAsia (5 million or more) 257
SAsia (Less than 1 million) 546
00
100
200
300
400
500
600
700
800
900
1950 1955 1960 1965 1970 1975 1980 1985 1990 1995 2000 2005 2010 2015
Source Derived from UN [2014]
Figure 7 Percentage of Urban Population in Small amp Large
Agglomerations 1950-2015
- Annez PC and RM Buckley [2009] Urbanization and Growth Setting the Context in M Spence PC Annez and RM Buckley [Edited] Urbanization and Growth World Bank Washington DC
- Combes P G Duranton L Gobillon D Puga and S Roux [2012] The Productivity Advantages of Large Cities Distinguishing Agglomeration from Firm Selection Econometrica 80 (6) November
-
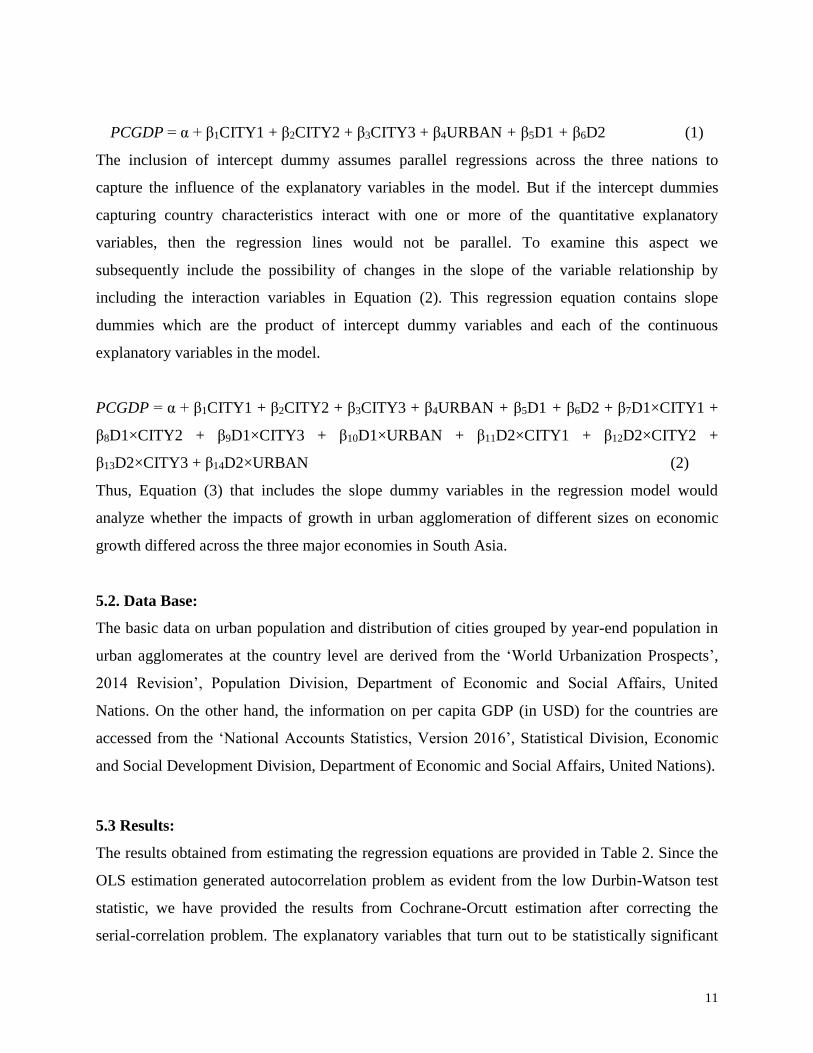
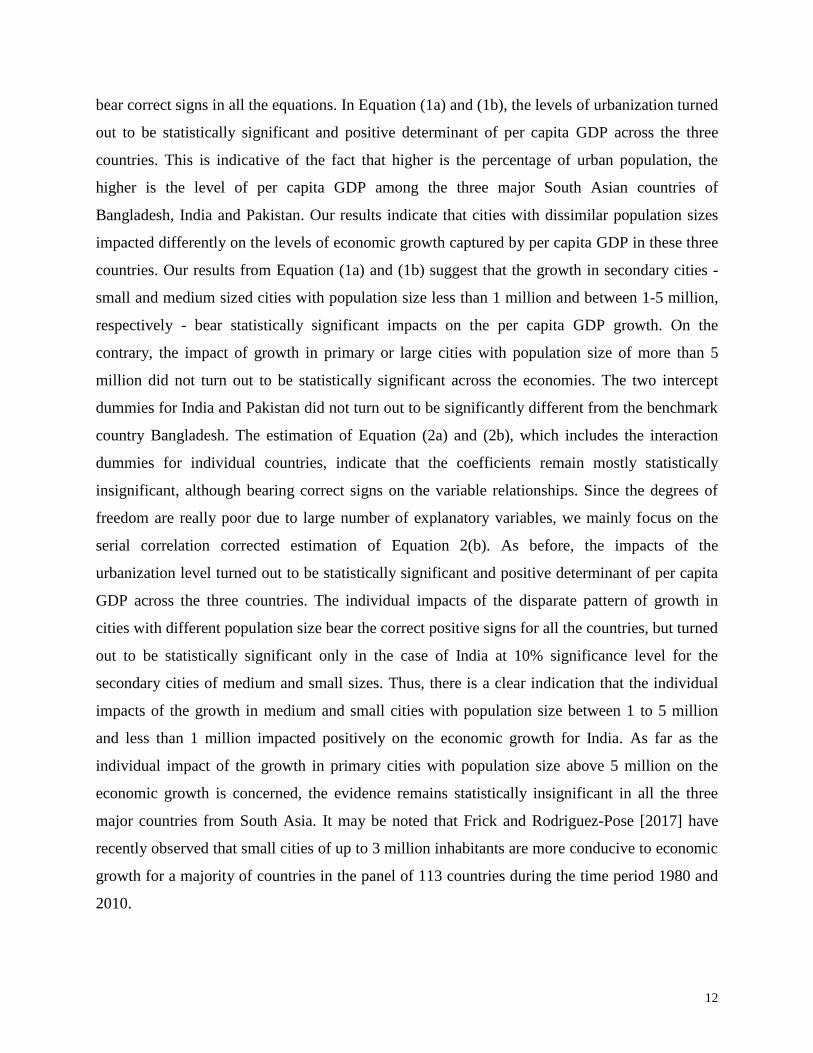

15
Bibliography
Annez PC and RM Buckley [2009] Urbanization and Growth Setting the Context in M
Spence PC Annez and RM Buckley [Edited] Urbanization and Growth World Bank
Washington DC
Chen N P Valente and Z Zlotnik [1998] What Do We Know about Recent Trends in
Urbanization in RE Billsborrow [Edited] Migration Urbanization and Development New
Directions and Issues United Nations Population Fund and Kluwer Academic Publishers
Massachusetts 1998
Combes P G Duranton L Gobillon D Puga and S Roux [2012] The Productivity
Advantages of Large Cities Distinguishing Agglomeration from Firm Selection Econometrica
80 (6) November
Duranton G [2008] Cities Engines of Growth and Prosperity for Developing Countries
World Bank Washington DC
Duranton G and D Puga [2004] Micro Foundations of Urban Agglomeration Economies in J
V Henderson and J F Thisse (Edt) Handbook of Regional and Urban Economics Volume 4
Elsevier
Ellis P and M Roberts [2016] Leveraging Urbanization in South Asia World Bank
Washington DC
Eaton J and Z Eckstein [1994] Cities and Growth Theory and Evidence from France and
Japan National Bureau of Economic Research (NBER) Working Paper No 4612
Fay M and C Opal [2000] Urbanization without Growth A not so uncommon Phenomenon
Policy Research Working Paper No 2412 World Bank Washington DC
Frick S A and A Rodriguez-Pose [2016] Average City Size and Economic Growth
Cambridge Journal of Regions Economy and Society Volume 9 Issue 2 1 July 2016 Pages
301ndash318
Frick S A and A Rodriguez-Pose [2017] Big or Small Cities Centre for Economic Policy
Research (CEPR) Discussion Paper No DP-12324
Fujita M [1988] A Monopolistic Competition Model of Spatial Agglomeration A
Differentiated Product Approach Regional Science and Urban Economics Volume 18 pp 87ndash
124
Hamer AS J F Linn [2000] Urbanization in the Developing World Patterns Issues and
Policies in ES Mills [Edited] Handbook of Regional and Urban Economics Volume 2 North
Holland Amsterdam
16
Krugman P [1991] Geography and Trade MIT Press Cambridge
Lucas R E [1988] On the Mechanics of Economic Development Journal of Monetary
Economics Volume 22 pp 3ndash42
Mahbub ul Haq Human Development Centre [2014] Human Development in South Asia 2014
Urbanization Challenges and Opportunities Lahore University of Management Sciences
Lahore Pakistan
Martin P and G Ottaviano [2001] Growth and Agglomeration International Economic
Review Vol 42 No 4 November pp 947-968
Polegravese Mario [2005] Cites and National Economic Growth A Reappraisal Urban Studies
42(8) pp 1429-1451
Quigley JM [2013] Agglomeration Regional Growth and Economic Development In
Klaesson J Johansson B Karlsson C (Edited) Metropolitan Regions Advances in Spatial
Science Springer Berlin
Roberts BH [2014] Managing Systems of Secondary Cities Cities Alliance Brussels
Roberts B and T Kanaley [Edited 2006] Urbanization and Sustainability in Asia Case
Studies of Good Practices Asian Development Bank Manila
Sarker S A Khan and M M Mannan [2016] Urban Population and Economic Growth South
Asia Perspective European Journal of Government and Economics Volume 5 Number 1 June
2016
Shabu Terwase [2010] The Relationship between Urbanization and Economic Development in
Developing Countries International Journal of Economic Development Research and
Investment 1(2) pp 30-36
Spence M P Annez and R Buckley [2009] Urbanization and Growth World Bank
Washington DC
Turok I and G McGranahan [2013] Urbanization and Economic Growth The Arguments and
Evidence for Africa and Asia Environment and Urbanization 25(1) pp 465-482
Venables AJ [1996] Equilibrium Locations of Vertically Linked Industries International
Economic Review Volume 37 pp 341-59
United Nations [2014] World Urbanization Prospects Population Division Department of
Economic and Social Affairs United Nations New York
17
United Nations [2016a] Policies on Spatial Distribution and Urbanization Data Booklet No
STESASERA394 Population Division Department of Economic and Social Affairs UN
New York
United Nations [2016b] The Worldrsquos Cities in 2016 Population Division Department of
Economic and Social Affairs UN New York
United Nations Human Settlements Programme (UN-Habitat) and United Nations Economic and
Social Commission for Asia and the Pacific (ESCAP) [2015] The State of Asian and Pacific
Cities 2015
World Bank [1991] Urban Policy and Economic Development An Agenda for the 1990s World
Bank Washington DC
World Bank [2013] Urbanization Beyond Municipal Boundaries Nurturing Metropolitan
Economies and Connecting Peri-Urban Areas in India World Bank Washington DC
18
Table 1 Urban Agglomerations (with 300 000 or more Inhabitants) in South Asian Countries 2015
Bangladesh Barisal Bogra Chittagong Comilla Dhaka Khulna Mymensingh Rajshahi
Rangpur and Sylhet (10)
India Agartala Agra Ahmadabad Ahmadnagar Aizawl Ajmer Akola Aligarh
Allahabad Alwar Amravati Amritsar Anand Anantapur Asansol Aurangabad
Baharampur Bangalore Barddhaman Bareilly Bathinda Begusarai Belgaum
Bellary Bhagalpur Bhavnagar Bhilwara Bhiwandi Bhopal Bhubaneswar Bihar
Sharif Bijapur Bikaner Bilaspur Bokaro Steel City Brahmapur Chandigarh
Chandrapur Chennai (Madras) Cherthala Coimbatore Cuttack Darbhanga
Davangere Dehradun Delhi Dewas Dhanbad Dhule Dindigul Durgapur Durg-
Bhilainagar English Bazar Erode Farrukhabad Firozabad Gaya Gorakhpur
Gulbarga Guntur Guwahati (Gauhati) Gwalior Habra Hardwar Hisar Hosur
Hubli-Dharwad Hyderabad Ichalakaranji Imphal Indore Jabalpur Jaipur
Jalandhar Jalgaon Jalna Jammu Jamnagar Jamshedpur Jhansi Jodhpur
Junagadh Kadapa Kakinada Kannur Kanpur Karimnagar Kayamkulam Kochi
(Cochin) Kolhapur Kolkata (Calcutta) Kollam Korba Kota Kottayam
Kozhikode (Calicut) Kurnool Latur Lucknow Ludhiana Madurai Malappuram
Malegaon Mangalore Mathura Maunath Bhanjan Meerut Moradabad Mumbai
(Bombay) Muzaffarnagar Muzaffarpur Mysore Nagpur Nanded Waghala
Nashik Navsari Nellore Nizamabad Palakkad Panipat Parbhani Patiala Patna
Puducherry Pune (Poona) Purnia Raipur Rajahmundry Rajkot Rampur Ranchi
Ranipet Raurkela Rohtak Roorkee Sagar Saharanpur Salem Sangali Santipur
Satna Shahjahanpur Shillong Shimoga Siliguri Solapur Srinagar Surat
Thanjavur Thiruvananthapuram Thoothukkudi (Tuticorin) Thrissur
Tiruchirappalli Tirunelveli Tirupati Tiruppur Tumkur Udaipur Ujjain
Vadodara Varanasi (Benares) Vellore Vijayawada Visakhapatnam Warangal and
Yamunanagar (166)
Pakistan Bahawalpur Dera Ghazikhan Faisalabad Gujranwala Gujrat Hyderabad
Islamabad Jhang Karachi Kasur Lahore Larkana Mardan Multan Nawabshah
Okara Peshawar Quetta Rahim Yar Khan Rawalpindi Sargodha Sheikhupura
Sialkot Sukkur and Wah (27)
Sri Lanka Colombo (1)
Note The number in parentheses indicate the number of such agglomerations in 2015
19
Table 2 Correlation of Urbanization amp Per Capita GDP in South Asian Countries (1970- 2015)
Bangladesh India Pakistan Sri Lanka
Correlation between PCGDP (USD) amp
Percentage of Total Urban Population
+089 +088 +095 -056
Correlation between PCGDP (USD) amp
Percentage of Population Living in 300000
plus Agglomeration
+086 +089 +098 -066
20
Table 3 Regression Results Dependent Variable Per Capita GDP (USD) at Constant (= 2005
Prices) in Bangladesh India amp Pakistan (sample 1970-2015 at 5-year intervals = 30 observations)
Explanatory Variables darr OLS (1a) Cochrane-Orcutt
(AR2) (1b)
OLS (2a) Cochrane-
Orcutt (AR2) (2b)
Constant -459
(-055)
-4402
(-111)
1670
(176)
1190
(067)
Percentage of Urban Population
(URBAN)
1690
(439)
2399
(287)
104
(010)
1896
(195)
Number of cities with Population
above 5 Million (CITY1)
1269
(030)
-762
(-066)
-682
(-007)
5210
(-035)
Number of cities with Population
between 1to 5 Million (CITY2)
1959
(279)
1013
(286)
-022
(-003)
-2420
(-070)
Number of cities with Population
less than 1 Million (CITY3)
-243
(-073)
683
(273)
5308
(265)
-2164
(-077)
Dummy 1 (D1) -17386
(-126)
-2370
(-139)
3639
(246)
40780
(042)
Dummy 2 (D2) 3888
(076)
1416
(057)
-50270
(-071)
-59060
(-103)
Dummy 1 times URBAN -24420
(-250)
-7313
(-124)
Dummy 1 times CITY1 -202
(-001)
3650
(052)
Dummy 1 times CITY2 4160
(061)
4032
(136)
Dummy 1 times CITY3 -2201
(-092)
3813
(135)
Dummy 2 times URBAN 2460
(074)
881
(033)
Dummy 2 times CITY1 1524
(012)
6553
(077)
Dummy 2 times CITY2 1543
(021)
4085
(096)
Dummy 2 times CITY3 -4418
(-157
3353
(110)
R-Squarred 091 098 097 098
R-Bar-Squarred 089 098 095 097
DW Statistic 090 185 161 191
F-Statistic 4182 13811 4050 6250
Note and indicate statistical significance at 5 and 10 level of significance respectively
21
South Asia 348
Afghanistan 267
Bangladesh 342
Bhutan 386
India 327
Iran 733
Maldives 455
Nepal 186
Pakistan 387
Sri Lanka 183
0
10
20
30
40
50
60
70
80
Source UN [2014]
Figure 1 Percentage of Urban Population in
South Asia 1950-2015
SouthAsia 122
Bangladesh 236
India 114
Pakistan 115
Sri Lanka 004
-050
0
050
100
150
200
250
300
350
1980-85 1985-90 1990-95 1995-2000 2000-05 2005-10 2010-15
Source UN [2014]
Figure 2 Average Annual Rate of Change in Percentage of
Urban Population 1980-2015
22
Bngladesh 88
India 673
Pakistan 117
Srilanka 0600
100
200
300
400
500
600
700
800
900
1950 1955 1960 1965 1970 1975 1980 1985 1990 1995 2000 2005 2010 2015
Source Derived from UN [2014]
Figure 3 Country Share of Urban Population in South Asia
0
10
20
30
40
50
60
70
80
90
100
Asia South Asia Bangladesh India Pakistan Srilanka
24 28
18
28 32
0
3328 27
2924
100
36 3745
36 36
0
Source Derived from UN [2014]
Figure 4 Percentage Distribution of Cities Classified by
Size of Urban Agglomerations 2015
10 million or more 5 to 10 million
1 to 5 million 500 000 to 1 million
300 000 to 500 000
23
0
10
20
30
40
50
60
70
80
90
Asia South Asia Bangladesh India Pakistan Srilanka
138 169
320
170227
0
410 421
504
412331
821
Source Derived from UN [2014]
Figure 5 Percentage of Urban Population Classified by
Agglomeration Size 2015
10 million or more 5 to 10 million
1 to 5 million 500 000 to 1 million
300 000 to 500 000 Fewer than 300 000
Bangladsh-10 17
India-166 19
Pakistan-25 26
Sri Lanka-1 3
0
5
10
15
20
25
30
Source Derived from UN [2014]
Figure 6 Percentage of Population Living in Urban
Agglomerations with 300 000 or more Inhabitants as of
Total Population 1950-2015
24
World (5 million or more) 197
World (Less than 1 million) 589
Asia (5 million or more) 232
Asia (Less than 1 million) 506
SAsia (5 million or more) 257
SAsia (Less than 1 million) 546
00
100
200
300
400
500
600
700
800
900
1950 1955 1960 1965 1970 1975 1980 1985 1990 1995 2000 2005 2010 2015
Source Derived from UN [2014]
Figure 7 Percentage of Urban Population in Small amp Large
Agglomerations 1950-2015
- Annez PC and RM Buckley [2009] Urbanization and Growth Setting the Context in M Spence PC Annez and RM Buckley [Edited] Urbanization and Growth World Bank Washington DC
- Combes P G Duranton L Gobillon D Puga and S Roux [2012] The Productivity Advantages of Large Cities Distinguishing Agglomeration from Firm Selection Econometrica 80 (6) November
-
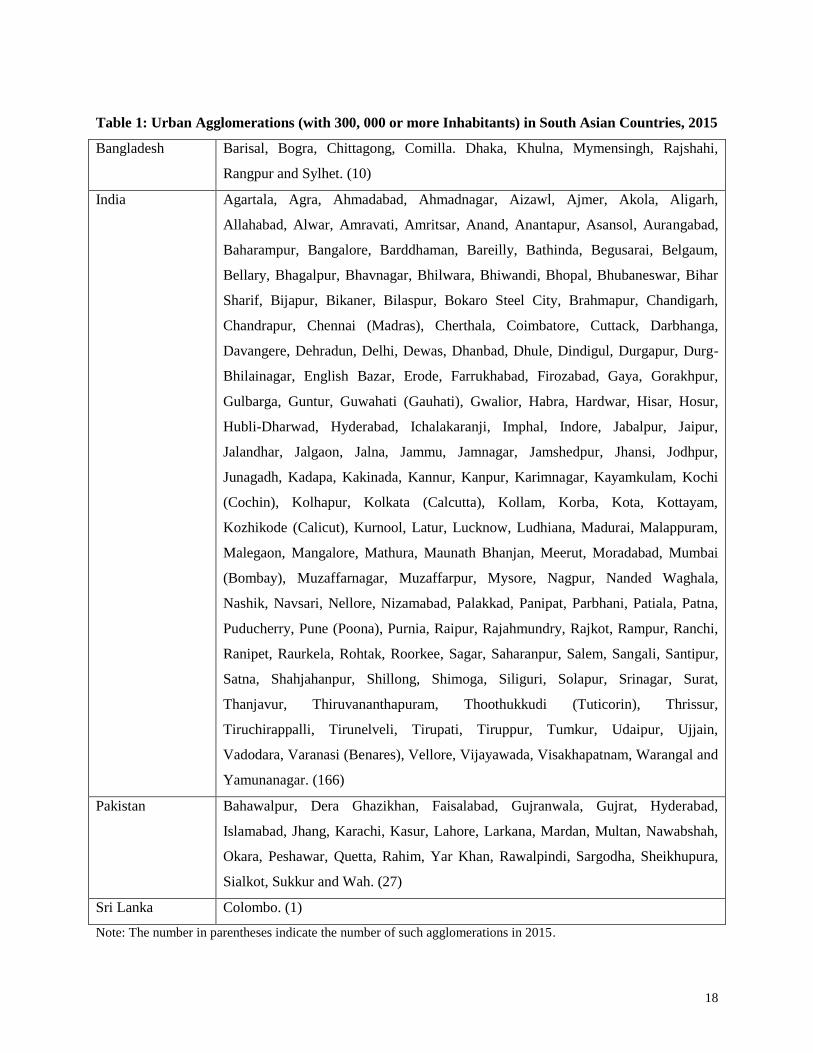
18
Table 1 Urban Agglomerations (with 300 000 or more Inhabitants) in South Asian Countries 2015
Bangladesh Barisal Bogra Chittagong Comilla Dhaka Khulna Mymensingh Rajshahi
Rangpur and Sylhet (10)
India Agartala Agra Ahmadabad Ahmadnagar Aizawl Ajmer Akola Aligarh
Allahabad Alwar Amravati Amritsar Anand Anantapur Asansol Aurangabad
Baharampur Bangalore Barddhaman Bareilly Bathinda Begusarai Belgaum
Bellary Bhagalpur Bhavnagar Bhilwara Bhiwandi Bhopal Bhubaneswar Bihar
Sharif Bijapur Bikaner Bilaspur Bokaro Steel City Brahmapur Chandigarh
Chandrapur Chennai (Madras) Cherthala Coimbatore Cuttack Darbhanga
Davangere Dehradun Delhi Dewas Dhanbad Dhule Dindigul Durgapur Durg-
Bhilainagar English Bazar Erode Farrukhabad Firozabad Gaya Gorakhpur
Gulbarga Guntur Guwahati (Gauhati) Gwalior Habra Hardwar Hisar Hosur
Hubli-Dharwad Hyderabad Ichalakaranji Imphal Indore Jabalpur Jaipur
Jalandhar Jalgaon Jalna Jammu Jamnagar Jamshedpur Jhansi Jodhpur
Junagadh Kadapa Kakinada Kannur Kanpur Karimnagar Kayamkulam Kochi
(Cochin) Kolhapur Kolkata (Calcutta) Kollam Korba Kota Kottayam
Kozhikode (Calicut) Kurnool Latur Lucknow Ludhiana Madurai Malappuram
Malegaon Mangalore Mathura Maunath Bhanjan Meerut Moradabad Mumbai
(Bombay) Muzaffarnagar Muzaffarpur Mysore Nagpur Nanded Waghala
Nashik Navsari Nellore Nizamabad Palakkad Panipat Parbhani Patiala Patna
Puducherry Pune (Poona) Purnia Raipur Rajahmundry Rajkot Rampur Ranchi
Ranipet Raurkela Rohtak Roorkee Sagar Saharanpur Salem Sangali Santipur
Satna Shahjahanpur Shillong Shimoga Siliguri Solapur Srinagar Surat
Thanjavur Thiruvananthapuram Thoothukkudi (Tuticorin) Thrissur
Tiruchirappalli Tirunelveli Tirupati Tiruppur Tumkur Udaipur Ujjain
Vadodara Varanasi (Benares) Vellore Vijayawada Visakhapatnam Warangal and
Yamunanagar (166)
Pakistan Bahawalpur Dera Ghazikhan Faisalabad Gujranwala Gujrat Hyderabad
Islamabad Jhang Karachi Kasur Lahore Larkana Mardan Multan Nawabshah
Okara Peshawar Quetta Rahim Yar Khan Rawalpindi Sargodha Sheikhupura
Sialkot Sukkur and Wah (27)
Sri Lanka Colombo (1)
Note The number in parentheses indicate the number of such agglomerations in 2015
19
Table 2 Correlation of Urbanization amp Per Capita GDP in South Asian Countries (1970- 2015)
Bangladesh India Pakistan Sri Lanka
Correlation between PCGDP (USD) amp
Percentage of Total Urban Population
+089 +088 +095 -056
Correlation between PCGDP (USD) amp
Percentage of Population Living in 300000
plus Agglomeration
+086 +089 +098 -066
20
Table 3 Regression Results Dependent Variable Per Capita GDP (USD) at Constant (= 2005
Prices) in Bangladesh India amp Pakistan (sample 1970-2015 at 5-year intervals = 30 observations)
Explanatory Variables darr OLS (1a) Cochrane-Orcutt
(AR2) (1b)
OLS (2a) Cochrane-
Orcutt (AR2) (2b)
Constant -459
(-055)
-4402
(-111)
1670
(176)
1190
(067)
Percentage of Urban Population
(URBAN)
1690
(439)
2399
(287)
104
(010)
1896
(195)
Number of cities with Population
above 5 Million (CITY1)
1269
(030)
-762
(-066)
-682
(-007)
5210
(-035)
Number of cities with Population
between 1to 5 Million (CITY2)
1959
(279)
1013
(286)
-022
(-003)
-2420
(-070)
Number of cities with Population
less than 1 Million (CITY3)
-243
(-073)
683
(273)
5308
(265)
-2164
(-077)
Dummy 1 (D1) -17386
(-126)
-2370
(-139)
3639
(246)
40780
(042)
Dummy 2 (D2) 3888
(076)
1416
(057)
-50270
(-071)
-59060
(-103)
Dummy 1 times URBAN -24420
(-250)
-7313
(-124)
Dummy 1 times CITY1 -202
(-001)
3650
(052)
Dummy 1 times CITY2 4160
(061)
4032
(136)
Dummy 1 times CITY3 -2201
(-092)
3813
(135)
Dummy 2 times URBAN 2460
(074)
881
(033)
Dummy 2 times CITY1 1524
(012)
6553
(077)
Dummy 2 times CITY2 1543
(021)
4085
(096)
Dummy 2 times CITY3 -4418
(-157
3353
(110)
R-Squarred 091 098 097 098
R-Bar-Squarred 089 098 095 097
DW Statistic 090 185 161 191
F-Statistic 4182 13811 4050 6250
Note and indicate statistical significance at 5 and 10 level of significance respectively
21
South Asia 348
Afghanistan 267
Bangladesh 342
Bhutan 386
India 327
Iran 733
Maldives 455
Nepal 186
Pakistan 387
Sri Lanka 183
0
10
20
30
40
50
60
70
80
Source UN [2014]
Figure 1 Percentage of Urban Population in
South Asia 1950-2015
SouthAsia 122
Bangladesh 236
India 114
Pakistan 115
Sri Lanka 004
-050
0
050
100
150
200
250
300
350
1980-85 1985-90 1990-95 1995-2000 2000-05 2005-10 2010-15
Source UN [2014]
Figure 2 Average Annual Rate of Change in Percentage of
Urban Population 1980-2015
22
Bngladesh 88
India 673
Pakistan 117
Srilanka 0600
100
200
300
400
500
600
700
800
900
1950 1955 1960 1965 1970 1975 1980 1985 1990 1995 2000 2005 2010 2015
Source Derived from UN [2014]
Figure 3 Country Share of Urban Population in South Asia
0
10
20
30
40
50
60
70
80
90
100
Asia South Asia Bangladesh India Pakistan Srilanka
24 28
18
28 32
0
3328 27
2924
100
36 3745
36 36
0
Source Derived from UN [2014]
Figure 4 Percentage Distribution of Cities Classified by
Size of Urban Agglomerations 2015
10 million or more 5 to 10 million
1 to 5 million 500 000 to 1 million
300 000 to 500 000
23
0
10
20
30
40
50
60
70
80
90
Asia South Asia Bangladesh India Pakistan Srilanka
138 169
320
170227
0
410 421
504
412331
821
Source Derived from UN [2014]
Figure 5 Percentage of Urban Population Classified by
Agglomeration Size 2015
10 million or more 5 to 10 million
1 to 5 million 500 000 to 1 million
300 000 to 500 000 Fewer than 300 000
Bangladsh-10 17
India-166 19
Pakistan-25 26
Sri Lanka-1 3
0
5
10
15
20
25
30
Source Derived from UN [2014]
Figure 6 Percentage of Population Living in Urban
Agglomerations with 300 000 or more Inhabitants as of
Total Population 1950-2015
24
World (5 million or more) 197
World (Less than 1 million) 589
Asia (5 million or more) 232
Asia (Less than 1 million) 506
SAsia (5 million or more) 257
SAsia (Less than 1 million) 546
00
100
200
300
400
500
600
700
800
900
1950 1955 1960 1965 1970 1975 1980 1985 1990 1995 2000 2005 2010 2015
Source Derived from UN [2014]
Figure 7 Percentage of Urban Population in Small amp Large
Agglomerations 1950-2015
- Annez PC and RM Buckley [2009] Urbanization and Growth Setting the Context in M Spence PC Annez and RM Buckley [Edited] Urbanization and Growth World Bank Washington DC
- Combes P G Duranton L Gobillon D Puga and S Roux [2012] The Productivity Advantages of Large Cities Distinguishing Agglomeration from Firm Selection Econometrica 80 (6) November
-
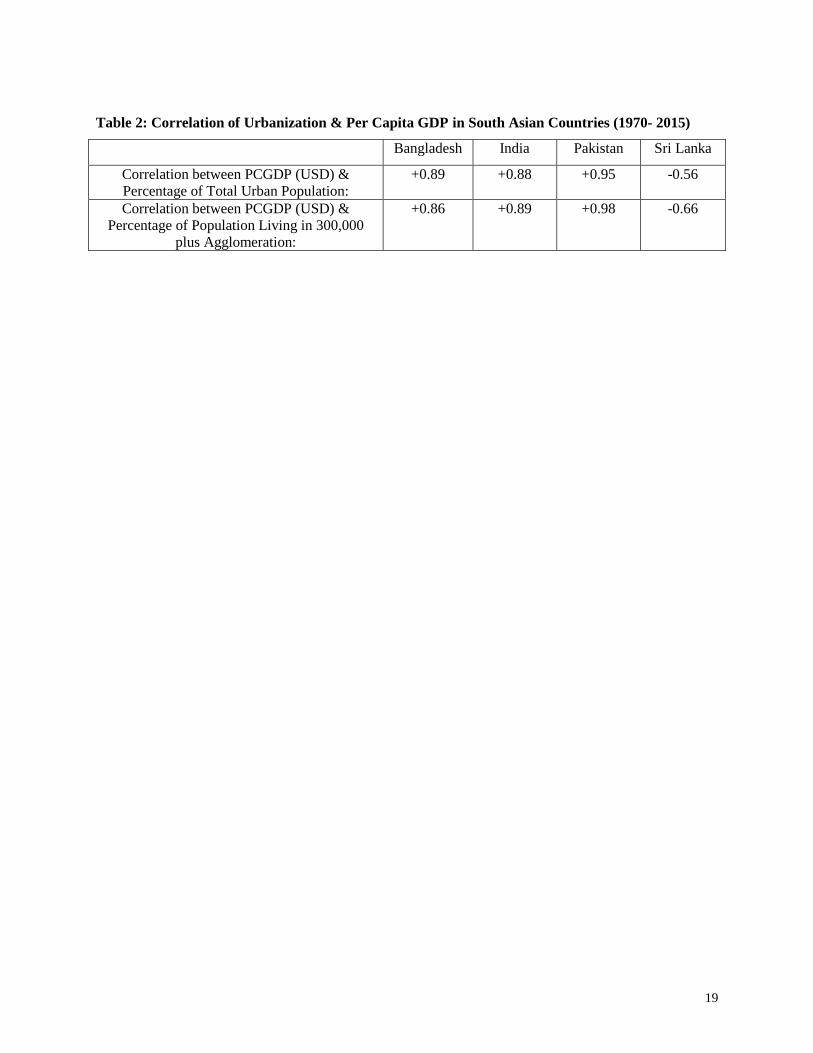
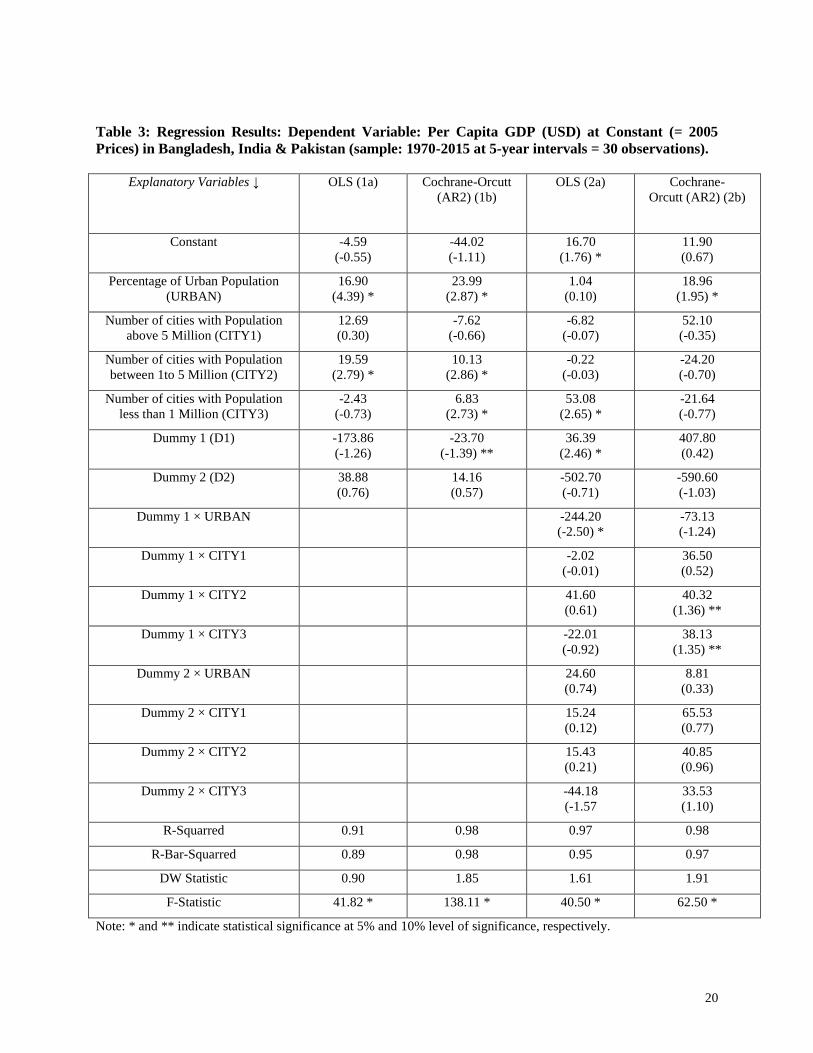
20
Table 3 Regression Results Dependent Variable Per Capita GDP (USD) at Constant (= 2005
Prices) in Bangladesh India amp Pakistan (sample 1970-2015 at 5-year intervals = 30 observations)
Explanatory Variables darr OLS (1a) Cochrane-Orcutt
(AR2) (1b)
OLS (2a) Cochrane-
Orcutt (AR2) (2b)
Constant -459
(-055)
-4402
(-111)
1670
(176)
1190
(067)
Percentage of Urban Population
(URBAN)
1690
(439)
2399
(287)
104
(010)
1896
(195)
Number of cities with Population
above 5 Million (CITY1)
1269
(030)
-762
(-066)
-682
(-007)
5210
(-035)
Number of cities with Population
between 1to 5 Million (CITY2)
1959
(279)
1013
(286)
-022
(-003)
-2420
(-070)
Number of cities with Population
less than 1 Million (CITY3)
-243
(-073)
683
(273)
5308
(265)
-2164
(-077)
Dummy 1 (D1) -17386
(-126)
-2370
(-139)
3639
(246)
40780
(042)
Dummy 2 (D2) 3888
(076)
1416
(057)
-50270
(-071)
-59060
(-103)
Dummy 1 times URBAN -24420
(-250)
-7313
(-124)
Dummy 1 times CITY1 -202
(-001)
3650
(052)
Dummy 1 times CITY2 4160
(061)
4032
(136)
Dummy 1 times CITY3 -2201
(-092)
3813
(135)
Dummy 2 times URBAN 2460
(074)
881
(033)
Dummy 2 times CITY1 1524
(012)
6553
(077)
Dummy 2 times CITY2 1543
(021)
4085
(096)
Dummy 2 times CITY3 -4418
(-157
3353
(110)
R-Squarred 091 098 097 098
R-Bar-Squarred 089 098 095 097
DW Statistic 090 185 161 191
F-Statistic 4182 13811 4050 6250
Note and indicate statistical significance at 5 and 10 level of significance respectively
21
South Asia 348
Afghanistan 267
Bangladesh 342
Bhutan 386
India 327
Iran 733
Maldives 455
Nepal 186
Pakistan 387
Sri Lanka 183
0
10
20
30
40
50
60
70
80
Source UN [2014]
Figure 1 Percentage of Urban Population in
South Asia 1950-2015
SouthAsia 122
Bangladesh 236
India 114
Pakistan 115
Sri Lanka 004
-050
0
050
100
150
200
250
300
350
1980-85 1985-90 1990-95 1995-2000 2000-05 2005-10 2010-15
Source UN [2014]
Figure 2 Average Annual Rate of Change in Percentage of
Urban Population 1980-2015
22
Bngladesh 88
India 673
Pakistan 117
Srilanka 0600
100
200
300
400
500
600
700
800
900
1950 1955 1960 1965 1970 1975 1980 1985 1990 1995 2000 2005 2010 2015
Source Derived from UN [2014]
Figure 3 Country Share of Urban Population in South Asia
0
10
20
30
40
50
60
70
80
90
100
Asia South Asia Bangladesh India Pakistan Srilanka
24 28
18
28 32
0
3328 27
2924
100
36 3745
36 36
0
Source Derived from UN [2014]
Figure 4 Percentage Distribution of Cities Classified by
Size of Urban Agglomerations 2015
10 million or more 5 to 10 million
1 to 5 million 500 000 to 1 million
300 000 to 500 000
23
0
10
20
30
40
50
60
70
80
90
Asia South Asia Bangladesh India Pakistan Srilanka
138 169
320
170227
0
410 421
504
412331
821
Source Derived from UN [2014]
Figure 5 Percentage of Urban Population Classified by
Agglomeration Size 2015
10 million or more 5 to 10 million
1 to 5 million 500 000 to 1 million
300 000 to 500 000 Fewer than 300 000
Bangladsh-10 17
India-166 19
Pakistan-25 26
Sri Lanka-1 3
0
5
10
15
20
25
30
Source Derived from UN [2014]
Figure 6 Percentage of Population Living in Urban
Agglomerations with 300 000 or more Inhabitants as of
Total Population 1950-2015
24
World (5 million or more) 197
World (Less than 1 million) 589
Asia (5 million or more) 232
Asia (Less than 1 million) 506
SAsia (5 million or more) 257
SAsia (Less than 1 million) 546
00
100
200
300
400
500
600
700
800
900
1950 1955 1960 1965 1970 1975 1980 1985 1990 1995 2000 2005 2010 2015
Source Derived from UN [2014]
Figure 7 Percentage of Urban Population in Small amp Large
Agglomerations 1950-2015
- Annez PC and RM Buckley [2009] Urbanization and Growth Setting the Context in M Spence PC Annez and RM Buckley [Edited] Urbanization and Growth World Bank Washington DC
- Combes P G Duranton L Gobillon D Puga and S Roux [2012] The Productivity Advantages of Large Cities Distinguishing Agglomeration from Firm Selection Econometrica 80 (6) November
-
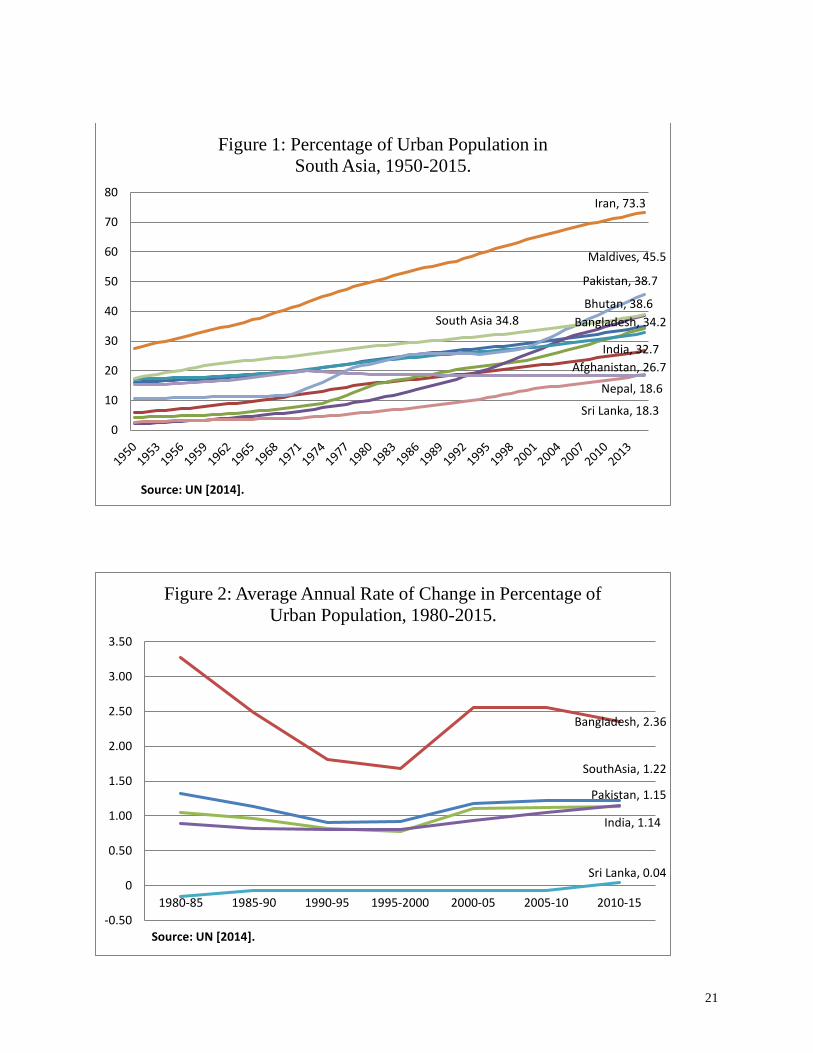
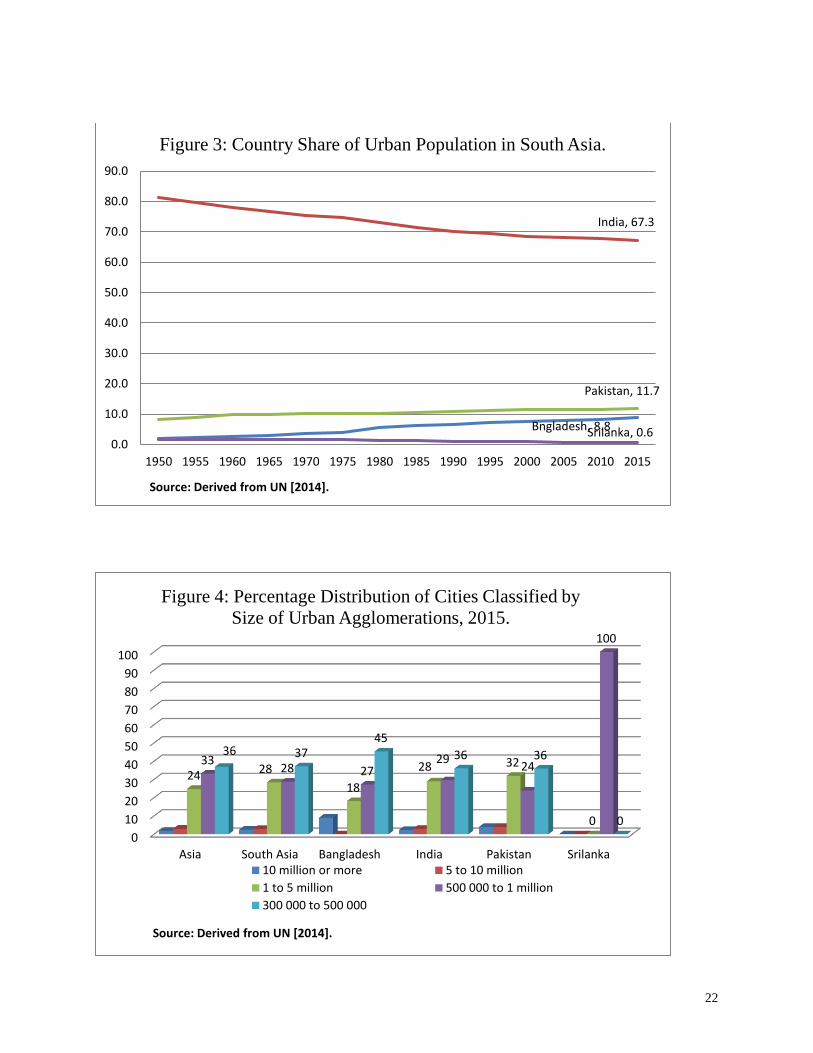
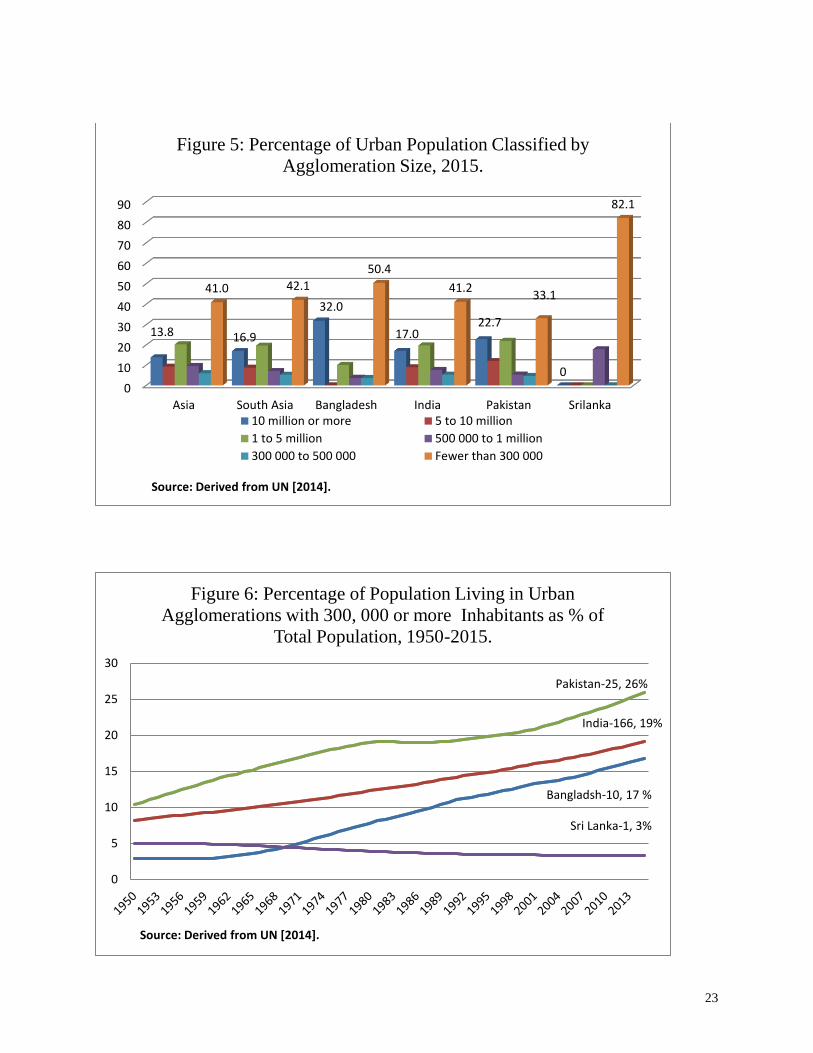