CITY OF SANTA MONICA WATER DIVISION ANNUAL · PDF fileSanta Monica Water Treatment Process...
13
CITY OF SANTA MONICA WATER DIVISION ANNUAL WATER QUALITY REPORT JUNE 2011 IMPORTANT INFORMATION AND TIPS ON WATER QUALITY AND SAFETY http://waterquality.smgov.net NEWS FLASH LOCAL WATER SUPPLY RESTORED!
Transcript of CITY OF SANTA MONICA WATER DIVISION ANNUAL · PDF fileSanta Monica Water Treatment Process...

CITY OF SANTA MONICA WATER DIVISION
ANNUAL
WATER QUALITY REPORTJUNE 2011
IMPORTANT INFORMATION AND TIPS ON WATER QUALITY
AND SAFETY
http://waterquality.smgov.net
NEWS FLASHLOCAL WATER SUPPLY RESTORED!

Environmental awareness extends beyond the air we breathe and food we eat. Citizens across the country have asked to be kept informed about the quality of their water. In response, Congress and the California Legislature have passed laws that require water agencies to provide an annual water quality report to their customers.
This report gives an overview of how the City of Santa Monica Public Works/Water Resources Division provides your tap water and explains the many steps we take to ensure the quality and safety of our water.
If you require this report in an alternate format, please call us at (310) 826-6712 or email [email protected]
Este informe contiene informacion muy importante sobre su agua potable. Traduzcalo o hable con alguien que lo entienda bien..
Water Quality Is Everybody’s Business
Dear Santa Monica Residents,This past year has been a milestone in the City of Santa Monica’s water history! The Charnock Well Field Restoration Project was completed and the wells went back online in December. The restoration of our local groundwater supply will reduce our dependence on imported water and help Santa Monica meet its sustainability objectives. In this regard, the City Council has established a goal of achieving water self-suffi ciency by the year 2020. With the wells back online, we can now produce more than 70% of the water the city uses on a daily basis. This is more than we have produced in the past 15 years.
This step toward self-suffi ciency is a major achievement for the city. Nevertheless, water conservation is still an important aspect of our Sustainability Plan. To become 100% reliant on our own sources, we encourage all residents and businesses in Santa Monica to continue what to date have been very effective water conservation practices: installation of water-effi cient appliances, drought-tolerant landscaping, and ensuring that all leaky fi xtures are repaired in a timely manner.
Although we now have a comprehensive treatment system and a reliable water source, it’s important that we also focus attention on the pipeline network that delivers the water throughout the city. This is part of the “infrastructure” challenge we keep hearing about in the national dialogue. We devote resources each year to replace aging water mains, and we estimate that a large portion of our system will need attention in the coming years. The task at hand is to make wise decisions in maintaining and replacing our aging infrastructure and to spend the right amount of money in the right places.
Keep drinking the tap water, Santa Monica, and to learn more ways to reduce your water consumption visit www.sustainablesm.org/water.
Sincerely,
Gil BorboaGil BorboaWater Resources Manager

The water from the Charnock Well Field is then combined with the fl ow from other wells and delivered to the City’s main treatment facility in West Los Angeles where it undergoes a 5 step process to reduce any remaining contaminants and achieve drinking water quality.
A major component of the Project was the replacement of the City’s obsolete water softening system at the main treatment plant with a new Reverse Osmosis (RO) softening system, with fl uoridation and disinfection capabilities.
Softening is the process of removing scale-forming calcium and magnesium from hard water. Reverse Osmosis (RO) is a method of softening that separates the scale-forming minerals by forcing hard water through membranes with very small pores.
The complete treatment process is outlined on the following pages. For more information about the new treatment facilities, please call the plant staff at (310) 826-6712.
It’s Here!The City of Santa Monica Public Works/Water Resources Division is pleased to inform our customers that the long-awaited Charnock Well Field Restoration Project is complete and fi ve wells that have been inactive for over a decade were reactivated in December 2010. The project restores the use of our local groundwater supplies, reduces reliance on imported water from Northern California and the Colorado River, and helps meet the city’s sustainability objectives.
The Charnock Well Field has been used as a drinking water source since 1924. In 1996, the well fi eld was shut down when testing revealed that the gasoline additive, Methyl tert-Butyl Ether (MTBE) had infi ltrated the aquifer supplying the wells. The source of the gasoline compound was leakage from underground storage tanks at gasoline service stations in the vicinity. The City of Santa Monica pursued restitution and eventually reached a settlement agreement with the principal responsible parties to remediate and restore the well fi eld as a drinking water source.
The installation of the Granular Activated Carbon (GAC) fi ltration system is a primary component of the Project. The GAC system provides treatment for MTBE and another potential gasoline additive, tert-Butyl Alcohol (TBA) contamination in the groundwater at the Charnock Well Field.

Santa Monica Water Treatment ProcessCHARNOCK WELL FIELD
Charnock WellsGroundwater contaminated with the gasoline additive
MTBE is pumped up from 400 feet below ground surface.
Greensand FiltrationThe well water is fi ltered
through greensand media to remove iron and manganese
which would foul thecarbon fi lters.
GAC FiltrationThe MTBE is removed by fi ltering through Granular
Activated Carbon (GAC) fi lters.
Pump to Treatment PlantThe fi ltered water is combined
with the fl ow of other wells and pumped to the Santa Monica Water Treatment
Plant.
SANTA MONICAWATER
TREATMENT PLANT
PretreatmentTo protect the sensitive Reverse Osmosis (RO) fi lters, the combined well fl ow is fi ltered again through greensand and cartridge fi lters to remove more iron, manganese and any remaining sediment.
Reverse Osmosis FiltrationFiltration through a three-stage Reverse Osmosis
(RO) membrane system softens the water by removing minerals (calcium and magnesium). RO uses pressure to force water through
membranes with pores so small the minerals can’t pass through.Water Quality
AdjustmentsThe mineral content is adjusted to the de-
sired softness. The pH is adjusted, fl uorideis added and the water undergoes fi nal
disinfection with chloramine.
Aeration and StorageThe fi nal step, aeration, uses the existingair stripping technology in the fi ve million gallonreservoir to remove any remaining volatile groundwater contaminants such as trichloroethene (TCE).
Reverse OsmosisFiltration
Final DeliverySanta Monica residents and businesses receive water for everyday use. Water conservation by end users is key to ensuring water reliability and sustainability.

Ensuring the Safety of Santa Monica’s Water SupplyOur drinking water meets or exceeds all State and Federal water quality requirements. The safety of Santa Monica’s drinking water supply is of paramount importance.
More than 10,000 water quality tests are conducted each year at Santa Monica’s State-certifi ed laboratory by qualifi ed chemists and technicians to ensure the safety of the city’s supply. The City of Santa Monica Public Works/Water Resources Division expends considerable resources keeping its water treatment system up to date and performing properly.
Drinking water, including bottled water, may reasonably be expected to contain at least small amounts of some contami-nants. Their presence does not necessarily indicate that water poses a health risk. More information about contaminants and potential health effects can be obtained by calling the EPA Safe Drinking Water Hotline at (800) 426-4791.
Sources of WaterThe sources of drinking water (both tap and bottled) include rivers, lakes, streams, ponds, reservoirs, springs and wells. As water travels over the surface of the land or through the ground, it dissolves naturally occurring minerals and can pick up substances resulting from the presence of animals or from human activity. Contaminants that may be present in source water before it is treated include:
• Microbial contaminants such as viruses and bacteria, which may come from sewage systems, septic tanks, agricultural livestock operations and wildlife.
• Inorganic contaminants such as salts and metals, which can be naturally occurring or result from urban stormwater runoff, industrial or domestic wastewater discharges, oil and gas production, mining or farming.**
• Pesticides and herbicides, which may come from a variety of sources such as agriculture and residential uses.
• Radioactive contaminants, which are naturally occurring.
• Organic chemical contaminants including synthetic and volatile organic chemicals, which are by-products of industrial processes and petroleum production and can also come from gas stations, urban stormwater runoff and septic systems.
In order to ensure that tap water is safe to drink, USEPA and the California Department of Public Health (DPH) prescribe limits on certain contaminants in water provided by public water systems. DPH regulations also establish limits for contami-nants in bottled water to provide the same protection for public health.
** You can help protect the purity of source water by helping control what goes into the storm drain and water table: Reduce use of hazardous products, clean up after pets, recycle used motor oil,sweep walks and alleys instead of hosing. Call (310) 458-8235 toreport storm drain pollution and (310) 458-2255 for information on alternatives to toxic cleaning products and pesticides.

Our Treated WaterSanta Monica has had to rely on imported water sources for more than 85% of our supply in recent years. However, with the restoration of the Charnock Well Field and continued water conservation, we can reduce the demand for imported water to 30% of our needs for the coming year. The imported water we consume is purchased from the Metropolitan Water District (MWD). MWD provides supplemental water to about 300 cities and unincorporated areas in Southern California, importing water from two separate sources. Colorado River water is deliv-ered from Lake Havasu by means of a 242-mile-long aqueduct. This water originates as snowmelt from mountainous regions of Utah, Wyoming and Colorado. MWD also distributes State Project water from the Sacramento-San Joaquin Delta and delivers it to Southern California by means of the 441-mile-long California Aqueduct. Water from the aqueducts is fi ltered at MWD’s six modern treatment plants, using chloramine for disinfection.
In 2002, MWD completed a source water assessment of its Colorado and State Project supplies. Colorado River supplies are considered to be most vulnerable to recreation, urban/storm water runoff, increasing urbanization in the watershed and wastewater. State Project supplies are considered to be most vulnerable to urban/storm water runoff, wildlife, agriculture, recreation and wastewater. A copy of the assessment can be obtained by contacting MWD at (213) 217-6850.
Santa Monica’s water supply undergoes constant, rigorous testing at the Water Treatment Plant by plant operators and chemists at our Water Quality Laboratory. Permission and oversight to operate a community water system is granted by the California Department of Public Health and the U.S. Environmental Protection Agency. Santa Monica has a perfect compliance record in regards to water quality.
The next few pages summarize the past year’s results for the tests we are required to perform to satisfy Federal and State regulations for our local well water as well as the water we import. However, testing the water coming out of the treatment plant is not enough. We also test the water at 100 locations throughout the city each month to ensure the quality.
The results are presented in two sections- Primary Drinking Water Quality Results and Secondary Drinking Water Qual-ity Results. The Primary Results are for the tests we perform for contaminants that may affect the public’s health. These contaminants include hazardous chemicals, metals, bacteria, and radioactivity. Santa Monica’s water is below permissible Maximum Contaminant Levels (MCL) for all contaminants.
The Secondary Results are for the tests we perform for param-eters that may affect the aesthetics of the water such as taste, appearance, and odor. These parameters include turbidity, minerals, and pH among others. Again, Santa Monica’s water meets all regulatory requirements for these parameters.
For questions regarding water quality, call the Water Quality Laboratory staff at (310) 826-6712.
About theTables
KEY TO ABBREVIATIONS
LOCAL IMPORTED IMPORTED Dates Meets MAJOR SOURCESLOCAL IMPORTED IMPORTED Dates Meets MAJOR SOURCESLOCAL IMPORTED IMPORTED Dates Meets MAJOR SOURCESLOCAL IMPORTED IMPORTED Dates Meets MAJOR SOURCESLOCAL IMPORTED IMPORTED Dates Meets MAJOR SOURCESLOCAL IMPORTED IMPORTED Dates Meets MAJOR SOURCESLOCAL IMPORTED IMPORTED Dates Meets MAJOR SOURCESLOCAL IMPORTED IMPORTED Dates Meets MAJOR SOURCESLOCAL IMPORTED IMPORTED Dates Meets MAJOR SOURCESLOCAL IMPORTED IMPORTED Dates Meets MAJOR SOURCESLOCAL IMPORTED IMPORTED Dates Meets MAJOR SOURCESLOCAL IMPORTED IMPORTED Dates Meets MAJOR SOURCESLOCAL IMPORTED IMPORTED Dates Meets MAJOR SOURCES PHG/ State WELL WATER (a) SM WELL #1(b) SURFACE WATER SURFACE WATER Sampled Std IN DRINKING WATER PHG/ State WELL WATER (a) SM WELL #1(b) SURFACE WATER SURFACE WATER Sampled Std IN DRINKING WATER PHG/ State WELL WATER (a) SM WELL #1(b) SURFACE WATER SURFACE WATER Sampled Std IN DRINKING WATER PHG/ State WELL WATER (a) SM WELL #1(b) SURFACE WATER SURFACE WATER Sampled Std IN DRINKING WATER PHG/ State WELL WATER (a) SM WELL #1(b) SURFACE WATER SURFACE WATER Sampled Std IN DRINKING WATER PHG/ State WELL WATER (a) SM WELL #1(b) SURFACE WATER SURFACE WATER Sampled Std IN DRINKING WATER PHG/ State WELL WATER (a) SM WELL #1(b) SURFACE WATER SURFACE WATER Sampled Std IN DRINKING WATER PHG/ State WELL WATER (a) SM WELL #1(b) SURFACE WATER SURFACE WATER Sampled Std IN DRINKING WATER PHG/ State WELL WATER (a) SM WELL #1(b) SURFACE WATER SURFACE WATER Sampled Std IN DRINKING WATER PHG/ State WELL WATER (a) SM WELL #1(b) SURFACE WATER SURFACE WATER Sampled Std IN DRINKING WATER PHG/ State WELL WATER (a) SM WELL #1(b) SURFACE WATER SURFACE WATER Sampled Std IN DRINKING WATER PHG/ State WELL WATER (a) SM WELL #1(b) SURFACE WATER SURFACE WATER Sampled Std IN DRINKING WATER PHG/ State WELL WATER (a) SM WELL #1(b) SURFACE WATER SURFACE WATER Sampled Std IN DRINKING WATER PHG/ State WELL WATER (a) SM WELL #1(b) SURFACE WATER SURFACE WATER Sampled Std IN DRINKING WATER PHG/ State WELL WATER (a) SM WELL #1(b) SURFACE WATER SURFACE WATER Sampled Std IN DRINKING WATER PHG/ State WELL WATER (a) SM WELL #1(b) SURFACE WATER SURFACE WATER Sampled Std IN DRINKING WATERParameter [MCLG]/ MCL/ Arcadia Plant Weymouth Plant Jensen Plant Parameter [MCLG]/ MCL/ Arcadia Plant Weymouth Plant Jensen Plant Parameter [MCLG]/ MCL/ Arcadia Plant Weymouth Plant Jensen Plant Parameter [MCLG]/ MCL/ Arcadia Plant Weymouth Plant Jensen Plant Parameter [MCLG]/ MCL/ Arcadia Plant Weymouth Plant Jensen Plant Parameter [MCLG]/ MCL/ Arcadia Plant Weymouth Plant Jensen Plant Parameter [MCLG]/ MCL/ Arcadia Plant Weymouth Plant Jensen Plant Parameter [MCLG]/ MCL/ Arcadia Plant Weymouth Plant Jensen Plant Parameter [MCLG]/ MCL/ Arcadia Plant Weymouth Plant Jensen Plant Parameter [MCLG]/ MCL/ Arcadia Plant Weymouth Plant Jensen Plant Parameter [MCLG]/ MCL/ Arcadia Plant Weymouth Plant Jensen Plant if other {MRDLG} {MRDL} Average Range Average Range Average Range {MRDLG} {MRDL} Average Range Average Range Average Range {MRDLG} {MRDL} Average Range Average Range Average Range {MRDLG} {MRDL} Average Range Average Range Average Range {MRDLG} {MRDL} Average Range Average Range Average Range {MRDLG} {MRDL} Average Range Average Range Average Range {MRDLG} {MRDL} Average Range Average Range Average Range {MRDLG} {MRDL} Average Range Average Range Average Range Average Range than 2010(c)
PRIMARY DRINKING WATER STANDARDS (MANDATORY HEALTH-RELATED STANDARDS)
CITY OF SANTA MONICA WATER DIVISION
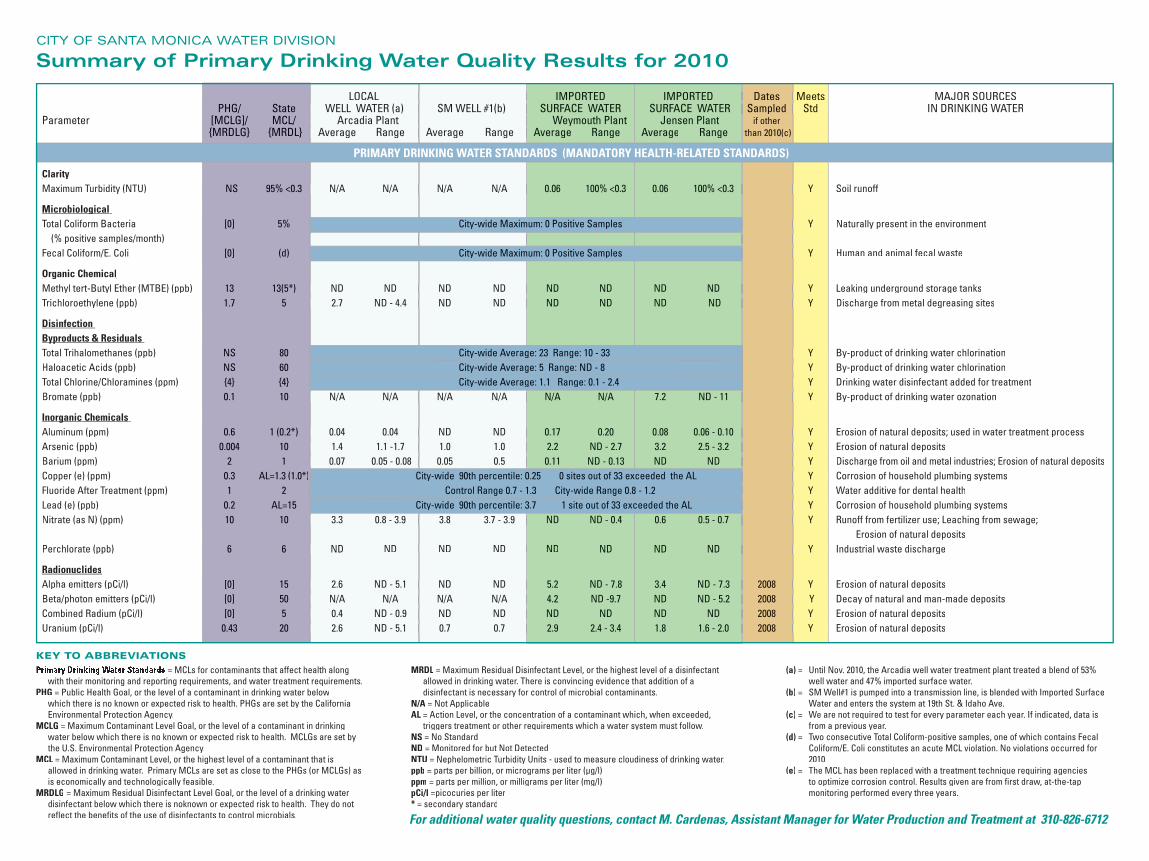
Summary of Primary Drinking Water Quality Results for 2010
Primary Drinking Water Standards = MCLs for contaminants that affect health along with their monitoring and reporting requirements, and water treatment requirements.
PHG = Public Health Goal, or the level of a contaminant in drinking water below which there is no known or expected risk to health. PHGs are set by the California Environmental Protection Agency.
MCLG = Maximum Contaminant Level Goal, or the level of a contaminant in drinking water below which there is no known or expected risk to health. MCLGs are set by the U.S. Environmental Protection Agency.
MCL = Maximum Contaminant Level, or the highest level of a contaminant that is allowed in drinking water. Primary MCLs are set as close to the PHGs (or MCLGs) as is economically and technologically feasible.
MRDLG = Maximum Residual Disinfectant Level Goal, or the level of a drinking water disinfectant below which there is noknown or expected risk to health. They do not refl ect the benefi ts of the use of disinfectants to control microbials.
MRDL = Maximum Residual Disinfectant Level, or the highest level of a disinfectant allowed in drinking water. There is convincing evidence that addition of a disinfectant is necessary for control of microbial contaminants.
N/A = Not ApplicableAL = Action Level, or the concentration of a contaminant which, when exceeded,
triggers treatment or other requirements which a water system must follow.NS = No Standard ND = Monitored for but Not DetectedNTU = Nephelometric Turbidity Units - used to measure cloudiness of drinking water.ppb = parts per billion, or micrograms per liter (µg/l)ppm = parts per million, or milligrams per liter (mg/l)pCi/l =picocuries per liter* = secondary standard
(a) = Until Nov. 2010, the Arcadia well water treatment plant treated a blend of 53% well water and 47% imported surface water.
(b) = SM Well#1 is pumped into a transmission line, is blended with Imported Surface Water and enters the system at 19th St. & Idaho Ave.
(c) = We are not required to test for every parameter each year. If indicated, data is from a previous year.
(d) = Two consecutive Total Coliform-positive samples, one of which contains Fecal Coliform/E. Coli constitutes an acute MCL violation. No violations occurred for 2010.
(e) = The MCL has been replaced with a treatment technique requiring agencies to optimize corrosion control. Results given are from fi rst draw, at-the-tap monitoring performed every three years.
For additional water quality questions, contact M. Cardenas, Assistant Manager for Water Production and Treatment at 310-826-6712
ClarityClarityMaximum Turbidity (NTU) NS 95% <0.3 N/A N/A N/A N/A 0.06 100% <0.3 0.06 100% <0.3 Y Maximum Turbidity (NTU) NS 95% <0.3 N/A N/A N/A N/A 0.06 100% <0.3 0.06 100% <0.3 Y Maximum Turbidity (NTU) NS 95% <0.3 N/A N/A N/A N/A 0.06 100% <0.3 0.06 100% <0.3 Y Maximum Turbidity (NTU) NS 95% <0.3 N/A N/A N/A N/A 0.06 100% <0.3 0.06 100% <0.3 Y Maximum Turbidity (NTU) NS 95% <0.3 N/A N/A N/A N/A 0.06 100% <0.3 0.06 100% <0.3 Y Maximum Turbidity (NTU) NS 95% <0.3 N/A N/A N/A N/A 0.06 100% <0.3 0.06 100% <0.3 Y Maximum Turbidity (NTU) NS 95% <0.3 N/A N/A N/A N/A 0.06 100% <0.3 0.06 100% <0.3 Y Maximum Turbidity (NTU) NS 95% <0.3 N/A N/A N/A N/A 0.06 100% <0.3 0.06 100% <0.3 Y Maximum Turbidity (NTU) NS 95% <0.3 N/A N/A N/A N/A 0.06 100% <0.3 0.06 100% <0.3 Y Maximum Turbidity (NTU) NS 95% <0.3 N/A N/A N/A N/A 0.06 100% <0.3 0.06 100% <0.3 Y Maximum Turbidity (NTU) NS 95% <0.3 N/A N/A N/A N/A 0.06 100% <0.3 0.06 100% <0.3 Y Maximum Turbidity (NTU) NS 95% <0.3 N/A N/A N/A N/A 0.06 100% <0.3 0.06 100% <0.3 Y Maximum Turbidity (NTU) NS 95% <0.3 N/A N/A N/A N/A 0.06 100% <0.3 0.06 100% <0.3 Y Maximum Turbidity (NTU) NS 95% <0.3 N/A N/A N/A N/A 0.06 100% <0.3 0.06 100% <0.3 Y Soil runoff
Microbiological Microbiological Total Coliform Bacteria [0] 5% City-wide Maximum: 0 Positive Samples Y Total Coliform Bacteria [0] 5% City-wide Maximum: 0 Positive Samples Y Total Coliform Bacteria [0] 5% City-wide Maximum: 0 Positive Samples Y Total Coliform Bacteria [0] 5% City-wide Maximum: 0 Positive Samples Y Total Coliform Bacteria [0] 5% City-wide Maximum: 0 Positive Samples Y Total Coliform Bacteria [0] 5% City-wide Maximum: 0 Positive Samples Y Total Coliform Bacteria [0] 5% City-wide Maximum: 0 Positive Samples Y Total Coliform Bacteria [0] 5% City-wide Maximum: 0 Positive Samples Y Naturally present in the environment (% positive samples/month) (% positive samples/month) (% positive samples/month) (% positive samples/month) (% positive samples/month) (% positive samples/month) (% positive samples/month) (% positive samples/month) (% positive samples/month) (% positive samples/month) (% positive samples/month) (% positive samples/month) (% positive samples/month) (% positive samples/month) Fecal Coliform/E. Coli [0] (d) City-wide Maximum: 0 Positive Samples Y Fecal Coliform/E. Coli [0] (d) City-wide Maximum: 0 Positive Samples Y Fecal Coliform/E. Coli [0] (d) City-wide Maximum: 0 Positive Samples Y Fecal Coliform/E. Coli [0] (d) City-wide Maximum: 0 Positive Samples Y Fecal Coliform/E. Coli [0] (d) City-wide Maximum: 0 Positive Samples Y Fecal Coliform/E. Coli [0] (d) City-wide Maximum: 0 Positive Samples Y Fecal Coliform/E. Coli [0] (d) City-wide Maximum: 0 Positive Samples Y Fecal Coliform/E. Coli [0] (d) City-wide Maximum: 0 Positive Samples Y Human and animal fecal waste
Organic ChemicalOrganic ChemicalMethyl tert-Butyl Ether (MTBE) (ppb) 13 13(5*) ND ND ND ND ND ND ND ND Y 13 13(5*) ND ND ND ND ND ND ND ND Y 13 13(5*) ND ND ND ND ND ND ND ND Y 13 13(5*) ND ND ND ND ND ND ND ND Y 13 13(5*) ND ND ND ND ND ND ND ND Y 13 13(5*) ND ND ND ND ND ND ND ND Y 13 13(5*) ND ND ND ND ND ND ND ND Y 13 13(5*) ND ND ND ND ND ND ND ND Y 13 13(5*) ND ND ND ND ND ND ND ND Y 13 13(5*) ND ND ND ND ND ND ND ND Y 13 13(5*) ND ND ND ND ND ND ND ND Y 13 13(5*) ND ND ND ND ND ND ND ND Y 13 13(5*) ND ND ND ND ND ND ND ND Y 13 13(5*) ND ND ND ND ND ND ND ND Y Leaking underground storage tanksTrichloroethylene (ppb) 1.7 5 2.7 ND - 4.4 ND ND ND ND ND ND Y Trichloroethylene (ppb) 1.7 5 2.7 ND - 4.4 ND ND ND ND ND ND Y Trichloroethylene (ppb) 1.7 5 2.7 ND - 4.4 ND ND ND ND ND ND Y Trichloroethylene (ppb) 1.7 5 2.7 ND - 4.4 ND ND ND ND ND ND Y Trichloroethylene (ppb) 1.7 5 2.7 ND - 4.4 ND ND ND ND ND ND Y Trichloroethylene (ppb) 1.7 5 2.7 ND - 4.4 ND ND ND ND ND ND Y Trichloroethylene (ppb) 1.7 5 2.7 ND - 4.4 ND ND ND ND ND ND Y Trichloroethylene (ppb) 1.7 5 2.7 ND - 4.4 ND ND ND ND ND ND Y Trichloroethylene (ppb) 1.7 5 2.7 ND - 4.4 ND ND ND ND ND ND Y Trichloroethylene (ppb) 1.7 5 2.7 ND - 4.4 ND ND ND ND ND ND Y Trichloroethylene (ppb) 1.7 5 2.7 ND - 4.4 ND ND ND ND ND ND Y Trichloroethylene (ppb) 1.7 5 2.7 ND - 4.4 ND ND ND ND ND ND Y Trichloroethylene (ppb) 1.7 5 2.7 ND - 4.4 ND ND ND ND ND ND Y Trichloroethylene (ppb) 1.7 5 2.7 ND - 4.4 ND ND ND ND ND ND Y Discharge from metal degreasing sites
Disinfection Byproducts & ResidualsByproducts & ResidualsTotal Trihalomethanes (ppb) NS 80 City-wide Average: 23 Range: 10 - 33 Y By-product of drinking water chlorinationTotal Trihalomethanes (ppb) NS 80 City-wide Average: 23 Range: 10 - 33 Y By-product of drinking water chlorinationTotal Trihalomethanes (ppb) NS 80 City-wide Average: 23 Range: 10 - 33 Y By-product of drinking water chlorinationTotal Trihalomethanes (ppb) NS 80 City-wide Average: 23 Range: 10 - 33 Y By-product of drinking water chlorinationTotal Trihalomethanes (ppb) NS 80 City-wide Average: 23 Range: 10 - 33 Y By-product of drinking water chlorinationTotal Trihalomethanes (ppb) NS 80 City-wide Average: 23 Range: 10 - 33 Y By-product of drinking water chlorinationTotal Trihalomethanes (ppb) NS 80 City-wide Average: 23 Range: 10 - 33 Y By-product of drinking water chlorinationTotal Trihalomethanes (ppb) NS 80 City-wide Average: 23 Range: 10 - 33 Y By-product of drinking water chlorinationTotal Trihalomethanes (ppb) NS 80 City-wide Average: 23 Range: 10 - 33 Y By-product of drinking water chlorinationHaloacetic Acids (ppb) NS 60 City-wide Average: 5 Range: ND - 8 Y By-product of drinking water chlorinationHaloacetic Acids (ppb) NS 60 City-wide Average: 5 Range: ND - 8 Y By-product of drinking water chlorinationHaloacetic Acids (ppb) NS 60 City-wide Average: 5 Range: ND - 8 Y By-product of drinking water chlorinationHaloacetic Acids (ppb) NS 60 City-wide Average: 5 Range: ND - 8 Y By-product of drinking water chlorinationHaloacetic Acids (ppb) NS 60 City-wide Average: 5 Range: ND - 8 Y By-product of drinking water chlorinationHaloacetic Acids (ppb) NS 60 City-wide Average: 5 Range: ND - 8 Y By-product of drinking water chlorinationHaloacetic Acids (ppb) NS 60 City-wide Average: 5 Range: ND - 8 Y By-product of drinking water chlorinationHaloacetic Acids (ppb) NS 60 City-wide Average: 5 Range: ND - 8 Y By-product of drinking water chlorinationHaloacetic Acids (ppb) NS 60 City-wide Average: 5 Range: ND - 8 Y By-product of drinking water chlorinationTotal Chlorine/Chloramines (ppm) {4} {4} City-wide Average: 1.1 Range: 0.1 - 2.4 Y Drinking water disinfectant added for treatmentTotal Chlorine/Chloramines (ppm) {4} {4} City-wide Average: 1.1 Range: 0.1 - 2.4 Y Drinking water disinfectant added for treatmentTotal Chlorine/Chloramines (ppm) {4} {4} City-wide Average: 1.1 Range: 0.1 - 2.4 Y Drinking water disinfectant added for treatmentTotal Chlorine/Chloramines (ppm) {4} {4} City-wide Average: 1.1 Range: 0.1 - 2.4 Y Drinking water disinfectant added for treatmentTotal Chlorine/Chloramines (ppm) {4} {4} City-wide Average: 1.1 Range: 0.1 - 2.4 Y Drinking water disinfectant added for treatmentTotal Chlorine/Chloramines (ppm) {4} {4} City-wide Average: 1.1 Range: 0.1 - 2.4 Y Drinking water disinfectant added for treatmentTotal Chlorine/Chloramines (ppm) {4} {4} City-wide Average: 1.1 Range: 0.1 - 2.4 Y Drinking water disinfectant added for treatmentTotal Chlorine/Chloramines (ppm) {4} {4} City-wide Average: 1.1 Range: 0.1 - 2.4 Y Drinking water disinfectant added for treatmentTotal Chlorine/Chloramines (ppm) {4} {4} City-wide Average: 1.1 Range: 0.1 - 2.4 Y Drinking water disinfectant added for treatmentBromate (ppb) 0.1 10 N/A N/A N/A N/A N/A N/A 7.2 ND - 11 Y By-product of drinking water ozonationBromate (ppb) 0.1 10 N/A N/A N/A N/A N/A N/A 7.2 ND - 11 Y By-product of drinking water ozonationBromate (ppb) 0.1 10 N/A N/A N/A N/A N/A N/A 7.2 ND - 11 Y By-product of drinking water ozonationBromate (ppb) 0.1 10 N/A N/A N/A N/A N/A N/A 7.2 ND - 11 Y By-product of drinking water ozonationBromate (ppb) 0.1 10 N/A N/A N/A N/A N/A N/A 7.2 ND - 11 Y By-product of drinking water ozonationBromate (ppb) 0.1 10 N/A N/A N/A N/A N/A N/A 7.2 ND - 11 Y By-product of drinking water ozonationBromate (ppb) 0.1 10 N/A N/A N/A N/A N/A N/A 7.2 ND - 11 Y By-product of drinking water ozonationBromate (ppb) 0.1 10 N/A N/A N/A N/A N/A N/A 7.2 ND - 11 Y By-product of drinking water ozonationBromate (ppb) 0.1 10 N/A N/A N/A N/A N/A N/A 7.2 ND - 11 Y By-product of drinking water ozonationBromate (ppb) 0.1 10 N/A N/A N/A N/A N/A N/A 7.2 ND - 11 Y By-product of drinking water ozonationBromate (ppb) 0.1 10 N/A N/A N/A N/A N/A N/A 7.2 ND - 11 Y By-product of drinking water ozonationBromate (ppb) 0.1 10 N/A N/A N/A N/A N/A N/A 7.2 ND - 11 Y By-product of drinking water ozonationBromate (ppb) 0.1 10 N/A N/A N/A N/A N/A N/A 7.2 ND - 11 Y By-product of drinking water ozonationBromate (ppb) 0.1 10 N/A N/A N/A N/A N/A N/A 7.2 ND - 11 Y By-product of drinking water ozonationBromate (ppb) 0.1 10 N/A N/A N/A N/A N/A N/A 7.2 ND - 11 Y By-product of drinking water ozonation
Inorganic Chemicals Inorganic Chemicals Aluminum (ppm) 0.6 1 (0.2*) 0.04 0.04 ND ND 0.17 0.20 0.08 0.06 - 0.10 Y Erosion of natural deposits; used in water treatment processAluminum (ppm) 0.6 1 (0.2*) 0.04 0.04 ND ND 0.17 0.20 0.08 0.06 - 0.10 Y Erosion of natural deposits; used in water treatment processAluminum (ppm) 0.6 1 (0.2*) 0.04 0.04 ND ND 0.17 0.20 0.08 0.06 - 0.10 Y Erosion of natural deposits; used in water treatment processAluminum (ppm) 0.6 1 (0.2*) 0.04 0.04 ND ND 0.17 0.20 0.08 0.06 - 0.10 Y Erosion of natural deposits; used in water treatment processAluminum (ppm) 0.6 1 (0.2*) 0.04 0.04 ND ND 0.17 0.20 0.08 0.06 - 0.10 Y Erosion of natural deposits; used in water treatment processAluminum (ppm) 0.6 1 (0.2*) 0.04 0.04 ND ND 0.17 0.20 0.08 0.06 - 0.10 Y Erosion of natural deposits; used in water treatment processAluminum (ppm) 0.6 1 (0.2*) 0.04 0.04 ND ND 0.17 0.20 0.08 0.06 - 0.10 Y Erosion of natural deposits; used in water treatment processAluminum (ppm) 0.6 1 (0.2*) 0.04 0.04 ND ND 0.17 0.20 0.08 0.06 - 0.10 Y Erosion of natural deposits; used in water treatment processAluminum (ppm) 0.6 1 (0.2*) 0.04 0.04 ND ND 0.17 0.20 0.08 0.06 - 0.10 Y Erosion of natural deposits; used in water treatment processAluminum (ppm) 0.6 1 (0.2*) 0.04 0.04 ND ND 0.17 0.20 0.08 0.06 - 0.10 Y Erosion of natural deposits; used in water treatment processAluminum (ppm) 0.6 1 (0.2*) 0.04 0.04 ND ND 0.17 0.20 0.08 0.06 - 0.10 Y Erosion of natural deposits; used in water treatment processAluminum (ppm) 0.6 1 (0.2*) 0.04 0.04 ND ND 0.17 0.20 0.08 0.06 - 0.10 Y Erosion of natural deposits; used in water treatment processAluminum (ppm) 0.6 1 (0.2*) 0.04 0.04 ND ND 0.17 0.20 0.08 0.06 - 0.10 Y Erosion of natural deposits; used in water treatment processAluminum (ppm) 0.6 1 (0.2*) 0.04 0.04 ND ND 0.17 0.20 0.08 0.06 - 0.10 Y Erosion of natural deposits; used in water treatment processAluminum (ppm) 0.6 1 (0.2*) 0.04 0.04 ND ND 0.17 0.20 0.08 0.06 - 0.10 Y Erosion of natural deposits; used in water treatment processArsenic (ppb) 0.004 10 1.4 1.1 -1.7 1.0 1.0 2.2 ND - 2.7 3.2 2.5 - 3.2 Y Erosion of natural depositsArsenic (ppb) 0.004 10 1.4 1.1 -1.7 1.0 1.0 2.2 ND - 2.7 3.2 2.5 - 3.2 Y Erosion of natural depositsArsenic (ppb) 0.004 10 1.4 1.1 -1.7 1.0 1.0 2.2 ND - 2.7 3.2 2.5 - 3.2 Y Erosion of natural depositsArsenic (ppb) 0.004 10 1.4 1.1 -1.7 1.0 1.0 2.2 ND - 2.7 3.2 2.5 - 3.2 Y Erosion of natural depositsArsenic (ppb) 0.004 10 1.4 1.1 -1.7 1.0 1.0 2.2 ND - 2.7 3.2 2.5 - 3.2 Y Erosion of natural depositsArsenic (ppb) 0.004 10 1.4 1.1 -1.7 1.0 1.0 2.2 ND - 2.7 3.2 2.5 - 3.2 Y Erosion of natural depositsArsenic (ppb) 0.004 10 1.4 1.1 -1.7 1.0 1.0 2.2 ND - 2.7 3.2 2.5 - 3.2 Y Erosion of natural depositsArsenic (ppb) 0.004 10 1.4 1.1 -1.7 1.0 1.0 2.2 ND - 2.7 3.2 2.5 - 3.2 Y Erosion of natural depositsArsenic (ppb) 0.004 10 1.4 1.1 -1.7 1.0 1.0 2.2 ND - 2.7 3.2 2.5 - 3.2 Y Erosion of natural depositsArsenic (ppb) 0.004 10 1.4 1.1 -1.7 1.0 1.0 2.2 ND - 2.7 3.2 2.5 - 3.2 Y Erosion of natural depositsArsenic (ppb) 0.004 10 1.4 1.1 -1.7 1.0 1.0 2.2 ND - 2.7 3.2 2.5 - 3.2 Y Erosion of natural depositsArsenic (ppb) 0.004 10 1.4 1.1 -1.7 1.0 1.0 2.2 ND - 2.7 3.2 2.5 - 3.2 Y Erosion of natural depositsArsenic (ppb) 0.004 10 1.4 1.1 -1.7 1.0 1.0 2.2 ND - 2.7 3.2 2.5 - 3.2 Y Erosion of natural depositsArsenic (ppb) 0.004 10 1.4 1.1 -1.7 1.0 1.0 2.2 ND - 2.7 3.2 2.5 - 3.2 Y Erosion of natural depositsArsenic (ppb) 0.004 10 1.4 1.1 -1.7 1.0 1.0 2.2 ND - 2.7 3.2 2.5 - 3.2 Y Erosion of natural depositsBarium (ppm) 2 1 0.07 0.05 - 0.08 0.05 0.5 0.11 ND - 0.13 ND ND Y Barium (ppm) 2 1 0.07 0.05 - 0.08 0.05 0.5 0.11 ND - 0.13 ND ND Y Barium (ppm) 2 1 0.07 0.05 - 0.08 0.05 0.5 0.11 ND - 0.13 ND ND Y Barium (ppm) 2 1 0.07 0.05 - 0.08 0.05 0.5 0.11 ND - 0.13 ND ND Y Barium (ppm) 2 1 0.07 0.05 - 0.08 0.05 0.5 0.11 ND - 0.13 ND ND Y Barium (ppm) 2 1 0.07 0.05 - 0.08 0.05 0.5 0.11 ND - 0.13 ND ND Y Barium (ppm) 2 1 0.07 0.05 - 0.08 0.05 0.5 0.11 ND - 0.13 ND ND Y Barium (ppm) 2 1 0.07 0.05 - 0.08 0.05 0.5 0.11 ND - 0.13 ND ND Y Barium (ppm) 2 1 0.07 0.05 - 0.08 0.05 0.5 0.11 ND - 0.13 ND ND Y Barium (ppm) 2 1 0.07 0.05 - 0.08 0.05 0.5 0.11 ND - 0.13 ND ND Y Barium (ppm) 2 1 0.07 0.05 - 0.08 0.05 0.5 0.11 ND - 0.13 ND ND Y Barium (ppm) 2 1 0.07 0.05 - 0.08 0.05 0.5 0.11 ND - 0.13 ND ND Y Barium (ppm) 2 1 0.07 0.05 - 0.08 0.05 0.5 0.11 ND - 0.13 ND ND Y Barium (ppm) 2 1 0.07 0.05 - 0.08 0.05 0.5 0.11 ND - 0.13 ND ND Y Discharge from oil and metal industries; Erosion of natural depositsCopper (e) (ppm) 0.3 Copper (e) (ppm) 0.3 Copper (e) (ppm) 0.3 AL=1.3 (1.0*) City-wide 90th percentile: 0.25 0 sites out of 33 exceeded the AL Y Corrosion of household plumbing systems City-wide 90th percentile: 0.25 0 sites out of 33 exceeded the AL Y Corrosion of household plumbing systems City-wide 90th percentile: 0.25 0 sites out of 33 exceeded the AL Y Corrosion of household plumbing systems City-wide 90th percentile: 0.25 0 sites out of 33 exceeded the AL Y Corrosion of household plumbing systems City-wide 90th percentile: 0.25 0 sites out of 33 exceeded the AL Y Corrosion of household plumbing systems City-wide 90th percentile: 0.25 0 sites out of 33 exceeded the AL Y Corrosion of household plumbing systems City-wide 90th percentile: 0.25 0 sites out of 33 exceeded the AL Y Corrosion of household plumbing systems City-wide 90th percentile: 0.25 0 sites out of 33 exceeded the AL Y Corrosion of household plumbing systems City-wide 90th percentile: 0.25 0 sites out of 33 exceeded the AL Y Corrosion of household plumbing systemsFluoride After Treatment (ppm) 1 2 Control Range 0.7 - 1.3Fluoride After Treatment (ppm) 1 2 Control Range 0.7 - 1.3Fluoride After Treatment (ppm) 1 2 Control Range 0.7 - 1.3Fluoride After Treatment (ppm) 1 2 Control Range 0.7 - 1.3Fluoride After Treatment (ppm) 1 2 Control Range 0.7 - 1.3 City-wide Range 0.8 - 1.2 Y Y Y Y Y Water additive for dental healthLead (e) (ppb) 0.2 AL=15 City-wide 90th percentile: 3.7 1 site out of 33 exceeded the AL Y Corrosion of household plumbing systemsLead (e) (ppb) 0.2 AL=15 City-wide 90th percentile: 3.7 1 site out of 33 exceeded the AL Y Corrosion of household plumbing systemsLead (e) (ppb) 0.2 AL=15 City-wide 90th percentile: 3.7 1 site out of 33 exceeded the AL Y Corrosion of household plumbing systemsLead (e) (ppb) 0.2 AL=15 City-wide 90th percentile: 3.7 1 site out of 33 exceeded the AL Y Corrosion of household plumbing systemsLead (e) (ppb) 0.2 AL=15 City-wide 90th percentile: 3.7 1 site out of 33 exceeded the AL Y Corrosion of household plumbing systemsLead (e) (ppb) 0.2 AL=15 City-wide 90th percentile: 3.7 1 site out of 33 exceeded the AL Y Corrosion of household plumbing systemsLead (e) (ppb) 0.2 AL=15 City-wide 90th percentile: 3.7 1 site out of 33 exceeded the AL Y Corrosion of household plumbing systemsLead (e) (ppb) 0.2 AL=15 City-wide 90th percentile: 3.7 1 site out of 33 exceeded the AL Y Corrosion of household plumbing systemsLead (e) (ppb) 0.2 AL=15 City-wide 90th percentile: 3.7 1 site out of 33 exceeded the AL Y Corrosion of household plumbing systemsNitrate (as N) (ppm) 10 10 3.3 0.8 - 3.9 3.8 3.7 - 3.9 ND ND - 0.4 0.6 0.5 - 0.7 Y Runoff from fertilizer use; Leaching from sewage; Nitrate (as N) (ppm) 10 10 3.3 0.8 - 3.9 3.8 3.7 - 3.9 ND ND - 0.4 0.6 0.5 - 0.7 Y Runoff from fertilizer use; Leaching from sewage; Nitrate (as N) (ppm) 10 10 3.3 0.8 - 3.9 3.8 3.7 - 3.9 ND ND - 0.4 0.6 0.5 - 0.7 Y Runoff from fertilizer use; Leaching from sewage; Nitrate (as N) (ppm) 10 10 3.3 0.8 - 3.9 3.8 3.7 - 3.9 ND ND - 0.4 0.6 0.5 - 0.7 Y Runoff from fertilizer use; Leaching from sewage; Nitrate (as N) (ppm) 10 10 3.3 0.8 - 3.9 3.8 3.7 - 3.9 ND ND - 0.4 0.6 0.5 - 0.7 Y Runoff from fertilizer use; Leaching from sewage; Nitrate (as N) (ppm) 10 10 3.3 0.8 - 3.9 3.8 3.7 - 3.9 ND ND - 0.4 0.6 0.5 - 0.7 Y Runoff from fertilizer use; Leaching from sewage; Nitrate (as N) (ppm) 10 10 3.3 0.8 - 3.9 3.8 3.7 - 3.9 ND ND - 0.4 0.6 0.5 - 0.7 Y Runoff from fertilizer use; Leaching from sewage; Nitrate (as N) (ppm) 10 10 3.3 0.8 - 3.9 3.8 3.7 - 3.9 ND ND - 0.4 0.6 0.5 - 0.7 Y Runoff from fertilizer use; Leaching from sewage; Nitrate (as N) (ppm) 10 10 3.3 0.8 - 3.9 3.8 3.7 - 3.9 ND ND - 0.4 0.6 0.5 - 0.7 Y Runoff from fertilizer use; Leaching from sewage; Nitrate (as N) (ppm) 10 10 3.3 0.8 - 3.9 3.8 3.7 - 3.9 ND ND - 0.4 0.6 0.5 - 0.7 Y Runoff from fertilizer use; Leaching from sewage; Nitrate (as N) (ppm) 10 10 3.3 0.8 - 3.9 3.8 3.7 - 3.9 ND ND - 0.4 0.6 0.5 - 0.7 Y Runoff from fertilizer use; Leaching from sewage; Nitrate (as N) (ppm) 10 10 3.3 0.8 - 3.9 3.8 3.7 - 3.9 ND ND - 0.4 0.6 0.5 - 0.7 Y Runoff from fertilizer use; Leaching from sewage; Nitrate (as N) (ppm) 10 10 3.3 0.8 - 3.9 3.8 3.7 - 3.9 ND ND - 0.4 0.6 0.5 - 0.7 Y Runoff from fertilizer use; Leaching from sewage; Nitrate (as N) (ppm) 10 10 3.3 0.8 - 3.9 3.8 3.7 - 3.9 ND ND - 0.4 0.6 0.5 - 0.7 Y Runoff from fertilizer use; Leaching from sewage; Nitrate (as N) (ppm) 10 10 3.3 0.8 - 3.9 3.8 3.7 - 3.9 ND ND - 0.4 0.6 0.5 - 0.7 Y Runoff from fertilizer use; Leaching from sewage; Erosion of natural depositsPerchlorate (ppb) 6 6 ND Perchlorate (ppb) 6 6 ND Perchlorate (ppb) 6 6 ND Perchlorate (ppb) 6 6 ND Perchlorate (ppb) 6 6 ND ND ND ND NDND ND ND NDND ND ND NDND ND ND NDND ND ND ND ND ND ND Y Industrial waste discharge ND ND ND Y Industrial waste discharge ND ND ND Y Industrial waste discharge ND ND ND Y Industrial waste discharge ND ND ND Y Industrial waste discharge ND ND ND Y Industrial waste discharge ND ND ND Y Industrial waste discharge ND ND ND Y Industrial waste discharge ND ND ND Y Industrial waste discharge
RadionuclidesAlpha emitters (pCi/l) [0] 15 2.6 ND - 5.1 ND ND 5.2 ND - 7.8 3.4 ND - 7.3 2008 Y Erosion of natural depositsAlpha emitters (pCi/l) [0] 15 2.6 ND - 5.1 ND ND 5.2 ND - 7.8 3.4 ND - 7.3 2008 Y Erosion of natural depositsAlpha emitters (pCi/l) [0] 15 2.6 ND - 5.1 ND ND 5.2 ND - 7.8 3.4 ND - 7.3 2008 Y Erosion of natural depositsAlpha emitters (pCi/l) [0] 15 2.6 ND - 5.1 ND ND 5.2 ND - 7.8 3.4 ND - 7.3 2008 Y Erosion of natural depositsAlpha emitters (pCi/l) [0] 15 2.6 ND - 5.1 ND ND 5.2 ND - 7.8 3.4 ND - 7.3 2008 Y Erosion of natural depositsAlpha emitters (pCi/l) [0] 15 2.6 ND - 5.1 ND ND 5.2 ND - 7.8 3.4 ND - 7.3 2008 Y Erosion of natural depositsAlpha emitters (pCi/l) [0] 15 2.6 ND - 5.1 ND ND 5.2 ND - 7.8 3.4 ND - 7.3 2008 Y Erosion of natural depositsAlpha emitters (pCi/l) [0] 15 2.6 ND - 5.1 ND ND 5.2 ND - 7.8 3.4 ND - 7.3 2008 Y Erosion of natural depositsAlpha emitters (pCi/l) [0] 15 2.6 ND - 5.1 ND ND 5.2 ND - 7.8 3.4 ND - 7.3 2008 Y Erosion of natural depositsAlpha emitters (pCi/l) [0] 15 2.6 ND - 5.1 ND ND 5.2 ND - 7.8 3.4 ND - 7.3 2008 Y Erosion of natural depositsAlpha emitters (pCi/l) [0] 15 2.6 ND - 5.1 ND ND 5.2 ND - 7.8 3.4 ND - 7.3 2008 Y Erosion of natural depositsAlpha emitters (pCi/l) [0] 15 2.6 ND - 5.1 ND ND 5.2 ND - 7.8 3.4 ND - 7.3 2008 Y Erosion of natural depositsAlpha emitters (pCi/l) [0] 15 2.6 ND - 5.1 ND ND 5.2 ND - 7.8 3.4 ND - 7.3 2008 Y Erosion of natural depositsAlpha emitters (pCi/l) [0] 15 2.6 ND - 5.1 ND ND 5.2 ND - 7.8 3.4 ND - 7.3 2008 Y Erosion of natural depositsAlpha emitters (pCi/l) [0] 15 2.6 ND - 5.1 ND ND 5.2 ND - 7.8 3.4 ND - 7.3 2008 Y Erosion of natural depositsBeta/photon emitters (pCi/l) [0] 50 N/A N/A N/A N/A 4.2 ND -9.7 ND ND - 5.2 2008 Y Decay of natural and man-made depositsBeta/photon emitters (pCi/l) [0] 50 N/A N/A N/A N/A 4.2 ND -9.7 ND ND - 5.2 2008 Y Decay of natural and man-made depositsBeta/photon emitters (pCi/l) [0] 50 N/A N/A N/A N/A 4.2 ND -9.7 ND ND - 5.2 2008 Y Decay of natural and man-made depositsBeta/photon emitters (pCi/l) [0] 50 N/A N/A N/A N/A 4.2 ND -9.7 ND ND - 5.2 2008 Y Decay of natural and man-made depositsBeta/photon emitters (pCi/l) [0] 50 N/A N/A N/A N/A 4.2 ND -9.7 ND ND - 5.2 2008 Y Decay of natural and man-made depositsBeta/photon emitters (pCi/l) [0] 50 N/A N/A N/A N/A 4.2 ND -9.7 ND ND - 5.2 2008 Y Decay of natural and man-made depositsBeta/photon emitters (pCi/l) [0] 50 N/A N/A N/A N/A 4.2 ND -9.7 ND ND - 5.2 2008 Y Decay of natural and man-made depositsBeta/photon emitters (pCi/l) [0] 50 N/A N/A N/A N/A 4.2 ND -9.7 ND ND - 5.2 2008 Y Decay of natural and man-made depositsBeta/photon emitters (pCi/l) [0] 50 N/A N/A N/A N/A 4.2 ND -9.7 ND ND - 5.2 2008 Y Decay of natural and man-made depositsBeta/photon emitters (pCi/l) [0] 50 N/A N/A N/A N/A 4.2 ND -9.7 ND ND - 5.2 2008 Y Decay of natural and man-made depositsBeta/photon emitters (pCi/l) [0] 50 N/A N/A N/A N/A 4.2 ND -9.7 ND ND - 5.2 2008 Y Decay of natural and man-made depositsBeta/photon emitters (pCi/l) [0] 50 N/A N/A N/A N/A 4.2 ND -9.7 ND ND - 5.2 2008 Y Decay of natural and man-made depositsBeta/photon emitters (pCi/l) [0] 50 N/A N/A N/A N/A 4.2 ND -9.7 ND ND - 5.2 2008 Y Decay of natural and man-made depositsBeta/photon emitters (pCi/l) [0] 50 N/A N/A N/A N/A 4.2 ND -9.7 ND ND - 5.2 2008 Y Decay of natural and man-made depositsBeta/photon emitters (pCi/l) [0] 50 N/A N/A N/A N/A 4.2 ND -9.7 ND ND - 5.2 2008 Y Decay of natural and man-made depositsCombined Radium (pCi/l) [0] 5 0.4 ND - 0.9 ND ND ND ND ND ND 2008 Y Erosion of natural depositsCombined Radium (pCi/l) [0] 5 0.4 ND - 0.9 ND ND ND ND ND ND 2008 Y Erosion of natural depositsCombined Radium (pCi/l) [0] 5 0.4 ND - 0.9 ND ND ND ND ND ND 2008 Y Erosion of natural depositsCombined Radium (pCi/l) [0] 5 0.4 ND - 0.9 ND ND ND ND ND ND 2008 Y Erosion of natural depositsCombined Radium (pCi/l) [0] 5 0.4 ND - 0.9 ND ND ND ND ND ND 2008 Y Erosion of natural depositsCombined Radium (pCi/l) [0] 5 0.4 ND - 0.9 ND ND ND ND ND ND 2008 Y Erosion of natural depositsCombined Radium (pCi/l) [0] 5 0.4 ND - 0.9 ND ND ND ND ND ND 2008 Y Erosion of natural depositsCombined Radium (pCi/l) [0] 5 0.4 ND - 0.9 ND ND ND ND ND ND 2008 Y Erosion of natural depositsCombined Radium (pCi/l) [0] 5 0.4 ND - 0.9 ND ND ND ND ND ND 2008 Y Erosion of natural depositsCombined Radium (pCi/l) [0] 5 0.4 ND - 0.9 ND ND ND ND ND ND 2008 Y Erosion of natural depositsCombined Radium (pCi/l) [0] 5 0.4 ND - 0.9 ND ND ND ND ND ND 2008 Y Erosion of natural depositsCombined Radium (pCi/l) [0] 5 0.4 ND - 0.9 ND ND ND ND ND ND 2008 Y Erosion of natural depositsCombined Radium (pCi/l) [0] 5 0.4 ND - 0.9 ND ND ND ND ND ND 2008 Y Erosion of natural depositsCombined Radium (pCi/l) [0] 5 0.4 ND - 0.9 ND ND ND ND ND ND 2008 Y Erosion of natural depositsCombined Radium (pCi/l) [0] 5 0.4 ND - 0.9 ND ND ND ND ND ND 2008 Y Erosion of natural depositsUranium (pCi/l) 0.43 20 2.6 ND - 5.1 0.7 0.7 2.9 2.4 - 3.4 1.8 1.6 - 2.0 2008 Y Erosion of natural depositsUranium (pCi/l) 0.43 20 2.6 ND - 5.1 0.7 0.7 2.9 2.4 - 3.4 1.8 1.6 - 2.0 2008 Y Erosion of natural depositsUranium (pCi/l) 0.43 20 2.6 ND - 5.1 0.7 0.7 2.9 2.4 - 3.4 1.8 1.6 - 2.0 2008 Y Erosion of natural depositsUranium (pCi/l) 0.43 20 2.6 ND - 5.1 0.7 0.7 2.9 2.4 - 3.4 1.8 1.6 - 2.0 2008 Y Erosion of natural depositsUranium (pCi/l) 0.43 20 2.6 ND - 5.1 0.7 0.7 2.9 2.4 - 3.4 1.8 1.6 - 2.0 2008 Y Erosion of natural depositsUranium (pCi/l) 0.43 20 2.6 ND - 5.1 0.7 0.7 2.9 2.4 - 3.4 1.8 1.6 - 2.0 2008 Y Erosion of natural depositsUranium (pCi/l) 0.43 20 2.6 ND - 5.1 0.7 0.7 2.9 2.4 - 3.4 1.8 1.6 - 2.0 2008 Y Erosion of natural depositsUranium (pCi/l) 0.43 20 2.6 ND - 5.1 0.7 0.7 2.9 2.4 - 3.4 1.8 1.6 - 2.0 2008 Y Erosion of natural depositsUranium (pCi/l) 0.43 20 2.6 ND - 5.1 0.7 0.7 2.9 2.4 - 3.4 1.8 1.6 - 2.0 2008 Y Erosion of natural depositsUranium (pCi/l) 0.43 20 2.6 ND - 5.1 0.7 0.7 2.9 2.4 - 3.4 1.8 1.6 - 2.0 2008 Y Erosion of natural depositsUranium (pCi/l) 0.43 20 2.6 ND - 5.1 0.7 0.7 2.9 2.4 - 3.4 1.8 1.6 - 2.0 2008 Y Erosion of natural depositsUranium (pCi/l) 0.43 20 2.6 ND - 5.1 0.7 0.7 2.9 2.4 - 3.4 1.8 1.6 - 2.0 2008 Y Erosion of natural depositsUranium (pCi/l) 0.43 20 2.6 ND - 5.1 0.7 0.7 2.9 2.4 - 3.4 1.8 1.6 - 2.0 2008 Y Erosion of natural depositsUranium (pCi/l) 0.43 20 2.6 ND - 5.1 0.7 0.7 2.9 2.4 - 3.4 1.8 1.6 - 2.0 2008 Y Erosion of natural depositsUranium (pCi/l) 0.43 20 2.6 ND - 5.1 0.7 0.7 2.9 2.4 - 3.4 1.8 1.6 - 2.0 2008 Y Erosion of natural deposits

CITY OF SANTA MONICA WATER DIVISION
Summary of Secondary Drinking Water Quality Results for 2010
LOCAL IMPORTED IMPORTED LOCAL IMPORTED IMPORTED LOCAL IMPORTED IMPORTED LOCAL IMPORTED IMPORTED LOCAL IMPORTED IMPORTED LOCAL IMPORTED IMPORTED LOCAL IMPORTED IMPORTED LOCAL IMPORTED IMPORTED LOCAL IMPORTED IMPORTED LOCAL IMPORTED IMPORTED LOCAL IMPORTED IMPORTED LOCAL IMPORTED IMPORTED PHG/ State WELL WATER (a) SM WELL #1(b) SURFACE WATER SURFACE WATER PHG/ State WELL WATER (a) SM WELL #1(b) SURFACE WATER SURFACE WATER PHG/ State WELL WATER (a) SM WELL #1(b) SURFACE WATER SURFACE WATER PHG/ State WELL WATER (a) SM WELL #1(b) SURFACE WATER SURFACE WATER PHG/ State WELL WATER (a) SM WELL #1(b) SURFACE WATER SURFACE WATER PHG/ State WELL WATER (a) SM WELL #1(b) SURFACE WATER SURFACE WATER PHG/ State WELL WATER (a) SM WELL #1(b) SURFACE WATER SURFACE WATER PHG/ State WELL WATER (a) SM WELL #1(b) SURFACE WATER SURFACE WATER PHG/ State WELL WATER (a) SM WELL #1(b) SURFACE WATER SURFACE WATER PHG/ State WELL WATER (a) SM WELL #1(b) SURFACE WATER SURFACE WATER PHG/ State WELL WATER (a) SM WELL #1(b) SURFACE WATER SURFACE WATER PHG/ State WELL WATER (a) SM WELL #1(b) SURFACE WATER SURFACE WATER PHG/ State WELL WATER (a) SM WELL #1(b) SURFACE WATER SURFACE WATER PHG/ State WELL WATER (a) SM WELL #1(b) SURFACE WATER SURFACE WATER Parameter [MCLG] MCL Arcadia Plant Weymouth Plant Jensen Plant Parameter [MCLG] MCL Arcadia Plant Weymouth Plant Jensen Plant Parameter [MCLG] MCL Arcadia Plant Weymouth Plant Jensen Plant Parameter [MCLG] MCL Arcadia Plant Weymouth Plant Jensen Plant Parameter [MCLG] MCL Arcadia Plant Weymouth Plant Jensen Plant Parameter [MCLG] MCL Arcadia Plant Weymouth Plant Jensen Plant Parameter [MCLG] MCL Arcadia Plant Weymouth Plant Jensen Plant Parameter [MCLG] MCL Arcadia Plant Weymouth Plant Jensen Plant Parameter [MCLG] MCL Arcadia Plant Weymouth Plant Jensen Plant Average Range Average Range Average Range Average Range Average Range Average Range Average Range Average Range Average Range Average Range Average Range Average Range
SECONDARY DRINKING WATER STANDARDS (AESTHETIC STANDARDS)
Chemical ParametersChloride (ppm) NS 500 83 14 - 95 100 99 - 103 88 83 - 94 74 67 -80 Y Runoff/leaching from natural deposits; industrial wastesChloride (ppm) NS 500 83 14 - 95 100 99 - 103 88 83 - 94 74 67 -80 Y Runoff/leaching from natural deposits; industrial wastesChloride (ppm) NS 500 83 14 - 95 100 99 - 103 88 83 - 94 74 67 -80 Y Runoff/leaching from natural deposits; industrial wastesChloride (ppm) NS 500 83 14 - 95 100 99 - 103 88 83 - 94 74 67 -80 Y Runoff/leaching from natural deposits; industrial wastesChloride (ppm) NS 500 83 14 - 95 100 99 - 103 88 83 - 94 74 67 -80 Y Runoff/leaching from natural deposits; industrial wastesChloride (ppm) NS 500 83 14 - 95 100 99 - 103 88 83 - 94 74 67 -80 Y Runoff/leaching from natural deposits; industrial wastesChloride (ppm) NS 500 83 14 - 95 100 99 - 103 88 83 - 94 74 67 -80 Y Runoff/leaching from natural deposits; industrial wastesChloride (ppm) NS 500 83 14 - 95 100 99 - 103 88 83 - 94 74 67 -80 Y Runoff/leaching from natural deposits; industrial wastesChloride (ppm) NS 500 83 14 - 95 100 99 - 103 88 83 - 94 74 67 -80 Y Runoff/leaching from natural deposits; industrial wastesChloride (ppm) NS 500 83 14 - 95 100 99 - 103 88 83 - 94 74 67 -80 Y Runoff/leaching from natural deposits; industrial wastesChloride (ppm) NS 500 83 14 - 95 100 99 - 103 88 83 - 94 74 67 -80 Y Runoff/leaching from natural deposits; industrial wastesChloride (ppm) NS 500 83 14 - 95 100 99 - 103 88 83 - 94 74 67 -80 Y Runoff/leaching from natural deposits; industrial wastesChloride (ppm) NS 500 83 14 - 95 100 99 - 103 88 83 - 94 74 67 -80 Y Runoff/leaching from natural deposits; industrial wastesChloride (ppm) NS 500 83 14 - 95 100 99 - 103 88 83 - 94 74 67 -80 Y Runoff/leaching from natural deposits; industrial wastesColor (units) NS 15 <5 <5 <5 <5 1 1 1 1 - 2 Y Naturally-occurring organic materialsColor (units) NS 15 <5 <5 <5 <5 1 1 1 1 - 2 Y Naturally-occurring organic materialsColor (units) NS 15 <5 <5 <5 <5 1 1 1 1 - 2 Y Naturally-occurring organic materialsColor (units) NS 15 <5 <5 <5 <5 1 1 1 1 - 2 Y Naturally-occurring organic materialsColor (units) NS 15 <5 <5 <5 <5 1 1 1 1 - 2 Y Naturally-occurring organic materialsColor (units) NS 15 <5 <5 <5 <5 1 1 1 1 - 2 Y Naturally-occurring organic materialsColor (units) NS 15 <5 <5 <5 <5 1 1 1 1 - 2 Y Naturally-occurring organic materialsColor (units) NS 15 <5 <5 <5 <5 1 1 1 1 - 2 Y Naturally-occurring organic materialsColor (units) NS 15 <5 <5 <5 <5 1 1 1 1 - 2 Y Naturally-occurring organic materialsColor (units) NS 15 <5 <5 <5 <5 1 1 1 1 - 2 Y Naturally-occurring organic materialsColor (units) NS 15 <5 <5 <5 <5 1 1 1 1 - 2 Y Naturally-occurring organic materialsColor (units) NS 15 <5 <5 <5 <5 1 1 1 1 - 2 Y Naturally-occurring organic materialsColor (units) NS 15 <5 <5 <5 <5 1 1 1 1 - 2 Y Naturally-occurring organic materialsColor (units) NS 15 <5 <5 <5 <5 1 1 1 1 - 2 Y Naturally-occurring organic materialsIron (ppb) NS 300 7 5 - 8 9 6 -13 ND Iron (ppb) NS 300 7 5 - 8 9 6 -13 ND Iron (ppb) NS 300 7 5 - 8 9 6 -13 ND Iron (ppb) NS 300 7 5 - 8 9 6 -13 ND Iron (ppb) NS 300 7 5 - 8 9 6 -13 ND Iron (ppb) NS 300 7 5 - 8 9 6 -13 ND ND ND ND Y Leaching from natural deposits; industrial wastesND ND ND Y Leaching from natural deposits; industrial wastesND ND ND Y Leaching from natural deposits; industrial wastesND ND ND Y Leaching from natural deposits; industrial wastesND ND ND Y Leaching from natural deposits; industrial wastesND ND ND Y Leaching from natural deposits; industrial wastesND ND ND Y Leaching from natural deposits; industrial wastesND ND ND Y Leaching from natural deposits; industrial wastesND ND ND Y Leaching from natural deposits; industrial wastesManganese (ppb) NS 50 8 6 - 9 9 6 - 12 ND ND ND ND Y Leaching from natural depositsManganese (ppb) NS 50 8 6 - 9 9 6 - 12 ND ND ND ND Y Leaching from natural depositsManganese (ppb) NS 50 8 6 - 9 9 6 - 12 ND ND ND ND Y Leaching from natural depositsManganese (ppb) NS 50 8 6 - 9 9 6 - 12 ND ND ND ND Y Leaching from natural depositsManganese (ppb) NS 50 8 6 - 9 9 6 - 12 ND ND ND ND Y Leaching from natural depositsManganese (ppb) NS 50 8 6 - 9 9 6 - 12 ND ND ND ND Y Leaching from natural depositsManganese (ppb) NS 50 8 6 - 9 9 6 - 12 ND ND ND ND Y Leaching from natural depositsManganese (ppb) NS 50 8 6 - 9 9 6 - 12 ND ND ND ND Y Leaching from natural depositsManganese (ppb) NS 50 8 6 - 9 9 6 - 12 ND ND ND ND Y Leaching from natural depositsManganese (ppb) NS 50 8 6 - 9 9 6 - 12 ND ND ND ND Y Leaching from natural depositsManganese (ppb) NS 50 8 6 - 9 9 6 - 12 ND ND ND ND Y Leaching from natural depositsManganese (ppb) NS 50 8 6 - 9 9 6 - 12 ND ND ND ND Y Leaching from natural depositsManganese (ppb) NS 50 8 6 - 9 9 6 - 12 ND ND ND ND Y Leaching from natural depositsManganese (ppb) NS 50 8 6 - 9 9 6 - 12 ND ND ND ND Y Leaching from natural depositsOdor- Threshold (units) NS 3 <1 <1 <1 <1 2(d) 2(d) 3(d) 3(d) Y Naturally-occurring organic materials; chlorineOdor- Threshold (units) NS 3 <1 <1 <1 <1 2(d) 2(d) 3(d) 3(d) Y Naturally-occurring organic materials; chlorineOdor- Threshold (units) NS 3 <1 <1 <1 <1 2(d) 2(d) 3(d) 3(d) Y Naturally-occurring organic materials; chlorineOdor- Threshold (units) NS 3 <1 <1 <1 <1 2(d) 2(d) 3(d) 3(d) Y Naturally-occurring organic materials; chlorineOdor- Threshold (units) NS 3 <1 <1 <1 <1 2(d) 2(d) 3(d) 3(d) Y Naturally-occurring organic materials; chlorineOdor- Threshold (units) NS 3 <1 <1 <1 <1 2(d) 2(d) 3(d) 3(d) Y Naturally-occurring organic materials; chlorineOdor- Threshold (units) NS 3 <1 <1 <1 <1 2(d) 2(d) 3(d) 3(d) Y Naturally-occurring organic materials; chlorineOdor- Threshold (units) NS 3 <1 <1 <1 <1 2(d) 2(d) 3(d) 3(d) Y Naturally-occurring organic materials; chlorineOdor- Threshold (units) NS 3 <1 <1 <1 <1 2(d) 2(d) 3(d) 3(d) Y Naturally-occurring organic materials; chlorineOdor- Threshold (units) NS 3 <1 <1 <1 <1 2(d) 2(d) 3(d) 3(d) Y Naturally-occurring organic materials; chlorineOdor- Threshold (units) NS 3 <1 <1 <1 <1 2(d) 2(d) 3(d) 3(d) Y Naturally-occurring organic materials; chlorineOdor- Threshold (units) NS 3 <1 <1 <1 <1 2(d) 2(d) 3(d) 3(d) Y Naturally-occurring organic materials; chlorineOdor- Threshold (units) NS 3 <1 <1 <1 <1 2(d) 2(d) 3(d) 3(d) Y Naturally-occurring organic materials; chlorineOdor- Threshold (units) NS 3 <1 <1 <1 <1 2(d) 2(d) 3(d) 3(d) Y Naturally-occurring organic materials; chlorineSpecifi c Conductance (µmho/cm) NS 1600 930 250 - 1112 1312 1283 - 1333 889 460 - 1000 555 500 -570 Y Specifi c Conductance (µmho/cm) NS 1600 930 250 - 1112 1312 1283 - 1333 889 460 - 1000 555 500 -570 Y Specifi c Conductance (µmho/cm) NS 1600 930 250 - 1112 1312 1283 - 1333 889 460 - 1000 555 500 -570 Y Specifi c Conductance (µmho/cm) NS 1600 930 250 - 1112 1312 1283 - 1333 889 460 - 1000 555 500 -570 Y Specifi c Conductance (µmho/cm) NS 1600 930 250 - 1112 1312 1283 - 1333 889 460 - 1000 555 500 -570 Y Specifi c Conductance (µmho/cm) NS 1600 930 250 - 1112 1312 1283 - 1333 889 460 - 1000 555 500 -570 Y Specifi c Conductance (µmho/cm) NS 1600 930 250 - 1112 1312 1283 - 1333 889 460 - 1000 555 500 -570 Y Specifi c Conductance (µmho/cm) NS 1600 930 250 - 1112 1312 1283 - 1333 889 460 - 1000 555 500 -570 Y Specifi c Conductance (µmho/cm) NS 1600 930 250 - 1112 1312 1283 - 1333 889 460 - 1000 555 500 -570 Y Specifi c Conductance (µmho/cm) NS 1600 930 250 - 1112 1312 1283 - 1333 889 460 - 1000 555 500 -570 Y Specifi c Conductance (µmho/cm) NS 1600 930 250 - 1112 1312 1283 - 1333 889 460 - 1000 555 500 -570 Y Specifi c Conductance (µmho/cm) NS 1600 930 250 - 1112 1312 1283 - 1333 889 460 - 1000 555 500 -570 Y Specifi c Conductance (µmho/cm) NS 1600 930 250 - 1112 1312 1283 - 1333 889 460 - 1000 555 500 -570 Y Substances that form ions when in water; seawater infl uenceSulfate (ppm) NS 500 161 32 -218 237 232 - 240 194 160 - 250 60 55 -65 Y Runoff/leaching from natural deposits; industrial wastesSulfate (ppm) NS 500 161 32 -218 237 232 - 240 194 160 - 250 60 55 -65 Y Runoff/leaching from natural deposits; industrial wastesSulfate (ppm) NS 500 161 32 -218 237 232 - 240 194 160 - 250 60 55 -65 Y Runoff/leaching from natural deposits; industrial wastesSulfate (ppm) NS 500 161 32 -218 237 232 - 240 194 160 - 250 60 55 -65 Y Runoff/leaching from natural deposits; industrial wastesSulfate (ppm) NS 500 161 32 -218 237 232 - 240 194 160 - 250 60 55 -65 Y Runoff/leaching from natural deposits; industrial wastesSulfate (ppm) NS 500 161 32 -218 237 232 - 240 194 160 - 250 60 55 -65 Y Runoff/leaching from natural deposits; industrial wastesSulfate (ppm) NS 500 161 32 -218 237 232 - 240 194 160 - 250 60 55 -65 Y Runoff/leaching from natural deposits; industrial wastesSulfate (ppm) NS 500 161 32 -218 237 232 - 240 194 160 - 250 60 55 -65 Y Runoff/leaching from natural deposits; industrial wastesSulfate (ppm) NS 500 161 32 -218 237 232 - 240 194 160 - 250 60 55 -65 Y Runoff/leaching from natural deposits; industrial wastesSulfate (ppm) NS 500 161 32 -218 237 232 - 240 194 160 - 250 60 55 -65 Y Runoff/leaching from natural deposits; industrial wastesSulfate (ppm) NS 500 161 32 -218 237 232 - 240 194 160 - 250 60 55 -65 Y Runoff/leaching from natural deposits; industrial wastesSulfate (ppm) NS 500 161 32 -218 237 232 - 240 194 160 - 250 60 55 -65 Y Runoff/leaching from natural deposits; industrial wastesSulfate (ppm) NS 500 161 32 -218 237 232 - 240 194 160 - 250 60 55 -65 Y Runoff/leaching from natural deposits; industrial wastesSulfate (ppm) NS 500 161 32 -218 237 232 - 240 194 160 - 250 60 55 -65 Y Runoff/leaching from natural deposits; industrial wastesTotal Dissolved Solids (ppm) NS 1000 627 627 869 869 532 470 - 630 309 290 - 320 Y Runoff/leaching from natural depositsTotal Dissolved Solids (ppm) NS 1000 627 627 869 869 532 470 - 630 309 290 - 320 Y Runoff/leaching from natural depositsTotal Dissolved Solids (ppm) NS 1000 627 627 869 869 532 470 - 630 309 290 - 320 Y Runoff/leaching from natural depositsTotal Dissolved Solids (ppm) NS 1000 627 627 869 869 532 470 - 630 309 290 - 320 Y Runoff/leaching from natural depositsTotal Dissolved Solids (ppm) NS 1000 627 627 869 869 532 470 - 630 309 290 - 320 Y Runoff/leaching from natural depositsTotal Dissolved Solids (ppm) NS 1000 627 627 869 869 532 470 - 630 309 290 - 320 Y Runoff/leaching from natural depositsTotal Dissolved Solids (ppm) NS 1000 627 627 869 869 532 470 - 630 309 290 - 320 Y Runoff/leaching from natural depositsTotal Dissolved Solids (ppm) NS 1000 627 627 869 869 532 470 - 630 309 290 - 320 Y Runoff/leaching from natural depositsTotal Dissolved Solids (ppm) NS 1000 627 627 869 869 532 470 - 630 309 290 - 320 Y Runoff/leaching from natural depositsTotal Dissolved Solids (ppm) NS 1000 627 627 869 869 532 470 - 630 309 290 - 320 Y Runoff/leaching from natural depositsTotal Dissolved Solids (ppm) NS 1000 627 627 869 869 532 470 - 630 309 290 - 320 Y Runoff/leaching from natural depositsTotal Dissolved Solids (ppm) NS 1000 627 627 869 869 532 470 - 630 309 290 - 320 Y Runoff/leaching from natural depositsTotal Dissolved Solids (ppm) NS 1000 627 627 869 869 532 470 - 630 309 290 - 320 Y Runoff/leaching from natural depositsTotal Dissolved Solids (ppm) NS 1000 627 627 869 869 532 470 - 630 309 290 - 320 Y Runoff/leaching from natural depositsTurbidity (NTU) NS 5 0.12 0.06- 0.21 0.06 0.06 - 0.18 0.05 0.03 - 0.06 0.04 0.03 - 0.08 Y Soil runoffTurbidity (NTU) NS 5 0.12 0.06- 0.21 0.06 0.06 - 0.18 0.05 0.03 - 0.06 0.04 0.03 - 0.08 Y Soil runoffTurbidity (NTU) NS 5 0.12 0.06- 0.21 0.06 0.06 - 0.18 0.05 0.03 - 0.06 0.04 0.03 - 0.08 Y Soil runoffTurbidity (NTU) NS 5 0.12 0.06- 0.21 0.06 0.06 - 0.18 0.05 0.03 - 0.06 0.04 0.03 - 0.08 Y Soil runoffTurbidity (NTU) NS 5 0.12 0.06- 0.21 0.06 0.06 - 0.18 0.05 0.03 - 0.06 0.04 0.03 - 0.08 Y Soil runoffTurbidity (NTU) NS 5 0.12 0.06- 0.21 0.06 0.06 - 0.18 0.05 0.03 - 0.06 0.04 0.03 - 0.08 Y Soil runoffTurbidity (NTU) NS 5 0.12 0.06- 0.21 0.06 0.06 - 0.18 0.05 0.03 - 0.06 0.04 0.03 - 0.08 Y Soil runoffTurbidity (NTU) NS 5 0.12 0.06- 0.21 0.06 0.06 - 0.18 0.05 0.03 - 0.06 0.04 0.03 - 0.08 Y Soil runoffTurbidity (NTU) NS 5 0.12 0.06- 0.21 0.06 0.06 - 0.18 0.05 0.03 - 0.06 0.04 0.03 - 0.08 Y Soil runoffTurbidity (NTU) NS 5 0.12 0.06- 0.21 0.06 0.06 - 0.18 0.05 0.03 - 0.06 0.04 0.03 - 0.08 Y Soil runoffTurbidity (NTU) NS 5 0.12 0.06- 0.21 0.06 0.06 - 0.18 0.05 0.03 - 0.06 0.04 0.03 - 0.08 Y Soil runoffTurbidity (NTU) NS 5 0.12 0.06- 0.21 0.06 0.06 - 0.18 0.05 0.03 - 0.06 0.04 0.03 - 0.08 Y Soil runoffTurbidity (NTU) NS 5 0.12 0.06- 0.21 0.06 0.06 - 0.18 0.05 0.03 - 0.06 0.04 0.03 - 0.08 Y Soil runoff
UNREGULATED CHEMICALS REQUIRING MONITORING
Boron (ppb) NS NL=1000 150 150 200 200 125 100 - 130 210 200 - 220Boron (ppb) NS NL=1000 150 150 200 200 125 100 - 130 210 200 - 220Boron (ppb) NS NL=1000 150 150 200 200 125 100 - 130 210 200 - 220Boron (ppb) NS NL=1000 150 150 200 200 125 100 - 130 210 200 - 220Boron (ppb) NS NL=1000 150 150 200 200 125 100 - 130 210 200 - 220Boron (ppb) NS NL=1000 150 150 200 200 125 100 - 130 210 200 - 220Boron (ppb) NS NL=1000 150 150 200 200 125 100 - 130 210 200 - 220Boron (ppb) NS NL=1000 150 150 200 200 125 100 - 130 210 200 - 220Boron (ppb) NS NL=1000 150 150 200 200 125 100 - 130 210 200 - 220Chromium VI (ppb) NS NS 1.2 1.2 1.1 1.1 0.06 0.04 - 0.10 0.42 0.37 - 0.45Chromium VI (ppb) NS NS 1.2 1.2 1.1 1.1 0.06 0.04 - 0.10 0.42 0.37 - 0.45Chromium VI (ppb) NS NS 1.2 1.2 1.1 1.1 0.06 0.04 - 0.10 0.42 0.37 - 0.45Chromium VI (ppb) NS NS 1.2 1.2 1.1 1.1 0.06 0.04 - 0.10 0.42 0.37 - 0.45Chromium VI (ppb) NS NS 1.2 1.2 1.1 1.1 0.06 0.04 - 0.10 0.42 0.37 - 0.45Chromium VI (ppb) NS NS 1.2 1.2 1.1 1.1 0.06 0.04 - 0.10 0.42 0.37 - 0.45Chromium VI (ppb) NS NS 1.2 1.2 1.1 1.1 0.06 0.04 - 0.10 0.42 0.37 - 0.45Chromium VI (ppb) NS NS 1.2 1.2 1.1 1.1 0.06 0.04 - 0.10 0.42 0.37 - 0.45Chromium VI (ppb) NS NS 1.2 1.2 1.1 1.1 0.06 0.04 - 0.10 0.42 0.37 - 0.45Vanadium (ppb) NS NL=50 3.9 3.7 - 4.0 ND ND ND ND - 3.1 5.2 Vanadium (ppb) NS NL=50 3.9 3.7 - 4.0 ND ND ND ND - 3.1 5.2 Vanadium (ppb) NS NL=50 3.9 3.7 - 4.0 ND ND ND ND - 3.1 5.2 Vanadium (ppb) NS NL=50 3.9 3.7 - 4.0 ND ND ND ND - 3.1 5.2 Vanadium (ppb) NS NL=50 3.9 3.7 - 4.0 ND ND ND ND - 3.1 5.2 Vanadium (ppb) NS NL=50 3.9 3.7 - 4.0 ND ND ND ND - 3.1 5.2 Vanadium (ppb) NS NL=50 3.9 3.7 - 4.0 ND ND ND ND - 3.1 5.2 Vanadium (ppb) NS NL=50 3.9 3.7 - 4.0 ND ND ND ND - 3.1 5.2 Vanadium (ppb) NS NL=50 3.9 3.7 - 4.0 ND ND ND ND - 3.1 5.2 4.8 - 5.6
Alkalinity (ppm) NS NS 198 62 - 227 331 322 - 335 107 63 - 130 87 81 - 99 Alkalinity (ppm) NS NS 198 62 - 227 331 322 - 335 107 63 - 130 87 81 - 99 Alkalinity (ppm) NS NS 198 62 - 227 331 322 - 335 107 63 - 130 87 81 - 99 Alkalinity (ppm) NS NS 198 62 - 227 331 322 - 335 107 63 - 130 87 81 - 99 Alkalinity (ppm) NS NS 198 62 - 227 331 322 - 335 107 63 - 130 87 81 - 99 Alkalinity (ppm) NS NS 198 62 - 227 331 322 - 335 107 63 - 130 87 81 - 99 Alkalinity (ppm) NS NS 198 62 - 227 331 322 - 335 107 63 - 130 87 81 - 99 Alkalinity (ppm) NS NS 198 62 - 227 331 322 - 335 107 63 - 130 87 81 - 99 Alkalinity (ppm) NS NS 198 62 - 227 331 322 - 335 107 63 - 130 87 81 - 99 Alkalinity (ppm) NS NS 198 62 - 227 331 322 - 335 107 63 - 130 87 81 - 99 Calcium (ppm) NS NS 80 18 - 99 118 115 - 123 57 49 - 71 28 26- 31 Calcium (ppm) NS NS 80 18 - 99 118 115 - 123 57 49 - 71 28 26- 31 Calcium (ppm) NS NS 80 18 - 99 118 115 - 123 57 49 - 71 28 26- 31 Calcium (ppm) NS NS 80 18 - 99 118 115 - 123 57 49 - 71 28 26- 31 Calcium (ppm) NS NS 80 18 - 99 118 115 - 123 57 49 - 71 28 26- 31 Calcium (ppm) NS NS 80 18 - 99 118 115 - 123 57 49 - 71 28 26- 31 Calcium (ppm) NS NS 80 18 - 99 118 115 - 123 57 49 - 71 28 26- 31 Calcium (ppm) NS NS 80 18 - 99 118 115 - 123 57 49 - 71 28 26- 31 Calcium (ppm) NS NS 80 18 - 99 118 115 - 123 57 49 - 71 28 26- 31 Calcium (ppm) NS NS 80 18 - 99 118 115 - 123 57 49 - 71 28 26- 31 Hardness (as CaCO3) (ppm) NS NS 335 76 - 412 540 537 - 544 237 84 - 300 118 86 - 130 Hardness (as CaCO3) (ppm) NS NS 335 76 - 412 540 537 - 544 237 84 - 300 118 86 - 130 Hardness (as CaCO3) (ppm) NS NS 335 76 - 412 540 537 - 544 237 84 - 300 118 86 - 130 Hardness (as CaCO3) (ppm) NS NS 335 76 - 412 540 537 - 544 237 84 - 300 118 86 - 130 Hardness (as CaCO3) (ppm) NS NS 335 76 - 412 540 537 - 544 237 84 - 300 118 86 - 130 Hardness (as CaCO3) (ppm) NS NS 335 76 - 412 540 537 - 544 237 84 - 300 118 86 - 130 Hardness (as CaCO3) (ppm) NS NS 335 76 - 412 540 537 - 544 237 84 - 300 118 86 - 130 Hardness (as CaCO3) (ppm) NS NS 335 76 - 412 540 537 - 544 237 84 - 300 118 86 - 130 Hardness (as CaCO3) (ppm) NS NS 335 76 - 412 540 537 - 544 237 84 - 300 118 86 - 130 Hardness (as CaCO3) (ppm) NS NS 335 76 - 412 540 537 - 544 237 84 - 300 118 86 - 130 Magnesium (ppm) NS NS 41 41 60 60 23 20 - 28 12 11 - 12 Magnesium (ppm) NS NS 41 41 60 60 23 20 - 28 12 11 - 12 Magnesium (ppm) NS NS 41 41 60 60 23 20 - 28 12 11 - 12 Magnesium (ppm) NS NS 41 41 60 60 23 20 - 28 12 11 - 12 Magnesium (ppm) NS NS 41 41 60 60 23 20 - 28 12 11 - 12 Magnesium (ppm) NS NS 41 41 60 60 23 20 - 28 12 11 - 12 Magnesium (ppm) NS NS 41 41 60 60 23 20 - 28 12 11 - 12 Magnesium (ppm) NS NS 41 41 60 60 23 20 - 28 12 11 - 12 Magnesium (ppm) NS NS 41 41 60 60 23 20 - 28 12 11 - 12 Magnesium (ppm) NS NS 41 41 60 60 23 20 - 28 12 11 - 12 pH (units) NS NS 8.1 7.9 - 8.3 7.0 7.0 - 7.3 7.9 7.6 - 8.6 8.2 8.1 - 8.4 pH (units) NS NS 8.1 7.9 - 8.3 7.0 7.0 - 7.3 7.9 7.6 - 8.6 8.2 8.1 - 8.4 pH (units) NS NS 8.1 7.9 - 8.3 7.0 7.0 - 7.3 7.9 7.6 - 8.6 8.2 8.1 - 8.4 pH (units) NS NS 8.1 7.9 - 8.3 7.0 7.0 - 7.3 7.9 7.6 - 8.6 8.2 8.1 - 8.4 pH (units) NS NS 8.1 7.9 - 8.3 7.0 7.0 - 7.3 7.9 7.6 - 8.6 8.2 8.1 - 8.4 pH (units) NS NS 8.1 7.9 - 8.3 7.0 7.0 - 7.3 7.9 7.6 - 8.6 8.2 8.1 - 8.4 pH (units) NS NS 8.1 7.9 - 8.3 7.0 7.0 - 7.3 7.9 7.6 - 8.6 8.2 8.1 - 8.4 pH (units) NS NS 8.1 7.9 - 8.3 7.0 7.0 - 7.3 7.9 7.6 - 8.6 8.2 8.1 - 8.4 pH (units) NS NS 8.1 7.9 - 8.3 7.0 7.0 - 7.3 7.9 7.6 - 8.6 8.2 8.1 - 8.4 Potassium (ppm) NS NS 3.4 3.4 4.0 4.0 4.2 3.8- 5.0 2.6 2.5 - 2.8 Potassium (ppm) NS NS 3.4 3.4 4.0 4.0 4.2 3.8- 5.0 2.6 2.5 - 2.8 Potassium (ppm) NS NS 3.4 3.4 4.0 4.0 4.2 3.8- 5.0 2.6 2.5 - 2.8 Potassium (ppm) NS NS 3.4 3.4 4.0 4.0 4.2 3.8- 5.0 2.6 2.5 - 2.8 Potassium (ppm) NS NS 3.4 3.4 4.0 4.0 4.2 3.8- 5.0 2.6 2.5 - 2.8 Potassium (ppm) NS NS 3.4 3.4 4.0 4.0 4.2 3.8- 5.0 2.6 2.5 - 2.8 Potassium (ppm) NS NS 3.4 3.4 4.0 4.0 4.2 3.8- 5.0 2.6 2.5 - 2.8 Potassium (ppm) NS NS 3.4 3.4 4.0 4.0 4.2 3.8- 5.0 2.6 2.5 - 2.8 Potassium (ppm) NS NS 3.4 3.4 4.0 4.0 4.2 3.8- 5.0 2.6 2.5 - 2.8 Radon (pCi/l) (e) NS NS 3 3 450 450 ND ND ND ND Radon (pCi/l) (e) NS NS 3 3 450 450 ND ND ND ND Radon (pCi/l) (e) NS NS 3 3 450 450 ND ND ND ND Radon (pCi/l) (e) NS NS 3 3 450 450 ND ND ND ND Radon (pCi/l) (e) NS NS 3 3 450 450 ND ND ND ND Radon (pCi/l) (e) NS NS 3 3 450 450 ND ND ND ND Radon (pCi/l) (e) NS NS 3 3 450 450 ND ND ND ND Radon (pCi/l) (e) NS NS 3 3 450 450 ND ND ND ND Sodium (ppm) NS NS 84 84 83 83 89 843 - 98 63 58 - 65 Sodium (ppm) NS NS 84 84 83 83 89 843 - 98 63 58 - 65 Sodium (ppm) NS NS 84 84 83 83 89 843 - 98 63 58 - 65 Sodium (ppm) NS NS 84 84 83 83 89 843 - 98 63 58 - 65 Sodium (ppm) NS NS 84 84 83 83 89 843 - 98 63 58 - 65 Sodium (ppm) NS NS 84 84 83 83 89 843 - 98 63 58 - 65 Sodium (ppm) NS NS 84 84 83 83 89 843 - 98 63 58 - 65 Sodium (ppm) NS NS 84 84 83 83 89 843 - 98 63 58 - 65 Sodium (ppm) NS NS 84 84 83 83 89 843 - 98 63 58 - 65 1, 4-Dioxane (ppb) NS NL=3 6.6 6.1 - 7.0 ND ND N/A N/A N/A N/A 1, 4-Dioxane (ppb) NS NL=3 6.6 6.1 - 7.0 ND ND N/A N/A N/A N/A 1, 4-Dioxane (ppb) NS NL=3 6.6 6.1 - 7.0 ND ND N/A N/A N/A N/A 1, 4-Dioxane (ppb) NS NL=3 6.6 6.1 - 7.0 ND ND N/A N/A N/A N/A 1, 4-Dioxane (ppb) NS NL=3 6.6 6.1 - 7.0 ND ND N/A N/A N/A N/A 1, 4-Dioxane (ppb) NS NL=3 6.6 6.1 - 7.0 ND ND N/A N/A N/A N/A 1, 4-Dioxane (ppb) NS NL=3 6.6 6.1 - 7.0 ND ND N/A N/A N/A N/A 1, 4-Dioxane (ppb) NS NL=3 6.6 6.1 - 7.0 ND ND N/A N/A N/A N/A N-Nitrosodimethylamine 3 NL=10 N/A N/A N/A N/A N/A ND - 2 N/A 4 - 7N-Nitrosodimethylamine 3 NL=10 N/A N/A N/A N/A N/A ND - 2 N/A 4 - 7N-Nitrosodimethylamine 3 NL=10 N/A N/A N/A N/A N/A ND - 2 N/A 4 - 7N-Nitrosodimethylamine 3 NL=10 N/A N/A N/A N/A N/A ND - 2 N/A 4 - 7N-Nitrosodimethylamine 3 NL=10 N/A N/A N/A N/A N/A ND - 2 N/A 4 - 7N-Nitrosodimethylamine 3 NL=10 N/A N/A N/A N/A N/A ND - 2 N/A 4 - 7N-Nitrosodimethylamine 3 NL=10 N/A N/A N/A N/A N/A ND - 2 N/A 4 - 7N-Nitrosodimethylamine 3 NL=10 N/A N/A N/A N/A N/A ND - 2 N/A 4 - 7 (NDMA) (ppt)
ADDITIONAL PARAMETERS
KEY TO ABBREVIATIONS
Secondary Drinking Water Standard = An MCL that applies to any contaminant in drinking water that adversely affects the taste, odor, or appearance of the water.
PHG = Public Health Goal or the level of a contaminant in drinking water below which there is no known or expected risk to health. PHGs are set by the California Environmental Protection Agency.
MCLG = The level of a contaminant in drinking water below which there is no known or expected risk to health. MCLGs are set by the U.S. Environmental Protection Agency.
MCL = Maximum Contaminant Level, or the highest level of a contaminant that is allowed in drinking water. Secondary MCLs are set to protect the odor, taste, and appearance of drinking water.
NL = Notifi cation Level, or the concentration of a contaminant that the California Department of Health Services has determined does not pose not a signifi cant health risk, but warrants notifi cation.
N/A = Not ApplicableNS = No StandardND = Monitored for, but Not DetectedNTU = Nephelometric Turbidity Units - used to measure cloudiness of
drinking water.ppb = parts per billion, or micrograms per liter (ug/l)ppm = parts per million, or milligrams per liter (mg/l)ppt = parts per trillion, or nanograms per liter (ng/l)umho/cm = micromhos per centimeter< = less than
(a) = Until Nov. 2010, the Arcadia well water treatment plant treated a blend of 53% well water and 47% imported surface water.
(b) = SM Well #1 is pumped into a transmission line, is blended with Imported Surface Water and enters the system at 19th St. & Idaho Ave.
(c) = We are not required to test for each parameter every year. If indicated, data is from a previous year.
(d) = MWD has developed a fl avor-profi le analysis method that can more accurately identify odor occurences.
(e) = EPA has proposed a limit of 300 pCi/l for Radon.
DatesLOCAL IMPORTED IMPORTED DatesLOCAL IMPORTED IMPORTED Sampled PHG/ State WELL WATER (a) SM WELL #1(b) SURFACE WATER SURFACE WATER Sampled PHG/ State WELL WATER (a) SM WELL #1(b) SURFACE WATER SURFACE WATER
if otherthan 2010(c)
MAJOR SOURCESLOCAL IMPORTED IMPORTED MAJOR SOURCESLOCAL IMPORTED IMPORTED IN DRINKING WATER PHG/ State WELL WATER (a) SM WELL #1(b) SURFACE WATER SURFACE WATER IN DRINKING WATER PHG/ State WELL WATER (a) SM WELL #1(b) SURFACE WATER SURFACE WATER
For additional water quality questions, contact M. Cardenas, Assistant Manager for Water Production and Treatment at 310-826-6712
MeetsLOCAL IMPORTED IMPORTED MeetsLOCAL IMPORTED IMPORTED Std PHG/ State WELL WATER (a) SM WELL #1(b) SURFACE WATER SURFACE WATER Std PHG/ State WELL WATER (a) SM WELL #1(b) SURFACE WATER SURFACE WATER

Facts about CryptosporidiumIn recent years, a microscopic organism called Cryptosporidium has been found in surface waters across the country. Cryptospo-ridium can also be transmitted through contaminated food or direct contact with human or animal waste. The organism can cause a gastrointestinal illness if ingested.
Today’s water treatment plants are capable of removing these organisms when present, but 100% elimination cannot be guaranteed. Therefore, a very slight chance of contracting the organism remains. Much research is underway to determine the best way to upgrade treatment plants to improve protection. Our supplier of surface water, MWD, maintains an aggressive program to detect and remove Cryptosporidium from the water it delivers to Santa Monica.
Cryptosporidium need not be a concern for healthy people; however, others may be more vulnerable to contaminants in drinking water. Immuno-compromised persons such as cancer patients undergoing chemotherapy, individuals who have undergone organ transplants, those with HIV/AIDS or other im-mune system disorders, some elderly and infants can particu-larly be at risk from infections. These people should seek advice about drinking water from their health care providers. USEPA/Centers for Disease Control guidelines on appropriate means to lessen the risk of infection by Cryptosporidium and other micro-bial contaminants are available from the USEPA Safe Drinking Water Hotline (800) 426-4791.
Source Water Vulnerability AssessmentsThe California Department of Public Health (DPH) completed Source Water Assessments on Santa Monica Wells #1, #3 and #4 in 2001 (a summary follows). The assessments are a require-ment for water utilities nationwide and serve to evaluate the vulnerability of all water sources used for drinking water to “possible contaminating activities“, which include a wide range of everyday activities in addition to those commonly as-sociated with contamination. For more information or to see a copy of the report, contact the Water Resources Division offi ce at (310) 826-6712.
Santa Monica Wells # 3 and #4, located mid-city, and Arcadia Wells #4 and #5, located in West L.A. and assessed in 2000, are considered most vulnerable to the following activities based on proximity and analysis of the water:
Automobile gas stationsChemical/petroleum processing/storageHistoric waste dumps/landfi llsKnown contamination plumesLandfi lls/dumpsAutomobile repair shopsFleet/truck/bus terminalsUtility station maintenance areasMachine shopsAutomobile body shopsHardware/lumber/parts storesParksApartments and condominiumsOffi ce buildings and complexesSchools
Santa Monica Well #1, located on the north side, Wells #3 and #4 and the Arcadia Wells are considered most vulnerable by their proximity to sewer collection systems, although analyses have detected no related contamination.

Answers to the Most Commonly Asked Questions About Your Tap Water
What Affects the Taste of My Water?The taste of drinking water is affected by its mineral content as well as the presence of chlorine, which is used to protect against potential bacterial contamination. Sometimes plumbing can cause a metallic fl avor, especially if the wa-ter has been sitting in the pipes for many hours. Taste, however, does not necessarily indicate a higher or lower degree of water quality.
How Does My Plumbing Affect the Quality of My Water?Plumbing is unlikely to degrade the quality of your water. If your plumbing is old, you may see a discoloration for a few moments after turning on your tap. This is caused by corrosion of iron or copper pipes, depending on your plumbing, and is generally not considered harmful. More serious pipe corrosion will be evident as leaks and breaks start to occur.
Why Do I Sometimes See Black, Greasy Particles in My Tub or Sink?The soot-like particles usually come from black rubber gaskets and/or linings of certain fl exible hoses used to connect appliances to a home’s water supply. As the rubber ages, it starts to break down and small pieces can break off in a fast fl ow, as when a tub faucet is opened all the way. The most common location to fi nd a degrading hose is on the outlet of the water heater.
What about Lead from My Plumbing?If your home plumbing contains lead, it could possibly leach into your water as a result of corrosion. Fortunately, the minerals in our water help to protect against pipe corrosion, greatly reducing the potential of lead entering the water. These minerals form a fi lm called “scale” that prevents water from coming into direct contact with home plumbing.
If present however, elevated levels of lead can cause serious health problems, especially for pregnant women and young children. Lead in drinking water is primarily from materials and components associated with service lines and home plumbing. The City of Santa Monica Water Resources Division is responsible for providing high quality drinking water, but cannot control the variety of materials used in plumbing components. When your water has been sitting for several hours, you can minimize the potential for lead exposure by fl ushing your tap for 30 seconds to 2 minutes before using water for drinking or cooking. If you are concerned about lead in your water, you may wish to have your water tested. Information on lead in drinking water, testing methods, and steps you can take to minimize exposure is available from the EPA Safe Drinking Water Hotline at (800) 426-4791 or at www.epa.gov/safewater/lead.

What is Chromium 6 And should I be Concerned?Hexavalent chromium also known as Chromium 6, has been in the news lately following a report late last year that it was detected in the drinking water of 31 cities across the country. Recently the California EPA proposed a Public Health Goal (PHG) of 0.02 ppb for Chromium 6. The new PHG for Chro-mium 6 will serve as guidance for the California Department of Public Health in developing the nation’s fi rst drinking water standard specifi cally for Chromium 6 in the future.
Although Chromium 6 is found in industrial processes, it also occurs naturally in groundwater. For the past decade, the Water Quality staff has been monitoring the naturally-occurring levels of Chromium 6 in the city’s groundwater wells. Addition-ally, City staff is tracking the development of a drinking water standard for Chromium 6 closely and will expand their current monitoring program to include testing of our treated water per recent recommendations from EPA.
For now, customers should be aware that California already has a limit for Total Chromium in drinking water of 50 ppb. All of the water sources for Santa Monica fall below this limit. Further, the city’s new Reverse Osmosis facilities are already providing added protection by reducing the level of natural-occurring Chromium 6 from our ground water. For now, customers should not be overly concerned.
Do I Really Need to Buy a Water Filter or Home Treatment System?The decision to buy a water fi lter or home treatment system is a matter of personal preference. Our water meets or exceeds rigid state and federal health standards. If you decide to buy a fi lter or system, be a smart shopper and do some homework. Any treatment device you buy should be registered with the National Sanitation Foundation (NSF). There are several system types designed to do different things. Information on treatment systems can be obtained at www.ConsumerReports.org,or from NSF.
Also consider the impact a home treatment system will have on the environment. Home Reverse Osmosis (RO) systems waste at least two gallons of water for every gallon they process. Water softeners that use salt release high levels of salt into wastewater treatment facilities and may render the water less desirable for recycling and reuse.
What about Bottled Water?Again, the decision is yours. To improve the taste of your tap water, you may fi nd that keeping a pitcher in your refrigerator is a low-cost, water-thrifty alternative to buying more expensive bottled water and is better for the environment. Even when the bottle is reused or recycled, the petrochemicals used in creating the bottle and the transportation of the water has a signifi cant impact on the environment — and your wallet.
Contact NSF toll free at (877) 867-3435or visit www.nsf.org

Water-Self Suffi ciency GoalCurrently, the city uses an average of 12 million gallons a day, but can only produce 8.5 million gallons a day. The additional water needed is purchased and delivered from Northern California or the Colorado River. The City Council has set a goal of water self-suffi ciency by 2020. In order to close this gap between demand and production, we need to save water. Here are some simple ways you can conserve water and comply with Santa Monica’s conservation regulations:
• Only use sprinklers before 10 am and after 4 pm any day of the week. Adjust your sprinkler controller each season. Go to www.lacoastalgardens.com to fi nd out how much water your garden needs and when to water. Even better, convert sprinklers to a drip irrigation system, install a rain barrel, or invest in sustainable landscaping. Rebates and grants up to $5,000 may be available!
• Don’t allow irrigation water to overspray or runoff your property and never use a hose or a leaf blower to clean driveways, sidewalks, patios, streets, or alleys.
• Replace old toilets, showerheads, and clothes washers with high-effi ciency models and repair all leaking fi xtures on your property.
• Turn off water when brushing teeth or shaving and only wash full loads of laundry.
To learn more on reducing your water use visit www.sustainablesm.org
or call (310) 458-8972.
Where Can I Get More Information?City of Santa Monica Water Utility Offi ces:
Water Quality ................................................... Water Quality ................................................... Water Quality (310) 826-6712 24 hr Water Emergencies ................................(310) 826-6712 Water Conservation ..........................................(310) 458-8972 Billing Offi ce ....................................................(310) 458-8224
Visit our website:
http://waterquality.smgov.net
Santa Monica City Council Meetings:2nd & 4th Tuesdays of each monthCouncil Chamber1685 Main Street, Santa Monica
http://www.smgov.net/cityclerk/council
Metropolitan Water District of Southern California(213) 217-6850
www.mwdh2o.com
California Department of Health ServicesDivision of Drinking Water and Environmental Management(213) 580-5723
www.cdph.ca.gov/certlic/drinkingwater
U.S. Environmental Protection Agency Offi ce of Ground Water & Drinking Water(800) 426-4791 - Safe Drinking Water Hotline
www.epa.gov/safewater/dwhealth.htmlwww.epa.gov/safewater/faq/faq.html
This brochure is printed w
ith vegetable-based inks on paper m
ade from
recycled paper.
PR
SR
T S
TD
U.S
. PO
STA
GE
PA
IDP
ermit N
o. 222
San
ta Mo
nica, C
A
CIT
Y O
F S
AN
TA
MO
NIC
AC
ITY
OF S
AN
TA
MO
NIC
AD
EPA
RT
ME
NT
OF P
UB
LIC
WO
RK
SD
EPA
RT
ME
NT
OF P
UB
LIC
WO
RK
SW
ATER
DIV
ISIO
NW
ATER
DIV
ISIO
NP.O
. Box 2
20
0P.O
. Box 2
20
01685 M
ain
Stre
et
1685 M
ain
Stre
et
Santa
Mo
nic
a, C
A 9
04
06
-22
00
Santa
Mo
nic
a, C
A 9
04
06
-22
00