
ción del capital humano al valor de un Resumen
28
Galeras de Administración Facultad de Administración Universidad de los Andes Management Galleys Abril de 2014 39 A quantitative model of the human capital contribution to the value of a project Rafael Batutista, profesor asociado, Facultad de Administración, Universidad de los Andes Un modelo cuantitativo de la contribución del capital humano al valor de un proyecto
Transcript of ción del capital humano al valor de un Resumen
Galeras de Administración
Facultad de AdministraciónUniversidad de los Andes
Management Galleys
Ab
ril d
e 20
14
39
A quantitative modelof the human capitalcontribution to the value of a project
39 A quantitative modelof the human capitalcontribution to the value of a project
Rafael Batutista, profesor asociado,Facultad de Administración, Universidad de los Andes
Rafael Bautista, Profesor asociado,Facultad de Administración, Universidad de los Andes
Un modelo cuantitativo de la contribución del capital humano al valor de un proyecto
Un modelo cuantitativo de la contribución del capital humano al valor de un proyecto
Este artículo propone una manera de construir un marco conceptual para evaluar la contribución económica debida al capital humano en proyectos reales. El punto de partida es el rechazo del supuesto del capital humano como un bien sustituible, supuesto que se encuentra insertado en prácticamente todos los tratamientos del tema. Una vez que el equipo gerencia ya ha escalado una curva inicial de aprendizaje, esa experiencia se traduce en un conjunto bien definido de destrezas y de conocimientos "cocinados en casa" que no son transferibles mediante un mecanismo de mercado y que son la base de una posible ventaja competitiva permanente durante la vida del proyecto. En este modelo, la especificidad de ese conocimiento "desarrollado en casa" queda codificada por medio de los parámetros de una función que representa las posibles respuestas del equipo gerencial frente al reto de coordinar los requerimientos de aspiraciones de ingresos que haga la administración central con las condiciones percibidas del mercado. La manera en la cual el valor presente neto del proyecto dependa de los parámetros reflejará el peso que tiene la contribución del capital humano. Esta aproximación al problema pone de manifiesto que la contribución del capital humano no sigue reglas aditivas simples, y que la noción de valor agregado proviene principalmente de la comparación entre los desempeños del equipo de gerencia del proyecto y los de sus competidores.
This paper proposes a conceptual frame for assessing the economic contribution attributable to the human capital in a project in the product market. The starting point is the rejection of the assumption of human capital as commodity, which is implicit in nearly all discussions about the economic value of a project in the product market. Once the management team has already climbed a particular learning curve, this experience translates into a well-defined assembly of skills and know-how "honed in house" that are not marketable and that become the basis of sustained competitive advantage during the life of the project. In this model, the specificity of the in-house developed knowledge is encoded by the parameters of a function that represents the responses of the team to aspiration levels proposed by central management, vis-à-vis its perceptions of market conditions. How the net present value of the project depends on those parameters reflects the weight of the human capital. This approach reveals that the contribution of the human capital component to the value of a project does not follow any simple additive rule, and that the notion of added value comes mainly from comparing the team's performance with that of competing management teams.

Bogotá, Abril de 2014
AdministraciónGaleras de
The relationship between perceptions of insecurity, social capital and subjective well-being: Empirical evidences from conflicted rural Colombia. La relación entre las percepciones sobre inseguridad, capital social y el bienestar subjetivo: Evidencias empíricas de la zona rural colombiana en conflicto. Eduardo Wills H., profesor asociado, Facultad de Administración, Universidad de los Andes; Luz E. Orozco C., profesora asistente, Facultad de Administración, Universidad de los Andes; Clemente Forero P., profesor titular, Facultad de Administración, Universidad de los Andes; Oscar Pardo A., profesor asistente, Facultad de Administración, Universidad de los Andes; Veneta Andonova Z., profesora asociada, Facultad de Administración, Universidad de los Andes. Marzo de 2009.
26
Business Networks and Innovation in SMEs of a Developing Country. Redes empresariales para la innovación en PYMEs de un país en desarrollo. Clemente Forero Pineda, profesor titular, Facultad de Administración, Universidad de los Andes; Sandra Corredor Waldron, asistente graduada, Facultad de Administración, Universidad de los Andes; Nohora Forero Ramírez, asistente de investigación, Facultad de Administración, Universidad de los Andes. Marzo de 2010.
27
Javier Yáñez ArenasDecano
Henry Gómez Samper, director
Germán Andrade Pérez
Camilo Dávila L. de Guevara
Ezequiel Reficco
Juan Pablo Soto
Piedad Salgado Camacho
Calle 21 No. 1 - 20 Ed. SD P. 7
Teléfono (571) 332 4555
Fax (571) 332 4551
Bogotá, Colombia
Internet-Based Corporate Disclosure and Market Value: Evidence from Latin America Divulgación de información corporativa basada en Internet: Evidencia de Latinoamérica. Urbi Garay, profesor titular, Centro de Finanzas, IESA; Maximiliano González, profesor asociado, Facultad de Administración, Universidad de los Andes. Octubre de 2010.
28
Dividend policy and ownership structure in Latin America. Política de dividendos y estructura de propiedad en Latinoamérica. Maximiliano González, profesor asociado, Facultad de Administración, Universidad de los Andes; Carlos Molina, profesor, área de finanzas, IESA; Eduardo Pablo, profesor, Universidad de Tulane y del IESA. Noviembre de 2010.
29
Violence, insecurity and hybrid organizational forms: A study in conflict-ridden zones in Colombia. Violencia, inseguridad y formas organizativas híbridas: un estudio en las zonas en conflicto en Colombia. Clemente Forero-Pineda, profesor titular, Facultad de Administración, Universidad de los Andes; Eduardo Wills, Herrera profesor asociado, Facultad de Administración, Universidad de los Andes; Veneta Andonova Zuleta, profesora asociada, Facultad de Administración, Universidad de los Andes; Luz Elena Orozco Collazos, profesora asistente, Facultad de Administración, Universidad de los Andes; Oscar Pardo Aragón, profesor asistente, Facultad de Administración, Universidad de los Andes. Abril de 2010.
30
Contratos de Estabilidad Jurídica en Colombia (CEJ): ¿información asimétrica, inconsistencia intertemporal o captura de la autoridad tributaria? Contracts for Legal Stability in Colombia: asymmetric information, inter temporal inconsistency or capture of the tax authority? Francisco Azuero , profesor asociado, Facultad de Administración, Universidad de los Andes; Alexander Guzmán, estudiante de Doctorado en Administración, Facultad de Administración, Universidad de los Andes. Profesor asociado, Colegio de Estudios Superiores de Administración (CESA; María Andrea Trujillo, estudiante de Doctorado en Administración, Facultad de Administración, Universidad de los Andes. Profesora asociada, Colegio de Estudios Superiores de Administración (CESA). Diciembre de 2010.
31
Family Firms and Financial Performance: The Cost of Growing. Empresas familiares y desempeño financiero: el costo del crecimiento. Maximiliano González, profesor asociado, Facultad de Administración, Universidad de los Andes; e , Facultad de Alexander Guzmán, studiante de Doctorado en AdministraciónAdministración, Universidad de los Andes a ); Carlos Pombo, profesor asociado, Facultad . Profesor sociado, Colegio de Estudios Superiores de Administración (CESAde Administración, Universidad de los Andes; e , Facultad de Administración, Universidad de los María Andrea Trujillo, studiante de Doctorado en AdministraciónAndes. a a a . Agosto 1.Profesor sociad , Colegio de Estudios Superiores de Administración (CESA) de 201
32
Family firms and debt: Risk aversion versus risk of losing control. Empresas familiares y deuda: tensión entre aversión al riesgo y el riesgo de perder el control. Maximiliano González profesor asociado, Facultad de Administración, Universidad de los Andes; e , , Alexander Guzmán, studiante de Doctorado en AdministraciónFacultad de Administración, Universidad de los Andes a ); Carlos Pombo, profesor . Profesor sociado, Colegio de Estudios Superiores de Administración (CESAasociado, Facultad de Administración, Universidad de los Andes; e , Facultad de Administración, María Andrea Trujillo, studiante de Doctorado en AdministraciónUniversidad de los Andes. a a a . Agosto 1Profesor sociad , Colegio de Estudios Superiores de Administración (CESA) de 201 .
33
Family Involvement and Dividend Policy in Listed and Non-Listed Firms. Involucramiento familiar y política de dividendos en empresas listadas y no listadas. Maximiliano González, profesor asociado, Facultad de Administración, Universidad de los Andes; Alexander Guzmán, estudiante de Doctorado en Administración, Facultad de Administración, Universidad de los Andes. Profesor asociado, Colegio de Estudios Superiores de Administración (CESA); Carlos Pombo, profesor asociado, Facultad de Administración, Universidad de los Andes; María Andrea Trujillo, estudiante de Doctorado en Administración, Facultad de Administración, Universidad de los Andes. Profesora asociada, Colegio de Estudios Superiores de Administración (CESA). Agosto de 2012.
34
Market Segmentation: Venezuelan ADRs. Segmentación de Mercado. Urbi Garay profesor titular, Instituto de Estudios Superiores de administración (IESA), , profesor visitante, Facultad de Administración, Universidad de los Andes; Maximiliano González profesor asociado, Facultad de Administración, Universidad de , los Andes. Agosto de 2012.
35
Cultural Distance and its Effect on Cross-Border Entry Mode: Latin American Evidence. Distancia cultural y su efecto en el modo de entrada en negocios transfronterizos. Eduardo Pablo, Assistant Professor, Minnesota State University Moorhead; Urbi Garay, profesor titular, Centro de Finanzas, Instituto de Estudios Superiores de Administración, Iesa; Maximiliano González, profesor asociado, Facultad de Administración, Universidad de los Andes. Octubre de 2013.
36
Corporate Governance Mechanisms in Family Firms: Evidence from CEO Turnovers Mecanismos de gobierno corporativo en empresas familiares. Evidencia de la . rotación de gerentes de empresas Maximiliano González, School of Management, Universidad de los Andes; Alexander Guzmán, CESA School of Business, . Bogotá, Colombia and School of Management, Universidad de los Andes; Carlos Pombo, School of Management, Universidad de los Andes; María Andrea Trujillo, CESA School of Business, Bogotá, Colombia and School of Management, Universidad de los Andes. Diciembre de 2013.
37
The Cost of Equity in Emerging Markets: The Case of Latin America El costo de capital en países emergentes: el caso de Latimoamérica. Urbi Garay, profesor titular, . Centro de Finanzas, Instituto de Estudios Superiores de Administración, Iesa. Maximiliano González, profesor asociado, Facultad de Administración, Universidad de los Andes. John Rosso, estudiante de Doctorado (Finanzas), Facultad de Administración, Universidad de los Andes. Profesor asistente, Universidad Pedagógica y Tecnológica de Colombia, UPTC. Febrero de 2014.
38

1
Un modelo cuantitativo de la contribu-ción del capital humano al valor de un proyecto
A quantitative model of the human capital contribution to the value of a project
Rafael Bautista
Abstract
This paper proposes a conceptual frame for assessing the economic contribution attributable to the human capital in a project in the product market. The start-ing point is the rejection of the assumption of human capital as commodity, which is implicit in nearly all discussions about the economic value of a project in the product market. Once the management team has already climbed a particular learning curve, this expe-rience translates into a well-defined assembly of skills and know-how “honed in house” that are not market-able and that become the basis of sustained competitive advantage during the life of the project. In this model, the specificity of the in-house developed knowledge is encoded by the parameters of a function that represents the responses of the team to aspiration levels proposed by central management, vis-à-vis its perceptions of market conditions. How the net present value of the project depends on those parameters reflects the weight of the human capital. This approach reveals that the contribution of the human capital component to the value of a project does not follow any simple additive rule, and that the notion of added value comes mainly from comparing the team’s performance with that of competing management teams.
JEL Classifications: D21, D24, D29, D70, D81
KeywordsHuman Capital, Response function, Market-based view, Resource-based view
Resumen
Este artículo propone una manera de construir un mar-co conceptual para evaluar la contribución económica debida al capital humano en proyectos reales. El punto de partida es el rechazo del supuesto del capital huma-no como un bien sustituible, supuesto que se encuentra insertado en prácticamente todos los tratamientos del tema. Una vez que el equipo gerencia ya ha escalado una curva inicial de aprendizaje, esa experiencia se traduce en un conjunto bien definido de destrezas y de conocimientos “cocinados en casa” que no son transferibles mediante un mecanismo de mercado y que son la base de una posible ventaja competitiva per-manente durante la vida del proyecto. En este modelo, la especificidad de ese conocimiento “desarrollado en casa” queda codificada por medio de los parámetros de una función que representa las posibles respuestas del equipo gerencial frente al reto de coordinar los re-querimientos de aspiraciones de ingresos que haga la administración central con las condiciones percibidas del mercado. La manera en la cual el valor presente neto del proyecto dependa de los parámetros reflejará el peso que tiene la contribución del capital humano. Esta aproximación al problema pone de manifiesto que la contribución del capital humano no sigue reglas aditivas simples, y que la noción de valor agregado proviene principalmente de la comparación entre los desempeños del equipo de gerencia del proyecto y los de sus competidores.
Clasificaciones JEL: D21, D24, D29, D70, D81
Palabras ClaveCapital Humano, Función de respuesta, Enfoque ba-sado en recursos, Enfoque basado en el mercado.

2 A quantitative model of the human capital ...
Introduction
1. This is also the starting point of much of the critique from the real options literature.
In the usual treatment of the subject of capital budget-ing, both in textbooks and in academic discussions, there is the almost universally made assumption that, somehow, the cash flows that represent the future expectations about the project emerge from a series of prescribed actions that seem to be uniquely deter-mined, once the machinery of project execution is set in motion.1 The series of cash flows to be evaluated would seem to be the result of objective procedures, universally recognized to lead to a predetermined solution. One reason why this convention is rarely acknowledged is because the theory of capital bud-geting implicitly assumes the perfect substitutability of human assets. This “substitutability assumption” is concise terminology to express the belief that, under certain conditions of partial equilibrium in the labor market, one managerial team may be substituted at negligible cost for another; therefore, any other team endowed with purely marketable skills will work seamlessly to keep the same business performance go-ing. This basic assumption usually goes unmentioned because it is a part of the ancillary concepts attached to the hypothesis of efficient markets. Following the conventional economic thought, without the sub-stitutability assumption, it would be very difficult to sell a project to outside investors (Rajan 2012). The consequence of this practice is then to erase the significance of the human team at work behind the project when strategic considerations reach the stage of capital budgeting decisions.
To proceed with the stated purpose of constructing a quantitative model of the value of human resources, it is useful to briefly explore the consequences of reject-ing that assumption. The theoretical discussions that treat the human resources as human capital often take place within the frame of the resource-based view (RBV) of the firm (Barney 1991). In this approach, the background of knowledge structure created by a team within the context of a firm is assumed to be highly non tradable (Peteraf 1993). This condition should be
a prerequisite for the identification of human resources as human capital (HC) (Barney and Wright 1997). Categorizing the coordinated actions of human beings as “capital” is tantamount to formally place them within the process of value creation. This notion of human capital mainly refers to the way human intellect assem-bles knowledge that leads to practical consequences. The non-tradability of this assembled knowledge is one clue to why some firms may achieve sustained competitive advantage over others. Once assembled, the structure comprised by a specific knowledge plus a group of people, who built it and set it into action, constitutes a whole that goes beyond the fact that there is no obvious way to price it. Its uniqueness implies that once installed as an operating unit, if successful, it cannot be easily replicated. One of the aims of this investigation is to provide a story on how this diffe-rentiation may adopt a quantitative expression, starting from first principles.
The proposed quantitative model is intended to serve as a frame to discuss the way in which the response to the market environment by the management team affects the firm’s competitiveness and its ultimate value. Hopefully, this may be a useful approach, complementary to more qualitative treatments. To attain this purpose, the procedure to be followed will be to restrict the discussion to a specific context: the reinvestment decision process in an ongoing project set in the product market. The choice of this particular context allows for the easy formation of the intuitions that underlie the theoretical model. Suppose that a group of coworkers in a new project are deciding how to organize themselves to best interpret the rather noisy signals they are able to detect from a given market environment. This group is in the process of constituting a well-functioning managerial team, which intends to grow into a source of sustained competitive advantage. Once the fundamentals of team building, such as individual competence, mutual trust in communication and action, commitment and

3
a common language,2 are up to the task, their main concern is how to produce a response to the market signals. To complete this process, they agree on how to best distribute specific responsibilities and which decisions are critical enough as to require some form of consensus. The types of decisions that will be of importance are two: The team must choose a sales goal for the period and must decide how much to reinvest from the previous period’s earnings. In every period, by choosing those two quantities, they at-tempt to respond to imperfect signals by way of their firm-designed process of decision making, which they believe captures what those signals convey as the right message. A consistently good interpretation of the message will lead to a sustained competitive advan-tage. This situation gathers the essential elements of the resource based view of human capital around the idea that the main purpose of the team is to interpret market signals and produce an adequate response by way of the production decision.
The revenues of the firm are made possible by a rather complex assembly of assets in place. This assembly comprises a long list of components that range from fixed assets to “soft” assets that go from software proper to written procedures and protocols to intangibles such as the constructed capabilities and efficient workings of the human team. The role of each category of assets may vary from the overall support of operations, down to the very specific. Nevertheless, one gross distinction that can be made is between those assets that endow the firm with the capacity to exact a predetermined top level of revenues, given its cost characteristics, and those that, through an adequate internal array, enable the firm to achieve the maximum allowed by the first class. In the scale of more ordinary human endeavors, the relation human-machine provides a useful example. In an Indy 500 race, for instance, it is clear that the mechanical characteristics of the machine establish both its pos-sibilities and its limits. The pilot is also endowed with his own set of powers and limitations: general state of health, reflexes, self-control, neural coupling with the mechanical characteristics of the vehicle, level of stress, instincts and intelligence to make quick decisions, etc. The degree of success on the racetrack, in the struggle
to beat opponents, depends critically on the quality of the interaction between the characteristics of pilot and those of the machine. The process of training and learn-ing provides the basis to develop an optimal coupling between these two components, which most interact with their specific, uncertain environment. Each in the succession of actions the driver undertakes, from one moment to the next, may be characterized by the probability that he will continue in the race.
Throughout most of the paper, the focus will be on how to model the interaction between the managerial team and the market environment, viewed through the lens of their production decisions. From this analysis, a quantitative expression for the effects of the mana-gement team over the entire project will be derived. The result of this approximation to the problem posed by the appropriate representation of the value of the human capital is a scheme where the production deci-sions translate into probabilities of fulfilling the team’s sales aspirations, with the probabilities parameterized by quantities that represent the result of the team’s best efforts at interpreting the market signals in each period of the project. Those parameters draw their meaning from the set of activities that may reasonably be expected to influence the probability of attaining a sales goal for a given period.
The rest of the paper is structured as follows: in Section 2 there is a description of the context and some of the main elements of the problem. Section 3 focuses on the principle that all efforts by the human resources of a firm converge first into the single goal of maximizing the probability that targets will be met, given the particular operating constraints. This idea is embodied in the con-cept of the response function. Section 4 develops the model that leads to an expression for the value added by the human resources. Section 5 illustrates – and extends – through a specific example the main features of the model. Section 6 discusses some possible avenues by which the theory may be brought in contact with empirical tests. Section 7 offers conclusions and some further considerations for future research.
2. Much of the work to get to an appropriate mix comes from the human resources management function. In the model to be discussed, this function is not distinguished from other components of what will be defined as a “management team”. This non-separation assumes that both explanations for the appropriation of rents, the “resource-picking” and the “capability-building” (Makadok 2001), are seamlessly integrated in the competitive mechanism of the team. The general spirit of this unification is to emphasize the workings of the human resource in the sense described by Wright, McMahan and McWilliams (1994).
4 A quantitative model of the human capital ...
An overview of the problem
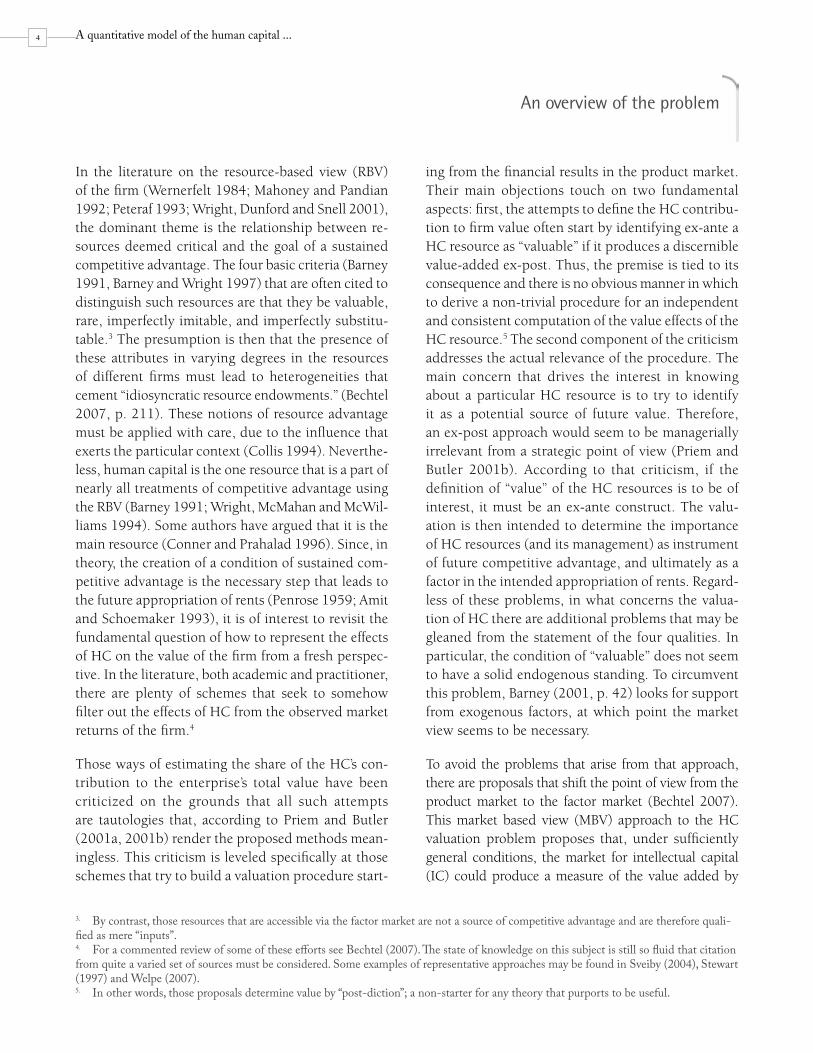
In the literature on the resource-based view (RBV) of the firm (Wernerfelt 1984; Mahoney and Pandian 1992; Peteraf 1993; Wright, Dunford and Snell 2001), the dominant theme is the relationship between re-sources deemed critical and the goal of a sustained competitive advantage. The four basic criteria (Barney 1991, Barney and Wright 1997) that are often cited to distinguish such resources are that they be valuable, rare, imperfectly imitable, and imperfectly substitu-table.3 The presumption is then that the presence of these attributes in varying degrees in the resources of different firms must lead to heterogeneities that cement “idiosyncratic resource endowments.” (Bechtel 2007, p. 211). These notions of resource advantage must be applied with care, due to the influence that exerts the particular context (Collis 1994). Neverthe-less, human capital is the one resource that is a part of nearly all treatments of competitive advantage using the RBV (Barney 1991; Wright, McMahan and McWil-liams 1994). Some authors have argued that it is the main resource (Conner and Prahalad 1996). Since, in theory, the creation of a condition of sustained com-petitive advantage is the necessary step that leads to the future appropriation of rents (Penrose 1959; Amit and Schoemaker 1993), it is of interest to revisit the fundamental question of how to represent the effects of HC on the value of the firm from a fresh perspec-tive. In the literature, both academic and practitioner, there are plenty of schemes that seek to somehow filter out the effects of HC from the observed market returns of the firm.4
Those ways of estimating the share of the HC’s con-tribution to the enterprise’s total value have been criticized on the grounds that all such attempts are tautologies that, according to Priem and Butler (2001a, 2001b) render the proposed methods mean-ingless. This criticism is leveled specifically at those schemes that try to build a valuation procedure start-
ing from the financial results in the product market. Their main objections touch on two fundamental aspects: first, the attempts to define the HC contribu-tion to firm value often start by identifying ex-ante a HC resource as “valuable” if it produces a discernible value-added ex-post. Thus, the premise is tied to its consequence and there is no obvious manner in which to derive a non-trivial procedure for an independent and consistent computation of the value effects of the HC resource.5 The second component of the criticism addresses the actual relevance of the procedure. The main concern that drives the interest in knowing about a particular HC resource is to try to identify it as a potential source of future value. Therefore, an ex-post approach would seem to be managerially irrelevant from a strategic point of view (Priem and Butler 2001b). According to that criticism, if the definition of “value” of the HC resources is to be of interest, it must be an ex-ante construct. The valu-ation is then intended to determine the importance of HC resources (and its management) as instrument of future competitive advantage, and ultimately as a factor in the intended appropriation of rents. Regard-less of these problems, in what concerns the valua-tion of HC there are additional problems that may be gleaned from the statement of the four qualities. In particular, the condition of “valuable” does not seem to have a solid endogenous standing. To circumvent this problem, Barney (2001, p. 42) looks for support from exogenous factors, at which point the market view seems to be necessary.
To avoid the problems that arise from that approach, there are proposals that shift the point of view from the product market to the factor market (Bechtel 2007). This market based view (MBV) approach to the HC valuation problem proposes that, under sufficiently general conditions, the market for intellectual capital (IC) could produce a measure of the value added by
3. By contrast, those resources that are accessible via the factor market are not a source of competitive advantage and are therefore quali-fied as mere “inputs”.4. For a commented review of some of these efforts see Bechtel (2007). The state of knowledge on this subject is still so fluid that citation from quite a varied set of sources must be considered. Some examples of representative approaches may be found in Sveiby (2004), Stewart (1997) and Welpe (2007).5. In other words, those proposals determine value by “post-diction”; a non-starter for any theory that purports to be useful.

5
6. See discussions in Peteraf and Bergen (2003) and Lengnick-Hall and Lengnick-Hall (2003).
the HC resources.6 The assumption behind that belief is that market mechanisms permeate all corners of the firm and therefore market opportunities are the sole driver of the firm’s internal activity. This approach seems like a logically consistent solution to the problems associated with the use of ex-post results from the product market. Nevertheless, there is at the basis of this proposal the close identification of the price of the resource with its actual value. This problem is more than just rhetorical, since it is not obvious that the pricing of the separate human capabilities in the factor market, as a mere aggre-gate, will in general correlate too well with the potential value added to the firm, once the hired personnel has transformed into a well-functioning HC team. The only way in which the factor price would equate the value created is if the individual members of the team could somehow capture all the rents. Since this seems to be one particular instance, in what follows it will be ignored. In this paper the HC team, as unit of analysis, is then treated as a non-tradable, highly idiosyncratic asset, as it is postulated in the RBV.
Perhaps the most important characteristic that de-fines “human capital” is its coordinated capacity to translate a given collection of experiences into a set of normative actions – from now on simply termed a “response” – that is meant to cope with an uncertain environment, in an attempt to create value. The under-lying process of decision-making that underpins the emergence of a response is in principle well-adjusted to the way the working team frames the shared ex-periences. At go through a process of learning about their internal resources, the external challenges, and the interactions among the two, in a way that it may articulate a set of restrictions and rules of thumb into a coherent process of decision making, over which team members reach some consensus, to be likely to produce desirable results. That is, they agree on some
prescribed actions that will enhance the probabilities of achieving results that meet the goals of the firm for the period. To develop shared intuitions and specific knowledge on what sort of actions are most likely to produce desirable outcomes, the team’s learning pro-cess consists of identifying those production factors whose control is most likely to increase the probability of success. Such learning process in no way resembles a sort of algorithm or “method”, with predetermined steps that would take any team to the same final set of decision rules, which must be applied without room for nuances. Instead, the contextual elements proper of the particular firm produce a specific learning his-tory that leads to a particular response. This manner of differentiation may come about in many ways. There is for instance the explanation based on the idea of causal ambiguity (Lippman and Rumelt 1982; Reed and Fillippi 1990; Mosakowski 1997), where proper care should be taken to specify the formal meaning of the term (Ryall 2009). Causal ambiguity creates his-tories that are irreproducible, often even to the same team; therefore, the resulting structured responses that emerge from such histories become unique assets, and the field of non-colluding competitors will grow heterogeneous responses.
The resulting heterogeneity of responses across the spectrum of competing firms will lead to temporary competitive advantages accruing to those that come up with better responses. In this sense, the essence of value in human resource management stems from the intellectual and operational capabilities of the team. The thesis proposed here is that the strategic relevance of the human resource resides in its degree of success in structuring the response, as defined by the probability of achieving the organization’s strategic goals for the duration of the project.

6 A quantitative model of the human capital ...
Building a response function
The response function embodies the principle that all the firm’s efforts in an uncertain environment are ori-ented toward the maximization of its expected income at every period during the life of a project. The response function is a proxy for the probability of meeting management-called targets, which must be maximized subject to the constraint of non-negative marginal income. The response function is also a design, in the sense explained below, for the decision-making process that the firm undertakes period after period under conditions of uncertain markets. This design follows after the firm has already made a choice of project in the product market, as a result of its strategic decisions. The choice of project will lead to the firm’s entering a particular market environment with uncertainties that are not amenable to precise quantification. In very ge-neral terms, those uncertainties are described by a set of lotteries that are imperfectly known. These lotteries are over the set {x} of all possible revenues that are feasible given the constraints of the firm; participation in any particular lottery is affected by the limitations imposed by firm production capacity. And – most important – the way the management team chooses one particular lottery as its best belief is by choosing a reinvestment k for the period. Thus, from the point of view of the team, these lotteries are labeled by k.
The project, chosen because of strategic considerations, requires an initial investment I with which the inves-tors buy a definite top production capacity M.7 In each period a management team assesses the market condi-tions. The initial learning process, during which the team adjusts its inner workings, has been completed very shortly after the start of the project. This learning process plays nevertheless a fundamental role in under-standing the uniqueness of the team’s created intangible human asset. This managerial team has improved its understanding of the way its decisions interact with the market environment well enough to allow the firm to stay in competition within the target market. As it is
explained in more detail in this section, the main as-sumption to be made about a well-trained team is that it has developed a rational approach to the relationship between the placement of reinvestment bets and the odds of satisfying the firm’s goals for the period.
One of the important problems faced by decision makers trying to run a profitable project is the pre-sence of irreducible, essential uncertainties (Penrose 1959). Essential uncertainties are of the kind that no amount of information will further knowledge about the set of possible outcomes, or will yield additional improvement to the imperfect knowledge about their probabilities (Lo and Muller 2010). Under those con-ditions, procedures that cling to textbook notions of rationality cannot attain a unique optimal solution that may be readily put in practice. One way in which human beings deal with states that contain irreducible uncertainties is by searching for “satisficing” solutions, rather than trying to optimize responses in the absence of perfect information (Simon 1955). The response function addresses the need for the firm to deal with its uncertain environment through a normative deci-sional scheme. The specific scheme to be developed has the management team to act in two steps. First, management provides an aspiration level, i.e., a target A, for the revenue to be attained for the period. Second, given the stated target, the team chooses the amount of reinvestment k that will maximize the expected income for the period. This last step presumes the existence “out there” of a cumulative probability distribution F(x) with which to compute the expected revenues. Given the restrictions in fully characterizing this function, the response function - denoted φ(k) - is an attempt to build a normatively consistent decision process inside the firm that captures some of the essential aspects of the interaction between the firm and the market.
The way to visualize the meaning of the response func-tion is positing that the best it can do is to concoct some
7. This number is a consequence of the strategic choice and of the initial act of investment. It obviously depends on how the production technology is initially assembled, but it clearly does not depend on how the future team-to-be structures its decision-making process.

7
subjective probability distribution for the revenues as-sociated to a given decision. Assuming the least about the lottery, management only reckons its two extreme
outcomes, A and 0, while φ(k) represents the expected utility of the chosen lottery. The diagram shows the structure of the lottery:
Figure 2.1. Basic representation of the meaning of the sponse function.
For this reduced lottery, it has been shown (see the proof sketched in Abbas and Matheson 2005) that, when use is made of a utility function of certain out-come normalized between zero and one, the expected utility of the full lottery is also the probability of the higher outcome. Therefore, φ(kA) also stands for the probability of meeting the target, if the choice of rein-vestment kA is made so that it maximizes the expected income for the period. The product A φ (kA) is then taken to be the expected revenue.
The connection between the two elements of the re-sponse may be understood within the larger frame of the constraints imposed by the particular project. As-sume that, as the result of the initial overall investment in the project, the top production capacity of the firm is M. This capacity, if it could be constantly placed in the market all along the lifespan of the project, should lead to a net present value that is significantly positive. On the other hand, there must be a firm-determined minimum M0, break-even point for the revenue per period that would mimic the perfect competition case of net present value equal to zero.8 An experienced management team chooses aspiration levels A∈[M0,M] although it is not necessarily the case, often the choice is subjectively believed to be close to the actual end-of-period market realization. Clearly, in a multi-period
model, the choice of target will in general be different in each period, following management’s assessment of market conditions. In this sense, the sequence of choices is driven by a proactive interpretation of market uncertainties, and therefore it may look as a random variable drawn from some unspecified probability distribution.
The function φ(k) represents how well the human resources in the project are able to couple the reinvest-ment decision k with the market uncertainties.9 The response function may be thought of as the formal tool that translates a given decision into a best-belief pro-bability distribution. For the belief is to be considered “appropriate” the team-built response function must satisfy minimal requirements of economic rationality, to be discussed below. From this description, it is then understood that φ(k) is shorthand notation for the probability of meeting a given target, conditional on decision k. The response function φ(k) is not a distribution in k, which is a decision variable and therefore no subject of stochastic behavior; the use of the conditional as the argument is to emphasize the importance of the choice of reinvestment in the creation of economic value.
A formal description of the way in which the team builds the response function requires a model of the
8. While M is determined by the factor market from which technology was purchased and the strategic plan, M0 may moreover depend on the specific shape of the response function.9. This makes the assumption that the only vehicle to enact the team’s response is their choice of reinvestment level for the given period. The reason for this is to keep the analysis as simple as possible. The theory of a multidimensional response would make the mathematics harder to handle and the results less intuitive.
φ (kA)
1 - φ(kA)
Choice: kA
A
0

8 A quantitative model of the human capital ...
initial learning process.10 This process will be simpli-fied to be one in which the team, through a limited and controlled sampling method, structures a set trial sampling distributions ordered by the value of k. The preparation of each sampling distribution requires first setting the values of the members of the set S11 of internal operating parameters that is being put to trial against the market lottery F(x). The elements of this set are n-tuples of values, one for each of the internally defined parameters that characterize operations of the firm. This primary set is chosen by the team on the basis of previous experience.
There is also the set of sampling distributions. Let Ls (x|k) be one member of this set, where s∈S. This construct is an instrument for probing F(x) through the associated excess distribution G(x)=1-F(x), which is a measure of the probability of meeting any target x.Taking the sampling distribution as the experimen-tally controlled measure, a trial response function will be defined by the product
φs (k)= G(x)dLs (x|k) [1]
From the structure of [1], it is clear that response functions are bounded so that 0≤φs(k)≤1. For a given s, sampling distributions are by design ordered so that increasing expected revenue goes paired with increas-ing k. Despite this construction procedure, there is no guarantee that φs(k) will follow a simple functional form. The learning procedure to be followed is to search for a subset S⊆S that contains only elements s whose associated trial response is monotonically increasing in k. This particular class of response functions may be qualified as “rational”, in the sense that they pair higher bets with higher expected prizes, therefore avoiding the undesirable condition where higher risk does not fetch a higher reward. In the best case, i. when the costs of learning are negligible, it may be the case #S>1, and then a procedure must be advanced to choose the best candidate of the set. If learning costs are non-negligible,
then #S=1 is likely, as satisficing will stop the search after the first element is found. If #S=012 this could mean that either the firm’s business conception or the system as a whole is enmeshed in a world where on average there is no connection between higher risk and higher return. Under these circumstances, no entrepre-neur could hope to hold business plans on the rational expectation of making a profit.
If there is more than one element in S then the rule for choosing the representative response function may depend on the team’s preferences. For instance, let [0,kmax ] be the feasible range for k. The functional
Q[φs ]=kmax- φs (k)dk [2]
computes the area right above the response curve.13 The smaller this area, the more efficient the sampling distribution Ls (x|k) is in terms of its associate operating costs (the size of the bet) for the same expected out-come. Therefore, one criterion is to choose the team’s representative response to be given by the formula
φ(k)=arg min{Q[φs ]|s∈S } [3]
There may be other criteria that could work.
As expected utility, the representation of φs (k) is somewhat unusual in the fact that its argument is not the final reward, but rather the bet placed on the lot-tery Ls (x|k). In this sense, it is the utility of betting the amount k. Therefore, the criterion given in [3], based on the notion of second order stochastic dominance, has to be applied “backward”, so to speak, given k as the independent variable. Since, from equation [1] the response function is bound within the interval [0,1], it classifies as meeting the criteria stated at the beginning of this section. Therefore, the team will choose k that maximizes the probability of meeting the stated target (Bordley and LiCalzi 2000), subject to the constraint that the marginal change in net income be non-negative.
10. The process of trial and error described here holds resemblance with the Metropolis-Hastings (Hastings 1970) sampling algorithms as they are used nowadays (Gilks, Robertson and Spiegelhalter 1995; Robert and Casella 2005). The difference is that here the measure of degree of progress toward the ideal distribution being sought is going to be truncated due to practical considerations before any fully stable distribution is attained.11. Being the result of knowledge acquisition efforts by a human team, all sets considered are finite. This means that the collection of members that compose S is actually a small sample from some convex subset in .12. Assuming this is the result after a thorough sampling effort by the team.13. A further restriction that may be imposed on the candidate responses is a “normalization” condition, by asking that limkmax→∞Q[φs]<∞.
1
kmax
0
0
s
∫
∫

9
Expanding on ideas in Berhold (1973), this alternative formulation of the decision problem was shown to be indistinguishable from the traditional maximization of expected utility approach by Castagnoli and LiCalzi (1996) for the Von Neumann-Morgenstern (1944) set of axioms, and by Bordley and LiCalzi (2000) for the Savage (1954) set of axioms. According to this inter-pretation, after normalizing between zero and one the utility function of the firm, the problem of maximizing the expected utility may be transformed into another where what the decision maker maximizes is the pro-bability of meeting the stated target.
Once there is a plausible formal procedure that grants the existence of φ(k), more down-to-earth considerations set in. It is worth to point out that, in general, learning costs must be assumed to be non-negligible. This is an important issue, because the formal process just de-scribed implies, in practice, what may be a random-walk search for candidate sampling distributions Ls (x|k), in the style, already mentioned of a Metropolis-Hastings search (Brooks, Gelman, Jones and Meng 2011). If the arguments about the existence of φ(k) are accepted, it is far more expedient – and quite possibly just as likely to produce a satisfying result – to start right off by propos-ing a continuous, smooth function that is in fact a proxy for the same concept. From now on, the same notation φ(k) will apply to this proxy. The shape of the response is built in such a manner that the structure parameters are easily connected to empirical terms. The representa-tion of the team’s learning process is thus simplified to the task of choosing a shape and afterwards building the connection between the shape parameters and the relevant empirical terms. By assimilating this type of learning process to a calibration process it is conceivable, at least in principle, that the response function may be structured by exploiting the capacities of the managerial team to fine-tune the firm’s internal workings so that its response to initial market signals is controlled by some key operating performance measures that act as the parameters that dictate its shape. If this more ad-hoc approach is chosen, then the management team faces what may be deemed a design problem.
The explicit form for the monotonicity condition on the response function is
φ’ (k)>0, k∈[0,kmax ] [4]
If the slope of the response function were negative within some range of k, this would imply the possibility that the team is running an operation were a larger risk tak-ing, i.e., a higher k, is known to lead to lower expected returns. This would be a sign that the management team is not yet high enough in the learning curve of the particular problem they face. Thus, this requirement con-stitutes the first structural condition that the proxy, i.e. the response function, must satisfy. Any interval where condition [4] were not met would mean that the team is still in an early stage of learning, and has not been able to properly coordinate its basic operative decisions with its reinvestment decisions; as a consequence, the team still is not quite able to establish the effect of marginal increments of working capital over the financial results for the period whit a reasonable degree of confidence Assumption [4] about the shape of φ(k) then implies the hypothesis that, under the assumption of a well-adjusted decision making process, meeting the established target A is more likely the more reinvestment is made. Nev-ertheless, this does not mean that this ideal should be pursued at any cost k. With φ(k) increasing, continuous and bounded, it is easy to see that attempts at adding a given marginal increase in the probability of the desired goal incurs in quickly increasing marginal costs of rein-vestment. Therefore, the optimum reinvestment decision will come at some probability below 100%.
There are other conditions that suggest both the shape and a basic parameterization. The idea of reinvestment in regular operations is often associated with working capital decisions, more or less along the lines found in traditional accounting treatments. This customary pro-cedure is by itself not enough to explain the continuous survival of the firm in a competitive, uncertain market environment. From the point of view pursued here, the act of reinvestment also includes many of the concepts that are often termed as “expenses” or “overhead”. Many of the costs that are truly unavoidable, for instance sala-ries, are threshold costs that enable the firm to continue its operations, even before considering any additional use of funds for the usual purposes of obtaining significant revenues. Clearly, if employees are not paid, they simply walk out and all business functions cease. This type of costs, instead of treating them as a kind of dissipative factor, will be reclassified as threshold reinvestments, and their total will simply be named the “threshold”. This value will be assumed as one of the parameters that characterize the response function, and will be denoted ki. The threshold is then one component of the total

10 A quantitative model of the human capital ...
reinvestment k. The team knows quite well that this level of reinvestment is the absolute minimum required for the production chores to make any economic sense. Once this level of reinvestment is applied, the probability of achieving an economically desirable goal increases at its quickest pace.
The monotonically increasing relation between the reinvestment made and the probability of meeting the target allows for a replacement of the usual represen-tation of expected-utility-of-outcome versus outcome by another where the horizontal axis is just the ap-plied reinvestment. By expensing the threshold cost the firm is expressing its willingness to take the risk of continuing as a player in the market. Therefore, using a representation analogous to that in prospect theory (Kahneman and Tversky 1979), reinvestments up to ki must be seen as undertaken by an entity that behaves as a risk seeker. The willingness to incur the threshold cost derives from the notion, founded in previous learning, that the team knows how to reinvest in the right operating activities that increase the probability of attaining the minimal conditions to access market opportunities.
There is also the decision about the level of conven-tional working capital, which composition and amount is partly discretionary. As the established wisdom of business practice dictates, if working capital is not appropriately managed, its inadequacy will cause the loss of opportunities (too little reinvestment) or inef-ficiencies (too much) that will reflect in aspects such as excess inventory or too many sales on credit. At this stage of the reinvestment decision the firm will be modeled as behaving in a risk-averse fashion, the team believing there is a decrease in the marginal probability gained per each unit of additional reinvestment. From these considerations it is then proposed a sigmoid shape for the response function. For reasons mainly of convenience in mathematical handling, it is useful that such function be perfectly smooth at the point k=ki where the lower, convex component matches the upper concave part. Given the manner of construction, this same point is also the place of the only global maximum of the slope; thus, the shape of φ(k) looks like the one shown in Figure 2.2.
1,0
0,00 1 2
k
3 4
The poitn at the threshold is also the point of maximum slope.
Figure 2.2. Proposed form for the response function of a well-trained assembly of human capital and technology.

11
This graph contains only one point at which the slope reaches a maximum, which is denoted si, at the co-rresponding threshold ki. This parameter is a primary input that, if the constructed response function is analytically smooth, satisfies the condition:14
φ’’ (ki )=0 [5]
The parameter si characterizes the efficacy of the response, given the threshold costs. When entering into the concave part of the curve, the initial marginal probability gain is higher the higher si. In similar fash-ion, a lower ki translates into greater efficiency. The ways to affect the value of si are many, for there are multiple factors whose variations converge on changes in the value of si. As an example, a major change in the processing of inventory, say a move into a just-in-time scheme, usually leads to the consequence that the same market performance may be achieved with a lower level of reinvestment. This is the same as saying that si has increased. Therefore, from the general shape shown in Figure 2.2, it can be seen that one obvious path to greater performance would be a combination of decreasing ki combined with increasing si. Clearly the opposite result obtains from the inverse path: increas-ing ki and decreasing si. From this intuition it may be assumed that organizational changes pushing for the former path must somehow be costly, with costs of restructuring growing more than proportionally to the possible gains in performance; therefore, the optimal design comes when the marginal cost of restructuring matches the performance gains from redesigning.
The proposed shape for φ(k) is plausible under some conditions of optimal team characteristics. The learning experience of the group leads to a current state of their decision-making process such that it allows the firm to keep competing in its target market. These optimality conditions reflect in the adequacy of the organiza-tion’s reinvestment decision’s effective coupling with the market environment. This state of affairs defines what in previous paragraphs has been termed a “well-functioning” team. Its main intellectual endowments may be summarized as follows:
1. The team has a high degree of understanding of the true possibilities of their technology base.
Therefore, the team has identified which vari-ables affect their chances of success, and it has properly established the main qualitative rela-tionships among them.
2. The activities of the different members of the team obey to a well-coordinated effort between decisions and actions. This condition intuitively implies that it is possible to establish a one-to-one functional relation between the values of those variables that are the object of decision and the consequence in terms of probabilities.
3. The team members understand which pieces of information they must have in order to place the best bets in the uncertain environment they have to interact with. In other words, the members of the team are reasonably sure that the relationship between decision variables and consequence is monotonic.
4. The team understands enough about what critical values their internal variables might contain, for instance the threshold costs, so that they have learned the best procedures to make operations go on smoothly. This is important in order to be able to design a parameterized decision process that shapes the response func-tion into one that can meet the three condi-tions discussed earlier. A reinvestment decision process based on a real understanding of the system with which it must interact, will at the very least have clarity on what is the minimum amount of reinvestment above which they will certainly have to go in order to make a profit. If knowledge about the system has translated into ideal conditions for asset outlay, then a proper distribution function along the lines postulated here should arise.
Working against its response design, the team faces:
1. Any design constraints imposed by the initial choice of technology and its particular configu-ration, which come as a consequence of initial strategic choices made by the firm.
14. These conditions, together with the condition of coincidence between the threshold point and the maximum slope, are analytically convenient but not strictly necessary. In particular, within the frame of the theory exposed here there are no adverse consequences if the second derivative is not continuous.

12 A quantitative model of the human capital ...
2. The sampling of market behavior is always insufficient to design an ideal response function. Therefore, there is always more than one possible response design that the operating team may arrive at in order to meet the challenge posed by market uncertainties. The particular path of development is by nature subject to trial and error and shaped in a fundamental way by the ignorance of alternative paths not taken. From these circumstances it may be inferred that φ(k) is the product of a particular development his-tory. Therefore, even when the resulting design may prove to be adequate for competition, only a post-facto comparison with other competitors will reveal the true goodness of response.
3. All the costs incurred in the particular deve-lopment path are sunk costs, and therefore the design arrived at will most likely get locked-in as the one that will shape the decision –making process. Any decision to change an established response design is costly and subject to a re-opened deck of intra-firm uncertainties.
This list of conditions does not imply that the response function is fully specified by just two parameters, ki and si. Clearly, it is possible to construct responses with a higher number of parameters as long as they enter de description in a way that suitably relates them to terms susceptible of empirical representation. Nevertheless in what follows it is expedient to assume that the response functions are fully characterized by just two parameters.
The model
Suppose that investors in the product market invest an amount I in a project to produce a single product. This project is the sole concern of the firm, and is the object of its strategic plans. The strategy includes the choice of a lifetime T for the project, after which obsolescence of the physical assets in place suddenly creeps in and causes their productive capacity to collapse to zero. The project and its associated strategic plans are conceived in a market environment where the market discount rate for its analyst-assigned risk category is r.
In the absence of debt any period’s net earnings u is cash flow to the owners. The market value of the project, using a uniform cash flow model, is given by:
V=-I+D u [6]
DTr is the present value factor, given the project’s life and
the market discount rate. u must be optimized on the basis of the aspiration level targeted by management.
An important element of the strategic plan is the scale M of the project. This quantity reflects the investors’ belief about the achievable market share. The scale is necessarily related to the size of the investment, and it is assumed that marginal gains in scale are decreasing with each additional unit of investment. Another com-
ponent of the strategic plan is the investor’s reservation value for the project, or merely their expectations of incremental wealth, represented by some minimum net present value V1≥0 expected to be achieved. Unless otherwise stated, for reasons of simplicity, this value will be taken to be zero. In general, many of the technical details that constraint operations depend on the scale of the project; this condition implies that some of the parameters affecting the management of each period’s income will depend on M and the reservation value for the project. Ultimately, the chosen investment level I will set the scale of the basic managerial variables, in particular that of the reinvestment decision in each period.
The firm constituted for this unique project sells a single product in a risky market that provides imperfect signals about its underlying uncertainties. The oper-ating team has to choose a strategy to provide what, within their understanding, is a best response to those uncertainties. The team has climbed the initial stages of its learning curve; therefore, for any single period of activities, the team is able to choose the appropri-ate amount of reinvestment k that it deems will elicit optimal end-of-period earnings given their beliefs about market behavior.
Tr

13
The response function may be placed within the traditional frame of inter-temporal utility analysis of projects, where a present sacrifice (disutility) of funds is increased until the inter-temporal sum of utilities reaches a maximum. This sum is the expected income for the period, given by:
u(k)=-k+Aφ(k) [7]
Since, by construction, φ(k) is monotonically increasing in k and bounded, the above expression will in general have a maximum for some value kA. This value may be found from the first order condition for the maximiza-tion of the expected income.
The management team, once under a normal regime of operating conditions, must decide on each period which level of reinvestment k is the optimal, given the target revenue. The firm fully finances this reinvest-ment out of the net income from the previous period. To avoid nonessential complications, it is assumed that such income is always enough to cover for the next period reinvestment needs. The application of the first order condition yields:
φ’ (kA )= 1 [8]
This equation will determine the optimal reinvestment level. The details on how kA will vary with A in this equation depend on the specific shape of φ(k).
For any k>ki the proposed general shape for φ(k) estab-lishes a monotonically decreasing relationship between its slope and its argument. From equation [8], an increas-ing A produces a decreasing slope for the optimal rein-vestment decision. If the problem is specified correctly, it should always be kA> ki. Given this fact, equation [8] reveals a monotonically increasing relationship between A and kA. The second order condition requires that φ’’ (kA)<0 for u(kA) to be the maximum. Therefore, assum-ing a sigmoid shape for the cumulative function, the optimum reinvestment level will be above the inflexion point of the curve.
It may be the case that despite [8] having a feasible solution, u(kA;A) turns out to be negative. In particular, if the attainment of positive solutions requires A>M, then it may be concluded that either the management team has not “climbed” correctly the learning curve, for their arrangement of activities and assets outlay is not matching correctly the opportunity enabled by the initial investment, or that the assembled technological and human capital – even at its best – is not up to the task, because the team was not able to structure a de-cision making system that produced a value of ki low enough for the firm to be competitive.
By formally solving equation [8], it is possible to know the optimal reinvestment kA that must be made, given the team’s beliefs as expressed by the target choice. That exercise would require of an explicit form for φ(k). Nevertheless, it is possible to establish the general character of the solution from a rewriting of equation [7]. Let u>0 be any particular value for the expected income, then equation [7] may be rearranged as follows
φ(k)= u + 1 k [9]
Expression [9] may be read as an equation in k where the solutions are given by the intersections between the function φ(k) and a straight line with intercept u⁄A and slope 1⁄A. In general, for fixed A, there will be two, one or no solution to this equation, depending on the value assigned to u. For fixed A, the value of u adjusts the intercept up or down, so that the line may be placed at a point where it is tangent to the curve. For fixed u, lowering A makes a steeper line whit a higher intercept.
Let u=u be the value that produces a single solution to [9], which must also be the maximum feasible expected income for the chosen target. This case leads to a simple graphical reading of the major features that characterize the optimal solution. Figure 3.1 shows a comparative plot of the optimal solutions for two different values of the aspiration, A1>A2, for the same response function. The intercept in each case is equal to the ratio of the op-timal income divided over the corresponding aspiration.
A
A A

14 A quantitative model of the human capital ...
Figure 3.1.In these representations the slope of the lines are the inverse of the aspiration. Therefore, the slope keeps an inverse relation with the
optimal single-period income. The horizontal axis is the reinvestment decision expressed in arbitrary units.
The lower intercept u2 ⁄A2 corresponds to the lower optimal income, and it may be seen from the graph that it is associated with both a lower optimal reinvestment and a lower expected income. The complementary statements can be made for the line with the higher intercept u1 ⁄A1 .
The diagrams for optimal solutions also reveal a rela-tive dominance relationship between any two teams. Figure 3.2. below shows the optimal solution plots for two different teams, where the response function
of Team 1 dominates that of Team 2 in terms of the optimal expected income for the period, given the same aspiration A. This notion of dominance needs to be specified by telling for which range of values of A applies. This concept of dominance is another way to express the idea that, at least for one period, Team 1 holds a competitive advantage over Team 2. The exten-sion of this idea to all periods of the project exploits this visual representation to describe the notion of sustained competitive advantage.
Figure 3.2.Illustration of the concept of relative dominance. The intercept for Team 1 is above that for Team 2. Since the slopes are the same, it
implies that the expected income for Team 1 is larger..
0,0
0,00
0,10
0,20
0,30
0,40
0,50
0,60
0,70
0,80
0,90
1,00
1,0 2,0 3,0 4,0
Aspiration 1
Aspiration 2
0,0
0,0
1,0
1,0 2,0 3,0 4,0 5,0
Team 1
Team 2

15
Figure 3.2 is useful to illustrate how the difference in performance between the two teams may serve as gauge to determine the value added by the human resource. In order to do this, first it is useful to intro-duce the concept of a “market team” (MT). A market team is one that under the best possible conditions for all periods of the project, which means that always A=M and, it barely manages to achieve net present value equal to zero. This is the same as saying that for any MT it is the case that M0=M. This condition ap-plied to the model in [6] means that the MT expected income for all periods is
u0= I [10]
This net present value equal to zero is expected un-der conditions of perfect competition in the product market. If the condition of perfect competition were a permanent feature of the market then it is legitimate to argue that, in the factor market, specifically the labor market, prices are essentially commoditized. Therefore, the labor cost of any MT represents its intrinsic value.
Consider next another team in a firm constituted with identical investment and capital market conditions, which manages to structure a response function such that – at A=M – the expected income u is consistently larger than u0 for every period. Then the value added by this difference is equal to any positive addition to owners’ wealth stemming from the project. Under these considerations, equation [6] may be rewritten as
V= (u-u0 ) [11]
If the only differentiating resource among competing firms is the HR, then this is the team’s incremental value added above its cost in the factor market. It may
be appreciated that the right-hand-side is the product of two terms: the first summarizes the main systematic elements from the financial markets, while the second summarizes the effects of the firm’s internal arrange-ments of its decision process.
One question that may be raised here is that may be the dominance shown in Figure 3.2 comes at an added cost in the “research” effort made to have a better response function. In this way, at the end of the day it may turn out to be not so obvious how much effort to throw into building a highly efficient response. The answer to this is that often two separate teams with access to similar material resources come up with completely dif-ferent plans, where one is clearly better designed than the other. Human creativity may be costly in terms of personal and collective intellectual efforts going into a particular endeavor, but there is no obvious relation-ship between efforts of that sort and economic costs. If the team members, after realizing their success, claim through some bargaining process a part of the captured rent, that is only a welfare issue that would not affect the derivations made in this section. Another concern with the model resulting in [11] is that it seems to ignore the existence of resources other than HR. This apparent restriction is not as stringent as it looks at first glance. Such an objection implicitly places HR at the same level as other, non-human resources. In fact, all other resources are such only because they are conceived to be so in the human mind. Therefore, the HR is actually better thought of as a meta-resource. If a team has access to material resources that others do not, then the only consequence of the appropriate deployment of those resources will be a more efficient and efficacious response function. In other words the existence of other specific resources will show in the values of the response function’s parameters.
TD r
TD r

16 A quantitative model of the human capital ...
In this section the results from the previous section will be illustrated by choosing the following proxy for the response function:
φ(k)= kα [12]
This function complies with the basic criteria discussed above as long as α>1. This particular choice of response function does not contemplate a finite maximum value for reinvestment; as a consequence, at the optimal re-investment, φ(k) will always remain below 100%. This function belongs to the class of responses for which no amount of reinvestment guarantees a certain outcome. The parameter q has a transparent interpretation, since a choice of reinvestment level in that particular amount would provide chances of meeting the target that are as good as tossing a fair coin.
The scale parameter q may be understood in terms of those defining the character of the distribution, namely ki and si. After some simplification, [5] yields
q= α+1 1/α ki [13]
Which gives the equivalence between the curve’s scale parameter and the fundamental ki. It can also be shown that
ki si= 1 (α-1/α) [14]
Since the pair (ki,si ) is the basic description of how the management team conducts its decision making pro-cess, the problem of optimizing its designed response is an attempt at tailoring its best fit between the firm’s operations and the environment. The discussion that follows is meant to clarify how this coupling may turn out to be either adequate or inadequate, depending on the choices in assets outlay summarized by (ki,si ).
With this specific response function, the team will want to maximize u in equation [4]. Introducing a scale variable through the transformation kA=qy, and the dimensionless combination ξ≡A/q, the first order condition yields:
αξyα-1
=1 [15]
This equation provides a closed form expression for the optimum expected income:
uA (y)= qy [1+yα-α] [16]
For this expression to produce the optimum value, its argument must be the solution to [15].
Using [15] and [16] it is possible to check for this particular example the shape and properties of the “isoquants” that form in the plane (α,q). Figure 4.1 shows three of them for different values of uA and for a fixed A=10.
A numerical example
Figure 4.1 Isoquants in the plane (α,q). All plots are for an aspiration target A=10.
α-1
(1+yα)2
α
4
(qα+kα )
1,0
1,0
1,2 1,4 1,8 2,0 2,21,6 2,4
4,0
3,5
3,0
2,5
2,0
1,5

17
The figure shows the tradeoffs between the adjusted values for α and q that would lead to the same ex-pected income. As the cost scale q varies from lower to higher values, it is evident the decrease in efficiency as measured by the corresponding value of the expected income for the same α. For instance, at aspiration level A=10 and α=2, increases in expected income from 1.50 up to 2.74 require correspondingly decreasing values of the parameter q from 3.7 down to 2.8, which means that the response is (or must be) increasingly efficient.
The aspiration level is constrained to the interval [M0,M]. While the maximum of this interval directly affects what is feasible to achieve when structuring a response, the minimum is mainly the result of the response that has already been structured. The mini-
mum acceptable aspiration M0 may be obtained by setting the left-hand-side of [16] equal to u0, as given by equation [10], solving for y, and then obtaining M0 from equation [15]. For the cases in Figure 4.1, the following data set from the upper graph: u0=1.5, α=2, taking M 10, and q=3.7 leads to a situation such that M0=M. Therefore, this graph is the set of all possible MTs within the plotted range. For the intermediate graph the only change is to choose its corresponding value of q=3.3. This is a more efficient response, and therefore the computed lower limit is M0=9.216<M. For the third, lowermost graph the corresponding value is M0=8.54. Therefore, the more efficient its response, the team has more room for a choice of aspiration.
For specific choices of the response proxy, there will be an explicit expression for the optimal income as a function of the model parameters, such as in expres-sion [16]. Let uC (kC ) be the optimum earnings for the period, based on the belief that the realized results will be management’s target C. Let the actual end-of-period realization of revenues be A, with uA (kA ) the corresponding optimum earnings. Then the forecast error is given by the difference
fe=uC (kC )- uA (kA ) [17]
Depending on some subjective tolerance criterion, this quantity informs about excess optimism (positive) or excess caution (negative) in the process of choosing an aspiration for the period. The difference kC-kA is the over- (sub-) reinvestment incurred as consequence of the choice of aspiration for the period. The associated loss function for the forecast error is given by the dif-ference between the actual optimum and the expected income function at realization A valued at the subop-timal reinvestment kC:
Loss(fe)=uA (kA )-uA (kC ) [18]
This difference is positive because of the optimum property of the first term on the right-hand side. For small differences kA-kC, it is straightforward to show that Loss(fe) behaves as a customary quadratic loss
function. This suggests the possibility of learning-as-calibration by way of using standard maximum likeli-hood methods.
To illustrate the point, the choice of proxy from the previous section has only two parameters, with sensi-bilities that are not yet known with respect to the usual production decisions. The set of production decisions contains a number of variables, ranging from changes in sales on credit and inventory, all the way to changes in sales force incentives. There are also other variable types, such as turnover ratios and the working capital-to-assets ratio. Let Z={zl |l=1…n} be the set of all those variables. Then, after some trial and error – mostly through the use of [18] – it may be possible to establish the linear model that explains best the relationship between the pair of dependent variables (α,q) and the set Z of independent variables.
This trial-and-error approach leaves something to be desired, because of the apparent lack of some guid-ing methodology. There is, moreover, the fact that the response is built out of two up to now separate parts: one is the structuring of the proxy for the response function, and the other is the best, rationally founded decision about the choice of aspiration. While the first piece is the result of strenuous efforts of the kind already discussed, the second so far has been left the subject of the arts of guessing the market out of a few
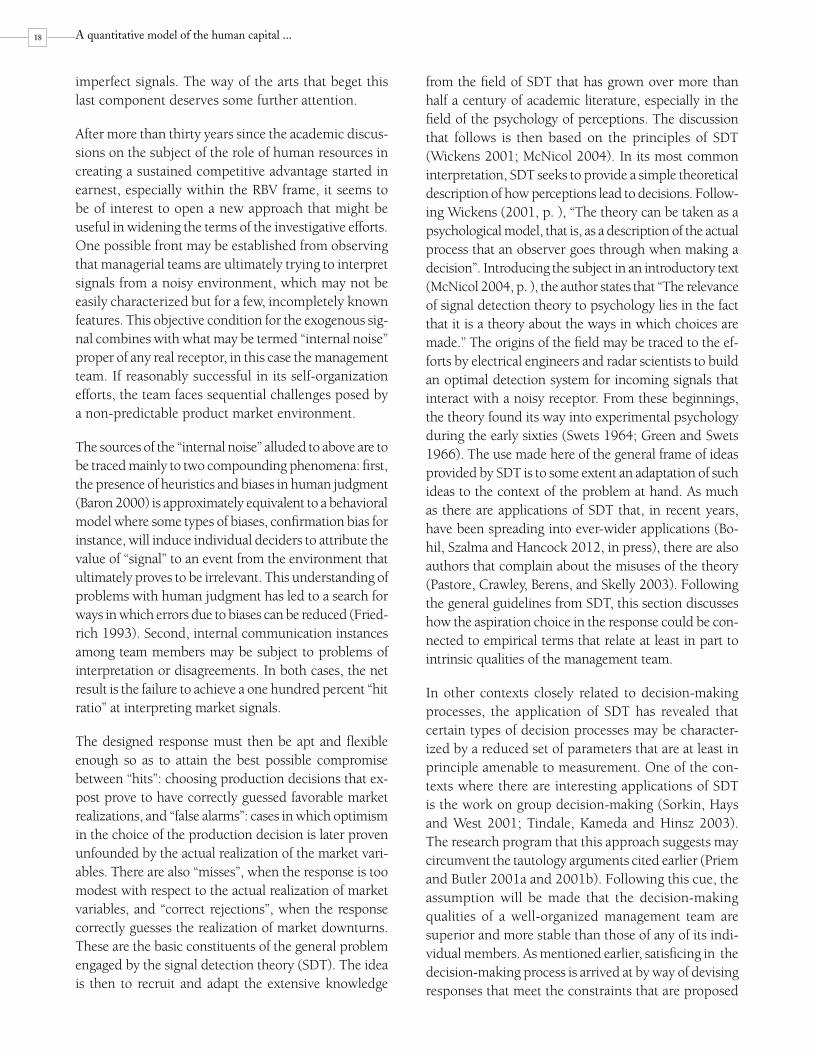
Remarks about some empirical aspects
18 A quantitative model of the human capital ...
imperfect signals. The way of the arts that beget this last component deserves some further attention.
After more than thirty years since the academic discus-sions on the subject of the role of human resources in creating a sustained competitive advantage started in earnest, especially within the RBV frame, it seems to be of interest to open a new approach that might be useful in widening the terms of the investigative efforts. One possible front may be established from observing that managerial teams are ultimately trying to interpret signals from a noisy environment, which may not be easily characterized but for a few, incompletely known features. This objective condition for the exogenous sig-nal combines with what may be termed “internal noise” proper of any real receptor, in this case the management team. If reasonably successful in its self-organization efforts, the team faces sequential challenges posed by a non-predictable product market environment.
The sources of the “internal noise” alluded to above are to be traced mainly to two compounding phenomena: first, the presence of heuristics and biases in human judgment (Baron 2000) is approximately equivalent to a behavioral model where some types of biases, confirmation bias for instance, will induce individual deciders to attribute the value of “signal” to an event from the environment that ultimately proves to be irrelevant. This understanding of problems with human judgment has led to a search for ways in which errors due to biases can be reduced (Fried-rich 1993). Second, internal communication instances among team members may be subject to problems of interpretation or disagreements. In both cases, the net result is the failure to achieve a one hundred percent “hit ratio” at interpreting market signals.
The designed response must then be apt and flexible enough so as to attain the best possible compromise between “hits”: choosing production decisions that ex-post prove to have correctly guessed favorable market realizations, and “false alarms”: cases in which optimism in the choice of the production decision is later proven unfounded by the actual realization of the market vari-ables. There are also “misses”, when the response is too modest with respect to the actual realization of market variables, and “correct rejections”, when the response correctly guesses the realization of market downturns. These are the basic constituents of the general problem engaged by the signal detection theory (SDT). The idea is then to recruit and adapt the extensive knowledge
from the field of SDT that has grown over more than half a century of academic literature, especially in the field of the psychology of perceptions. The discussion that follows is then based on the principles of SDT (Wickens 2001; McNicol 2004). In its most common interpretation, SDT seeks to provide a simple theoretical description of how perceptions lead to decisions. Follow-ing Wickens (2001, p. ), “The theory can be taken as a psychological model, that is, as a description of the actual process that an observer goes through when making a decision”. Introducing the subject in an introductory text (McNicol 2004, p. ), the author states that “The relevance of signal detection theory to psychology lies in the fact that it is a theory about the ways in which choices are made.” The origins of the field may be traced to the ef-forts by electrical engineers and radar scientists to build an optimal detection system for incoming signals that interact with a noisy receptor. From these beginnings, the theory found its way into experimental psychology during the early sixties (Swets 1964; Green and Swets 1966). The use made here of the general frame of ideas provided by SDT is to some extent an adaptation of such ideas to the context of the problem at hand. As much as there are applications of SDT that, in recent years, have been spreading into ever-wider applications (Bo-hil, Szalma and Hancock 2012, in press), there are also authors that complain about the misuses of the theory (Pastore, Crawley, Berens, and Skelly 2003). Following the general guidelines from SDT, this section discusses how the aspiration choice in the response could be con-nected to empirical terms that relate at least in part to intrinsic qualities of the management team.
In other contexts closely related to decision-making processes, the application of SDT has revealed that certain types of decision processes may be character-ized by a reduced set of parameters that are at least in principle amenable to measurement. One of the con-texts where there are interesting applications of SDT is the work on group decision-making (Sorkin, Hays and West 2001; Tindale, Kameda and Hinsz 2003). The research program that this approach suggests may circumvent the tautology arguments cited earlier (Priem and Butler 2001a and 2001b). Following this cue, the assumption will be made that the decision-making qualities of a well-organized management team are superior and more stable than those of any of its indi-vidual members. As mentioned earlier, satisficing in the decision-making process is arrived at by way of devising responses that meet the constraints that are proposed

19
by different individuals within a well-structured team. This assumption bears particular importance, since the main theoretical support for the arguments that follow is the theory of signal detection, as is normally treated in the academic literature. In this theory, the responses that human beings produce are the result of the composite of external signals with the internal, noisy perceptions by the receptor of the signals. Much of what the receivers consider their best response is thus constructed according to criteria that necessarily contain discretionary elements that may blur the dis-tinction between the receptions of a noisy signal and that of mere internal noise. The statement that team decision-making is superior refers to team structures where the aggregate of individual perceptions results in a lower degree of receptor-generated noise and then hopefully to a higher degree of discrimination capac-ity between noise and signal plus noise.15 Therefore, another quality of a well-functioning team is that its self-organization efforts lead to a reduction of this “receptor noise”, well below what could be expected from each individual member.
Therefore unit of analysis established for this theory is the team. This is justified on the intuition that a group that is well managed should be able to produce signal interpretations that are more robust, i.e., less noisy than any of its individual members. But, beyond that argument, there is enough empirical evidence that points to the fact that group analysis and responses are in general more accurate than those of individuals.
This is at least in part due to the fact that it may be expected that in group decision-making the assumption of independence between stimuli and criterion setting should be better satisfied than for individuals.
For the case of relevance to this paper, group decision-making in the absence of group anomalies, the as-sumption of independence between perceptual and decisional effects should be easier to uphold (Ashby 1992).
A sketch of the approach to the problem of target choice from the perspective of SDT may start by going back to the model from the strategy expressed by equation [6]. So far V1, the shareholders’ specified reservation net present value for the project has been set to zero. In this section that assumption is changed to V>V1>0. V represents the net present value when the team is able to exploit the market at full production capacity M for all periods. In the same vain, M1 represents the production level that if sustained for all periods would produce net present value of V1.
Any choice of target such that A∈[M1,M] will be termed HIGH. The same applies to any actual end-of-period revenue realization R. If either the target or the actual revenue falls in the complement, then it is termed LOW. With these conventions, the following table summarizes the characterization of each combi-nation of target and realization:
Following the prescriptions of SDT (Wickens 2001), after a sufficient sample of attempts has been col-lected it is possible to construct an adapted version of the corresponding receiver-operating characteristic (ROC) curve, which maps in a single plain the num-ber of “false alarms” versus the number of “hits”. This characterization allows for the induction of some of
the main discriminating characteristics of the deci-sion maker vis-à-vis the signals that he receives from the environment. Then a feedback loop through this procedure may allow a learning team to “hone in” its skills at choosing targets by adjusting some of its decision-making habits and attitudes.
Target \ Realization Low High
Low Correct rejection Miss
High False alarm Hit
15. The reason for a better discrimination capacity to be “hopefully” the result is because some failures in team structure may lead to phenomena such as groupthink ( Janis 1982), where team discriminating capacity is seriously biased toward the reception characteristics of one dominant member of the team.

20 A quantitative model of the human capital ...
This paper develops the basic idea that the main purpose of all activity within the boundaries of a firm interacting with an uncertain environment are oriented toward the maximization of the probability of meet-ing its goals, given its specific constraints. This idea is embodied in the concept of the response to the chal-lenges posed by the environment to a team that has transcended the stage of a mere collection of individu-als, each with his/her particular intellectual strengths and drawbacks, and has become, through a process of learning, a form of human capital. The response is then represented by two separate – though closely related – components. One is the response function, which summarizes the dual role of both expected utility and probability of meeting a predetermined target. The second component is the choice of a target, on the basis of the imperfect information that the team trusts to be useful to provide a guess about the best target to set.
The intent of the model is to provide a stage for the rigorous discussion and identification of the potential for future value creation, i. e., ex-ante identification of possible sources of strategic advantages, or other forms of sustainable competitive advantage, which may lead to the future appropriation of rents.
The model consists of a single project in the product market. This project was chosen after strategic con-siderations and the specification of its general goals and dimensions places constraints on the actions that the management team may undertake. In particular, shareholder expectations for the project are guided by expected returns that are within the dictum of capital markets. Therefore, some of the constraints faced by the management team come from market conditions, which is in agreement with one of the main tenets of the market-based view (MBV) of the firm. Neverthe-less, the firm-specific internal environment will create a learning process that may lead to either higher or lower response capacity by the management team. Being subject to many idiosyncratic uncertainties, the learning process produces inevitable differentia-tions among teams competing in the same product market. As a consequence, some teams are able to capture rents with respect to others whose responses are then dominated. This relative dominance is thus
the first-principles basis for a sustained competitive advantage, at least over a number of periods. This re-sult endorses several of the assumptions made in the resource-based view (RBV) of the firm, once human capabilities have been turned into human capital (HC); in particular, assumptions such as causal ambiguity and non-tradability of the HC.
At least in principle, models along the lines of the one discussed in the paper allow for the judicious param-eterization of many of the features that constitute the basic stuff of sustainable competitive advantage. This approach provides the foundation for a non-retrograde way to calculate the HR impact on value creation, since it does not attempt to compute its contribution to value by using ex-post financial results; therefore, the model can be aimed at the tasks of managerially relevant strategic analysis. This is made possible be-cause of the connecting lines that go from the theoreti-cal frame to the learning process initially experienced by the team. In practice, there will be the need to invent calibration procedures that meaningfully map certain activities and capabilities into one or more of the response function parameters.
The choice of target is of capital importance, for a con-sistently wrong choice will lead to failure of the whole strategy, regardless of how otherwise efficient the re-sponse might be. The team in the learning process must make explicit efforts about developing an appropriate intuition of the environment outside the boundaries of the firm. For the sake of keeping matters as simple as possible, the blueprint for the theory that describes this component of the response is the one-dimensional signal detection theory (SDT). In a more realistic treat-ment, it is likely that the multi-dimensional generaliza-tion, sometimes known as “general recognition theory” (GRT), will bring additional insight. The appeal of SDT is not just because of the circumstance that it seems to be the obvious choice of empirical protocol for the problem at hand. The attempt is to hire – so to speak – some of the paradigmatic principles from other bodies of knowledge, such as SDT, to build some new avenues into the problem of how to better understand the HR contribution to the value of the firm. The usefulness of this approach is manifest in that it allows a
Conclusions and further considerations

21
quantitative representation of the problem from first principles, avoiding thus the circularity criticism at-tributed to approaches from ex-post type of analyses.
When assessing the financial convenience of a project that is meant for the real world, the only convention that is meaningful to apply to the projected cash flows is that they are “expected”. Although most textbooks in finance deal with this attribute as if it were an obviously settled matter, it is relevant to ask ‘whose expectations?’ Even a casual reading of reports prepared by market specialists who are assessing a particular enterprise’s worth shows that, together with due attention paid to systematic aspects of the valuation, most of the infor-mation that analysts deem pertinent is idiosyncratic. In other words, many of the expectations that the “market” (read analysts) attach to a given asset are based on the particular enterprise management -team perceived performance. The attempt made here is to model these
two components – systematic and idiosyncratic – in a separable fashion. The idea is then to apply a simplified scheme of decision separability that parallels the lines of analysis used in psychophysical research, particularly in empirical work within the frame of general recogni-tion theory (GRT).16
As a closing remark, it is worth to point out that the model presented here is essentially static in character. Within the scope of the model, the link between the MVB and RBV approaches is the act of target choosing. This contact comes through the exogenous influences that affect the target choice A. The full integration of both approaches would require a dynamic model of interaction between firms, as seen through the time variations in the target choice. The discussion in Teece et al. (1997) seems like a promising starting point for such a research program.
Abbas, Ali E. and Matheson, James E. (2005). Nor-mative target-based decision making. Managerial and Decision Economics 26, 373-385.
Amit, Raphael and Shoemaker, Paul (1993). Strategic Assets and Organizational Rent. Strategic Management Journal 14, 33-46.
Ashby, F. G. (1992) (Ed.). Multidimensional models of perception and cognition. Hillside, NJ: Erlbaum.
Barney, Jay B. (1991). Firm Resources and Sustained Competitive Advantage. Journal of Management 17, issue 1, 99-120.
Barney, Jay (2001). Is the Resource-Based “View” a Useful Perspective for Strategic Management Research? Yes. Academy of Management Review 26, 41-56.
Barney, Jay and Wright, Patrick (1997). On becoming a strategic partner: the role of human resources in gaining competitive advantage. Working paper 97-09, Cornell University ILR School.
Baron, Jonathan (2000). Thinking and Deciding. Cam-bridge University Press.
Bechtel, Roman (2007). Calculating human capital: The market based valuation of the human resource. Zeits-chrift für Personalforschung (ZfP), ISSN 1862-0000. Reiner Hampp Verlag, Mering, Vol. 21, issue 3, 206-231.
Berhold, M. H. (1973). The use of distribution functions to represent utility functions. Management Science 19, 825-829.
Bohil, C.J., Szalma, J.L., & Hancock, P.A. (in press). Psychophysical methods and signal detection: Recent advances in theory. In J.L., Szalma, M., Scerbo, R. Parasuraman, P.A., Hancock, & R.R., Hoffman (Eds.) Cambridge Handbook of Applied Perception Research.
Bordley, Robert and LiCalizi (2000). Decision analysis using targets instead of utility functions. Decisions in Economics and Finance 23, 53-74.
16. The subject of decision separabililty encompasses a number of subtleties. The article prepared by Bohil, Szalma and Hancock (2012) discusses some of the main issues related to that concept.
References

22 A quantitative model of the human capital ...
Brooks, Steve, Gelman, Andrew, Jones, Galin and Meng, Xiao-Li (2011). Handbook of Markov Chain Monte Carlo. Chapman & Hall/CRC Handbooks of Modern Statistical Methods.
Castagnoli, Ennio and LiCalzi, Marco (1996). Expected utility without utility. Theory and Decision 41, 281-301.
Collis, D. J. (1994). Research note: How valuable are organizational capabilities? Strategic Management Jour-nal 15, Issue Supplement S1, 143-152.
Conner, Kathleen and Prahalad, C. K. (1996). A resource-based theory of the firm: Knowledge vs. op-portunism. Organization Science 7, issue 5, 477-501.
Friedrich, James (1993). Primary error detection and minimization (PEDMIN) strategies in social cognition: a reinterpretation of confirmation bias phenomena. Psychological Review (American Psychological Associa-tion) 100 (2): 298–319.
Gilks, W. R., Richardson, S. and Spiegelhalter, D. (Eds.) (1995). Markov Chain Montecarlo in Practice. Chapman & Hall/CRC Interdisciplinary Statistics.
Green, D.M. and Swets J.A. (1966). Signal Detection Theory and Psychophysics. New York: Wiley.
Hastings, W.K. (1970). Monte Carlo Sampling Methods Using Markov Chains and Their Applications. Biome-trika 57 (1): 97–109.
Janis, I. L. (1982). Psychological Studies of Policy Decisions and Fiascos. Boston: Houghton-Mifflin.
Kahneman, Daniel and Tversky, Amos (1979). Prospect theory: An analysis of decision under risk. Econometrica 47, 263-291.
Lengnick-Hall, Mark and Lengnick-Hall, Cynthia (2003). Human Resource Management in the Knowledge Economy. New Challenges – New Roles – New Capabilities. San Francisco.
Lippman, S. A. and Rumelt, R. P. (1982). Uncertain imitability: An analysis of inter-firm differences in efficiency under competition. Bell Journal of Economics 13(3), 4188-438.
Lo, Andrew and Mueller, Mark (2010). Warning: Phy-sics Envy May Be Dangerous to Your Wealth! Journal of Investment Management 8, No. 2, 13-63.
Mahoney, Joseph and Pandian, J. Rajendran (1992). The resource-based view within the conversation of strategic management. Strategic Management Journal 13, 363-380.
Makadok, Richard (2001). Toward a synthesis of the resource-based and dynamic-capability views of rent creation. Strategic Management Journal 22, 387-401.
McNicol, D. (2004). A Primer of Signal Detection Theory. Psychology Press, New Ed edition.
Mosakowski, Elaine (1997). Strategy Making Under Causal Ambiguity: Conceptual issues and empirical evidence. Organizational Science 8(4) 414-442.
Pastore, Richard, Crawley, Edward, Berens , Melody and Skelly, Michael (2003). “Nonparametric” A’ and other modern misconceptions about signal detection theory. Psychonomic Bulletin Review 10 (3), 556-569.
Penrose, Edith (1959). The Theory of The Growth of the Firm (Revised Edition 2009). Oxford University Press.
Peteraf, Margaret (1993). The Cornerstones of Com-petitive Advantage: A Resource-Based View. Strategic Management Journal, Vol. 14, No. 3, 179-191.
Peteraf, Margaret and Bergen, Mark E. (2003). Scanning Dynamic Competitive Landscapes: A Market-Based and Resource-Based Framework. Strategic Management Journal 24, 1027-1041.
Priem, R. L. and Butler, J. E. (2001a). Is the Resource-Based “View” a Useful Perspective for Strategic Mana-gement Research? Academy of Management Review 26, 22-40.
Priem, R. L. and Butler, J. E. (2001b). Tautology in the Resource-Based View and the Implications of Externally Determined Resource Value: Further Comments. Aca-demy of Management Review 26, 57-66.
Rajan, Raghuram (2012). The Corporation in Finance. Presidential Address to the American Finance Associa-tion, Chicago, January 2012. Also, Working Paper No. 12-02, Fama-Miller Paper Series, IGM Working Paper

23
No. 69, The University of Chicago Booth School of Business.
Reed, Richard and DeFillippi, Robert J. (1990). Cau-sal Ambiguity, Barriers to Imitation, And Sustainable Competitive Advantage. The Academy of Management Review 15, No. 1, 88-102.
Robert, Christian and Casella, George (2005). Mon-tecarlo Statistical Methods. Springer Texts in Statistics.
Ryall, Michael D. (2009). Causal Ambiguity, Comple-xity, and Capability-Based Advantage. Management Science, Vol. 55, No. 3 (March), pp. 389-403.
Savage, J. L. (1954).The Foundations of Statistics. New York: Wiley.
Simon, Herbert (1955). A Behavioral Model of Rational Choice. Quarterly Journal of Economics 69, 99-118.
Sorkin, Robert D., Hays, Christopher J. and West, Ryan (2001). Signal-Detection Analysis of Group Decision Ma-king. Psychology Review 108, No. 1, 183-203.
Stewart, Thomas A. (1997). Intellectual Capital. The New Wealth of Organizations. London: Doubleday.
Sveiby, Karl-Erik (2004). Methods for Measuring In-tangible Assets. http://www.sveiby.com/articles/Intan-gibleMethods.htm. Download:
Swets, J.A. (Ed.) (1964). Signal detection and recognition by human observers. New York: Wiley.
Teece, David J., Pisano, Gary and Shuen, Amy (1997). Dynamic Capabilities and Strategic Management. Strategic Management Journal, Vol. 18, No. 7, 509-533.
Tindale, R. Scott, Kameda, Tatsuya and Hinsz, Verlin B. (2003). Group Decision Making. In M. A. Hogg & J. Cooper (Eds.) Sage handbook of social psychology. London: Sage Publications.
Von Neuman; John and Morgentern, Oskar (1944). The Theory of Games and Economic Behavior. Princeton University Press. Princeton, NJ.
Welpe, Isabell (2007). The Theory of Real Options as Theoretical Foundation of the Assessment of Human Capital in Organizations. Zeitschrift für Personalfors-chung (ZfP). ISSN 1862-0000. Reiner Hampp Verlag, Mering, Vol. 21, issue 3, 274-294 https://www.econstor.eu/dspace/bitstream/10419/70940/1/730644324.pdf
Wernerfelt, Birger (1984). A Resource-Based View of the Firm. Strategic Management Journal 5, 171-180.
Wickens, T. D. (2001). “Elementary Signal Detection Theory”, Oxford University Press.
Wright, Patrick, Dunford, Benjamin and Snell, Scott (2001). Human Resources and the Resource Based View of the Firm. Journal of Management 27, 701-721.
Wright, Patrick, McMahan, Gary and McWilliams, Abagail (1994). Human Resources and Sustained Competitive Advantage: A Resource-Based Perspective. International Journal of Human Resource Management 5, 301-326.

24 A quantitative model of the human capital ...

Bogotá, Abril de 2014
AdministraciónGaleras de
The relationship between perceptions of insecurity, social capital and subjective well-being: Empirical evidences from conflicted rural Colombia. La relación entre las percepciones sobre inseguridad, capital social y el bienestar subjetivo: Evidencias empíricas de la zona rural colombiana en conflicto. Eduardo Wills H., profesor asociado, Facultad de Administración, Universidad de los Andes; Luz E. Orozco C., profesora asistente, Facultad de Administración, Universidad de los Andes; Clemente Forero P., profesor titular, Facultad de Administración, Universidad de los Andes; Oscar Pardo A., profesor asistente, Facultad de Administración, Universidad de los Andes; Veneta Andonova Z., profesora asociada, Facultad de Administración, Universidad de los Andes. Marzo de 2009.
26
Business Networks and Innovation in SMEs of a Developing Country. Redes empresariales para la innovación en PYMEs de un país en desarrollo. Clemente Forero Pineda, profesor titular, Facultad de Administración, Universidad de los Andes; Sandra Corredor Waldron, asistente graduada, Facultad de Administración, Universidad de los Andes; Nohora Forero Ramírez, asistente de investigación, Facultad de Administración, Universidad de los Andes. Marzo de 2010.
27
Javier Yáñez ArenasDecano
Henry Gómez Samper, director
Germán Andrade Pérez
Camilo Dávila L. de Guevara
Ezequiel Reficco
Juan Pablo Soto
Piedad Salgado Camacho
Calle 21 No. 1 - 20 Ed. SD P. 7
Teléfono (571) 332 4555
Fax (571) 332 4551
Bogotá, Colombia
Internet-Based Corporate Disclosure and Market Value: Evidence from Latin America Divulgación de información corporativa basada en Internet: Evidencia de Latinoamérica. Urbi Garay, profesor titular, Centro de Finanzas, IESA; Maximiliano González, profesor asociado, Facultad de Administración, Universidad de los Andes. Octubre de 2010.
28
Dividend policy and ownership structure in Latin America. Política de dividendos y estructura de propiedad en Latinoamérica. Maximiliano González, profesor asociado, Facultad de Administración, Universidad de los Andes; Carlos Molina, profesor, área de finanzas, IESA; Eduardo Pablo, profesor, Universidad de Tulane y del IESA. Noviembre de 2010.
29
Violence, insecurity and hybrid organizational forms: A study in conflict-ridden zones in Colombia. Violencia, inseguridad y formas organizativas híbridas: un estudio en las zonas en conflicto en Colombia. Clemente Forero-Pineda, profesor titular, Facultad de Administración, Universidad de los Andes; Eduardo Wills, Herrera profesor asociado, Facultad de Administración, Universidad de los Andes; Veneta Andonova Zuleta, profesora asociada, Facultad de Administración, Universidad de los Andes; Luz Elena Orozco Collazos, profesora asistente, Facultad de Administración, Universidad de los Andes; Oscar Pardo Aragón, profesor asistente, Facultad de Administración, Universidad de los Andes. Abril de 2010.
30
Contratos de Estabilidad Jurídica en Colombia (CEJ): ¿información asimétrica, inconsistencia intertemporal o captura de la autoridad tributaria? Contracts for Legal Stability in Colombia: asymmetric information, inter temporal inconsistency or capture of the tax authority? Francisco Azuero , profesor asociado, Facultad de Administración, Universidad de los Andes; Alexander Guzmán, estudiante de Doctorado en Administración, Facultad de Administración, Universidad de los Andes. Profesor asociado, Colegio de Estudios Superiores de Administración (CESA; María Andrea Trujillo, estudiante de Doctorado en Administración, Facultad de Administración, Universidad de los Andes. Profesora asociada, Colegio de Estudios Superiores de Administración (CESA). Diciembre de 2010.
31
Family Firms and Financial Performance: The Cost of Growing. Empresas familiares y desempeño financiero: el costo del crecimiento. Maximiliano González, profesor asociado, Facultad de Administración, Universidad de los Andes; e , Facultad de Alexander Guzmán, studiante de Doctorado en AdministraciónAdministración, Universidad de los Andes a ); Carlos Pombo, profesor asociado, Facultad . Profesor sociado, Colegio de Estudios Superiores de Administración (CESAde Administración, Universidad de los Andes; e , Facultad de Administración, Universidad de los María Andrea Trujillo, studiante de Doctorado en AdministraciónAndes. a a a . Agosto 1.Profesor sociad , Colegio de Estudios Superiores de Administración (CESA) de 201
32
Family firms and debt: Risk aversion versus risk of losing control. Empresas familiares y deuda: tensión entre aversión al riesgo y el riesgo de perder el control. Maximiliano González profesor asociado, Facultad de Administración, Universidad de los Andes; e , , Alexander Guzmán, studiante de Doctorado en AdministraciónFacultad de Administración, Universidad de los Andes a ); Carlos Pombo, profesor . Profesor sociado, Colegio de Estudios Superiores de Administración (CESAasociado, Facultad de Administración, Universidad de los Andes; e , Facultad de Administración, María Andrea Trujillo, studiante de Doctorado en AdministraciónUniversidad de los Andes. a a a . Agosto 1Profesor sociad , Colegio de Estudios Superiores de Administración (CESA) de 201 .
33
Family Involvement and Dividend Policy in Listed and Non-Listed Firms. Involucramiento familiar y política de dividendos en empresas listadas y no listadas. Maximiliano González, profesor asociado, Facultad de Administración, Universidad de los Andes; Alexander Guzmán, estudiante de Doctorado en Administración, Facultad de Administración, Universidad de los Andes. Profesor asociado, Colegio de Estudios Superiores de Administración (CESA); Carlos Pombo, profesor asociado, Facultad de Administración, Universidad de los Andes; María Andrea Trujillo, estudiante de Doctorado en Administración, Facultad de Administración, Universidad de los Andes. Profesora asociada, Colegio de Estudios Superiores de Administración (CESA). Agosto de 2012.
34
Market Segmentation: Venezuelan ADRs. Segmentación de Mercado. Urbi Garay profesor titular, Instituto de Estudios Superiores de administración (IESA), , profesor visitante, Facultad de Administración, Universidad de los Andes; Maximiliano González profesor asociado, Facultad de Administración, Universidad de , los Andes. Agosto de 2012.
35
Cultural Distance and its Effect on Cross-Border Entry Mode: Latin American Evidence. Distancia cultural y su efecto en el modo de entrada en negocios transfronterizos. Eduardo Pablo, Assistant Professor, Minnesota State University Moorhead; Urbi Garay, profesor titular, Centro de Finanzas, Instituto de Estudios Superiores de Administración, Iesa; Maximiliano González, profesor asociado, Facultad de Administración, Universidad de los Andes. Octubre de 2013.
36
Corporate Governance Mechanisms in Family Firms: Evidence from CEO Turnovers Mecanismos de gobierno corporativo en empresas familiares. Evidencia de la . rotación de gerentes de empresas Maximiliano González, School of Management, Universidad de los Andes; Alexander Guzmán, CESA School of Business, . Bogotá, Colombia and School of Management, Universidad de los Andes; Carlos Pombo, School of Management, Universidad de los Andes; María Andrea Trujillo, CESA School of Business, Bogotá, Colombia and School of Management, Universidad de los Andes. Diciembre de 2013.
37
The Cost of Equity in Emerging Markets: The Case of Latin America El costo de capital en países emergentes: el caso de Latimoamérica. Urbi Garay, profesor titular, . Centro de Finanzas, Instituto de Estudios Superiores de Administración, Iesa. Maximiliano González, profesor asociado, Facultad de Administración, Universidad de los Andes. John Rosso, estudiante de Doctorado (Finanzas), Facultad de Administración, Universidad de los Andes. Profesor asistente, Universidad Pedagógica y Tecnológica de Colombia, UPTC. Febrero de 2014.
38

Galeras de Administración
Facultad de AdministraciónUniversidad de los Andes
Management Galleys
Ab
ril d
e 20
14
39
A quantitative modelof the human capitalcontribution to the value of a project
39 A quantitative modelof the human capitalcontribution to the value of a project
Rafael Batutista, profesor asociado,Facultad de Administración, Universidad de los Andes
Rafael Bautista, Profesor asociado,Facultad de Administración, Universidad de los Andes
Un modelo cuantitativo de la contribución del capital humano al valor de un proyecto
Un modelo cuantitativo de la contribución del capital humano al valor de un proyecto
Este artículo propone una manera de construir un marco conceptual para evaluar la contribución económica debida al capital humano en proyectos reales. El punto de partida es el rechazo del supuesto del capital humano como un bien sustituible, supuesto que se encuentra insertado en prácticamente todos los tratamientos del tema. Una vez que el equipo gerencia ya ha escalado una curva inicial de aprendizaje, esa experiencia se traduce en un conjunto bien definido de destrezas y de conocimientos "cocinados en casa" que no son transferibles mediante un mecanismo de mercado y que son la base de una posible ventaja competitiva permanente durante la vida del proyecto. En este modelo, la especificidad de ese conocimiento "desarrollado en casa" queda codificada por medio de los parámetros de una función que representa las posibles respuestas del equipo gerencial frente al reto de coordinar los requerimientos de aspiraciones de ingresos que haga la administración central con las condiciones percibidas del mercado. La manera en la cual el valor presente neto del proyecto dependa de los parámetros reflejará el peso que tiene la contribución del capital humano. Esta aproximación al problema pone de manifiesto que la contribución del capital humano no sigue reglas aditivas simples, y que la noción de valor agregado proviene principalmente de la comparación entre los desempeños del equipo de gerencia del proyecto y los de sus competidores.
This paper proposes a conceptual frame for assessing the economic contribution attributable to the human capital in a project in the product market. The starting point is the rejection of the assumption of human capital as commodity, which is implicit in nearly all discussions about the economic value of a project in the product market. Once the management team has already climbed a particular learning curve, this experience translates into a well-defined assembly of skills and know-how "honed in house" that are not marketable and that become the basis of sustained competitive advantage during the life of the project. In this model, the specificity of the in-house developed knowledge is encoded by the parameters of a function that represents the responses of the team to aspiration levels proposed by central management, vis-à-vis its perceptions of market conditions. How the net present value of the project depends on those parameters reflects the weight of the human capital. This approach reveals that the contribution of the human capital component to the value of a project does not follow any simple additive rule, and that the notion of added value comes mainly from comparing the team's performance with that of competing management teams.