China Taiping Insurance Holdings Company Limited Investor ... · 2015年末 2016年末...
108
China Taiping Insurance Holdings Company Limited Investor/Analyst Open Day 22 June, 2017
Transcript of China Taiping Insurance Holdings Company Limited Investor ... · 2015年末 2016年末...

China Taiping Insurance
Holdings Company Limited
Investor/Analyst Open Day
22 June, 2017

2
The presentation herein contains unaudited data. While the Company has endeavored to accurate and complete data, it makes no express or implied statement or warranty regarding fairness, accuracy, completeness and correctness of such information or opinions. All data contained in this presentation are only subject to the circumstances when they were provided and the Company makes no commitment to perform any update of the presentation for any consequent change
The “forward-looking statements” contained in the presentation herein refer to the statements of the Company on possible future business activities, events or evolutions. Such statements are assumptions formed on the basis of the Company’s future operations and various factors out of the control of the Company, hence actual operation outcomes may differ greatly from such statements
Data, statements or opinions contained in the presentation herein do not constitute any open offer or investment advice. The Company and its staff, whatever reason it might be, assume no responsibility for any loss or damage incurred from the use or interpretation of the presentation herein or any information in connection with it
Forward-looking Statements

3
China Taiping Insurance Holdings Company Limited was listed on the Hong Kong Stock Exchange Main Board in 2000, making it the first Chinese-funded insurer that was listed overseas
The parent company China Taiping Insurance Group Ltd. was founded in Shanghai in 1929 as a national insurance brand with the longest history in China, and is the only Chinese state-owned financial and insurance group whose management headquarters is located in Hong Kong. Its business covers many countries and regions in the world, particularly in Mainland China, Hong Kong, Macau, North America, Europe, East and Southeast Asia. In 2013, successfully completed its reorganization and restructuring as well as overall listing synchronously through China Taiping Insurance Holdings Company Limited (China Taiping hereinafter)
The principal activity of China Taiping is investment holding. The principal activities of China Taiping’s subsidiaries are the underwriting of direct life insurance business in the PRC and Hong Kong, direct property and casualty insurance business in the PRC, Hong Kong and overseas, pension and group life business, and all classes of global reinsurance business. Its subsidiaries also carry on operations in asset management, insurance intermediary, E-commerce, property investment, financial leasing, securities dealing and broking business
Company Introduction

China Taiping
— Overall Business Review
4

Business Overview
Overall Realization of Sustained, Healthy and Rapid Development from Jan to May, 2017
Balanced and rapid growth of scale and value
Continuous increase of overall strength
Continuous optimization of business structure
Significant improvement in operating efficiency
Continuous improvement in international influence
5

Business Overview (Cont’d)
Scale and Value of Mainland Insurance Business Have Gained Balanced and Rapid Development, and Business Structure Has Continued to be Optimized
By the end of May, direct premium written of life insurance totaled RMB 69.18 billion*, increased by 31.6% YoY
Agency force increased by 43.0% compared with 2016 year-end, resulting in an 56.3% increase in individual FYP YoY, which ranked No.4 in the industry; high productivity agents (FYP ≥ RMB 300,000) increased by 60.2% YoY; bancassurance regular premium increased by 88.9% YoY, with its business structure continued to be optimized
The four persistency ratio indicators of individual and bancassurance channel continued to maintain the industry-leading position; the loss ratio of short-term group insurance kept in a satisfactory range
TPI’s direct premium written increased by 11.5% YoY, continued to maintain double-digit growth. Growth rate of motor insurance is 15.5% YoY, which outperformed the market. Combined ratio decreased, continuing to make underwriting profits
Balance of pension assets under management was over RMB 140 billion
6 * All data related in this material is stated in RMB, if not specified

Business Overview (Cont’d)
Overseas Insurance Businesses Recorded Accelerated Growth, and international influence kept rising
Premium of CTPI(HK) increased steadily, keeping its forefront ranking in the HK P&C market
Overseas life insurance business was developing rapidly; TPL(HK) was founded in 2015 year-end
and achieved a premium income of HK$400 million from Jan to Mar 2017, with its ranking in
the market improved
The scale of TP Macau continued to rank No.1 in the market, with premiums and underwriting
profits both increased
Overseas companies actively provided insurance services for the Belt and Road strategic
projects, and the Chinese capitalized business of TP Indonesia developed rapidly
TPRe continued to promote international business by expanding the base of new customers in
Singapore, Thailand and Europe, and business with Lloyd's achieved a rapid growth; TPRe
(China) continued to improve its service level, and gradually enhanced its market influence
7

Business Overview (Cont’d)
Effective Implementation of Strategic Cooperation and Cross-selling
Initiatives with Large Clients
By the end of May 2017, China Taiping signed Group Strategic Cooperation
Agreements with 76 large clients; 4 new large clients was signed and 6 are being
worked on in 2017
Our cross-selling initiatives achieved RMB 2.09 billion premium sales, including RMB
1.69 billion of property insurance sales through TPL, RMB 0.36 billion of pension
sales through TPL, and RMB 30 million of property insurance sales through TPP
The Sinopec gas station project achieved rapid development, achieving RMB 0.505
billion of premium sales from Jan to May, in which RMB 0.34 billion is motor
insurance
8

• TPL
Mainland Life Insurance Business Review
9
Note: The Group holds 75.1% of the equity interest in TPL

Life insurance: The leading Indicator of Value Growth Continued
to be Excellent
Agency force grew rapidly on a year-on-year basis, and had reached 375,000
as at the end of May. The number of high productivity agents reached
10,000, realizing a substantial increase of 60.2% in the period of Jan to May
New business premium for individual and bancasurance core business
achieved rapid growth; structure for new business premium optimized, with
health insurance proportion being increased
Persistency ratio indicators continued to lead the industry
10

Life insurance: Premium remained a fast growth and solvency was
stable
11
Direct Premiums Written
( RMB million)
Comprehensive Solvency Ratio
69,181
Jan-May 2016
+31.6% 240% 251%
At 31 Mar 2017 At 31 Dec 2016
52,551
Jan-May 2017
C-Ross C-Ross

Further Increase in Proportion of Individual Business
Life Insurance: Structure of Gross Premiums – By Distribution
Channels
12
Jan-May 2016
Jan-May 2017
819 1,005
26,607 26,512
25,124 41,665
(RMB million,%)
Individual
Group and telemarketing
Bancassurance
Jan-May 2016 Jan-May 2017
47.8%
50.6%
1.6%
60.2%
38.3%
1.5%

Life Insurance: Individual New Business Premium for Health
Insurance Grew Substantially and its Proportion Increased
significantly
13
Individual New Business Health Insurance Premium
(RMB Million)
Others
Health Insurance
Individual New Business Structure
(%)
Jan-May 2016 Jan-May 2017
89.3%
10.7%
82.8%
17.2% +6.5pp
Jan-May 2016 Jan-May 2017
1,291
3,142
+143.4%

Year Distribution of Critical Illness Insurance In-force Business
Insurer Age Distribution of Critical Illness In-force Business
38.5% 47.9%
30.1%
24.1%
20.5%
20.0%
11.3% 9.8%
9.6%
8.6% 5.4%
8.8%
17.6% 16.5%
31.6%
Coverage Premium Policy
1 Year 2 Year 3 Year 4 Year 5 Year and above
33.6%
16.8% 29.3%
9.7%
6.4%
8.5%
16.9%
15.2%
17.0%
24.7%
30.2%
25.3%
12.8%
24.1%
16.3%
2.4% 7.4% 3.7%
Coverage Premium Policy
Age 0-9 Age 10-19 Age 20-29
Age 30-39 Age 40-49 Age 50-59
Critical Illness Insurance:New Business Grew Rapidly in Recent Two Years;
Actual Experience and Pricing Assumption for Insurer Age Closely Matched
14

Life Insurance: Agency Force Realized Rapid Growth; High
Productivity Agents Grew Substantially
15
Number of Agents
374,630
261,922
+43.0%
251,856
10,147
6,335
+60.2%
Number of High Productivity Agents*
(person) (person)
* High productivity agent refers to agent with RMB300,000 FYP and above
At 31 May 2017 At 31 Dec 2016 At 31 May 2017 At 31 May 2016
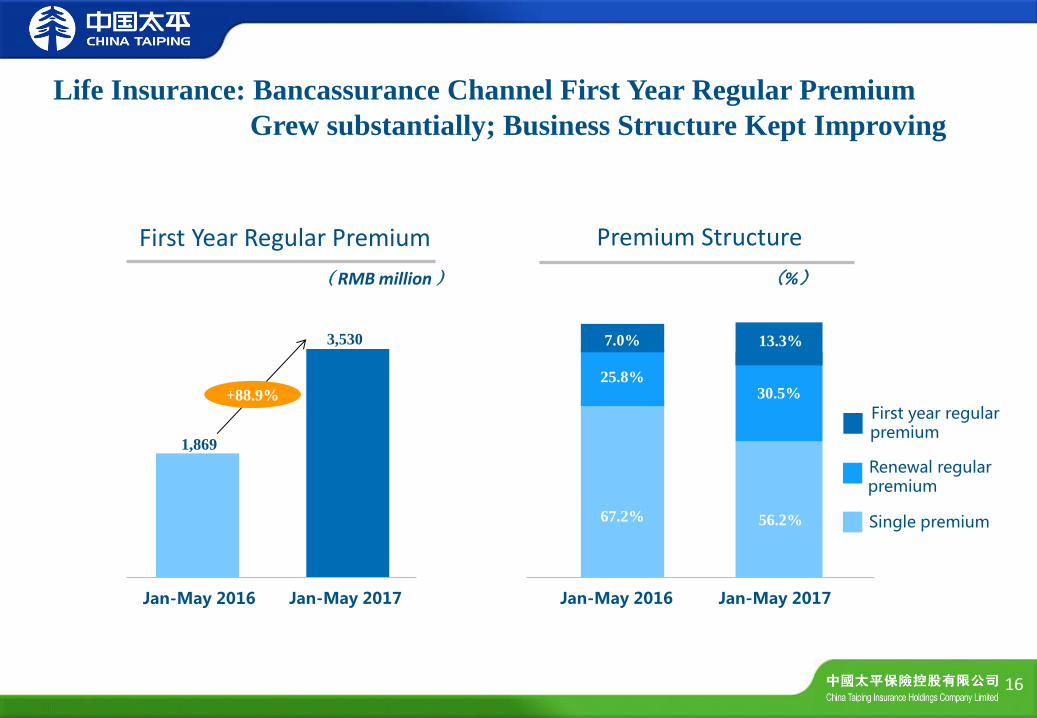
Life Insurance: Bancassurance Channel First Year Regular Premium
Grew substantially; Business Structure Kept Improving
16
(%)
3,530
1,869
Jan-May 2016
+88.9%
67.2%
25.8%
7.0%
56.2%
30.5%
13.3%
First Year Regular Premium
(RMB million)
Premium Structure
Jan-May 2017 Jan-May 2016 Jan-May 2017
First year regular premium
Renewal regular premium
Single premium

17
Life Insurance: Persistency Ratios Stood at the Forefront of the
Industry
93%
95% 97%
88% 89%
92%
2015年末 2016年末 2017年5月末
第13个月之保费继续率
第25个月之保费继续率
At 31 Dec 2015 At 31 Dec 2016 At 31 May 2017
92% 94%
96%
87%
89% 91%
2015年末 2016年末 2017年5月末
第13个月之保费继续率
第25个月之保费继续率
At 31 Dec 2015 At 31 Dec 2016 At 31 May 2017
Individual Bancassurance
Persistency ratio – 13th month
Persistency ratio – 25th month
Persistency ratio – 13th month
Persistency ratio – 25th month
Note: According to communications with peers, TPL was No.1 in both Individual and Bancassurance Channels in terms of 13th month persistency ratio

18 * result from the same valuation assumptions of 2015 unless otherwise specified, similarly hereinafter
+17.6%
+60.1%
-14.1%
2016 2015
+37.6%
New Business Value
Life Insurance: New Business Value Continued the Growth Trend
(RMB million)
Standard Change & Assumption Change Movement Analysis
(RMB million)
Standard Change
Business Growth
Assumption Change
2015 Solvency l
2015 C-Ross
2016* C-Ross
2016 C-Ross
C-Ross
C-Ross
5,927
8,154
5,927
5,041
8,154
9,488

19
+6.8%
+19.2% -5.7%
Adjusted Net
Worth
In-force Business
Value
+3.5%
+36.2% -10.4%
At 31 Dec 2016
+12.4%
At 31 Dec 2015
Embedded Value
Life Insurance: Embedded Value Continued Steady Growth Trend
(RMB million)
2015 Solvency l
2015 C-Ross
2016* C-Ross
2016 C-Ross
Standard Change
Business Growth
Assumption Change
(RMB million)
Standard Change & Assumption Change Movement Analysis
C-Ross C-Ross
82,338
73,240
68,582
34,643
33,939
73,240
38,128
35,112
87,313
47,839
39,474
82,338
42,864
39,474

• TPI
Mainland P&C Insurance Business Review
20
Note:The Group holds the 100% equity interest of TPI

Direct Premiums Written
(RMB million)
Comprehensive Solvency Ratio
Mainland P&C Insurance: Premiums Kept Growing Steadily
202% 206%
At 31 Mar 2017 At 31 Dec 2016
21
8,439
7,566
Jan-May 2017 Jan-May 2016
+11.5%
C-Ross C-Ross

Overseas P&C Insurance and Reinsurance Businesses Review
HK & Macau
• CTPI (HK)
• TP Macau
Overseas
• TP Singapore
• TP UK
• TP Indonesia
Reinsurance
• TPRe
• TPRe (China)
22
Note:The Group holds 55% of the equity interest in TP Indonesia, and 100% in the other companies listed above
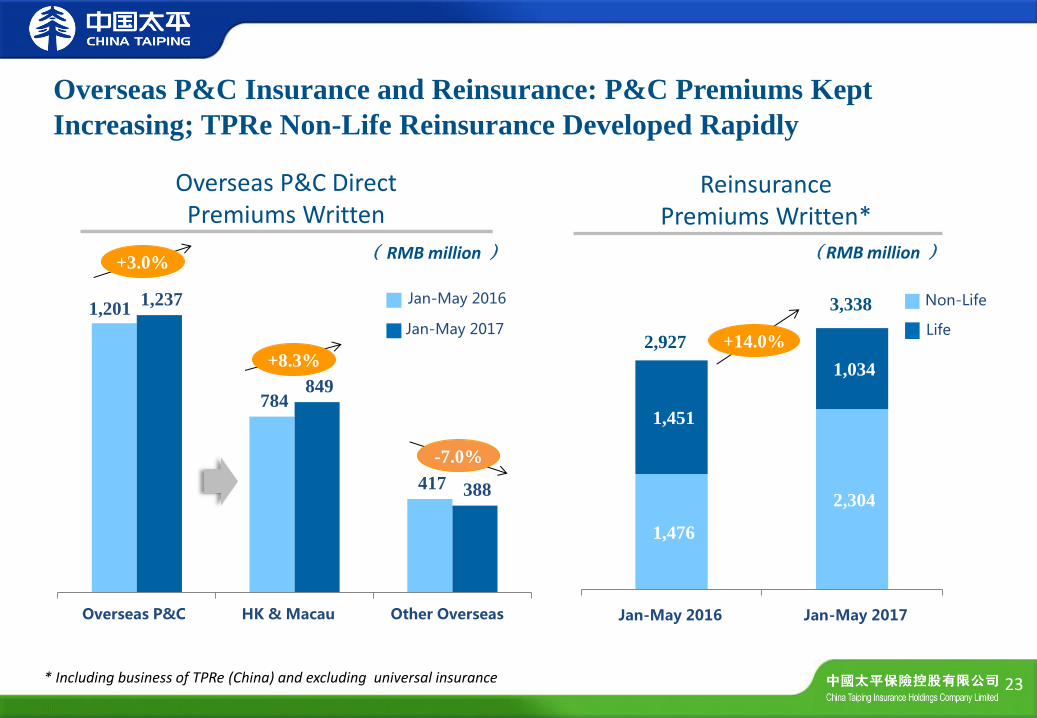
1,476
2,304
1,451
1,034
2016年1-5月 2017年1-5月 Jan-May 2016 Jan-May 2017
1,201
784
417
1,237
849
388
境外产险 港澳 海外 Overseas P&C HK & Macau Other Overseas
Jan-May 2016
Jan-May 2017
Overseas P&C Insurance and Reinsurance: P&C Premiums Kept
Increasing; TPRe Non-Life Reinsurance Developed Rapidly
23
-7.0%
+8.3%
+3.0%
3,338
+14.0% 2,927
Overseas P&C Direct Premiums Written
( RMB million )
Reinsurance Premiums Written*
(RMB million )
* Including business of TPRe (China) and excluding universal insurance
Non-Life
Life
• TPP
Pension and Group Life Insurance Businesses Review
Note: The Group holds 100% of the equity interest in TPP
24

25
Pension and Group Life Insurance Businesses: Premium Income Kept
Growing; Annuity Business Achieved Steady Growth
55,890
54,145
At 31 May 2017 At 31 Dec 2016
+3.2%
68,761
62,957
+9.2%
Jan-May 2017 Jan-May 2016
2,464
2,223
+10.8%
(RMB million)
Annuity Entrusted Assets Annuity Invested Assets
(RMB million) (RMB million)
Premiums Written
At 31 May 2017 At 31 Dec 2016

Outlook
26

Outlook Life Insurance Business
Under the guidance of the concept of "protection is the fundamental function of the insurance industry", life insurance market transformed, and the high-growth of individual new business drove the life insurance premium of the industry to maintain a high growth. A high growth of new business value is expected for the whole industry in 2017. Meanwhile the surrender rate continued to improve, indicating a rebound of the life insurance industry
In the context of a comprehensive trend of strict insurance regulation, the listed insurance companies with a sound internal control system and operating compliance are expected to be in a stronger position in the market competition
With the gradual promotion and implementation of the Outline of the Plan for Health China 2030 issued by the CPC Central Committee and the State Council, the health insurance market is expected to usher in a new growth point
Occupational annuity is expected to break through in the second half of 2017, and the annuity market is expected to usher in development opportunities
Investment assets are expected to grow faster in 2017 while rising interest rates are expected to ease the investment pressure; investment return is expected to remain stable throughout the year
27

Outlook (Cont’d)
P&C Business
The growth of new car sales slows down, and the traditional non-motor insurance business such as corporate property insurance and cargo insurance with strong relevance to economic environment grows slowly, seriously restricting the overall development of the P&C insurance industry
With the deepening of the motor insurance marketization reform and the launch of the second round of the reform, the market competition is increasingly intensive, the premium adequacy ratio is further reduced, the motor insurance growth continues to slow down, and underwriting profitability continues to be under pressure
With the national the Belt and Road strategy and the acceleration of the modernization of national governance, the new economy is booming, and non-motor insurance business such as liability insurance, accidental health insurance and agricultural insurance will usher in the development opportunities while raising high demand on the professional services and risk management capabilities of insurance companies
28

Outlook (Cont’d)
29
Reinsurance Business
Reinsurance market funds are still abundant, and a lot of capital in entering the reinsurance industry and the Chinese market. Fierce competition will lead to the continuous decline of the premium rate, and underwriting profit margins will continue to narrow
With the increase in claim of insurance with large coverage, the driving of the regulatory policies including C-ROSS and the new risks brought about by the development of science and technology, new insurance needs are generated. Reinsurance, as an effective means to diversify risks, manage capital and control business fluctuations, is re-evaluated and recognized by the market
With the system of C-ROSS, the impose of differentiation requirement on risk capital of domestic and overseas reinsurance companies is conducive to business development and market performance of TPRe in China
Thank you!
30

TPL
— Life Insurance Business Review
31

• Business Development
Individual Life Insurance Business Review
32

Business Development
Agency Force and Premium Increased Steadily
As of the end of Mar 2017, the number of agents was 321,000, and regular premium was RMB 16.14 billion in the first quarter of 2017; as of the end of May, agency force reached 366,000, and regular premium was RMB 17.78 billion
As of the end of Mar 2017, the market ranking of individual new business premium continued to remain No.4
33
Jan-Mar 2016 Jan-Mar 2017 YoY Growth Jan-May 2017
Agency Force 234,000 321,000 37% 366,000
Regular Premium 9.6 billion 16.14 billion 68% 17.78 billion
Regular Premium per Month
3.2 billion 5.38 billion 68% 3.56 billion
Note:1. Data in this page does not include the Sinopec gas station project, and similarly hereinafter 2. Regular premium in this page is company’s assessment indicator, which is calculated as “FYP+Single Premium*0.1”,
and similarly hereinafter

Business Development (Cont’d)
34
Agency Force Trend since 2016
Assessment was made in strict accordance with the Basic Law in 2016, and agency force reached 250,000 in the fourth quarter, and reached 254,000 at the end of the year, an increase of 17% over the beginning of the year; after a year of integration of agents in the first quarter of 2017, agency force realized growth with break through, reaching 321,000 at the end of the quarter, and 366,000 as of the end of May
20.7 20 23.4 22.7 21.5
23 22.8 24.2 24.5 25.2 25.4 25.4 26.1
30.632.1 33
36.6
15
20
25
30
35
40
Jan-16 Feb Mar Apr May Jun Jul Aug Sep Oct Nov Dec Jan-17 Feb Mar Apr May
10 Thousand Agents

• Key Agent and Performance Indicators
Individual Life Insurance Business Review
35

2015 2016 Jan-Mar 2017
Group 24,962 32,489 34,493
Agency Force per Group 9.1 8.0 9.3
Department 4,677 5,892 6,061
Agency Force per Department 48.7 44.2 52.9
Key Agent and Performance Indicators
Agency Force per Group, Agency Force per Department
Retention Rate
36
2015 2016 Jan-Mar 2017
6th Month Retention Rate 83.0% 75.1% 82.7%
13th Month Retention Rate 52.5% 41.6% 48.1%
24th Month Retention Rate 24.4% 24.3% 23.3%

Key Agent and Performance Indicators (Cont’d)
37
2017 Agent Development
In the first quarter of 2017, strict basic management was made for individual channel, the new agent retention system was continued to be strengthened, and the Basic Law was followed for promotion. The number of new agents reached 101,000 in the first quarter, and the agency force reached 321,000 at the end of the first quarter, and reached 366,000 as of the end of May
Assessment was made in strict accordance with the Basic Law of the 2016 version. We have moderately raised some of the basic standards of the Basic Law. For example, the standard of new contract commission for active agent was raised from RMB 300 to RMB 500; the group structure standard for promotion to senior executives was adjusted, and the requirement for direct groups was increased

Key Agent and Performance Indicators (Cont’d)
Key Performance Indicators
38
2015 2016 Jan-Mar 2017 Jan-May 2017
Policy Per Month Per Capita 0.95 1.09 1.9 1.3
Productivity Per Month Per Capita (Regular)*
14,181 15,145 36,227 27,416
Monthly Overall Activation Ratio 49.8% 52.5% 60.8% 59.5%
Three Month Formalization Ratio 37.9% 45% 41% 44.8%
Cumulative Activation Ration In Three Months
76.3% 81.3% 91.4% 88.4%
Monthly Agents With RMB 10K Sales (regular Premium)*
30,635 39,273 100,477 77,224
Annual Agents With RMB 1MM Sales (regular Premium)
1,451 1,924 2,167 2,275
* In the first quarter of 2017, the high regular premium for the Jump Start period significantly increased the agent productivity; products with high NBV will be sold in the second half of the year, and it is expected that the average annual indicators will fall back
Key Agent and Performance Indicators (Cont’d)
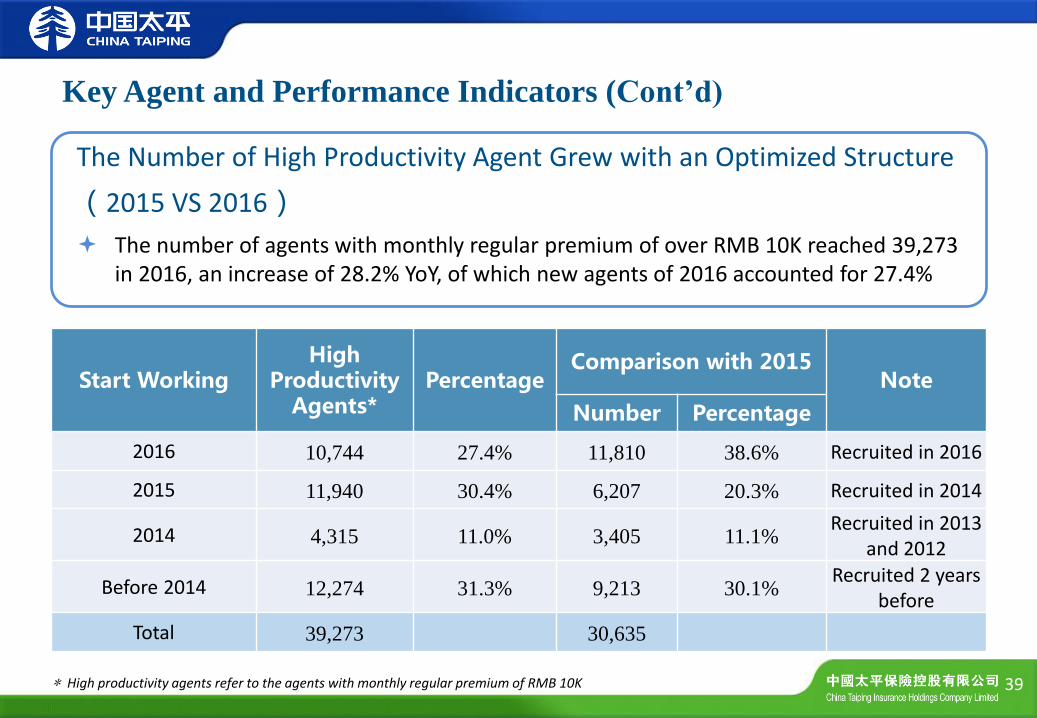
39
Start Working High
Productivity Agents*
Percentage Comparison with 2015
Note
Number Percentage
2016 10,744 27.4% 11,810 38.6% Recruited in 2016
2015 11,940 30.4% 6,207 20.3% Recruited in 2014
2014 4,315 11.0% 3,405 11.1% Recruited in 2013
and 2012
Before 2014 12,274 31.3% 9,213 30.1% Recruited 2 years
before
Total 39,273 30,635
* High productivity agents refer to the agents with monthly regular premium of RMB 10K
The Number of High Productivity Agent Grew with an Optimized Structure
(2015 VS 2016)
The number of agents with monthly regular premium of over RMB 10K reached 39,273 in 2016, an increase of 28.2% YoY, of which new agents of 2016 accounted for 27.4%
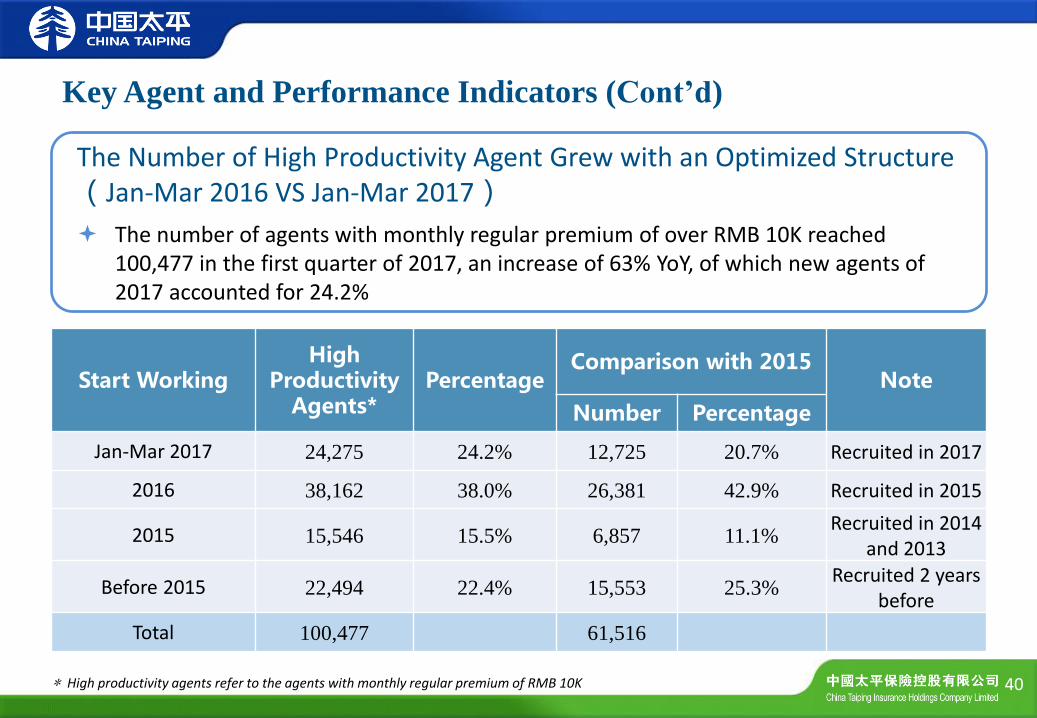
The Number of High Productivity Agent Grew with an Optimized Structure(Jan-Mar 2016 VS Jan-Mar 2017)
The number of agents with monthly regular premium of over RMB 10K reached 100,477 in the first quarter of 2017, an increase of 63% YoY, of which new agents of 2017 accounted for 24.2%
Key Agent and Performance Indicators (Cont’d)
40
Start Working High
Productivity Agents*
Percentage Comparison with 2015
Note
Number Percentage
Jan-Mar 2017 24,275 24.2% 12,725 20.7% Recruited in 2017
2016 38,162 38.0% 26,381 42.9% Recruited in 2015
2015 15,546 15.5% 6,857 11.1% Recruited in 2014
and 2013
Before 2015 22,494 22.4% 15,553 25.3% Recruited 2 years
before
Total 100,477 61,516
* High productivity agents refer to the agents with monthly regular premium of RMB 10K
• Development Strategy for 2017
Individual Life Insurance Business Review
41

As of the end of the first quarter of 2017, agents employed for 6 months in the existing teams accounted for 42%, and agents employed for 12 months accounted for 64%. The high proportion of new agents imposed pressure on basic management, and their increased productivity and effective retention require time and ongoing training
The growth of TPL’s individual insurance business is much higher than the growth of agent force; the agent force increased by 17% in 2016, and the premium increased by 39%; how to maintain the continuous improvement of productivity is the pressure we face
The new policies of the regulation from CIRC affects the design of new products. It is expected that the growth of premium in 2017 will depend on the increase of agency force and the total number of policies. In the first quarter of 2017, the number of new agents reached 101,000, accounting for 50% of the number of agents recruited in 2016
1. Opportunities and Challenges
42
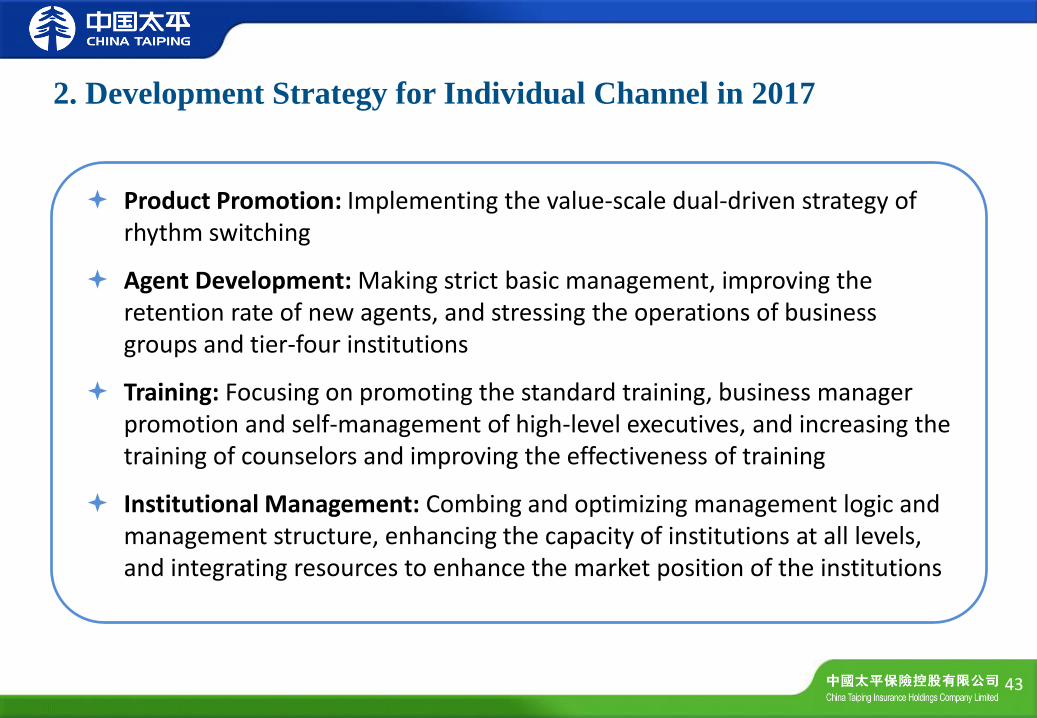
2. Development Strategy for Individual Channel in 2017
43
Product Promotion: Implementing the value-scale dual-driven strategy of rhythm switching
Agent Development: Making strict basic management, improving the retention rate of new agents, and stressing the operations of business groups and tier-four institutions
Training: Focusing on promoting the standard training, business manager promotion and self-management of high-level executives, and increasing the training of counselors and improving the effectiveness of training
Institutional Management: Combing and optimizing management logic and management structure, enhancing the capacity of institutions at all levels, and integrating resources to enhance the market position of the institutions

Product Promotion: Improving Product Switching
44
Continuously Improve the Mode of Switching and Alternating Operation of Health Products and Annuity Products
Drive two rounds of annuity products and two rounds of health products, and clarify the pace of business throughout the year in advance. At the same time focus on selling key products by relying on operation advantages of various types of projects
Attract Customers with Online and Offline Activities, and Help the Agents to Get Access to the Market As Soon As Possible
Manage the Alternation Between Old and New Products Combined with Regulatory Policy Requirements
Ensure the smooth delisting of old products and timely converge competitive new products in line with market demand combined with regulatory policy requirements, while holding the team's product training, and guiding the team to quickly adapt to sales of new products

45
Agent Development: Effective Growth of Agency Force Ensures Healthy,
Stable and Sustainable Development of Individual Business
Continue to Promote Effective Growth of Agency Force
Business managers are key force to promote the growth of individual business; continue to speed up promotion in 2017, and improve the number and quality of business groups. In the first quarter of 2017, the number of new business managers promoted was 9,184, accounting for 55% of the total promotion of 2016
Continue to Improve the “New Agent Retention System”
Without affecting the existing pre-service and orientation 135 training projects, the System focused on operating units of tier-four institutions by optimizing and transforming the link of new agents’ retaining; the focus is on the habit curing of new agents within 30 days; 310 marketing service units will be added in the System in 2017, and 149 service units were already added in the first quarter of 2017
Build a Multi-channel Sales Force Focusing on Individual Business and Supplemented by Sinopec Project and Service Marketing, so as to Enhance the Number and Quality of Agents

46
Training: Focusing on Retaining New Agents and Training Executives
Continuously Promote the Standard Training and Stabilize System Training Platform to Build the Basic Ecological Foundation for the Retention of New Comers
Strictly implement the induction training requirements for new agents (various channels); Insurance Agents Qualifying Examination APP was put into effect
Continuously Enhance the Business Managers’ Ability to Guide the Operation, and Continue to Promote Self-management through High-level Executive Management Seminars
Continuously improve the ability of the executives in guiding operations through promotion oral examination, MCA training and business manager training
Sales department training (building a new agent development platform in the business department)
Continue to Promote the Training of Internal Work Training Cadre
New agent auxiliary training is held for 640 people in 4 sessions in the year; in-service auxiliary training is held continuously
Strengthen Online Support, and Gradually Realize The “Rich, Visual, Audible, Interactive, and Integrated” Training Management Platform in Which Learning Management Can be Conducted
Optimize the existing training management and micro-classroom system, and enrich online courses; develop the live interactive feature and integrate online resources

47
Institutional management: Improve the institutional management
system and drive institutions to become bigger and stronger
According to The Company's Development Strategy and Institutional Development, Revise the Star Standard and Drive the Operating Units under Institutions to Comprehensively Develop with All Indicators Combing and optimizing management logic and management structure; in February the Approach to Meet Star Standard for Institutions was revised, and the Basic Law where the Approach is used for institutional assessment is vigorously promoted
Further Improve the Institutional Management System by Driving Systematic and Standardized Operation of the Institutions Facilitate the use of the Operating Manual of Tier-Four Institutions of TPL Individual Channel in the institutions; and examine responsible persons of Tier-Four Institutions on their understanding of the Manual
Improve the Training System of Management Cadres Hold senior management personnel training by classification and categories to improve their management capacity and overall quality

Develop more online and offline marketing support tools such as H5 page of the company's profile, claims report and customer service newspaper.
Mobile agent on-line self-service system
The Sales Support system APP builds agent insurance supermarket platform (business card, product introduction, insurance book, news center)
Make the revised version of Individual Insurance Morning Training by deepening and optimizing the contents and add new channels for optimization and dissemination (dual number, Corporate blog can be more targeted, safe and effective dissemination of internal training content)
48
3. Utilized Internet with Marketing Support Tools

• Business Development and Strategy
Bancasurrance Business Review
49

Bancassurance Business Development
Bancasurrance (RMB 100 million)
Jan-Mar 2017 YoY Growth Percentage Jan-May 2017
Single Premium 145.17 -16.3% 82.9% 145.41
Regular Premium 29.97 122.1% 17.1% 35.34
In the first quarter of 2017, Bancassurance took the initiative to adjust the business
structure by reducing single premium and increasing regular premium business
Single premiums decreased by 16.3% YoY while regular premiums increased by 122.1%,
accounting for 17.1% of total premium, with an increase of nearly 10 percentage
points YoY
50

Bancassurance Channel Structure
5.6
4.8 4.6
3.4
2.4
1.5 1.2
1.2
5.3
187%
93%
211%
222%
71%
12%
93%
47%
124%
0%
50%
100%
150%
200%
250%
0
1
2
3
4
5
6
ICBC CCB BOCOM BOC ABC CMB Industrial
Bank
SPDB Others
Jan-Mar 2016 Jan-Mar 2017 YoY Growth(RMB 100 million)
We had a substantial growth in regular business among the five major banks YoY, and the channel structure was significantly improved
51

Bancassurance Development Strategy for the Second Half of the Year
In accordance with the overall requirement that protection is the fundamental function of the insurance industry, speed up the transition to the protection business, adhere to value growth, and further expand the regular business
Deepen channel cooperation by strengthening the channel linkage, and focusing on key banks including ICBC, ABC, BOC, CCB and BOCOM; continue to promote precision marketing, and improve business proportion to achieve stability and increase of channel share and ranking
Innovate the mode of operation by improving and optimizing the existing mode of operation and improving the level of project operation and output efficiency to achieve accurate customer marketing and intensively farmed projects
Strengthen team building by making strict basic law assessment, strengthening cost control, and encouraging outstanding institutions to develop agency force; continue to promote the growth of high productivity agents with "Fortune 500" as the starting point
Expand business coverage by enhancing the classification and category management of institutions, and strive to build 100 tier-three institutions and improve the business coverage of tier-four institutions
Continue compliance management by strictly carrying out inspection and supervision in accordance with the requirements of regulatory authorities and resolutely investigating and dealing with the problem found and seriously implementing accountability
52

• 2017 First Quarter Sales Introduction
Jump Start Review
53

Individual Channel Focused on Value Growth; Long-term Protection
Business Growth Rate was Higher Than Overall Growth by Focusing on
Customers’ Health Protection Needs
17.0
45.1
Jan-Mar 2016 Jan-Mar 2017
+165%
(RMB 100 million)
Note: Long-term protection products refer to the products of illness insurance, accident insurance, term life insurance and whole life insurance with an insurance period of more than one year
In the first quarter of 2017,new business grew 69% YoY, of which long-term protection products grew 165%, which is higher than the overall growth. Compared with the first quarter of 2016, proportion of long-term protection products increased by 10 percentage points
Among long-term protection products, illness insurance sales accounted for nearly 90%. Will continue to focus on customers’ health protection needs and promote its normal operation
Long-term Protection Products FYP (2016vs2017)
54

Bancassurance Insists on Transformation Towards Value with Rapid
Growth of Regular Business. Proportion of 10-year and above Regular
Premiums is Stable, and Participating Products Still Dominate
Bancassurance FYP (2016 vs 2017)
13.5
30.0
Jan-Mar 2016 Jan-Mar 2017
+122%
(RMB 100 million)
Bancassurance Regular Products Structure
(Jan-Mar 2017)
64%
33%
3%
10 years and above
5-9 years
Others
In the first quarter of 2017, single premium business was steady but declined, and regular premium business was doubled compared to the same period in 2016; regular premium products were mainly long-term
For regular premium business, sales volume of ordinary products accounted for 35%, and participating products still dominate
55

• Product Strategy for 2017
Product Introduction
56

Focus on Customers’ Protection Needs and Support Collaborative Growth
of Business Scale and Value to Achieve Breakthrough Growth for Core
Value Business
Bancassurance Product
Individual Product
Support transformation towards value, match the operation of precision marketing projects and normal business model, classify customer base, and actively develop high-value regular products
Strengthen high value annuity regular products, shrink the size of single business, and supplement long-term protection products throughout the year
Focus on customers’ pension and health needs, constantly optimize the product structure, and support the coordinated development of regular premium and business value
Focus on annuity products in Jump Start and mid-year, continue to promote long-term protection products throughout the year, build worry-free series products, and help achieve agency force target
57

Thank you!
58

TPI
— P&C Business Review
59

P&C Business Development
60
Core Business Realized Sound Growth
In the first quarter of 2017, direct premiums written were RMB 4.66 billion; from Jan to May, direct premiums written were RMB 8.44 billion, and RMB 6.80 billion was motor insurance
Operating Efficiency Continued to Improve
In the complex and fluctuate market environment , realized underwriting profit in six consecutive years with continuous accelerated development
In-depth Practice of the Boutique Strategy
By the end or May 2017, the Group signed the contract to achieve premium income of RMB 630 million and customer cooperation coverage rate of 81.3%; comprehensive financial results were significant, property insurance sales through TPL increased by 43.7% YoY and the premium increase accounted for 47.6%. Promote customer-centric and technology-led product innovation "+ Internet" and conduct continuous research and application of insurance innovation brought about by new technologies of the Internet

Jan-May 2016Jan-May 2017Jan-Mar 2016Jan-Mar 2017
2.6
2.9
Jan-May 2016Jan-May 2017
1.5
1.9
Jan-Mar 2016Jan-Mar 2017
61
Adhere to the Principle of Core Business Outperforming the Market,
and Actively Fulfill the Responsibility as A Central Enterprise
Actively deal with the motor insurance marketization reform; as of the first quarter of 2017,
motor insurance premium was RMB 3.60 billion; by the end of May 2017, motor insurance premium was RMB 6.80 billion with an increase of 15.5% YoY, outperforming the market by 7.8pp
Make in-depth study of national strategies to accelerate the development of agricultural insurance, liability insurance and other policy insurance business; as of the first quarter of 2017, agricultural insurance and liability insurance business maintained rapid growth
Agriculture Insurance Premium Motor Insurance Premium
+ 26.7%
+ 11.5% +254.8% + 265.3%
(RMB 100 million)
4,285
Jan-May 2016Jan-May 2017
36.0
Jan-Mar 2016Jan-Mar 2017
+ 15.5% + 8.1%
68.0
58.9 33.3
1,173 757
2,686
Liability Insurance Premium (RMB 100 million) (RMB 10 thousand)

Accelerate Development with the Bottom Line of Maintaining
Underwriting Profit
62
Combined Ratio Direct Premiums Written
108.0
132.7
156.1
181.8
84.4
2013 2014 2015 2016 Jan-May
2017
99.9% 99.9% 99.8% 99.8%
2013 2014 2015 2016 Jan-May
2017
(RMB 100 million)

Jan-May 2016 Jan-May 2017
6.8
9.5
Jan-Mar 2016 Jan-Mar 2017
4.6
6.3
Jan-May 2016 Jan-May 2017
2.6
4.0
Jan-Mar 2016 Jan-Mar 2017
Develop the Boutique Strategy and Highlight Characteristics Business
The Group strategic costumer business effectively had break through signing the insurance project of the Hong Kong-Zhuhai-Macao Bridge of Zhuhai municipal government and the Kunming Metro Line 4 project of China Railway Group with a total premium income of RMB 3.8 million . Promote the CGN Singapore project to achieve breakthrough in the overseas strategic customer business
Property insurance sales through TPL continued to improve with a 43.2% growth YoY from Jan to May 2017
New progress has been made in the North American market. Successfully contacted with the major domestic reinsurer, and established an appointment sub-agreement in speeding up the cooperate with STARR
Linkage with Japan orderly advanced. A meeting was held to promote the insurance business of travel in Japan; a project team was set up, job objectives and responsibilities were clarified, and regular work meetings were held. Actively cooperate with the "cross-border" project development while studying the launch of we-chat service platform and products
63
Strategic Customer Business
Property Insurance Sales through TPL
+ 53.8% + 37.0%
+ 39.7% + 43.2% 16.9
11.8
(RMB 100 million)
(RMB 100 million)

Initiate Customer Management and Fully Embrace the Internet
Dock Internet giants, independently develop innovative products, and enhance pricing power through big data
Dock the Five Major Internet Giants
Carry out Big Data Experiments
Work with Ant Financial to carry out motor insurance data building and enhance motor insurance pricing ability; optimize the existing pricing model from human factor + big data accurate pricing, which is beneficial for TPI to establish stronger pricing advantage
Set up five team of Ant, Qunar, Baidu, Jingdong and Tencent to dock Internet giants, and become the backbone in the business expansion of network marketing for the company
Developed non-motor insurance network marketing products such as Alipay account security insurance, passenger accident insurance, RMB 3.99 aviation accident insurance, and parents anti-telecommunications fraud insurance
64
Adhere to The Strategy of "Product Innovation Driven"

P&C Development Strategy for 2017
65
Seize New Opportunities and Get off to a Good Start to Become Leader In the Second Tier of the Industry Take the preemptive opportunities in the market, and build up business development advantages. Promote
professional building of motor insurance channels, deepen strategic interaction and interconnection of P&C business, and strengthen innovation driven for accident & health insurance
Strive to develop overseas business, and actively coordinate with overseas subsidiaries. Strengthen the efforts to expand strategic customers, support domestic enterprises to expand overseas, and enhance coordination and interaction with overseas subsidiaries
Accelerate strategic business development, and implement characteristic business. Promote contract signing with group customers, build the organizational structure for development of worksite marketing, and develop agriculture insurance business steadily
Focus on the problem of claim ratio reduction and renewal, and comprehensively enhance cost-saving and profit-increasing. Strictly prohibit fraud cases, fully strengthen claim management, accelerate building of Internet and phone renewal platform, and establish a total-cost analysis system
Drive channel specialization, and implement the differentiated development strategy. Cross-selling Channel shall promote high quality growth , Group Channel shall promote team building, Sinopec Channel shall build new business foundation, Car Dealer Channel shall boost increase of renewal rate, Agent Channel shall advance transitional development, and Bancassurance Channel shall promote specialized operation
Intensify cost-saving and profit-increasing, and comprehensively upgrade service level. Improve the effectiveness of management team, enhance building of sales team, intensify management and control of expenses and costs, manage service evaluation ranking, and increase the information technology level
Optimize internal control of risks, and strengthen risk prevention management. Reinforce risk management, improve quality of auditing, inspection and rectification, and enhance compliance control ability building

Thank you !
66

China Taiping
— Investment
67

• Group Investment Introduction
Investment
68

69
Asset Size Rose Rapidly, and Asset Under Management of The Group
Reached the Level of RMB 700 billion
As of the end of May, insurance asset under management within the Group was RMB 403.6 billion, increased by 6.4% compared to the beginning of the year; third-party entrusted asset was RMB 309.4 billion, increased by 16.8% compared to the beginning of the year
0
1000
2000
3000
4000
5000
2012年 2013年 2014年 2015年 2016年 2017年5月
Asset Under Management with the Group
0
500
1000
1500
2000
2500
3000
3500
2012年 2013年 2014年 2015年 2016年 2017年5月
Third-party entrusted Asset
2012 2013 2014 2015 2016 May 2017 2012 2013 2014 2015 2016 May 2017

70
Bond asset and debt scheme jointly account for 60.2%, and constitute the main segments in asset allocation of the Group
Equity securities account for 8.1%. The latest industry data shows that the proportion of stocks and funds at the end of March was 12.7%
Asset Allocation is Positive and Steady, with the Debt Portfolio Covering
60.2% and Equity Portfolio Covering 8.1%
10%
45%
8%
15%
6%
4%
12%
Proportion of Main Asset Categories
现金存款及货币市场工
具
债券资产
权益类证券
债权计划
股权投资
投资性物业
其他金融产品
Cash deposit and instruments of money market
Bond assets
Equity securities
Debt Scheme
Equity investment
Investment property
Other financial products

71
Market Value Yield and Book Yield
As of the end of May, market value yield of investment assets of the Group surpassed that of the same period last year
Part of unrealized equity loss was realized and book yield was behind the same period last year, but the equity position structure has been optimized
2016年5月末 2017年5月末
Market Value Yield
-0.19%
2.17%
2016年5月末 2017年5月末
Book Yield
At 31 May 2016 At 31 May 2017 At 31 May 2016 At 31 May 2017

72
Traditional Assets Performed Differently. Bond Performance Surpassed
Market, while Stock Performance Lagged Behind
As of the end of May, the overall yield of trading and available-for-sale bond assets of Taiping Asset was above ChinaBond Total Wealth Index
As of the end of May, the overall yield of stock portfolio of Taiping Asset was below the Shanghai and Shenzhen 300 Total Return Index and the stock type publicly offered funds
Bond Investment Performance
Taiping Assets ChinaBond total
wealth Index
Stock Investment Performance
-1.7%
Taiping Assets Index of Stock
Funds
Shanghai and Shenzhen 300 Total
Return Index
-0.4%
5.8%
73
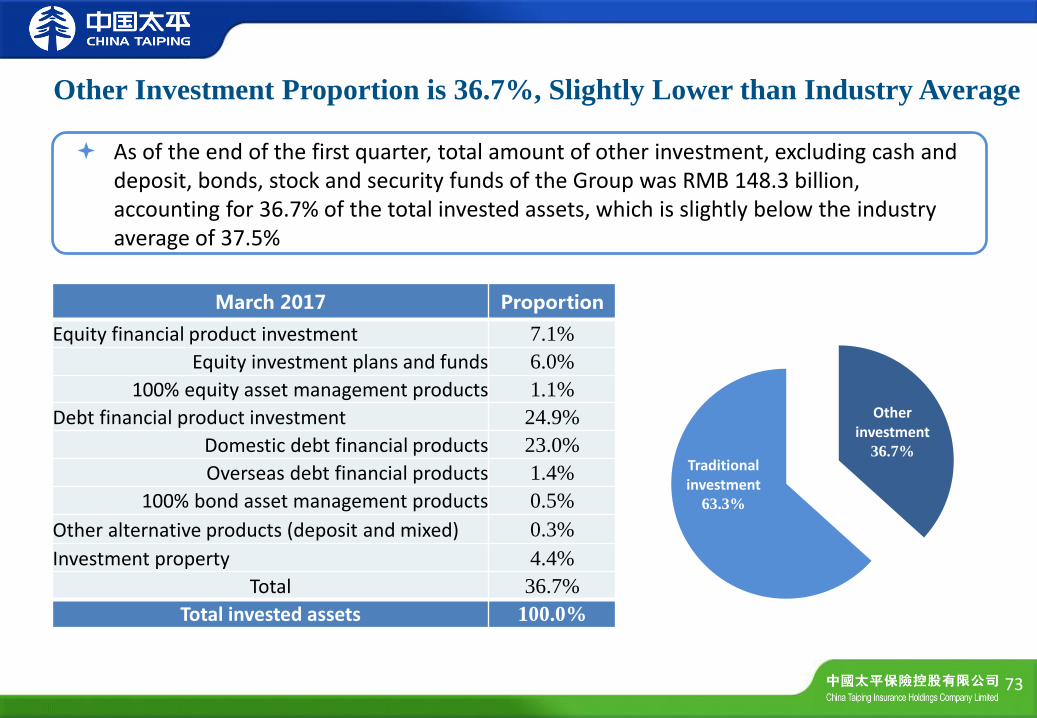
March 2017 Proportion
Equity financial product investment 7.1%
Equity investment plans and funds 6.0%
100% equity asset management products 1.1%
Debt financial product investment 24.9%
Domestic debt financial products 23.0%
Overseas debt financial products 1.4%
100% bond asset management products 0.5%
Other alternative products (deposit and mixed) 0.3%
Investment property 4.4%
Total 36.7%
Total invested assets 100.0%
Other Investment Proportion is 36.7%, Slightly Lower than Industry Average
As of the end of the first quarter, total amount of other investment, excluding cash and deposit, bonds, stock and security funds of the Group was RMB 148.3 billion, accounting for 36.7% of the total invested assets, which is slightly below the industry average of 37.5%
Other investment
36.7% Traditional investment
63.3%

35%
20%
17%
13%
7%
4% 3%
1%
地方国企及其他担保
准中央政府债/银行担保
免增信
大型企业担保
抵押/质押
优先劣后
其他
无增信
74
82.1%
6.2%
0.8% 10.8%
Debt Financial Products Ratings
AAA
AA+
AA
不适用 NA
Debt Financial Products Feature High Credit Rating and Credit
Enhancement Measures were Sound
As of the end of the first quarter, debt financial products within the Group have maintained high credit rating, of which AAA level products account for 82.1%, and AA+ and AA account for 7.0%. The remaining 10.8% of overseas fixed income funds and convertible debts does not apply
In terms of credit enhancement, quasi central government debts/bank guarantee and credit enhancement exempted products cover 37.2%, large-scale enterprise guarantee covers 13.0%, local SOE and other guarantee covers 34.6%, mortgage/pledge products 7.5%, and others 7.7%
Debt Financial Products Credit Enhancement
Local SOE and other guarantee Quasi-central Government Debts/Bank Guarantee Credit Enhancement Exempted
Large-scale Enterprise Guarantee
Mortgage/Pledge
Superior/Inferior
Others
No Credit Enhancement

75
Types of Other Investment Become Diversified Along with Development of
the Industry
As of the end of the first quarter, in the debt financial product investment, infrastructures and real estate investment jointly cover 41.0%, trust products cover 38.2%, asset management products 6.3%, special asset-backed plan 3.7%, and the overseas bond funds and convertible debts 10.8%
As of the end of the first quarter, in the debt financial product investment, real estate industry accounts for 26%, public utilities industry accounts for 21%, transportation industry for 19%, non-bank financial industry 14%, and the other industry 20%
38%
31%
10%
6%
4% 11%
Classification of Debt Financial Product Investment
信托
基础设施建设债权计划
房地产债权计划
资管产品
资产支持计划
境外债权基金与可转债
26%
21%
19%
14%
3% 3%
3%
Primary Industry Classification of Shenyin & Wanguo Securities Co., Ltd.
房地产 公用事业 交通运输 非银金融 建筑材料 商业贸易 综合 采掘 建筑装饰 航运 医疗生物 医药生物
Trust
Infrastructure Construction Debt Scheme
Real Estate Debt Scheme
Asset Management Products
Asset-backed Plan
Overseas Bond Funds and Convertible Debts
Real Estate
Public Utilities Industry
Transportation Industry
Non-bank Financial Industry
Construction Material
Commercial Trade
Comprehensive
Extractive Industry
Architectural Ornament
Shipping
Bio-medicine
Bio-pharmacy

76
Center on National Strategies, Correspond to the Core Insurance Business,
and Innovate Investment Form
Center on the national strategies to make alternative investment innovation, actively explores in terms of public-private partnership (PPP), the Belt and Road, senior health service and supply-side reform and has obtained favorable returns and brand effect.
PPP
Taiping-Shanghai
Construction Group PPP
Industry Fund Project
The Belt and
Road
Silk Road Prosperity
Taiping Fund
Senior Health Service
Taiping Shanghai “Wutong Renjia” senior
housing community
Taiping Yifang Health
Pension Industry Equity
Investment Fund
Taiping –Watermark
Joint Venture
Support Supply-side Reform
CICO-Taiping Infrastructure
Equity Investment
Fund
Taiping-Qinghai
Supply-side Reform
Industry Fund Equity
Investment Plan

The Group invests in properties mainly in the first-tier cities of Beijing, Shanghai and Shenzhen, the second-tier cities of Suzhou, Nanning and other economically developed ones with growth potential, as well as Hong Kong and Macau
Area and quality for most of the projects are superior, and rent operation situation is well
Yield of the Group’s property investment for the past five years were high and steady, and the compound yield reached 11.13%
Projects Locations Business types
Main projects
completed
Shanghai Taiping Financial Tower
Lujiazui, Shanghai Office building
Hong Kong Taiping Tower
Causeway Bay, Hongkong
Office building
The Exchange Building Beijing
China World Tower Office building
Shenzhen Taiping Financial Tower
Futian Central District, Shenzhen
Office building
Longbi Industrial Zone Bantian, Shenzhen Industry
Main projects under
construction
Beijing Guangan Center Beijing Financial
Street Office building
Suzhou Taiping Financial Tower
Jinji Lake, Suzhou Office building
Nanning Taiping Financial Tower
Wuxiang New District, Nanning
Office building
Shanghai Zhoupu Old-Senior Service Communities
Zhoupu, Pudong District, Shanghai
Senior service community
77
Real Estate Investment Focuses on Core Cities and Core Areas

• Investment Strategy for 2017
Investment
78

Global Economy Recovers Slowly, and China’s Economy has Maintained
Steady Performance and Made Positive Advances
79
The global economy recovers slowly. International Monetary Fund (IMF) forecasts that global GDP growth rate is expected to rise from 3.1% in 2016 to 3.4% in 2017. However, emergence of trade protectionism and accumulation of geopolitical conflict risk factors makes the global economy face with more risks. US economy grew well. In May 2017, the US Markit manufacturing PMI registered 52.7, and the US service industry PMI registered 53.6. Unemployment rate of the United States fell to a 16-year low of 4.3%; core CPI registered 1.7%
The Chinese economy shows an overall stable performance with good momentum for growth. In the first five months, Chinese economy showed four characteristics: stable production and demand, continuously improving employment, moderate inflation, and improved international balance of payments. Total retail sales of consumer goods increased by 10.7%, remaining as the main engine of economic growth. Growth rate of fixed asset investment registered 8.6%, higher than last year’s annual growth rate of 8.1%. As for external demand, exports in May increased by 15.5%, 1.2 percentage points higher MoM. In the first five month, the number of newly increased urban jobs was 5.99 million, completing 54.4% of the annual target in this regard; and the unemployment rate was less than 5%. CPI rose moderately by 1.5% YoY, up 0.3% MoM. In May, trade surplus totaled RMB 281.6 billion. Foreign currency reserves rebounded for four consecutive months, reaching US$ 3,053.6 billion at the end of May. The exchange rate is basically stable

Monetary Policy of China is “Steady and Neutral”, and Financial Regulation
Pays More Attention on Risk Prevention
80
Monetary Policy for the US presents a combination of “interest rate increase + balance sheet reduction”. On June 15, the Federal Reserve increased interest rate by 25bp to 1.25%, and increased discount rate by 25bp to 1.75%. The Fed restated that it expected that the economy would guarantee FOMC’s steady rate hike. Meanwhile, it is expected that reduction of balance sheet will start in 2017
Monetary Policy of China is “Steady and Neutral”, but tightening in essence. Firstly, interest rate increase of USA poses a pressure on China’s exchange rate and foreign exchange reserves. Secondly, China’s economy growth has provided space for tightening of monetary policy. Thirdly, risk prevention and deleveraging becomes the emphasis of the central government
A series of financial regulation policies have been adopted for deleveraging. The Central Bank has raised the policy rates: On January 24, 2017, the Central Bank raised MLF rates by 10bp, and on February 3, 2017, it increased reverse repo rates by 10bp, which was the first time to raise policy rates since 2012. The CBRC deleveraged in the banking system, and issued documents to remove chaotic phenomenon of "three violations", "three arbitrages" and "four misconducts", so as to restrain asset bubbles. The CIRC issued the important "1 + 4" series of documents to strengthen risk prevention, intensify regulation, crack down illegal activities, regulate market chaos, and to maintain steady and healthy industrial development

Strategy for Bond Investment in 2017: Increase Allocation and Optimize
Structure
81
Increase debt investment allocation. The yield to maturity of domestic and overseas bonds rise, and the allocation value has been obviously improved compared with that in the last year. Enlarge the allocation proportion of bond asset
Optimize debt allocation structure. Optimize maturity structure, grasp the trend of yield curve, make proper allocation of long, medium and short duration, and effectively cope with fluctuation of interest rate; improve credit structure, make proper allocation of national debts and corporate debts with different credit level, and take efforts to increase investment yield; optimize accounting structure, make proper allocation of held-to-maturity and available-for-sale bond, and balance requirements for book yield and the market value yield requirements
Take strict precautions against credit default risk. Regularly check existing bond investment, and take strict precautions against credit default risk. Perform credit review and risk investigation selectively in terms of credit rating, industrial distribution and regional distribution, develop an emergency response plan, implement accountability, and enhance post-investment management and auditing

82
Under the new accounting standard, if the equity instrument is included in “Fair value through other comprehensive income (FVOCI)”, the book yield will be systematically undervalued relative to the market value yield for a long term since “the income and loss is maintained in other comprehensive income (i.e. re-classification not available)”. Hence, most of the equity instruments will be included in “Financial liabilities measured at fair value and whose movements are included in the profit and loss of the current period (FVPL)
Adhere to value investment philosophy. The stock allocation style will change obviously when the fair value change is included in the profit and loss of the current period. More importance will be attached to value investment, long term investment, prudent investment, and blue chip stocks with good fundamentals, strong profitability and high dividend level
Seize opportunities for long term equity investment. Give full play to advantages of large volume, stable supply and long term of insurance funds, and seize opportunities for long term equity investment in the listed and non-listed companies with good profitability and dividends payment capacity. Under the premise of friendly cooperation, make efforts to realize accrediting at board of directors and equity method accounting, and obtain stable and sound investment yield
Strategy for Stock Investment in 2017: Adhere to Value Investment, and
Seize Opportunities For Long Term Equity Investment

Strategies for Alternative and Real Estate Investment in 2017: Follow National
Strategies and Grasp Key Points of Investment
83
Alternative Investment should actively respond to national strategies, and support industry transformation and upgrading. Firstly, give full play to advantages of integrated financial layout and cross-border business of the Group, and keep in line with “the Belt and Road” strategy, coordinated development of Beijing, Tianjin and Hebei Province, and the Yangtze River Economic Belt development strategy in multiple manners. Secondly, actively invest in major national infrastructures, significant livelihood projects and new type urbanization, energetically serve China capital enterprises to “going globally” and overseas customers, and strive to become important ties for cross-border investment and financing cooperation. Thirdly, Seek quality targets in senior service, health service, medical treatment service, automobile industry chain and other segments by virtue of the core insurance business of the Group
Real estate investment should keep in step with the national policies, and pay close attention to regional opportunities. Domestically, focus on regions with significant development potential in future, e.g. Xiongan New District, Guangdong-Hongkong-Macau Greater Bay Area, Qianhai Shenzhen-Hong Kong Modern Service Industry Cooperation Zone, and China (Hangzhou) Cross-border E-commerce Comprehensive Pilot Area. Mature properties in developed countries and regions with active transaction are the main focus of overseas real estate investment

Strengthen building of credit rating ability. Accelerate establishment of the unified credit rating center of the Group, and further intensify the overall credit rating ability of the Group
Enhance investigation of existing asset risk. Set up a post-investment risk early-warning mechanism combining on-site inspection and off-site supervision, regularly track and inspect the investment projects, and organize special investigation for various risks on an unscheduled basis. Lay emphasis on penetration type management, and discover, cope with and solve the risks as early as possible. Results for investigation of Alternative projects, credit debt and finance rent showed that capital was invested prudently and steadily, comply with regulations, asset quality is sound, and total risk is under control
Optimize investment risk disposal mechanism. For projects with potential risk, stick to the principle of “one company one policy”. Implement credit enhancement by guarantee and pledge, increasing backed asset, improving obligations of guarantor or re-purchase person, seeking government support. Perform investment risk disposal by taking actions of investment halting, asset preservation, requesting the guarantor or re-purchase person to execute responsibilities, legal action and others
84
Investment Protection Measures in 2017: Establish a risk prevention and
management system covering pre-investment, in-process and post-
investment stages

China Taiping
—Featured Highlights
85

• Impacts of Interest Rate Upside Environment and Countermeasures
Featured Highlights
86
Flat Upside Trend of Yield Curve
87
数据来源:wind资讯
2017-5-31 2016-6-30
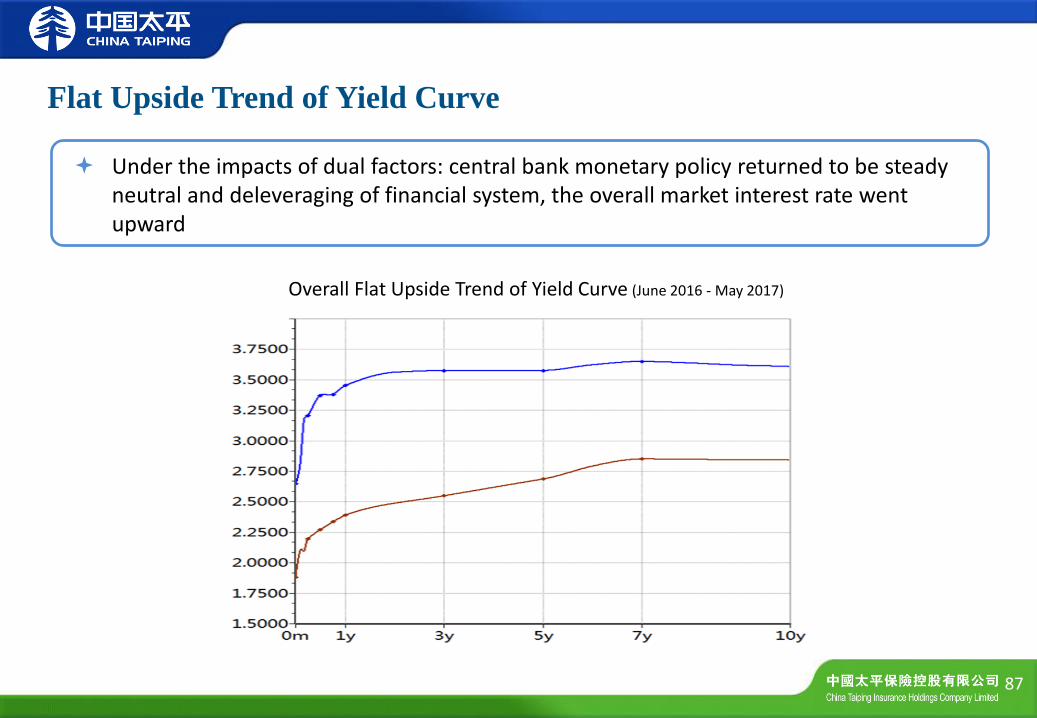
Under the impacts of dual factors: central bank monetary policy returned to be steady neutral and deleveraging of financial system, the overall market interest rate went upward
Overall Flat Upside Trend of Yield Curve (June 2016 - May 2017)

1.5
2.0
2.5
3.0
3.5
4.0
中债国债到期收益率:1年 中债国债到期收益率:10年 Yield to Maturity of China Bond
Treasury Bond: 1-year Yield to Maturity of China Bond Treasury Bond: 10-year
Flat Upside Trend of Yield Curve
88
2.0
2.5
3.0
3.5
4.0
4.5
5.0
5.5
2016-0
1
2016-0
2
2016-0
3
2016-0
4
2016-0
5
2016-0
6
2016-0
7
2016-0
8
2016-0
9
2016-1
0
2016-1
1
2016-1
2
2017-0
1
2017-0
2
2017-0
3
2017-0
4
2017-0
5
银行间质押式回购加权利率:7天 中债国开债到期收益率:5年 Weighted Interest Rate of Interbank Pledge-style Repo: 7-day
Yield to Maturity of China Bond Treasury Bond: 5-year
However, as real economy was still weak, yield to maturity of long-term bond rose to a limited extent, the yield curve became more flat, and term spread narrowed significantly
Term Spread Narrowed Significantly (10-year Treasury Bond – 1-year Treasury Bond Yield)
Interest Rate Volatility Increased, and Repo Rate was Sometimes Higher than Interest Rate of 5-year CBD Bond

Credit Spread Widened Significantly
89
0.4
0.6
0.8
1.0
1.2
1.4
1.6
Overall upside of interest rate and lower risk appetite of institutional investors made credit spread of AAA corporate bond yield and treasury bond yield widen significantly, which was beneficial for improving the return of insurance fund
The Overall Upward Trend in Interest Rates, Coupled with Lower Risk Appetite, Resulted in a Significant Increase in Credit Spreads
(Yield of 10-year AAA Corporate Debt - Treasury Bond)
The Impacts of Current Interest Rate Environment and Countermeasures
90
The overall impact of interest rate upside on insurance company was positive. It was mainly because that the liability duration is longer than asset duration in insurance companies. In the interest rate upside cycle, return on reinvestment at maturity was high, and interest spread improves
In early stage of interest rate upside, it had some impacts on the balance sheet for insurance company. These impacts mainly included that 750-day moving average for the yield of treasury bond, which is applicable for calculating reserve, was still lowering, reserve provisioning was still increasing, while fair value of available-for-sale existing bond was decreasing. But such impacts will change from negative to positive in the late stage of interest rate upside
The impacts on income statement for insurance company will be both positive and negative, which will be dominated by positive impact on the whole. The reserve provision on liability side is likely to increase, but yield of held-to-maturity fix income assets for new money will rise. Decrease in the fair value of available-for-sale assets is only recognized in “Other Consolidated Gains And Losses” in balance sheet rather than be recognized in income statement
The Impacts of Current Interest Rate Environment and Countermeasures
(Con’d)
91
Grasp opportunities from high volatility of market interest rates, and allocate at peak points. Improve the forecasting ability for interest rate trends, grasp the inflection point in short-term trend and long-term trend, increase the allocation proportion of held-to-maturity assets with new and reinvesting funds, and icrease investment income.
Build a balanced term structure, and make comprehensive balancing of current income and long-term value. On the basis of accurate judgment on the mid/long-term interest rate trends, make preparation for proper term structure of fix income assets, and avoid the allocation of excessive long-term bonds under the pursuit of short-term book profits in early stage of the interest rate upside
Flexibly adjust credit structure of fix income assets, and increase investment income. Take advantage of the characteristics of rising credit spreads, and make reasonable adjustment for credit distribution of the bonds above investment rating. Appropriately allocate in credit debt and increase investment income on the basis of further strengthening of the Group's credit risk prevention capacity

Thank you !
92
• Implication of IFRS 9 & IFRS 17
Featured Highlights
93

1. IFRS9 and IFRS17
94
IFRS9-Financial Instruments: 2014 issued, effective on 1 Jan 2018
Insurance companies which meet the requirements could delay the execution of
IFRS 9 to 2021
On 31 Mar 2017, MOF of PRC issued three CAS for financial instruments. As with
IFRS, insurance companies which meet the requirements could delay the execution
to 2021
IFRS17-Insurance Contracts: 2017 issued, effective on 1 Jan 2021
When will CAS of insurance contracts be issued?

2.1 IFRS9 Category: How to Classify
95
Could financial assets be classified as below if our purpose and intention of holding the assets are unchanged:
HFT FVPL All assets
AFS
FVOCI
LAR
HTM AMC All assets
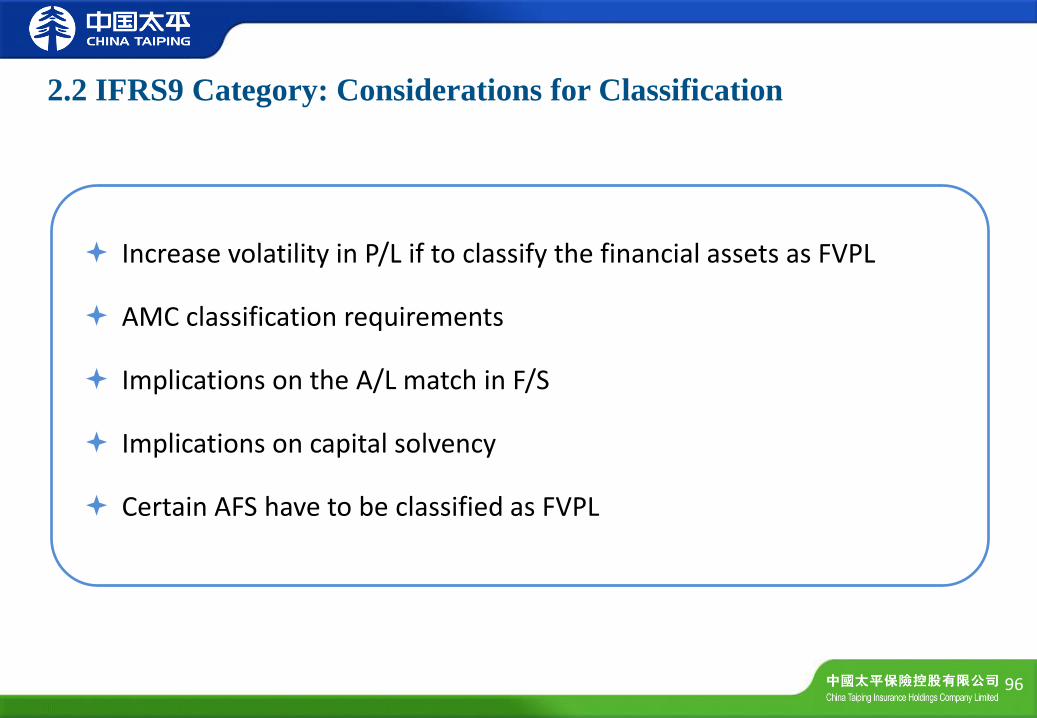
2.2 IFRS9 Category: Considerations for Classification
96
Increase volatility in P/L if to classify the financial assets as FVPL
AMC classification requirements
Implications on the A/L match in F/S
Implications on capital solvency
Certain AFS have to be classified as FVPL

2.3 IFRS9 Classification: Equity Instruments
97
Equity instruments are measured at fair value
“FVOCI-equity instruments”: Given low dividend yield ratio, how to
meet equity investment’s high return expectation in P/L?
When equity instrument investments could not be exempted from the
cost measurement, how to evaluate FV of the non-listed equity
investments reasonably?

2.4 IFRS9 Classification: Debt Instruments
98
Debt instrument investments: the business model and the contractual
cash flow characteristics for FVOCI and AMC should be assessed
Some structured and non-standard investments may need to be
classified as FVPL
When requirements met, FVOCI would be preferred classification for
P/L and A/L measurement

2.5 IFRS9 Impairment: Single Model
99
Impairment for non-FVPL debt instrument only, with Single Expected Credit Loss Model
Investment return and performance evaluation:impairment recognition timing, 12-month expected loss and life cycle expected credit loss
“FVOCI-debt instruments”recognize the impairment provision, and the profit/loss on the impairment is recognized in current period’s income statement

2.6 IFRS9 Impairment: Expected credit loss model
100
Difficulties in building up expected credit loss model
Information & data on the macro-economic forecast
Low asset amounts, transaction volume and data fineness
Insurance companies lack complete credit risk structure, control
process and historical data, unlike banks

2.7 IFRS17 Implications: Information Providers and Users
101
Information providers
Different F/S users
Comprehensive Income Statement
Insurance contract revenue X
Losses and expenses (X)
Underwriting profit X
Investment income X
Insurance financial income (X)
Investment profit X
Other profit X
Income tax (X)
Profit after tax X
Other comprehensive income (X)
Comprehensive income X

2.8 IFRS17 Implications: Professional Judgment and Earning
Management
102
No shadow accounting, changes in actuarial estimate (non-market) adjust to CSM instead of P/L
Should effect of changes in discount rate and other financial risks go to P/L or OCI?
Financial assets and insurance contractual liabilities are not matched: discount rate changes, market price fluctuation, timing difference on the recognition of assets and liabilities changes
Implications of actuarial assumptions & IFRS17 transitions

2.9 IFRS9 and IFRS17: ALM and Solvency
103
Financial asset classification and liability measurement affect NAV、P/L and ALM
Under C-ROSS, financial asset classification affect actual capital & minimal capital, C-ROSS rules should be revised
If IFRS9 and IFRS17 are not implemented simultaneously, asset/liability’s measurement and ALM would be more difficult

2.10 IFRS9 and IFRS17 Implications: Others
104
Asset reclassification’s impact on the strategic assets allocation and capital market
Social intermediaries and media
Small companies how to implement
Knowledge and technical skills for the insurance companies' financial staff

3.1 How to Implement
105
Seek for understanding and support: company’s senior management and outside consultancy firms
Form the implementation team: classification and measurement, insurance contract, impairment model, and IT system
Knowledge sharing: knowledge and technical training
Expertise selection and training: actuary, investment, IT and financial compound talents
Financial statement parallel disclosure: financial statement and tax report, regulatory report and internal management report

3.2 Implementation Time: the Year of 2021
106
Analysis, assessment and planning
Project teams formation: include the below sub-teams in 2018:
(1) Asset classification and measurement (2) Asset impairment model (3) Insurance liabilities measurement (4) Information system reform
Implementation and improvement: process and information systems update in 2019 and 2020, and implementation in 2021

Thank you !
107

Q&A
108