China Seafood Industry Report - Amazon S3s3.amazonaws.com/zanran_storage/ Seafood Industry Report -...
49
China Seafood Industry Report Glitnir Seafood Team November 2006
-
Upload
phungtuong -
Category
Documents
-
view
227 -
download
0
Transcript of China Seafood Industry Report - Amazon S3s3.amazonaws.com/zanran_storage/ Seafood Industry Report -...

China Seafood Industry Report
Glitnir Seafood Team
November 2006

Glitnir Seafood Industry Report - China
2
Contents
• Foreword and Report’s Main Findings ............................................... 3 - 4
• China – Investment Considerations .................................................. 5
• China Overview ............................................................................. 6 - 9
• China – Seafood Industry
1) Seafood Production ............................................................ 10 - 192) Seafood Processing ............................................................ 20 - 223) Seafood Consumption ........................................................ 23 - 264) Seafood Sales and Trade .................................................... 27 - 32
• Investment Opportunity in Focus
5) Tilapia Culture & Processing ................................................ 33 - 40
• Glitnir Seafood Stockwatch ............................................................. 41 - 42
• Glitnir Bank – General Information .................................................. 43 - 44
• Glitnir Bank – Global Seafood Team ................................................. 45 - 47

Glitnir Seafood Industry Report - China
3
Foreword
Dear Reader,
It is our pleasure to present the latest issue of Glitnir's Seafood Industry Report. In this issue we focus on the Seafood Industry in China. We are now in our third year of publication and are grateful for the good feedback we have received from our industry partners. We will issue 5 reports altogether this year, focusing on one country or region in each report.
In March 2006 Íslandsbanki (ISB) became Glitnir in a global group rebranding, unifying our national and international operations under one brand.
In China, fish is a sign of affluence. As one decade of marvelous economic growth brings China unprecedented prosperity, its significance in the global seafood industry has also reached a new height. Today, China is by far the world’s largest supplier of aquatic products, both by means of capture and aquaculture. At the same time, China is also one of the most important consumer markets for seafood, with a fast growing appetite for exotic and high-end seafood products. Its seafood processing industry continues to attract substantial investments from around the world. In short, the vastness of Chinese seafood industry presents many opportunities to foreign investors, in virtually all of its sectors. This report aims to give an analytical overview of the current Chinese seafood industry and present our understanding of its likely future developments.
We trust you find this report of benefit. We at Glitnir are proud of our strong team of seafood industry expertsand look forward to working with you in our quest to make the seafood industry even more dynamic, efficient and profitable.
You can contact the seafood team via [email protected] and www.glitnir.is/seafood
Best regards,
Glitnir Seafood Team
Glitnir Seafood Industry Report - China
4
Main Findings
• China is the largest producer of seafood in the world, representing some 35% of the total global seafood production.
• Freshwater and seawater species represent 44% and 56%, respectively of all aquatic production in China.
• Total aquatic production in China stood at 49 MMT in 2004, approx. 64% of this volume comes from aquaculture farming. This makes China the largest aquaculture nation in the world and the only country in the world where farmed fish production exceeds wild catch. In 2004 farmed freshwater species represented 59% of all farming in China while seawater species accounted for 41%.
• Main farming species are shellfish (seawater) and carp (freshwater).
• Shandong province receives the largest portion of foreign investment in seafood processing, the majority of which comes from Japan and Korea.
• Japan is the major export destination for Chinese aquatic product exports, taking more than half of all China’s seafood exports in recent years.
• All three sectors of the Chinese food market (retail, wholesale and foodservice) has experienced significant growth in recent years and we believe that this development will continue as purchasing power increases.
• Seafood consumption is expected to increase substantially in coming years. Seafood consumption in China was 25 kg per capita in 2004 and is expected to reach 36 kg per capita in 2020.
• Looking into the future, tilapia is likely to surpass other cultured species in importance.
• Production of tilapia worldwide is likely to expand robustly in coming years, as a result of strong investment in that sector.
• China continues to be the world’s main producer of tilapia and the main export market for Chinese tilapia is the U.S.

Glitnir Seafood Industry Report - China
5
Investment in the Chinese Seafood Industry
The purpose of Glitnir’s China Seafood Report is to assist our current and potential clients in creating value by making sound investment decisions in the seafood industry in China. The value-chain of the industry is shown below:
Supply of RawMaterials
Catch / Culture
ProcessingPrimary / Secondary
Distribution Trading /
Import & Export
RetailConsumers / Marketing
& Sales
A business may choose to devote its effort to one, several or all of the sectors in this chain. A sound investment decision, however, must always be based on a clear understanding of each sector in which the value is created. The first part of the Report is dedicated to this purpose. It provides a general overview of the development and current status in aquatic catch and culture, seafood processing, distribution and retail in China.
Based on this understanding, a section in this Report named “Investment Opportunity in Focus” aims to identify potential investment opportunities in various sectors of the Chinese seafood industry. In each issue, Glitnir’sChina Seafood Report focuses on different investment potentials in the industry. In this issue, the focus is on the culture and processing of tilapia in China.

Glitnir Seafood Industry Report - China
6
China Overview

Glitnir Seafood Industry Report - China
7
Economy at a Glance
• Area: 9,596,960 sq km
• Population: 1,313,973,713 (July 2006 est.)
• Administrative Divisions: 23 provinces, 5 autonomous regions, and 4 municipalities
• GDP (PPP): $8.859 trillion (2005 est.) – Ranked the second in the world
• GDP composition by sector: agriculture: 12.5%, industry: 47.3%, services: 40.3%
• GDP per capita: $6,800 (2005 est.), ranked 117th in the world
• Inflation Rate (Consumer Prices): 1.8% (Q2 2006)
• Unemployment: 9% official registered unemployment in urban areas in 2004.
• Exchange Rate: CNY per USD – 7.98 (2006e) 8.1943 (2005), 8.2768 (2004), 8.277 (2003), 8.277 (2002), 8.2771 (2001)
• Real GDP growth (%): 10.7 (2006e), 9.9 (2005)
• Country risk rating (EIU CRS)*: Sovereign (BBB stable) Currency (BBB stable), Banking Sector (B stable), Political (B),Economic structure (BBB)
• Foreign trade ($m Q2 2006): export fob 231,360; import cif193,396
• FDI ($bn): 14.2 (Q2 2006), 14.3 (Q1 2006), 17.1 (Q4 2005), 14.7 (Q3 2005), 15.2 (Q2 2005), 13.4 (Q1 2005) Source: CIA World Factbook, the EIU
*the Economist Intelligence Unit Country Risk Services

Glitnir Seafood Industry Report - China
8
Recent Economic Development
• Central bank introduced flexibility to the RMB in 2005 allowing its appreciation against major currencies.
• Shift of focus starting in 2006 from an investment-driven economy to a consumption-driven one.
Looming fears of overinvestment still present
- Investment partially boosted by rise in money supply and thus in the available funds for lending.
- Efforts to curb overheating such as interest rate & reserve requirement hikes have been unsuccessful.
Fixed asset investment in real estate slowed although rebound in total FAI has been led by investment in manufacturing (especially consumer goods), natural resource processing and export-oriented industries.
Household consumption on slow but steady rise.
• Transition from power intensive industrial focus to increased emphasis on the service sector both in terms of the sector’s market share in the economy and employment.
• Inflation and interest rates on the rise but expected to stay low.
• Increasing emphasis on quality of growth at the expense of the growth rate for the coming years.
Emphasis on strengthening structure rather than increasing size of industries (increasing efficiency).
Heavier funding towards research and development to encourage technological innovation.
• Concentration of investment in East China begins gradual shift to Central and Western China.
52 55 59 64 7187
108118
127142
166
223
0
50
100
150
200
250
2000 2001 2002 2003 2004 20050
1
2
3
4
5
6
7
8Household Consumption GDP FDI
2000-2005 GDP, FDI & Consumption (USD 10bn)
0%
5%
10%
15%
20%
25%
30%
35%
40%
1992 1994 1996 1998 2000 2002 2004
Retail Sales of Consumer Goods Living Exp Consumption
1992-2004 Growth Rate of Consumption (Value)

Glitnir Seafood Industry Report - China
9
-
5
10
15
20
25
30
35
40
45
50
1980
1981
1982
1983
1984
1985
1986
1987
1988
1989
1990
1991
1992
1993
1994
1995
1996
1997
1998
1999
2000
2001
2002
2003
2004
Mill
ions
Inland waters Marine waters
Seafood Giant of the World
-
5
10
15
20
25
30
35
40
45
50
China Peru Indoesia Chile India Japan USA Thailand Norway Iceland Canada
Mill
ions
Capture Aquaculture
2004 World’s Aquatic Supply (in million tonnes)
Source: FOA Figis database
1980 – 2004 Growth in China’s Aquatic Production
• China remains by far the largest producer of seafood in the world, representing some 35% of the total global seafood production.
• The country has seen a rapid growth in aquatic production in the last 25 years, averaging an annual growth rate of 15.22% from 1980 – 2004.
• Total aquatic production in China stood at 49 MMT in 2004, approx. 64% of this volume comes from aquaculture farming. This makes China the largest aquaculture nation in the world and the only country in the world where farmed fish production exceeds wild catch.
• Fish farming has grown more rapidly in recent years, at a CAGR of 6% from 1999 to 2004.
Glitnir Seafood Industry Report - China
10
1) China Seafood Production
Supply of RawMaterials
Catch / Culture
ProcessingPrimary / Secondary
Distribution Trading /
Import & Export
RetailConsumers / Marketing
& Sales

Glitnir Seafood Industry Report - China
11
China’s Aquatic Production
Seaw ater Products
56%
Freshw ater Products
44%
Wild Capture36%
Aquaculture64%
• Total aquatic production for 2004 was 49 million tonnes, up by 4.2% over the year before. The industry estimates the similar growth rate for 2005 and 2006. Between 2001 and 2004, the growth rate averaged 5.3%.
• Facing depleting wild fish stocks and serious environmental damages resulted from over fishing, the Chinese government continues to restrict marine and inland fishery and focus on development of aquaculture.
• Fresh and seawater culture production increased by 6.6% and 5.1% respectively in 2004.
• Seawater catch increased by 1.31% in 2004. Freshwater catch, however, decreased by 1.72%.
• Seawater fish output decreased by 0.76%, yet freshwater fish output increased 5.53%.
Source: USDA Foreign Agricultural Services GAIN Report 2005
2001 – 2005 Growth in Wild Capture and Aquaculture (in million tonnes)
2004 Breakdown of China’s Aquatic Production
Seaw ater Catch29%
Seaw ater Culture26%
Freshw ater Catch7%
Freshw ater Culture38%
17 17 17 17 17
29 27
30 32
34
-
5
10
15
20
25
30
35
40
2001 2002 2003 2004 2005
Mill
ions
Wild Capture Aquaculture

Glitnir Seafood Industry Report - China
12
Shandong Province – the Largest in SeafoodIn 2004
No.1 Total Aquatic Production: Shandong Province (7.2 million tonnes, 6.1 million tonnes from seawaters and 1.1 million tonnes from freshwaters).
No.1 Seawater Catch: Zhejiang Province (3.2 million tonnes).
No. 1 Freshwater Catch: Hubei Province (393 thousand tonnes).
No. 1 Seawater Culture: Shandong Province (3.4 million tonnes).
No. 1 Freshwater Culture: Guangdong Province (2.7 million tonnes).
0,9
4,03,7
4,9
1,7
5,9
1,6
7,2
3,0
1,7
6,6
2,7
1,4
0
1
2
3
4
5
6
7
8
Hebei
Liaoning
Jiangsu
Zhejian
g
Anhui
Fujian
Jiangxi
Shandong
Hubei
Hunan
Guangdo
ngGuan
gxiHain
an
mill
ion
tonn
es
2004 Top Regions in Aquatic Production(in million tonnes)
Source: Ministry of Agriculture, China

Glitnir Seafood Industry Report - China
13
Wild Capture and Marine Resources
• There are over 1700 kinds of fishes and about 300 kinds of economically exploitable fishes.
• In addition, there are about 2000 kinds of seaweeds, 300 kinds of shrimp and crabs, and 200 kinds of economically exploitable molluscs.
• China’s natural marine resource is mainly divided among three sea areas.
Yellow Sea & Bohai Gulf AreaEast China Sea AreaSouth China Sea Area
Freshwate Catch; 14,29%
South China Sea; 21,29%
East China Sea; 29,34%
Yellow Sea; 18,73%
Bohai Gulf; 7,39%
Others; 8,96%
Source: USDA Foreign Agricultural Services GAIN Report 2005
2004 Distribution of Wild Capture in China

Glitnir Seafood Industry Report - China
14
Decreasing Output in Seawater Catch
2001-2004 Wild Capture in Yellow Sea & Bohai Gulf (in ‘000 tonnes)
Yellow Sea & Bohai Gulf
• Small yellow-fin tuna
• Ling
• Pacific herring
• Prawn
• Hair shrimp
• Jellyfish
• Kelp
Source: USDA Foreign Agricultural Services GAIN Report 2005
2001-2004 Wild Capture in East China Sea (in ‘000 tonnes)
East China Sea
• Hairtail
• Big yellow-fin tuna
• Small yellow-fin tuna
• Cuttle fish
• Pomfret
• Moray
• Shuttle crab
-
500
1.000
1.500
2.000
2.500
3.000
3.500
2001 2002 2003 2004
Thou
sand
Ton
nes
0%
5%
10%
15%
20%
25%
Bohai Gulf Yellow Sea Bohai Gulf % of total catch Yellow Sea % of total catch
4.700
4.800
4.900
5.000
5.100
5.200
5.300
5.400
5.500
2001 2002 2003 2004
Thou
sand
Ton
nes
27%
28%
29%
30%
31%
32%
33%
East China Sea East China Sea % of total catch
Glitnir Seafood Industry Report - China
15
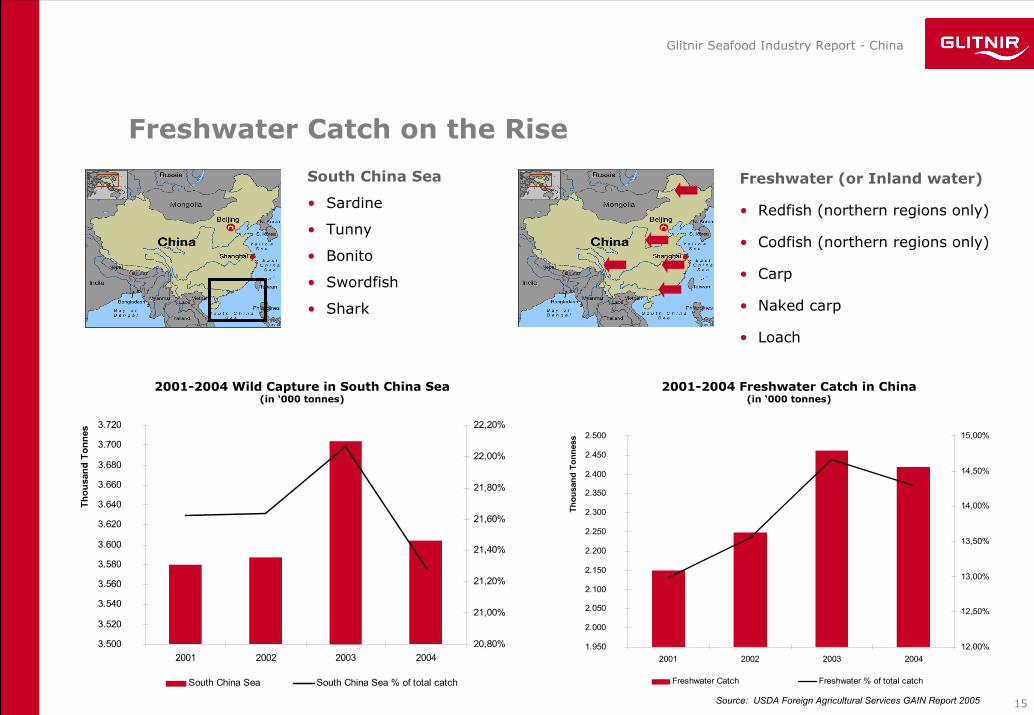
Freshwater Catch on the Rise
2001-2004 Wild Capture in South China Sea(in ‘000 tonnes)
Source: USDA Foreign Agricultural Services GAIN Report 2005
South China Sea
• Sardine
• Tunny
• Bonito
• Swordfish
• Shark
2001-2004 Freshwater Catch in China(in ‘000 tonnes)
Freshwater (or Inland water)
• Redfish (northern regions only)
• Codfish (northern regions only)
• Carp
• Naked carp
• Loach
3.500
3.520
3.540
3.560
3.580
3.600
3.620
3.640
3.660
3.680
3.700
3.720
2001 2002 2003 2004
Thou
sand
Ton
nes
20,80%
21,00%
21,20%
21,40%
21,60%
21,80%
22,00%
22,20%
South China Sea South China Sea % of total catch
1.950
2.000
2.050
2.100
2.150
2.200
2.250
2.300
2.350
2.400
2.450
2.500
2001 2002 2003 2004
Thou
sand
Ton
ness
12,00%
12,50%
13,00%
13,50%
14,00%
14,50%
15,00%
Freshwater Catch Freshwater % of total catch

Glitnir Seafood Industry Report - China
16
Aquaculture in China
• Total culture area reached 7.28 million hectares for 2004, up by 2.5 percent over 2003.
• About 22 percent of the total culture area is in seawaters, 78 percent is in freshwaters. However, production is divided more evenly – 41% from seawater and 59% from freshwater.
• Culture area expansion is expected to slow down, as the priority has been shifted to increase of productivity and efficiency, rather than expanding blindly.
2001-2004 Development of China’s Aquaculture Area Resource (in ‘000 hectares)
Source: USDA Foreign Agricultural Services GAIN Report 2005
2001-2005 Aquaculture Production in China (in million tonnes)
Freshwater78%
Seawater22%
Freshwater; 58,96%
Seawater; 41,03%
2004 Aquaculture area & production in %
14 13 13
11 12
20 19
18 17
16
-
5
10
15
20
25
2.001 2.002 2003 2004 2005(e)
Mill
ion
Tonn
es
Seawater culture Freshwater culture
5.664 5.571 5.470 5.362
1.617 1.532 1.345 1.286
-
1.000
2.000
3.000
4.000
5.000
6.000
2001 2002 2003 2004
Thou
sand
hec
tare
s
Freshwater Seawater
Area Resources Production

Glitnir Seafood Industry Report - China
17
Shellfish - the Most Cultured Product in Seawater
0 10 20 30 40 50 60 70
Fish
Shrimp
Crab
Algae
Thousands Hectares
Guangxi
Guangdong
Shangdong
Fujian
Zhejiang
Jiangsu
Liaoning
Hebei
2%7%
23%
7%
4%
15%16%
26%
HebeiLiaoningJiangsuZhejiangFujianShandongGuangdongGuangxi
2004 Seawater Farming Area Resource by Selected Products & Regions
(in ‘000 hectares) 2004 Total Seawater Farming Area by Regions
• The leading species are molluscs, accounting for approx. 78% of total farmed production, followed by algae (10%), crustaceans, (5.5%) and fish (4%).
• Growth in seawater farming is relatively slow. Production yield per hectare has not been improved significantly in recent years. Yet the expansion of seawater culture areas starts to result in damage to the marine eco-system. Therefore growth in seawater farming is expected to slow down further.
• China’s largest seawater farming area, in the terms of hectares, is in Liaoning province in Northern China. It is followed by Shandong province, with close to 24% of the total farming area.
6%8% 5%
15%
5%
61%
FishShrimp/PrawnCrabShellfishAlgaeOther
2004 Seawater Farming Area by Products(% of total hectares)
Source: Ministry of Agriculture, China

Glitnir Seafood Industry Report - China
18
Freshwater Farming Areas
• Freshwater fish farming is dominated by small and medium-sized individual farms located primarily in the provinces of Hubei, Anhui, Jiangsu, Hunan and Heillongjiang.
• Largest pond farming: Hubei province (340,015 hectares).
• Largest lake farming: Anhui province (193,279 hectares).
• Largest reservoir farming: Jiangxi province (132,559 hectares).
• Largest stream farming: Jiangsu province (113,014 hectares).
3%
22%
5%
23%13%
34%
PondLakeReservoirStreamRice PaddiesOthers
2004 China Inland Culture Area Resources by Type(percentage of total area in hectares)
Source: Ministry of Agriculture, China
5% 16%5%
7%
9%
9%
9%11%
14%
15%
HubeiJiangsuAnhuiHunanHeilongjiangGuangdongJiangxiShandongZhejiangHenan
2004 China Inland Culture Area Resources by Regions(Ten top provinces as percentage of total area in hectares)
Source: Ministry of Agriculture, China

Glitnir Seafood Industry Report - China
19
Carps - 79% of Total Freshwater Culture Output
• The dominant form of freshwater farming in China is pond farming, which occupies 34% of the total freshwater farming area and produces a little over 70% of the total output.
• Carps account for the majority of the output. They contributed more than 79% of all the output of the 1999 freshwater aquaculture output (the distribution today is deemed to be similar), which is equivalent to 47.2% of the total Chinese aquaculture output or 27.4% of the total fisheries output.
• In 1999, carps were valued at CNY74.39 billion at the price of that year, representing 49.8% of the total value of China’s freshwater culture output, or 29.4% of its total fisheries output value.
• Apart from the carp family, tilapia also occupies an important place in the freshwater aquaculture in China. In 1999, it represented approximately 4% of the freshwater culture output (or 561,794 tonnes) and 3.61% of the total value (CNY3.61 billion). The production of tilapia is expected to increase further.
33%
22%
14%
9%
1%
4%
3%
9%
1%1%
1%1%
1%
Silver carp & Bighead carpGrass carpCommon carpCrucian carpBlack crapTilapiaChinese breamEelChinese mitten handed crabMandarin fishMacrobrachium rosenbergiiSoft shelled turtleOthers
3%5%5%
6%
10%
71%
Ponds
Reservoirs
Lakes
Rivers/canals
Rice paddy
Other
Estimated freshwater production by farming environment
Freshwater culture output by species
Source: FAO: Aquaculture development in China 2001
Source: FAO: Aquaculture development in China 2001

Glitnir Seafood Industry Report - China
20
2) Seafood Processing in China
Supply of RawMaterials
Catch / Culture
ProcessingPrimary / Secondary
Distribution Trading /
Import & Export
RetailConsumers / Marketing
& Sales
Glitnir Seafood Industry Report - China
21
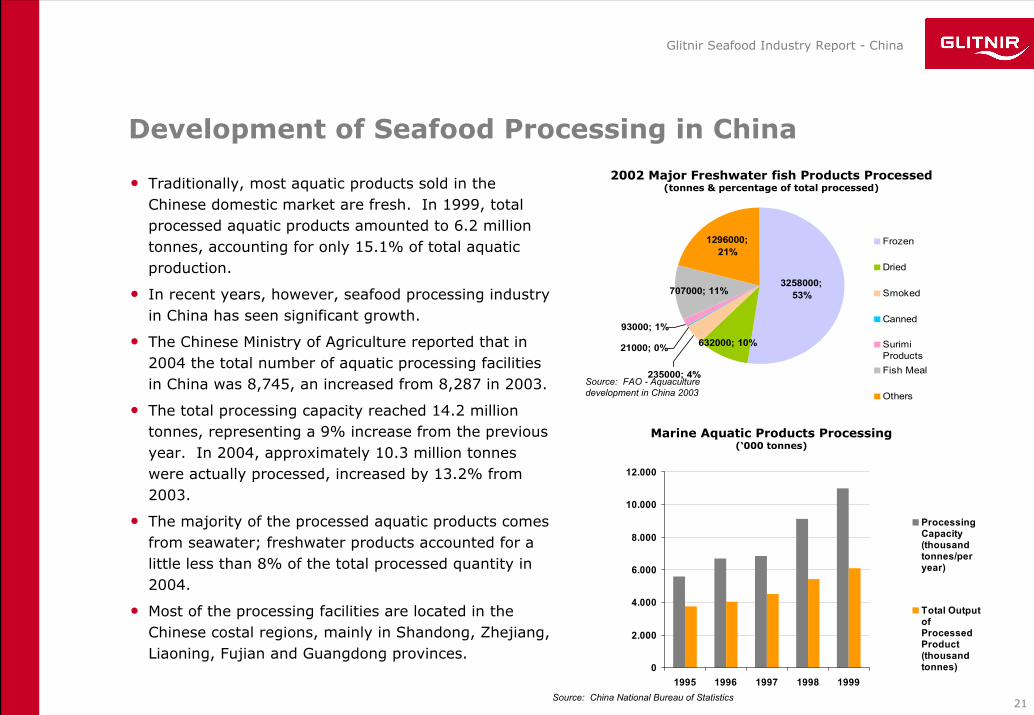
Development of Seafood Processing in China
• Traditionally, most aquatic products sold in the Chinese domestic market are fresh. In 1999, total processed aquatic products amounted to 6.2 million tonnes, accounting for only 15.1% of total aquatic production.
• In recent years, however, seafood processing industry in China has seen significant growth.
• The Chinese Ministry of Agriculture reported that in 2004 the total number of aquatic processing facilities in China was 8,745, an increased from 8,287 in 2003.
• The total processing capacity reached 14.2 million tonnes, representing a 9% increase from the previous year. In 2004, approximately 10.3 million tonnes were actually processed, increased by 13.2% from 2003.
• The majority of the processed aquatic products comes from seawater; freshwater products accounted for a little less than 8% of the total processed quantity in 2004.
• Most of the processing facilities are located in the Chinese costal regions, mainly in Shandong, Zhejiang, Liaoning, Fujian and Guangdong provinces.
93000; 1%
707000; 11%
235000; 4%
632000; 10%
1296000; 21%
3258000; 53%
21000; 0%
Frozen
Dried
Smoked
Canned
SurimiProducts Fish Meal
Others
Source: China National Bureau of Statistics
2002 Major Freshwater fish Products Processed(tonnes & percentage of total processed)
Source: FAO - Aquaculture development in China 2003
0
2.000
4.000
6.000
8.000
10.000
12.000
1995 1996 1997 1998 1999
ProcessingCapacity(thousandtonnes/peryear)
Total OutputofProcessedProduct(thousandtonnes)
Marine Aquatic Products Processing (‘000 tonnes)

Glitnir Seafood Industry Report - China
22
Outsource Seafood Processing to China
• As seafood processing is a labour-concentrated industry, the lower labour cost in China attracts a large amount of foreign investment into this sector. Often, tax incentives provided by the Chinese government also play a big role. The hourly pay of Chinese factory labour is estimated at $0.5 (RaboBank estimate).
• Shandong province receives the largest portion of foreign investment in seafood processing, the majority of which comes from Japan and Korea. Fujian province, ranked the second, receives foreign funds from a wider range of regions, including Taiwan, Hong Kong, Japan, Korea, the U.S., Argentina and Denmark.
0 500 1000 1500 2000 2500 3000
Hebei
Liaoning
Jiangsu
Zhejiang
Fujian
Shandong
Guangdong
Guangxi
Hainan
Thousand tonnes
Fish Shrimp, Prawns, Crabs Shell fish Algae Other
Local Supply of Seawater Raw material for Processing(‘000 tonnes, 1999)
Source: China National Bureau of Statistics
About Seafood Processing in China
Currently, Homey Group, located in Shandong, is the largest aquatic processing company in China, with total sales of US$230 million in 2004. The joint venture between ShanfuGroup and Japan Nippon Suisan is building its annual capacity toward 40,000 tonnes in 2007, with the aim of becoming one of the largest processing companies by then.
(RaboBank – China’s aquaculture industry 2005)
Major U.S. fisheries, including Trident, Pacific Seafood, Premier Pacific Seafood and many more, outsource processing to China. Seafood products processed there include Salmon, Dungeness crab, Alaskan Pollock.
(Bloomberg News – July 19, 2005)
Agreement Signed between Chinese and Icelandic companies on construction of a 150,000-ton storing house for frozen seafood at the city of Qingdao in East China's Shandong Province.
(Xinhua New Agency – May 22, 2005)

Glitnir Seafood Industry Report - China
23
3) Seafood Trade and Sales
Supply of RawMaterials
Catch / Culture
ProcessingPrimary / Secondary
Distribution Trading /
Import & Export
RetailConsumers / Marketing
& Sales
Glitnir Seafood Industry Report - China
24
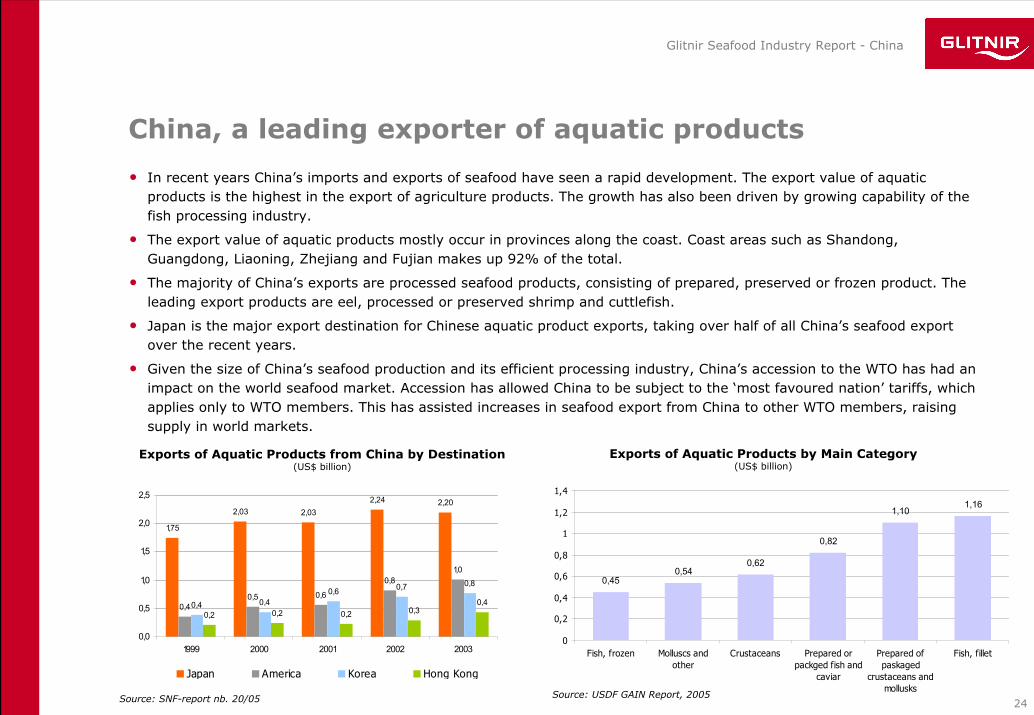
China, a leading exporter of aquatic products
1,75
2,03 2,032,24 2,20
0,40,5 0,6
0,81,0
0,4 0,40,6 0,7 0,8
0,2 0,2 0,2 0,30,4
0,0
0,5
1,0
1,5
2,0
2,5
1999 2000 2001 2002 2003
Japan America Korea Hong Kong
• In recent years China’s imports and exports of seafood have seen a rapid development. The export value of aquatic products is the highest in the export of agriculture products. The growth has also been driven by growing capability of the fish processing industry.
• The export value of aquatic products mostly occur in provinces along the coast. Coast areas such as Shandong, Guangdong, Liaoning, Zhejiang and Fujian makes up 92% of the total.
• The majority of China’s exports are processed seafood products, consisting of prepared, preserved or frozen product. The leading export products are eel, processed or preserved shrimp and cuttlefish.
• Japan is the major export destination for Chinese aquatic product exports, taking over half of all China’s seafood export over the recent years.
• Given the size of China’s seafood production and its efficient processing industry, China’s accession to the WTO has had an impact on the world seafood market. Accession has allowed China to be subject to the ‘most favoured nation’ tariffs, which applies only to WTO members. This has assisted increases in seafood export from China to other WTO members, raising supply in world markets.
Source: SNF-report nb. 20/05
Source: SNF-report nb. 20/05
1,161,10
0,82
0,620,54
0,45
0
0,2
0,4
0,6
0,8
1
1,2
1,4
Fish, filletPrepared ofpaskaged
crustaceans andmollusks
Prepared orpackged fish and
caviar
CrustaceansMolluscs andother
Fish, frozen
Source: USDF GAIN Report, 2005
Exports of Aquatic Products from China by Destination(US$ billion)
Exports of Aquatic Products by Main Category(US$ billion)

Glitnir Seafood Industry Report - China
25
Increasing Demand for Seafood in China
0,3
0,4
0,7
0,2
0,4
0,3
0,4
0,3
0,10,1
0,2 0,20,20,2
0,10,1 0,1 0,1
0,7
0,5
0,0
0,1
0,2
0,3
0,4
0,5
0,6
0,7
0,8
1999 2000 2001 2002 2003
Russia Peru America Japan
• China was the world’s eighth largest importer of aquatic products in 2003, with an import value of $2.5 bn.
• China’s two main imports were cod (mainly from Russia) and Fish meal (mainly from Peru).
• The seafood trade surplus was $3 billion for 2003 with imports valued at about $2.5 billion and exports at $5.5 billion.
• Much of the imports are destined for re-export following processing in China. Beside the re-export, an increasing share of imports is destined for the domestic market, as the emerging upper class is creating demand for imported seafood.
• China has reduced its tariffs on seafood products since joining the WTO in 2001.
• China also influences the demand side of the world seafood market. Lower tariff barriers have reduced import costs and resulted in greater seafood imports by China.
Source: USDA GAIN Report, 2005Source: SNF-report nb. 20/05
1,20
0,63
0,290,26
0,11
0
0,2
0,4
0,6
0,8
1
1,2
1,4
Fish, frozenFish MealCrustaceansMolluscs andother
Other
Import of Aquatic Products into China by Origin(US$ billion)
Import of Aquatic Products into China by Main Category(US$ billion)

Glitnir Seafood Industry Report - China
26
China’s Domestic Food Market on the Rise
Source: National Bureau of Statistics of PRCNote: 100% = USD 212bn
2004 Market Structure2000-2004 Market Structure
(US$ billion)
Source: National Bureau of Statistics of PRC
43
65
93
74 74
91
1519
28
0
20
40
60
80
100
2000 2002 2004
Foodservice Food Wholesale Food Retail
Foodservice44%
Food Wholesale
43%
Food Retail13%
• All the three sectors of the food market have experienced a significant growth in recent years and we believe that this development will continue as purchasing power increases. Seafood consumption is expected to increase substantially in coming years. Therefore we expect that the position of seafood in the food market will be strong in the future.
• Food retail is on the rise due to consumer’s increasing willingness to spend on foods as a result of growing concerns over food safety and health.
• With urbanisation and marketisation, lifestyles become increasingly fast-paced resulting in growing convenience food and foodservice markets.
• Rapid growth in food wholesale sector could be attributed to the sudden rise of large-scale, national supermarket and hypermarket chains in food retail as well as the increasing preference of consumers to buy in bulk (facilitated by the rise in car ownership).
• Increased purchasing power in recent years has contributed to fast growth in the foodservice sector, including the seafood sector.
Glitnir Seafood Industry Report - China
27
4) China Seafood Consumption
Supply of RawMaterials
Catch / Culture
ProcessingPrimary / Secondary
Distribution Trading /
Import & Export
RetailConsumers / Marketing
& Sales
Glitnir Seafood Industry Report - China
28
High Consumption of Seafood
0,9 1,1 1,1 1,3 1,6 1,8 2,1 2,3 2,7 2,7 3,0 3,0 3,0 3,0 3,01,1 1,2 1,3 1,4 1,8 2,2 2,5 2,7 3,1 3,0 2,7 2,8 2,7 2,7 2,74,5 4,5 5,1 6,16,9
7,88,9 9,8
10,3 10,6 10,8 10,9 10,8 10,8 10,7
2,1 2,1 2,32,4
2,62,6
3,12,7 2,0 1,9 2,1 1,7 1,7 1,7 1,7
2,02,6
4,4
5,5
5,9 6,0 6,2 6,3 6,2 6,2 6,2
0,80,8
0,8
0,7
0,8
1,01,2 1,2 1,1 1,1 1,1 1,1 1,1
2,2
3,5
5,55,3
0,7
0,7
0
5
10
15
20
25
30
1990 1991 1992 1993 1994 1995 1996 1997 1998 1999 2000 2001 2002 2003 2004
Per
capi
ta /
kg /
year
Crustaceans Demersal fish Freshwater and diadromous fish Marine fish, other Molluscs Other
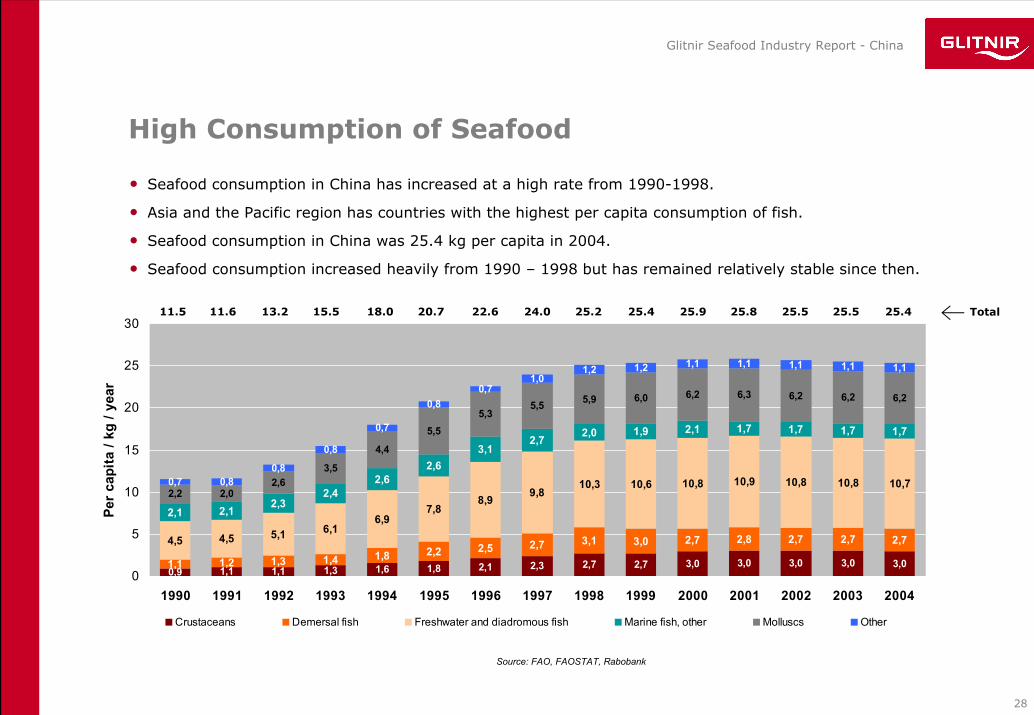
• Seafood consumption in China has increased at a high rate from 1990-1998.
• Asia and the Pacific region has countries with the highest per capita consumption of fish.
• Seafood consumption in China was 25.4 kg per capita in 2004.
• Seafood consumption increased heavily from 1990 – 1998 but has remained relatively stable since then.
11.5 11.6 13.2 15.5 18.0 24.020.7 25.2 25.925.422.6 25.8 25.5 25.5 25.4 Total
Source: FAO, FAOSTAT, Rabobank

Glitnir Seafood Industry Report - China
29
Increased protein consumption
22,6 24,0 26,1 28,1 30,6 31,9 31,4 35,6 38,0 38,2 39,6 40,7 42,1 43,9 45,93,3 4,0 4,5 5,56,1 7,3 7,3
8,39,0 9,8 10,6 10,3 10,5 10,9 11,1
11,5 11,613,2
15,418,0
20,8 22,624,0
25,1 25,4 25,8 25,9 25,7 25,5 25,3
0
10
20
30
40
50
60
70
80
1990 1991 1992 1993 1994 1995 1996 1997 1998 1999 2000 2001 2002 2003 2004
Per
capi
ta /
kg /
year
Red Meat Poultry Seafood
Source: FAO, FAOSTAT
37.4 39.6 43.8 49.0 54.7 67.959.5 72.1 76.073.461.3 76.9 78.3 80.3 82.3 Total
• Followed by high growth in recent years protein consumption has increased substantially.
• Seafood’s average historical share in consumption of red meat, poultry and seafood is 33%. The peak was in
1996 when it reached 37%. The share in 2004 was 31%.
• The average share of meat and poultry is 55% and 12%, respectively. Over this period the share of poultry has
steadily increased from 9% to 14%, while meat has lost a share of 4%.

Glitnir Seafood Industry Report - China
30
Regional Trends in Consumption
• There is significant difference in seafood consumption between rural and urban areas in China.
– In 2002, seafood accounted for 4.4% of total food consumption in rural areas while it accounted for 13.2% in urban
areas.
• Consumption is higher in coastal provinces and in provinces with high level of disposable income.
– The top 5 provinces that had the most expenditure on seafood products in 2004 were: Fujian, Shanghai, Zhejiang,
Hainan and Guangdong.
• More expensive marine fish is consumed by the affluent population in coastal cities of China, while freshwater fish
is consumed throughout China. Source: Rabobank, GAIN, Agri-Food Trade Service
0
100
200
300
400
500
600
700
Fujia
nSha
ngha
iZh
ejian
g
Hainan
Guang
dong
Tianji
n
Jiang
su
Liaon
ing
Guang
xi
Beijing
Nation
al
Expe
nditu
re C
NY p
er c
apita
per
ann
um
0
5000
10000
15000
20000
25000
Inco
me
CNY
per
capi
ta p
er a
nnum
Aquatic Product Expenditure (in CNY) Disposable Income (in CNY)
2004 Top Ten Aquatic Product Expenditure Per Capita & Disposable Income (US$ billion)
Source: USDF Gain Report 2005
Glitnir Seafood Industry Report - China
31
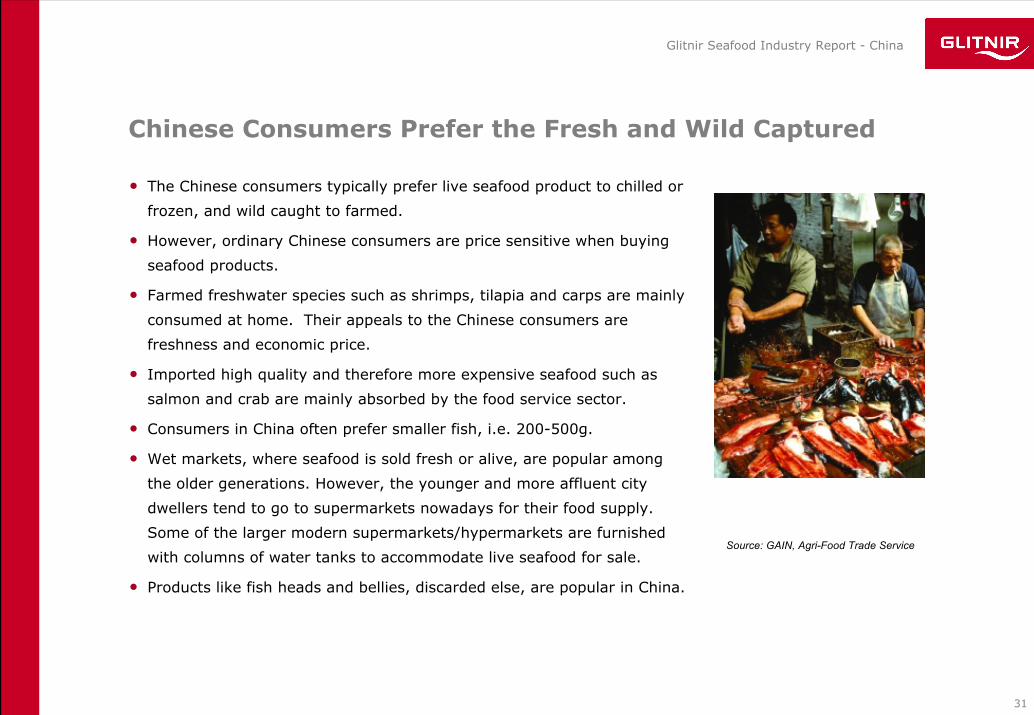
Chinese Consumers Prefer the Fresh and Wild Captured
• The Chinese consumers typically prefer live seafood product to chilled or
frozen, and wild caught to farmed.
• However, ordinary Chinese consumers are price sensitive when buying
seafood products.
• Farmed freshwater species such as shrimps, tilapia and carps are mainly
consumed at home. Their appeals to the Chinese consumers are
freshness and economic price.
• Imported high quality and therefore more expensive seafood such as
salmon and crab are mainly absorbed by the food service sector.
• Consumers in China often prefer smaller fish, i.e. 200-500g.
• Wet markets, where seafood is sold fresh or alive, are popular among
the older generations. However, the younger and more affluent city
dwellers tend to go to supermarkets nowadays for their food supply.
Some of the larger modern supermarkets/hypermarkets are furnished
with columns of water tanks to accommodate live seafood for sale.
• Products like fish heads and bellies, discarded else, are popular in China.
Source: GAIN, Agri-Food Trade Service

Glitnir Seafood Industry Report - China
32
Seafood Consumption: Strong Fundamentals
• We expect a strong seafood consumption growth and a strong demand for high quality seafood. Main reasons for that are:
– According to FAO seafood consumption in China is projected to be 35.9 kg/year per capita in 2020, an increase of 41% compared to the 2004 consumption.
– The higher consumption of seafood in urban areas, compared to rural areas, indicates that the increased urbanization will lead to increased consumption of seafood.
– Dramatic rise is expected in China’s middle class in next 5-10 years. In 2005 the middle class accounted for 90 million inhabitants but is projected to account for 650 million in 2015. Therefore, increased purchasing power is likely to result in higher seafood consumption.
– Chinese consumers are sensitive to product quality regardless of low disposable income, compared to developed countries. Demand for high quality seafood is therefore expected to increase as purchasing power increases.
Source: FAO, Rabobank, Dep. of agriculture, fisheries and forestry (Australia), Goldman Sachs
68
24 25
36
12 1316 16 17
0
5
10
15
20
25
30
35
40
1973 1985 1997 2004 2020e
Per
cap
ita /
kg /
year
China World
Forecast of Seafood Consumption Trend in China and the World
Glitnir Seafood Industry Report - China
33
5) Investment Opportunity in Focus: Culture & Processing of Tilapia in China

Glitnir Seafood Industry Report - China
34
Important Aquaculture Product of the 21st Century
Tilapia is one of the most widely cultured species in the world. FAO reports production in 85 countries, including China.• Wild catch is being replaced by aquaculture. Tilapia is most often farmed in:
– Ponds– Cages– Raceways, round tanks, re-circulating systems– Ranching (lake releases)– Freshwater, Brackish water, estuarine and marine
• Tilapia grows well in most production systems.
– Polyculture with shrimp, catfish, and carp– Could be herbivorous and/or omnivorous– Good growth in fertilized ponds– Many by products can be used in prepared feeds– Simple hatchery technology– Disease resistant– Grow well at high densities
• There is an established and growing market demand for tilapia.
– Accepted in many national dishes– Popular in many forms (live, whole, fillets, fresh, frozen, smoked, surimi)
• Tilapia will surpass other cultured species in importance.
– Production constraints being reduced, and costs decreasing– Markets are still expanding– Market price is steady– Ecologically sustainable and environment friendly– Consumption not restricted by religious observances– Mild flavour preferred by many consumers– Carp: markets are limited– Salmonids and shrimps need high levels of fish meal, limited ingredients for diets– Most other species need higher water quality, competition for sites
Source: Kevin Fitzsimmons, Ph.D. Tilapia Aquaculture in the 21st Century, University of Arizona

Glitnir Seafood Industry Report - China
35
Soaring Tilapia Market In the U.S.• The U.S. market is estimated to import approx.
180,000 tonnes of tilapia in 2006, compared to only 40,000 tonnes in 2000.
• Since 2001, tilapia consumption has doubled in the U.S. The species is now number 6 among the top ten seafood consumed by U.S. consumers.
• The EU market is still limited, but imports are expected to increase, especially in the light of limited wild whitefish supplies to the market.
• Production of tilapia worldwide is likely to expand robustly in coming years, as a result of strong investment in this sector.
0
20
40
60
80
100
120
140
160
1999 2000 2001 2002 2003 2004 2005 Jan-Jul2005
Jan-Jul2006
Thousand tonnes
Whole frozen Frozen fillets Fresh fillets
1999 - 2005 U.S. Total Tilapia Import by Product Form(‘000 tonnes)
0
10
20
30
40
50
60
1999 2000 2001 2002 2003 2004 2005 Jan-Jul2005
Jan - Jul2006
Thou
sand
tonn
es
EcuadorThailandTaiwanIndonesiaChina
US Frozen Tilapia Fillets Import by Country of Origin(‘000 tonnes)
Source: Fish INFOnetwork Market Report on Tilapia
0
5
10
15
20
25
1999 2000 2001 2002 2003 2004 2005 Jan-Jul2005
Jan - Jul2006
Thou
sand
tonn
es
TaiwanChinaCosta RicaHondurasEcuador
US Fresh Tilapia Fillets Import by Country of Origin(‘000 tonnes)

Glitnir Seafood Industry Report - China
36
Strong Growth in the Chinese Tilapia Industry
• China continues to be the world’s main producer of tilapia. Total production in 2006 is expected to reach 1.07 million tonnes, representing a 10% growth from 2005.
• The value of tilapia production in China is thus exceeding $2,000 million.
• More than 80% of the tilapia is consumed in the country. Main market for Chinese tilapia is the U.S., which takes over 70% of the exports.
• The impressive increase in tilapia is caused by farmers switching from carp and shrimp to tilapia production. Some 120 plants are processing, of which 30 are specialised in this fish alone. The average retail price of tilapia in China is $1.60/kg, while the unit value of the exported fish is around $2.16/kg.
562629
672707
806
897
978
1070
0
200
400
600
800
1000
1200
1999 2000 2001 2002 2003 2004 2005 2006e
1999 – 2006 Tilapia Production in China(‘000 tonnes)
Source: Fish INFOnetwork Market Report on Tilapia
Source: USDA Foreign Agricultural Service China’s Tilapia Production Situation 2006
Glitnir Seafood Industry Report - China
37
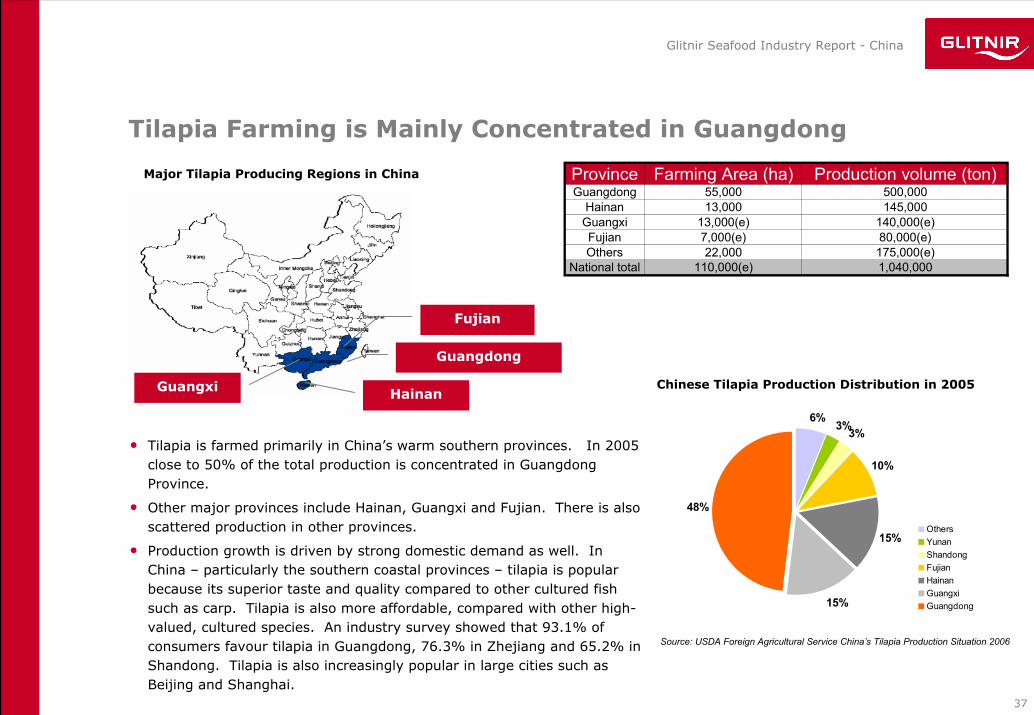
Tilapia Farming is Mainly Concentrated in Guangdong
• Tilapia is farmed primarily in China’s warm southern provinces. In 2005 close to 50% of the total production is concentrated in Guangdong Province.
• Other major provinces include Hainan, Guangxi and Fujian. There is also scattered production in other provinces.
• Production growth is driven by strong domestic demand as well. In China – particularly the southern coastal provinces – tilapia is popular because its superior taste and quality compared to other cultured fish such as carp. Tilapia is also more affordable, compared with other high-valued, cultured species. An industry survey showed that 93.1% of consumers favour tilapia in Guangdong, 76.3% in Zhejiang and 65.2% in Shandong. Tilapia is also increasingly popular in large cities such as Beijing and Shanghai.
Province Farming Area (ha) Production volume (ton)Guangdong 55,000 500,000
Hainan 13,000 145,000Guangxi 13,000(e) 140,000(e)Fujian 7,000(e) 80,000(e)Others 22,000 175,000(e)
National total 110,000(e) 1,040,000
Guangdong
Hainan
Fujian
Guangxi
6%3%3%
10%
15%
15%
48%
OthersYunanShandongFujianHainanGuangxiGuangdong
Major Tilapia Producing Regions in China
Chinese Tilapia Production Distribution in 2005
Source: USDA Foreign Agricultural Service China’s Tilapia Production Situation 2006

Glitnir Seafood Industry Report - China
38
Common Business Model of Tilapia Farming in China
Processing Company / Trader Breeding Farm Feeds Factory
Tilapia Farm Tilapia Farm Tilapia Farm Tilapia Farm
Contract land, pond, etc. from villages
Sign contract and sell tilapia
quality and safe control
Sign contract and purchase tilapia
Supply breeds and technological support
Supply feed and technical support
Importer / Distributor

Glitnir Seafood Industry Report - China
39
The U.S. Remains Chinese Tilapia’s Largest Customer
• Tilapia fillet and frozen whole are the major products, accounting for almost 100% of total exported volume.
• Increasing tilapia exports from China bring more opportunities for the tilapia processing industry, as nearly all exported tilapia products are processed.
• This is mainly because of China’s relatively low cost of labour and the industry’s effort to deepen processing to add value to exported products.
• Fillet exports are likely to increase further while the portion of frozen whole fish is expected to continue to diminish.
• United States remains the largest export destination for China, which on average absorbs 77% of tilapia fillet and 73% of frozen whole fish.
• Industry insiders believe that more attention will be paid to diversifying its export market, in particular in Europe and Middle East.
0
20
40
60
80
100
2002 2003 2004 2005
Thou
sand
tonn
es
Frozen w hole tilapia
Tilapia f illet
0
10
20
30
40
50
60
2002 2003 2004 2005
Thou
sand
tonn
esHong Kong
Canada
Germany
Puerto Rico
Mexico
United States
China’s Export Mix From 2002 – 2005 (tonnes)
China’s Tilapia Fillet Exports by Destination(tonnes)
Source: USDA Foreign Agricultural Service China’s Tilapia Production Situation 2006Source: USDA Foreign Agricultural Service China’s Tilapia Production Situation 2006

Glitnir Seafood Industry Report - China
40
Opportunities in Tilapia Culture & Processing
• Tilapia is well suited for large-scale and poly-culture farming. The unit cost of production is expected to decrease further as a result of ongoing consolidation among Chinese tilapia producers. This presents international seafood companies with the opportunity for vertical integration, in order to ensure steady supply and constant quality.
• Increasing demand for tilapia, especially tilapia fillet, in the world market encourages further growth of tilapia exports from China. This gives rise to opportunities in the tilapia processing sector. In addition, the relatively low cost of labour in China constitutes a major advantages in the labour intensive processing business.
Glitnir Seafood Industry Report - China
41
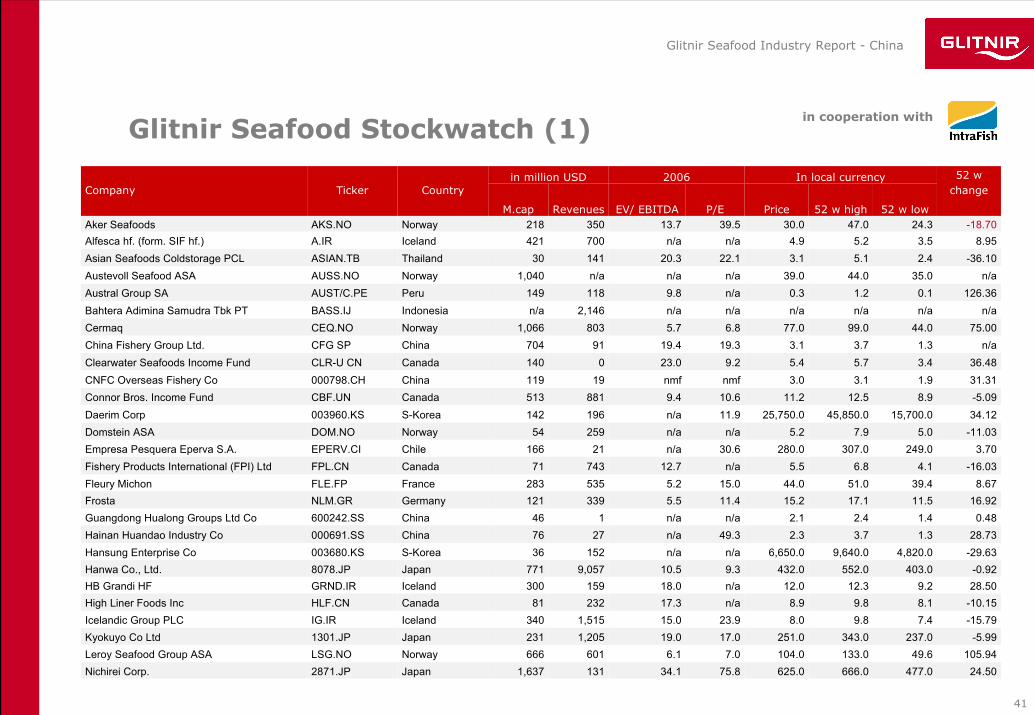
Glitnir Seafood Stockwatch (1)
-15.797.49.88.023.915.01,515340IcelandIG.IRIcelandic Group PLC-5.99237.0343.0251.017.019.01,205231Japan1301.JPKyokuyo Co Ltd
105.9449.6133.0104.07.06.1601666NorwayLSG.NOLeroy Seafood Group ASA
-10.158.19.88.9n/a17.323281CanadaHLF.CNHigh Liner Foods Inc
24.50477.0666.0625.075.834.11311,637Japan2871.JPNichirei Corp.
28.509.212.312.0n/a18.0159300IcelandGRND.IRHB Grandi HF-0.92403.0552.0432.09.310.59,057771Japan8078.JPHanwa Co., Ltd.
-29.634,820.09,640.06,650.0n/an/a15236S-Korea003680.KSHansung Enterprise Co28.731.33.72.349.3n/a2776China000691.SSHainan Huandao Industry Co
0.481.42.42.1n/an/a146China600242.SSGuangdong Hualong Groups Ltd Co16.9211.517.115.211.45.5339121GermanyNLM.GRFrosta
8.6739.451.044.015.05.2535283FranceFLE.FPFleury Michon-16.034.16.85.5n/a12.774371CanadaFPL.CNFishery Products International (FPI) Ltd
3.70249.0307.0280.030.6n/a21166ChileEPERV.CIEmpresa Pesquera Eperva S.A.-11.035.07.95.2n/an/a25954NorwayDOM.NODomstein ASA34.1215,700.045,850.025,750.011.9n/a196142S-Korea003960.KSDaerim Corp-5.098.912.511.210.69.4881513CanadaCBF.UNConnor Bros. Income Fund31.311.93.13.0nmfnmf19119China000798.CHCNFC Overseas Fishery Co36.483.45.75.49.223.00140CanadaCLR-U CNClearwater Seafoods Income Fund
n/a1.33.73.119.319.491704ChinaCFG SPChina Fishery Group Ltd.75.0044.099.077.06.85.78031,066NorwayCEQ.NOCermaq
n/an/an/an/an/an/a2,146n/aIndonesiaBASS.IJBahtera Adimina Samudra Tbk PT126.360.11.20.3n/a9.8118149PeruAUST/C.PEAustral Group SA
n/a35.044.039.0n/an/an/a1,040NorwayAUSS.NOAustevoll Seafood ASA-36.102.45.13.122.120.314130ThailandASIAN.TBAsian Seafoods Coldstorage PCL
8.953.55.24.9n/an/a700421IcelandA.IRAlfesca hf. (form. SIF hf.)-18.7024.347.030.039.513.7350218NorwayAKS.NOAker Seafoods
52 w change
52 w low52 w highPriceP/EEV/ EBITDARevenuesM.cap
CountryTickerCompanyIn local currency2006in million USD
in cooperation with
Glitnir Seafood Industry Report - China
42
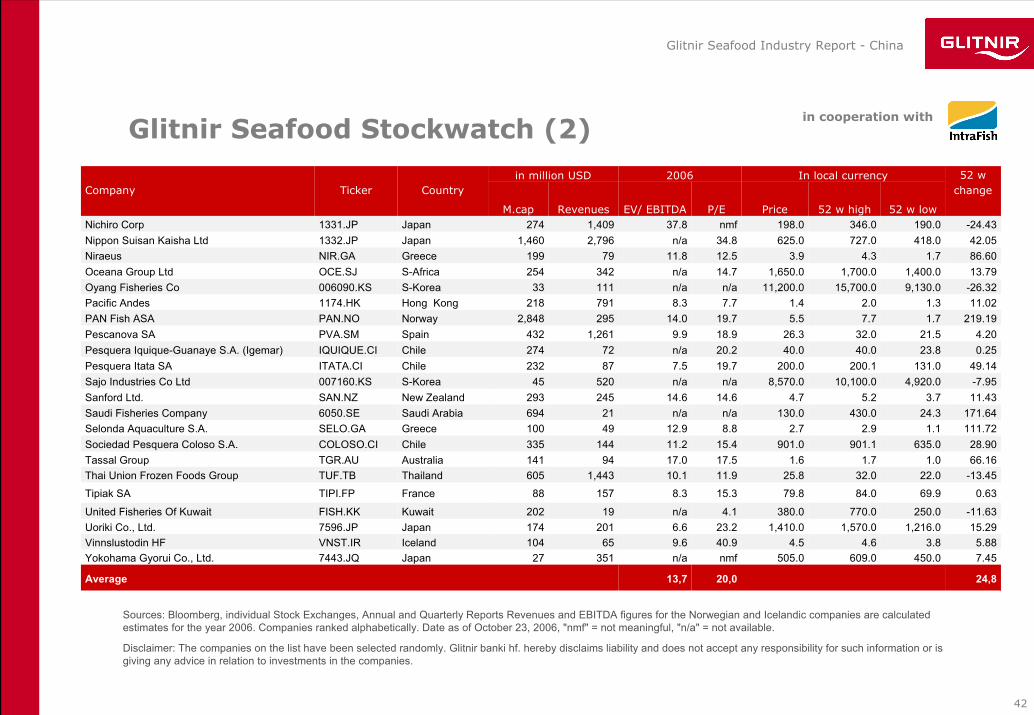
Glitnir Seafood Stockwatch (2)in cooperation with
24,820,013,7Average
7.45450.0609.0505.0nmfn/a35127Japan7443.JQYokohama Gyorui Co., Ltd.5.883.84.64.540.99.665104IcelandVNST.IRVinnslustodin HF
15.291,216.01,570.01,410.023.26.6201174Japan7596.JPUoriki Co., Ltd.-11.63250.0770.0380.04.1n/a19202KuwaitFISH.KKUnited Fisheries Of Kuwait
0.6369.984.079.815.38.315788FranceTIPI.FPTipiak SA
-13.4522.032.025.811.910.11,443605ThailandTUF.TBThai Union Frozen Foods Group66.161.01.71.617.517.094141AustraliaTGR.AUTassal Group28.90635.0901.1901.015.411.2144335ChileCOLOSO.CISociedad Pesquera Coloso S.A.
111.721.12.92.78.812.949100GreeceSELO.GASelonda Aquaculture S.A.171.6424.3430.0130.0n/an/a21694Saudi Arabia6050.SESaudi Fisheries Company
11.433.75.24.714.614.6245293New ZealandSAN.NZSanford Ltd.-7.954,920.010,100.08,570.0n/an/a52045S-Korea007160.KSSajo Industries Co Ltd49.14131.0200.1200.019.77.587232ChileITATA.CIPesquera Itata SA
0.2523.840.040.020.2n/a72274ChileIQUIQUE.CIPesquera Iquique-Guanaye S.A. (Igemar)4.2021.532.026.318.99.91,261432SpainPVA.SMPescanova SA
219.191.77.75.519.714.02952,848NorwayPAN.NOPAN Fish ASA11.021.32.01.47.78.3791218Hong Kong1174.HKPacific Andes
-26.329,130.015,700.011,200.0n/an/a11133S-Korea006090.KSOyang Fisheries Co13.791,400.01,700.01,650.014.7n/a342254S-AfricaOCE.SJOceana Group Ltd86.601.74.33.912.511.879199GreeceNIR.GANiraeus42.05418.0727.0625.034.8n/a2,7961,460Japan1332.JPNippon Suisan Kaisha Ltd
-24.43190.0346.0198.0nmf37.81,409274Japan1331.JPNichiro Corp
52 w change
52 w low52 w highPriceP/EEV/ EBITDARevenuesM.cap
CountryTickerCompanyIn local currency2006in million USD
Sources: Bloomberg, individual Stock Exchanges, Annual and Quarterly Reports Revenues and EBITDA figures for the Norwegian and Icelandic companies are calculated estimates for the year 2006. Companies ranked alphabetically. Date as of October 23, 2006, "nmf" = not meaningful, "n/a" = not available.
Disclaimer: The companies on the list have been selected randomly. Glitnir banki hf. hereby disclaims liability and does not accept any responsibility for such information or is giving any advice in relation to investments in the companies.

Glitnir Seafood Industry Report - China
43
About Glitnir
• Home markets are Iceland and Norway.
• Focus on niche segments worldwide.
– Seafood / Food Industry– Sustainable Energy– Shipping - Offshore Supply Vessels
• Strong focus on the seafood industry since 1904.
• Today 10% of the bank’s loan portfolio is in the seafood industry.
• Credit ratings:
A1 / P-1 (Moody’s), A / F1 (Fitch) and A-/A-2 (Standard and Poor’s)
Credit facilities
– Term loan facilities– Working capital
facilities– Syndicated loans– Vessel financing– Bridge loans
Mergers & acquisitions
– Financial advisory– Acquisitions– Disposals– Minority investments– MBOs / LBOs / MBIs– Private Placements– Strategic reviews
Services include:
Commerce5%
Manf. constr.
8%
Seafood10%
Services20%
Households24%
Property companies
30%
Other3%
Glitnir’s total loan portfolio USD18.5bn *
Other services
– Risk management advisory
– Equity participation
Capital Markets
– Bond issuances– FX dealings– Forward contracts– Options
* as of December 31, 2005

Glitnir Seafood Industry Report - China
44
Glitnir’s International Platform
London Branch • Corporate Banking• Corporate Finance • Centre of Excellence
• Food industry• Structured Finance• Loan Syndication
Iceland
United Kingdom Luxembourg
Norway
DenmarkCopenhagen Branch • Leveraged Finance• Corporate Finance
Glitnir Luxembourg• Corporate Banking• Centre of Excellence
• Real Estate• Private Banking
Headquarters• Corporate Banking • Centres of Excellence
• Global seafood• Sustainable energy• International core customers
• Structured Finance• Capital Markets• Corporate Finance
Canada
China
Glitnir CanadaRepresentative Office Halifax • Opened April 2006
Glitnir ChinaRepresentative Office Shanghai• Opening Fall 2006
BNbank• Corporate and retail mortgageGlitnir Bank• Full service bank, trad. indust. • Centre of Excellence
• Shipping/ Offshore supply vessels
• Subsidiaries:• Glitnir Factoring
Glitnir SecuritiesUnion GroupNorsk Privatøkonomi ASA
41 Lothbury, London City 534 Rue de Neudorf, Lux. Frederiksgade 19, Copenhagen
Kirkjusandur, Reykjavik
1718 Argyle Street, Halifax
Level 8, CitiGroup Tower33, Hua Yuan Shai Qiao RoadPudong, Shanghai
BNbank: Munkegata 21, TrondheimDronningens gate 40, OsloGlitnir Bank:St. Olavsplass 1, AlesundGlitnir Securities:Haakon VII’s gate 10, Oslo
Sweden
Hovslagargatan, Stockholm
Fischer Partners • Equity Trading & Brokerage

Glitnir Seafood Industry Report - China
45
Glitnir Seafood Team
Magnús BjarnasonManaging DirectorRegion Asia & AmericasDirect line: +354 440 4523Mobile: +354 844 [email protected]
Helgi Anton EiríkssonGlobal Seafood Director
Direct line: +354 440 4518Mobile: +354 844 [email protected]
Analysts: Alexander RichterDirect line: +354 440 4766Mobile: +354 844 [email protected]
Ásmundur GíslasonDirect line: +354 440 4768Mobile: +354 844 [email protected]
Valdimar HalldórssonDirect line: +354 440 4638Mobile: +354 844 [email protected]
Henning LundDirect line: +47 22 01 63 47Mobile: +47 952 55 [email protected]
Management:
Websites: www.glitnir.is/Seafood
www.glitnir.is/StockwatchGlobal Seafood Stockwatch:

Glitnir Seafood Industry Report - China
46
Glitnir Seafood – Regional Teams
North America
Europe/ Nordic
Asia
South America
Jiang ZhuDirector Glitnir Representative Office ChinaDirect line: +86 21 6101 0190Mobile: +86 139 0161 [email protected]
Kjartan ÓlafssonDirectorGlitnir BankDirect line: +47 7010 2015Mobile: +47 9592 [email protected]
Jonathan LoganExecutive DirectorNorth AmericaUS: +1 (203) 979 5275 (cell)Iceland: +354 844 4521 (cell)[email protected]
Jón Gardar GudmundssonDirectorBusiness ManagementDirect line: +354 440 4516Mobile: +354 844 [email protected]
Joe FillmoreDirectorCanadaphone: +1 (902) 429 3114mobile: +1 (902) 237 [email protected]
Hjálmur NordalDirectorCanadaphone: +1 (902) 429 3113mobile: +1 (902) 237 [email protected]
Michael RichardDirectorUnited States
mobile: +1 (508) 878 [email protected]
Kristján Th. DavídssonManaging Director Corporate Banking, IcelandDirect line: +354 440 4517 Mobile: +354 844 4517 [email protected]
Ragnar GudjónssonDirectorCorporate Banking, IcelandDirect line: +354 440 4550Mobile: +354 844 [email protected]
Ola ÖvrelidBank Executive | Glitnir Bank Seafood Credit, Norwayphone: +47 7010 2026mobile: +47 9133 [email protected]
Grace LiuExecutive AssistantGlitnir Representative Office ChinaDirect line: +86 21 6101 0191Mobile: +86 136 6166 [email protected]
Hafliði SævarssonAnalystGlitnir Representative Office ChinaDirect line: +86 21 6101 0191Mobile: +354 844 [email protected]
Bjartur Logi Ye ShenAnalystGlitnir Corporate BankingDirect line: +354 440 4560Mobile: +354 844 [email protected]
Greta Marín PálmadóttirAdministrative AssistantCorporate BankingDirect line: +354 440 4746Mobile: +354 844 [email protected]
Anna Rósa RóbertsdóttirAnalystCorporate BankingDirect line: +354 440 4554Mobile: +354 844 [email protected]

Glitnir Seafood Industry Report - China
47
Gísli SigurgeirssonSenior ManagerInternational Corporate BankingDirect line: +354 440 4765Mobile: +354 844 [email protected]
Tim OwenExecutive DirectorHead of Corporate Finance, UKDirect line: +44(0) 20 7710 9130 Mobile: +44(0) 7843 512 [email protected]
Timothy H. SpanosDirectorInternational Corporate BankingDirect line: +354 440 4777Mobile: +354 844 [email protected]
Hjörtur Thor SteindorssonCredit ManagerInternational Corporate BankingDirect line: +354 440 4503Mobile: +354 844 [email protected]
Gudmundur RagnarssonSenior ManagerCorporate Banking, IcelandDirect line: +354 440 4547Mobile: +354 844 [email protected]
Kyrre DaleCredit Manager | Glitnir BankSeafood Credit, NorwayDirect line: +47 7011 2034Mobile: +47 9137 [email protected]
Glitnir Seafood Team – Other Members
Atli Rafn BjörnssonAssociateCorporate Finance, UKDirect line: +44(0) 20 7710 9135 Mobile: +44(0) 788 798 [email protected]
Snorri Arnar VidarssonCredit ManagerInternational Corporate BankingDirect line: +354 440 4771Mobile: +354 844 [email protected]
Eiríkur R. EiríkssonSenior ManagerCorporate Risk AdvisoryDirect line: +354 440 4565Mobile: +354 844 [email protected]
Rúnar JónssonFX BrokerageCapital MarketsDirect line: +354 440 4489 Mobile: +354 844 [email protected]
Stefán Eiríks StefánssonFX BrokerageCapital MarketsDirect line: +354 440 4483Mobile: +354 844 [email protected]
Ingi Rafnar JúlíussonExecutive DirectorCapital MarketsDirect line: +354 440 4459Mobile: +354 844 [email protected]

Glitnir Seafood Industry Report - China
48
Legal Disclaimer
All opinions and analyses represent the views of Glitnir at the time of writing and are subject to change without notice. Glitnir and its employees cannot be held responsible for any trading conducted on the basis of the information and views presented here. Glitnir may at any time have vested interests in individual companies, for example as an investor, creditor or service provider, but its opinions and analyses are produced independently by Glitnir Region Asia & Americas, based on publicly available information on the company in question.
This Seafood Industry Report is written by
Ásmundur Gíslason – Glitnir – Region Asia & Americas [email protected]
Bjartur Logi Ye Shen – Glitnir – Region Asia & Americas [email protected]
Valdimar Halldórsson – Glitnir – Research [email protected]

www.glitnir.is/seafood