CHENIERE ENERGY, INC.cheniere.com/files/documents/Cheniere_Analyst_Day_2017_-_vFinal.pdfRandy...
126
CHENIERE ENERGY, INC. April 19, 2017 ANALYST DAY
Transcript of CHENIERE ENERGY, INC.cheniere.com/files/documents/Cheniere_Analyst_Day_2017_-_vFinal.pdfRandy...

CHENIERE ENERGY, INC. April 19, 2017 ANALYST DAY

Agenda
Strategic Overview
Financial Strategy & Guidance
Welcome & Logistics
Q&A
Commercial Strategy & Initiatives
Construction, Pipeline and Operations Panel
Closing Remarks
Commercial Panel
Special Guest Speaker
Randy Bhatia, Vice President, Investor Relations
Jack Fusco, President and Chief Executive Officer
Michael Wortley, Executive Vice President and Chief Financial Officer
Jack Fusco & Michael Wortley
Anatol Feygin, Executive Vice President and Chief Commercial Officer
Andrew Walker, Vice President, LNG Strategy and Communications Corey Grindal, Senior Vice President, Gas Supply Eric Bensaude, Managing Director, Commercial Operations and Asset Optimization Ramzi Mroueh, Managing Director, Origination
Ed Lehotsky, Senior Vice President, Engineering and Construction Chad Zamarin, Senior Vice President, Pipeline Doug Shanda, Senior Vice President, Operations
2
Break
Lunch
Jack Fusco, President and Chief Executive Officer
Safe Harbor Statements Forward-Looking Statements
This presentation contains certain statements that are, or may be deemed to be, “forward-looking statements” within the meaning of Section 27A of the Securities Act of 1933, as amended, and Section 21E of the Securities Exchange Act of 1934, as amended. All statements, other than statements of historical or present facts or conditions, included or incorporated by reference herein are “forward-looking statements.” Included among “forward-looking statements” are, among other things:
• statements regarding the ability of Cheniere Energy Partners, L.P. to pay distributions to its unitholders or Cheniere Energy Partners LP Holdings, LLC or Cheniere Energy, Inc. to pay dividends to its shareholders or participate in share or unit buybacks;
• statements regarding Cheniere Energy, Inc.’s, Cheniere Energy Partners LP Holdings, LLC’s or Cheniere Energy Partners, L.P.’s expected receipt of cash distributions from their respective subsidiaries; • statements that Cheniere Energy Partners, L.P. expects to commence or complete construction of its proposed liquefied natural gas (“LNG”) terminals, liquefaction facilities, pipeline facilities or other projects,
or any expansions or portions thereof, by certain dates or at all; • statements that Cheniere Energy, Inc. expects to commence or complete construction of its proposed LNG terminals, liquefaction facilities, pipeline facilities or other projects, or any expansions or portions then
of, by certain dates or at all; • statements regarding future levels of domestic and international natural gas production, supply or consumption or future levels of LNG imports into or exports from North America and other countries worldwide,
or purchases of natural gas, regardless of the source of such information, or the transportation or other infrastructure, or demand for and prices related to natural gas, LNG or other hydrocarbon products; • statements regarding any financing transactions or arrangements, or ability to enter into such transactions; • statements relating to the construction of our proposed liquefaction facilities and natural gas liquefaction trains (“Trains”) and the construction of the Corpus Christi Pipeline, including statements concerning the
engagement of any engineering, procurement and construction ("EPC") contractor or other contractor and the anticipated terms and provisions of any agreement with any EPC or other contractor, and anticipated costs related thereto;
• statements regarding any agreement to be entered into or performed substantially in the future, including any revenues anticipated to be received and the anticipated timing thereof, and statements regarding the amounts of total LNG regasification, natural gas, liquefaction or storage capacities that are, or may become, subject to contracts;
• statements regarding counterparties to our commercial contracts, construction contracts and other contracts; • statements regarding our planned development and construction of additional Trains or pipelines, including the financing of such Trains or pipelines; • statements that our Trains, when completed, will have certain characteristics, including amounts of liquefaction capacities; • statements regarding our business strategy, our strengths, our business and operation plans or any other plans, forecasts, projections or objectives, including anticipated revenues, capital expenditures,
maintenance and operating costs, run-rate SG&A estimates, cash flows, EBITDA, Adjusted EBITDA, run-rate EBITDA, contracted EBITDA, free cash flow, distributable cash flow, distributable cash flow per share, Net Loss, As Adjusted, and Net Loss Per Share, As Adjusted, any or all of which are subject to change;
• statements regarding projections of revenues, expenses, earnings or losses, working capital or other financial items; • statements regarding legislative, governmental, regulatory, administrative or other public body actions, approvals, requirements, permits, applications, filings, investigations, proceedings or decisions; • statements regarding our anticipated LNG and natural gas marketing activities; and • any other statements that relate to non-historical or future information.
These forward-looking statements are often identified by the use of terms and phrases such as “achieve,” “anticipate,” “believe,” “contemplate,” “develop,” “estimate,” “example,” “expect,” “forecast,” “goals,” “opportunities,” “plan,” “potential,” “project,” “propose,” “subject to,” “strategy,” “target,” and similar terms and phrases, or by use of future tense. Although we believe that the expectations reflected in these forward-looking statements are reasonable, they do involve assumptions, risks and uncertainties, and these expectations may prove to be incorrect. You should not place undue reliance on these forward-looking statements, which speak only as of the date of this presentation. Our actual results could differ materially from those anticipated in these forward-looking statements as a result of a variety of factors, including those discussed in “Risk Factors” in the Cheniere Energy, Inc., Cheniere Energy Partners, L.P. and Cheniere Energy Partners LP Holdings, LLC Annual Reports on Form 10-K filed with the SEC on February 24, 2017, which are incorporated by reference into this presentation. All forward-looking statements attributable to us or persons acting on our behalf are expressly qualified in their entirety by these ”Risk Factors.” These forward-looking statements are made as of the date of this presentation, and other than as required by law, we undertake no obligation to update or revise any forward-looking statement or provide reasons why actual results may differ, whether as a result of new information, future events or otherwise.
Reconciliation to U.S. GAAP Financial Information The following presentation includes certain “non-GAAP financial measures” as defined in Regulation G under the Securities Exchange Act of 1934, as amended. Schedules are included in the appendix hereto that reconcile the non-GAAP financial measures included in the following presentation to the most directly comparable financial measures calculated and presented in accordance with U.S. GAAP.
3
STRATEGIC OVERVIEW Jack Fusco, President and CEO
Key
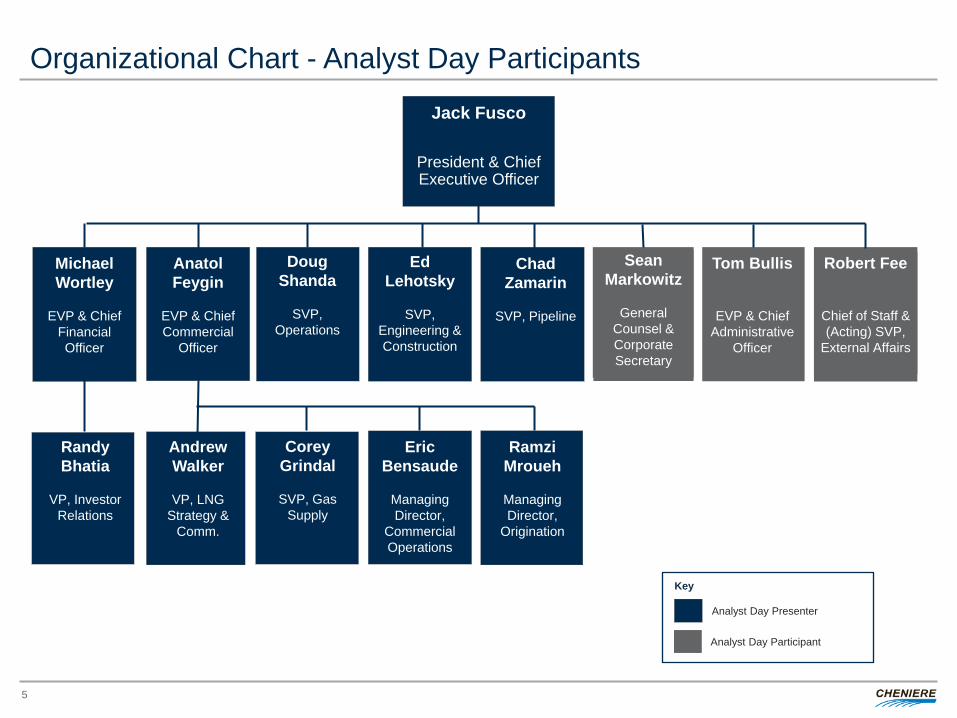
Jack Fusco
President & Chief Executive Officer
Michael Wortley
EVP & Chief
Financial Officer
Anatol Feygin
EVP & Chief Commercial
Officer
Doug Shanda
SVP,
Operations
Ed Lehotsky
SVP,
Engineering & Construction
Chad Zamarin
SVP, Pipeline
Tom Bullis
EVP & Chief Administrative
Officer
Robert Fee
Chief of Staff & (Acting) SVP,
External Affairs
Randy Bhatia
VP, Investor
Relations
Andrew Walker
VP, LNG
Strategy & Comm.
Corey Grindal
SVP, Gas
Supply
Eric Bensaude
Managing Director,
Commercial Operations
Ramzi Mroueh
Managing Director,
Origination
Analyst Day Presenter
Sean Markowitz
General
Counsel & Corporate Secretary
Analyst Day Participant
Organizational Chart - Analyst Day Participants
5
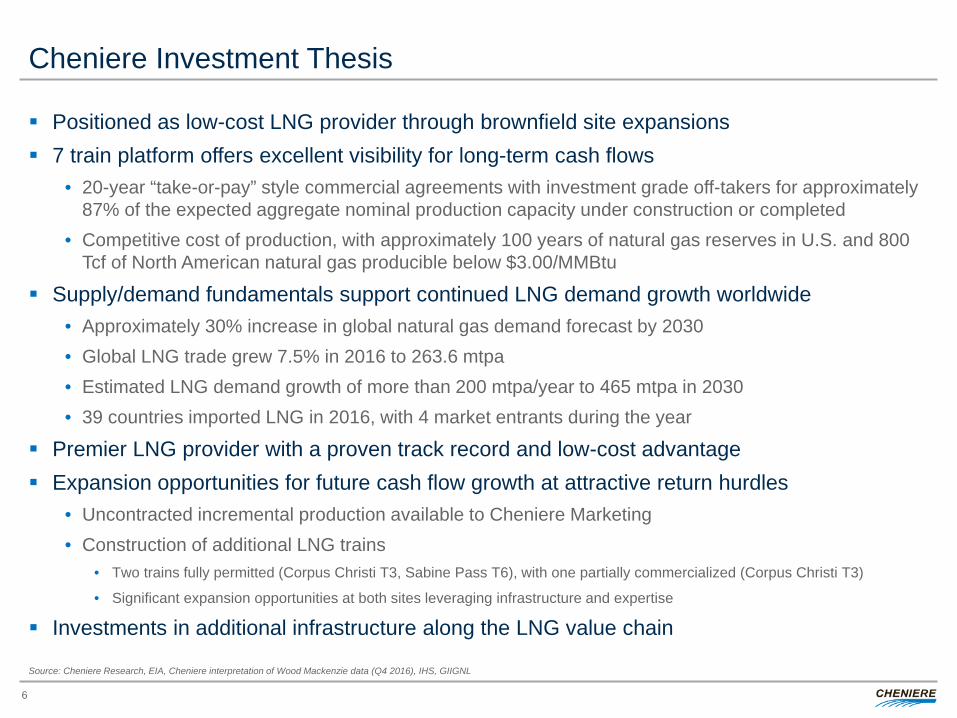
Cheniere Investment Thesis
Positioned as low-cost LNG provider through brownfield site expansions 7 train platform offers excellent visibility for long-term cash flows
• 20-year “take-or-pay” style commercial agreements with investment grade off-takers for approximately 87% of the expected aggregate nominal production capacity under construction or completed
• Competitive cost of production, with approximately 100 years of natural gas reserves in U.S. and 800 Tcf of North American natural gas producible below $3.00/MMBtu
Supply/demand fundamentals support continued LNG demand growth worldwide • Approximately 30% increase in global natural gas demand forecast by 2030 • Global LNG trade grew 7.5% in 2016 to 263.6 mtpa • Estimated LNG demand growth of more than 200 mtpa/year to 465 mtpa in 2030 • 39 countries imported LNG in 2016, with 4 market entrants during the year
Premier LNG provider with a proven track record and low-cost advantage Expansion opportunities for future cash flow growth at attractive return hurdles
• Uncontracted incremental production available to Cheniere Marketing • Construction of additional LNG trains
• Two trains fully permitted (Corpus Christi T3, Sabine Pass T6), with one partially commercialized (Corpus Christi T3)
• Significant expansion opportunities at both sites leveraging infrastructure and expertise
Investments in additional infrastructure along the LNG value chain
Source: Cheniere Research, EIA, Cheniere interpretation of Wood Mackenzie data (Q4 2016), IHS, GIIGNL
6
-
10.00
20.00
30.00
40.00
50.00
60.00
-
2.00
4.00
6.00
8.00
10.00
Henry Hub Oil Parity (Brent) Cheniere Share Price (LNG)
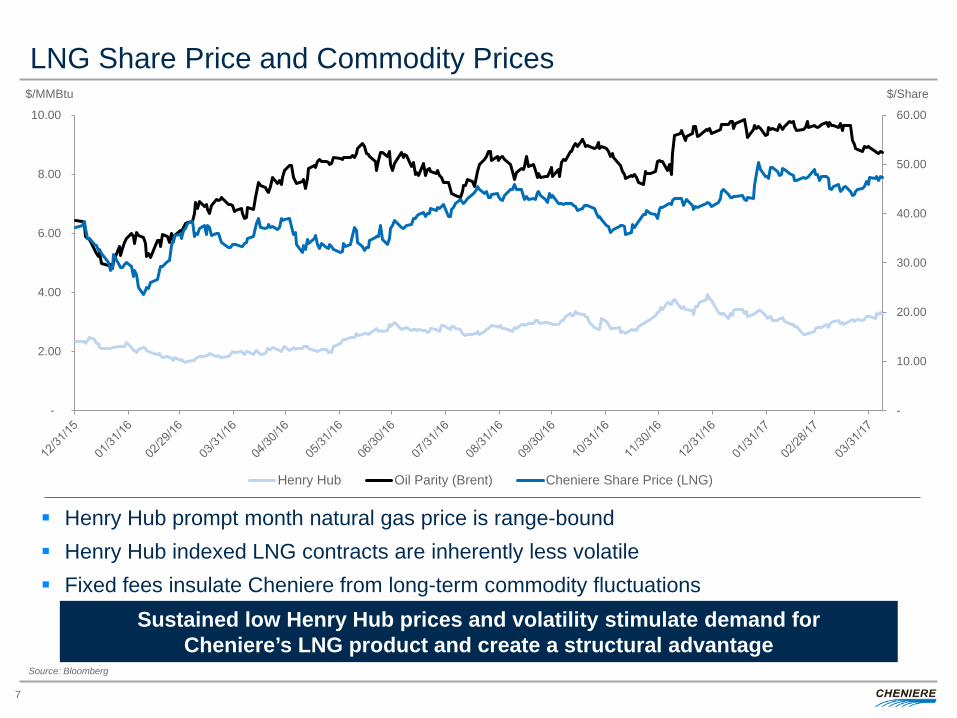
LNG Share Price and Commodity Prices
Henry Hub prompt month natural gas price is range-bound Henry Hub indexed LNG contracts are inherently less volatile Fixed fees insulate Cheniere from long-term commodity fluctuations
$/MMBtu $/Share
Sustained low Henry Hub prices and volatility stimulate demand for Cheniere’s LNG product and create a structural advantage
7
Source: Bloomberg
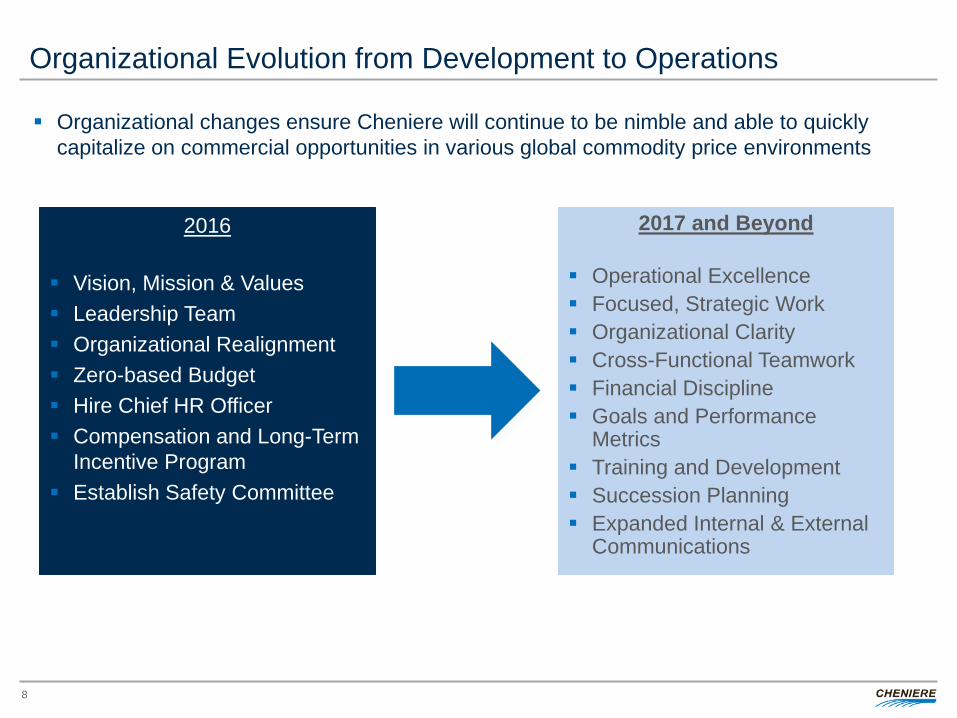
Organizational Evolution from Development to Operations
2016
Vision, Mission & Values Leadership Team Organizational Realignment Zero-based Budget Hire Chief HR Officer Compensation and Long-Term
Incentive Program Establish Safety Committee
2017 and Beyond
Operational Excellence Focused, Strategic Work Organizational Clarity Cross-Functional Teamwork Financial Discipline Goals and Performance
Metrics Training and Development Succession Planning Expanded Internal & External
Communications
Organizational changes ensure Cheniere will continue to be nimble and able to quickly capitalize on commercial opportunities in various global commodity price environments
8
Engineering & Construction and Operations
Execute on construction of LNG platform safely, on time, and on budget
Transition the trains from construction management to operations management safely, efficiently, and effectively
Identify and incorporate lessons learned • Cross-functional team working together to identify lessons learned during construction, commissioning,
and operations • Implement improvements and optimize processes across trains and locations
Build operational best practices to increase LNG production reliability and efficiency
• Identify bottlenecks and areas of opportunity to maintain maximum performance • Execute on efficiencies to maximize production • Develop longer-term capital investment strategy to alleviate bottlenecks
Leverage expertise and brownfield advantage to explore expansion opportunities
• Sabine Pass and Corpus Christi brownfield expansions
9
Financial and Commercial
Disciplined long-term financial strategy enables expansion opportunities for future cash flow growth at attractive return hurdles
Contracted cash flows, strong balance sheet and liquidity, and SPL’s investment grade ratings provide optionality and lower costs for future financing needs
• No long-term debt maturities until 2020 • Investment grade ratings for SPL from Fitch and S&P
Financial and Commercial teams working together to offer innovative and competitive
contract structures to customers • Ready to deliver now on either FOB or DES terms, which allows greater flexibility and creativity • Ability to offer contracts on a range of terms, quantities, and tenors • Willingness and ability to invest strategically along LNG value chain to enhance and support core LNG
platform
Full Service LNG offering to underwrite new liquefaction capacity
• U.S. gas supply management, LNG operations, LNG marketing and shipping • Global origination team
10
Existing Capacity
Newly Operational
Under Construction
0
50
100
150
200
250
300
350
400
450
500
2013 2014 2015 2016 2017 2018 2019 2020 2021 2022 2023 2024 2025 2026 2027 2028 2029 2030
Market tightening
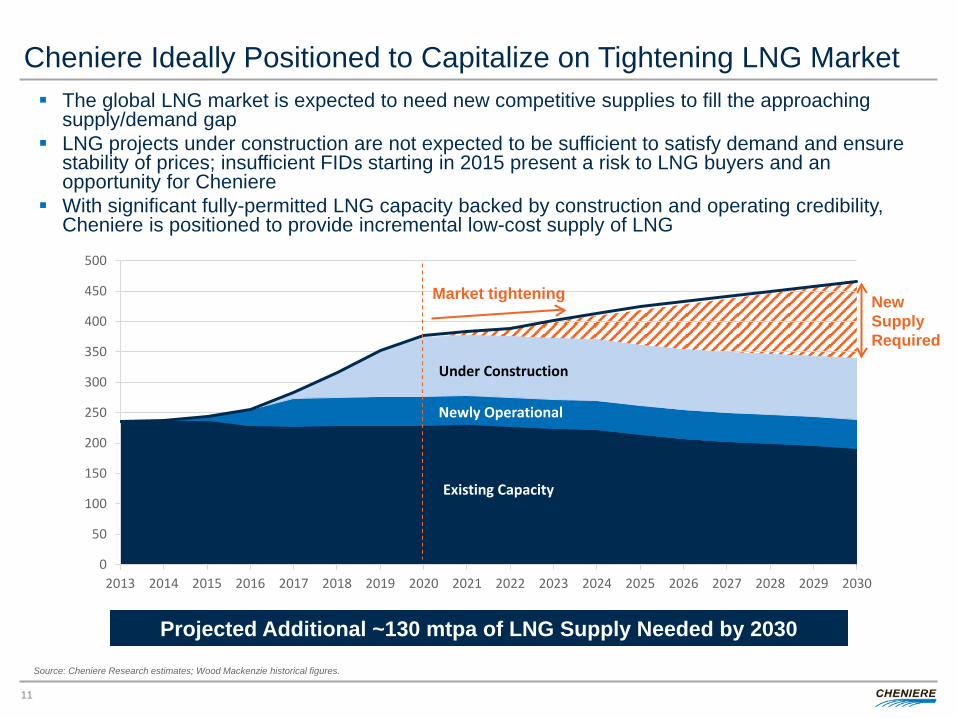
Cheniere Ideally Positioned to Capitalize on Tightening LNG Market The global LNG market is expected to need new competitive supplies to fill the approaching
supply/demand gap LNG projects under construction are not expected to be sufficient to satisfy demand and ensure
stability of prices; insufficient FIDs starting in 2015 present a risk to LNG buyers and an opportunity for Cheniere
With significant fully-permitted LNG capacity backed by construction and operating credibility, Cheniere is positioned to provide incremental low-cost supply of LNG
11
Source: Cheniere Research estimates; Wood Mackenzie historical figures.
Projected Additional ~130 mtpa of LNG Supply Needed by 2030
New Supply Required
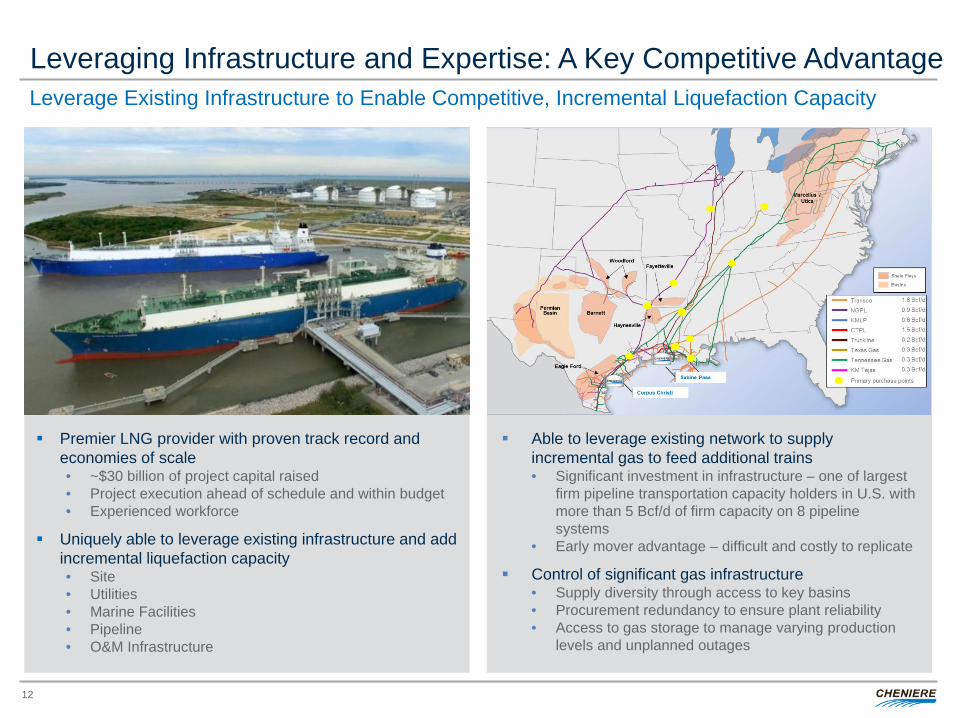
Leveraging Infrastructure and Expertise: A Key Competitive Advantage Leverage Existing Infrastructure to Enable Competitive, Incremental Liquefaction Capacity
Able to leverage existing network to supply incremental gas to feed additional trains • Significant investment in infrastructure – one of largest
firm pipeline transportation capacity holders in U.S. with more than 5 Bcf/d of firm capacity on 8 pipeline systems
• Early mover advantage – difficult and costly to replicate
Control of significant gas infrastructure • Supply diversity through access to key basins • Procurement redundancy to ensure plant reliability • Access to gas storage to manage varying production
levels and unplanned outages
Premier LNG provider with proven track record and economies of scale • ~$30 billion of project capital raised • Project execution ahead of schedule and within budget • Experienced workforce
Uniquely able to leverage existing infrastructure and add incremental liquefaction capacity • Site • Utilities • Marine Facilities • Pipeline • O&M Infrastructure
12
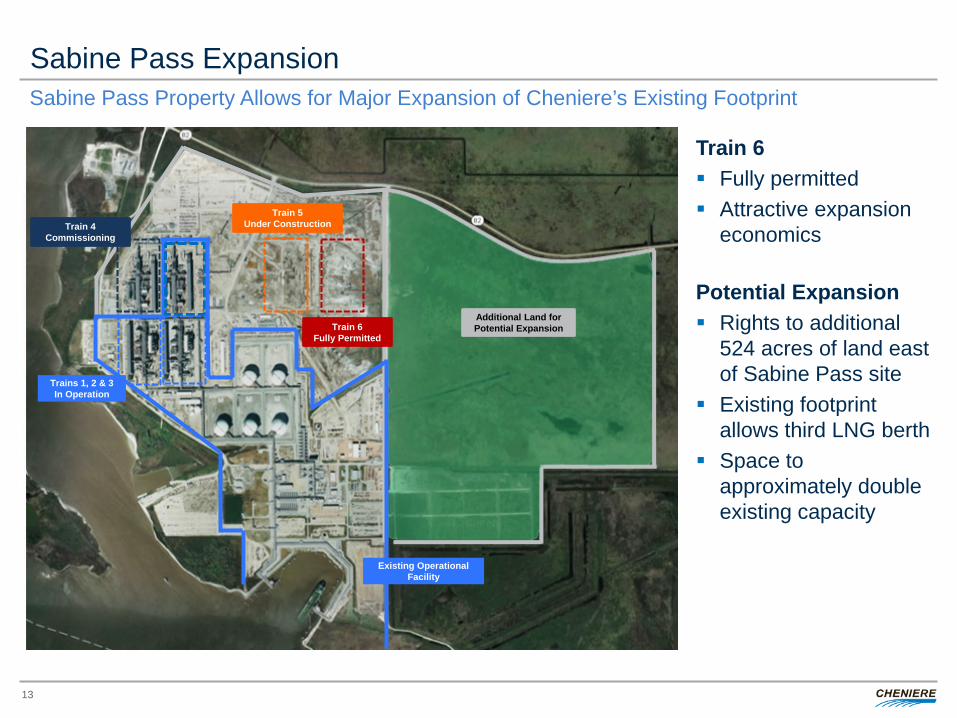
Sabine Pass Expansion Sabine Pass Property Allows for Major Expansion of Cheniere’s Existing Footprint
Artist’s rendition
Train 6 Fully permitted Attractive expansion
economics Potential Expansion Rights to additional
524 acres of land east of Sabine Pass site
Existing footprint allows third LNG berth
Space to approximately double existing capacity
13
TBU
Trains 1, 2 & 3 In Operation
Train 4 Commissioning
Train 5 Under Construction
Additional Land for Potential Expansion Train 6
Fully Permitted
Existing Operational Facility
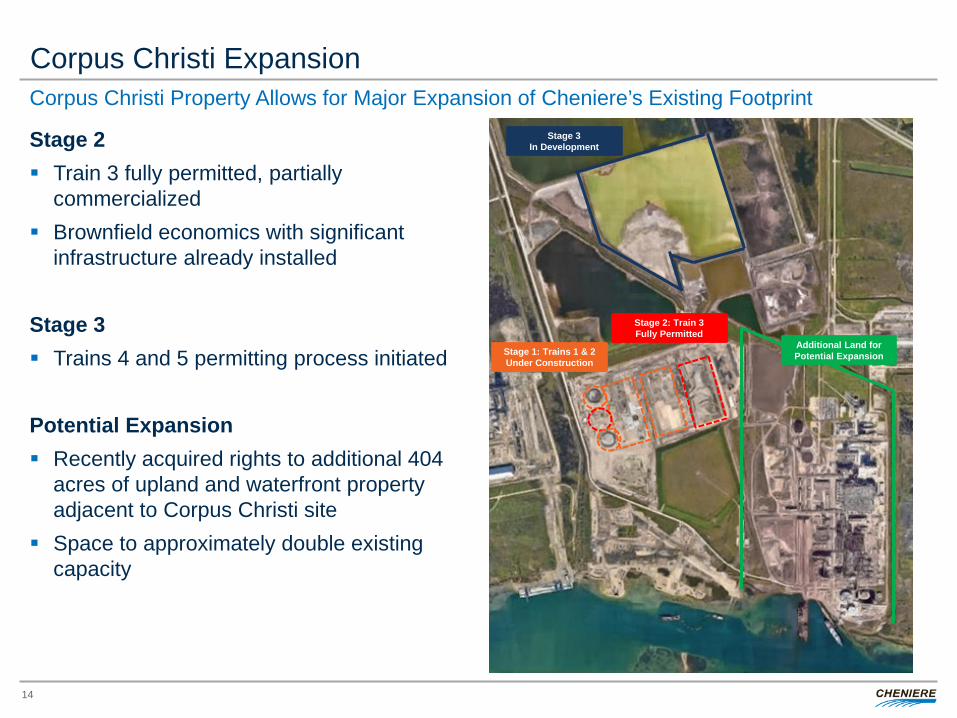
Additional Land for Potential Expansion
Stage 3 In Development
Stage 2: Train 3 Fully Permitted
Stage 1: Trains 1 & 2 Under Construction
Corpus Christi Expansion Corpus Christi Property Allows for Major Expansion of Cheniere’s Existing Footprint
Stage 2 Train 3 fully permitted, partially
commercialized Brownfield economics with significant
infrastructure already installed
Stage 3 Trains 4 and 5 permitting process initiated Potential Expansion Recently acquired rights to additional 404
acres of upland and waterfront property adjacent to Corpus Christi site
Space to approximately double existing capacity
14
15
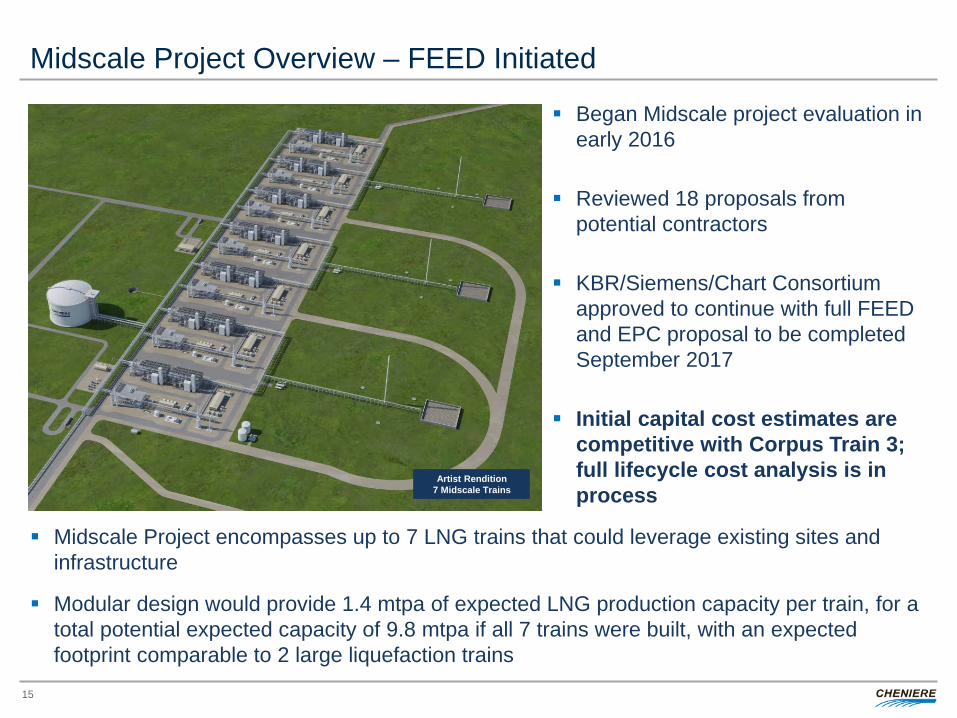
Midscale Project Overview – FEED Initiated
Began Midscale project evaluation in early 2016
Reviewed 18 proposals from potential contractors
KBR/Siemens/Chart Consortium approved to continue with full FEED and EPC proposal to be completed September 2017
Initial capital cost estimates are competitive with Corpus Train 3; full lifecycle cost analysis is in process
Midscale Project encompasses up to 7 LNG trains that could leverage existing sites and infrastructure
Modular design would provide 1.4 mtpa of expected LNG production capacity per train, for a total potential expected capacity of 9.8 mtpa if all 7 trains were built, with an expected footprint comparable to 2 large liquefaction trains
Artist Rendition 7 Midscale Trains
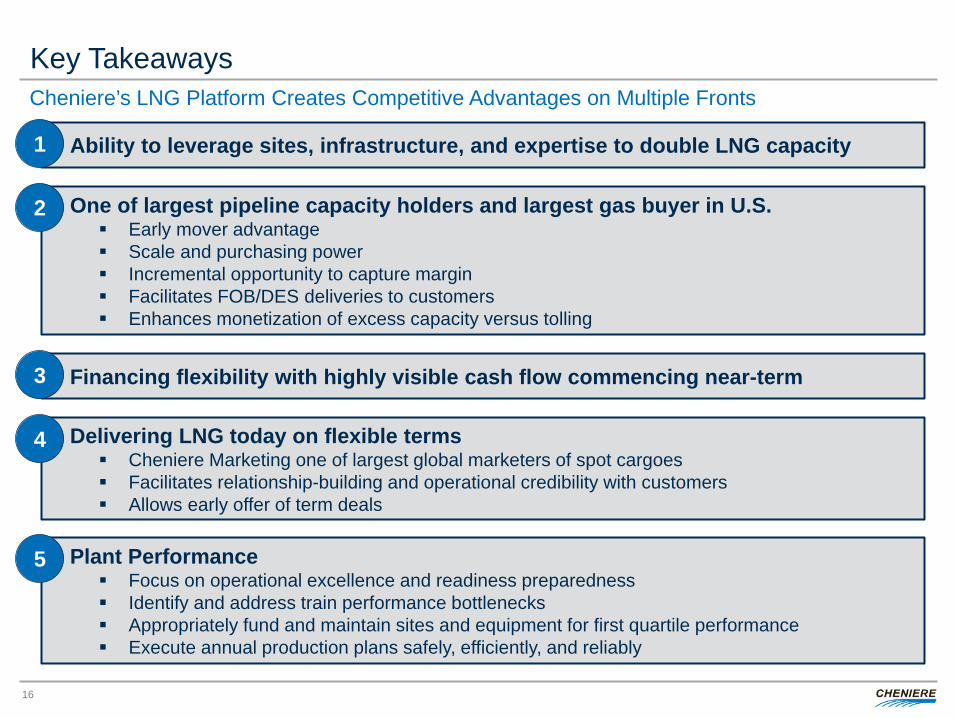
Key Takeaways
16
Ability to leverage sites, infrastructure, and expertise to double LNG capacity 1
One of largest pipeline capacity holders and largest gas buyer in U.S. Early mover advantage Scale and purchasing power Incremental opportunity to capture margin Facilitates FOB/DES deliveries to customers Enhances monetization of excess capacity versus tolling
2
Delivering LNG today on flexible terms Cheniere Marketing one of largest global marketers of spot cargoes Facilitates relationship-building and operational credibility with customers Allows early offer of term deals
4
Financing flexibility with highly visible cash flow commencing near-term 3
Plant Performance Focus on operational excellence and readiness preparedness Identify and address train performance bottlenecks Appropriately fund and maintain sites and equipment for first quartile performance Execute annual production plans safely, efficiently, and reliably
5
Cheniere’s LNG Platform Creates Competitive Advantages on Multiple Fronts

FINANCIAL STRATEGY AND GUIDANCE Michael Wortley, EVP and CFO
Table of Contents
18
Where We’ve Been I
Long-Term Balance Sheet Strategy II
Liquidity Summary III
Financial Projections and Capital Allocation Strategy IV
Strategic and Competitive Considerations V
Appendix VI
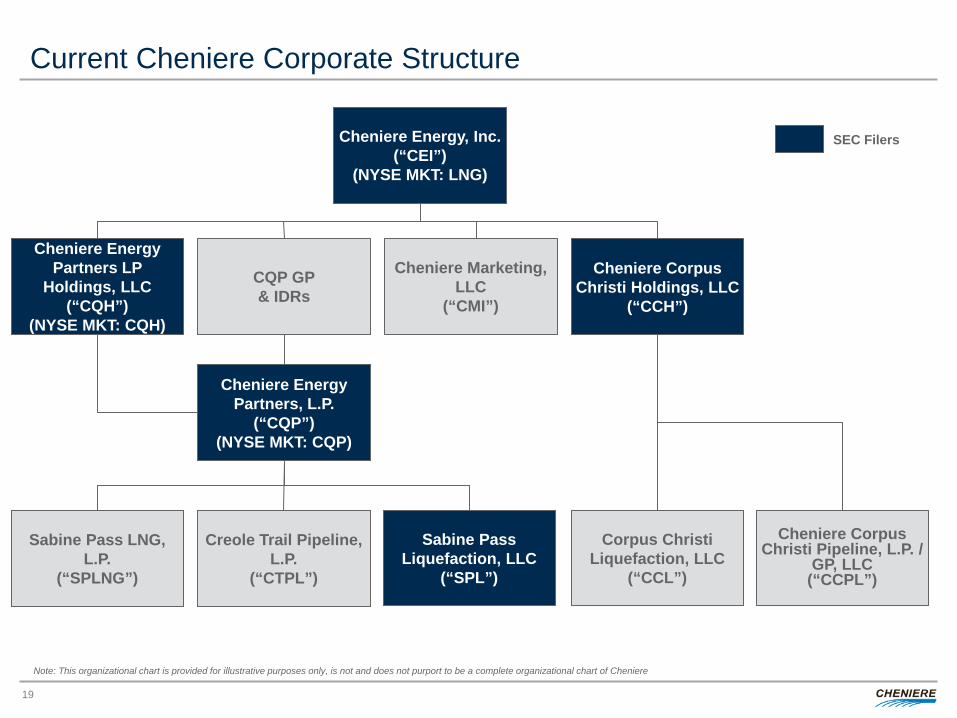
Current Cheniere Corporate Structure
19
Cheniere Energy, Inc. (“CEI”)
(NYSE MKT: LNG)
Cheniere Energy Partners, L.P.
(“CQP”) (NYSE MKT: CQP)
Sabine Pass LNG, L.P.
(“SPLNG”)
Sabine Pass Liquefaction, LLC
(“SPL”)
Creole Trail Pipeline, L.P.
(“CTPL”)
Cheniere Energy Partners LP
Holdings, LLC (“CQH”)
(NYSE MKT: CQH)
Corpus Christi Liquefaction, LLC
(“CCL”)
Cheniere Corpus Christi Holdings, LLC
(“CCH”)
Cheniere Corpus Christi Pipeline, L.P. /
GP, LLC (“CCPL”)
CQP GP & IDRs
Cheniere Marketing, LLC
(“CMI”)
SEC Filers
Note: This organizational chart is provided for illustrative purposes only, is not and does not purport to be a complete organizational chart of Cheniere

CHENIERE ENERGY, INC. WHERE WE’VE BEEN
I
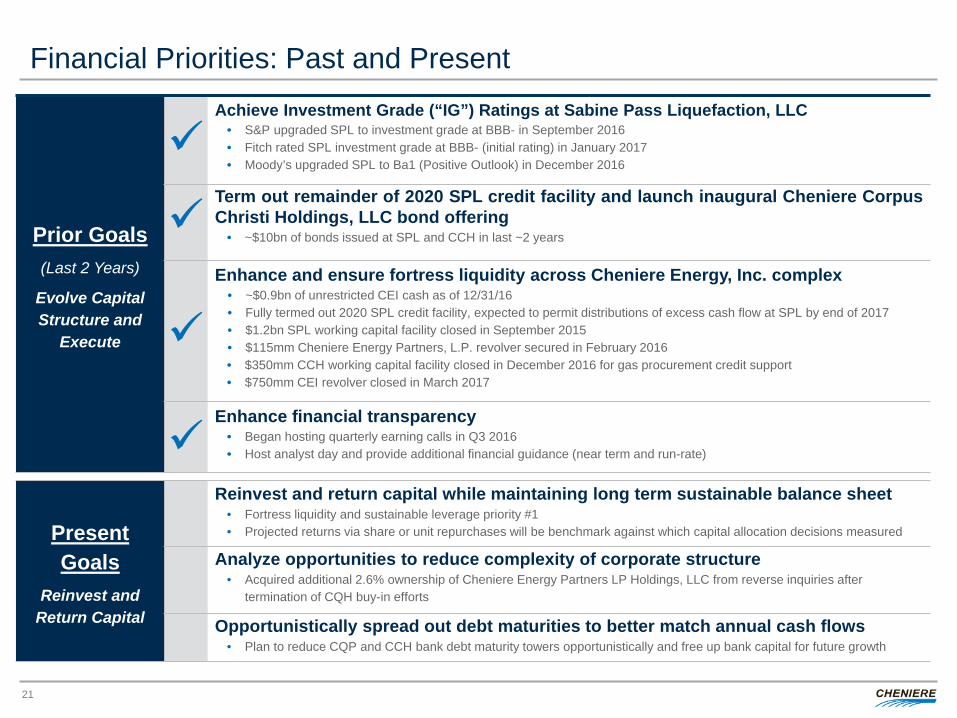
Financial Priorities: Past and Present
21
Prior Goals (Last 2 Years)
Evolve Capital Structure and
Execute
Achieve Investment Grade (“IG”) Ratings at Sabine Pass Liquefaction, LLC • S&P upgraded SPL to investment grade at BBB- in September 2016 • Fitch rated SPL investment grade at BBB- (initial rating) in January 2017 • Moody’s upgraded SPL to Ba1 (Positive Outlook) in December 2016
Term out remainder of 2020 SPL credit facility and launch inaugural Cheniere Corpus Christi Holdings, LLC bond offering
• ~$10bn of bonds issued at SPL and CCH in last ~2 years
Enhance and ensure fortress liquidity across Cheniere Energy, Inc. complex • ~$0.9bn of unrestricted CEI cash as of 12/31/16 • Fully termed out 2020 SPL credit facility, expected to permit distributions of excess cash flow at SPL by end of 2017 • $1.2bn SPL working capital facility closed in September 2015 • $115mm Cheniere Energy Partners, L.P. revolver secured in February 2016 • $350mm CCH working capital facility closed in December 2016 for gas procurement credit support • $750mm CEI revolver closed in March 2017
Enhance financial transparency • Began hosting quarterly earning calls in Q3 2016 • Host analyst day and provide additional financial guidance (near term and run-rate)
Present Goals
Reinvest and Return Capital
Reinvest and return capital while maintaining long term sustainable balance sheet • Fortress liquidity and sustainable leverage priority #1 • Projected returns via share or unit repurchases will be benchmark against which capital allocation decisions measured
Analyze opportunities to reduce complexity of corporate structure • Acquired additional 2.6% ownership of Cheniere Energy Partners LP Holdings, LLC from reverse inquiries after
termination of CQH buy-in efforts
Opportunistically spread out debt maturities to better match annual cash flows • Plan to reduce CQP and CCH bank debt maturity towers opportunistically and free up bank capital for future growth
Ba3
BB++1Notch
BBB-(Stab le)
+1Notch
+1 Notch
Ba1(Positive)
BBB-(Stab le)
Ba3 / BB-
Ba2 / BB
Ba1 / BB+
Baa3 / BBB-Investment
Grade
Baa2 / BBB
Baa1 / BBB+
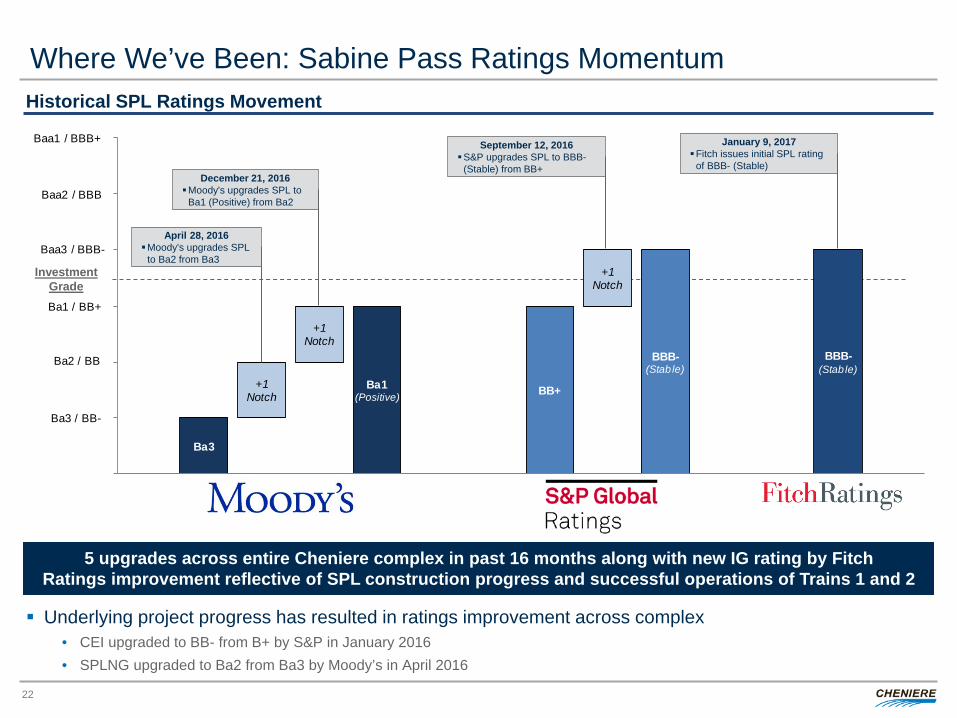
Where We’ve Been: Sabine Pass Ratings Momentum
22
December 21, 2016 Moody's upgrades SPL to
Ba1 (Positive) from Ba2
September 12, 2016 S&P upgrades SPL to BBB-
(Stable) from BB+
January 9, 2017 Fitch issues initial SPL rating
of BBB- (Stable)
5 upgrades across entire Cheniere complex in past 16 months along with new IG rating by Fitch Ratings improvement reflective of SPL construction progress and successful operations of Trains 1 and 2
April 28, 2016 Moody's upgrades SPL
to Ba2 from Ba3
Historical SPL Ratings Movement
Underlying project progress has resulted in ratings improvement across complex • CEI upgraded to BB- from B+ by S&P in January 2016 • SPLNG upgraded to Ba2 from Ba3 by Moody’s in April 2016
Investment Grade
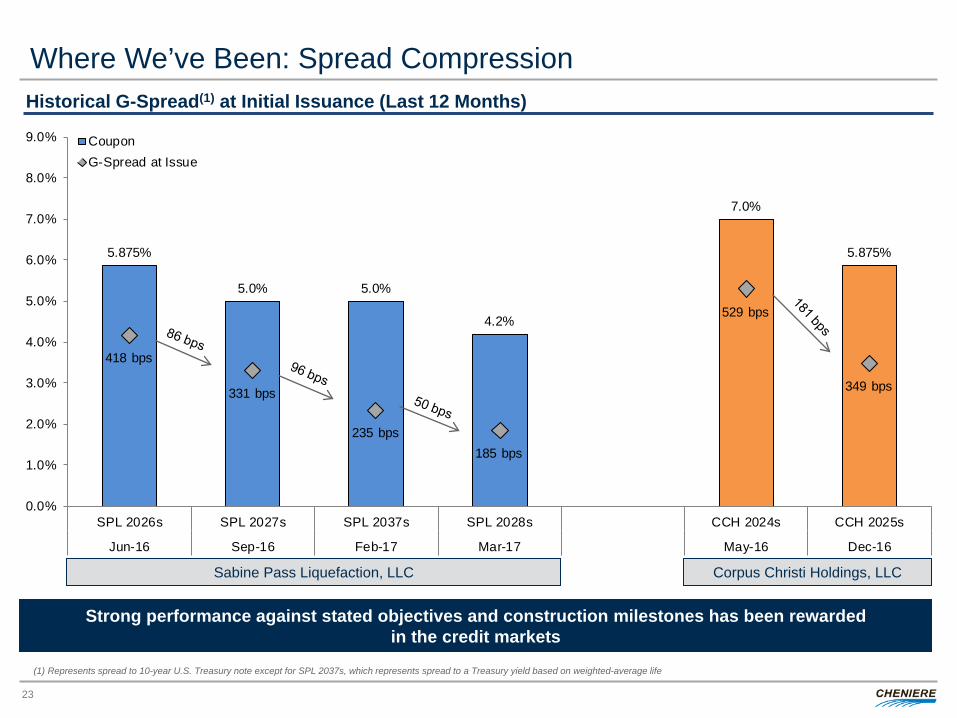
5.875%
5.0% 5.0%
4.2%
7.0%
5.875%
418 bps
331 bps
235 bps185 bps
529 bps
349 bps
0.0%
1.0%
2.0%
3.0%
4.0%
5.0%
6.0%
7.0%
8.0%
9.0%
SPL 2026s SPL 2027s SPL 2037s SPL 2028s – CCH 2024s CCH 2025s
Jun-16 Sep-16 Feb-17 Mar-17 – May-16 Dec-16
CouponG-Spread at Issue
Where We’ve Been: Spread Compression
23
Historical G-Spread(1) at Initial Issuance (Last 12 Months)
Strong performance against stated objectives and construction milestones has been rewarded in the credit markets
Sabine Pass Liquefaction, LLC Corpus Christi Holdings, LLC
(1) Represents spread to 10-year U.S. Treasury note except for SPL 2037s, which represents spread to a Treasury yield based on weighted-average life
$8.4
–
$1.0
$2.0
$3.0
$4.0
$5.0
$6.0
$7.0
$8.0
$9.0 CCH - Credit Facilities
$1.2
5
$1.5
$6.0
–
$1.0
$2.0
$3.0
$4.0
$5.0
$6.0
$7.0
$8.0
$9.0 CCH - Credit Facilities
CCH - Senior Notes
$1.7
$0.4 $0.4
$4.6
$5
.0
$2.0
$1.0
$1.5
$2.0
$2.0
–
$1.0
$2.0
$3.0
$4.0
$5.0
$6.0 SPLNG - Senior NotesCTPL - Term LoanSPL - Credit FacilitiesSPL - Senior Notes
$2.8
$2.0
$1.0
$1.5
$2.0
$2.0
$1.5
$1.5
$1.3
5
$0.8
–
$1.0
$2.0
$3.0
$4.0
$5.0
$6.0 CQP - Credit FacilitiesSPL - Senior Notes
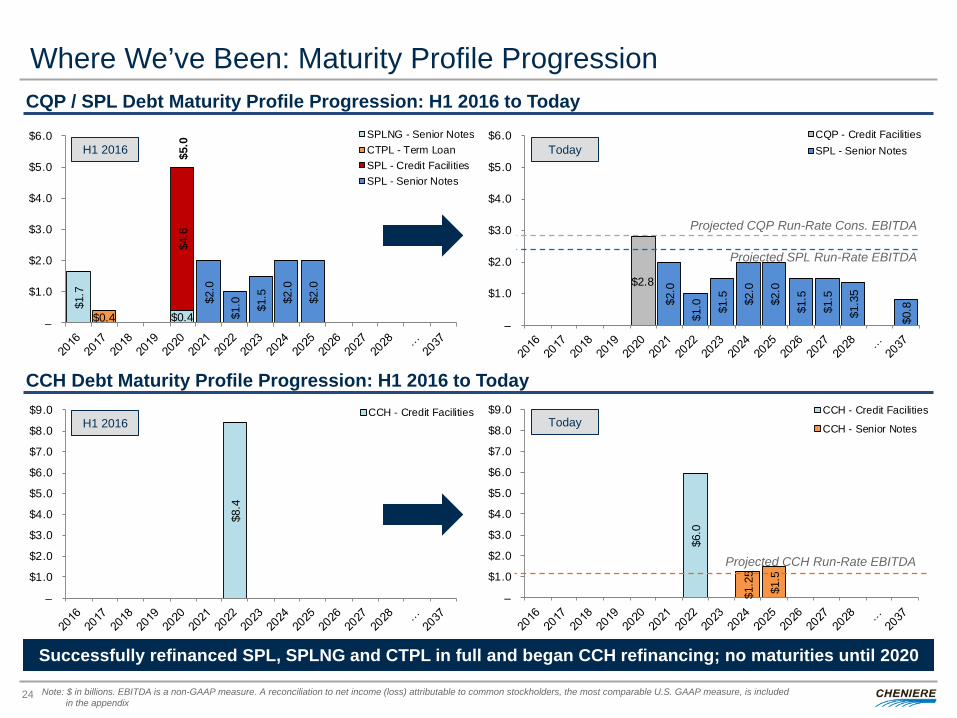
Where We’ve Been: Maturity Profile Progression
24
CQP / SPL Debt Maturity Profile Progression: H1 2016 to Today
Today
Successfully refinanced SPL, SPLNG and CTPL in full and began CCH refinancing; no maturities until 2020
H1 2016
Today
CCH Debt Maturity Profile Progression: H1 2016 to Today
H1 2016
Projected SPL Run-Rate EBITDA
Projected CQP Run-Rate Cons. EBITDA
Projected CCH Run-Rate EBITDA
Note: $ in billions. EBITDA is a non-GAAP measure. A reconciliation to net income (loss) attributable to common stockholders, the most comparable U.S. GAAP measure, is included in the appendix
$0$1$2$3$4$5$6$7$8$9
$10$11$12$13$14$15$16$17$18$19$20$21$22$23$24$25
Sep-
12N
ov-1
2Ja
n-13
Mar
-13
May
-13
Jul-1
3Se
p-13
Nov
-13
Jan-
14M
ar-1
4M
ay-1
4Ju
l-14
Sep-
14N
ov-1
4Ja
n-15
Mar
-15
May
-15
Jul-1
5Se
p-15
Nov
-15
Jan-
16M
ar-1
6M
ay-1
6Ju
l-16
Sep-
16N
ov-1
6Ja
n-17
Mar
-17
May
-17
Jul-1
7Se
p-17
Nov
-17
Jan-
18M
ar-1
8M
ay-1
8Ju
l-18
Sep-
18N
ov-1
8Ja
n-19
Mar
-19
May
-19
Jul-1
9Se
p-19
Nov
-19
Jan-
20M
ar-2
0M
ay-2
0
Cum
ulat
ive s
pend
to e
nd o
f per
iod
($bn
)
Current Spend - Total SPL and CCL Project
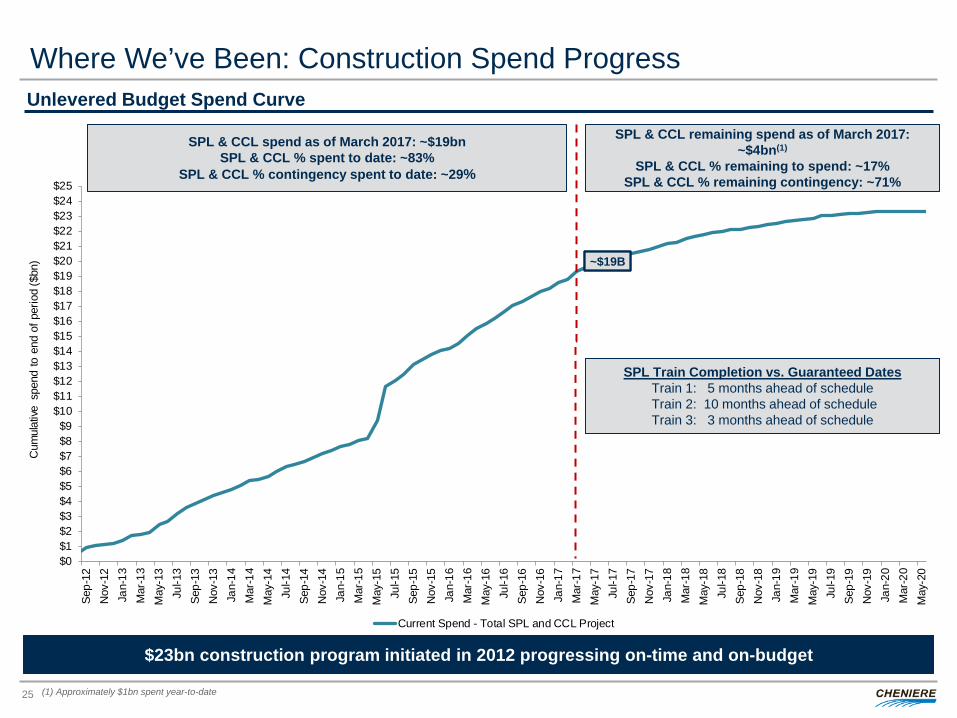
Where We’ve Been: Construction Spend Progress
25
$23bn construction program initiated in 2012 progressing on-time and on-budget
Unlevered Budget Spend Curve
SPL & CCL spend as of March 2017: ~$19bn SPL & CCL % spent to date: ~83%
SPL & CCL % contingency spent to date: ~29%
SPL & CCL remaining spend as of March 2017: ~$4bn(1)
SPL & CCL % remaining to spend: ~17% SPL & CCL % remaining contingency: ~71%
SPL Train Completion vs. Guaranteed Dates Train 1: 5 months ahead of schedule Train 2: 10 months ahead of schedule Train 3: 3 months ahead of schedule
~$19B
(1) Approximately $1bn spent year-to-date

CHENIERE ENERGY, INC. LONG-TERM BALANCE SHEET STRATEGY
II
AA- to AA+ Rated
20.2%
A- to A+ Rated20.3%
BBB- to BBB+ Rated59.5%
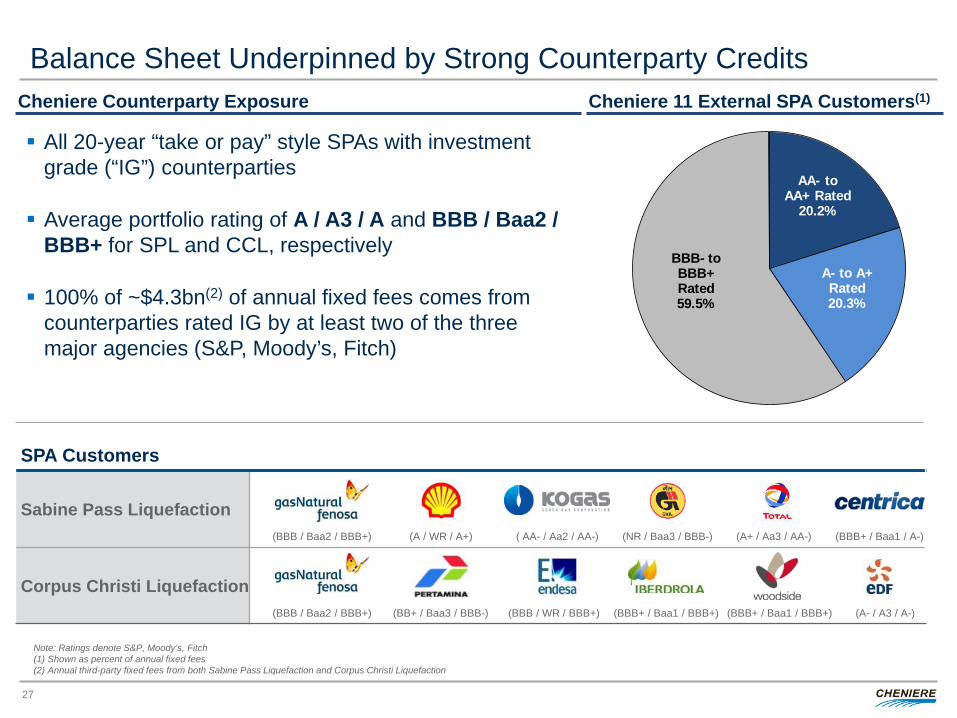
Balance Sheet Underpinned by Strong Counterparty Credits
27
Cheniere Counterparty Exposure
SPA Customers
Sabine Pass Liquefaction
Corpus Christi Liquefaction
Cheniere 11 External SPA Customers(1)
(BBB / Baa2 / BBB+) (NR / Baa3 / BBB-) ( AA- / Aa2 / AA-) (A+ / Aa3 / AA-) (BBB+ / Baa1 / A-) (A / WR / A+)
(BBB / Baa2 / BBB+) (BBB+ / Baa1 / BBB+) (BBB / WR / BBB+) (BBB+ / Baa1 / BBB+) (A- / A3 / A-) (BB+ / Baa3 / BBB-)
All 20-year “take or pay” style SPAs with investment grade (“IG”) counterparties
Average portfolio rating of A / A3 / A and BBB / Baa2 / BBB+ for SPL and CCL, respectively
100% of ~$4.3bn(2) of annual fixed fees comes from counterparties rated IG by at least two of the three major agencies (S&P, Moody’s, Fitch)
Note: Ratings denote S&P, Moody’s, Fitch (1) Shown as percent of annual fixed fees (2) Annual third-party fixed fees from both Sabine Pass Liquefaction and Corpus Christi Liquefaction
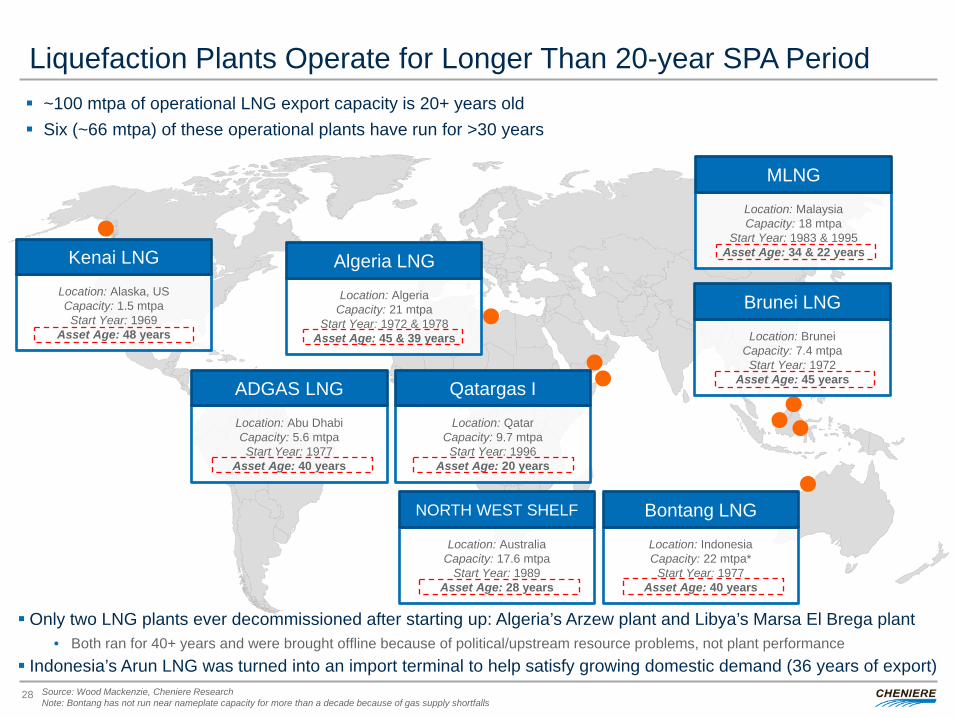
Liquefaction Plants Operate for Longer Than 20-year SPA Period
Location: Abu Dhabi Capacity: 5.6 mtpa Start Year: 1977
Asset Age: 40 years
ADGAS LNG
Location: Algeria Capacity: 21 mtpa
Start Year: 1972 & 1978 Asset Age: 45 & 39 years
Algeria LNG
Location: Brunei Capacity: 7.4 mtpa Start Year: 1972
Asset Age: 45 years
Brunei LNG
Location: Malaysia Capacity: 18 mtpa
Start Year: 1983 & 1995 Asset Age: 34 & 22 years
MLNG
Location: Alaska, US Capacity: 1.5 mtpa Start Year: 1969
Asset Age: 48 years
Kenai LNG
Only two LNG plants ever decommissioned after starting up: Algeria’s Arzew plant and Libya’s Marsa El Brega plant • Both ran for 40+ years and were brought offline because of political/upstream resource problems, not plant performance
Indonesia’s Arun LNG was turned into an import terminal to help satisfy growing domestic demand (36 years of export)
Location: Qatar Capacity: 9.7 mtpa Start Year: 1996
Asset Age: 20 years
Qatargas I
Location: Australia Capacity: 17.6 mtpa
Start Year: 1989 Asset Age: 28 years
NORTH WEST SHELF
Location: Indonesia Capacity: 22 mtpa*
Start Year: 1977 Asset Age: 40 years
Bontang LNG
28
~100 mtpa of operational LNG export capacity is 20+ years old Six (~66 mtpa) of these operational plants have run for >30 years
Source: Wood Mackenzie, Cheniere Research Note: Bontang has not run near nameplate capacity for more than a decade because of gas supply shortfalls
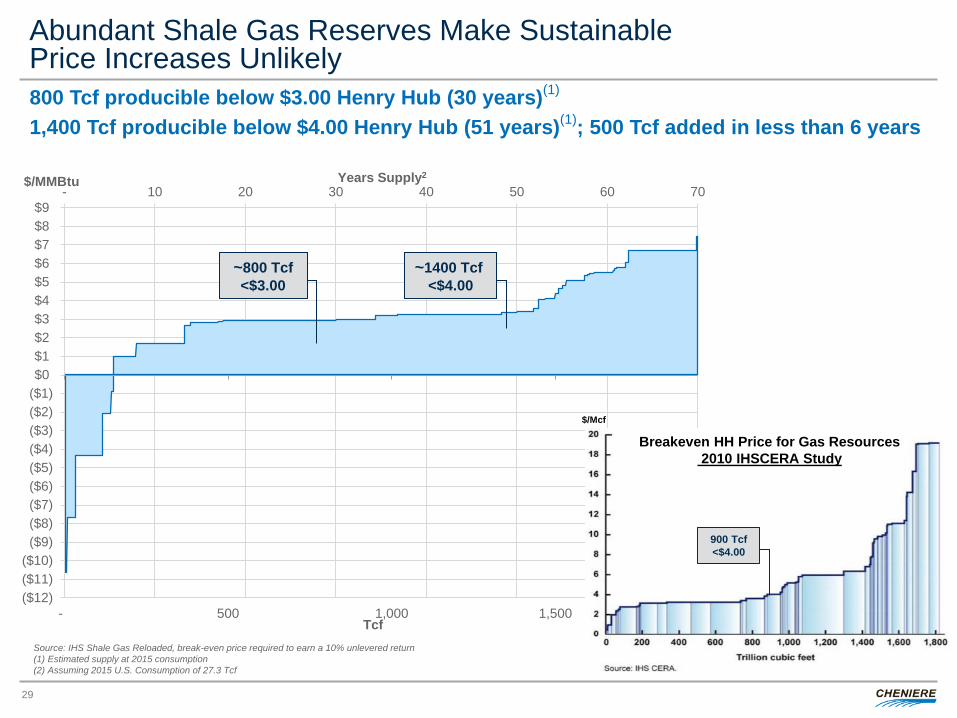
Abundant Shale Gas Reserves Make Sustainable Price Increases Unlikely
- 10 20 30 40 50 60 70
($12)($11)($10)($9)($8)($7)($6)($5)($4)($3)($2)($1)$0$1$2$3$4$5$6$7$8$9
- 500 1,000 1,500
Years Supply2 $/MMBtu
Tcf
29
800 Tcf producible below $3.00 Henry Hub (30 years)(1) 1,400 Tcf producible below $4.00 Henry Hub (51 years)(1); 500 Tcf added in less than 6 years
$/Mcf
Breakeven HH Price for Gas Resources 2010 IHSCERA Study
900 Tcf <$4.00
Source: IHS Shale Gas Reloaded, break-even price required to earn a 10% unlevered return (1) Estimated supply at 2015 consumption (2) Assuming 2015 U.S. Consumption of 27.3 Tcf
~800 Tcf <$3.00
~800 Tcf <$3.00
~1400 Tcf <$4.00
~1400 Tcf <$4.00
Long-term Capital Structure Plan
30
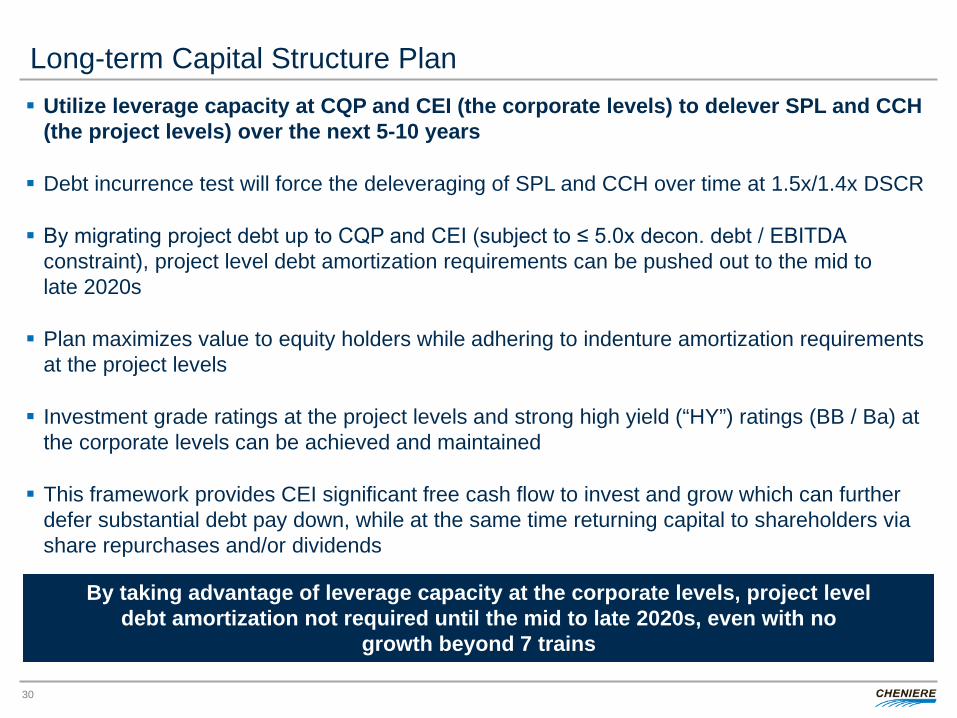
Utilize leverage capacity at CQP and CEI (the corporate levels) to delever SPL and CCH (the project levels) over the next 5-10 years
Debt incurrence test will force the deleveraging of SPL and CCH over time at 1.5x/1.4x DSCR
By migrating project debt up to CQP and CEI (subject to ≤ 5.0x decon. debt / EBITDA constraint), project level debt amortization requirements can be pushed out to the mid to late 2020s
Plan maximizes value to equity holders while adhering to indenture amortization requirements at the project levels
Investment grade ratings at the project levels and strong high yield (“HY”) ratings (BB / Ba) at the corporate levels can be achieved and maintained
This framework provides CEI significant free cash flow to invest and grow which can further defer substantial debt pay down, while at the same time returning capital to shareholders via share repurchases and/or dividends
By taking advantage of leverage capacity at the corporate levels, project level debt amortization not required until the mid to late 2020s, even with no
growth beyond 7 trains
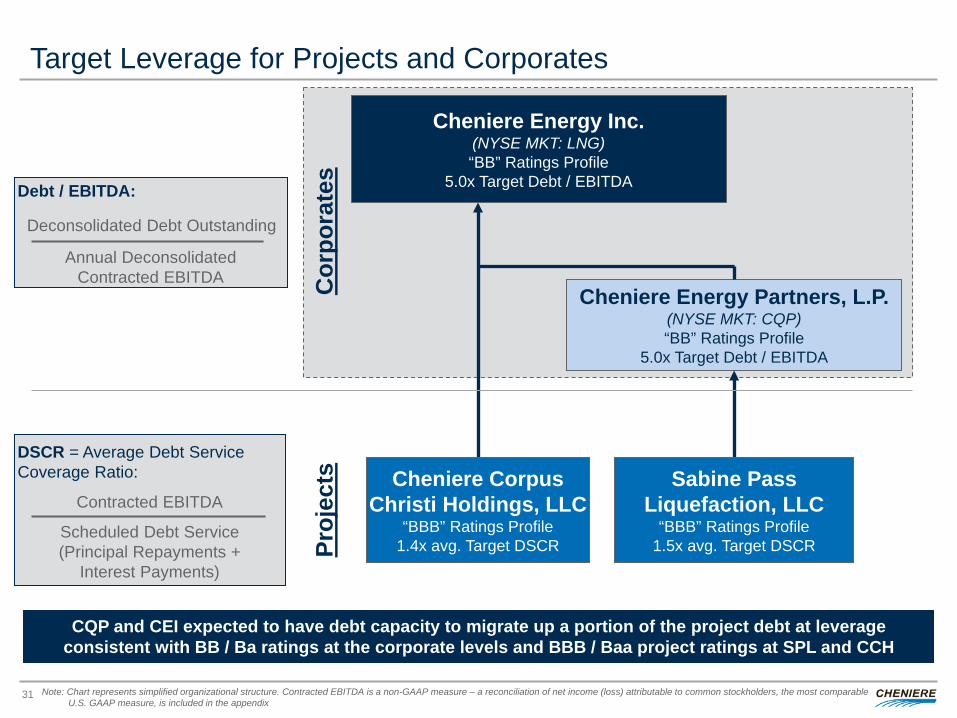
Target Leverage for Projects and Corporates
31
Cheniere Energy Inc. (NYSE MKT: LNG) “BB” Ratings Profile
5.0x Target Debt / EBITDA
Cheniere Energy Partners, L.P. (NYSE MKT: CQP) “BB” Ratings Profile
5.0x Target Debt / EBITDA
Sabine Pass Liquefaction, LLC
“BBB” Ratings Profile 1.5x avg. Target DSCR
Cheniere Corpus Christi Holdings, LLC
“BBB” Ratings Profile 1.4x avg. Target DSCR
Cor
pora
tes
Proj
ects
CQP and CEI expected to have debt capacity to migrate up a portion of the project debt at leverage consistent with BB / Ba ratings at the corporate levels and BBB / Baa project ratings at SPL and CCH
DSCR = Average Debt Service Coverage Ratio:
Debt / EBITDA:
Scheduled Debt Service (Principal Repayments +
Interest Payments)
Contracted EBITDA
Deconsolidated Debt Outstanding
Annual Deconsolidated Contracted EBITDA
Note: Chart represents simplified organizational structure. Contracted EBITDA is a non-GAAP measure – a reconciliation of net income (loss) attributable to common stockholders, the most comparable U.S. GAAP measure, is included in the appendix
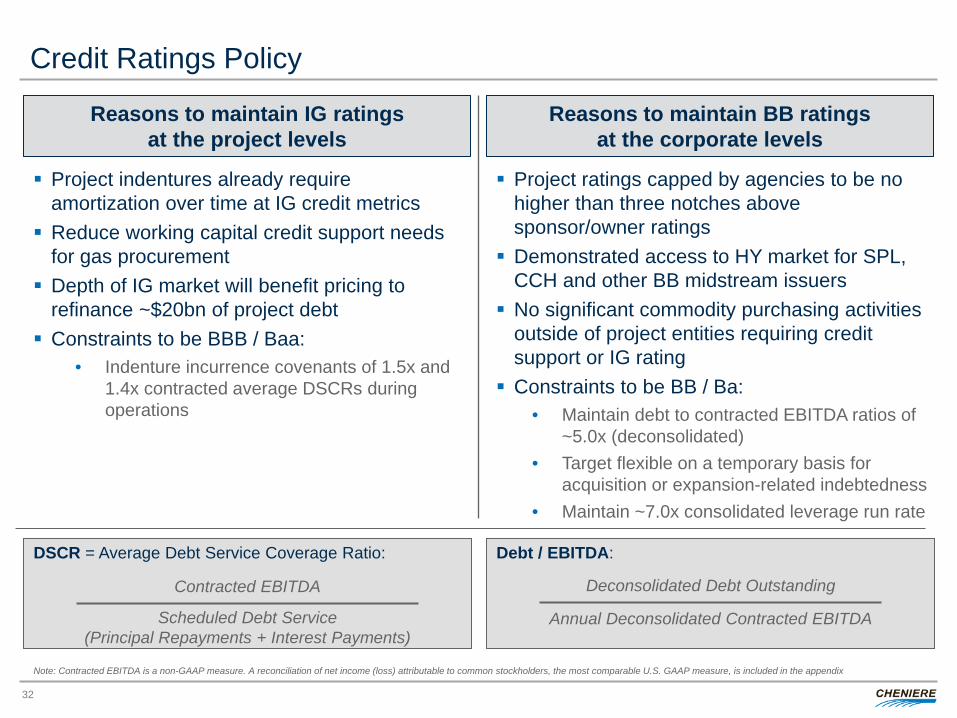
Credit Ratings Policy
32
Project ratings capped by agencies to be no higher than three notches above sponsor/owner ratings
Demonstrated access to HY market for SPL, CCH and other BB midstream issuers
No significant commodity purchasing activities outside of project entities requiring credit support or IG rating
Constraints to be BB / Ba: • Maintain debt to contracted EBITDA ratios of
~5.0x (deconsolidated) • Target flexible on a temporary basis for
acquisition or expansion-related indebtedness • Maintain ~7.0x consolidated leverage run rate
Project indentures already require amortization over time at IG credit metrics
Reduce working capital credit support needs for gas procurement
Depth of IG market will benefit pricing to refinance ~$20bn of project debt
Constraints to be BBB / Baa: • Indenture incurrence covenants of 1.5x and
1.4x contracted average DSCRs during operations
Reasons to maintain IG ratings at the project levels
Reasons to maintain BB ratings at the corporate levels
DSCR = Average Debt Service Coverage Ratio: Debt / EBITDA:
Contracted EBITDA
Scheduled Debt Service (Principal Repayments + Interest Payments)
Deconsolidated Debt Outstanding
Annual Deconsolidated Contracted EBITDA
Note: Contracted EBITDA is a non-GAAP measure. A reconciliation of net income (loss) attributable to common stockholders, the most comparable U.S. GAAP measure, is included in the appendix
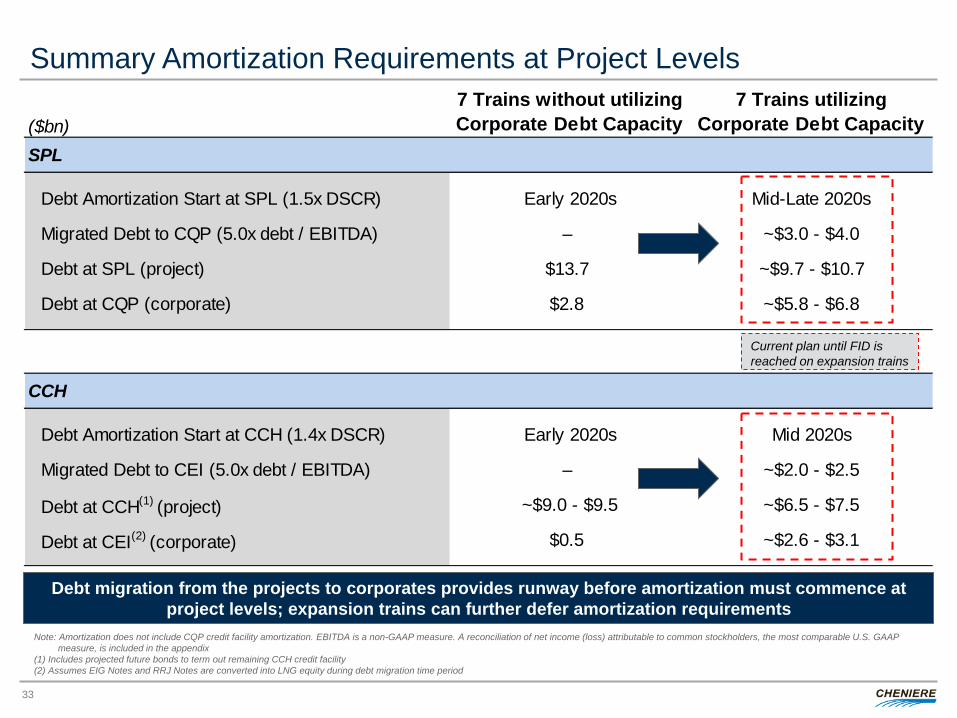
($bn)7 Trains without utilizing Corporate Debt Capacity
7 Trains utilizing Corporate Debt Capacity
SPL
Debt Amortization Start at SPL (1.5x DSCR) Early 2020s Mid-Late 2020s
Migrated Debt to CQP (5.0x debt / EBITDA) – ~$3.0 - $4.0
Debt at SPL (project) $13.7 ~$9.7 - $10.7
Debt at CQP (corporate) $2.8 ~$5.8 - $6.8
CCH
Debt Amortization Start at CCH (1.4x DSCR) Early 2020s Mid 2020s
Migrated Debt to CEI (5.0x debt / EBITDA) – ~$2.0 - $2.5
Debt at CCH(1) (project) ~$9.0 - $9.5 ~$6.5 - $7.5
Debt at CEI(2) (corporate) $0.5 ~$2.6 - $3.1
Summary Amortization Requirements at Project Levels
33
Debt migration from the projects to corporates provides runway before amortization must commence at project levels; expansion trains can further defer amortization requirements
Current plan until FID is reached on expansion trains
Note: Amortization does not include CQP credit facility amortization. EBITDA is a non-GAAP measure. A reconciliation of net income (loss) attributable to common stockholders, the most comparable U.S. GAAP measure, is included in the appendix (1) Includes projected future bonds to term out remaining CCH credit facility (2) Assumes EIG Notes and RRJ Notes are converted into LNG equity during debt migration time period
CHENIERE ENERGY, INC. LIQUIDITY SUMMARY
III
$0.2
$0.9 $0.3
$0.3
$0.1
$0.8
$0.1
$0.1
$0.0
$0.3
$0.5
$0.8
$1.0
$1.3
$1.5
$1.8
$2.0
CQP CEI
$bn
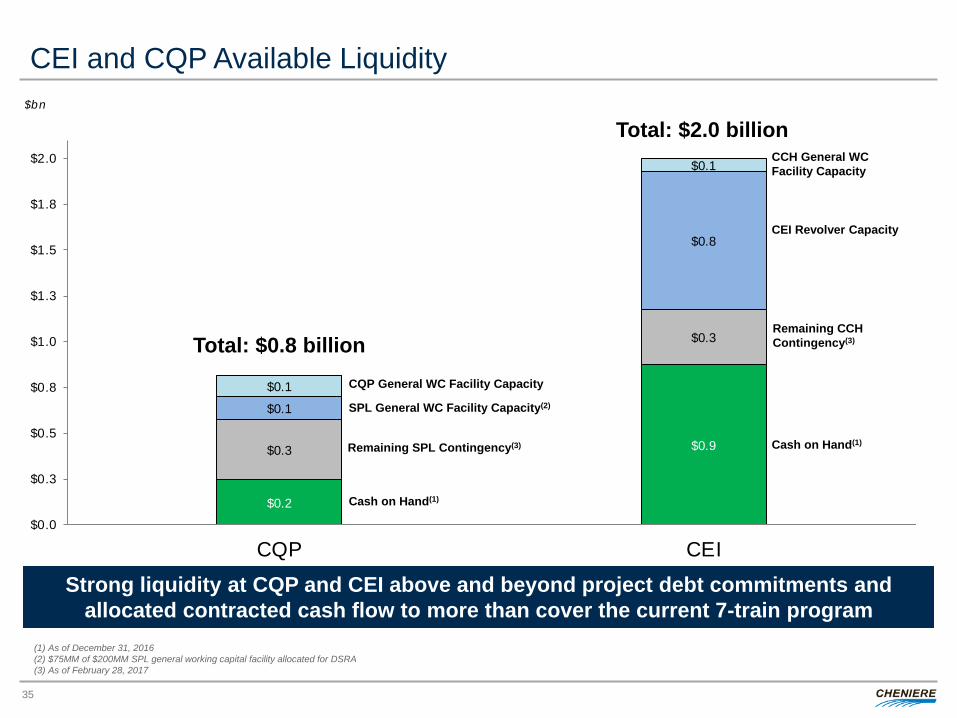
CEI and CQP Available Liquidity
35
Cash on Hand(1)
CEI Revolver Capacity
Remaining SPL Contingency(3)
Remaining CCH Contingency(3)
Cash on Hand(1)
Total: $0.8 billion
Total: $2.0 billion
CQP General WC Facility Capacity
SPL General WC Facility Capacity(2)
CCH General WC Facility Capacity
Strong liquidity at CQP and CEI above and beyond project debt commitments and allocated contracted cash flow to more than cover the current 7-train program
(1) As of December 31, 2016 (2) $75MM of $200MM SPL general working capital facility allocated for DSRA (3) As of February 28, 2017
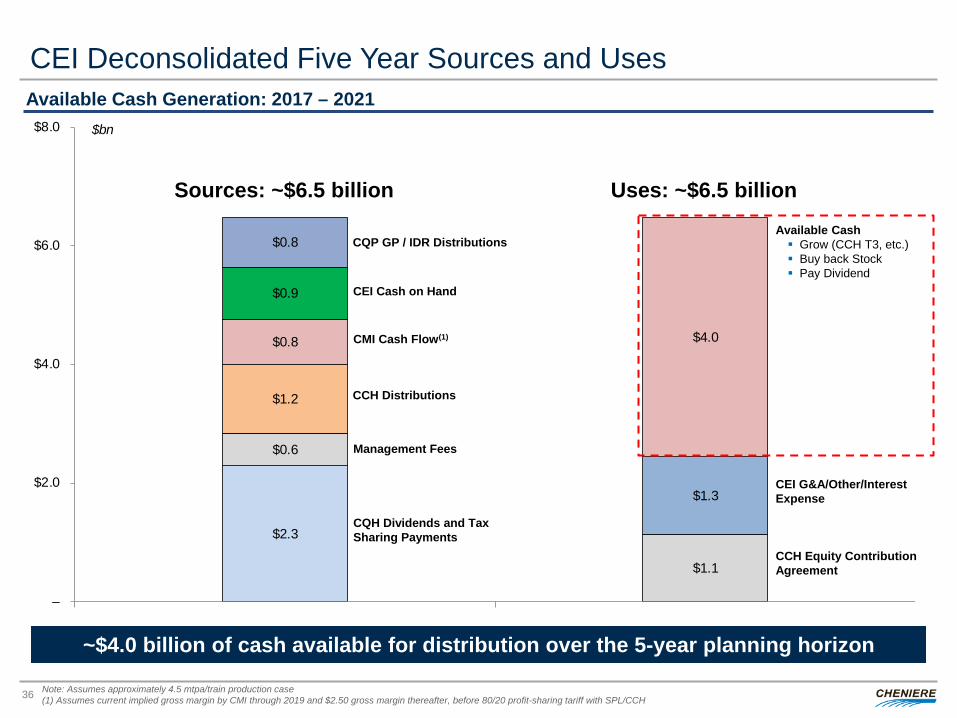
Note: Assumes approximately 4.5 mtpa/train production case (1) Assumes current implied gross margin by CMI through 2019 and $2.50 gross margin thereafter, before 80/20 profit-sharing tariff with SPL/CCH
$2.3
$0.6
$1.1
$1.2
$0.8
$1.3
$0.9
$0.8
$4.0
–
$2.0
$4.0
$6.0
$8.0
Sources Uses
$bn
CEI Deconsolidated Five Year Sources and Uses
36
Available Cash Generation: 2017 – 2021
CEI G&A/Other/Interest Expense
Management Fees
Available Cash Grow (CCH T3, etc.) Buy back Stock Pay Dividend
CCH Distributions
Sources: ~$6.5 billion
CQP GP / IDR Distributions
CMI Cash Flow(1)
CEI Cash on Hand
CQH Dividends and Tax Sharing Payments
CCH Equity Contribution Agreement
Uses: ~$6.5 billion
~$4.0 billion of cash available for distribution over the 5-year planning horizon
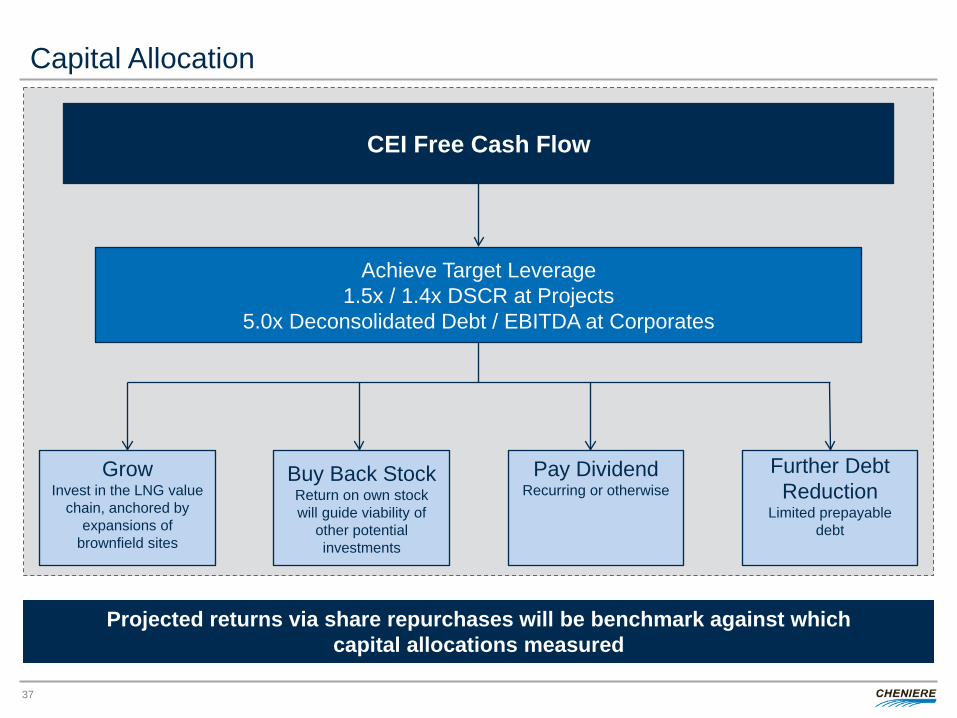
Capital Allocation
37
CEI Free Cash Flow
Achieve Target Leverage 1.5x / 1.4x DSCR at Projects
5.0x Deconsolidated Debt / EBITDA at Corporates
Grow Invest in the LNG value
chain, anchored by expansions of
brownfield sites
Buy Back Stock Return on own stock will guide viability of
other potential investments
Pay Dividend Recurring or otherwise
Projected returns via share repurchases will be benchmark against which capital allocations measured
Further Debt Reduction
Limited prepayable debt

CHENIERE ENERGY, INC. FINANCIAL PROJECTIONS AND CAPITAL ALLOCATION STRATEGY
IV
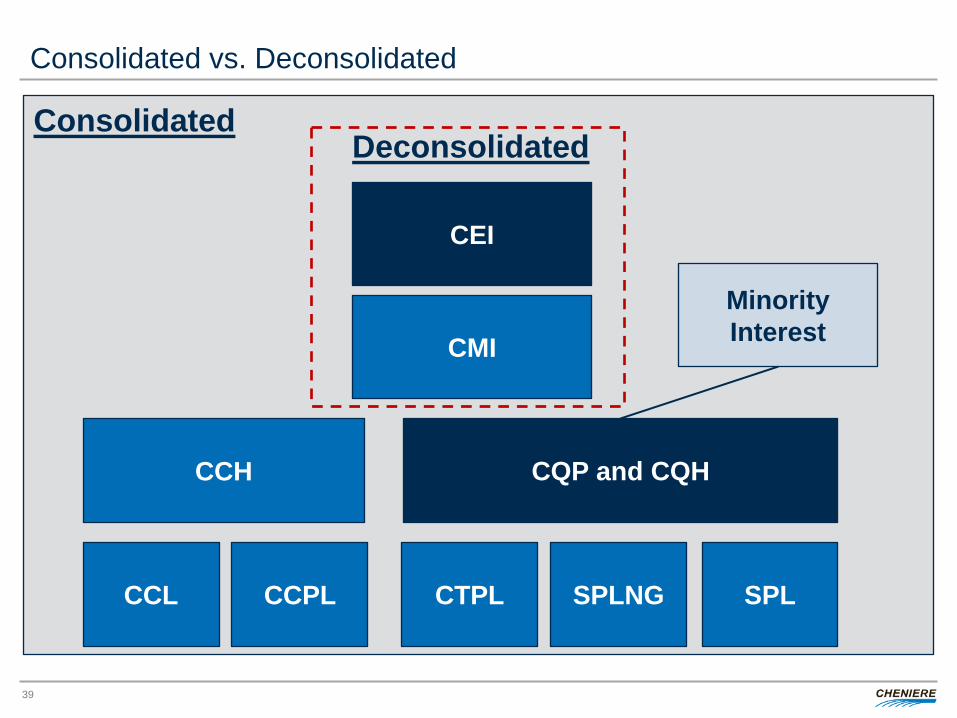
Consolidated vs. Deconsolidated
39
CEI
CCH
Consolidated Deconsolidated
SPL
CQP and CQH
SPLNG CTPL
CMI
CCPL CCL
Minority Interest
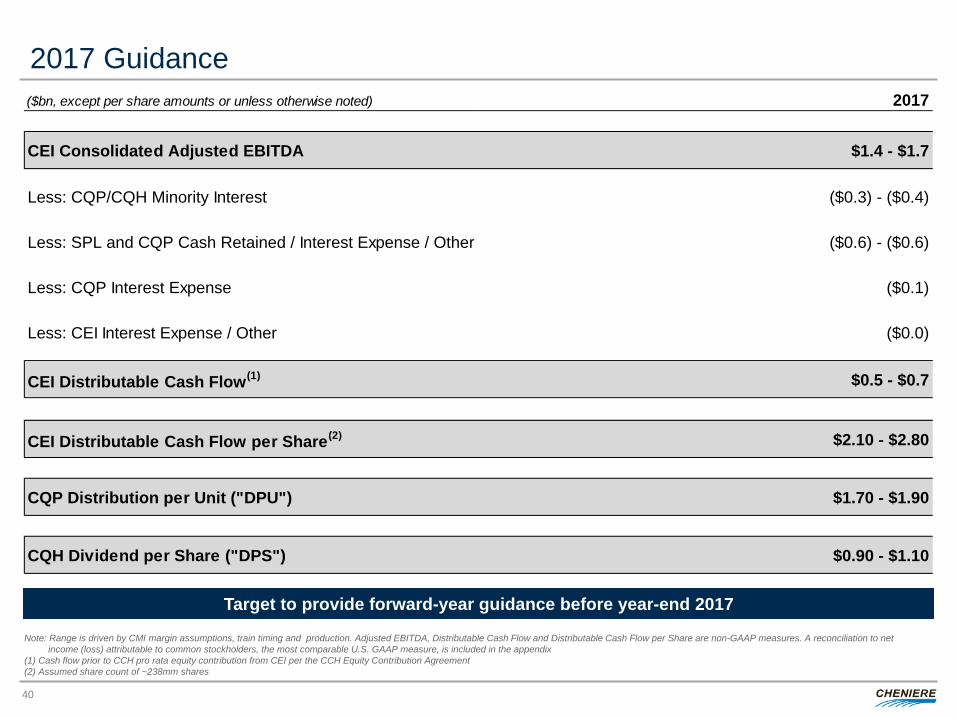
2017 Guidance
40
Note: Range is driven by CMI margin assumptions, train timing and production. Adjusted EBITDA, Distributable Cash Flow and Distributable Cash Flow per Share are non-GAAP measures. A reconciliation to net income (loss) attributable to common stockholders, the most comparable U.S. GAAP measure, is included in the appendix (1) Cash flow prior to CCH pro rata equity contribution from CEI per the CCH Equity Contribution Agreement (2) Assumed share count of ~238mm shares
Target to provide forward-year guidance before year-end 2017
($bn, except per share amounts or unless otherwise noted) 2017
CEI Consolidated Adjusted EBITDA $1.4 - $1.7
Less: CQP/CQH Minority Interest ($0.3) - ($0.4)
Less: SPL and CQP Cash Retained / Interest Expense / Other ($0.6) - ($0.6)
Less: CQP Interest Expense ($0.1)
Less: CEI Interest Expense / Other ($0.0)
CEI Distributable Cash Flow(1) $0.5 - $0.7
CEI Distributable Cash Flow per Share(2) $2.10 - $2.80
CQP Distribution per Unit ("DPU") $1.70 - $1.90
CQH Dividend per Share ("DPS") $0.90 - $1.10
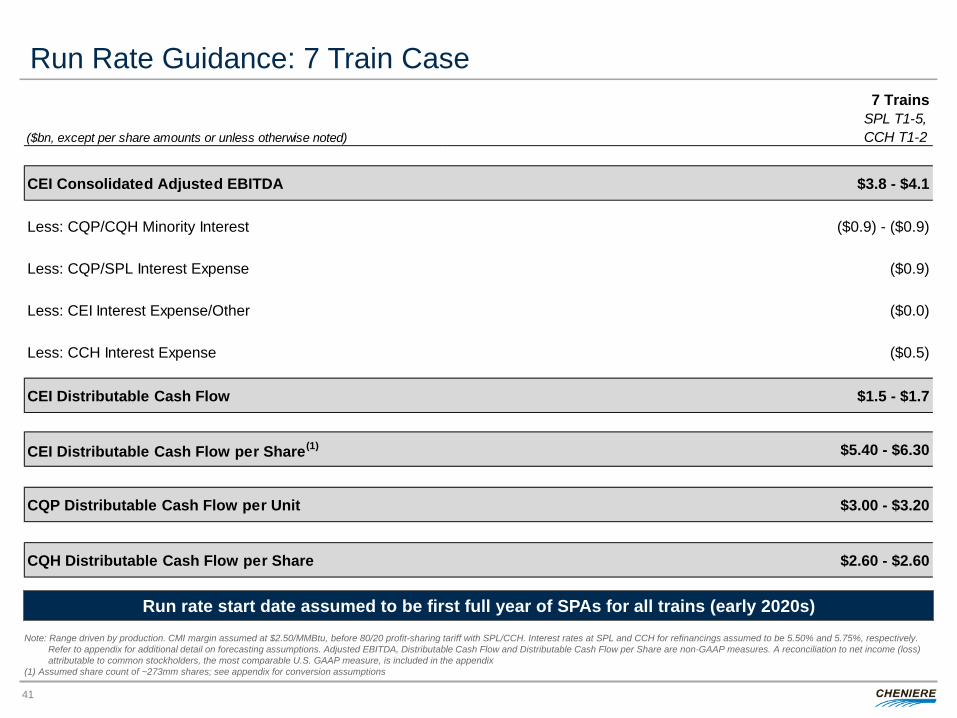
7 Trains
($bn, except per share amounts or unless otherwise noted)SPL T1-5, CCH T1-2
CEI Consolidated Adjusted EBITDA $3.8 - $4.1
Less: CQP/CQH Minority Interest ($0.9) - ($0.9)
Less: CQP/SPL Interest Expense ($0.9)
Less: CEI Interest Expense/Other ($0.0)
Less: CCH Interest Expense ($0.5)
CEI Distributable Cash Flow $1.5 - $1.7
CEI Distributable Cash Flow per Share(1) $5.40 - $6.30
CQP Distributable Cash Flow per Unit $3.00 - $3.20
CQH Distributable Cash Flow per Share $2.60 - $2.60
Run Rate Guidance: 7 Train Case
41
Run rate start date assumed to be first full year of SPAs for all trains (early 2020s) Note: Range driven by production. CMI margin assumed at $2.50/MMBtu, before 80/20 profit-sharing tariff with SPL/CCH. Interest rates at SPL and CCH for refinancings assumed to be 5.50% and 5.75%, respectively. Refer to appendix for additional detail on forecasting assumptions. Adjusted EBITDA, Distributable Cash Flow and Distributable Cash Flow per Share are non-GAAP measures. A reconciliation to net income (loss) attributable to common stockholders, the most comparable U.S. GAAP measure, is included in the appendix (1) Assumed share count of ~273mm shares; see appendix for conversion assumptions
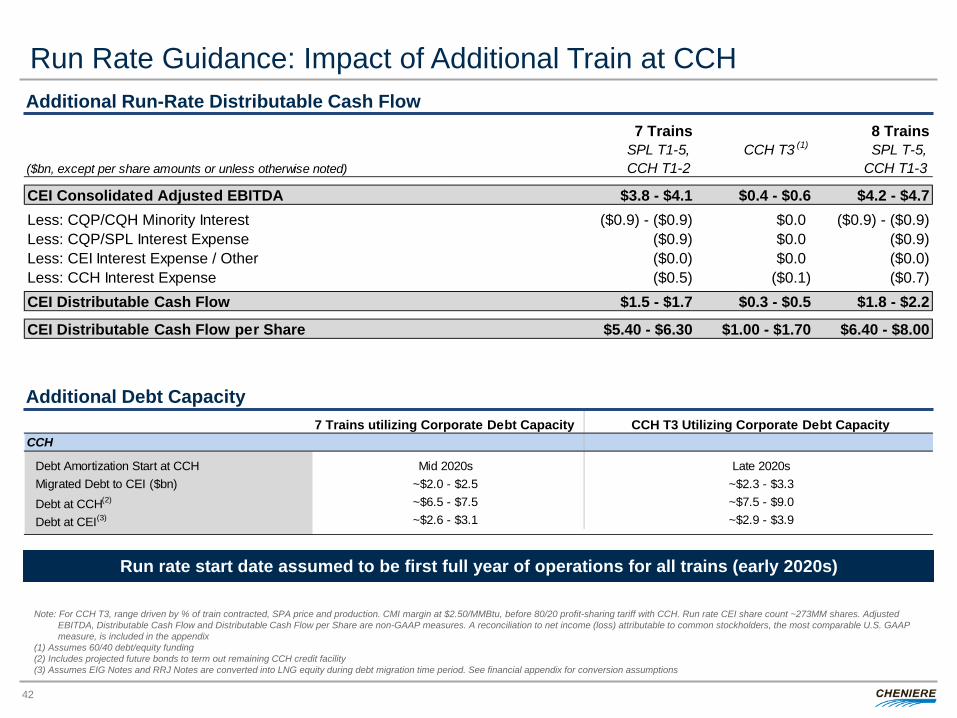
7 Trains utilizing Corporate Debt Capacity CCH T3 Utilizing Corporate Debt CapacityCCH
Debt Amortization Start at CCH Mid 2020s Late 2020sMigrated Debt to CEI ($bn) ~$2.0 - $2.5 ~$2.3 - $3.3Debt at CCH(2) ~$6.5 - $7.5 ~$7.5 - $9.0Debt at CEI(3) ~$2.6 - $3.1 ~$2.9 - $3.9
7 Trains 8 Trains
($bn, except per share amounts or unless otherwise noted)SPL T1-5, CCH T1-2
SPL T-5, CCH T1-3
CEI Consolidated Adjusted EBITDA $3.8 - $4.1 $0.4 - $0.6 $4.2 - $4.7Less: CQP/CQH Minority Interest ($0.9) - ($0.9) $0.0 ($0.9) - ($0.9)Less: CQP/SPL Interest Expense ($0.9) $0.0 ($0.9)Less: CEI Interest Expense / Other ($0.0) $0.0 ($0.0)Less: CCH Interest Expense ($0.5) ($0.1) ($0.7)CEI Distributable Cash Flow $1.5 - $1.7 $0.3 - $0.5 $1.8 - $2.2
CEI Distributable Cash Flow per Share $5.40 - $6.30 $1.00 - $1.70 $6.40 - $8.00
CCH T3 (1)
Run Rate Guidance: Impact of Additional Train at CCH
42
Additional Run-Rate Distributable Cash Flow
Run rate start date assumed to be first full year of operations for all trains (early 2020s)
Additional Debt Capacity
Note: For CCH T3, range driven by % of train contracted, SPA price and production. CMI margin at $2.50/MMBtu, before 80/20 profit-sharing tariff with CCH. Run rate CEI share count ~273MM shares. Adjusted EBITDA, Distributable Cash Flow and Distributable Cash Flow per Share are non-GAAP measures. A reconciliation to net income (loss) attributable to common stockholders, the most comparable U.S. GAAP measure, is included in the appendix (1) Assumes 60/40 debt/equity funding (2) Includes projected future bonds to term out remaining CCH credit facility (3) Assumes EIG Notes and RRJ Notes are converted into LNG equity during debt migration time period. See financial appendix for conversion assumptions
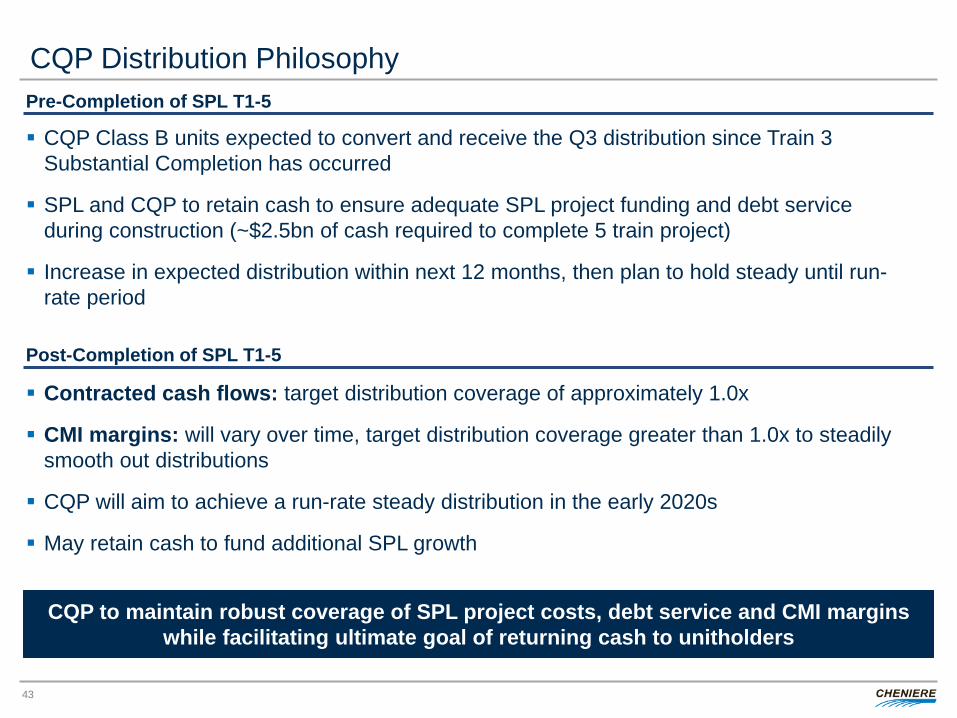
CQP Distribution Philosophy
43
CQP Class B units expected to convert and receive the Q3 distribution since Train 3 Substantial Completion has occurred
SPL and CQP to retain cash to ensure adequate SPL project funding and debt service during construction (~$2.5bn of cash required to complete 5 train project)
Increase in expected distribution within next 12 months, then plan to hold steady until run-rate period
Pre-Completion of SPL T1-5
Contracted cash flows: target distribution coverage of approximately 1.0x
CMI margins: will vary over time, target distribution coverage greater than 1.0x to steadily smooth out distributions
CQP will aim to achieve a run-rate steady distribution in the early 2020s
May retain cash to fund additional SPL growth
Post-Completion of SPL T1-5
CQP to maintain robust coverage of SPL project costs, debt service and CMI margins while facilitating ultimate goal of returning cash to unitholders

CHENIERE ENERGY, INC. STRATEGIC AND COMPETITIVE CONSIDERATIONS
V
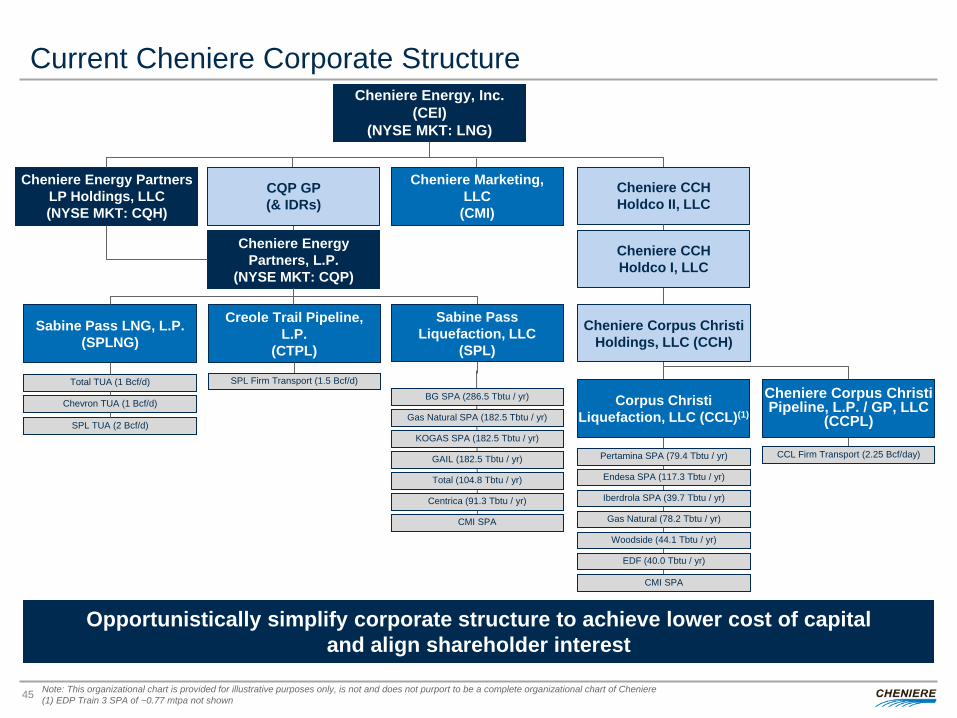
Current Cheniere Corporate Structure
45
Cheniere Energy, Inc. (CEI)
(NYSE MKT: LNG)
Cheniere Energy Partners, L.P.
(NYSE MKT: CQP)
Sabine Pass LNG, L.P. (SPLNG)
Total TUA (1 Bcf/d)
Chevron TUA (1 Bcf/d)
SPL TUA (2 Bcf/d)
Sabine Pass Liquefaction, LLC
(SPL)
Creole Trail Pipeline, L.P.
(CTPL)
Cheniere Energy Partners LP Holdings, LLC (NYSE MKT: CQH)
Cheniere CCH Holdco II, LLC
SPL Firm Transport (1.5 Bcf/d)
BG SPA (286.5 Tbtu / yr)
Gas Natural SPA (182.5 Tbtu / yr)
KOGAS SPA (182.5 Tbtu / yr)
GAIL (182.5 Tbtu / yr)
Total (104.8 Tbtu / yr)
Centrica (91.3 Tbtu / yr)
CMI SPA
Pertamina SPA (79.4 Tbtu / yr)
Endesa SPA (117.3 Tbtu / yr)
Iberdrola SPA (39.7 Tbtu / yr)
Gas Natural (78.2 Tbtu / yr)
Woodside (44.1 Tbtu / yr)
EDF (40.0 Tbtu / yr)
CMI SPA
Cheniere CCH Holdco I, LLC
Corpus Christi Liquefaction, LLC (CCL)(1)
Cheniere Corpus Christi Holdings, LLC (CCH)
CCL Firm Transport (2.25 Bcf/day)
Cheniere Corpus Christi Pipeline, L.P. / GP, LLC
(CCPL)
CQP GP (& IDRs)
Cheniere Marketing, LLC
(CMI)
Opportunistically simplify corporate structure to achieve lower cost of capital and align shareholder interest
Note: This organizational chart is provided for illustrative purposes only, is not and does not purport to be a complete organizational chart of Cheniere (1) EDP Train 3 SPA of ~0.77 mtpa not shown
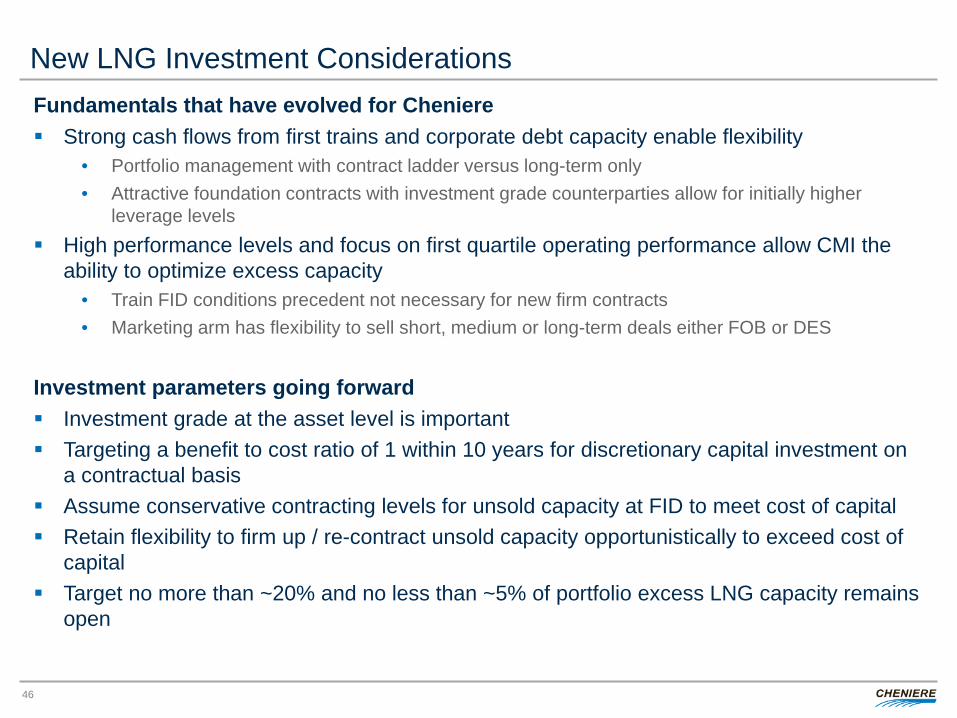
New LNG Investment Considerations
46
Fundamentals that have evolved for Cheniere Strong cash flows from first trains and corporate debt capacity enable flexibility
• Portfolio management with contract ladder versus long-term only • Attractive foundation contracts with investment grade counterparties allow for initially higher
leverage levels High performance levels and focus on first quartile operating performance allow CMI the
ability to optimize excess capacity • Train FID conditions precedent not necessary for new firm contracts • Marketing arm has flexibility to sell short, medium or long-term deals either FOB or DES
Investment parameters going forward Investment grade at the asset level is important Targeting a benefit to cost ratio of 1 within 10 years for discretionary capital investment on
a contractual basis Assume conservative contracting levels for unsold capacity at FID to meet cost of capital Retain flexibility to firm up / re-contract unsold capacity opportunistically to exceed cost of
capital Target no more than ~20% and no less than ~5% of portfolio excess LNG capacity remains
open
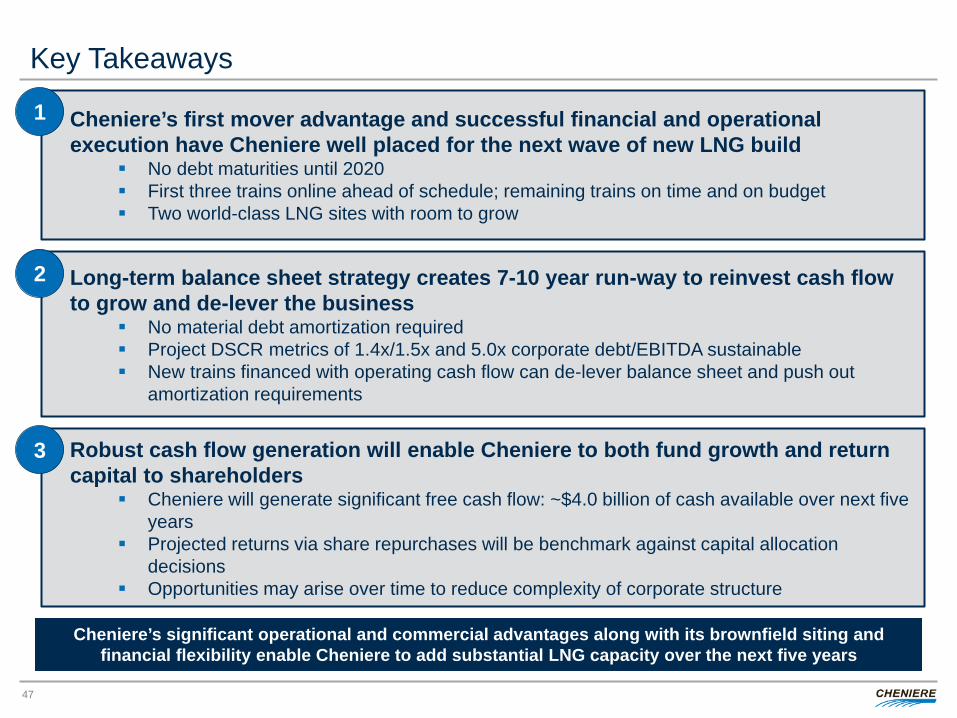
Key Takeaways
47
Cheniere’s first mover advantage and successful financial and operational execution have Cheniere well placed for the next wave of new LNG build
No debt maturities until 2020 First three trains online ahead of schedule; remaining trains on time and on budget Two world-class LNG sites with room to grow
1
Long-term balance sheet strategy creates 7-10 year run-way to reinvest cash flow to grow and de-lever the business
No material debt amortization required Project DSCR metrics of 1.4x/1.5x and 5.0x corporate debt/EBITDA sustainable New trains financed with operating cash flow can de-lever balance sheet and push out
amortization requirements
2
Robust cash flow generation will enable Cheniere to both fund growth and return capital to shareholders
Cheniere will generate significant free cash flow: ~$4.0 billion of cash available over next five years
Projected returns via share repurchases will be benchmark against capital allocation decisions
Opportunities may arise over time to reduce complexity of corporate structure
3
Cheniere’s significant operational and commercial advantages along with its brownfield siting and financial flexibility enable Cheniere to add substantial LNG capacity over the next five years

CHENIERE ENERGY, INC. FINANCIAL APPENDIX
VI
Forecasting Points
49
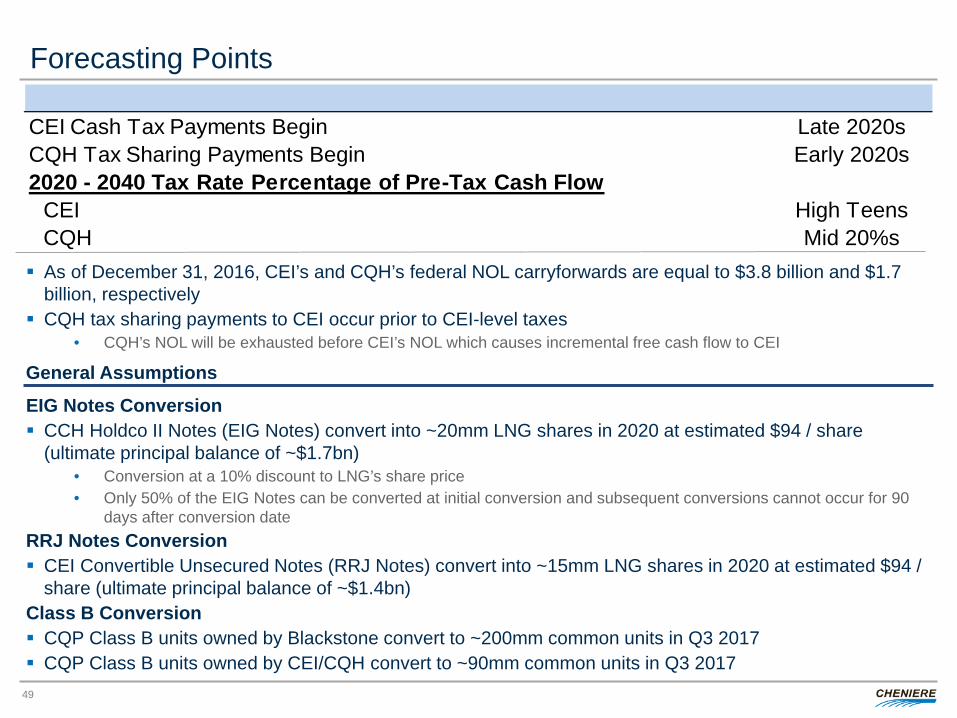
EIG Notes Conversion CCH Holdco II Notes (EIG Notes) convert into ~20mm LNG shares in 2020 at estimated $94 / share
(ultimate principal balance of ~$1.7bn) • Conversion at a 10% discount to LNG’s share price • Only 50% of the EIG Notes can be converted at initial conversion and subsequent conversions cannot occur for 90
days after conversion date RRJ Notes Conversion CEI Convertible Unsecured Notes (RRJ Notes) convert into ~15mm LNG shares in 2020 at estimated $94 /
share (ultimate principal balance of ~$1.4bn) Class B Conversion CQP Class B units owned by Blackstone convert to ~200mm common units in Q3 2017 CQP Class B units owned by CEI/CQH convert to ~90mm common units in Q3 2017
As of December 31, 2016, CEI’s and CQH’s federal NOL carryforwards are equal to $3.8 billion and $1.7 billion, respectively
CQH tax sharing payments to CEI occur prior to CEI-level taxes • CQH’s NOL will be exhausted before CEI’s NOL which causes incremental free cash flow to CEI
General Assumptions
CEI Cash Tax Payments Begin Late 2020sCQH Tax Sharing Payments Begin Early 2020s2020 - 2040 Tax Rate Percentage of Pre-Tax Cash Flow
CEI High TeensCQH Mid 20%s
Insurance Summary
50
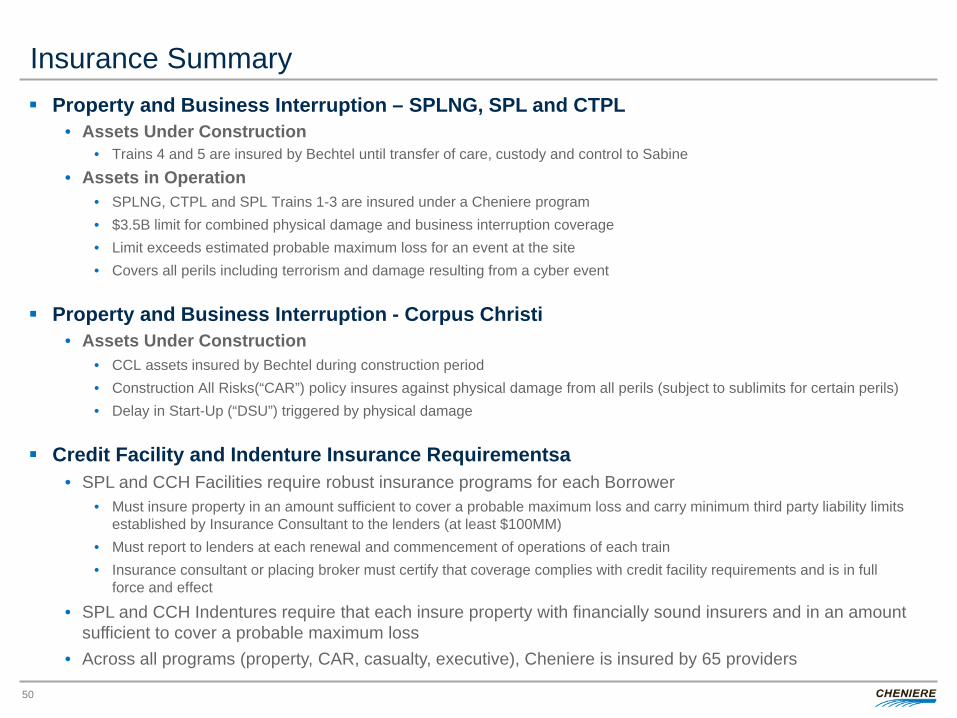
Property and Business Interruption – SPLNG, SPL and CTPL • Assets Under Construction
• Trains 4 and 5 are insured by Bechtel until transfer of care, custody and control to Sabine
• Assets in Operation • SPLNG, CTPL and SPL Trains 1-3 are insured under a Cheniere program • $3.5B limit for combined physical damage and business interruption coverage • Limit exceeds estimated probable maximum loss for an event at the site • Covers all perils including terrorism and damage resulting from a cyber event
Property and Business Interruption - Corpus Christi • Assets Under Construction
• CCL assets insured by Bechtel during construction period • Construction All Risks(“CAR”) policy insures against physical damage from all perils (subject to sublimits for certain perils) • Delay in Start-Up (“DSU”) triggered by physical damage
Credit Facility and Indenture Insurance Requirementsa • SPL and CCH Facilities require robust insurance programs for each Borrower
• Must insure property in an amount sufficient to cover a probable maximum loss and carry minimum third party liability limits established by Insurance Consultant to the lenders (at least $100MM)
• Must report to lenders at each renewal and commencement of operations of each train • Insurance consultant or placing broker must certify that coverage complies with credit facility requirements and is in full
force and effect
• SPL and CCH Indentures require that each insure property with financially sound insurers and in an amount sufficient to cover a probable maximum loss
• Across all programs (property, CAR, casualty, executive), Cheniere is insured by 65 providers

CHENIERE ENERGY, INC. April 19, 2017 ANALYST DAY
COMMERCIAL STRATEGY AND INITIATIVES Anatol Feygin, EVP and CCO
Table of Contents
53
Commercial Strategy and Initiatives I
LNG Strategy and Communications – Andrew Walker, Vice President II
Gas Supply – Corey Grindal, Senior Vice President III
Commercial Operations and Asset Optimization – Eric Bensaude, Managing Director IV
Origination – Ramzi Mroueh, Managing Director V

CHENIERE ENERGY, INC. COMMERCIAL STRATEGY AND INITIATIVES
I
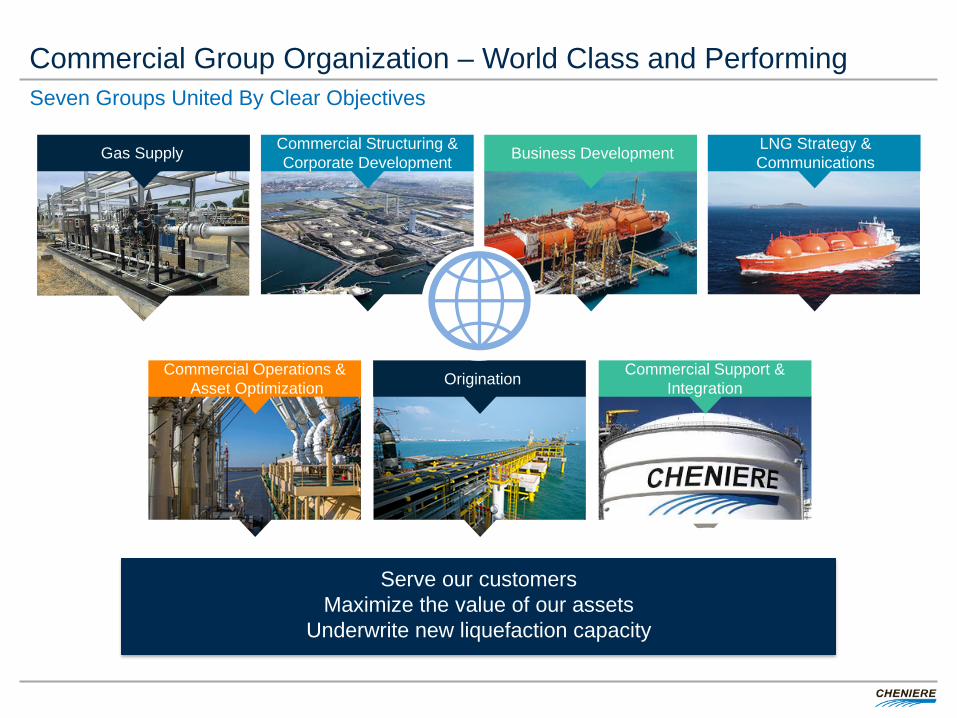
Commercial Group Organization – World Class and Performing Seven Groups United By Clear Objectives
Serve our customers Maximize the value of our assets
Underwrite new liquefaction capacity
Gas Supply Commercial Structuring & Corporate Development
Commercial Support & Integration
Commercial Operations & Asset Optimization Origination
LNG Strategy & Communications Business Development
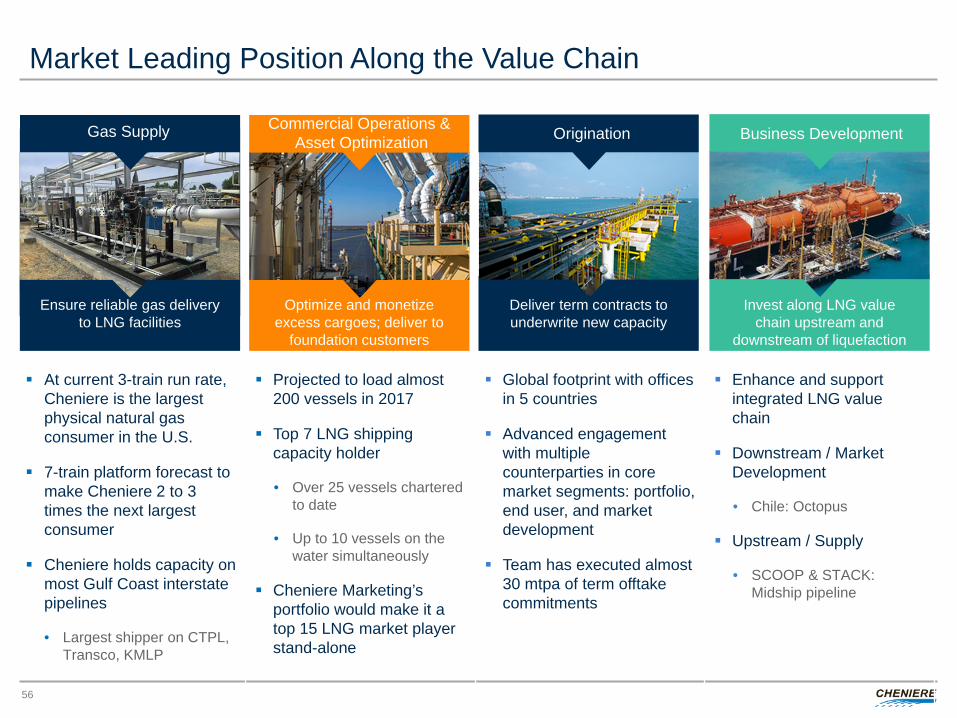
At current 3-train run rate, Cheniere is the largest physical natural gas consumer in the U.S.
7-train platform forecast to make Cheniere 2 to 3 times the next largest consumer
Cheniere holds capacity on most Gulf Coast interstate pipelines
• Largest shipper on CTPL, Transco, KMLP
Projected to load almost 200 vessels in 2017
Top 7 LNG shipping capacity holder
• Over 25 vessels chartered to date
• Up to 10 vessels on the water simultaneously
Cheniere Marketing’s portfolio would make it a top 15 LNG market player stand-alone
Global footprint with offices in 5 countries
Advanced engagement with multiple counterparties in core market segments: portfolio, end user, and market development
Team has executed almost 30 mtpa of term offtake commitments
Enhance and support integrated LNG value chain
Downstream / Market Development
• Chile: Octopus
Upstream / Supply
• SCOOP & STACK: Midship pipeline
Market Leading Position Along the Value Chain
56
Gas Supply
Optimize and monetize excess cargoes; deliver to
foundation customers
Deliver term contracts to underwrite new capacity
Invest along LNG value chain upstream and
downstream of liquefaction
Gas Supply
Ensure reliable gas delivery to LNG facilities
Commercial Operations & Asset Optimization Origination Business Development
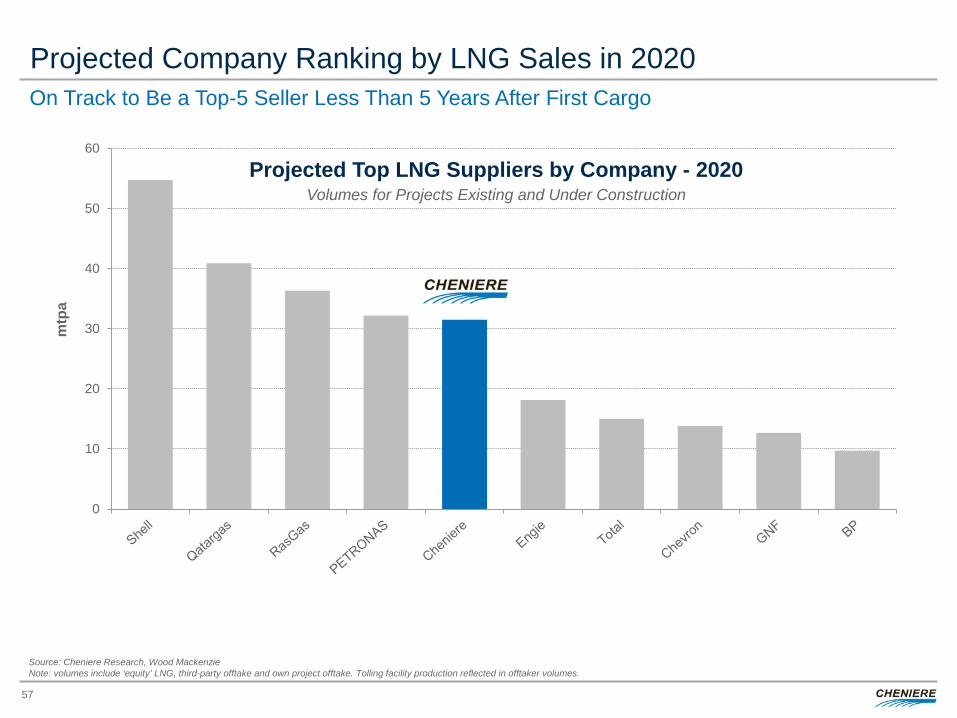
Projected Company Ranking by LNG Sales in 2020
0
10
20
30
40
50
60
mtp
a
Projected Top LNG Suppliers by Company - 2020
Source: Cheniere Research, Wood Mackenzie Note: volumes include ‘equity’ LNG, third-party offtake and own project offtake. Tolling facility production reflected in offtaker volumes.
Volumes for Projects Existing and Under Construction
On Track to Be a Top-5 Seller Less Than 5 Years After First Cargo
57
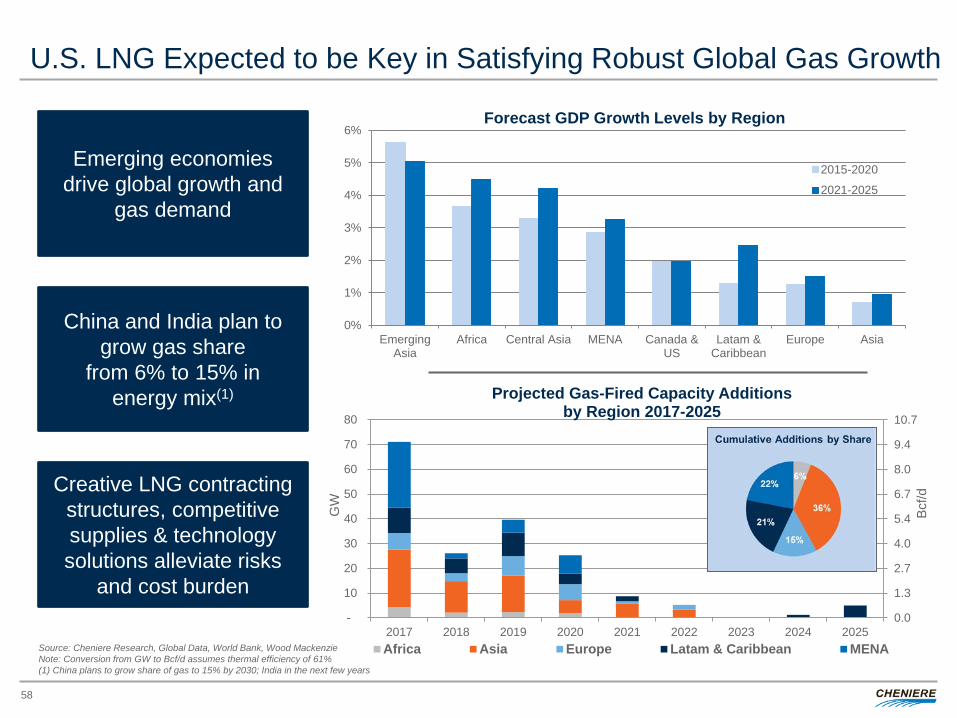
U.S. LNG Expected to be Key in Satisfying Robust Global Gas Growth
58
Source: Cheniere Research, Global Data, World Bank, Wood Mackenzie Note: Conversion from GW to Bcf/d assumes thermal efficiency of 61% (1) China plans to grow share of gas to 15% by 2030; India in the next few years
0%
1%
2%
3%
4%
5%
6%
EmergingAsia
Africa Central Asia MENA Canada &US
Latam &Caribbean
Europe Asia
Forecast GDP Growth Levels by Region
2015-2020
2021-2025
Emerging economies drive global growth and
gas demand
China and India plan to grow gas share
from 6% to 15% in energy mix(1)
Creative LNG contracting structures, competitive supplies & technology solutions alleviate risks
and cost burden 0.0
1.3
2.7
4.0
5.4
6.7
8.0
9.4
10.7
-
10
20
30
40
50
60
70
80
2017 2018 2019 2020 2021 2022 2023 2024 2025
Bcf/d
GW
Projected Gas-Fired Capacity Additions by Region 2017-2025
Africa Asia Europe Latam & Caribbean MENA
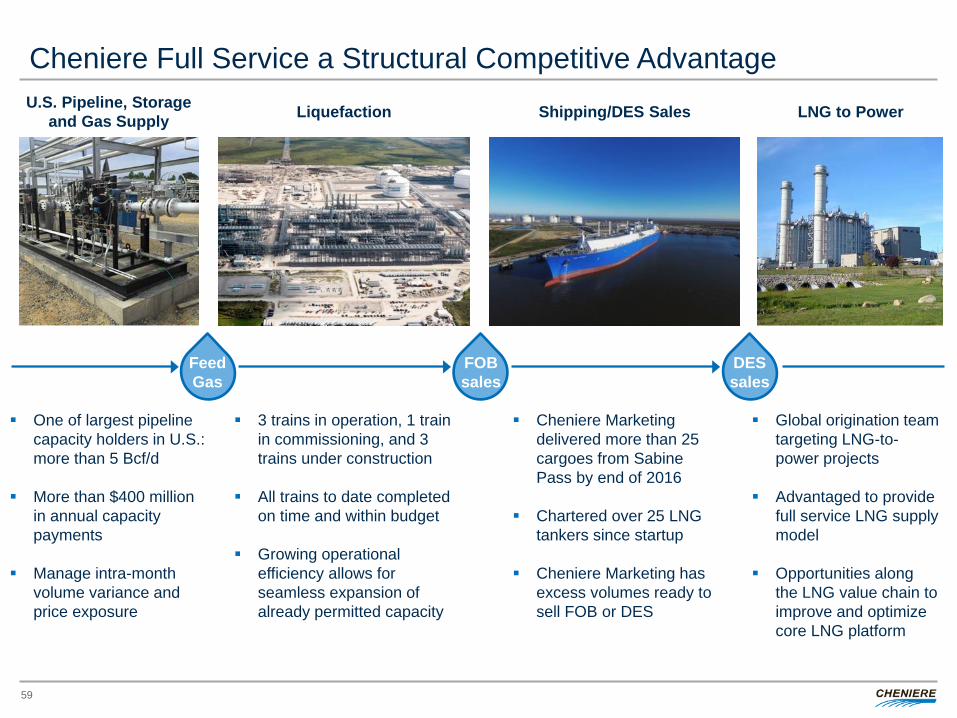
Cheniere Full Service a Structural Competitive Advantage
Liquefaction Shipping/DES Sales LNG to Power U.S. Pipeline, Storage and Gas Supply
One of largest pipeline capacity holders in U.S.: more than 5 Bcf/d
More than $400 million in annual capacity payments
Manage intra-month volume variance and price exposure
3 trains in operation, 1 train in commissioning, and 3 trains under construction
All trains to date completed on time and within budget
Growing operational efficiency allows for seamless expansion of already permitted capacity
Cheniere Marketing delivered more than 25 cargoes from Sabine Pass by end of 2016
Chartered over 25 LNG tankers since startup
Cheniere Marketing has excess volumes ready to sell FOB or DES
Global origination team targeting LNG-to-power projects
Advantaged to provide full service LNG supply model
Opportunities along the LNG value chain to improve and optimize core LNG platform
Feed Gas
FOB sales
DES sales
59
Cheniere Marketing’s LNG portfolio is currently being marketed on a short, medium and long term basis
Excess volumes have seasonality with incremental volume available during the premium Northern Hemisphere winter – potential for marketing seasonal strips of cargoes
Firm volumes are used to structure term deals that require rapid time to market and increased flexibility in the initial stage of a term commitment
Capacity retained for optimization and operational flexibility
Build relationships and reputation of reliability and execution
Cheniere Marketing: Robust Strategy for Excess Volumes
60
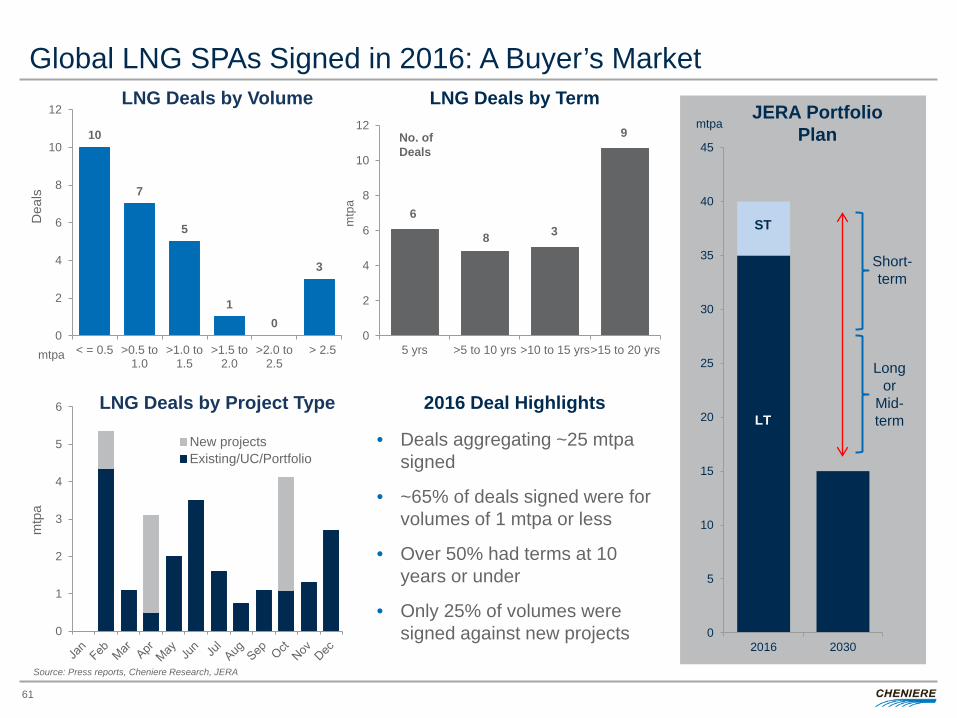
Global LNG SPAs Signed in 2016: A Buyer’s Market
61
0
1
2
3
4
5
6
mtp
a
New projectsExisting/UC/Portfolio
10
7
5
1 0
3
0
2
4
6
8
10
12
< = 0.5 >0.5 to1.0
>1.0 to1.5
>1.5 to2.0
>2.0 to2.5
> 2.5
Dea
ls
mtpa 0
2
4
6
8
10
12
5 yrs >5 to 10 yrs >10 to 15 yrs>15 to 20 yrsm
tpa
LNG Deals by Volume LNG Deals by Term
LNG Deals by Project Type
• Deals aggregating ~25 mtpa signed
• ~65% of deals signed were for volumes of 1 mtpa or less
• Over 50% had terms at 10 years or under
• Only 25% of volumes were signed against new projects
2016 Deal Highlights
0
5
10
15
20
25
30
35
40
45
2016 2030
Short-term
Long or
Mid-term
JERA Portfolio Plan
Source: Press reports, Cheniere Research, JERA
No. of Deals
6
8 3
9
ST
LT
mtpa
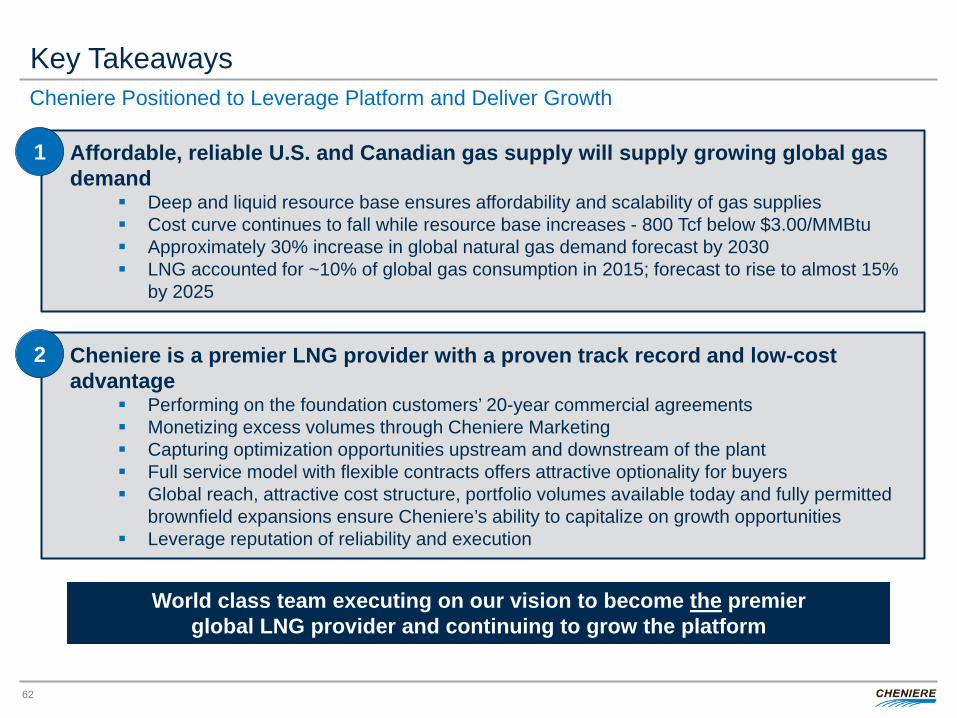
Key Takeaways
62
Affordable, reliable U.S. and Canadian gas supply will supply growing global gas demand
Deep and liquid resource base ensures affordability and scalability of gas supplies Cost curve continues to fall while resource base increases - 800 Tcf below $3.00/MMBtu Approximately 30% increase in global natural gas demand forecast by 2030 LNG accounted for ~10% of global gas consumption in 2015; forecast to rise to almost 15%
by 2025
1
Cheniere is a premier LNG provider with a proven track record and low-cost advantage
Performing on the foundation customers’ 20-year commercial agreements Monetizing excess volumes through Cheniere Marketing Capturing optimization opportunities upstream and downstream of the plant Full service model with flexible contracts offers attractive optionality for buyers Global reach, attractive cost structure, portfolio volumes available today and fully permitted
brownfield expansions ensure Cheniere’s ability to capitalize on growth opportunities Leverage reputation of reliability and execution
2
Cheniere Positioned to Leverage Platform and Deliver Growth
World class team executing on our vision to become the premier global LNG provider and continuing to grow the platform
COMMERCIAL PANEL
CHENIERE ENERGY, INC. LNG STRATEGY AND COMMUNICATIONS
II
Andrew Walker, Vice President
Pacific Basin SPAs
Atlantic Basin SPAs
0
50
100
150
200
250
300
350
400
450
500
2016 2018 2020 2022 2024 2026 2028 2030
Global LNG Demand vs. SPAs (mtpa) Global LNG Demand Estimate
Existing Capacity
Newly Operational
Under Construction
0
50
100
150
200
250
300
350
400
450
500
2013 2014 2015 2016 2017 2018 2019 2020 2021 2022 2023 2024 2025 2026 2027 2028 2029 2030
LNG Demand vs. Supply (mtpa)
Market tightening New Supply (127 mtpa)
65
Source: Cheniere Research, Global Data, World Bank, Wood Mackenzie
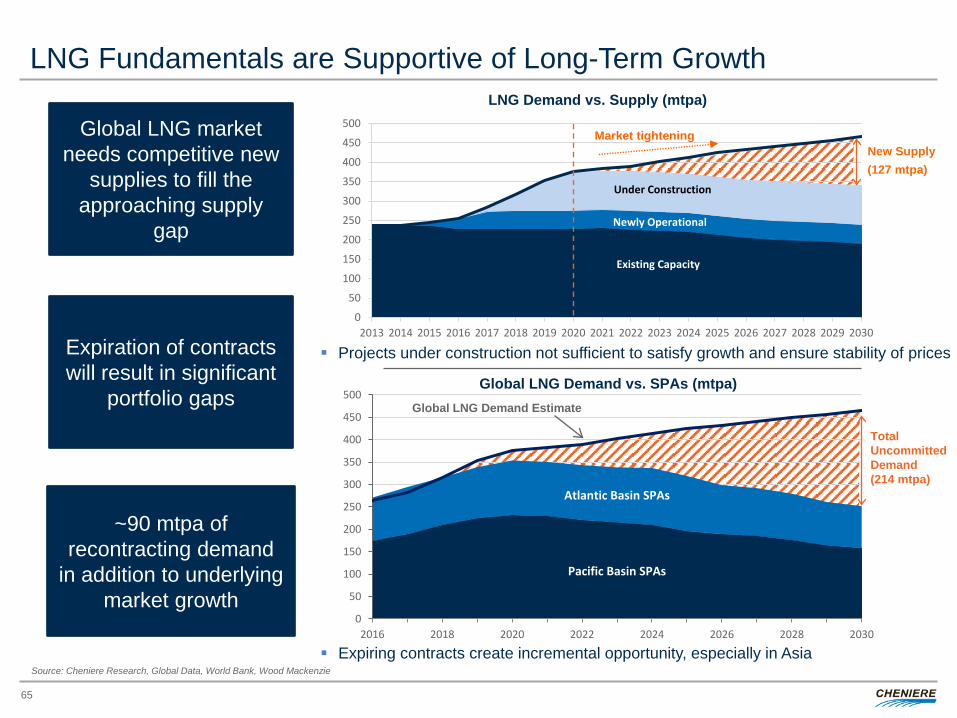
Global LNG market needs competitive new
supplies to fill the approaching supply
gap
Expiration of contracts will result in significant
portfolio gaps
~90 mtpa of recontracting demand
in addition to underlying market growth
LNG Fundamentals are Supportive of Long-Term Growth
Projects under construction not sufficient to satisfy growth and ensure stability of prices
Expiring contracts create incremental opportunity, especially in Asia
Total Uncommitted Demand (214 mtpa)
-10
0
10
20
30
40
50
2002 2003 2004 2005 2006 2007 2008 2009 2010 2011 2012 2013 2014 2015 2016 2017 2018 2019 2020 2021 2022 2023 2024 2025
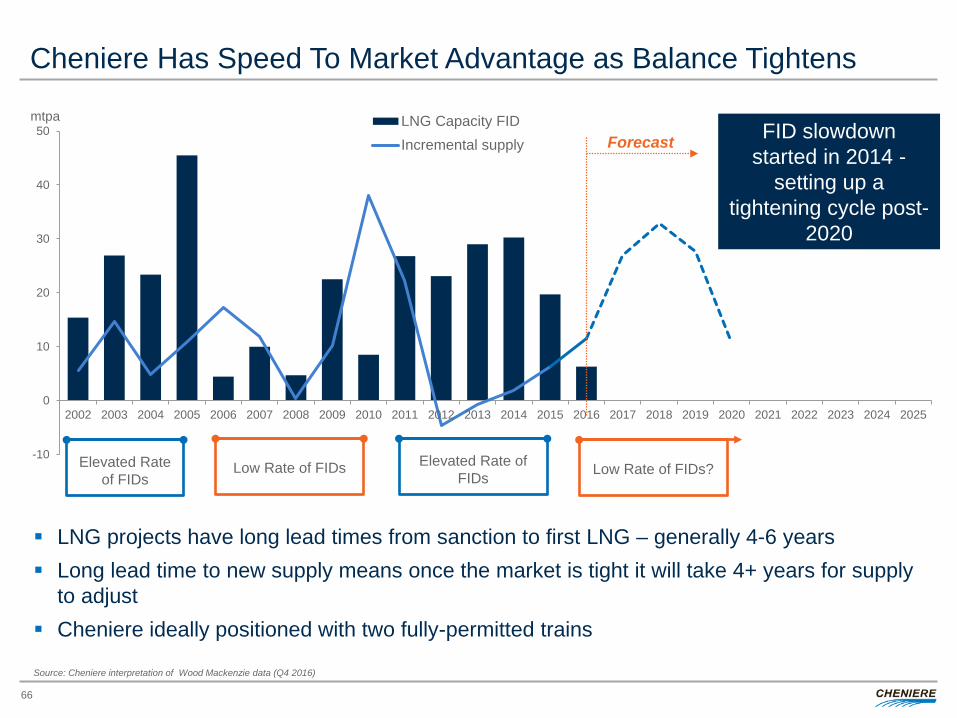
mtpa LNG Capacity FIDIncremental supply Forecast
Source: Cheniere interpretation of Wood Mackenzie data (Q4 2016)
LNG projects have long lead times from sanction to first LNG – generally 4-6 years Long lead time to new supply means once the market is tight it will take 4+ years for supply
to adjust Cheniere ideally positioned with two fully-permitted trains
Elevated Rate of FIDs
Low Rate of FIDs Low Rate of FIDs? Elevated Rate of FIDs
FID slowdown started in 2014 -
setting up a tightening cycle post-
2020
66
Cheniere Has Speed To Market Advantage as Balance Tightens
$7.5 $8.6
$11.4 $12.2
$10.4 $8.5 $9.6
$12.2 $13.2 $13.2
$5
$10
$15
$20
Cheniere Gulf Coast Southeast Asia Western Canada Northwest Australia East Africa
LNG
Pric
es ($
/MM
Btu
)
67
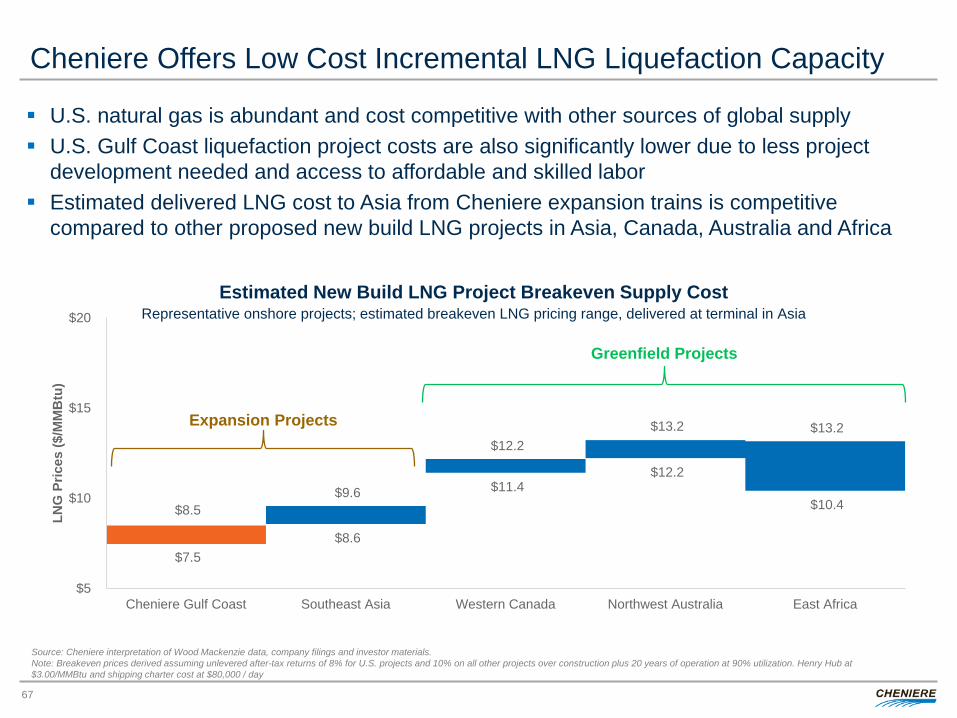
U.S. natural gas is abundant and cost competitive with other sources of global supply U.S. Gulf Coast liquefaction project costs are also significantly lower due to less project
development needed and access to affordable and skilled labor Estimated delivered LNG cost to Asia from Cheniere expansion trains is competitive
compared to other proposed new build LNG projects in Asia, Canada, Australia and Africa
Representative onshore projects; estimated breakeven LNG pricing range, delivered at terminal in Asia
Source: Cheniere interpretation of Wood Mackenzie data, company filings and investor materials. Note: Breakeven prices derived assuming unlevered after-tax returns of 8% for U.S. projects and 10% on all other projects over construction plus 20 years of operation at 90% utilization. Henry Hub at $3.00/MMBtu and shipping charter cost at $80,000 / day
Cheniere Offers Low Cost Incremental LNG Liquefaction Capacity
Greenfield Projects
Expansion Projects
Estimated New Build LNG Project Breakeven Supply Cost
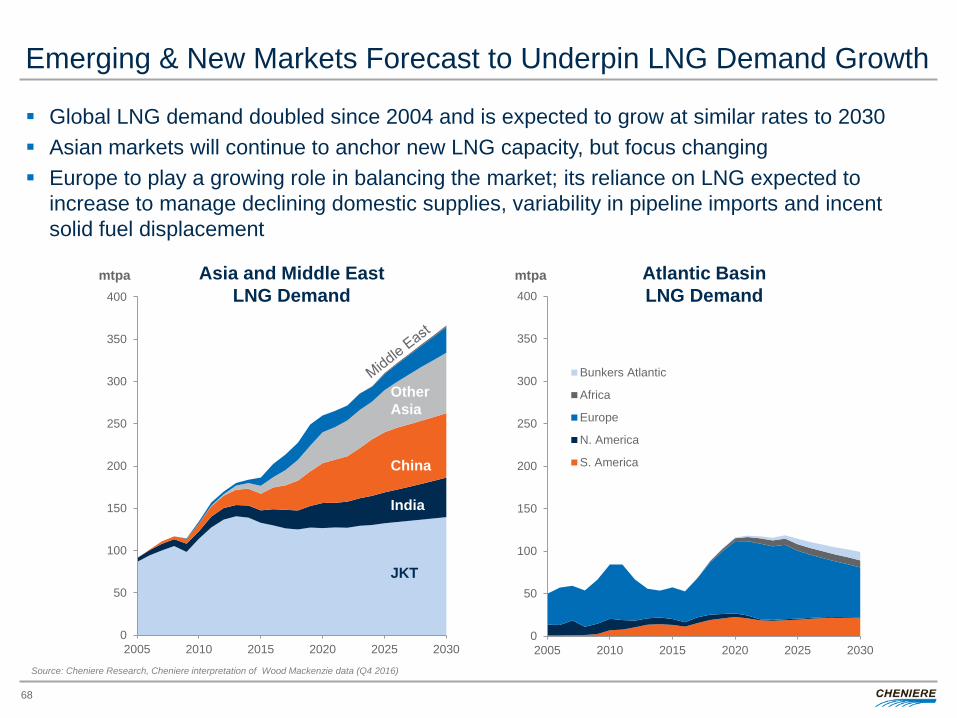
Emerging & New Markets Forecast to Underpin LNG Demand Growth
68
Source: Cheniere Research, Cheniere interpretation of Wood Mackenzie data (Q4 2016)
0
50
100
150
200
250
300
350
400
2005 2010 2015 2020 2025 2030
Bunkers Atlantic
Africa
Europe
N. America
S. America
0
50
100
150
200
250
300
350
400
2005 2010 2015 2020 2025 2030
mtpa
JKT
China
India
Other Asia
Asia and Middle East LNG Demand
Atlantic Basin LNG Demand
mtpa
Global LNG demand doubled since 2004 and is expected to grow at similar rates to 2030 Asian markets will continue to anchor new LNG capacity, but focus changing Europe to play a growing role in balancing the market; its reliance on LNG expected to
increase to manage declining domestic supplies, variability in pipeline imports and incent solid fuel displacement
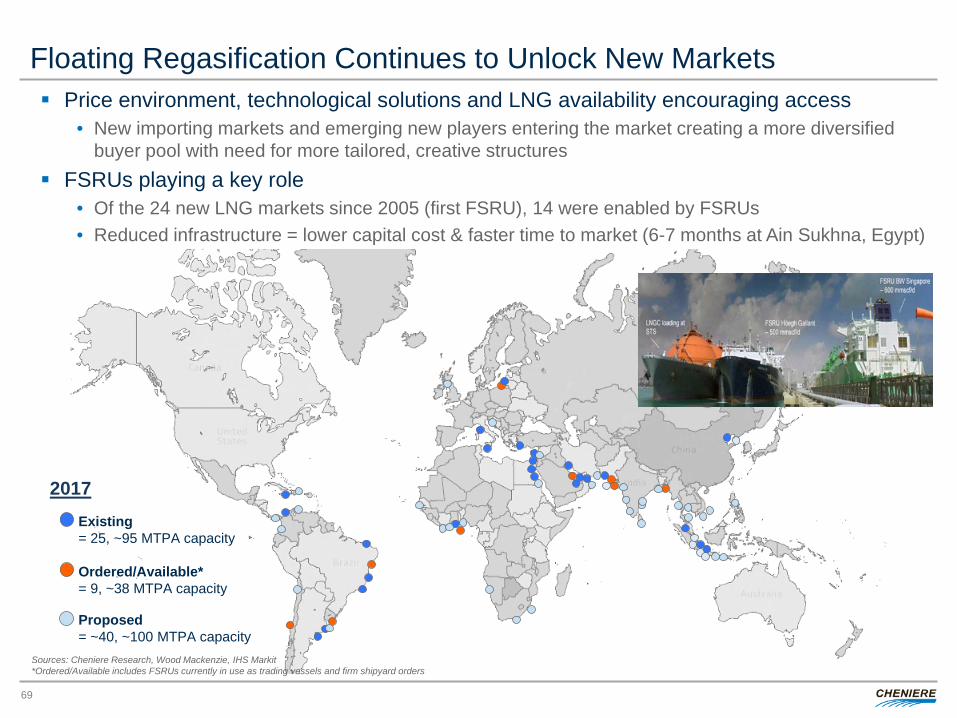
Floating Regasification Continues to Unlock New Markets
69
Existing = 25, ~95 MTPA capacity Ordered/Available* = 9, ~38 MTPA capacity
2017
Proposed = ~40, ~100 MTPA capacity
Price environment, technological solutions and LNG availability encouraging access • New importing markets and emerging new players entering the market creating a more diversified
buyer pool with need for more tailored, creative structures FSRUs playing a key role
• Of the 24 new LNG markets since 2005 (first FSRU), 14 were enabled by FSRUs • Reduced infrastructure = lower capital cost & faster time to market (6-7 months at Ain Sukhna, Egypt)
Sources: Cheniere Research, Wood Mackenzie, IHS Markit *Ordered/Available includes FSRUs currently in use as trading vessels and firm shipyard orders
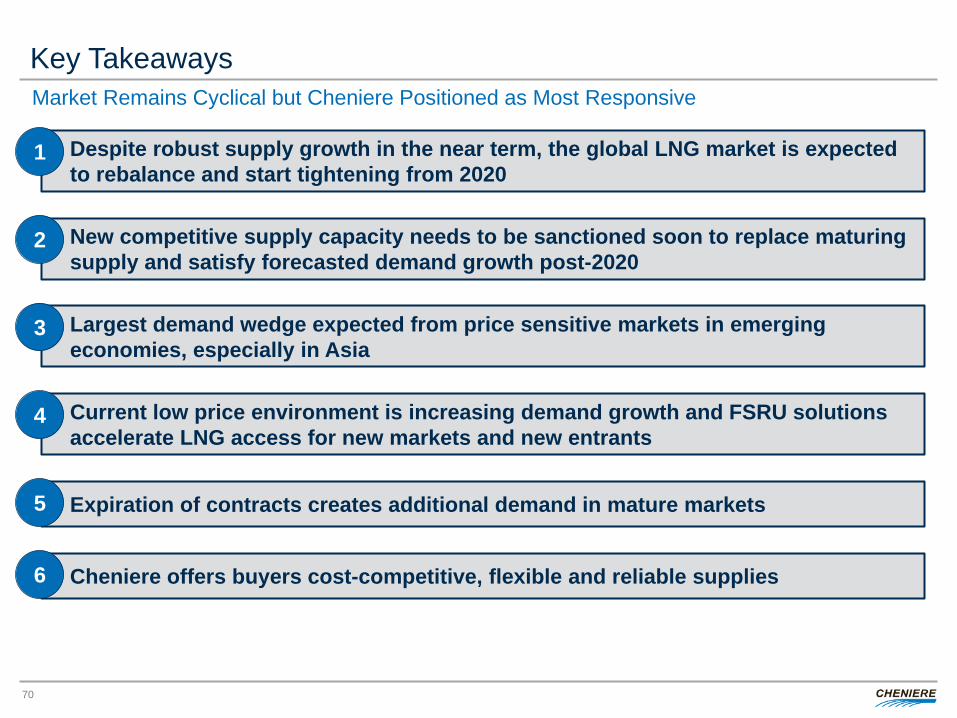
Key Takeaways
70
Despite robust supply growth in the near term, the global LNG market is expected to rebalance and start tightening from 2020
1
Market Remains Cyclical but Cheniere Positioned as Most Responsive
New competitive supply capacity needs to be sanctioned soon to replace maturing supply and satisfy forecasted demand growth post-2020
2
Largest demand wedge expected from price sensitive markets in emerging economies, especially in Asia
3
Current low price environment is increasing demand growth and FSRU solutions accelerate LNG access for new markets and new entrants
4
Expiration of contracts creates additional demand in mature markets 5
Cheniere offers buyers cost-competitive, flexible and reliable supplies 6

CHENIERE ENERGY, INC. GAS SUPPLY
III
Corey Grindal, Senior Vice President
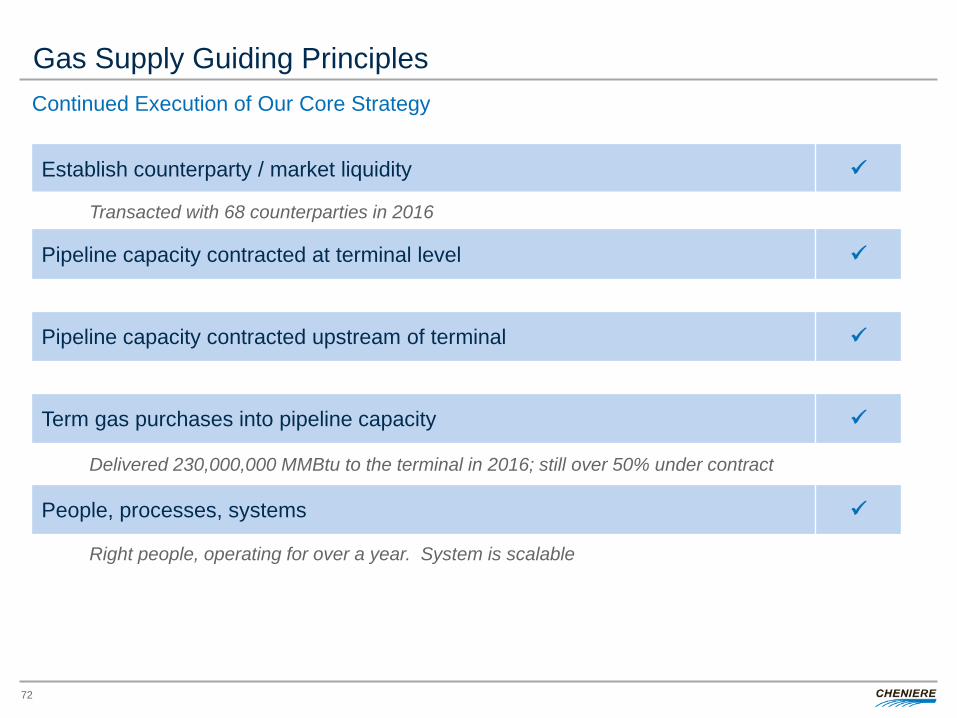
Establish counterparty / market liquidity
Transacted with 68 counterparties in 2016
Pipeline capacity contracted at terminal level
Pipeline capacity contracted upstream of terminal
Term gas purchases into pipeline capacity
Delivered 230,000,000 MMBtu to the terminal in 2016; still over 50% under contract
People, processes, systems
Right people, operating for over a year. System is scalable
Gas Supply Guiding Principles Continued Execution of Our Core Strategy
72
Sabine Pass Liquefaction Gas Supply
73
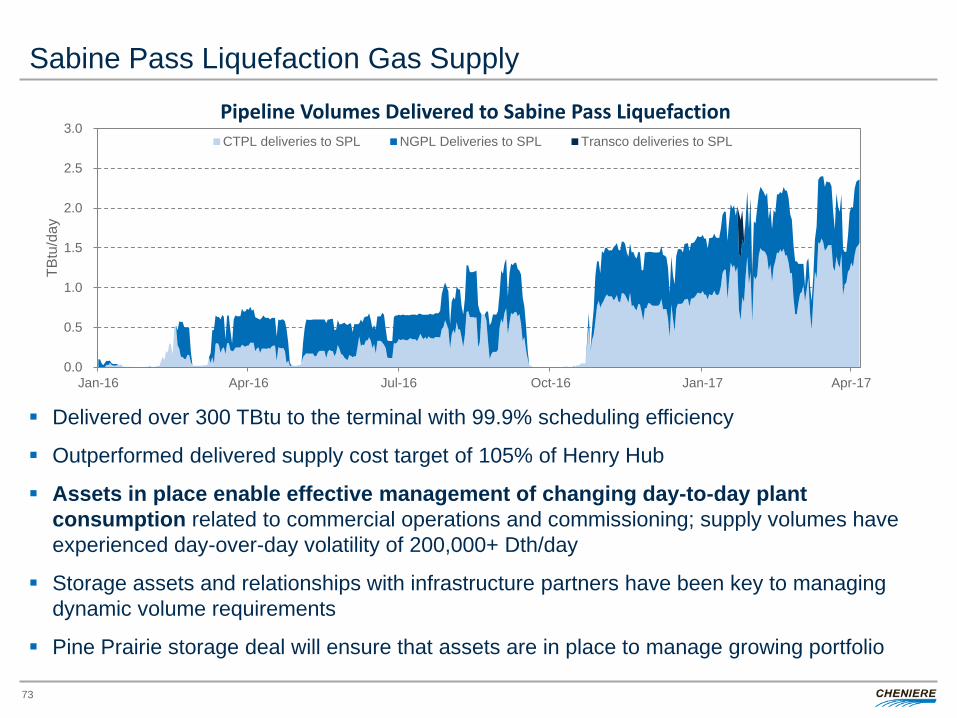
Delivered over 300 TBtu to the terminal with 99.9% scheduling efficiency
Outperformed delivered supply cost target of 105% of Henry Hub
Assets in place enable effective management of changing day-to-day plant consumption related to commercial operations and commissioning; supply volumes have experienced day-over-day volatility of 200,000+ Dth/day
Storage assets and relationships with infrastructure partners have been key to managing dynamic volume requirements
Pine Prairie storage deal will ensure that assets are in place to manage growing portfolio
0.0
0.5
1.0
1.5
2.0
2.5
3.0
Jan-16 Apr-16 Jul-16 Oct-16 Jan-17 Apr-17
TBtu
/day
Pipeline Volumes Delivered to Sabine Pass Liquefaction CTPL deliveries to SPL NGPL Deliveries to SPL Transco deliveries to SPL
Managing Changing Feed Gas Needs
74
1.6
1.8
2.0
2.2
2.4
Weds Jan 11 Thurs Jan 12 Fri Jan 13 Sat Jan 14 Sun Jan 15
TBtu
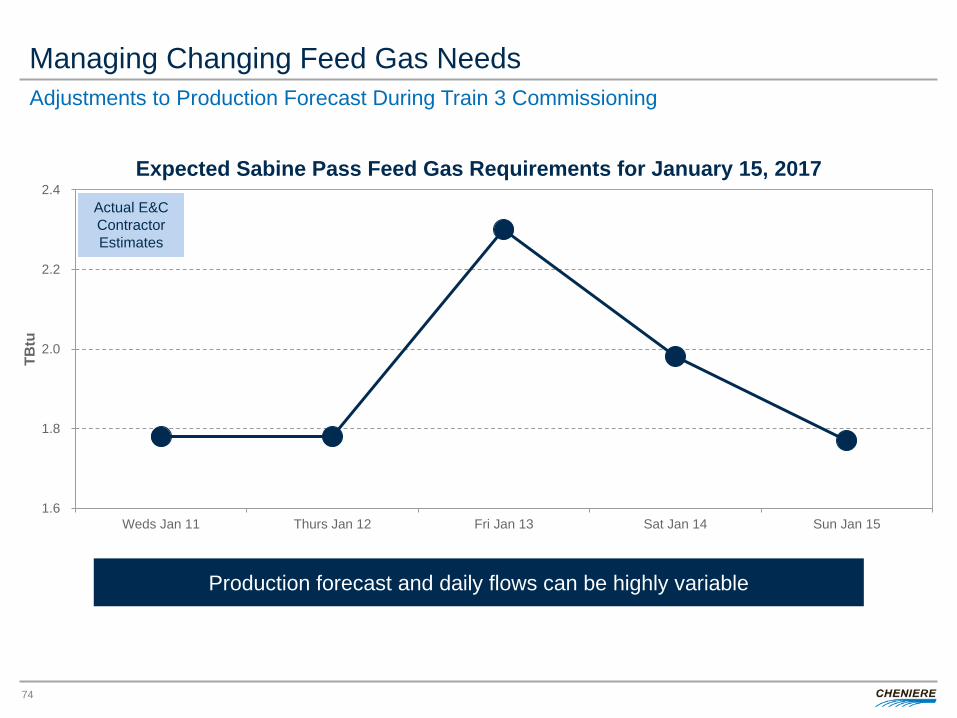
Expected Sabine Pass Feed Gas Requirements for January 15, 2017
Production forecast and daily flows can be highly variable
Adjustments to Production Forecast During Train 3 Commissioning
Actual E&C Contractor Estimates
75
Sabine Pass Gas Supply Infrastructure Advantage
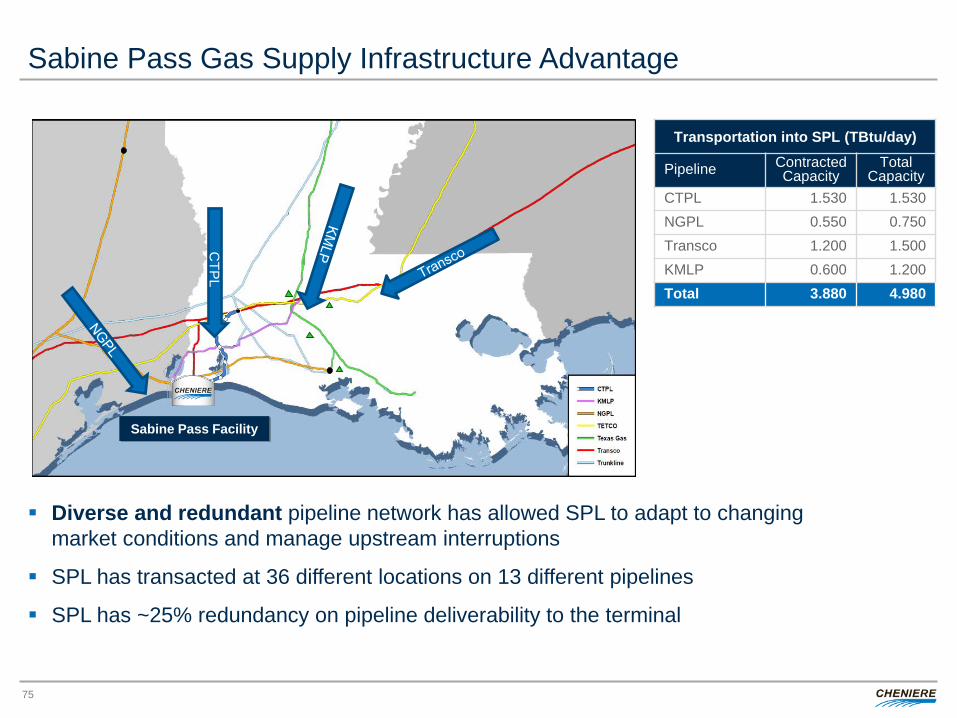
Transportation into SPL (TBtu/day)
Pipeline Contracted Capacity
Total Capacity
CTPL 1.530 1.530 NGPL 0.550 0.750 Transco 1.200 1.500 KMLP 0.600 1.200 Total 3.880 4.980
Diverse and redundant pipeline network has allowed SPL to adapt to changing market conditions and manage upstream interruptions
SPL has transacted at 36 different locations on 13 different pipelines
SPL has ~25% redundancy on pipeline deliverability to the terminal
Sabine Pass Facility
CTP
L
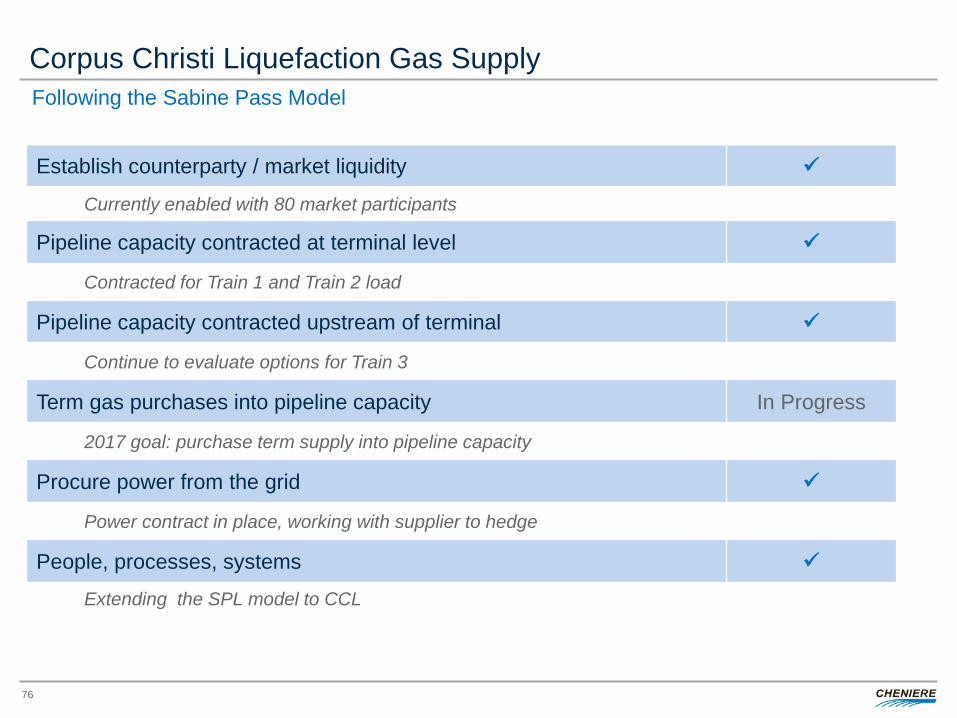
Establish counterparty / market liquidity
Currently enabled with 80 market participants
Pipeline capacity contracted at terminal level
Contracted for Train 1 and Train 2 load
Pipeline capacity contracted upstream of terminal
Continue to evaluate options for Train 3
Term gas purchases into pipeline capacity In Progress
2017 goal: purchase term supply into pipeline capacity
Procure power from the grid
Power contract in place, working with supplier to hedge
People, processes, systems
Extending the SPL model to CCL
Corpus Christi Liquefaction Gas Supply Following the Sabine Pass Model
76
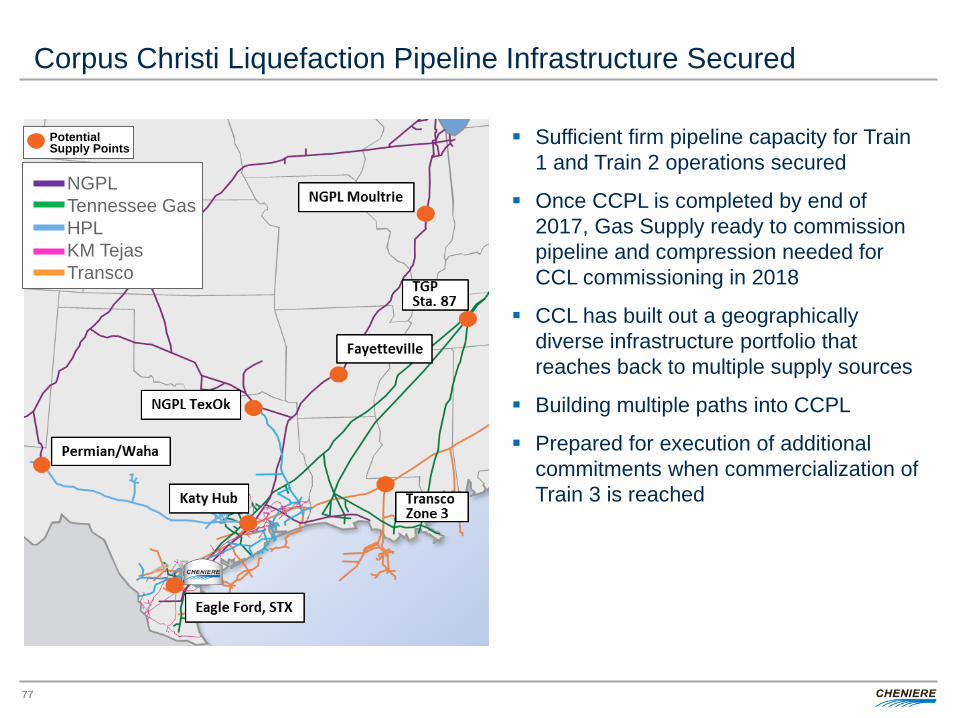
Corpus Christi Liquefaction Pipeline Infrastructure Secured
Sufficient firm pipeline capacity for Train 1 and Train 2 operations secured
Once CCPL is completed by end of 2017, Gas Supply ready to commission pipeline and compression needed for CCL commissioning in 2018
CCL has built out a geographically diverse infrastructure portfolio that reaches back to multiple supply sources
Building multiple paths into CCPL
Prepared for execution of additional commitments when commercialization of Train 3 is reached
77
NGPL Tennessee Gas HPL KM Tejas Transco
Potential Supply Points
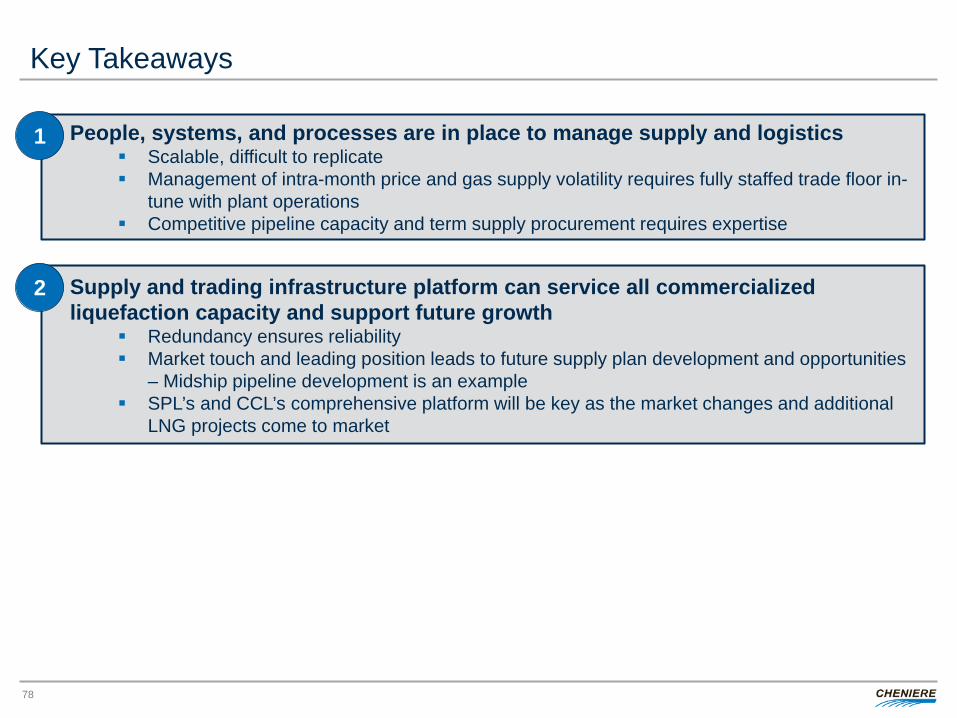
Key Takeaways
78
People, systems, and processes are in place to manage supply and logistics Scalable, difficult to replicate Management of intra-month price and gas supply volatility requires fully staffed trade floor in-
tune with plant operations Competitive pipeline capacity and term supply procurement requires expertise
1
Supply and trading infrastructure platform can service all commercialized liquefaction capacity and support future growth
Redundancy ensures reliability Market touch and leading position leads to future supply plan development and opportunities
– Midship pipeline development is an example SPL’s and CCL’s comprehensive platform will be key as the market changes and additional
LNG projects come to market
2

CHENIERE ENERGY, INC. COMMERCIAL OPERATIONS AND ASSET OPTIMIZATION
IV
Eric Bensaude, Managing Director
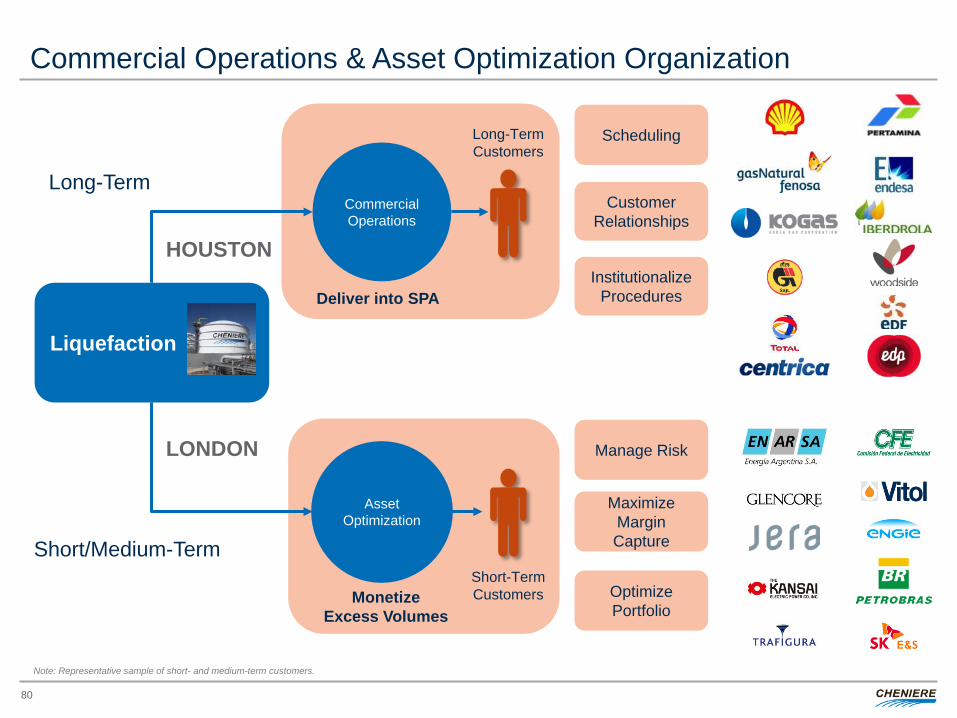
Commercial Operations & Asset Optimization Organization
80
Liquefaction
Asset Optimization
Long-Term
Short/Medium-Term
Monetize Excess Volumes
Short-Term Customers
Long-Term Customers
Commercial Operations
Deliver into SPA
Scheduling
Customer Relationships
Manage Risk
Maximize Margin Capture
Optimize Portfolio
Institutionalize Procedures
HOUSTON
LONDON
Note: Representative sample of short- and medium-term customers.
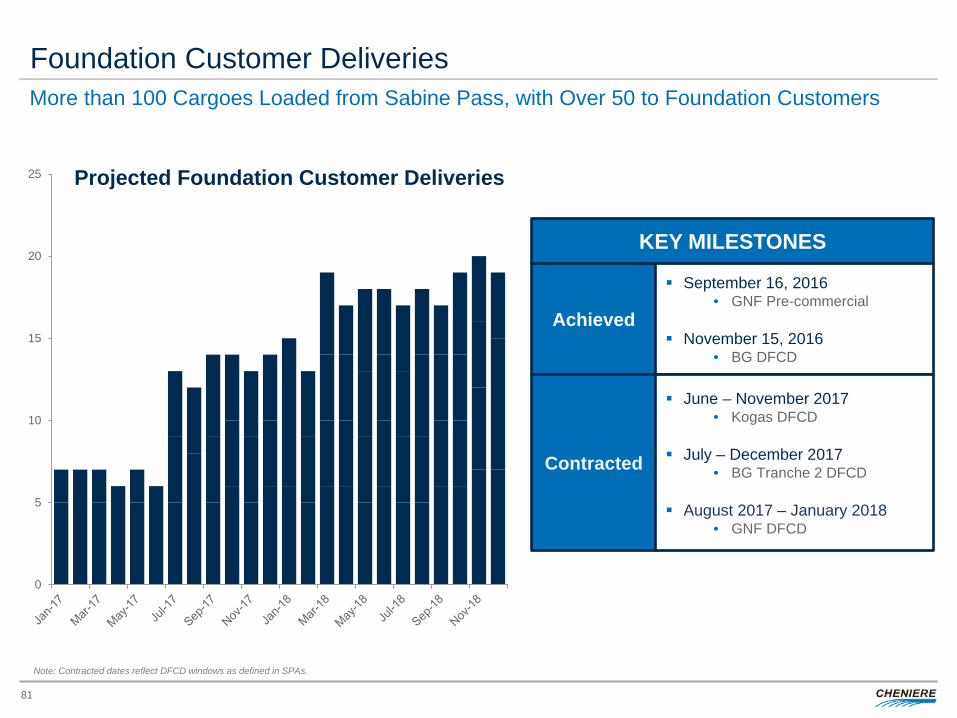
Foundation Customer Deliveries
81
More than 100 Cargoes Loaded from Sabine Pass, with Over 50 to Foundation Customers
0
5
10
15
20
25 Projected Foundation Customer Deliveries
KEY MILESTONES
Achieved
Contracted
September 16, 2016 • GNF Pre-commercial
November 15, 2016
• BG DFCD
June – November 2017 • Kogas DFCD
July – December 2017
• BG Tranche 2 DFCD
August 2017 – January 2018 • GNF DFCD
Note: Contracted dates reflect DFCD windows as defined in SPAs.
0
1
2
3
4
$/M
MB
tu
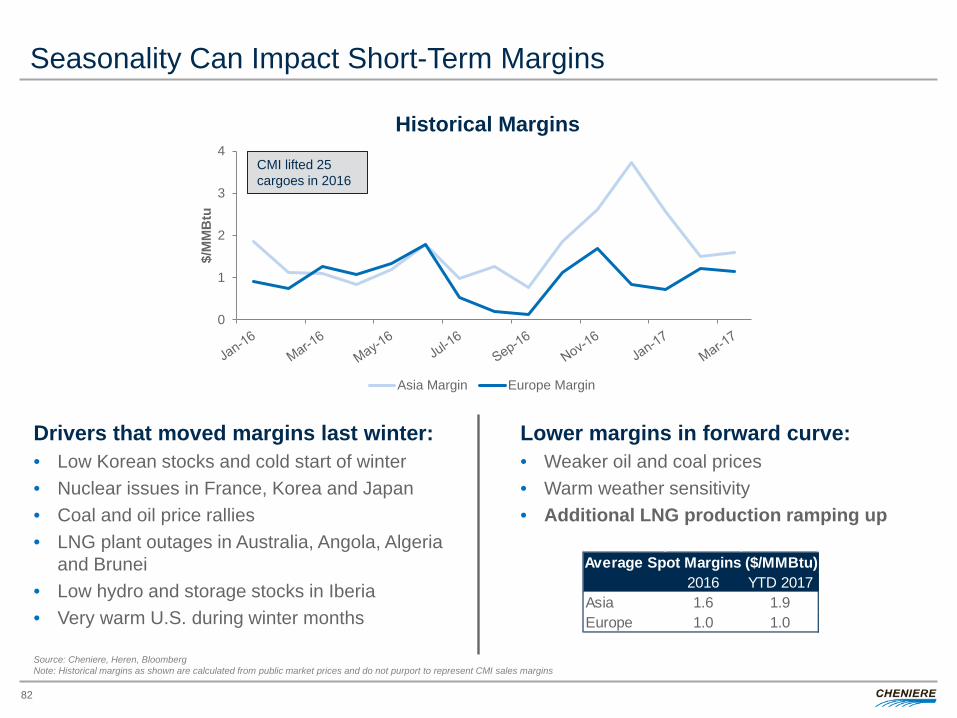
Historical Margins
Asia Margin Europe Margin
Seasonality Can Impact Short-Term Margins
82
Lower margins in forward curve: • Weaker oil and coal prices • Warm weather sensitivity • Additional LNG production ramping up
Drivers that moved margins last winter: • Low Korean stocks and cold start of winter • Nuclear issues in France, Korea and Japan • Coal and oil price rallies • LNG plant outages in Australia, Angola, Algeria
and Brunei • Low hydro and storage stocks in Iberia • Very warm U.S. during winter months
CMI lifted 25 cargoes in 2016
Source: Cheniere, Heren, Bloomberg Note: Historical margins as shown are calculated from public market prices and do not purport to represent CMI sales margins
2016 YTD 2017Asia 1.6 1.9Europe 1.0 1.0
Average Spot Margins ($/MMBtu)
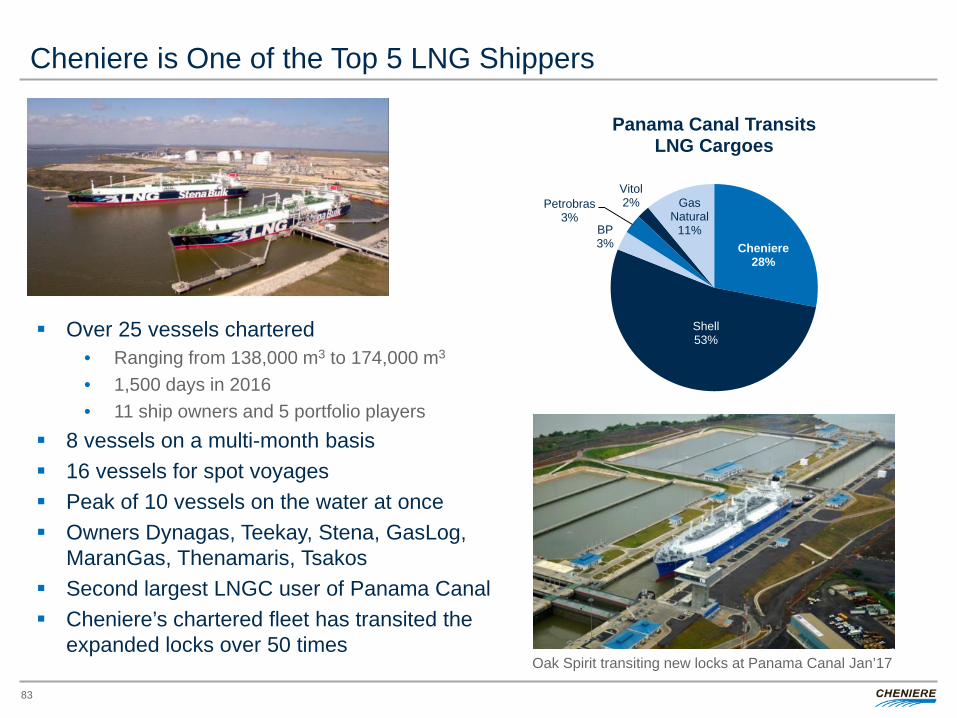
Cheniere is One of the Top 5 LNG Shippers
83
Oak Spirit transiting new locks at Panama Canal Jan’17
Over 25 vessels chartered • Ranging from 138,000 m3 to 174,000 m3 • 1,500 days in 2016 • 11 ship owners and 5 portfolio players
8 vessels on a multi-month basis 16 vessels for spot voyages Peak of 10 vessels on the water at once Owners Dynagas, Teekay, Stena, GasLog,
MaranGas, Thenamaris, Tsakos Second largest LNGC user of Panama Canal Cheniere’s chartered fleet has transited the
expanded locks over 50 times
Cheniere 28%
Shell 53%
BP 3%
Petrobras 3%
Vitol 2% Gas
Natural 11%
Panama Canal Transits LNG Cargoes
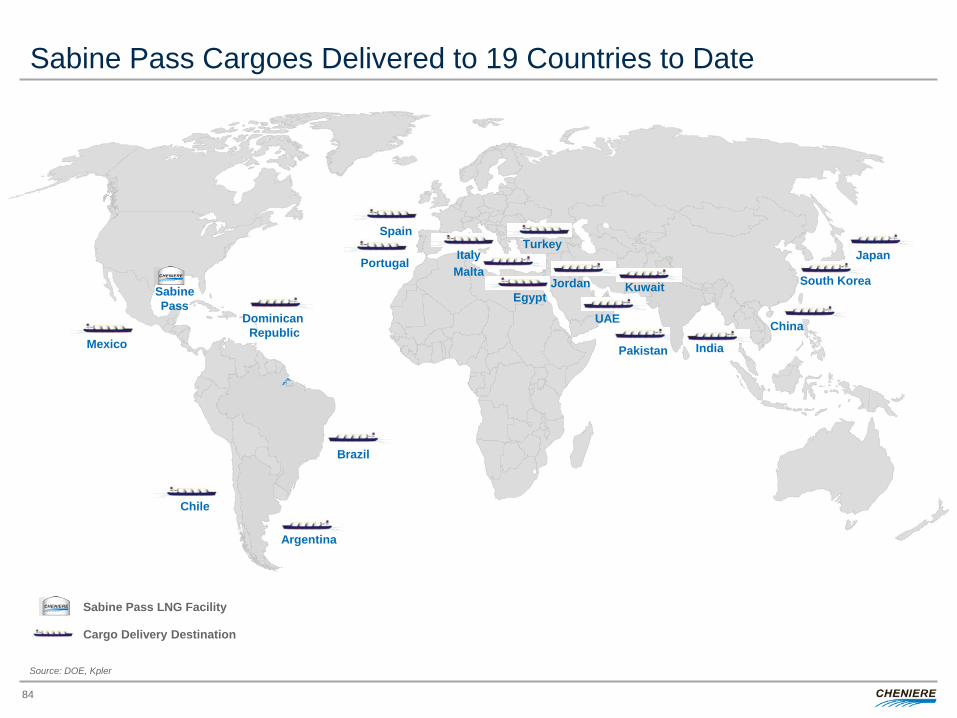
Sabine Pass Cargoes Delivered to 19 Countries to Date
84
Sabine Pass LNG Facility
Portugal
Kuwait
India
Brazil
Argentina
Cargo Delivery Destination
China
Spain
Sabine Pass
Chile
Mexico
Jordan
Dominican Republic
Turkey
Egypt
Japan
South Korea
Italy
UAE
Source: DOE, Kpler
Malta
Pakistan
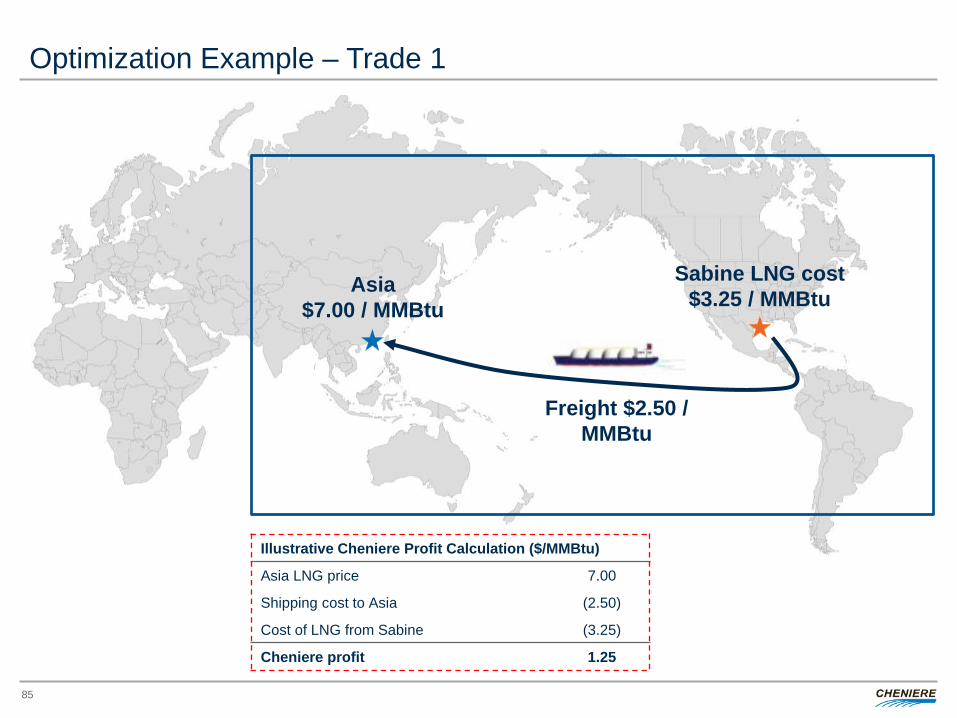
Optimization Example – Trade 1
Sabine LNG cost $3.25 / MMBtu Asia
$7.00 / MMBtu
Freight $2.50 / MMBtu
Illustrative Cheniere Profit Calculation ($/MMBtu)
Asia LNG price 7.00
Shipping cost to Asia (2.50)
Cost of LNG from Sabine (3.25)
Cheniere profit 1.25
85
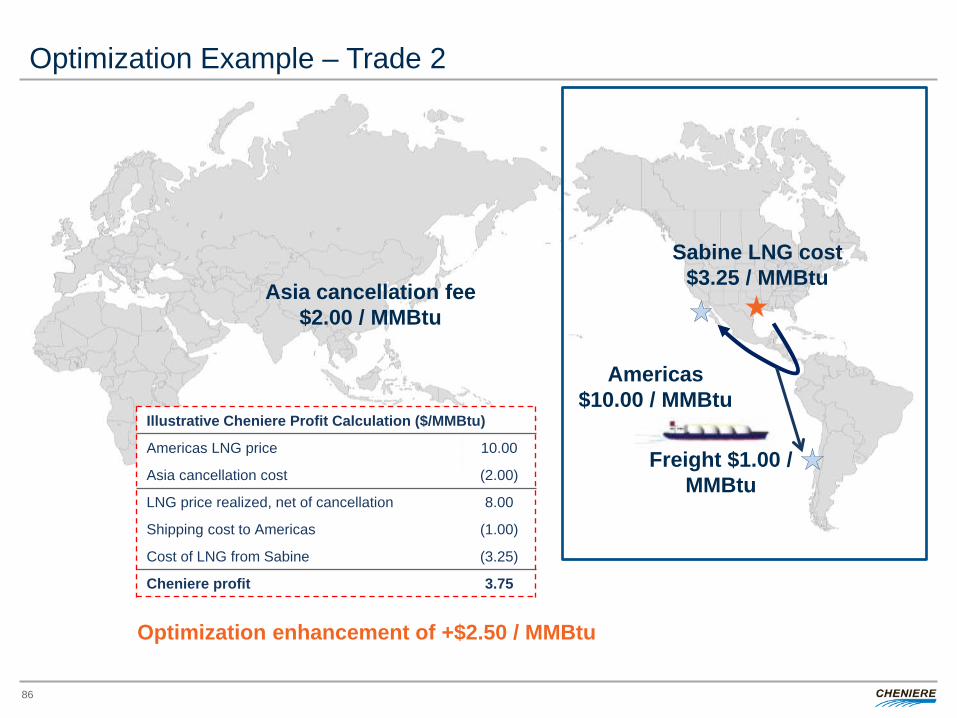
Optimization Example – Trade 2
Freight $1.00 / MMBtu
Americas $10.00 / MMBtu
Asia cancellation fee $2.00 / MMBtu
Sabine LNG cost $3.25 / MMBtu
Illustrative Cheniere Profit Calculation ($/MMBtu)
Americas LNG price 10.00
Asia cancellation cost (2.00)
LNG price realized, net of cancellation 8.00
Shipping cost to Americas (1.00)
Cost of LNG from Sabine (3.25)
Cheniere profit 3.75
Optimization enhancement of +$2.50 / MMBtu
86
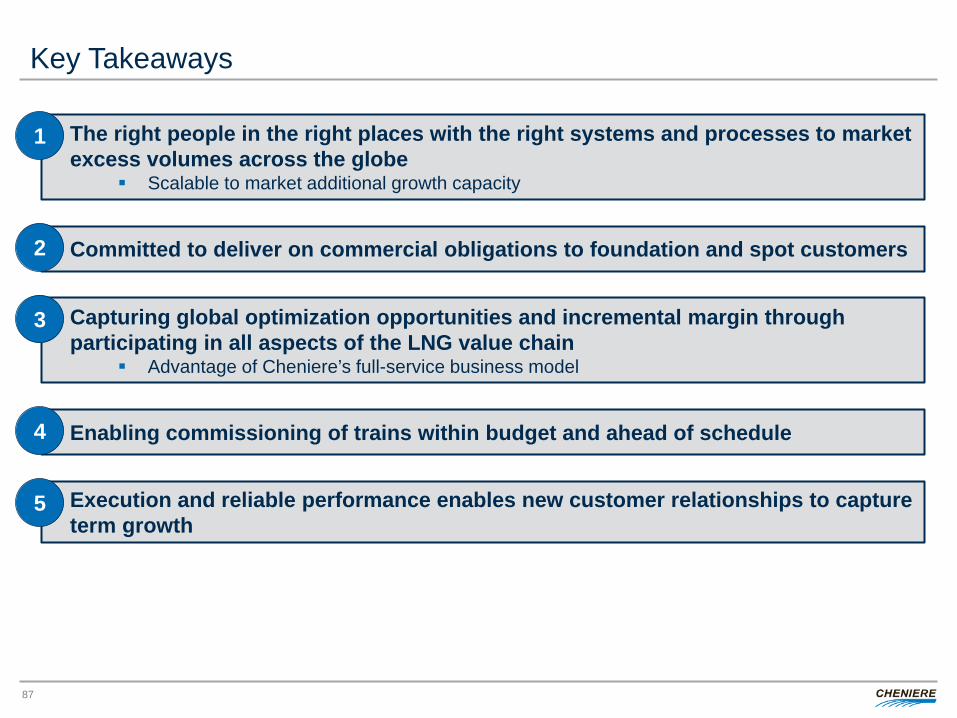
Key Takeaways
87
The right people in the right places with the right systems and processes to market excess volumes across the globe
Scalable to market additional growth capacity
1
Committed to deliver on commercial obligations to foundation and spot customers 2
Capturing global optimization opportunities and incremental margin through participating in all aspects of the LNG value chain
Advantage of Cheniere’s full-service business model
3
Enabling commissioning of trains within budget and ahead of schedule 4
Execution and reliable performance enables new customer relationships to capture term growth
5
CHENIERE ENERGY, INC. ORIGINATION
V
Ramzi Mroueh, Managing Director
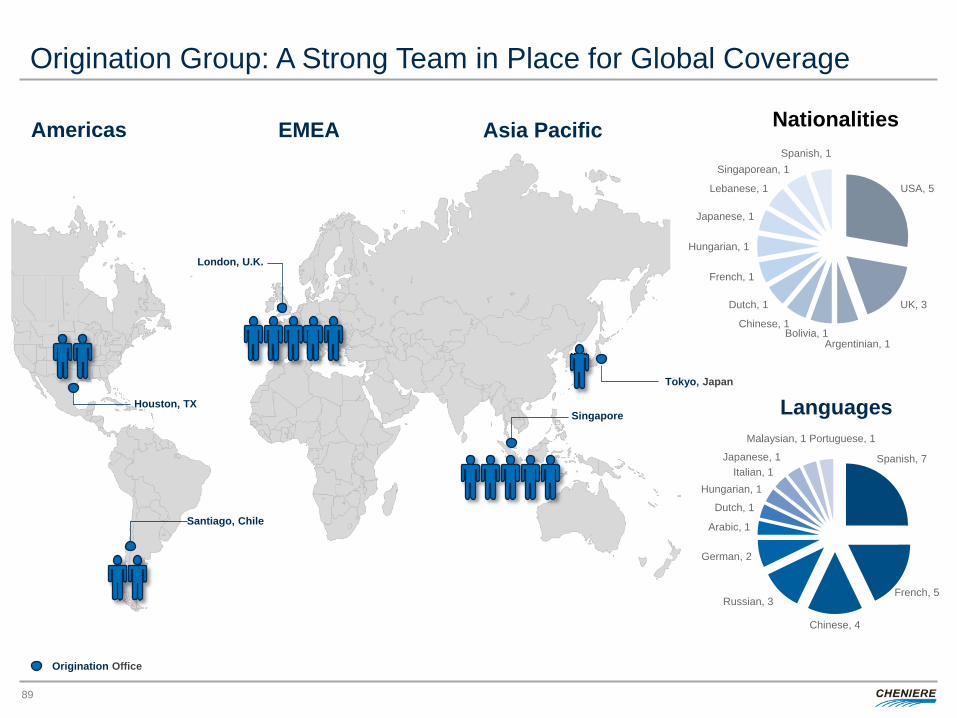
Origination Group: A Strong Team in Place for Global Coverage
89
Singapore Houston, TX
Santiago, Chile
London, U.K.
Origination Office
Americas EMEA Asia Pacific
Tokyo, Japan
Nationalities
Spanish, 7
French, 5
Chinese, 4
Russian, 3
German, 2
Arabic, 1
Dutch, 1
Hungarian, 1 Italian, 1
Japanese, 1
Malaysian, 1 Portuguese, 1
Languages
USA, 5
UK, 3
Argentinian, 1 Bolivia, 1
Chinese, 1
Dutch, 1
French, 1
Hungarian, 1
Japanese, 1
Lebanese, 1
Singaporean, 1 Spanish, 1
-
50
100
150
200
250
300
350
400
450
500
2000 2005 2010 2015 2020 2025 2030
mtpa
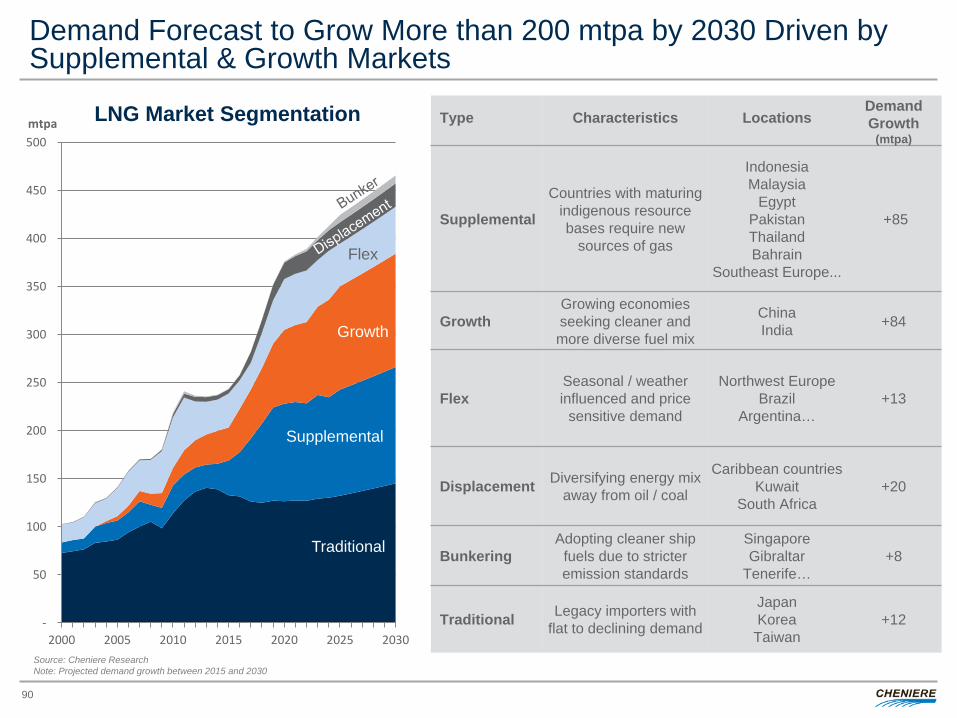
Demand Forecast to Grow More than 200 mtpa by 2030 Driven by Supplemental & Growth Markets
90
LNG Market Segmentation
Traditional
Flex
Growth
Supplemental
Type
Characteristics
Locations
Demand Growth
(mtpa)
Supplemental
Countries with maturing indigenous resource bases require new
sources of gas
Indonesia Malaysia
Egypt Pakistan Thailand Bahrain
Southeast Europe...
+85
Growth Growing economies seeking cleaner and more diverse fuel mix
China India +84
Flex Seasonal / weather influenced and price
sensitive demand
Northwest Europe Brazil
Argentina… +13
Displacement Diversifying energy mix away from oil / coal
Caribbean countries Kuwait
South Africa +20
Bunkering Adopting cleaner ship
fuels due to stricter emission standards
Singapore Gibraltar
Tenerife… +8
Traditional Legacy importers with flat to declining demand
Japan Korea
Taiwan +12
Source: Cheniere Research Note: Projected demand growth between 2015 and 2030
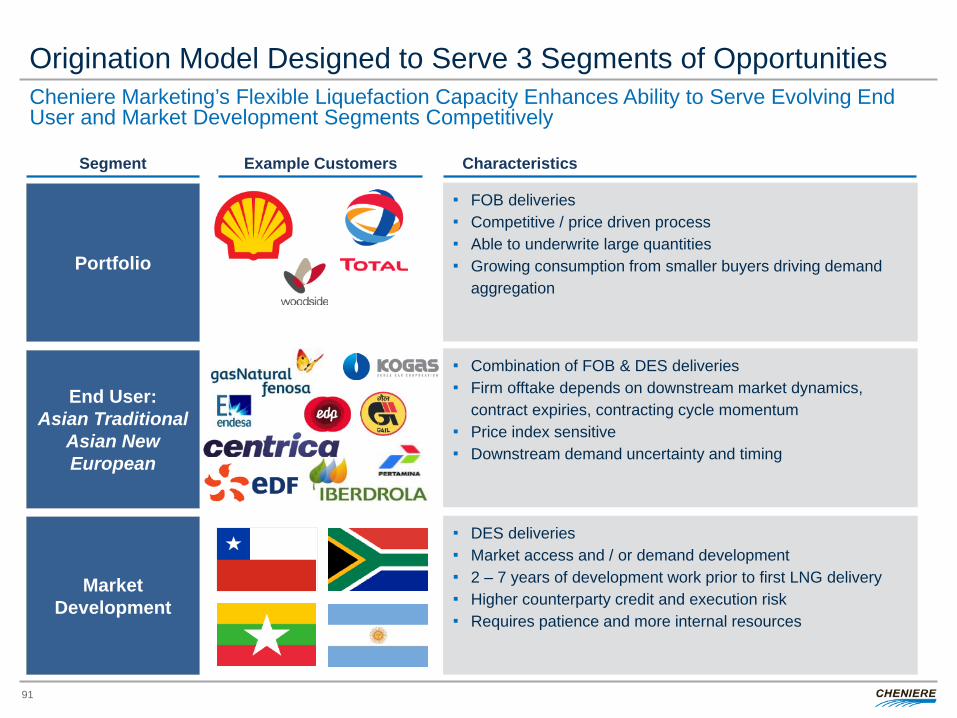
Origination Model Designed to Serve 3 Segments of Opportunities
91
Cheniere Marketing’s Flexible Liquefaction Capacity Enhances Ability to Serve Evolving End User and Market Development Segments Competitively
Traditional
Supplemental
FOB deliveries Competitive / price driven process Able to underwrite large quantities Growing consumption from smaller buyers driving demand
aggregation Portfolio
Segment Example Customers Characteristics
End User: Asian Traditional
Asian New European
DES deliveries Market access and / or demand development 2 – 7 years of development work prior to first LNG delivery Higher counterparty credit and execution risk Requires patience and more internal resources
Market Development
Combination of FOB & DES deliveries Firm offtake depends on downstream market dynamics,
contract expiries, contracting cycle momentum Price index sensitive Downstream demand uncertainty and timing
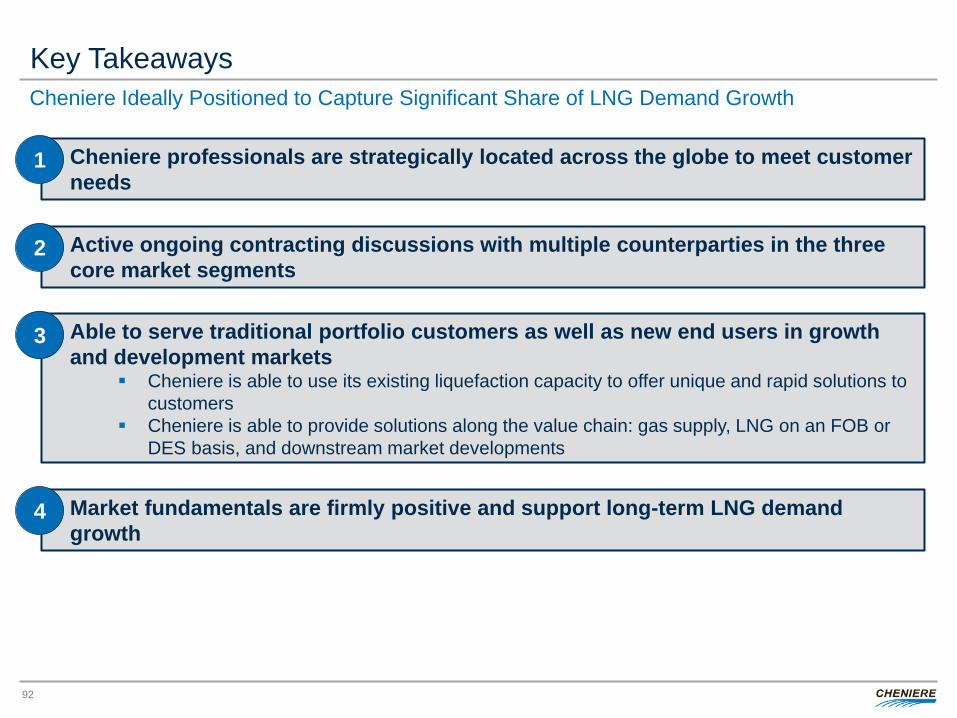
Key Takeaways
92
Cheniere professionals are strategically located across the globe to meet customer needs
1
Active ongoing contracting discussions with multiple counterparties in the three core market segments
2
Able to serve traditional portfolio customers as well as new end users in growth and development markets
Cheniere is able to use its existing liquefaction capacity to offer unique and rapid solutions to customers
Cheniere is able to provide solutions along the value chain: gas supply, LNG on an FOB or DES basis, and downstream market developments
3
Market fundamentals are firmly positive and support long-term LNG demand growth
4
Cheniere Ideally Positioned to Capture Significant Share of LNG Demand Growth

CHENIERE ENERGY, INC. April 19, 2017 ANALYST DAY
CONSTRUCTION, PIPELINE AND OPERATIONS PANEL
ENGINEERING AND CONSTRUCTION Ed Lehotsky, Senior Vice President
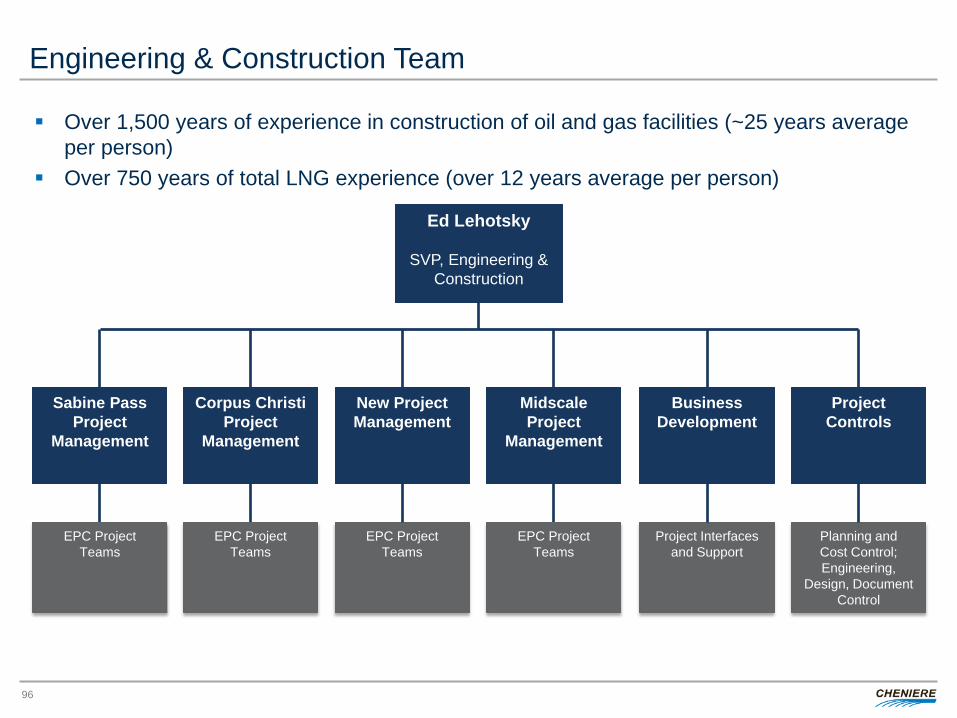
Engineering & Construction Team
96
Over 1,500 years of experience in construction of oil and gas facilities (~25 years average per person)
Over 750 years of total LNG experience (over 12 years average per person)
Ed Lehotsky
SVP, Engineering & Construction
New Project Management
Project Controls
Corpus Christi Project
Management
Sabine Pass Project
Management
Business Development
Midscale Project
Management
EPC Project Teams
EPC Project Teams
EPC Project Teams
Planning and Cost Control; Engineering,
Design, Document Control
Project Interfaces and Support
EPC Project Teams
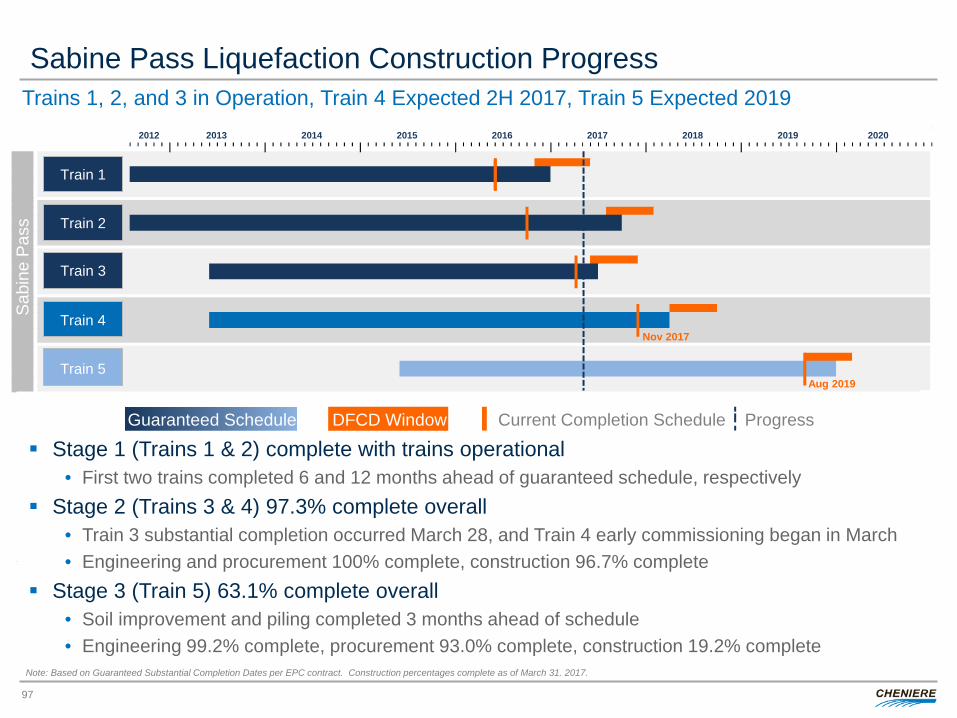
Sabine Pass Liquefaction Construction Progress Trains 1, 2, and 3 in Operation, Train 4 Expected 2H 2017, Train 5 Expected 2019
Note: Based on Guaranteed Substantial Completion Dates per EPC contract. Construction percentages complete as of March 31. 2017.
DFCD Window Current Completion Schedule Progress Guaranteed Schedule
Nov 2017
Sab
ine
Pas
s
2020
Aug 2019
2018 2019 2012 2013 2014 2015 2016 2017
Train 1
Train 2
Train 3
Train 4
Train 5
Stage 1 (Trains 1 & 2) complete with trains operational • First two trains completed 6 and 12 months ahead of guaranteed schedule, respectively
Stage 2 (Trains 3 & 4) 97.3% complete overall • Train 3 substantial completion occurred March 28, and Train 4 early commissioning began in March • Engineering and procurement 100% complete, construction 96.7% complete
Stage 3 (Train 5) 63.1% complete overall • Soil improvement and piling completed 3 months ahead of schedule • Engineering 99.2% complete, procurement 93.0% complete, construction 19.2% complete
97
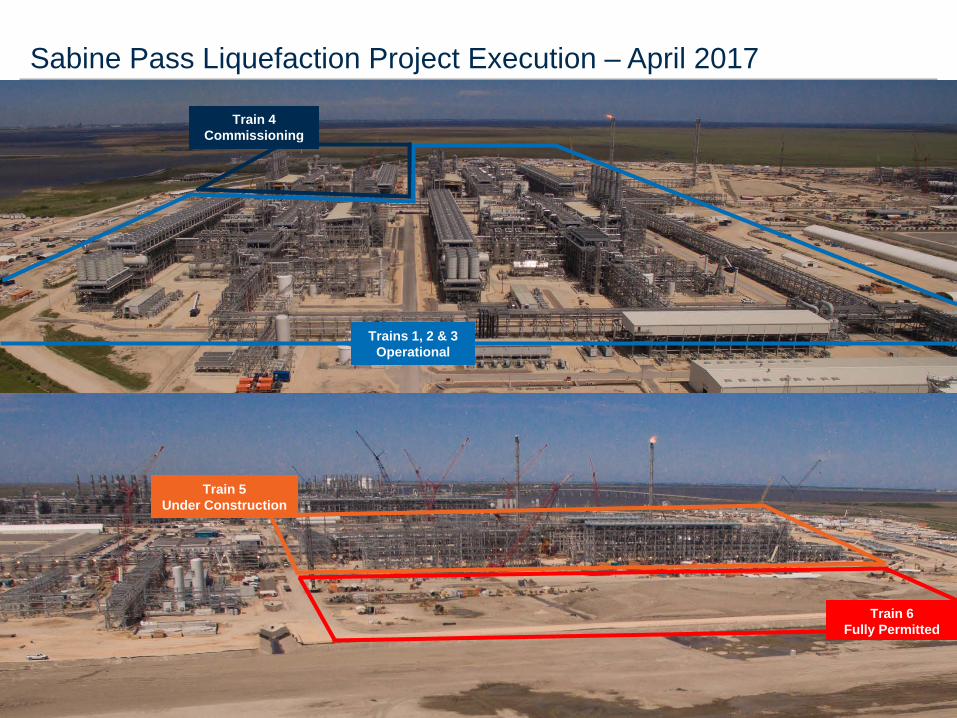
Sabine Pass Liquefaction Project Execution – April 2017
Trains 1, 2 & 3 Operational
Train 4 Commissioning
Train 5 Under Construction
Train 6 Fully Permitted
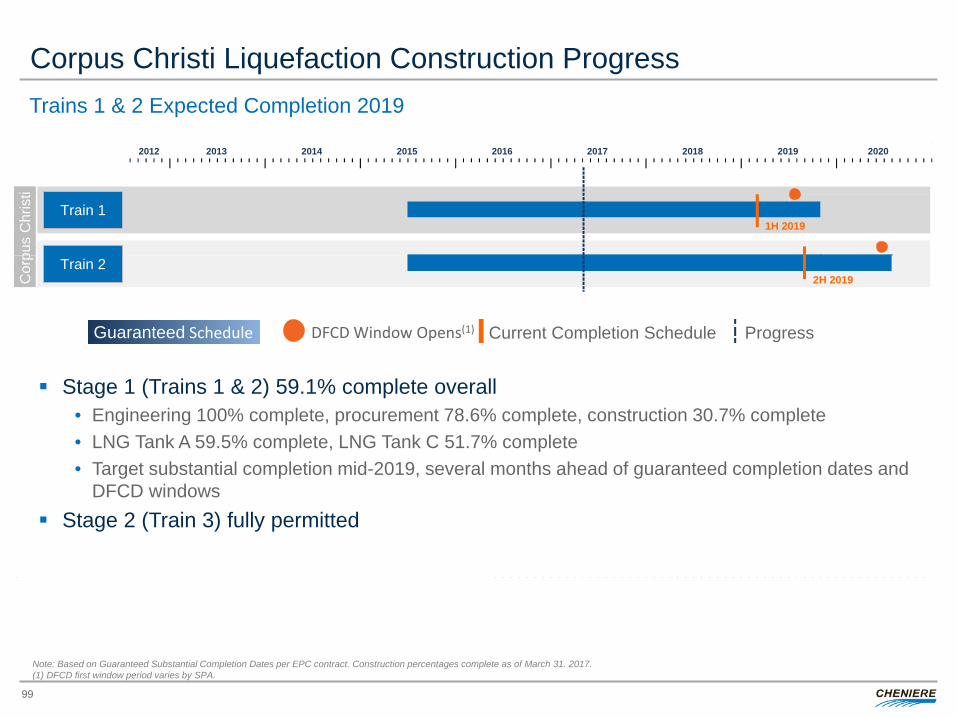
Corpus Christi Liquefaction Construction Progress Trains 1 & 2 Expected Completion 2019
Stage 1 (Trains 1 & 2) 59.1% complete overall • Engineering 100% complete, procurement 78.6% complete, construction 30.7% complete • LNG Tank A 59.5% complete, LNG Tank C 51.7% complete • Target substantial completion mid-2019, several months ahead of guaranteed completion dates and
DFCD windows Stage 2 (Train 3) fully permitted
Note: Based on Guaranteed Substantial Completion Dates per EPC contract. Construction percentages complete as of March 31. 2017. (1) DFCD first window period varies by SPA.
DFCD Window Opens(1) Current Completion Schedule Progress Guaranteed Schedule
2020
1H 2019
Cor
pus
Chr
isti
2H 2019
2018 2019 2012 2013 2014 2015 2016 2017
Train 1
Train 2
99
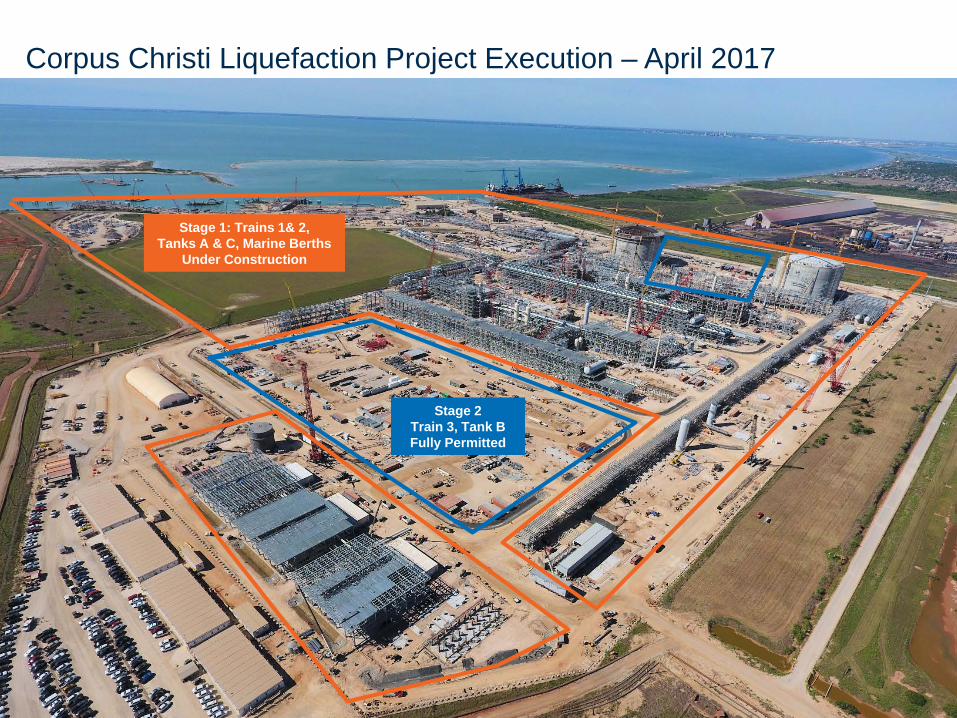
Corpus Christi Liquefaction Project Execution – April 2017
Stage 1: Trains 1& 2, Tanks A & C, Marine Berths
Under Construction
Stage 2 Train 3, Tank B Fully Permitted
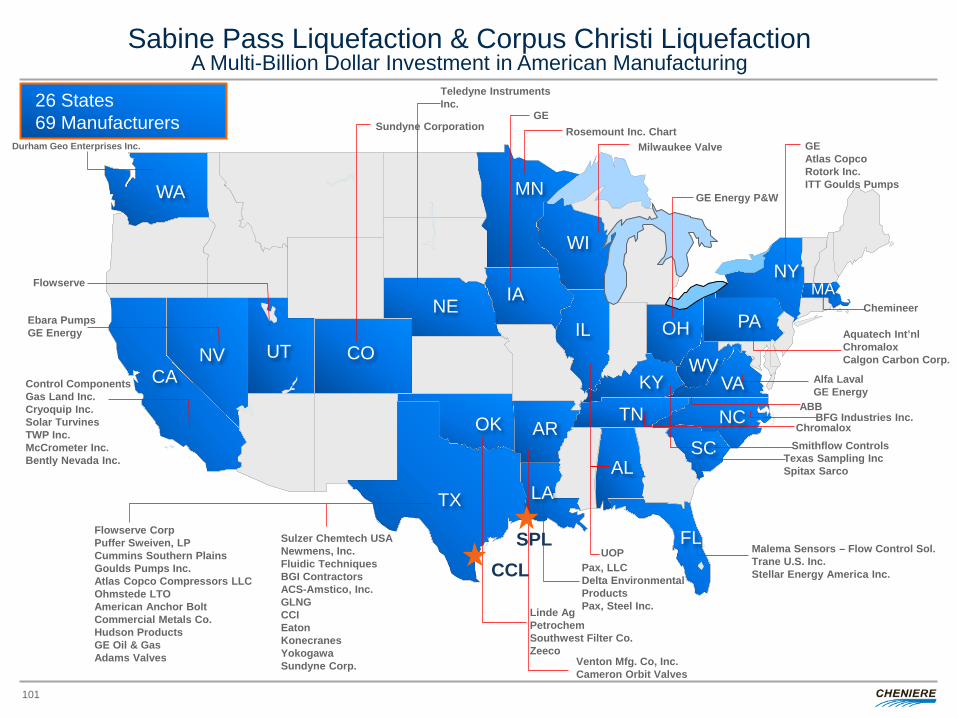
CA CO
IA
LA
MN
NV
NY
OK
OH
TX
PA
VA
Flowserve
Ebara Pumps GE Energy
Pax, LLC Delta Environmental Products Pax, Steel Inc.
Rosemount Inc. Chart GE
Linde Ag Petrochem Southwest Filter Co. Zeeco
GE Energy P&W
Alfa Laval GE Energy
Aquatech Int’nl Chromalox Calgon Carbon Corp.
GE Atlas Copco Rotork Inc. ITT Goulds Pumps
Flowserve Corp Puffer Sweiven, LP Cummins Southern Plains Goulds Pumps Inc. Atlas Copco Compressors LLC Ohmstede LTO American Anchor Bolt Commercial Metals Co. Hudson Products GE Oil & Gas Adams Valves
Sulzer Chemtech USA Newmens, Inc. Fluidic Techniques BGI Contractors ACS-Amstico, Inc. GLNG CCI Eaton Konecranes Yokogawa Sundyne Corp.
Sundyne Corporation
26 States 69 Manufacturers
CCL
ABB
IL
WV UT
Control Components Gas Land Inc. Cryoquip Inc. Solar Turvines TWP Inc. McCrometer Inc. Bently Nevada Inc.
TN Chromalox
UOP
MA Chemineer
AR
Venton Mfg. Co, Inc. Cameron Orbit Valves
WI
Milwaukee Valve
FL Malema Sensors – Flow Control Sol. Trane U.S. Inc. Stellar Energy America Inc.
AL
NE
Teledyne Instruments Inc.
WA
Durham Geo Enterprises Inc.
KY
Smithflow Controls
NC SC
BFG Industries Inc.
Texas Sampling Inc Spitax Sarco
SPL
Sabine Pass Liquefaction & Corpus Christi Liquefaction
A Multi-Billion Dollar Investment in American Manufacturing
101
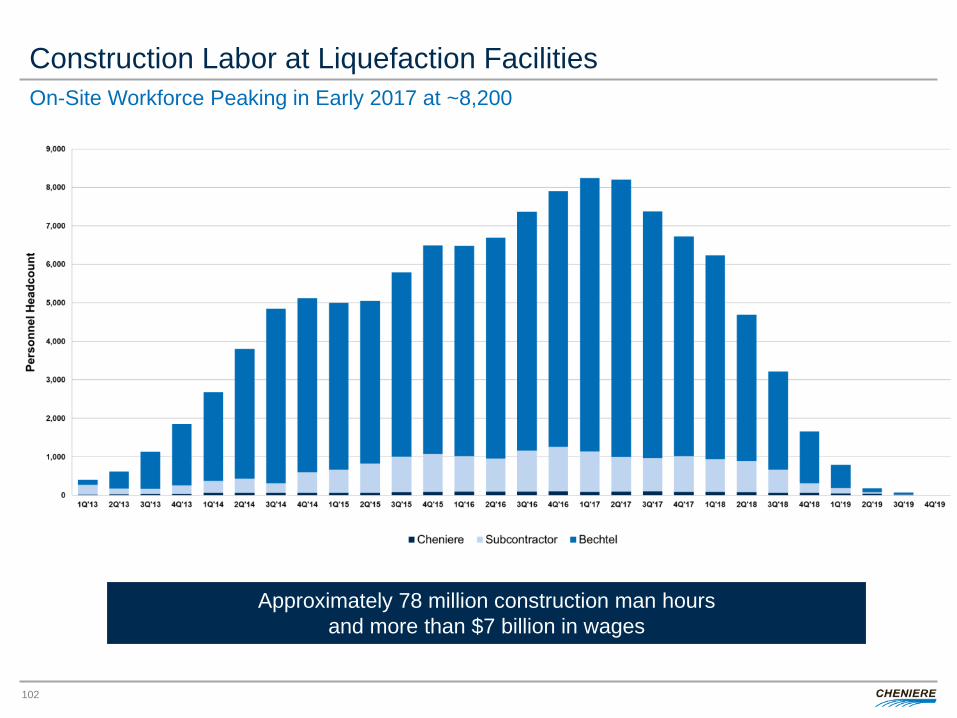
Construction Labor at Liquefaction Facilities
102
On-Site Workforce Peaking in Early 2017 at ~8,200
Approximately 78 million construction man hours and more than $7 billion in wages
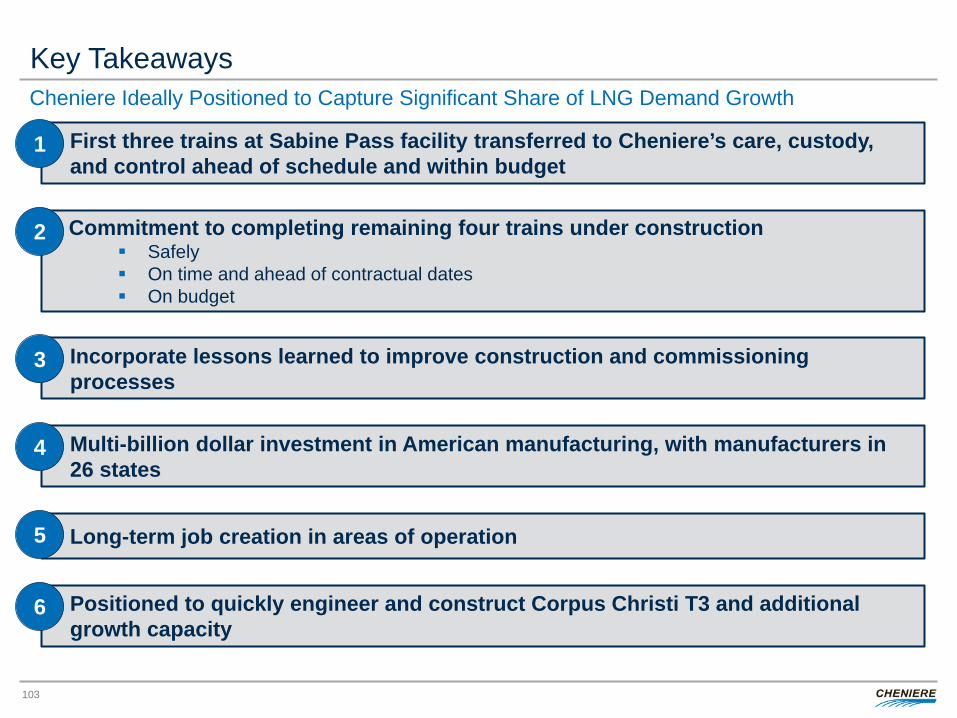
Key Takeaways
103
First three trains at Sabine Pass facility transferred to Cheniere’s care, custody, and control ahead of schedule and within budget
1
Commitment to completing remaining four trains under construction Safely On time and ahead of contractual dates On budget
2
Incorporate lessons learned to improve construction and commissioning processes
3
Cheniere Ideally Positioned to Capture Significant Share of LNG Demand Growth
Multi-billion dollar investment in American manufacturing, with manufacturers in 26 states
4
Positioned to quickly engineer and construct Corpus Christi T3 and additional growth capacity
6
Long-term job creation in areas of operation 5
PIPELINES Chad Zamarin, Senior Vice President
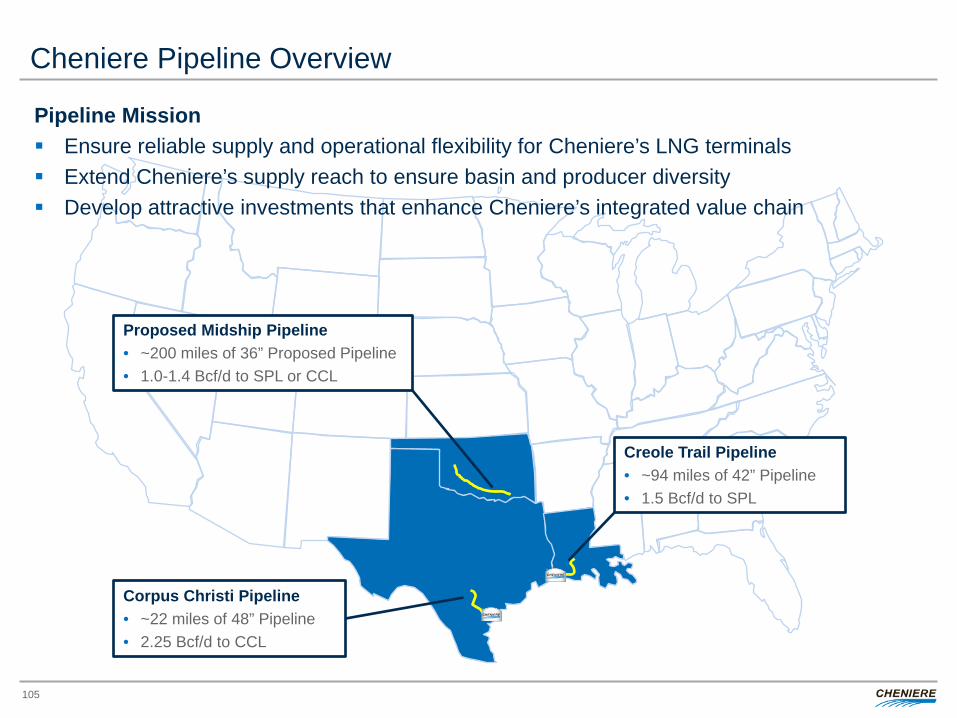
Cheniere Pipeline Overview
105
Pipeline Mission Ensure reliable supply and operational flexibility for Cheniere’s LNG terminals Extend Cheniere’s supply reach to ensure basin and producer diversity Develop attractive investments that enhance Cheniere’s integrated value chain
Proposed Midship Pipeline • ~200 miles of 36” Proposed Pipeline • 1.0-1.4 Bcf/d to SPL or CCL
Creole Trail Pipeline • ~94 miles of 42” Pipeline • 1.5 Bcf/d to SPL
Corpus Christi Pipeline • ~22 miles of 48” Pipeline • 2.25 Bcf/d to CCL
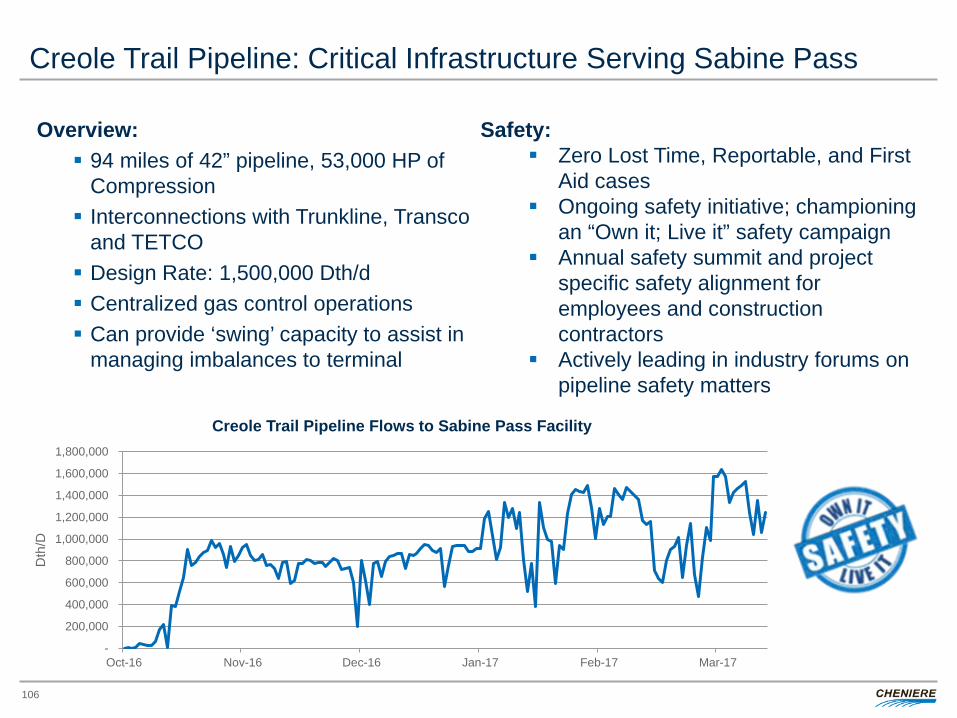
Creole Trail Pipeline: Critical Infrastructure Serving Sabine Pass
Overview: 94 miles of 42” pipeline, 53,000 HP of
Compression Interconnections with Trunkline, Transco
and TETCO Design Rate: 1,500,000 Dth/d Centralized gas control operations Can provide ‘swing’ capacity to assist in
managing imbalances to terminal
-
200,000
400,000
600,000
800,000
1,000,000
1,200,000
1,400,000
1,600,000
1,800,000
Oct-16 Nov-16 Dec-16 Jan-17 Feb-17 Mar-17
Dth
/D
Creole Trail Pipeline Flows to Sabine Pass Facility
Safety: Zero Lost Time, Reportable, and First
Aid cases Ongoing safety initiative; championing
an “Own it; Live it” safety campaign Annual safety summit and project
specific safety alignment for employees and construction contractors
Actively leading in industry forums on pipeline safety matters
106
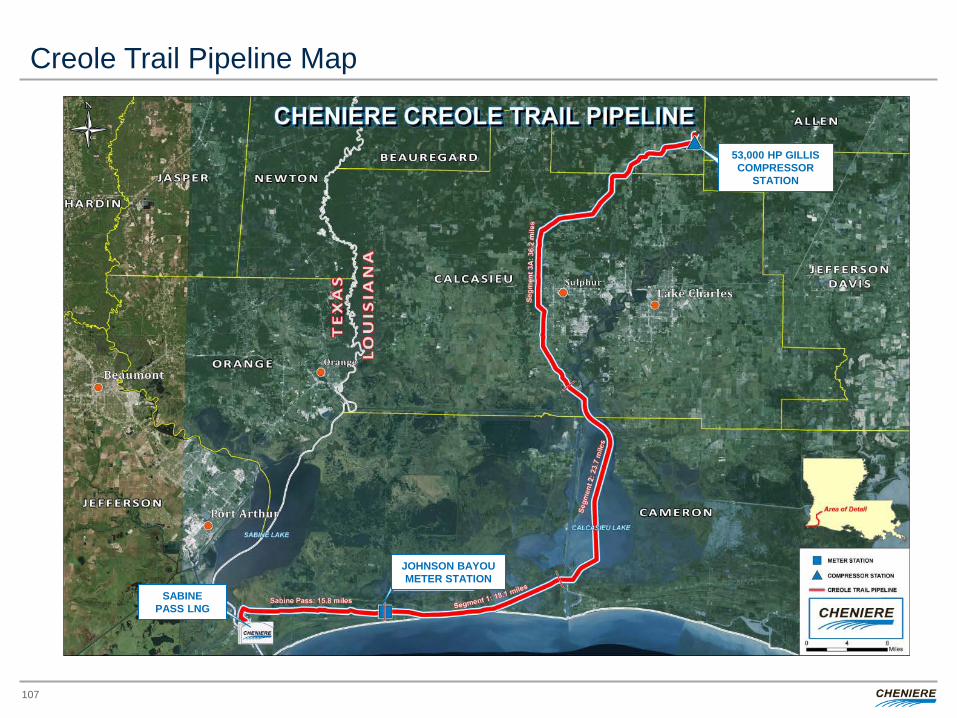
Creole Trail Pipeline Map
107
SABINE PASS LNG
JOHNSON BAYOU METER STATION
53,000 HP GILLIS COMPRESSOR
STATION
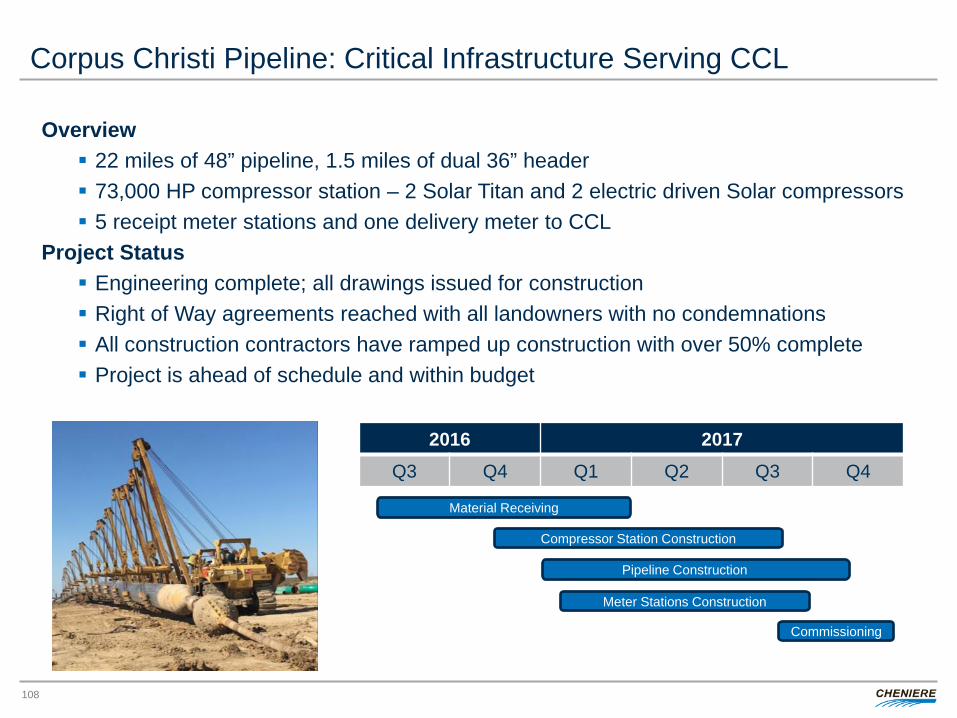
Corpus Christi Pipeline: Critical Infrastructure Serving CCL
Overview 22 miles of 48” pipeline, 1.5 miles of dual 36” header 73,000 HP compressor station – 2 Solar Titan and 2 electric driven Solar compressors 5 receipt meter stations and one delivery meter to CCL
Project Status Engineering complete; all drawings issued for construction Right of Way agreements reached with all landowners with no condemnations All construction contractors have ramped up construction with over 50% complete Project is ahead of schedule and within budget
108
2016 2017 Q3 Q4 Q1 Q2 Q3 Q4
Material Receiving
Commissioning
Meter Stations Construction
Pipeline Construction
Compressor Station Construction
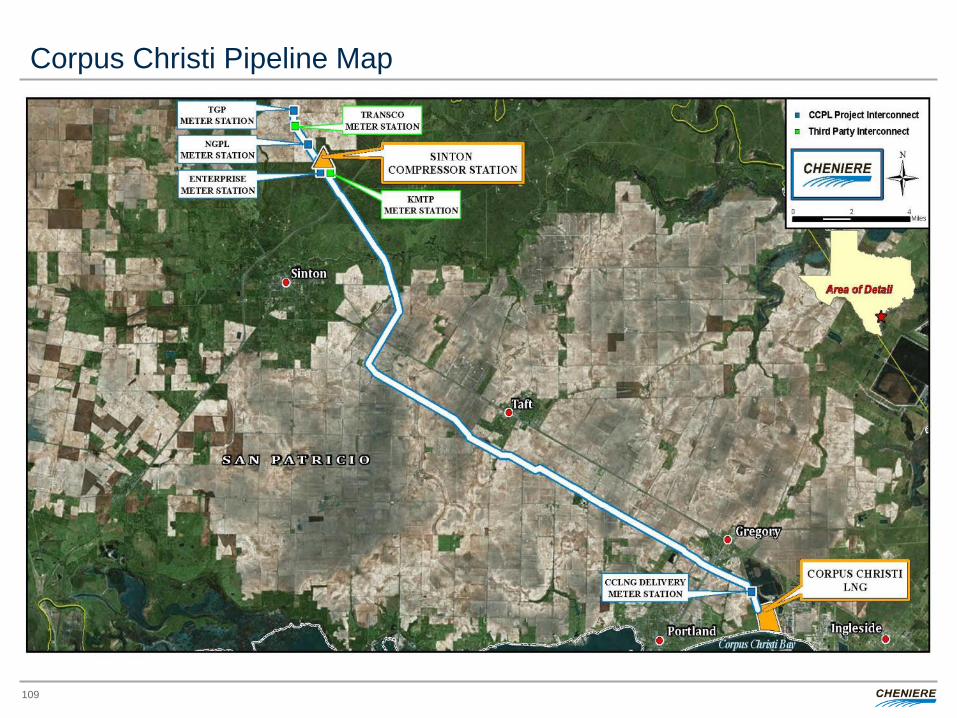
Corpus Christi Pipeline Map
109
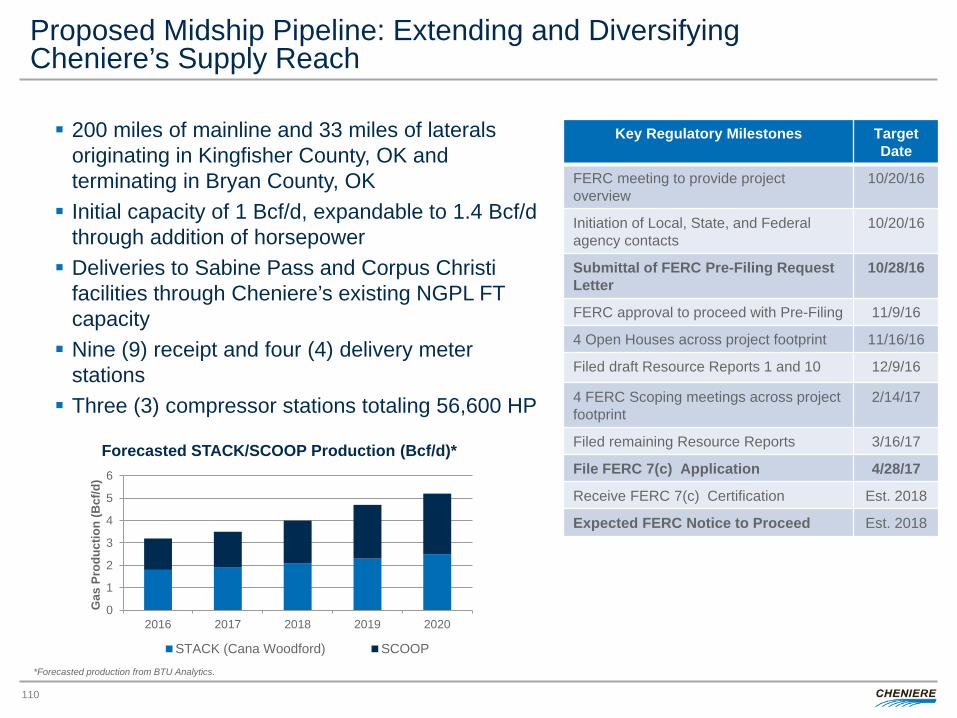
Proposed Midship Pipeline: Extending and Diversifying Cheniere’s Supply Reach
200 miles of mainline and 33 miles of laterals originating in Kingfisher County, OK and terminating in Bryan County, OK Initial capacity of 1 Bcf/d, expandable to 1.4 Bcf/d
through addition of horsepower Deliveries to Sabine Pass and Corpus Christi
facilities through Cheniere’s existing NGPL FT capacity Nine (9) receipt and four (4) delivery meter
stations Three (3) compressor stations totaling 56,600 HP
110
Key Regulatory Milestones Target Date
FERC meeting to provide project overview
10/20/16
Initiation of Local, State, and Federal agency contacts
10/20/16
Submittal of FERC Pre-Filing Request Letter
10/28/16
FERC approval to proceed with Pre-Filing 11/9/16
4 Open Houses across project footprint 11/16/16
Filed draft Resource Reports 1 and 10 12/9/16
4 FERC Scoping meetings across project footprint
2/14/17
Filed remaining Resource Reports 3/16/17
File FERC 7(c) Application 4/28/17
Receive FERC 7(c) Certification Est. 2018
Expected FERC Notice to Proceed Est. 2018
0
1
2
3
4
5
6
2016 2017 2018 2019 2020
Gas
Pro
duct
ion
(Bcf
/d)
STACK (Cana Woodford) SCOOP
Forecasted STACK/SCOOP Production (Bcf/d)*
*Forecasted production from BTU Analytics.
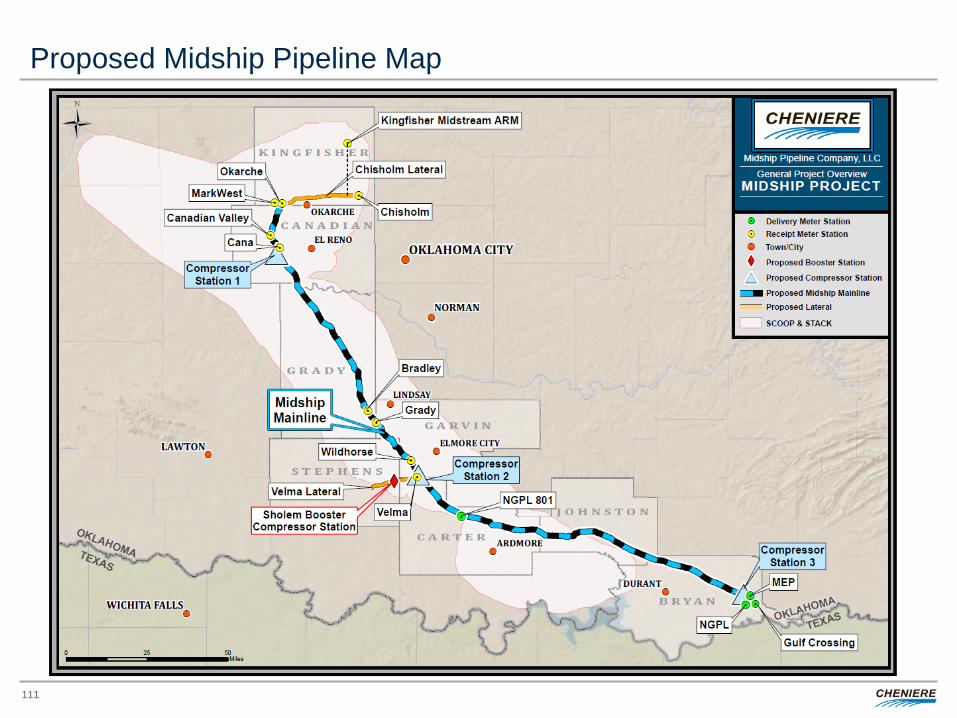
Proposed Midship Pipeline Map
111
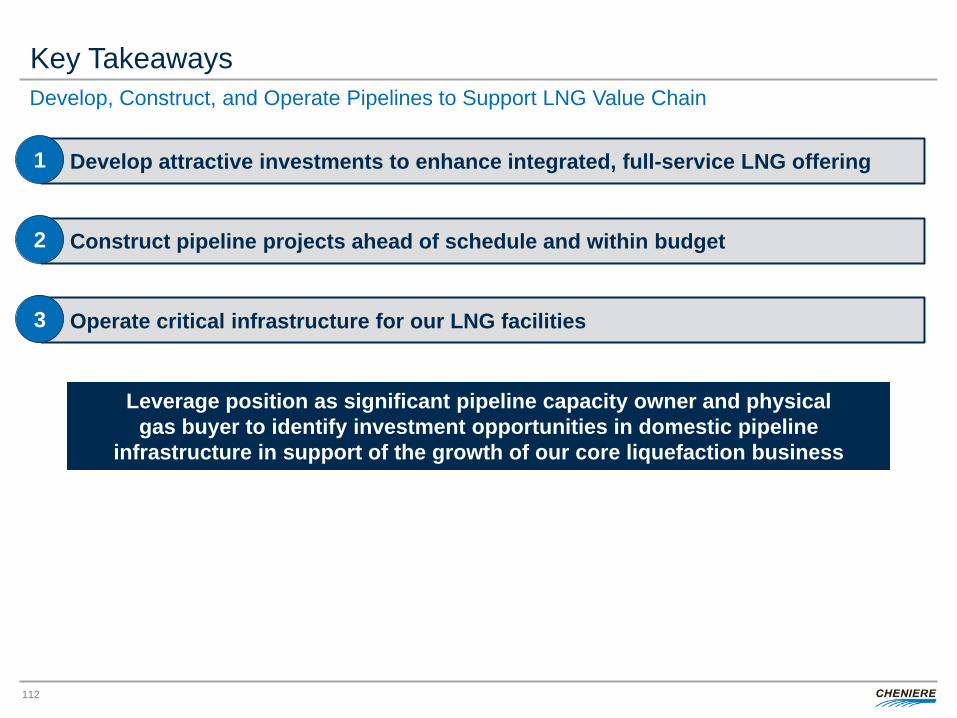
Key Takeaways
112
Develop attractive investments to enhance integrated, full-service LNG offering 1
Construct pipeline projects ahead of schedule and within budget 2
Operate critical infrastructure for our LNG facilities 3
Develop, Construct, and Operate Pipelines to Support LNG Value Chain
Leverage position as significant pipeline capacity owner and physical gas buyer to identify investment opportunities in domestic pipeline
infrastructure in support of the growth of our core liquefaction business
OPERATIONS Doug Shanda, Senior Vice President
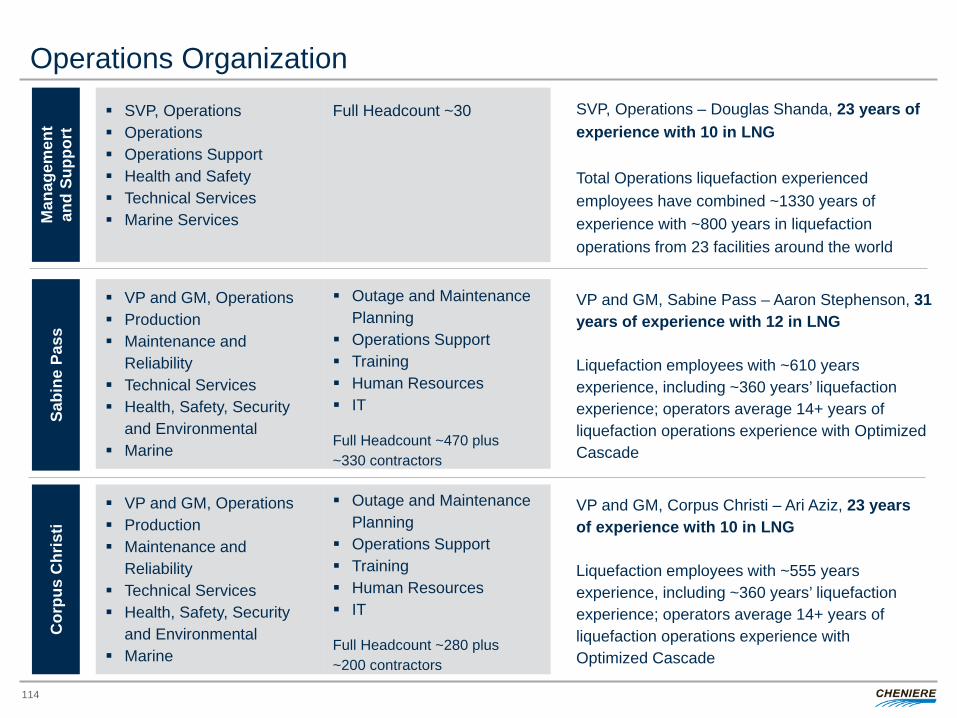
Operations Organization M
anag
emen
t an
d Su
ppor
t Sa
bine
Pas
s
SVP, Operations – Douglas Shanda, 23 years of experience with 10 in LNG Total Operations liquefaction experienced employees have combined ~1330 years of experience with ~800 years in liquefaction operations from 23 facilities around the world
VP and GM, Sabine Pass – Aaron Stephenson, 31 years of experience with 12 in LNG Liquefaction employees with ~610 years experience, including ~360 years’ liquefaction experience; operators average 14+ years of liquefaction operations experience with Optimized Cascade
VP and GM, Corpus Christi – Ari Aziz, 23 years of experience with 10 in LNG Liquefaction employees with ~555 years experience, including ~360 years’ liquefaction experience; operators average 14+ years of liquefaction operations experience with Optimized Cascade
SVP, Operations Operations Operations Support Health and Safety Technical Services Marine Services
Cor
pus
Chr
isti
VP and GM, Operations Production Maintenance and
Reliability Technical Services Health, Safety, Security
and Environmental Marine
Outage and Maintenance Planning
Operations Support Training Human Resources IT
Full Headcount ~470 plus ~330 contractors
VP and GM, Operations Production Maintenance and
Reliability Technical Services Health, Safety, Security
and Environmental Marine
Outage and Maintenance Planning
Operations Support Training Human Resources IT
Full Headcount ~280 plus ~200 contractors
Full Headcount ~30
114
Liquefaction Capacity
115
How do we define nominal production capacity? Nominal production capacity is the approximate expected capacity before adjustments,
which include: • Planned maintenance • Reliability • Over design • Debottlenecking • Process conditions
Are the adjustments the same for Sabine Pass and Corpus Christi? Most of the adjustments are expected to be similar except planned maintenance
Is capacity the same every year? Capacity for each train varies year to year mainly due to the amount of planned
maintenance • Planned maintenance is driven mainly by turbine maintenance • Minor variations due to reliability or weather conditions may occur
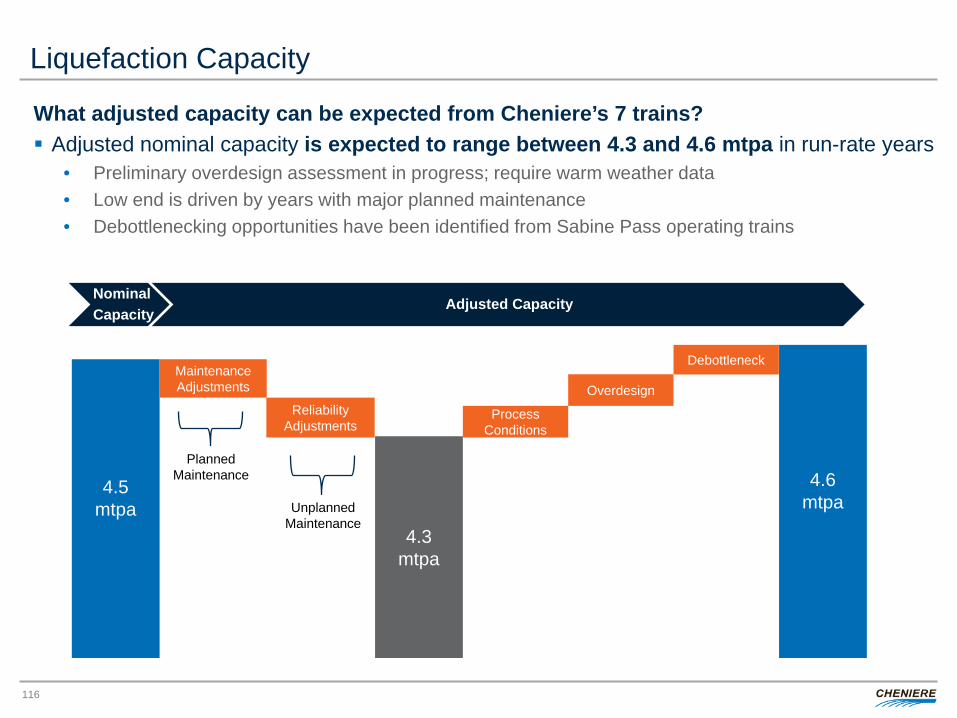
Liquefaction Capacity
116
4.5 mtpa
Maintenance Adjustments
Reliability Adjustments
4.3 mtpa
4.6 mtpa
Planned Maintenance
Unplanned Maintenance
Nominal Capacity
Adjusted Capacity
What adjusted capacity can be expected from Cheniere’s 7 trains? Adjusted nominal capacity is expected to range between 4.3 and 4.6 mtpa in run-rate years
• Preliminary overdesign assessment in progress; require warm weather data • Low end is driven by years with major planned maintenance • Debottlenecking opportunities have been identified from Sabine Pass operating trains
Debottleneck
Overdesign
Process Conditions
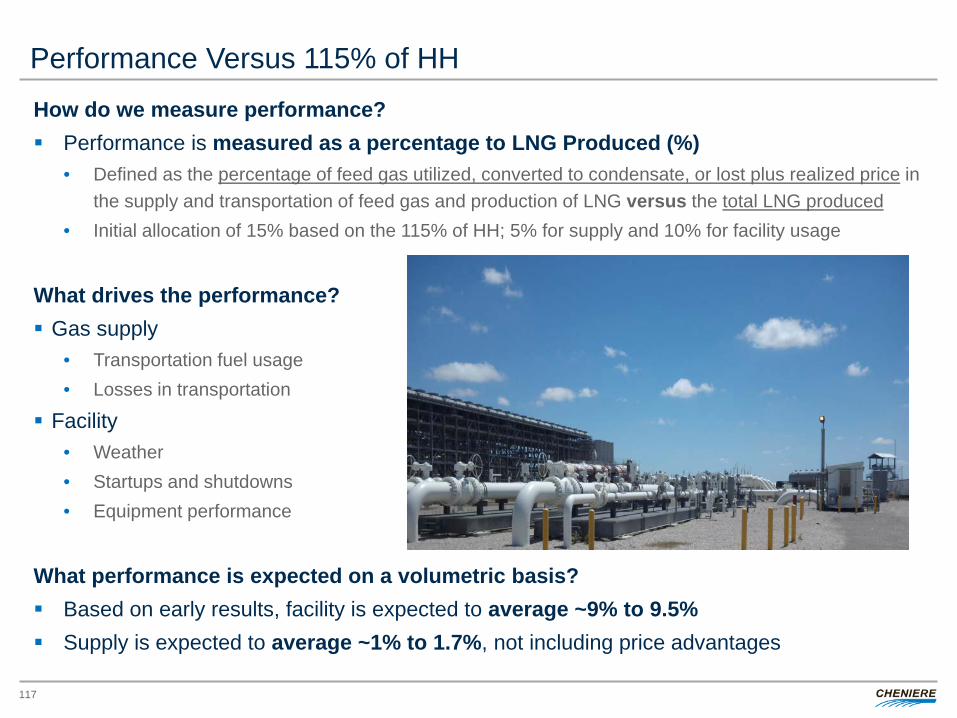
Performance Versus 115% of HH How do we measure performance? Performance is measured as a percentage to LNG Produced (%)
• Defined as the percentage of feed gas utilized, converted to condensate, or lost plus realized price in the supply and transportation of feed gas and production of LNG versus the total LNG produced
• Initial allocation of 15% based on the 115% of HH; 5% for supply and 10% for facility usage
What drives the performance? Gas supply
• Transportation fuel usage • Losses in transportation
Facility • Weather • Startups and shutdowns • Equipment performance
What performance is expected on a volumetric basis? Based on early results, facility is expected to average ~9% to 9.5% Supply is expected to average ~1% to 1.7%, not including price advantages
117
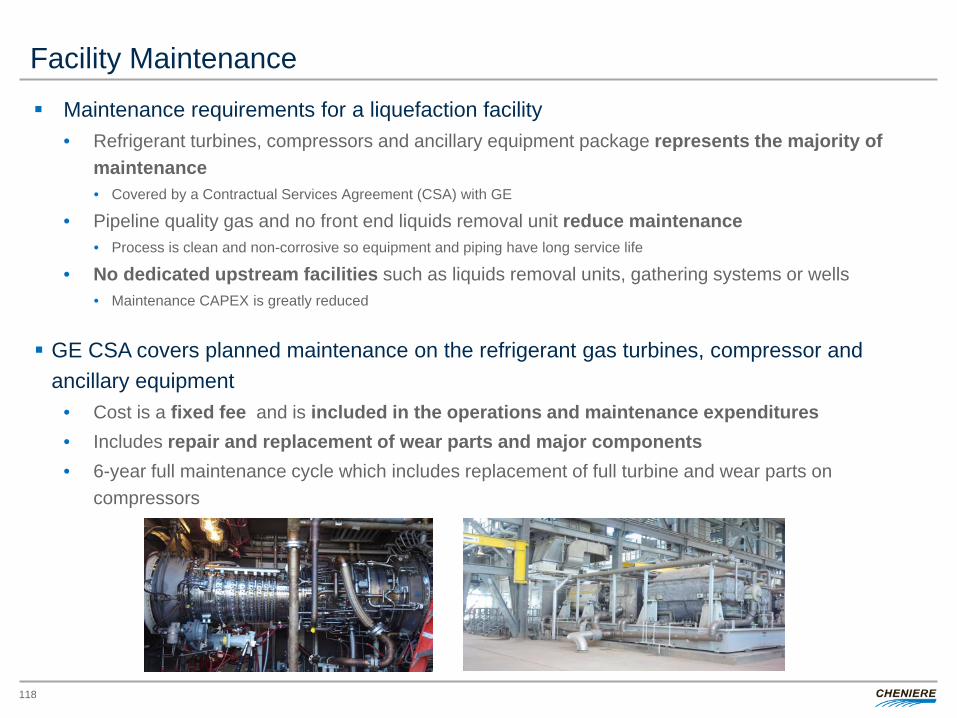
Facility Maintenance Maintenance requirements for a liquefaction facility
• Refrigerant turbines, compressors and ancillary equipment package represents the majority of maintenance • Covered by a Contractual Services Agreement (CSA) with GE
• Pipeline quality gas and no front end liquids removal unit reduce maintenance • Process is clean and non-corrosive so equipment and piping have long service life
• No dedicated upstream facilities such as liquids removal units, gathering systems or wells • Maintenance CAPEX is greatly reduced
GE CSA covers planned maintenance on the refrigerant gas turbines, compressor and ancillary equipment
• Cost is a fixed fee and is included in the operations and maintenance expenditures • Includes repair and replacement of wear parts and major components • 6-year full maintenance cycle which includes replacement of full turbine and wear parts on
compressors
118
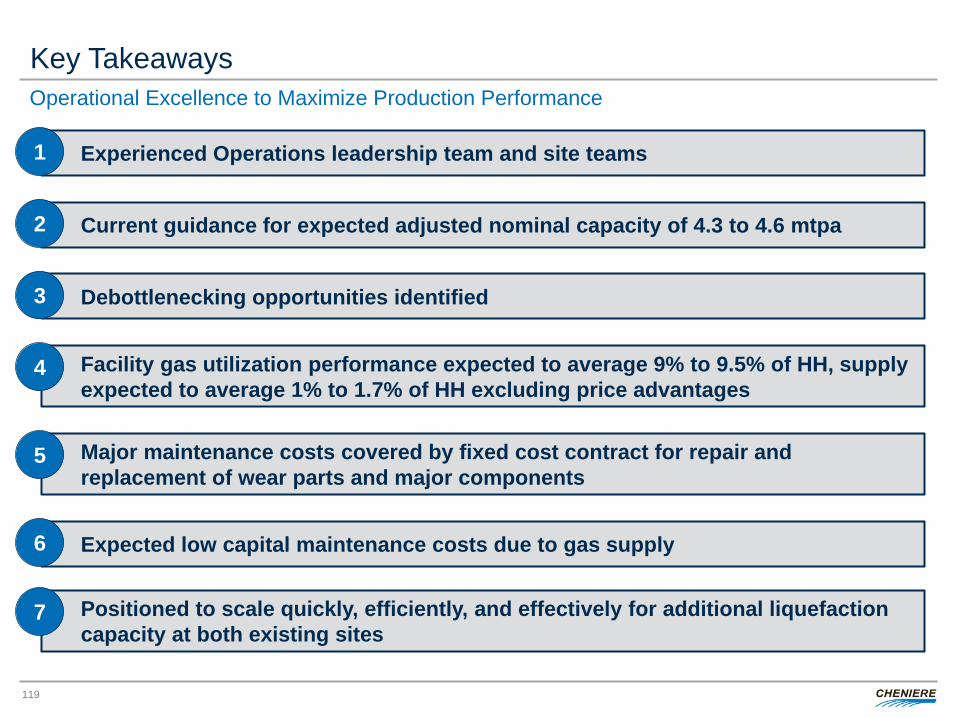
Key Takeaways
119
Experienced Operations leadership team and site teams 1
Current guidance for expected adjusted nominal capacity of 4.3 to 4.6 mtpa 2
Debottlenecking opportunities identified 3
Operational Excellence to Maximize Production Performance
Facility gas utilization performance expected to average 9% to 9.5% of HH, supply expected to average 1% to 1.7% of HH excluding price advantages
4
Major maintenance costs covered by fixed cost contract for repair and replacement of wear parts and major components
5
Expected low capital maintenance costs due to gas supply 6
Positioned to scale quickly, efficiently, and effectively for additional liquefaction capacity at both existing sites
7

CHENIERE ENERGY, INC. April 19, 2017 ANALYST DAY
CLOSING REMARKS Jack Fusco, President and CEO
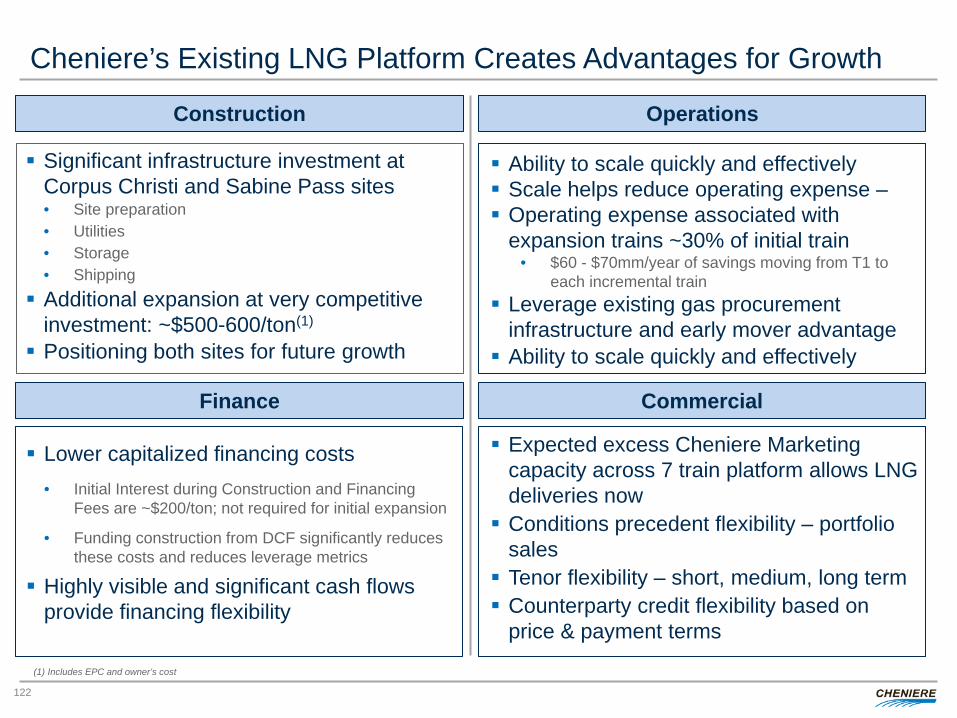
Cheniere’s Existing LNG Platform Creates Advantages for Growth
Construction Operations
Significant infrastructure investment at Corpus Christi and Sabine Pass sites • Site preparation • Utilities • Storage • Shipping Additional expansion at very competitive
investment: ~$500-600/ton(1)
Positioning both sites for future growth
Ability to scale quickly and effectively Scale helps reduce operating expense – Operating expense associated with
expansion trains ~30% of initial train • $60 - $70mm/year of savings moving from T1 to
each incremental train Leverage existing gas procurement
infrastructure and early mover advantage Ability to scale quickly and effectively
Finance Commercial
Expected excess Cheniere Marketing capacity across 7 train platform allows LNG deliveries now Conditions precedent flexibility – portfolio
sales Tenor flexibility – short, medium, long term Counterparty credit flexibility based on
price & payment terms
Lower capitalized financing costs • Initial Interest during Construction and Financing
Fees are ~$200/ton; not required for initial expansion
• Funding construction from DCF significantly reduces these costs and reduces leverage metrics
Highly visible and significant cash flows provide financing flexibility
(1) Includes EPC and owner’s cost
122

CHENIERE ENERGY, INC. April 19, 2017 ANALYST DAY
APPENDIX
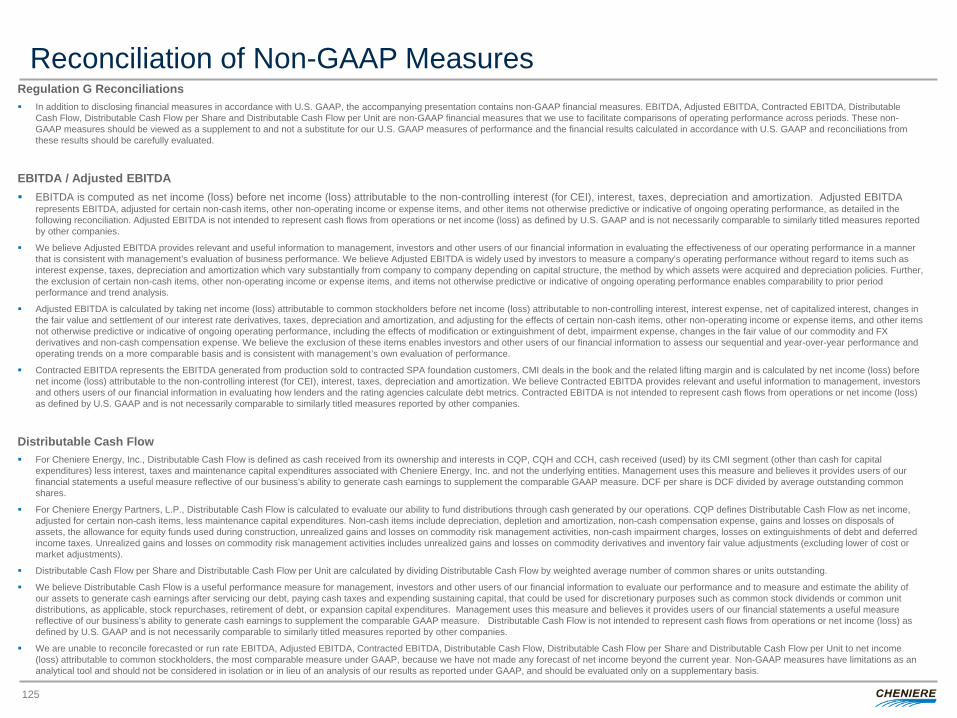
Reconciliation of Non-GAAP Measures
125
Regulation G Reconciliations In addition to disclosing financial measures in accordance with U.S. GAAP, the accompanying presentation contains non-GAAP financial measures. EBITDA, Adjusted EBITDA, Contracted EBITDA, Distributable
Cash Flow, Distributable Cash Flow per Share and Distributable Cash Flow per Unit are non-GAAP financial measures that we use to facilitate comparisons of operating performance across periods. These non-GAAP measures should be viewed as a supplement to and not a substitute for our U.S. GAAP measures of performance and the financial results calculated in accordance with U.S. GAAP and reconciliations from these results should be carefully evaluated.
EBITDA / Adjusted EBITDA EBITDA is computed as net income (loss) before net income (loss) attributable to the non-controlling interest (for CEI), interest, taxes, depreciation and amortization. Adjusted EBITDA
represents EBITDA, adjusted for certain non-cash items, other non-operating income or expense items, and other items not otherwise predictive or indicative of ongoing operating performance, as detailed in the following reconciliation. Adjusted EBITDA is not intended to represent cash flows from operations or net income (loss) as defined by U.S. GAAP and is not necessarily comparable to similarly titled measures reported by other companies.
We believe Adjusted EBITDA provides relevant and useful information to management, investors and other users of our financial information in evaluating the effectiveness of our operating performance in a manner that is consistent with management’s evaluation of business performance. We believe Adjusted EBITDA is widely used by investors to measure a company’s operating performance without regard to items such as interest expense, taxes, depreciation and amortization which vary substantially from company to company depending on capital structure, the method by which assets were acquired and depreciation policies. Further, the exclusion of certain non-cash items, other non-operating income or expense items, and items not otherwise predictive or indicative of ongoing operating performance enables comparability to prior period performance and trend analysis.
Adjusted EBITDA is calculated by taking net income (loss) attributable to common stockholders before net income (loss) attributable to non-controlling interest, interest expense, net of capitalized interest, changes in the fair value and settlement of our interest rate derivatives, taxes, depreciation and amortization, and adjusting for the effects of certain non-cash items, other non-operating income or expense items, and other items not otherwise predictive or indicative of ongoing operating performance, including the effects of modification or extinguishment of debt, impairment expense, changes in the fair value of our commodity and FX derivatives and non-cash compensation expense. We believe the exclusion of these items enables investors and other users of our financial information to assess our sequential and year-over-year performance and operating trends on a more comparable basis and is consistent with management’s own evaluation of performance.
Contracted EBITDA represents the EBITDA generated from production sold to contracted SPA foundation customers, CMI deals in the book and the related lifting margin and is calculated by net income (loss) before net income (loss) attributable to the non-controlling interest (for CEI), interest, taxes, depreciation and amortization. We believe Contracted EBITDA provides relevant and useful information to management, investors and others users of our financial information in evaluating how lenders and the rating agencies calculate debt metrics. Contracted EBITDA is not intended to represent cash flows from operations or net income (loss) as defined by U.S. GAAP and is not necessarily comparable to similarly titled measures reported by other companies.
Distributable Cash Flow For Cheniere Energy, Inc., Distributable Cash Flow is defined as cash received from its ownership and interests in CQP, CQH and CCH, cash received (used) by its CMI segment (other than cash for capital
expenditures) less interest, taxes and maintenance capital expenditures associated with Cheniere Energy, Inc. and not the underlying entities. Management uses this measure and believes it provides users of our financial statements a useful measure reflective of our business’s ability to generate cash earnings to supplement the comparable GAAP measure. DCF per share is DCF divided by average outstanding common shares.
For Cheniere Energy Partners, L.P., Distributable Cash Flow is calculated to evaluate our ability to fund distributions through cash generated by our operations. CQP defines Distributable Cash Flow as net income, adjusted for certain non-cash items, less maintenance capital expenditures. Non-cash items include depreciation, depletion and amortization, non-cash compensation expense, gains and losses on disposals of assets, the allowance for equity funds used during construction, unrealized gains and losses on commodity risk management activities, non-cash impairment charges, losses on extinguishments of debt and deferred income taxes. Unrealized gains and losses on commodity risk management activities includes unrealized gains and losses on commodity derivatives and inventory fair value adjustments (excluding lower of cost or market adjustments).
Distributable Cash Flow per Share and Distributable Cash Flow per Unit are calculated by dividing Distributable Cash Flow by weighted average number of common shares or units outstanding.
We believe Distributable Cash Flow is a useful performance measure for management, investors and other users of our financial information to evaluate our performance and to measure and estimate the ability of our assets to generate cash earnings after servicing our debt, paying cash taxes and expending sustaining capital, that could be used for discretionary purposes such as common stock dividends or common unit distributions, as applicable, stock repurchases, retirement of debt, or expansion capital expenditures. Management uses this measure and believes it provides users of our financial statements a useful measure reflective of our business’s ability to generate cash earnings to supplement the comparable GAAP measure. Distributable Cash Flow is not intended to represent cash flows from operations or net income (loss) as defined by U.S. GAAP and is not necessarily comparable to similarly titled measures reported by other companies.
We are unable to reconcile forecasted or run rate EBITDA, Adjusted EBITDA, Contracted EBITDA, Distributable Cash Flow, Distributable Cash Flow per Share and Distributable Cash Flow per Unit to net income (loss) attributable to common stockholders, the most comparable measure under GAAP, because we have not made any forecast of net income beyond the current year. Non-GAAP measures have limitations as an analytical tool and should not be considered in isolation or in lieu of an analysis of our results as reported under GAAP, and should be evaluated only on a supplementary basis.
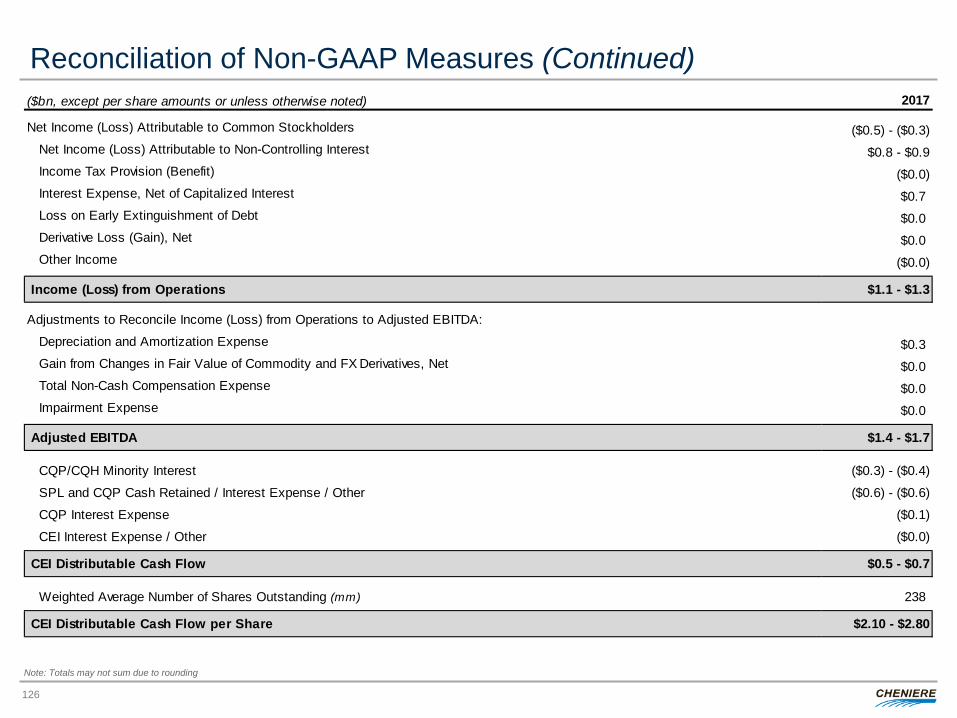
Reconciliation of Non-GAAP Measures (Continued)
126
Note: Totals may not sum due to rounding
($bn, except per share amounts or unless otherwise noted) 2017
Net Income (Loss) Attributable to Common Stockholders ($0.5) - ($0.3)Net Income (Loss) Attributable to Non-Controlling Interest $0.8 - $0.9Income Tax Provision (Benefit) ($0.0)Interest Expense, Net of Capitalized Interest $0.7Loss on Early Extinguishment of Debt $0.0Derivative Loss (Gain), Net $0.0Other Income ($0.0)
Income (Loss) from Operations $1.1 - $1.3
Adjustments to Reconcile Income (Loss) from Operations to Adjusted EBITDA:
Depreciation and Amortization Expense $0.3Gain from Changes in Fair Value of Commodity and FX Derivatives, Net $0.0Total Non-Cash Compensation Expense $0.0Impairment Expense $0.0
Adjusted EBITDA $1.4 - $1.7
CQP/CQH Minority Interest ($0.3) - ($0.4)
SPL and CQP Cash Retained / Interest Expense / Other ($0.6) - ($0.6)
CQP Interest Expense ($0.1)
CEI Interest Expense / Other ($0.0)
CEI Distributable Cash Flow $0.5 - $0.7
Weighted Average Number of Shares Outstanding (mm) 238
CEI Distributable Cash Flow per Share $2.10 - $2.80