Time and Distance Formulas Steve Tuckerman 11 th Grade Mathematics Education page.

CHENIERE ENERGY, INC.
Oliver TuckermanDirector, Strategy and Analytics
September 2016US LNG Taking World Stage
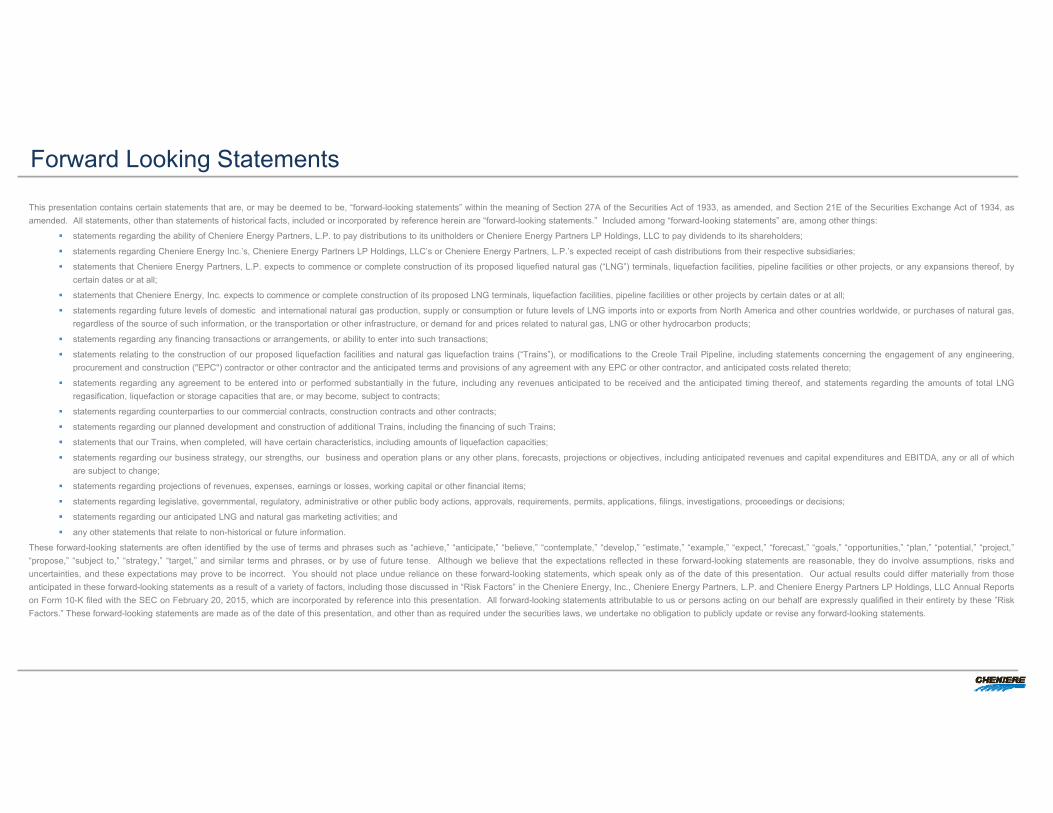
Forward Looking Statements
This presentation contains certain statements that are, or may be deemed to be, “forward-looking statements” within the meaning of Section 27A of the Securities Act of 1933, as amended, and Section 21E of the Securities Exchange Act of 1934, asamended. All statements, other than statements of historical facts, included or incorporated by reference herein are “forward-looking statements.” Included among “forward-looking statements” are, among other things:
statements regarding the ability of Cheniere Energy Partners, L.P. to pay distributions to its unitholders or Cheniere Energy Partners LP Holdings, LLC to pay dividends to its shareholders;
statements regarding Cheniere Energy Inc.’s, Cheniere Energy Partners LP Holdings, LLC’s or Cheniere Energy Partners, L.P.’s expected receipt of cash distributions from their respective subsidiaries;
statements that Cheniere Energy Partners, L.P. expects to commence or complete construction of its proposed liquefied natural gas (“LNG”) terminals, liquefaction facilities, pipeline facilities or other projects, or any expansions thereof, bycertain dates or at all;
statements that Cheniere Energy, Inc. expects to commence or complete construction of its proposed LNG terminals, liquefaction facilities, pipeline facilities or other projects by certain dates or at all;
statements regarding future levels of domestic and international natural gas production, supply or consumption or future levels of LNG imports into or exports from North America and other countries worldwide, or purchases of natural gas,regardless of the source of such information, or the transportation or other infrastructure, or demand for and prices related to natural gas, LNG or other hydrocarbon products;
statements regarding any financing transactions or arrangements, or ability to enter into such transactions;
statements relating to the construction of our proposed liquefaction facilities and natural gas liquefaction trains (“Trains”), or modifications to the Creole Trail Pipeline, including statements concerning the engagement of any engineering,procurement and construction ("EPC") contractor or other contractor and the anticipated terms and provisions of any agreement with any EPC or other contractor, and anticipated costs related thereto;
statements regarding any agreement to be entered into or performed substantially in the future, including any revenues anticipated to be received and the anticipated timing thereof, and statements regarding the amounts of total LNGregasification, liquefaction or storage capacities that are, or may become, subject to contracts;
statements regarding counterparties to our commercial contracts, construction contracts and other contracts;
statements regarding our planned development and construction of additional Trains, including the financing of such Trains;
statements that our Trains, when completed, will have certain characteristics, including amounts of liquefaction capacities;
statements regarding our business strategy, our strengths, our business and operation plans or any other plans, forecasts, projections or objectives, including anticipated revenues and capital expenditures and EBITDA, any or all of whichare subject to change;
statements regarding projections of revenues, expenses, earnings or losses, working capital or other financial items;
statements regarding legislative, governmental, regulatory, administrative or other public body actions, approvals, requirements, permits, applications, filings, investigations, proceedings or decisions;
statements regarding our anticipated LNG and natural gas marketing activities; and
any other statements that relate to non-historical or future information.
These forward-looking statements are often identified by the use of terms and phrases such as “achieve,” “anticipate,” “believe,” “contemplate,” “develop,” “estimate,” “example,” “expect,” “forecast,” “goals,” “opportunities,” “plan,” “potential,” “project,”“propose,” “subject to,” “strategy,” “target,” and similar terms and phrases, or by use of future tense. Although we believe that the expectations reflected in these forward-looking statements are reasonable, they do involve assumptions, risks anduncertainties, and these expectations may prove to be incorrect. You should not place undue reliance on these forward-looking statements, which speak only as of the date of this presentation. Our actual results could differ materially from thoseanticipated in these forward-looking statements as a result of a variety of factors, including those discussed in “Risk Factors” in the Cheniere Energy, Inc., Cheniere Energy Partners, L.P. and Cheniere Energy Partners LP Holdings, LLC Annual Reportson Form 10-K filed with the SEC on February 20, 2015, which are incorporated by reference into this presentation. All forward-looking statements attributable to us or persons acting on our behalf are expressly qualified in their entirety by these ”RiskFactors.” These forward-looking statements are made as of the date of this presentation, and other than as required under the securities laws, we undertake no obligation to publicly update or revise any forward-looking statements.

Summary
Cheniere’s update
US LNG hits the international waters; US ramps up to become a top three global LNG supplier this decade
US LNG exports spur new age for LNG trading
US LNG exports facilitate and expedite the transition to a more environmentally sound energy future

Sabine Pass First Cargo: 24th Feb 2016

Cheniere LNG Platform Underway
Train 1: OperationalTrain 2: CommissioningTrains 3 – 7: Under ConstructionTrains 8-9: Fully Permitted
Cash flows from fixed fees -
~$30Bcapital spend
Significant investment in U.S. infrastructure
annual fixed fees
Stable cash flows underpinned by investment grade counterparties
~$4.3B
~87%
Flexible, Scalable, Industry-leading platform
LNG volumes contracted
Long term SPAs support debt service coverage
27.0 mtpa currently under construction
20-year contracts with fixed fees, no price reopeners, and parent as counterparty or guarantor
not tied to commodity prices

Cheniere LNG Platform
6
Sabine Pass Liquefaction Project 6 train development – 27 mtpa Train 1: Substantial completion achieved Trains 2 and 3: Commissioning Trains 4-5: Under construction Train 6: Fully permitted
Corpus Christi LNG Terminal 5 train development – 22.5 mtpa Trains 1-2: Under construction Train 3: Fully permitted Train 4-5: Initiated development
Cheniere Office
Cheniere LNG Facility
Portugal
UAE
Kuwait India
Brazil
Argentina
Houston, TX
Santiago, Chile
Washington, DC
London, U.K.
Singapore
Cargo Delivery Destination
China
Spain

Cheniere is Constructing Half of US LNG Export Capacity
0
10
20
30
40
50
60
70
Jan-16 Jan-17 Jan-18 Jan-19 Jan-20
mtp
a
Freeport T3
Sabine Pass T5
Cameron LNG T3
Corpus Christi T2
Freeport T2
Corpus Christi T1
Cameron LNG T2
Freeport T1
Cameron LNG T1
Cove Point LNG T1
Sabine Pass T4
Sabine Pass T3
Sabine Pass T2
Sabine Pass T1
Source: Cheniere Research

Cheniere Provides Flexibility To Global LNG Players – No Destination Restriction
Supply Purchase Agreements
SpainGas Natural Fenosa
EndesaIberdrola
IndiaGAIL
South KoreaKogas
U.K.BGCentrica
8.6
France TotalEDF
IndonesiaPertamina
AustraliaWoodside
PortugalEDP

0
100
200
300
400
500
2000 2005 2010 2015 2020 2025 2030
mtp
aU.S. to Become Third Largest LNG Supplier LNG demand expected to nearly double by 2030 ~33 LNG trains(1) need to take FID by 2025 to meet forecasted demand through 2030 Coal to gas displacement offers upside potential
Sources: Cheniere interpretation of Wood Mackenzie data (Q2 2016)
Qatar
LNG trade forecasts
Australia
New supply~140 mtpa
Supply: existing and under construction
USA
2015 to 2030CAGR = 4.5%
(1) Assuming 85% utilization of nameplate capacity ~160 mtpa of new liquefaction capacity would be required. 5 mtpa trains = 33 trains.

The Changing Geography of Supply & Demand Driving Export Growth
10
Source: Cheniere ResearchImage reflects simulation of trade patterns based on Cheniere Research estimates. Lines do not reflect actual trade routes.

US LNG to Upend the Market Landscape…
Destination flexibility in US contracts will further boost “traded” volumes Incents more buyers and sellers into the marketplace –
beyond traders Fosters liquidity and erodes dominance of incumbents Improves portfolio diversification and optimization
Volumes will become more responsive to market signal Trade patterns will change as long term point-to-point
transactions account for a smaller percentage of the market
Drives hub formation and improves price discovery
Connectivity between markets to increase Smoothes out price disparities Results in enhanced efficiency and reduced delivered
costs
The US Gulf Coast to become a major LNG trading hub
Source: GIIGNL estimates of 2015 spot and short term trade representing contracts of four years or less in duration.

…And Shift the Power Landscape Rapid supply increase over the next 3 to 4 years to transform the
industry
LNG demand response has been visible and meaningful
Coal displacement on-going and increasing
US exports catalysing change
Growing volumes of flexible, traded LNG
Abundant, reliable, accessible, cost-competitive
Represents opportunity for global power markets
Enhances gas supply security & diversity and increases fuel competition
Provides alternative to HSFO, diesel, and coal
Compensates for nuclear decommissioning decisions
Complements renewable intermittency
Reduces carbon emissions and could accelerate compliance with emission targets
Switching is raising gas plant run rates and changing the shape of the power demand stack in the UK
Similar switching levels not yet seen in continental Europe but prices have just started to incent
Sources: Cheniere Research, Elexon, Destatis, Reuters, EEX

Many Emerging LNG Markets Targeting Integrated LNG to Power
Source: Cheniere (May 2016); Woodmac (Q2 2016)
Note: Bar chart only denotes select markets
Integration with FSRUs offers competitive advantages • Reduces time to market• Minimizes capex, reduces stranded asset risk• Innovative commercial structures to minimize risk• Financial institutions backing away from coal• Supports competitive procurement strategies• Fuel sourcing optionality, diversification • Scalable, flexible in complementing renewables
mtpa

Competitively Priced LNG and FSRU Technology Enable and Expedite Cleaner Power Generation
Source: Cheniere Research, Bloomberg, BAFA, METI, PLatts
November 2015FSRU starts commissioning
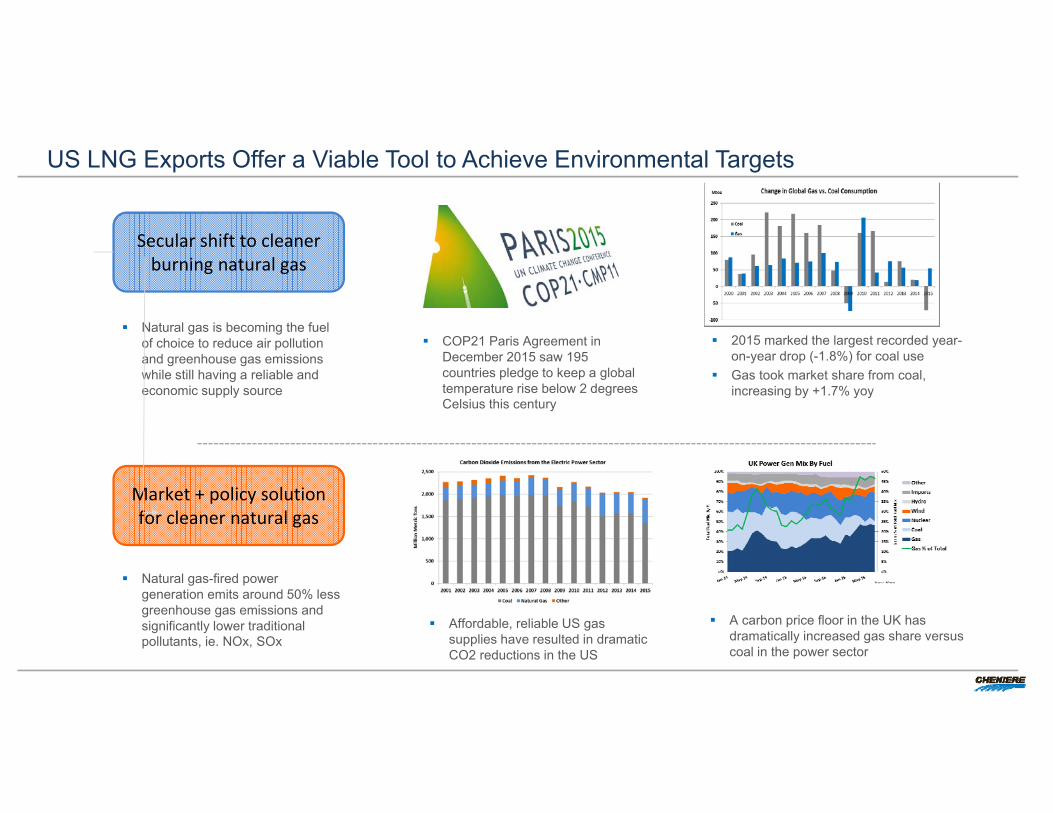
US LNG Exports Offer a Viable Tool to Achieve Environmental Targets
Secular shift to cleaner burning natural gas
Natural gas is becoming the fuel of choice to reduce air pollution and greenhouse gas emissions while still having a reliable and economic supply source
2015 marked the largest recorded year-on-year drop (-1.8%) for coal use
Gas took market share from coal, increasing by +1.7% yoy
COP21 Paris Agreement in December 2015 saw 195 countries pledge to keep a global temperature rise below 2 degrees Celsius this century
Market + policy solution for cleaner natural gas
Natural gas-fired power generation emits around 50% less greenhouse gas emissions and significantly lower traditional pollutants, ie. NOx, SOx
Affordable, reliable US gas supplies have resulted in dramatic CO2 reductions in the US
A carbon price floor in the UK has dramatically increased gas share versus coal in the power sector

Cleaner Power is Critical to Achieving Greenhouse Gas Reduction Goals
The referenced studies assessed lifecycle GHG emissions of LNG exports from the US. (1) Life Cycle Greenhouse Gas Perspective on Exporting Liquefied Natural Gas from the United States, DOE/NETL-2014(2) Life Cycle Greenhouse Gas Emissions From U.S. Liquefied Natural Gas (Environmental Science & Technology article, 2015)Source: Cheniere Research
DOE and National Technology Laboratory1, 2014• 42% less global warming potential in Europe over 100 yrs
and 28% less over 20 yrs vs. coal combustion• 39% less GWP than coal in Asia
Carnegie Mellon Study Environmental Science & Technology article2, 2015
• Mean lifecycle emissions are 45% lower than coal-generated electricity over 100 yrs
• 32% lower than coal over 20 yrs
Ample,Affordable, Flexible
US LNG EXPORTS Commercial Advantages
DecarbonizationCommitments
Environmental Advantages
Reduce lifecycle GHG emissions in power
generation vs. burning regional coal

Thank you