Charged Aerosol Detection 101 - Thermo Fisher Scientific · 2 • Introduction to charged aerosol...
32
The world leader in serving science Dr. Alexander Schwahn European Sales Support Expert for Biopharma Industry Thermo Fisher Scientific, Reinach, Switzerland Charged Aerosol Detection 101
Transcript of Charged Aerosol Detection 101 - Thermo Fisher Scientific · 2 • Introduction to charged aerosol...

The world leader in serving science
Dr. Alexander Schwahn European Sales Support Expert for Biopharma Industry Thermo Fisher Scientific, Reinach, Switzerland
Charged Aerosol Detection 101

2
• Introduction to charged aerosol detection (CAD) • How charged aerosol technology works • Comparison of CAD to ELSD • CAD product evolution • Example applications • Summary
Outline

3
Introduction to Charged Aerosol Detection (CAD)
Comparison of charged aerosol detection to UV and MS
• Used to quantitate any non-volatile and many semi-volatile analytes with LC
• Provides consistent analyte response independent of chemical structure and molecule size
• Neither a chromophore, nor the ability to ionize, is required for detection.
• Dynamic range up to four orders of magnitude from a single injection (sub-ng to µg quantities on column)
• Mass sensitive detection – CAD provides relative quantification without the need for reference standards
• Compatible with gradient conditions for HPLC, UHPLC, and micro LC

4
1 Inlet from column 6 Corona charger 2 FocusJet™ concentric nebulizer 7 Mixing chamber 3 Gas inlet 8 Ion trap 4 Micro drain pump 9 Electrometer 5 Evaporation tube 10 Gas exhaust
1
3 4
5
6
7
8 9
2
10
Charged Aerosol Detection – How It Works
Flow path through a Thermo Scientific™ Dionex™ Corona™ Veo™ charged aerosol detector

5
Charged Aerosol Detection – How It Works
Active drain pump
N2
HPLC eluent
Heated evaporation
sector FocusJet Concentric nebulizer tip
Mixing chamber
Ion trap
Electrometer
N2
Corona charger
Flow path through a Thermo Scientific™ Dionex™ Corona™ Veo™ charged aerosol detector
Signal is proportional to the analyte quantity

6
Particle Charging for Charged Aerosol Detection
Dried particles
Charged gas ions
Diffusional charging of aerosol in mixing chamber
Charged particle
• Particle size proportional to mass of analyte • Charge per particle proportional to particle size • Charged particles are measured, not gas phase ions as in MS (Independent of analyte net charge). CAD response depends on initial mass concentration of analyte in droplets formed but is independent of its chemical properties. Nearly uniform detector response However,
sample needs to be non-volatile or at least only semi-volatile.

7
ELSD vs. CAD
Measures the optical reflection of solute particles after the sample has been passed through a nebulizer
Charged aerosol detector
Measures charged particles by an electrometer generating a signal that is proportional to particle size (Mass of analyte) after nebulization
Evaporating chamber
Siphon
Heated nebulizer
Light source
Detection chamber
• Particle size is proportional to mass of analyte + background residue
Evaporative light scattering detector (ELSD)
Charged particles
PMT
Evaporation tube Nebulizer
Electrometer
Corona charger
Drain

8
• For Rayleigh scattering: b = 2 • For Mie scattering: b = 1⅓ • For Refraction and reflection scattering: b = ⅔
ELSD exhibits a narrower linear calibration range than CAD.
Res
pons
e
Mass on Column
Narrow linear segment
ELSD
Mass on Column
Res
pons
e Expanded linear segment
CAD
• Nonvolatiles - Decreasing slope with increasing mass (b ~ ⅔)
Detector Response Characteristics

9
Detector Response Characteristics
Apramycin and impurities

10
Detector Response Characteristics
Apramycin and impurities

11
• Over short ranges, both ELSD and charged aerosol detector can offer linear response.
• All aerosol-based detectors exhibit a non-linear response over large concentration ranges.
• Several calibration curve approaches are available: • Selections –
Calibration Consideration with Using Universal Detectors
ELSD CAD Sigmoidal response behavior Parabolic response behavior
Log-log Log-log Point to point Quadratic
Power function
The most appropriate approach depends upon the data.
12
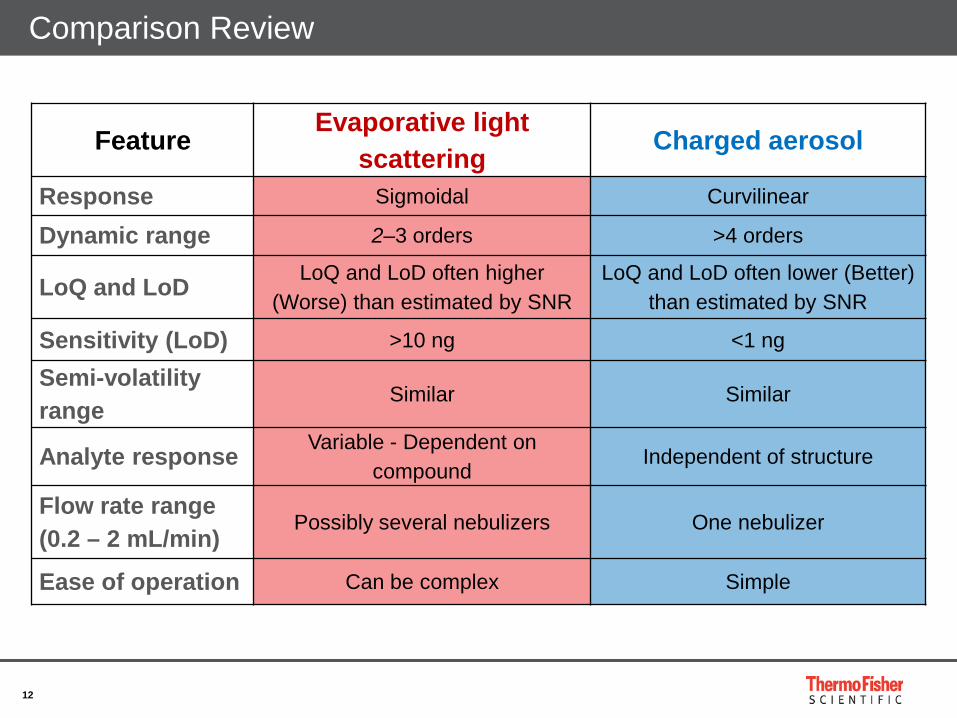
Comparison Review
Feature Evaporative light scattering Charged aerosol
Response Sigmoidal Curvilinear
Dynamic range 2–3 orders >4 orders
LoQ and LoD LoQ and LoD often higher (Worse) than estimated by SNR
LoQ and LoD often lower (Better) than estimated by SNR
Sensitivity (LoD) >10 ng <1 ng
Semi-volatility range
Similar Similar
Analyte response Variable - Dependent on compound
Independent of structure
Flow rate range (0.2 – 2 mL/min)
Possibly several nebulizers One nebulizer
Ease of operation Can be complex Simple

13
Evolution of Charged Aerosol Detectors
2013 Corona Veo RS Extended micro flow rate range; total CAD redesign with concentric nebulization and optimized spray chamber for enhanced sensitivity, heated evaporation and electronic gas regulation
2006 Corona Plus Expanded solvent compatibility with heated nebulization, software drivers CAD for popular CDS systems and external gas conditioning module for improved precision.
Corona CAD Introduction of the first commercial charged aerosol detector for HPLC with full control via front panel interface. Designed for near-universal detection on any HPLC system using isocratic or gradient separations
2005
2015 Thermo Scientific™ Full integration with Thermo Scientific™ Vanquish™ Vanquish™ charged UHPLC platform, slide-in module design, reduced aerosol detector flow path for optimum operation
Corona ultra UHPLC compatible, stackable design, enhanced sensitivity, touch- CAD screen user interface with real-time chromatogram display, incorporated precision internal gas regulation system
2009
Corona ultra RS Unified with Dionex™ UltiMate™ 3000 UHPLC+ system, CAD added on-board diagnostics / monitoring, automated flow diversion capability and selection of linearization parameters
2011 Dionex Corp. acquired by Thermo Fisher Scientific Inc.
ESA Biosciences, Inc. acquired by Dionex Corp.

14
Corona Veo and Vanquish Charged Aerosol Detectors
Corona Veo RS
Vanquish CAD
• Concentric nebulization system improves sensitivity and precision.
• Thermally controlled evaporation scheme widens the scope of applications.
• Corona Veo and Vanquish RS model includes low flow capabilities for micro LC, as well as UHPLC.
• Usability and serviceability have been enhanced.
• CDS drivers available for use with all Thermo Scientific and many other vendor systems.
FocusJet

15
• Drug composition • Impurity testing
• Formulation • Counterions • Surfactants / Excipients
• Degradation / Stability testing • Characterization
• Glycan analysis • Adjuvant analysis
• Excipient raw material analysis and lot-to-lot variability
Pharma and Biopharma Application Areas

16
• Drug composition • Impurity testing
• Formulation • Counterions • Surfactants / Excipients
• Degradation / Stability testing • Characterization
• Glycan analysis • Adjuvant analysis
• Excipient raw material analysis and lot-to-lot variability
Pharma and Biopharma Application Areas
• Cleaning validation • Mass balance • Extractables / Leachables • PEGylation and antibody-drug conjugates • siRNA lipid delivery vehicles • QbD • MIST (Metabolites in safety testing)
Visit the charged aerosol detection website and the free Thermo Scientific AppsLab library of analytical applications, to see more examples of HPLC-CAD solutions: www.thermofisher.com/cad www.thermofisher.com/appslab

17
Drug Composition – Example: Aminoglycoside Antibiotic
Analysis of Gentamicin standard (200 μg/mL)
Column: Thermo Scientific™ Acclaim™ RSLC PolarAdvantage II, 2.2 μm, 2.1 × 100 mm
Mobile phase A: 0.025:95:5 HFBA:water:acetonitrile
Mobile phase B: 0.3:95:5 TFA:water:acetonitrile Gradient: 0 to 1.5min,1 to 10%B
1.5 to 7min,10 to 100% B 7 to 10min,100% B 4 min. pre-injection equilibration
Flow rate: 0.45 mL/min Inj. volume: 1 μL Detector: Corona ultra RS, 15 °C, 60 Hz

18
Orthogonal and Complimentary Detection with DAD and CAD
Metoprolol and impurities A, M and N
Isocratic HILIC chromatographic method using both UV and charged aerosol detection
0 1 2 3 4 5 6 7 8 9 10 Time [min]
-20
0
10
20
30
40
50
Res
pons
e [p
A]
CAD
UV @ 280nm
Impurity N
Metoprolol Impurity A Impurity M

19
Formulation – Counterions
Drug counterions Instrumentation: Thermo Scientific™ Dionex™ UltiMate™ 3000 RSLC system Column: Acclaim Trinity P2, 3 μm, 3×50 mm Col. temp: 30 ºC Flow rate: 0.6 mL/min Inj. volume: 2 μL Mobile phase A: Water Mobile phase B: 100 mM ammonium formate, pH 3.65 Gradient: Charged aerosol: Corona Veo RS; 55 ºC, 5 Hz, 2 s, PF 1.5 Sample: 20 to 100 ng/µL each in deionized water Peaks 1. Phosphate 7. Nitrate 2. Sodium 8. Citrate 3. Potassium 9. Fumarate 4. Chloride 10. Sulfate 5. Malate 11. Magnesium 6. Bromide 12. Calcium
Time (min)
-8.0 0.0 1.0 11 15
%A 90 90 90 0 0
%B 10 10 10 100 100
Anions, cations, organic and inorganic ions simultaneously

20
Formulation – Counterions
Drug counterions Instrumentation: UltiMate 3000 RSLC system Column: Acclaim Trinity P2, 3 μm, 3×50 mm Col. temp: 30 ºC Flow Rate: 0.6 mL/min Inj. Volume: 2 μL Mobile Phase A: Water Mobile Phase B: 100 mM ammonium formate, pH 3.65 Gradient: Charged Aerosol: Corona Veo RS; 55 ºC, 5 Hz, 2 s, PF 1.5 Sample: 20 to 100 ng/µL each in deionized water Peaks 1. Phosphate 7. Nitrate 2. Sodium 8. Citrate 3. Potassium 9. Fumarate 4. Chloride 10. Sulfate 5. Malate 11. Magnesium 6. Bromide 12. Calcium
Time (min)
-8.0 0.0 1.0 11 15
%A 90 90 90 0 0
%B 10 10 10 100 100
Anions, cations, organic and inorganic ions simultaneously
Nano-polymer/Silica hybrid particle
Anion-exchange /HILIC functionality in inner pore area
Sulfonated nano-polymer beads attached to surface
Sulfonated nano-polymer bead

21
Formulation – API and Counterions Instrumentation: UltiMate 3000 RSLC system Column: Acclaim Trinity P2, 3 μm, 3×50 mm Col. temp: 30 ºC Flow rate: 0.6 mL/min Inj. volume: 5 μL Mobile phases: A: Acetonitrile B: Water C: 100 mM ammonium formate, pH 3.65 Gradient: UV detector: UV diode array; 254 nm, 5 Hz, 0.5 s Charged aerosol: Corona Veo RS; 55 ºC, 5 Hz, 2 s, PF 1.5 Peaks: 1 aspartate 24 µg/mL 2 sodium 3 saccharin 24 µg/mL 4 amphetamine 122 µg/mL 5 sulfate 26 µg/mL Ref: AN20870
Time (min)
A B C
-8.0 35 59 6
0.0 35 59 6
0.5 35 59 6
5.0 35 0 65
10 20 0 80
12 20 0 80
Complimentary detection by CAD and UV/Vis
UV @ 254 nm
CAD
Adderall® (Shire Pharmaceuticals) and counterions

22
Formulation – API, Counter-Ions and Impurities
Column: Acclaim Trinity P1, 3 μm, 3.0 × 50 mm Mobile phase A: 75% Acetonitrile Mobile phase B: 25% 200 mM Ammonium acetate pH 4 Flow rate: 0.8 mL/min Inj. volume: 5 μL Col. temp: 30 ⁰C Detector: Corona Veo RS CAD Evap. temp: 60 ⁰C
Analysis of diclofenac sodium salt (1 mg/mL)
Charged aerosol even detects chloride impurity.

23
Stability – Forced Degradation
Follow forced degradation of Amikacin sulfate
Corona ultra RS CAD


25
•Simple carbohydrates •Lipids
• Profiling methods • Targeted methods
• Artificial sweeteners
Food and Beverage Application Areas

26
Food and Beverage – Simple Carbohydrates
Simplified sample preparation “Dilute-and-shoot” method
Std. Grape Cranberry Apple Orange
Analysis of simple sugars Add 20 mL of 85% ACN to 1 gram juice, mix & spin
Isocratic HILIC separation Corona Ultra RS CAD

27
Lipids – Profiling Column: Thermo Scientific™ Accucore™ C18,
2.6 μm, 3.0x150 mm Mobile phases: A: Methanol:water:acetic acid (600:400:4) B: Tetrahydrofuran:acetonitrile (50:950) C: Acetone:acetonitrile (900:100) Gradient: Time FlowRate %A %B %C (min) (mL/min) -10.0 1. 00 90 10 0 -0.1 1. 00 90 10 0 0. 0 0. 25 90 10 0 20.0 0. 50 15 85 0 35.0 0. 50 2 78 20 60.0 0. 50 2 3 95 65.0 0. 50 90 10 0 Flow rate: 1.0 mL/min Inj. volume: 2 μL Col. temp: 40 ⁰C Detector: Corona Veo RS CAD Evap. temp: 40 ⁰C
Global lipids – Algal oils
Complex sample – Minimal sample prep

28
Lipids – Targeted Methods
Column: Thermo Scientific™ Hypersil™ ODS C18 5 μm, 4.6 ×250 mm, 2 in series, plus 2 in series for gradient compensation
Mobile phase A: 2-propanol:hexane 1:1 (v/v) Mobile phase B: Acetonitrile Gradient: Time Flow rate %A %B (min) (mL/min) 0.0 1 20 80 80 1 90 10 Inverse gradient: Yes Flow rate: 1.0 mL/min Inj. volume: 4 μL Col. temp: 30 ⁰C Detector: Corona CAD 100 pA; 35 psi, low filter Sample: B, TG standard GLC#435 and D) GLC#437,
dissolved in hexane Reference: Sandra et al, J Chromatogr. A 1176 (2007)
135 – 142.
Complex real samples – minimal sample prep
Olive oil
Sunflower oil

29
Food Additives: Steviol Glycosides (Sweetener)
0.0 2.0 4.0 6.0 8.0 10.0 12.0 14.0 16.0 18.0 20.0 Time [min]
0
5
10
15
C u r
r e n t
[ p A
]
74
100
120
140
161
R e s
p o n s
e
ELSD
CAD
Isosteviol
Rebaudioside D Sodium Rebaudioside A
Rebaudioside B
Rabaudioside F
Rabaudioside C
Steviolbioside
Stevioside
Dulcoside A
Rubusoside Steviol
Column: Acclaim Trinity P1, 3 µm, 2.1 × 150 mm Mobile phase: 88:12 (v/v) Acetonitrile:10 mM ammonium formate, pH 3.1 Flow rate: 0.8 mL/min Inj. volume: 2 µL Col. temp: 30 ⁰C Detection: Dionex Corona Veo RS CAD Settings: 2 Hz, 5 second filter, PF 1.0, evap. temp 35 ⁰C
CAD exhibits more uniform response.
Stevioside

30
Artificial Sweeteners: Steviol Glycosides
0.0 2.0 4.0 6.0 8.0 10.0 12.0 14.0 16.0 18.0 20.0 Time [min]
0
5
10
15
C u r
r e n t
[ p A
]
74
100
120
140
161
R e s
p o n s
e
ELSD
CAD
Isosteviol
Rebaudioside D Sodium Rebaudioside A
Rebaudioside B
Rabaudioside F
Rabaudioside C
Steviolbioside
Stevioside
Dulcoside A
Rubusoside Steviol
Column: Acclaim Trinity P1, 3 µm, 2.1 × 150 mm Mobile phase: 88:12 (v/v) Acetonitrile:10 mM ammonium formate, pH 3.1 Flow rate: 0.8 mL/min Inj. volume: 2 µL Col. temp: 30 ⁰C Detection: Dionex Corona Veo RS CAD Settings: 2 Hz, 5 second filter, PF 1.0, evap. temp 35 ⁰C
CAD exhibits more uniform response.
Stevioside

31
• Charged aerosol detection delivers accurate and precise quantification of lipids, carbohydrates, surfactants, amines and counterions that UV/Vis absorbance cannot detect.
• For analytes with chromophores, charged aerosol detection provides uniform response independent of the extinction coefficient.
• Charged aerosol detection provides a good estimate of the amount of unknown impurities and degradation products.
• Charged aerosol detection is superior to ELSD in terms of sensitivity, dynamic range, response uniformity, precision and ease of use.
• More information on charged aerosol detection can be found at www.thermofisher.com/cad
• Bibliography of charged aerosol detector applications can be downloaded from http://analyteguru.com/resources/charged-aerosol-detection-list-of-published-articles/
Summary

32
Thank You Very Much for Your Attention!
Questions?
Do you have additional questions or do you want to talk to an expert from Thermo Fisher Scientific? Please send an E-Mail to [email protected] and we will get back to you.